Review

Machine-Learning-Based Digital Twin in Manufacturing: A Bibliometric Analysis and Evolutionary Overview

by
Sharmin Sultana Sheuly
*,
Mobyen Uddin Ahmed
and
Shahina Begum
Division of Computer Science and Software Engineering, Embedded Systems, Mälardalen University, P.O. Box 883, 721 23 Västerås, Sweden
*
Author to whom correspondence should be addressed.
Appl. Sci. 2022, 12(13), 6512; https://doi.org/10.3390/app12136512
Submission received: 24 May 2022 / Revised: 17 June 2022 / Accepted: 22 June 2022 / Published: 27 June 2022
(This article belongs to the Special Issue Artificial Intelligence and Optimization in Industry 4.0)

Abstract

:
The Digital Twin (DT) concept in the manufacturing industry has received considerable attention from researchers because of its versatile application potential. Machine Learning (ML) adds a new dimension to DT by enhancing its functionality. Many studies on DT in the manufacturing industry have recently been published. However, there is still a lack of a systematic literature review on different aspects of ML-based DT in the manufacturing industry from a bibliometric and evolutionary perspective. Therefore, the proposed study is mainly aimed at reviewing DT in the manufacturing industry to identify the contribution of ML, current methods, and future research directions. According to the findings, the contribution of ML to this domain is significant. Additionally, the results show that the latest ML technologies are being used in the DT domain; neural networks have evolved based on application-specific requirements. The total number of papers and citations per paper on ML-based DT is increasing. The relevance of ML in DT has increased over time. The current trend is to use ML-based DT for data analytics. Additionally, there are many unfilled gaps; certain gaps include industrial applications of DT, synchronisation with real-time data through sensors, heterogeneous data management, and benchmarking.

1. Introduction

Digital Twin (DT) technology is being applied in different areas. The first application was in the aerospace industry. However, it is now being used in healthcare, manufacturing, networking, communication, etc. [1]. In the manufacturing industry, the DT is used for machine health monitoring [2], predicting failure [3], product design [4], and human–machine collaboration [5].
Conversely, data produced in manufacturing have been used to schedule maintenance or create product logs [6]. These data have fostered machine learning (ML) and artificial intelligence (AI) applications in DT for manufacturing systems. AI algorithms such as genetic algorithms, particle swarm optimisation (PSO) [7,8], and fuzzy logic [9] have been widely used in various applications. A primary screening of manufacturing-domain publications showed that most AI-based studies focused on ML. There has been a sharp rise in the scientific study of DT in the manufacturing industry from the ML perspective. The reviews that have already been published on DT in the manufacturing domain focus on broad areas such as the current research state, role of AI, ML, and applications.
There has been no review narrowing down bibliometric and evolutionary analysis of ML-based DT in the manufacturing industry. Evolutionary analysis captures changes in the characteristics and structure of a system, product, or algorithm over the trajectory of time.
In NASA’s Apollo program, a DT of a space vehicle was created for the first time. The target of this creation was to check the physical space vehicle’s condition during missions [10]. Michael Grieves from Michigan University has been widely acknowledged as the person who first coined the term DT in 2002 [11]. Grieves described DT as “The Digital Twin is a set of virtual information constructs that fully describes a potential or actual physical manufactured product from the micro atomic level to the macro geometrical level”. The DT concept has received popularity since then, and other definitions have been published. Tao and Zhang [12] described DT as a means of converging physical and virtual spaces. Yuqian and Chao [13] described DT as a representation of a physical object which merges cyberspace and physical space through near-real-time synchronisation. According to Glaessegen and Stargel [14], DT is a simulation of physical space. Reifsnider and Majumdar [15] described DT as an ultra-high-fidelity simulation of its physical counterpart.
An ML-based DT can be defined as “an application-specific DT which is comprised of components such as physical entity, ML model, ML data, real time synchronisation, IoT and used for tasks such as process control, scheduling and prediction” The differences between ML-enabled DT and AI-enabled DT are
  • ML-enabled DT is a subset of AI-enabled DT.
  • ML-enabled DT involves algorithms such as ANN, RF, kNN, whereas AI-enabled DT involves algorithms such as genetic algorithm, ant colony optimization, and particle swarm optimization, in addition to ML algorithms.
  • ML-enabled DT is primarily used for process control, scheduling and prediction, whereas AI-enabled DT is primarily used for optimization, scheduling, and resource allocation.
  • ML-enabled DT is more abundant than AI-enabled DT
Grieves defined a three-dimensional DT architecture with a set of tests called the test of virtuality (GTV) to examine the fidelity of a DT. These three dimensions are (a) physical entity (PE), (b) virtual entity, and (c) the connection between physical and virtual worlds. However, Grieves did not define any auxiliary technology needed to build DT. With the advancement of sensor technology, IoT, and the introduction of big data and ML, DT architecture has evolved into a five-dimensional architecture. These five dimensions are (a) PE, (b) virtual entity, (c) services, (d) Digital Twin data, and (e) connection [2]. These five dimensions have evolved over time to eight dimensions: (a) integration breadth, (b) connectivity mode, (c) update frequency, (d) CPS intelligence, (d) simulation capabilities, (e) digital model richness, (f) human interaction, and (g) product lifecycle according to CIRP Encyclopaedia [16]. An analysis of these architectures shows that DT has been evolving over time with the incorporation of data, CPS, simulation, and humans. The CIRP Encyclopaedia dimensions have been considered in the proposed review because of their versatile dimensions.
The specific characteristics/dimensions of DT in manufacturing are:
  • DT in the manufacturing life cycle.
    -
    Manufacturing design.
    -
    Manufacturing service.
    -
    Manufacturing process management.
  • Simulation of manufacturing process.
  • Big data associated with manufacturing.
  • Cyberphysical system.
  • Human-integrated manufacturing.
A network analysis was performed using vosviewer on the most relevant 500 bibliographic datapoints from Web of Science, with primary keywords: (“Manufacturing” or “Production,” or “Operation”) AND (“Digital Twin” or “DT”). The connections between the keywords are shown in Figure 1. Each keyword is represented by a circle, with a larger circle representing a higher occurrence of the keyword. Additionally, the connecting lines represent connections among keywords and a thicker line represents a stronger correlation. In the figure, a Digital Twin co-occurs with the keywords smart manufacturing, industry 4.0, and simulation in most cases. However, the keyword “machine learning” has emerged.

2. Related Review Studies

Kritzinger et al. [17] classified current publications in the manufacturing industry based on the DT integration level. The authors showed a distinction between Digital Shadow, (DS), Digital Model (DM) and Digital Twin (DT). Additionally, they concluded that literature related to DT is scarce, whereas literature relating to DS and DM is abundant. Following the study by Kritzinger et al. [17], Chiara et al. [18] attempted to identify the missing part between the implemented and theoretical DT, including the integration level of the manufacturing execution system (MES). This review identifies different applications in the manufacturing domain and DT development in a laboratory to overcome the identified gap. The connection between these two publications [17,18] is that they both focused on the DT integration level and the missing part in the current research.
Finding the missing part in the current study is a popular track. However, the overview, definition, and application of characteristics to create a common base have also been of interest to the scientific community [16,19].
Barbara et al. [19] defined DT as an artificially intelligent virtual replica of a physical entity. The review results provide an overview of definitions, characteristics and applications of DT based on scientific publications published before July 2019 in several application areas.
Jones et al. [16] attempted to consolidate DT research studies in the manufacturing industry by analysing 92 research studies to create a common base for future researchers. Thirteen characteristics, including physical entity/twin, virtual entity/twin, physical environment, virtual environment, state, realisation, metrology, twinning, twinning rate, and physical-to-virtual connection/twinning, were analysed to create consolidated knowledge.
Bin et al. [20] discussed sustainability and the associated technologies of intelligent manufacturing. Certain review criteria include intelligent manufacturing equipment, systems, and services. The applications reviewed in this study were
  • DT in product design,
  • Manufacturing,
  • Product service,
  • Digital twin-driven sustainable intelligent manufacturing etc.
A framework for digital-twin-driven sustainable intelligent manufacturing is proposed in this study. Mengnan et al. [21] identified and classified 240 academic publications to identify the concepts, technologies, industrial applications, research status, and key enabling technologies associated with DT. Based on this analysis, the authors showed different lifecycle phases as future recommendations. Similarly to Bin et al. [20], Mengnan et al. [21] considered the design phase, manufacturing phase, concept, technology, application, digital model, and so on. According to the authors, the Digital Twin is stepping out of its infancy with regard to a widely accepted definition, unified creation, and deployment. The difference between the studies by Mengnan et al. [21] and Bin et al. [20] is that Mengnan et al. considered concepts, technologies, industrial applications, research status, and key enabling technologies associated with DT, whereas Bin et al. reviewed intelligent manufacturing equipment, systems, and services. A framework for digital-twin-driven sustainable intelligent manufacturing was proposed by Bin et al., while Mengnan et al. presented different lifecycle phases as future recommendations.
Mazhar et al. [1] reviewed 117 studies on AI ML-based DT. This review provides an overview of the standards and technologies used to create a DT relationship and of AI–ML, big data, IoT, digital twinning, related applications, the role of AI–ML and big data in DT, the tools needed to create AI-enabled DT, challenges, and future directions of digital twinning. Eight multidisciplinary electronic bibliographic databases, including (1) IEEE Xplore (IEEE, IET), (2) ACM digital library, (3) Scopus (ScienceDirect, Elsevier); and (4) SpringerLink (Springer) were used to collect the papers. This paper outlines future research directions by creating a reference AI–ML and big-data-enabled digital twinning system.
Many review studies have been published in recent years focusing on gaps in current research, unified definition, identification of dominant technology, future recommendations, and so on. However, a review focusing on bibliometric and evolutionary analysis of ML-based DT in the manufacturing industry is lacking. The proposed literature review fills this gap. The scope of the proposed study is ML-based DT in the manufacturing industry. The scope of the proposed study does not cover other industries such as healthcare, transportation, energy or DT that does not use ML. The main purpose of the proposed literature review is to explore ML-based DT in the manufacturing industry and create a path for future research.

Difference between Proposed Literature Review Study and State-of-the-Art Studies

The study that is most similar to the proposed literature review is that by Mazhar et al. [1]. The difference between that study and the proposed one is that Mazhar focused on Artificial Intelligence (AI), ML, and big data in DT, whereas the proposed literature review study only focuses on ML-based DT. Mazhar et al. [1] focused on different application domains such as manufacturing, medical, transportation, power and energy fields, etc. Conversely, the proposed study focuses only on manufacturing. The extracted data are the quantitative and qualitative statistics, tasks performed by ML, ML algorithms used and their evolution in ML-based DT, role of ML in DT development, contribution of ML to DT dimensions, contribution of ML-based DT to PLM, evolution of future research direction and future research direction in ML-based DT in manufacturing processes.
Barbara et al. [19] and Jones et al. [16] reviewed the definitions and characteristics of DT in different domains. Conversely, one of the findings of the proposed literature review study is DT dimensions that are enhanced by ML in the manufacturing industry.

3. Methodology

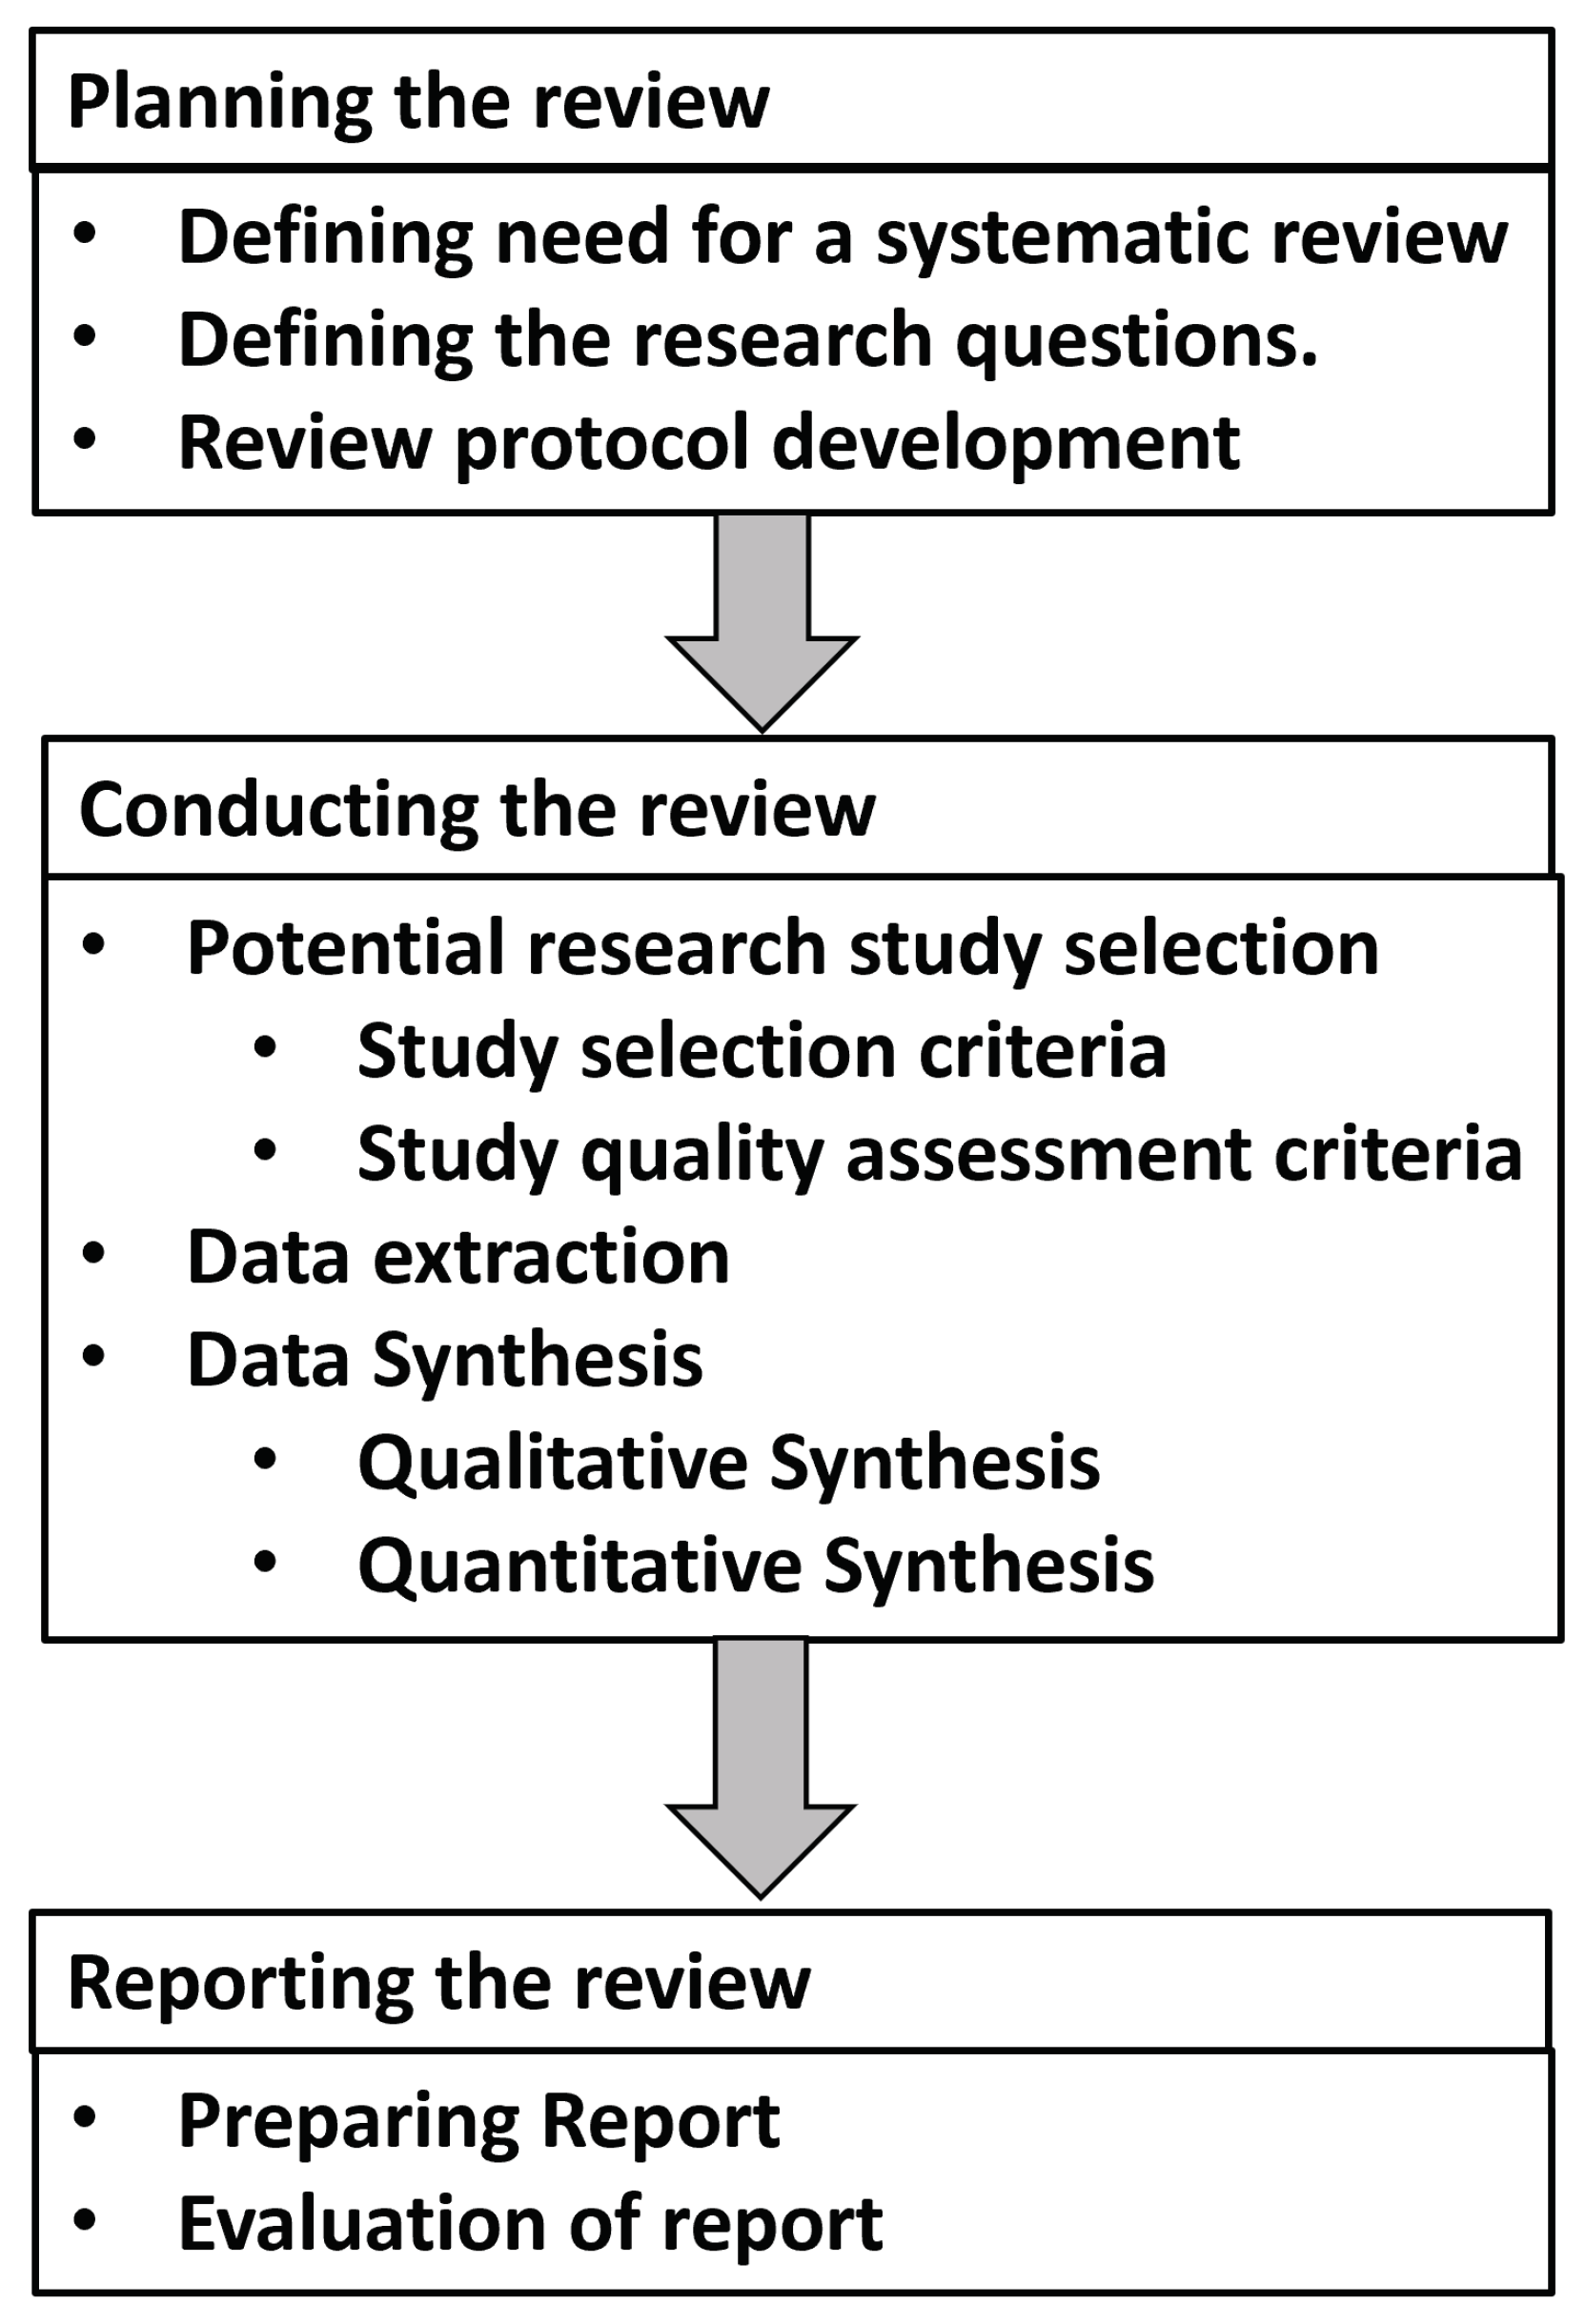
The proposed review study is based on scientific publications published from 2015 to March 2022 in the manufacturing domain. A systematic literature review (SLR) was performed by following the steps shown in Figure 2 [22]. SLR has three stages:
  • Planning the review,
  • Conducting the review,
  • Reporting the review.
Figure 2. Systematic Literature Review steps. Systematic Literature Review steps shown with the help of four boxes and connecting arrows.
Applsci 12 06512 g002
The necessity of a systematic literature review was identified early in the planning of the review. The research questions were defined in later stages. In the following stage, the review was conducted by accumulating recent publications, extracting data, performing a questionnaire survey, and analysing the data extracted from articles. This stage was followed by the reporting stage, where the outcome of the data analysis was reported. The final review report was obtained in the last stage.
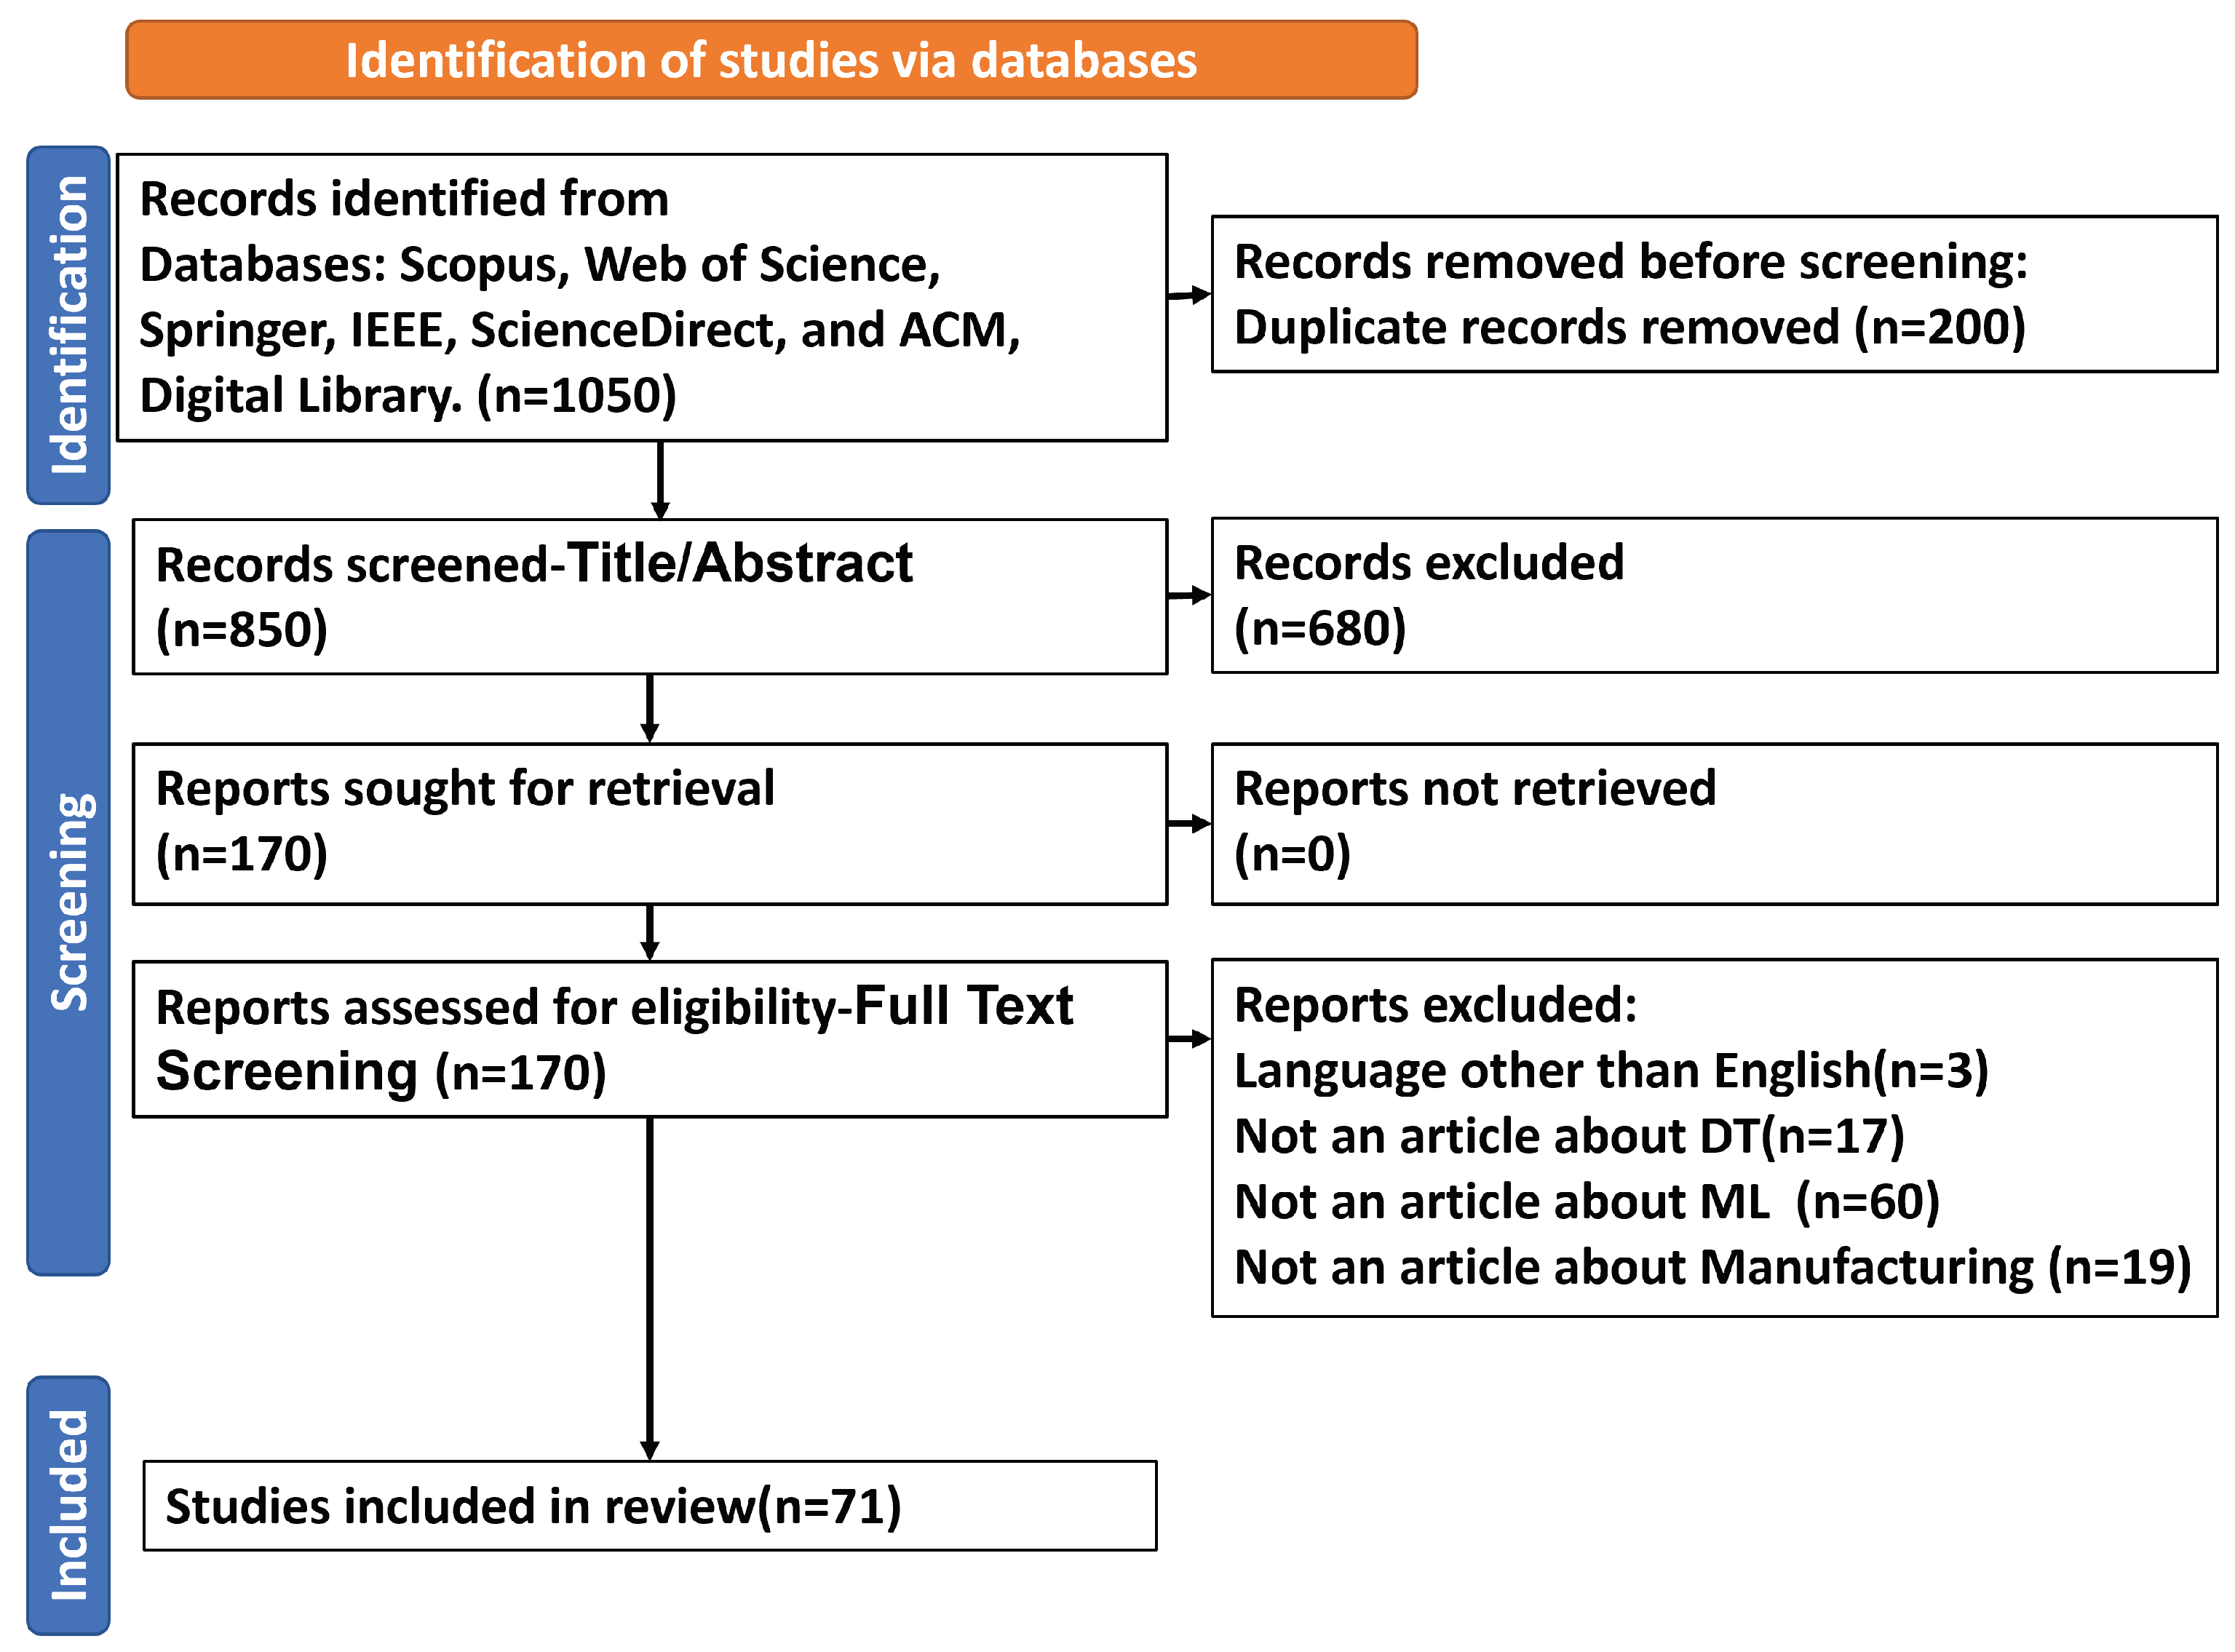
The strategy provided in [23] was used to identify the primary studies. It comprises two steps: (a) automatic search, and (b) manual search. A search string was defined based on the research questions of the automatic search. The search string consists of the following: the primary keywords: (“Manufacturing” or “Production”, or “Operation”) AND (“Digital Twin” or “DT”) AND (“Machine Learning” or “ML”). These keywords were used with shifting positions and replacing them with synonyms. The databases used in the proposed study are: Scopus, Web of Science, Springer, IEEE, ScienceDirect, and ACM Digital Library. In the manual search, a backward citation search strategy was used. The proposed study is based on publications published between 2015 and March 2022. This period was chosen to include the most recent studies in this domain. The process to identify primary studies (for data extraction) is shown in Figure 3.
The search string described in the previous section resulted in 1050 publications. After several screenings, 71 publications were found to be most relevant based on the inclusion and exclusion criteria. In the next stage, the primary publications were carefully read and data were extracted carefully. The derived data were saved in an Excel file for detailed analysis.

Research Questions

  • RQ1: What are the quantitative statistics, such as citation trends, author productivity, journal productivity, and qualitative trends, such as thematic evolution and topic clusters associated with ML-based DT of manufacturing systems?
  • RQ2: What tasks are performed by ML in the ML-based DT of manufacturing systems?
    -
    RQ2.1 Which ML algorithms are used? How are these algorithms evolving over time?
  • RQ3: What is the role of ML in developing the DT?
    -
    RQ3.1 What DT dimensions are enhanced by ML?
    -
    RQ3.2 What is the contribution of ML-based DT in Manufacturing Product lifecycle management (PLM)?
  • RQ4: How do open issues associated with ML-based DT evolve over time? What are the possibilities for future research?

4. Research Question Results

4.1. First Research Question

The first research question focuses on bibliometric analysis of the collected publications. Bibliometric analysis was performed using the ‘bibliomatrix’ package in R. Table 1 describes corpus summary.
As shown in the table, there are 71 documents from 47 sources (journals, conferences, etc.), with an annual growth rate of 20.09%. The documents’ average age of 2.11 years indicates that ML-based DT is a relatively new research field. The authors’ keywords’ frequency distribution is 249, which implies that 249 keywords are frequently used by authors of ML-based DT research. It can be concluded from this that versatile technology has not yet been incorporated into ML-based DT, resulting in a higher number of keywords. Documents with international collaboration comprise 12.68% of the total corpus, while the number of multi-authored publications is 68. This implies that robust collaborative research in this field is ongoing.
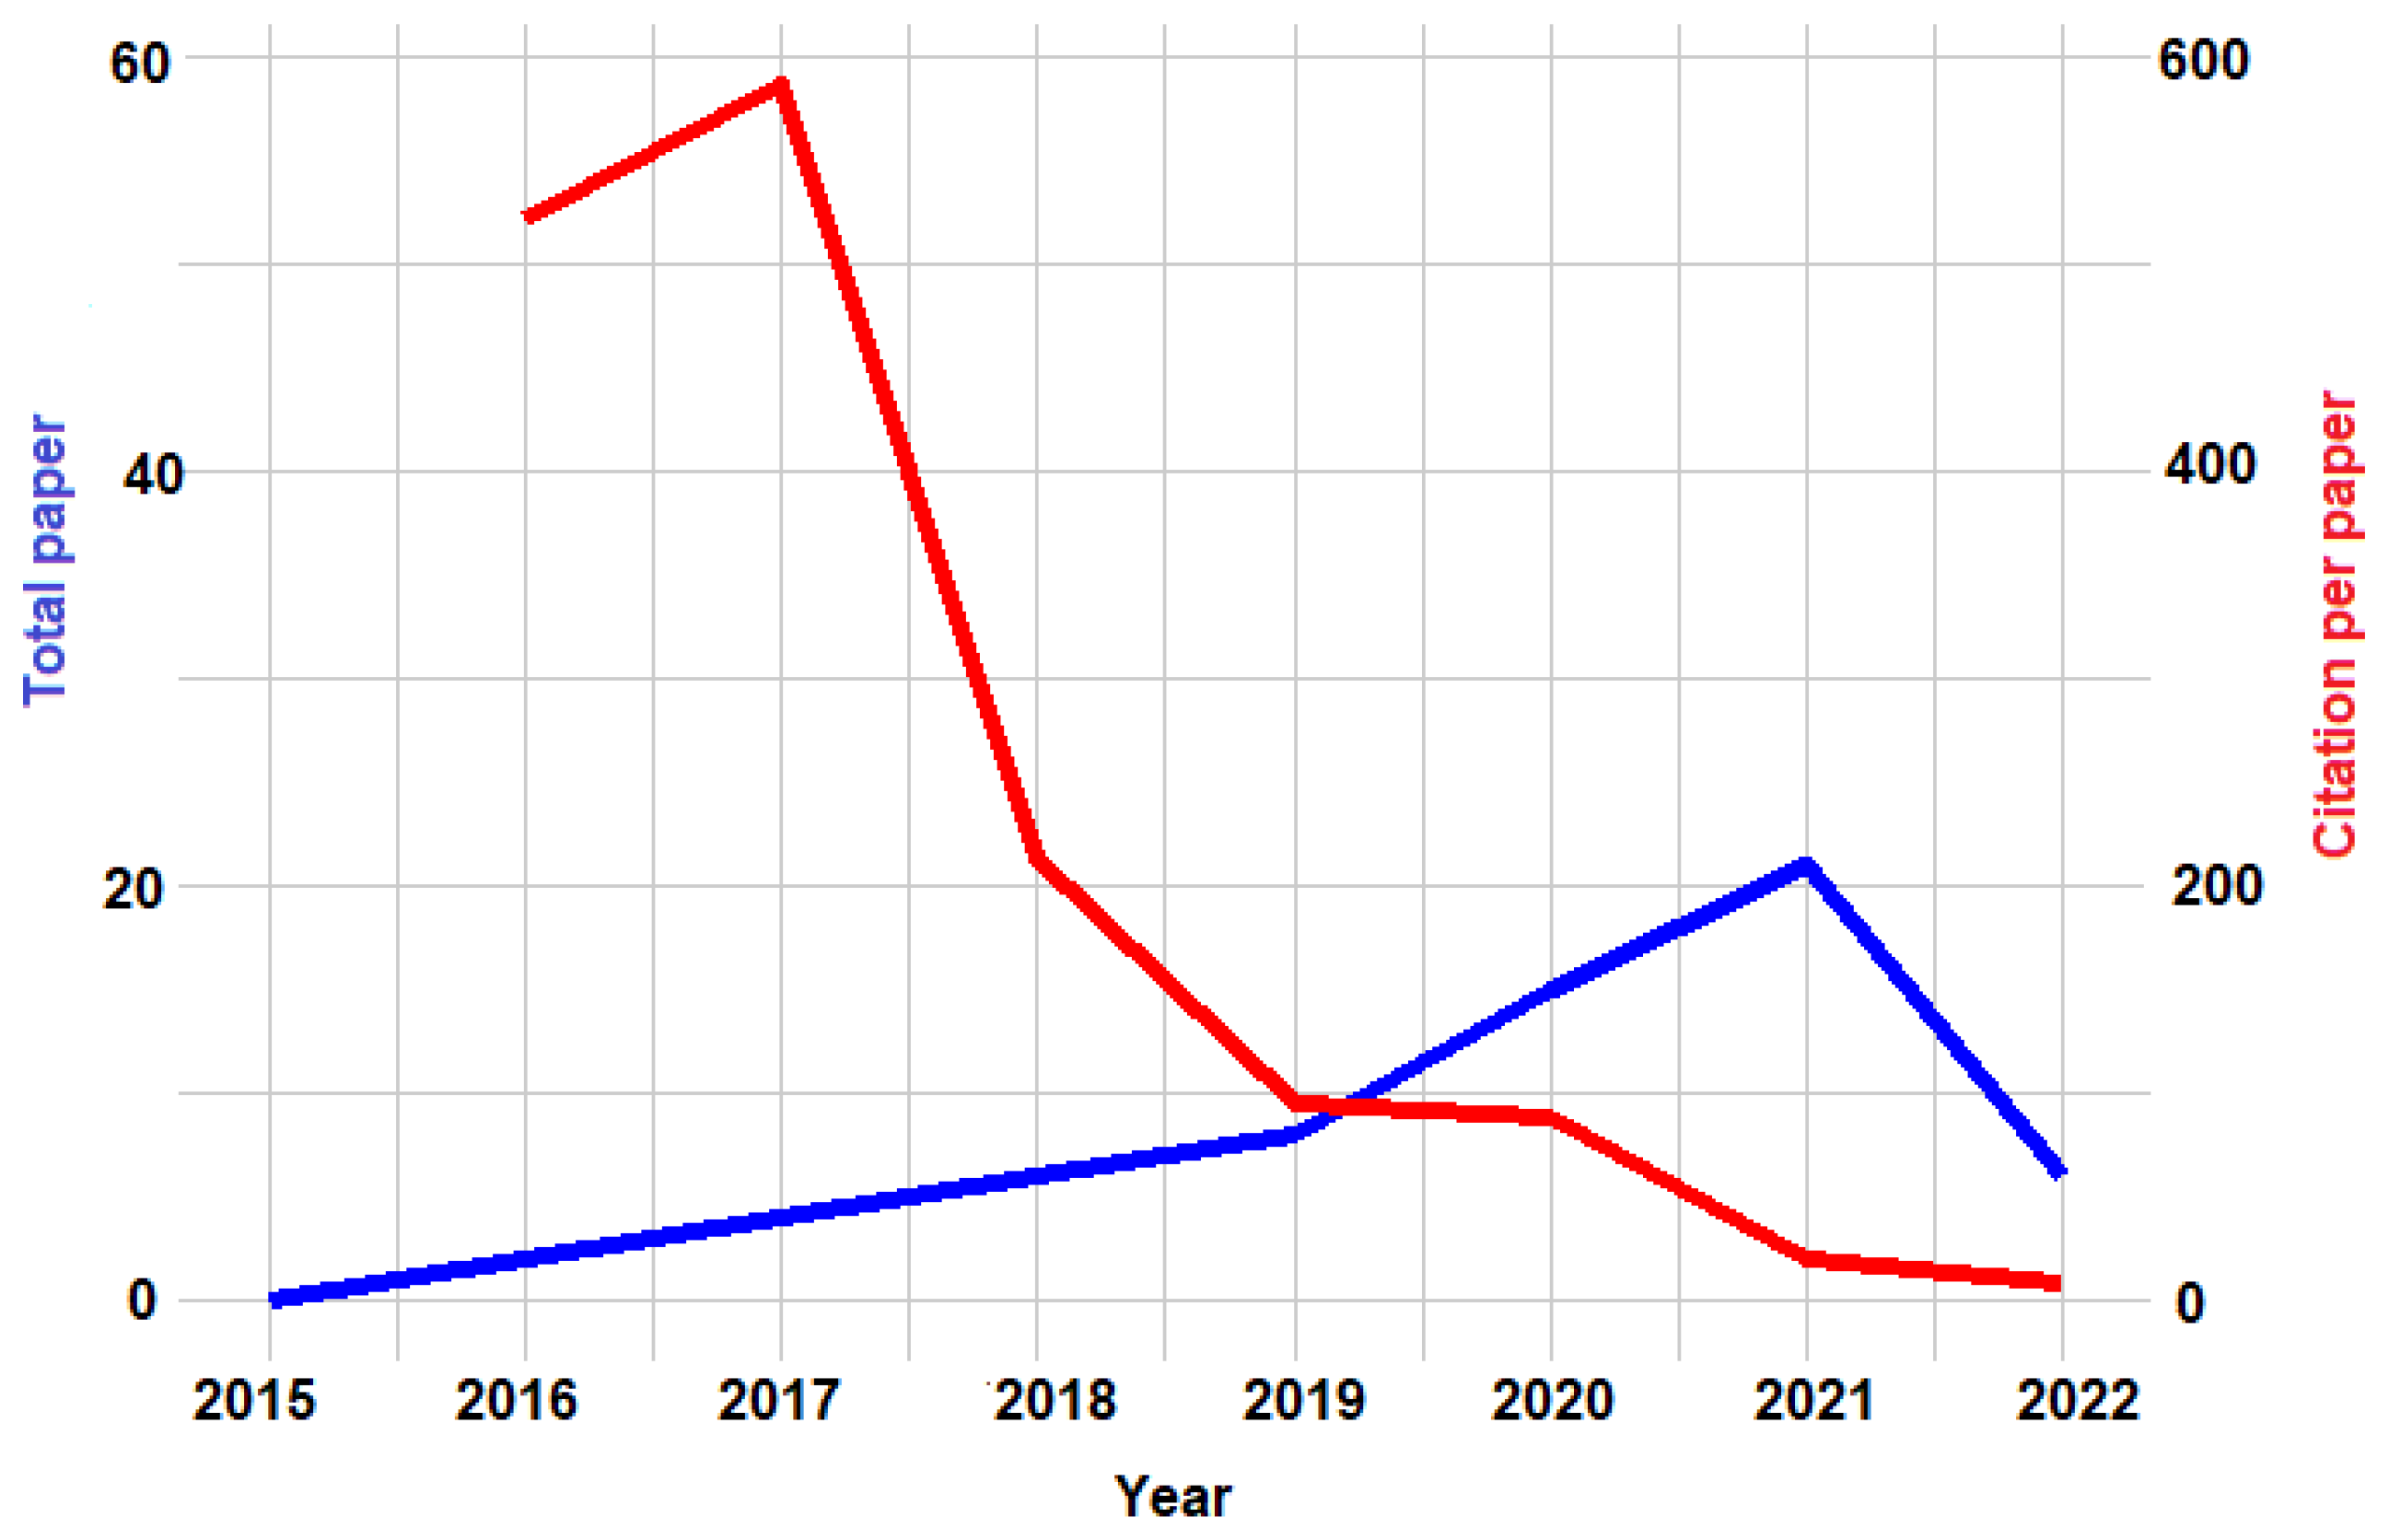
Figure 4 depicts citation trends with total paper number within a 7-year period. A linear increase in the number of publications from 2015 to 2019 can be seen. After 2019, there was a sharp increase in publication number. The most publications were published in 2021. This trend is supposed to continue in 2022. Conversely, citations per paper was zero in the year 2015. In 2016, only two publications were published [10,11].
However, these publications received a significant number of citations, with 500 citations per paper. In 2017, the number of citations per paper peaked because of two highly cited publications by Fei Tao et al. [4,12]. After 2017, the average number of citations per paper decreased due to an increase in the number of publications.
Figure 5 depicts percentage of publications by subject category. According to the figure, most publications belong to ‘Computer Science’. Other popular subject categories are: ‘Engineering’, ‘Operations Research And Management Science’, and ‘Automation And Control Systems’.
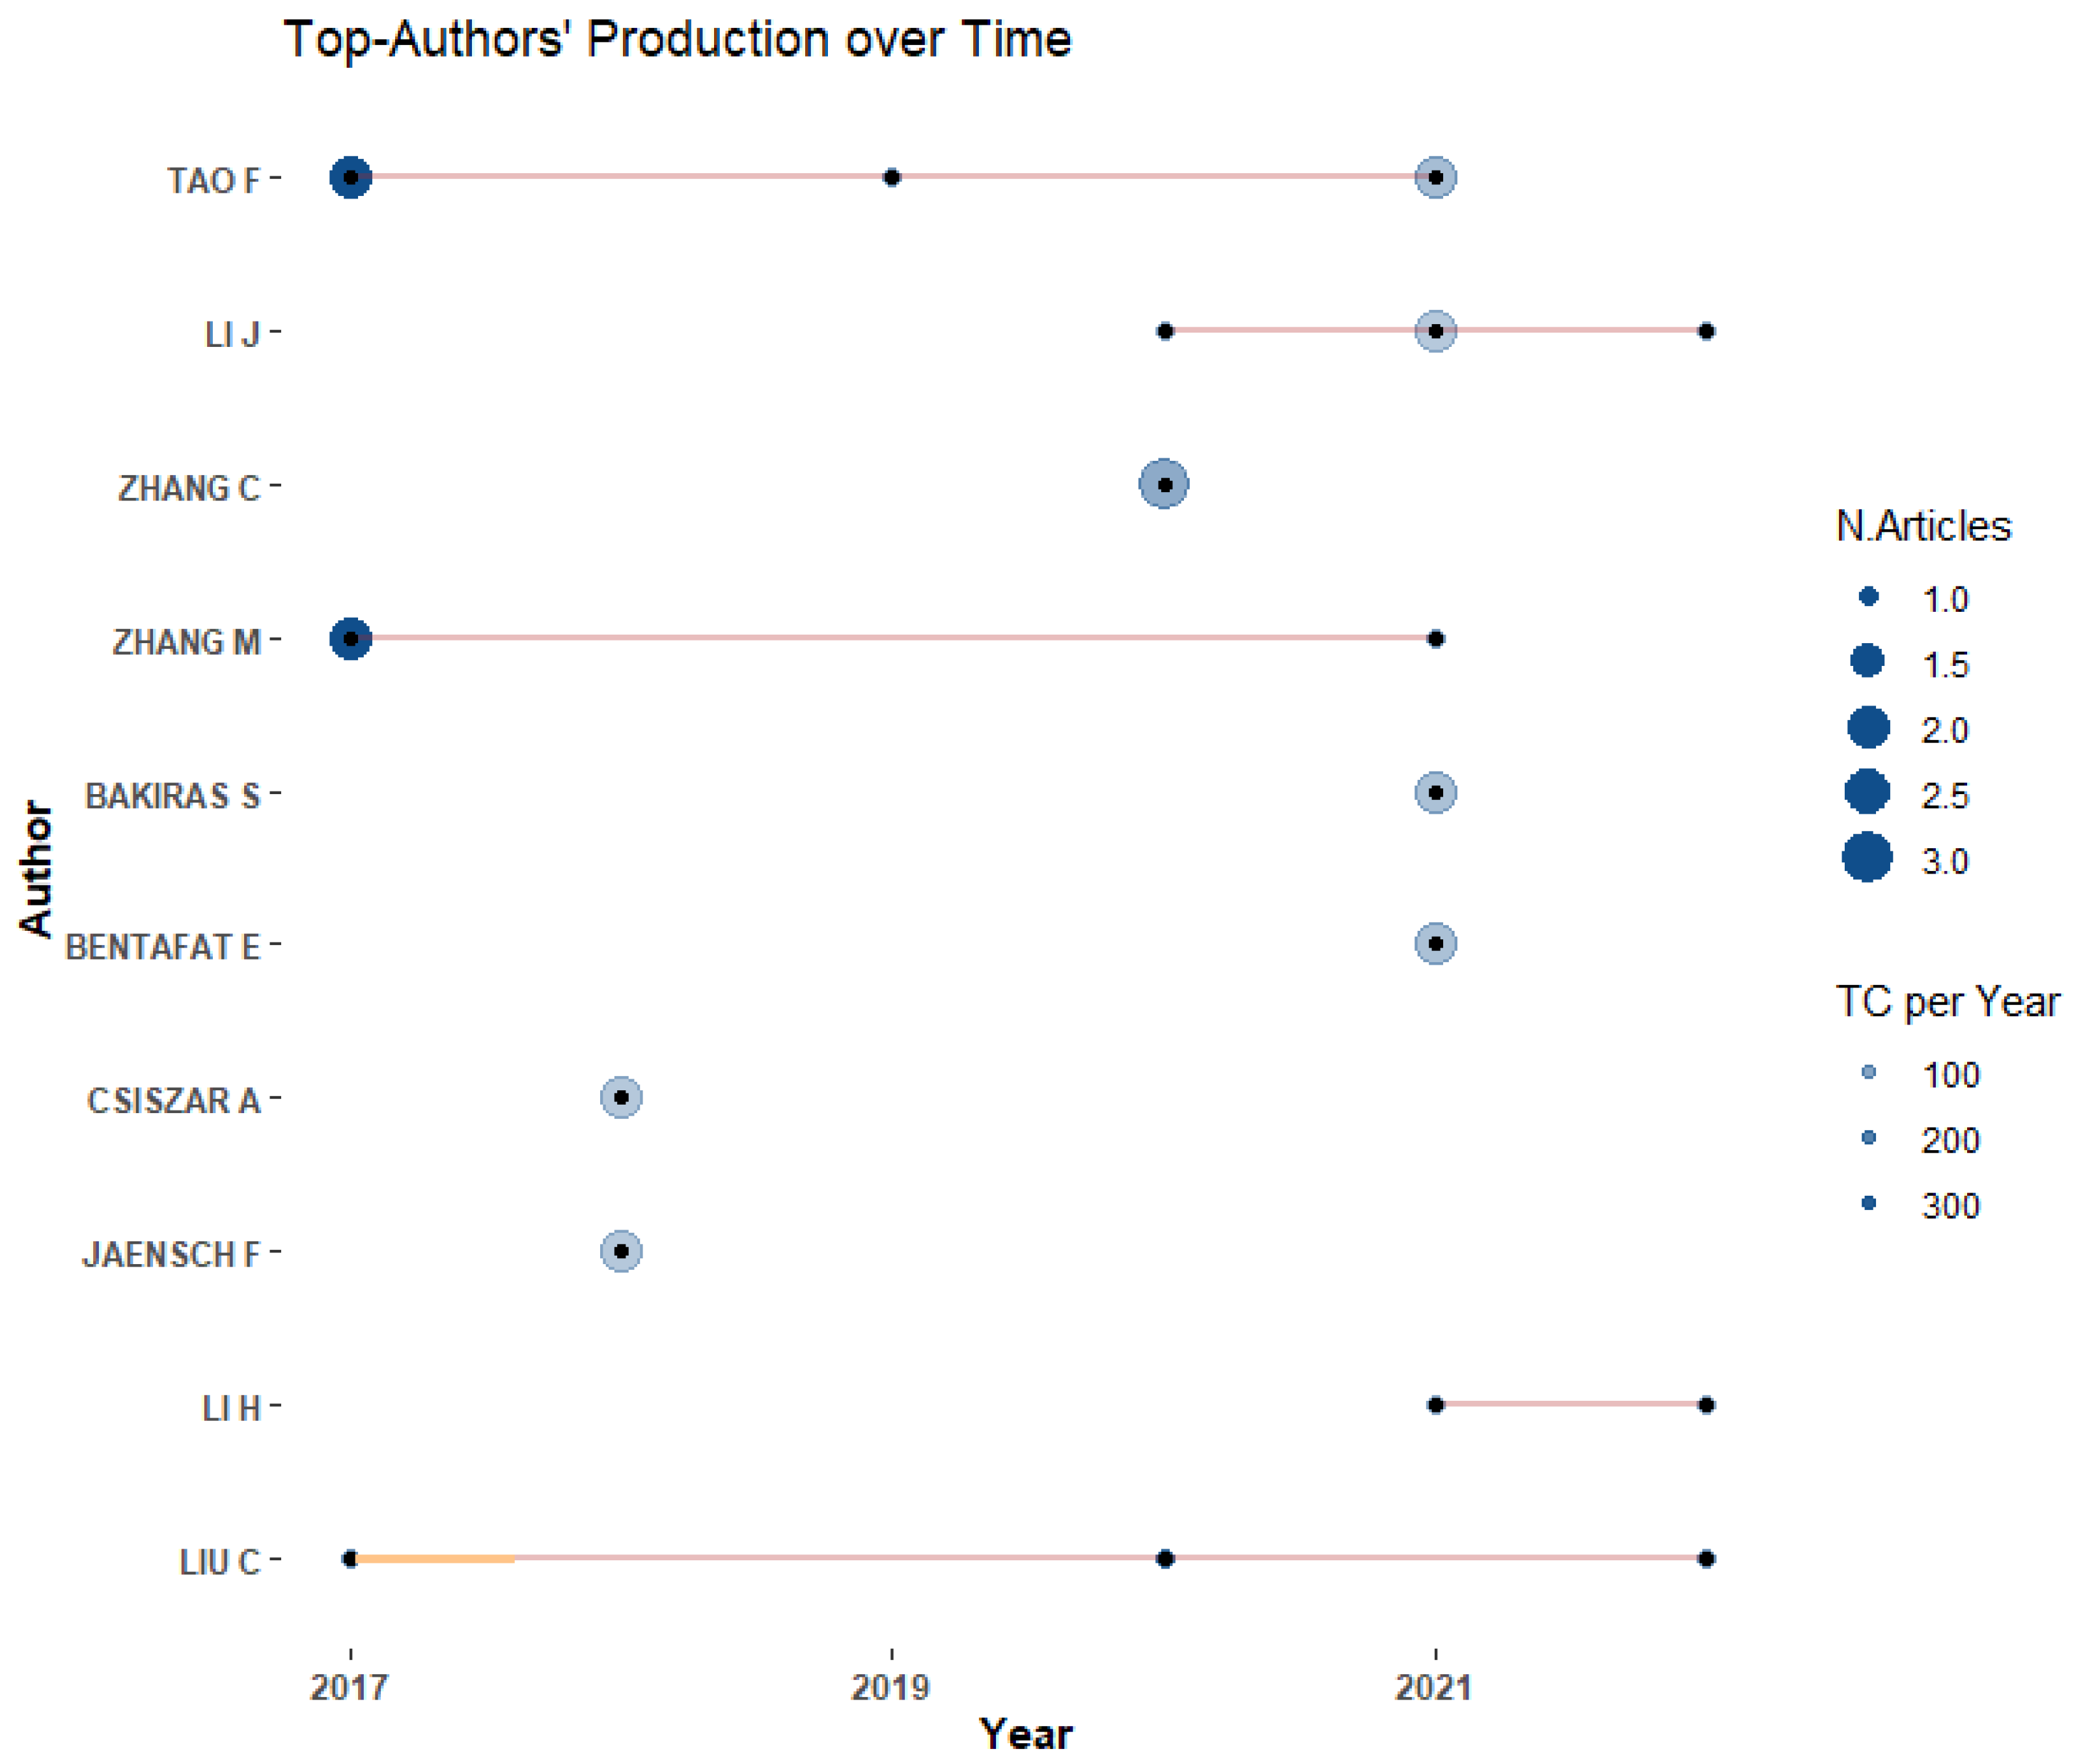
Figure 6 depicts the top 10 authors considering total publications (TP) and total citations per year (TC). According to the figure, Fei Tao is the most productive (six publications) [2,3,4,12,24,25] and most cited author (300 average citations). Following Fei Tao, Jiakun Li [5,25] is the most productive and cited author. Most authors published three papers in the same year and stopped publishing afterwards.
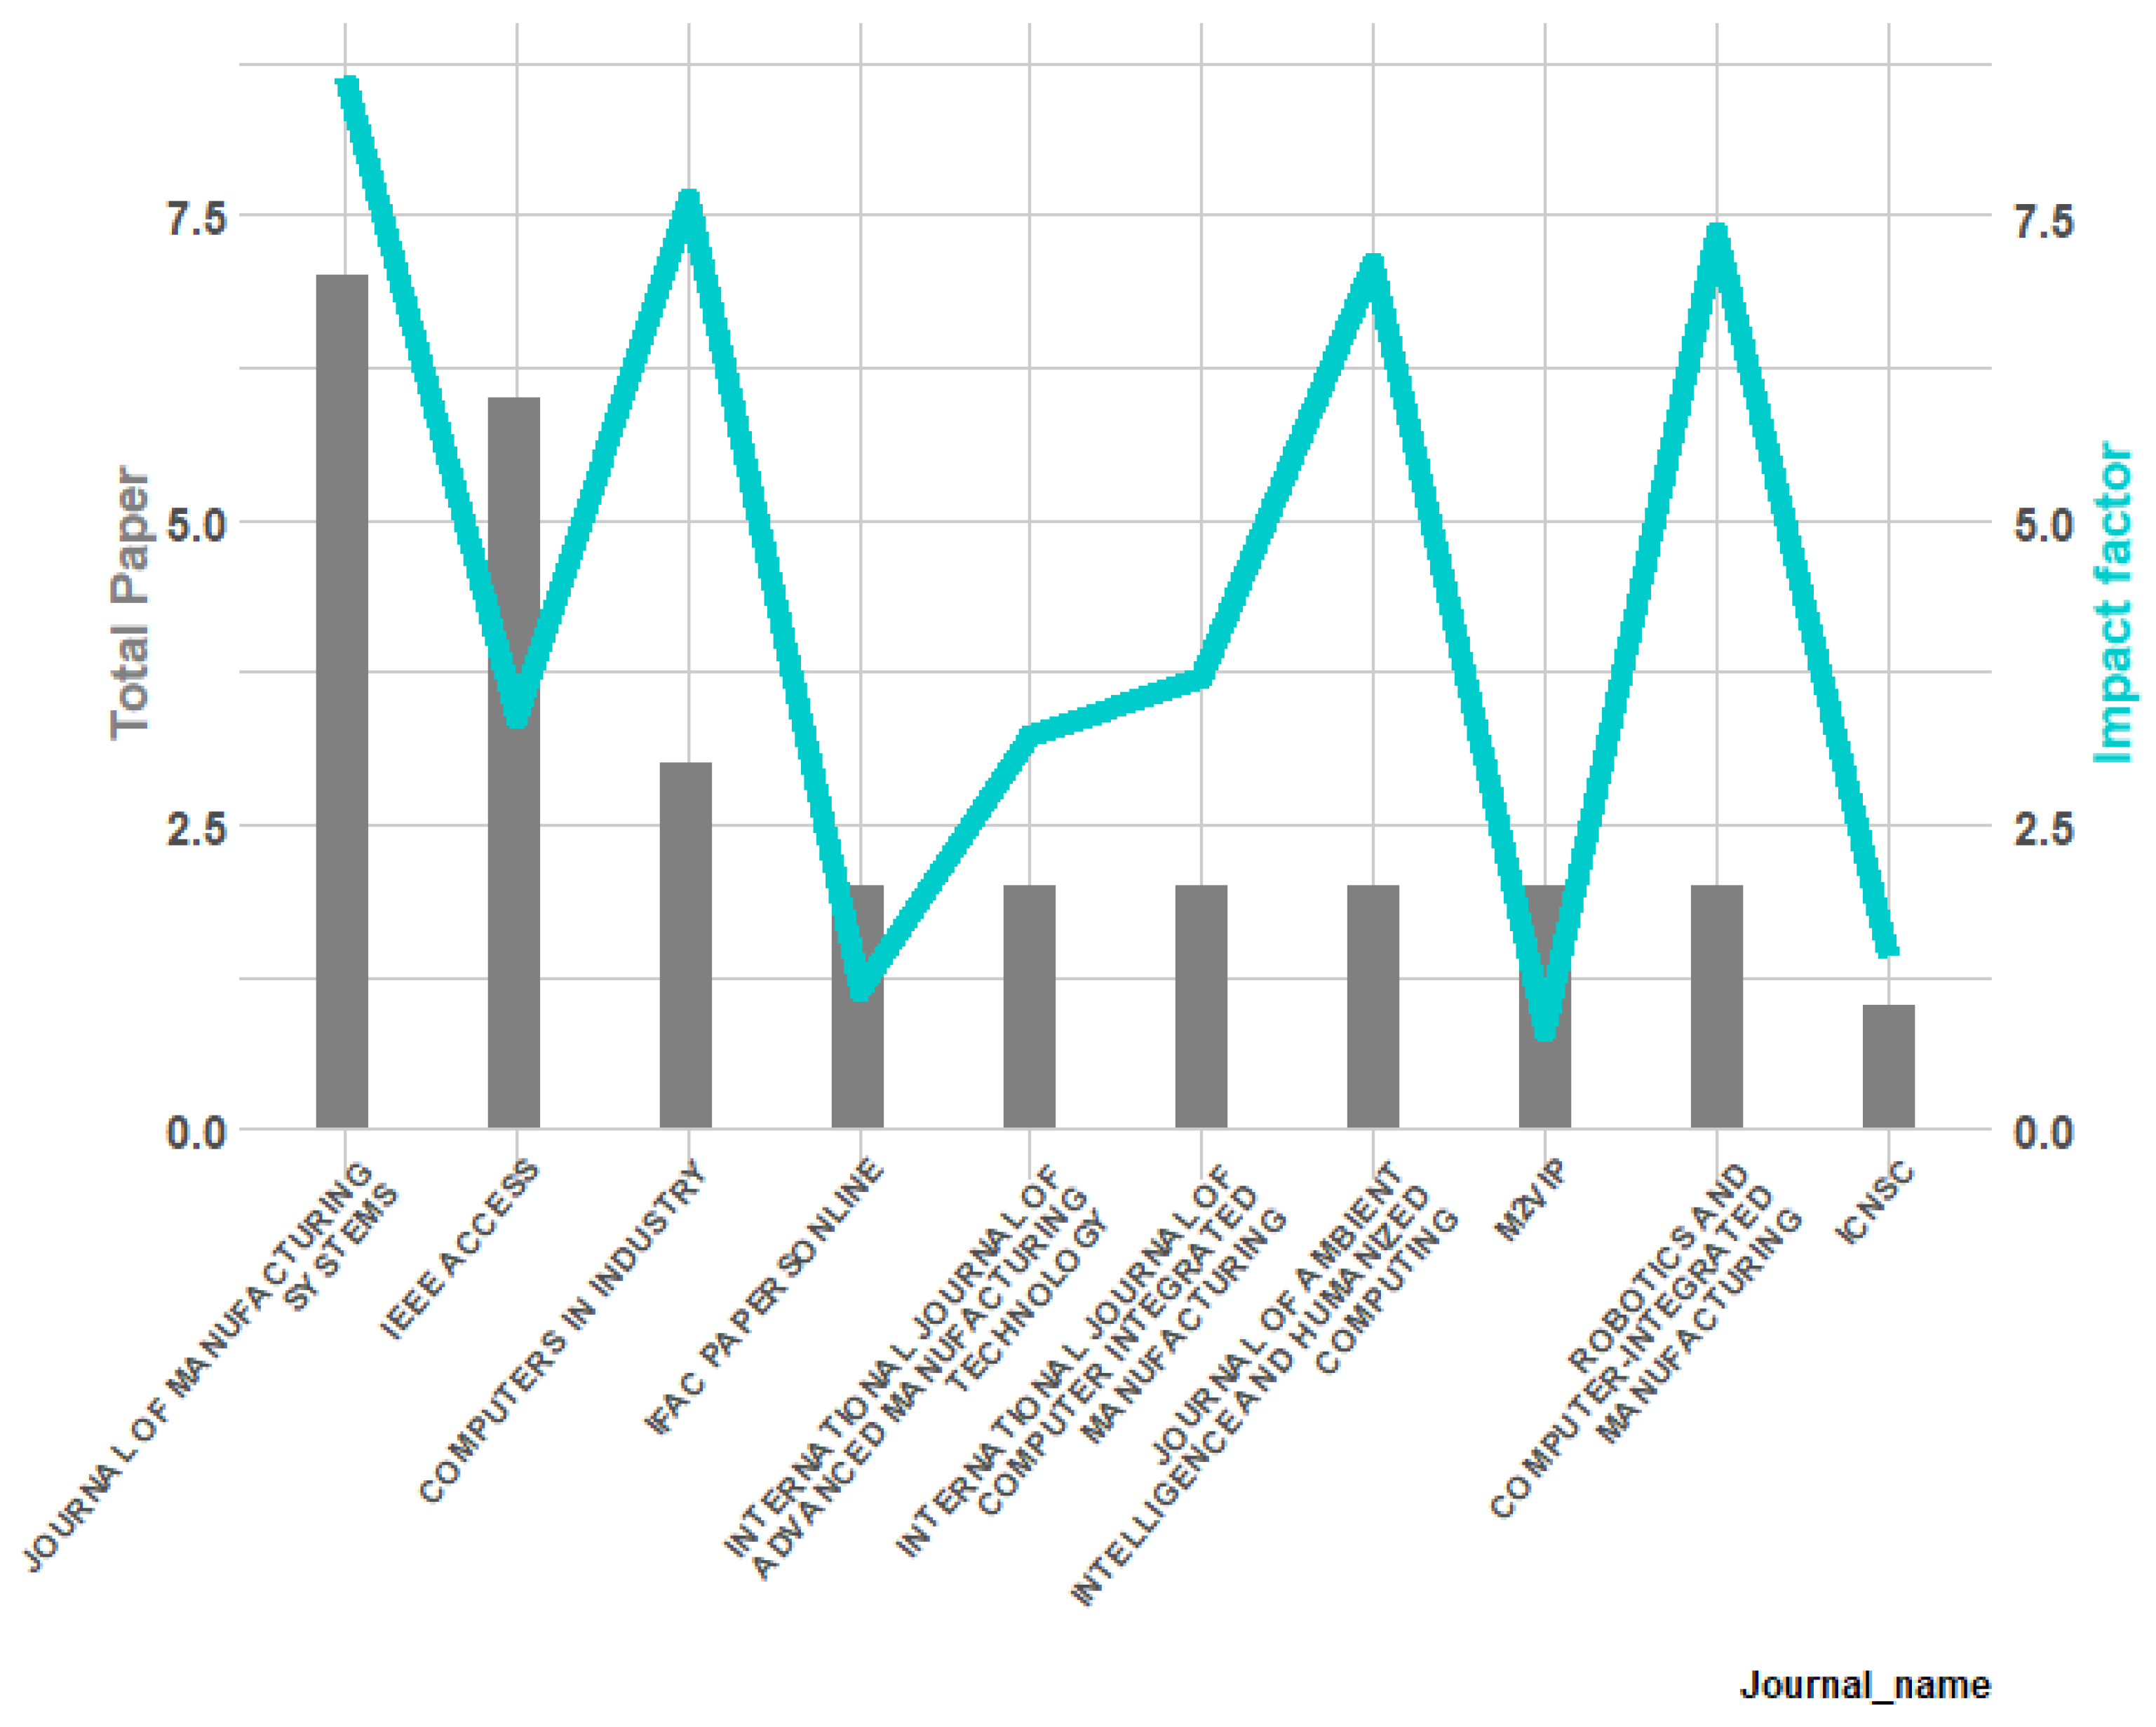
Figure 7 represents the top 10 journals and conferences considering total papers (TP). M2VIP is an abbreviation of Proceedings of the 2018 25th international conference on mechatronics and machine vision in practice, while ICNSC is an abbreviation of 2018 IEEE 15TH International conference on networking sensing and control. Additionally, the Figure shows the impact factors of the journals and conferences. The most productive journal is the Journal of manufacturing systems, with seven publications, and it has the highest impact factor 8.63. The Journal of manufacturing systems is followed by IEEE access, with six publications and an impact factor of 3.36. Additionally, other high-impact-factor journals are Robotics and computer-integrated manufacturing, and computers in industry. The trends in publication quantity and impact factor imply that ML-based DT is being focused on by the scientific community with increased significance.

4.1.1. Topic Cluster

A conceptual structure of the author keywords is drawn with help of Multiple Correspondence Analysis (MCA) and named as Co-word Analysis through Correspondence Analysis.
Co-word analysis is a technique for content analysis of textual data. The result is several clusters created based on certain scientific aspects. Each cluster comprises textual information of scientific topics with similar semantic or conceptual information.
MCA is a technique to find relative relationships among qualitative variables. In correspondence analysis, residuals of a variable’s value from the expected value indicates its association. A significant positive number indicates a stronger relationship.
For example, publication A has author keywords “Digital Twin”, “Machine Learning”, and “manufacturing”. Therefore, a variable named publication-A is created with values: “Digital Twin”, “Machine Learning”, and “manufacturing”. Similarly, each publication in the corpus contributed one variable with respective author keywords as the variable value. These newly created variables are used in MCA. Co-occurrence frequency of these newly created variable values determine their association. Variable values with higher associations are placed in the same cluster.
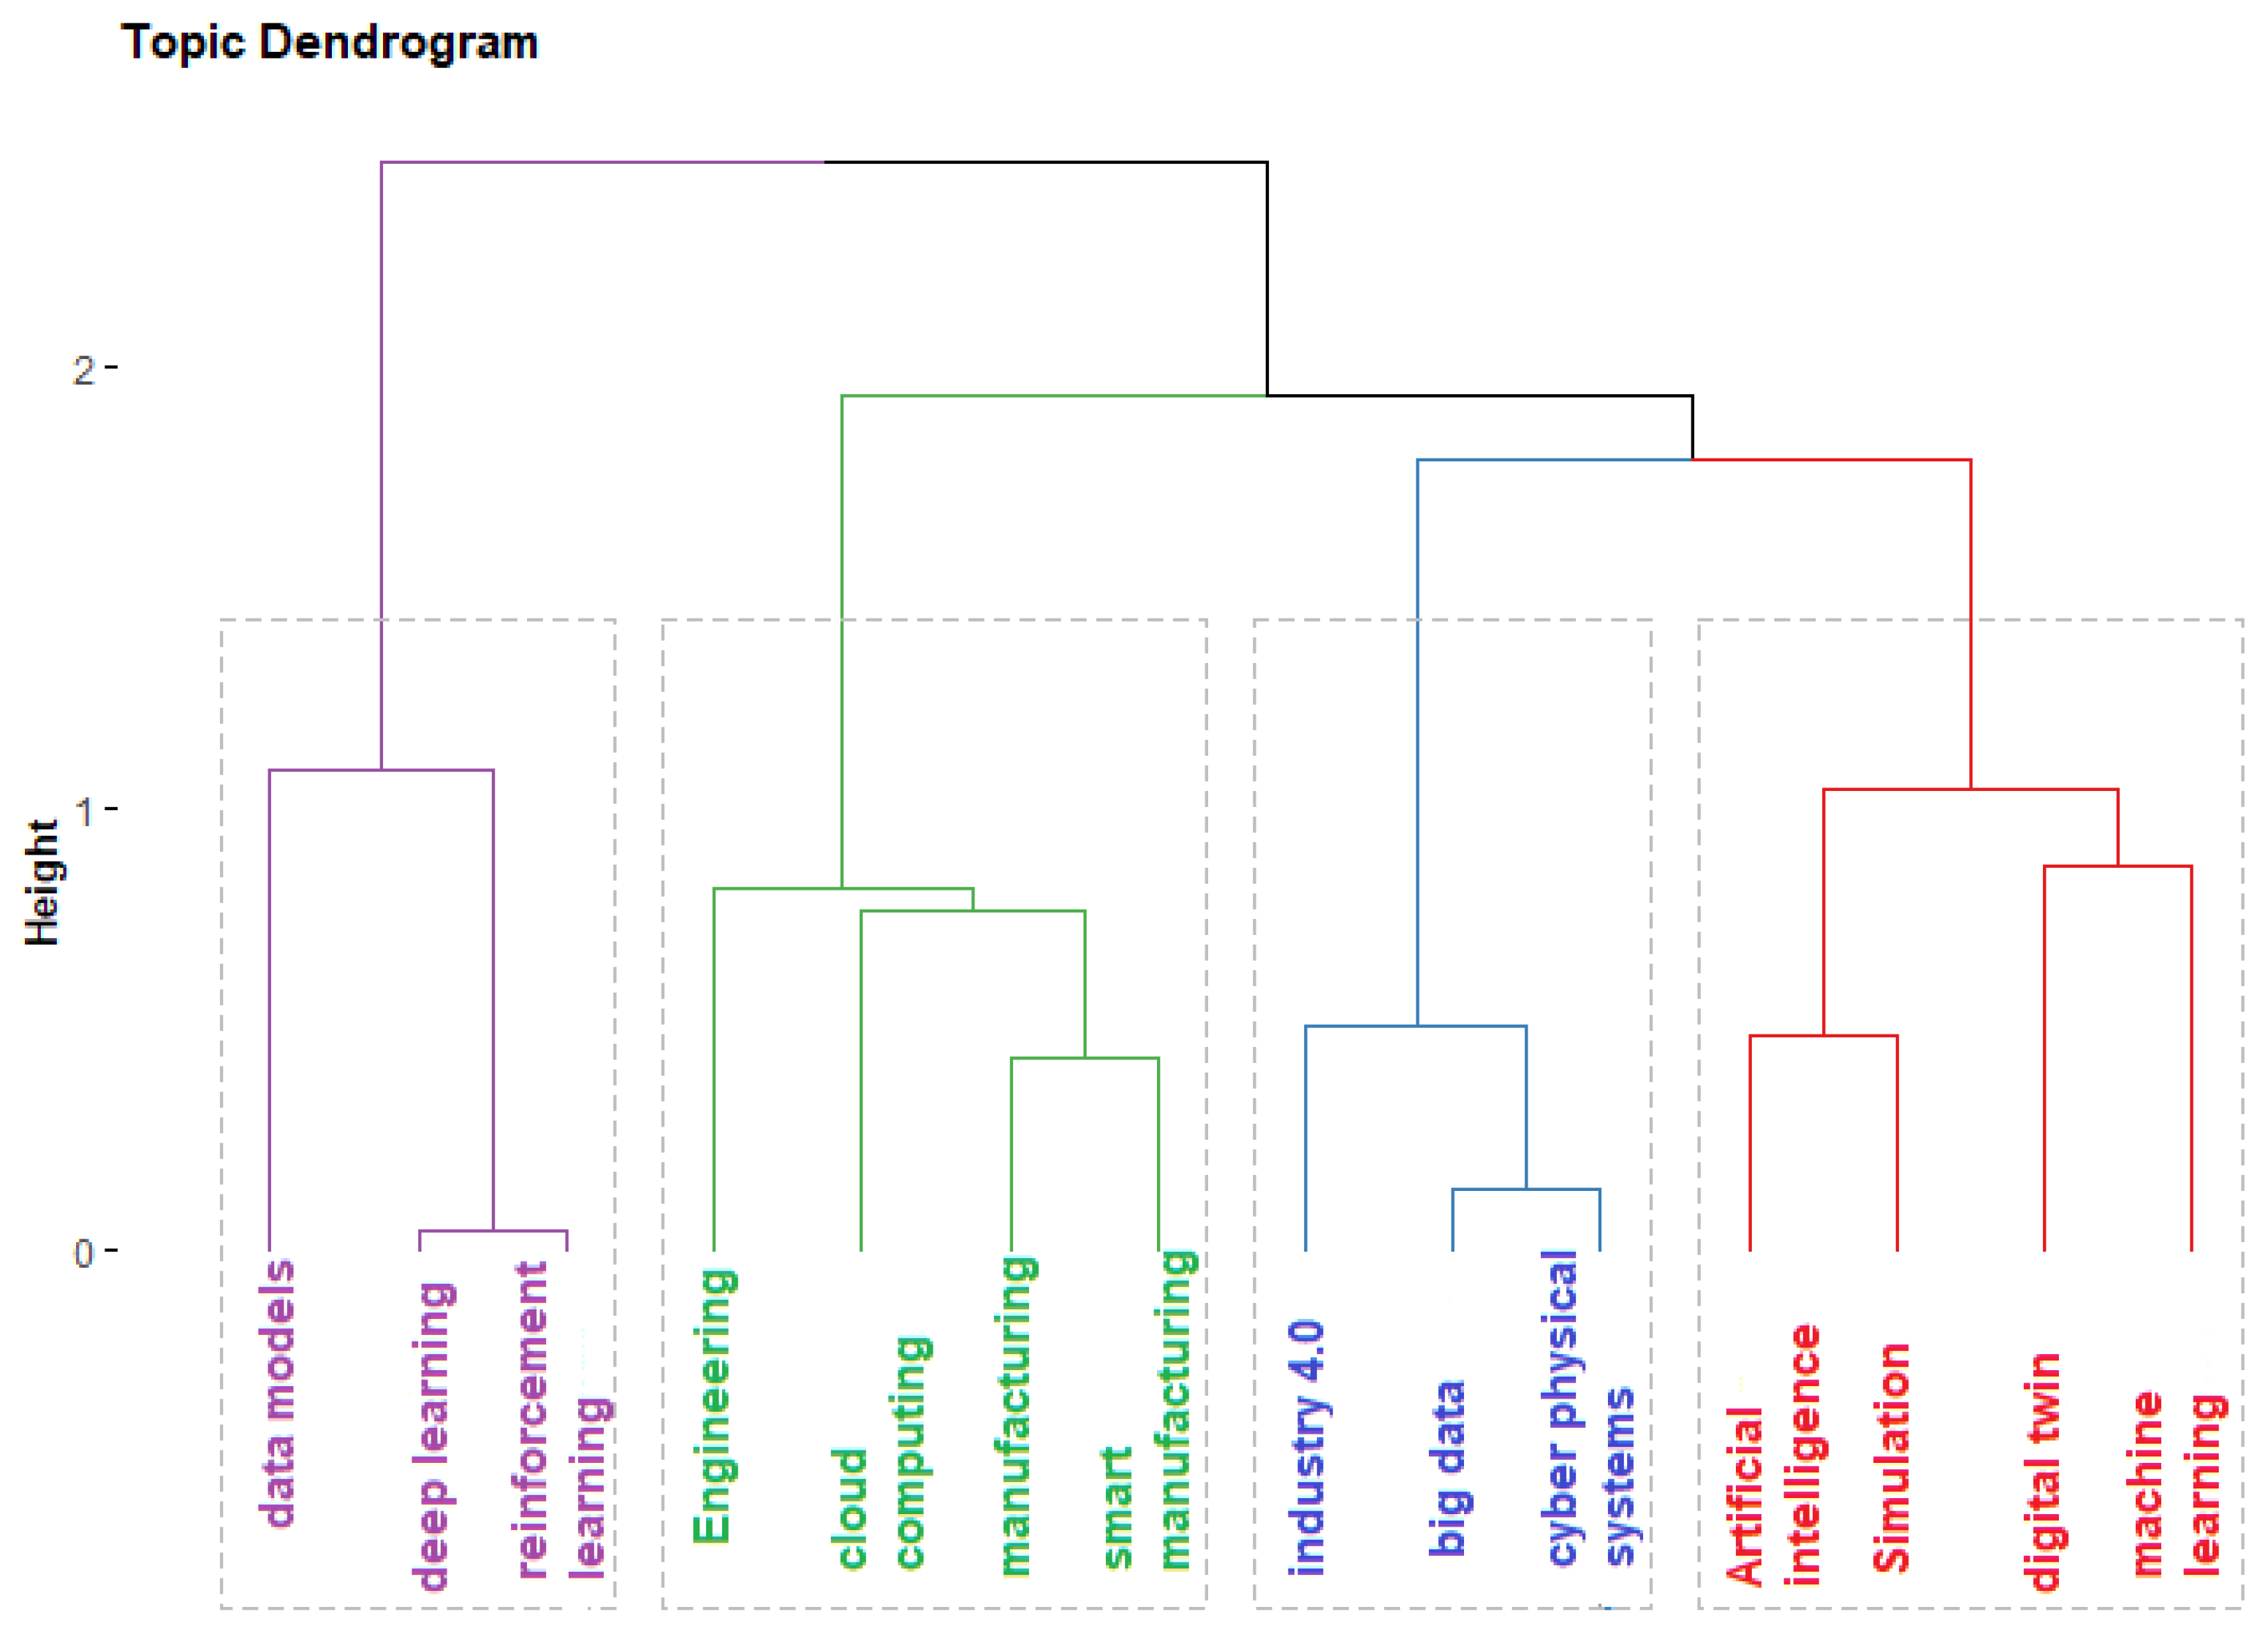
A natural language processing (NLP) routine in addition to Porter’s stemming algorithm is used to extract words from author keywords. Porter’s stemming algorithm identifies inflected and derived words. In the topic dendrogram, four clusters can be identified. The keywords in cluster 1 have the highest association, whereas keywords in cluster 4 have the least.
The four identified clusters are: (a) Cluster 1: Computer-integrated manufacturing, (b) Cluster 2: Industry 4.0, (c) Cluster 3: Smart manufacturing, and (d) Cluster 4: Data models.
Cluster 1: Computer-integrated manufacturing. Computer integration into manufacturing (red cluster in Figure 8) has paved the way for sustainable, robust, and economically efficient manufacturing. Fei Tao et al. [12] proposed DT shop floor (DTS) with four components: (a) physical shop floor, (b) virtual shop floor, (c) shop-floor service system, and (d) shop-floor DT data. In a subsequent study by Fei Tao et al. [4], they used DT for product lifecycle management, that is, design, manufacturing, and service. The difference between these two studies is that one [12] focuses on the DT architecture, while the other [4] focuses on DT application scenarios.
Zhang et al. [26] discussed the DT architecture and combined a DT and stacked auto-encoder (SAE) to monitor product quality. The results showed an improvement in performance. Gaikwad et al. [27] proposed a gray-box DT model for laser powder bed fusion (LPBF) and directed energy deposition (DED) by combining simulation, in situ sensor data, and ML. This architecture improves performance. The timeline analysis shows that in 2017, the focus was on DT architecture [12] and application scenarios [4], whereas in 2020, the focus was on improved performance [27]. Certain review papers have been published, such as one [19] by Barricelli et al., which emphasises the DT definition, characteristics, and application domains. Similar to Barricelli et al. [19], Cimino et al. [18] performed a literature review on DT applications and gaps in the current state of the art. In addition, the authors proposed simulation-based DT to fill the identified gap.
Conversely, Rathore et al. [1] tried to identify the role of AI/ML, big data in the creation of DT, and challenges associated with future studies. The reviews that belong to this cluster emphasise DT characteristics [19], DT applications [18,19], and the role of specific technology in DT creation [1]. The analysis of these publications indicates that in 2019, the primary research focus was to create a common base of DT through unified definitions, characteristics, and applications, whereas in 2021, the focus was more on the application of advanced technology to DT.
Cluster 2: Industry 4.0. Industry 4.0 is a buzz word in the manufacturing industry (blue cluster in Figure 8). Certain technologies applied to enhance Industry 4.0 are cloud computing, big data, and cyberphysical systems (CPS). To achieve industry 4.0, Fei Tao et al. [12] proposed a DT shop floor (DTS) with four components, (a) physical shop floor, (b) virtual shop floor, (c) shop-floor service system, and (d) shop-floor DT data.
Following the track of Fei Tao, Zhang et al. [7] proposed a conceptual model of Cyberphysical Production Systems (CPPS) which is based on DT for job scheduling. This system converges to physical and virtual spaces similar to those in reference [12]. However, the proposed model has (a) a physical layer, (b) network layer, (c) database layer, (d) model layer, and (e) application layer. In 2021, Lugarsi et al. [28] advanced the concept of DT using automatic model generation from the data. This increases the fidelity of the DT. Compared to [7,12], Lugarsi et al. [28] focused on one of the characteristics of DT instead of the total architecture. Lugarsi et al.’s work contributes to the domain of Industry 4.0 with a robust DT. This cluster deals with several architectures and characteristics of the DT for Industry 4.0. Additionally, this cluster focuses on the convergence of physical and virtual spaces.
Cluster 3: Smart manufacturing. This cluster is shown in green in Figure 8. A study [6] by Jiafu Wan contributed to this cluster. The author of this publication used big data for preventive maintenance, in which the cloud environment plays an important role in data processing. Another contributing document is by Fei Tao et al. [12], in which the authors proposed a conceptual DT shop floor (DTS) to enhance smart manufacturing. In this case, cloud computing, cyberphysical systems (CPS), and data models play important roles. Both [6,12] implement smart manufacturing through cutting-edge technologies.
Cluster 4: Data models. This cluster is coloured purple (Figure 8) and includes author keywords: data models, deep learning, and reinforcement learning. Deep learning and reinforcement learning were the most common keywords. The publication by Cronrath et al. [29] in 2019 helped compensate for data errors in the DT model with the help of reinforcement learning (RL). This work helped increase DT fidelity. However, another study [30] used deep learning for data analytics, that is, fault diagnosis, instead of data error compensation. In 2020, Lacueva et al. [31] used machine learning for fault prediction following this theme.

4.1.2. Thematic Evolution

An evolutionary analysis based on author keywords within the three periods was performed. These are Period 1 (2015–2017), Period 2 (2018–2019), and Period 3 (2020–2022).
In the proposed study, co-word analysis was performed on author keywords in three time periods and returned several word clusters. These clusters of keywords are named as themes.
Each theme has two parameters: “density” and “centrality”. The placing of a theme in one of the four quadrants depends on these parameters. They indicate the similarity of items within and between themes. The similarity of an item can be calculated based on keywords’ co-occurrence frequency. Density implies Callon’s density [32], which measures the strength of a keyword’s interaction with other keywords within a theme. Conversely, centrality implies Callon’s centrality [32], which measures strength of interactions of a keyword in a theme to keywords in other themes. Therefore this value indicates the importance of the theme in the development of the target research domain, whereas density implies the themes’ development stage [33].
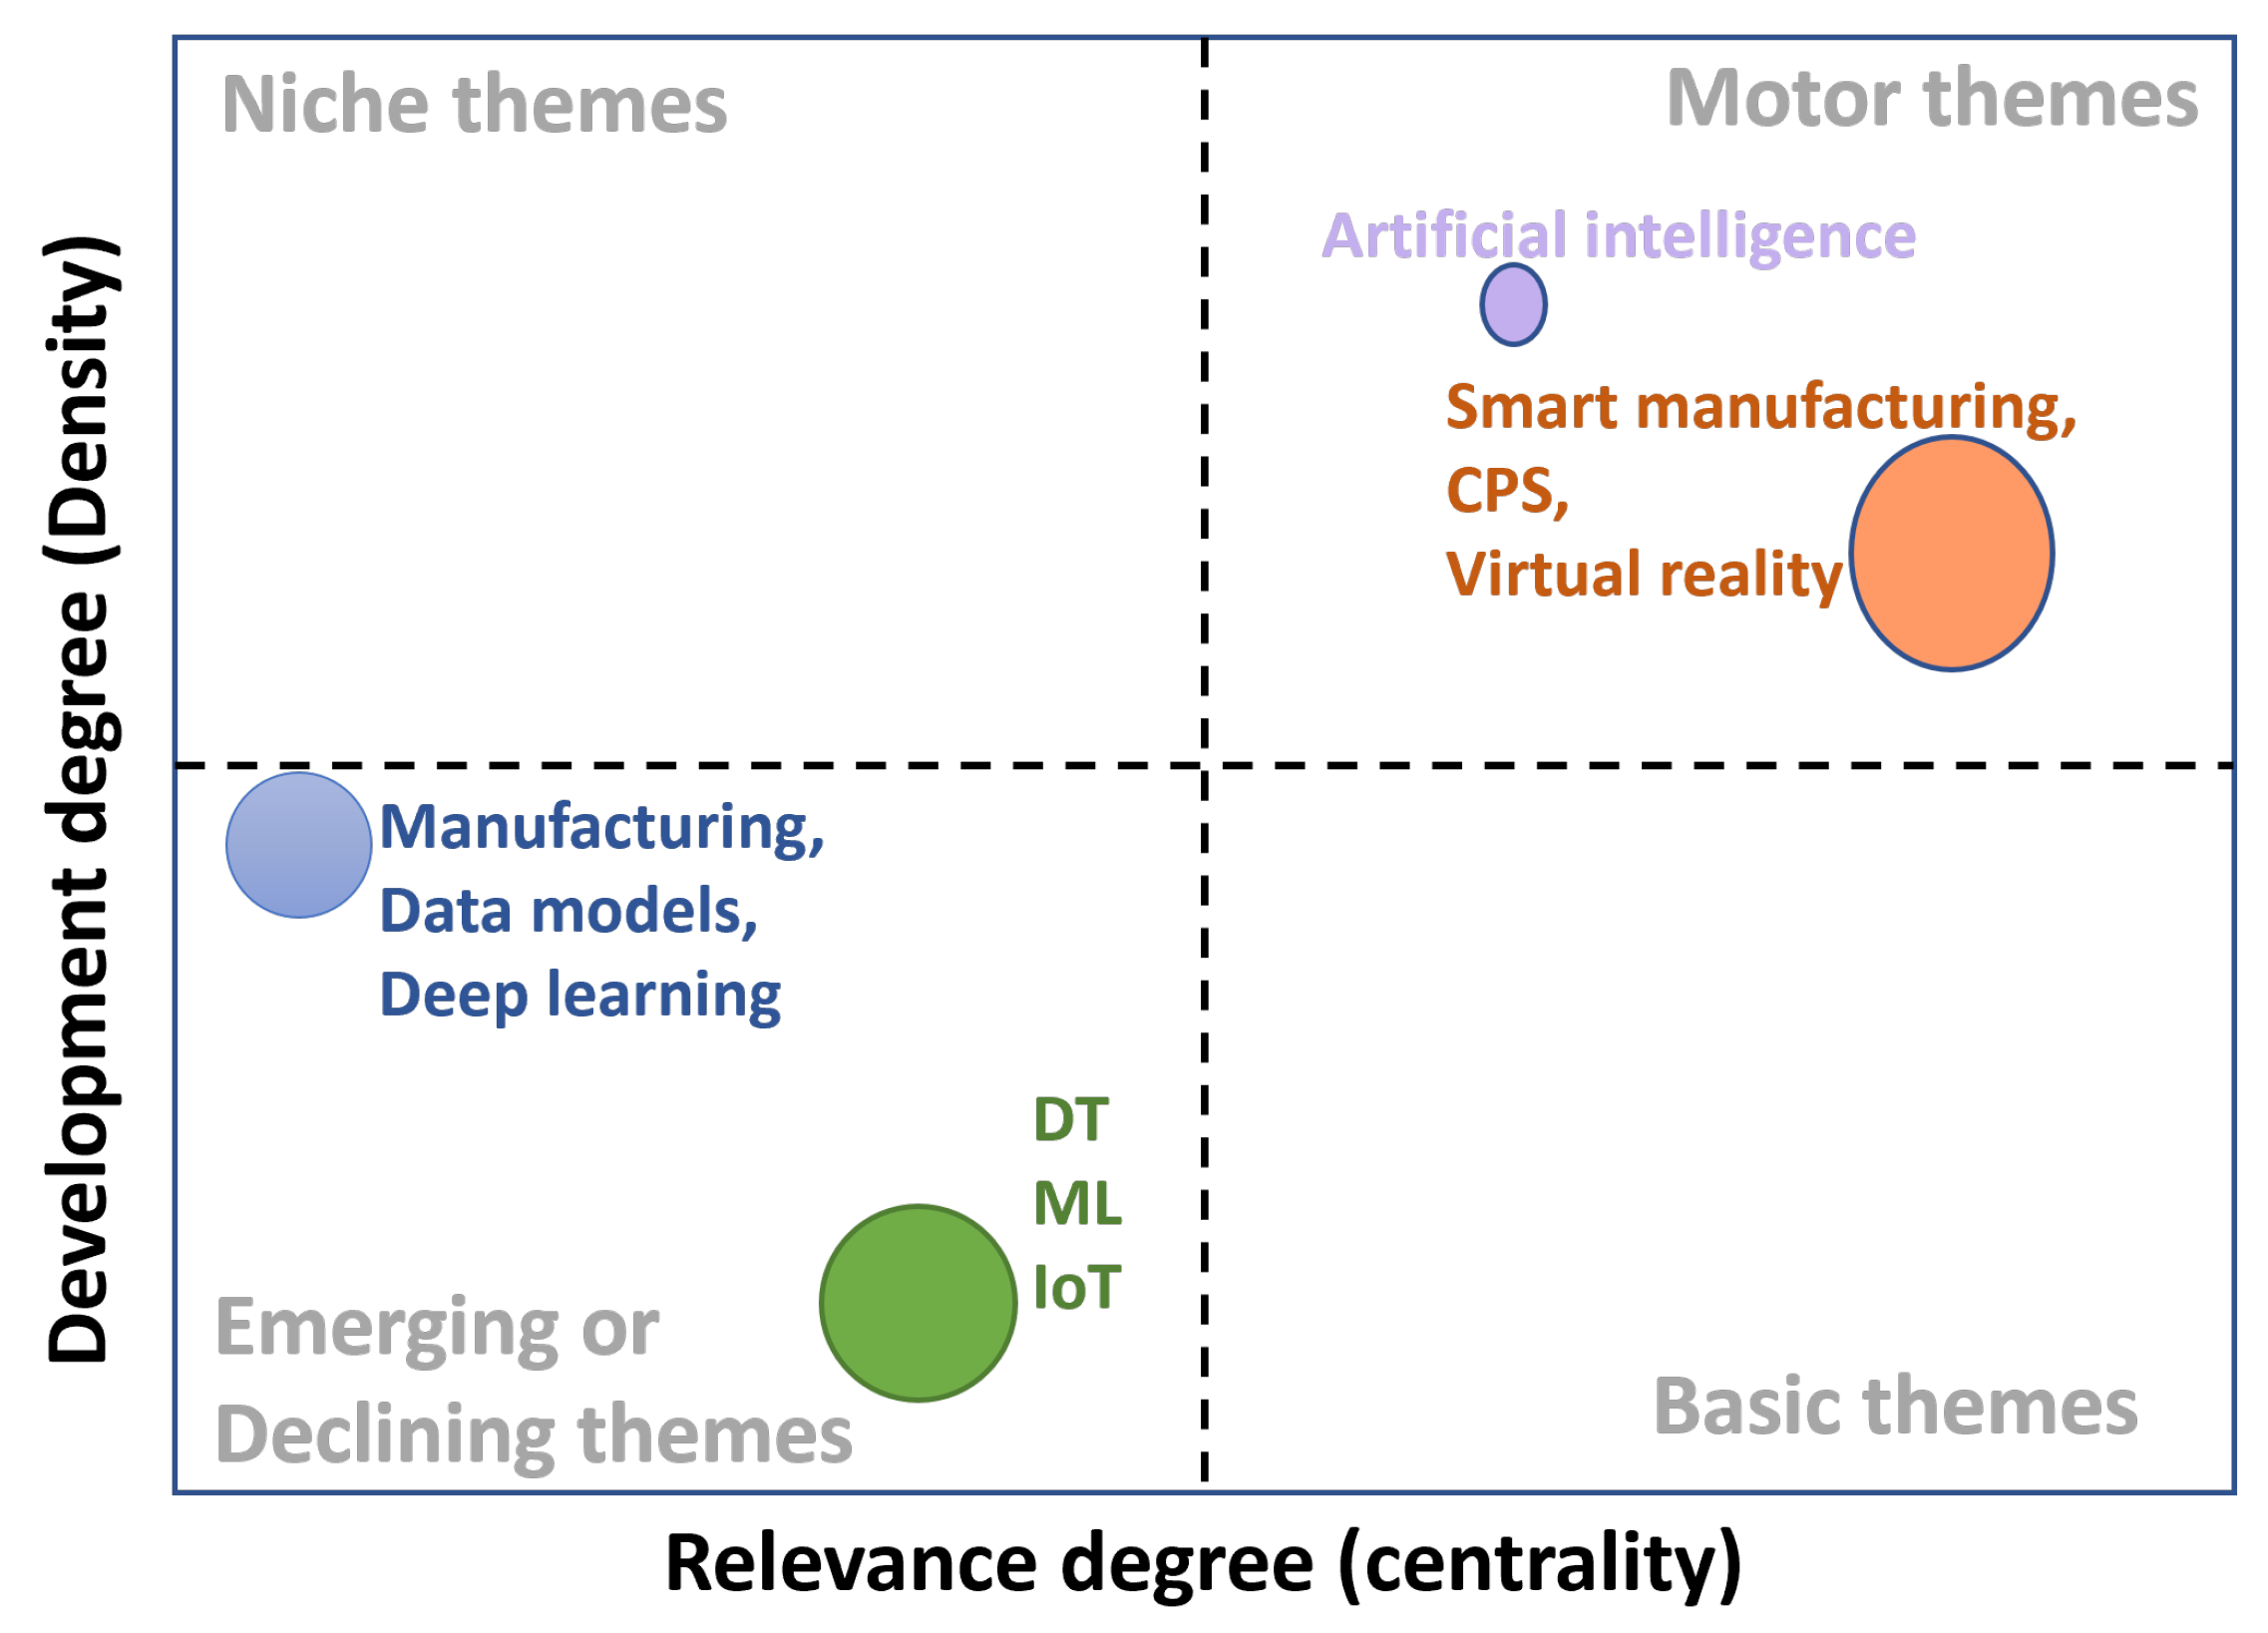
An evolutionary map consists of four quadrants (i.e., Figure 9):
  • Upper-right quadrant: motor themes—higher values of development and relevance define motor themes. These themes are well-developed and relevant to the domain.
  • Lower-right quadrant: basic themes—higher values of relevance and lower values of development define basic themes. These themes are significant for the domain; however, they are not well-developed.
  • Lower-left quadrant: emerging or declining themes—lower values for relevance and development define emerging or declining themes. These themes are not directly connected to the domain, and full development has not been achieved.
  • Upper-left quadrant: very specialized/niche themes—lower-relevance values and higher development values define niche themes. These themes are highly developed, but their relevance to the domain is marginal.
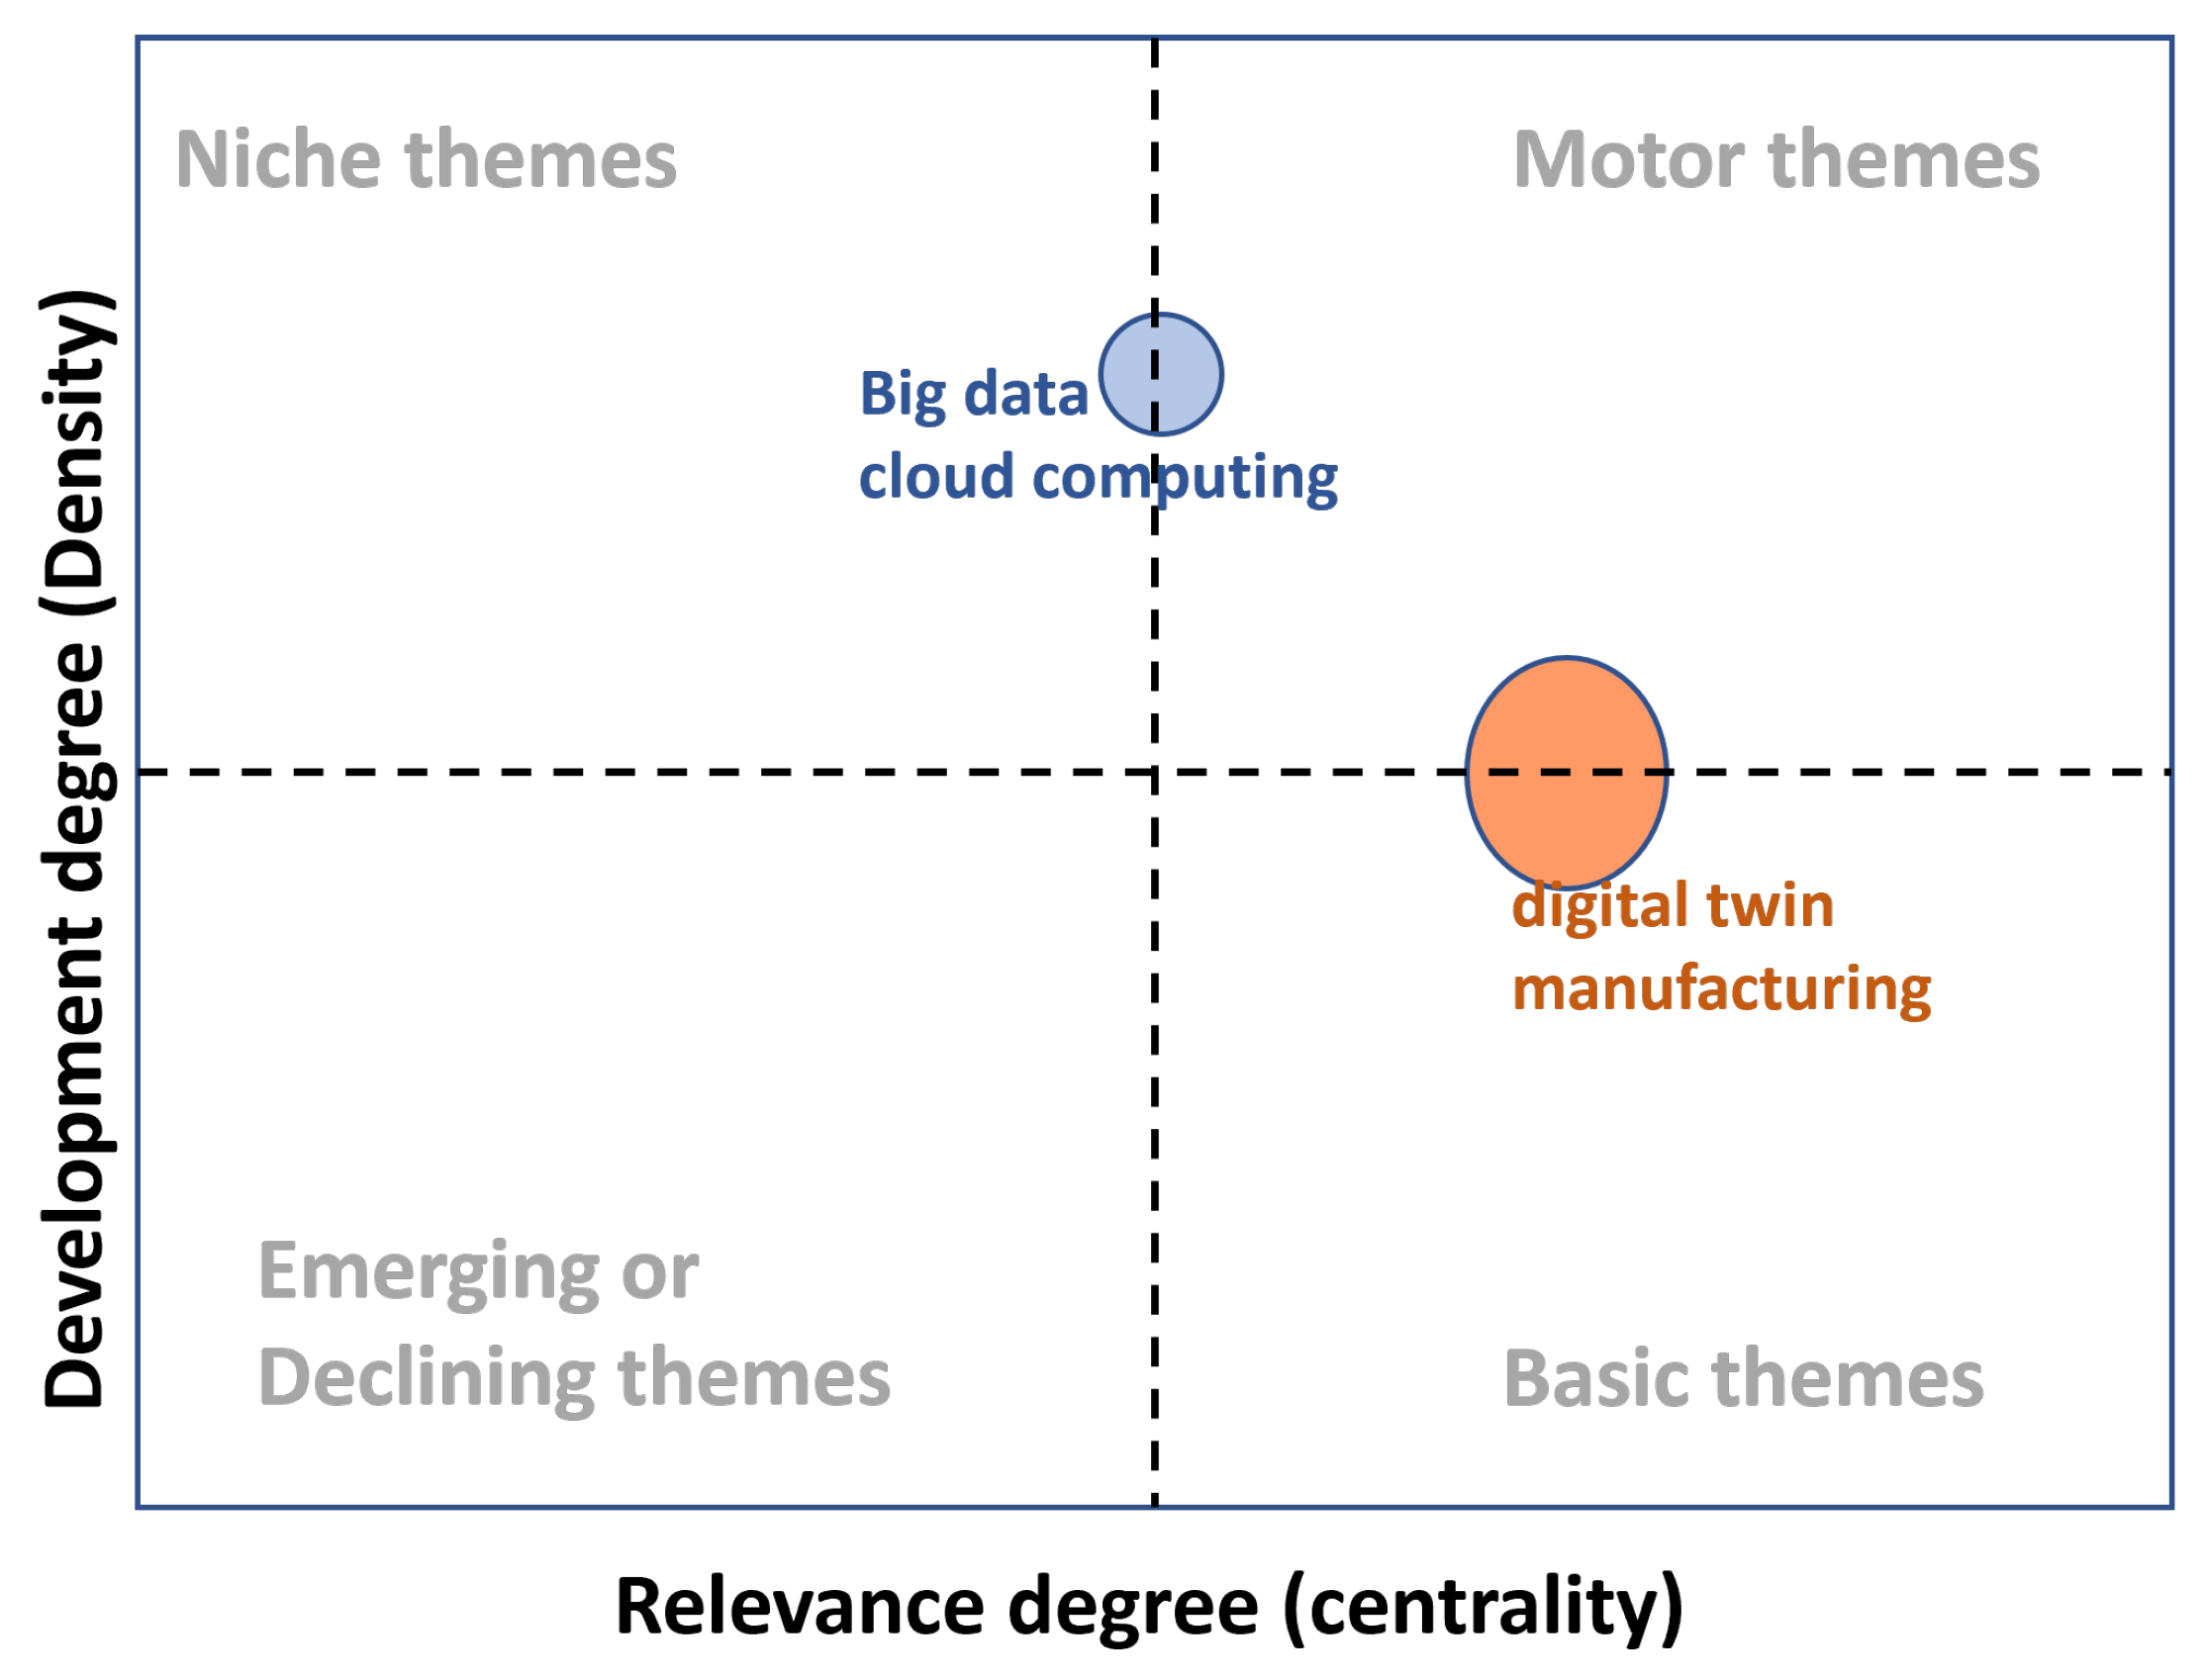
Figure 9. Thematic evolution period 1, 2015–2017. A figure with four quadrants representing specific relevance and development degree. Two themes in period 1, 2015–2017.
Applsci 12 06512 g009
Period 1 (2015–2017): In Figure 9, the circle with keyword “Digital Twin” and “manufacturing” is a transversal theme that is related to different research fields of the manufacturing domain. The circle size indicates that these keywords (“Digital Twin” and “manufacturing”) are emphasised by the authors in Period 1 more than “big data” and “cloud computing”.
Period 2 (2018–2019): In Period 2 (Figure 10), the keywords “Digital twin”, “machine learning,” and “Internet of things” are emphasised as emerging themes. Additionally, “manufacturing”, “data models”, and “deep learning” are considered as emerging themes. The trajectory through these two time periods (Period 1 and Period 2) indicates that DT is evolving from only applications in the manufacturing domain to a robust architecture. A new motor theme appeared in period 2: “smart manufacturing”, “cyber physical systems”, and “virtual reality”. This theme is highly relevant and has been developed for the manufacturing domain. Another motor theme appeared in Period 2, which is “artificial intelligence”, with high density and centrality.
Period 3 (2020–2022): In period 3 (Figure 11), deep learning remained an emerging theme, similarly to in Period 2. Conversely, “artificial intelligence,” “big data,” and “smart manufacturing” degraded from the motor theme (Periods 1 and 2) to the basic theme (Period 3). Additionally, ML, DT, and the data model evolved from emerging themes (Period 2) to basic themes (Period 3). Several new themes that appeared as basic themes were “solid modelling”, “real-time systems”, “reinforcement learning”, “simulation”, “machining”, and “process mining”.
It can be seen from the analysis of the three time periods that DT evolves from a basic shadow of a physical system to a cutting-edge digital counterpart. Several recent technologies, such as real-time systems, simulation, ML, and big data, contribute to the convergence of physical and virtual spaces. Analysis of the trajectory over three time periods shows that big data and ML remained as the research focus, while simulation emerged as a contributing technology after 2020.

4.2. Second Research Question

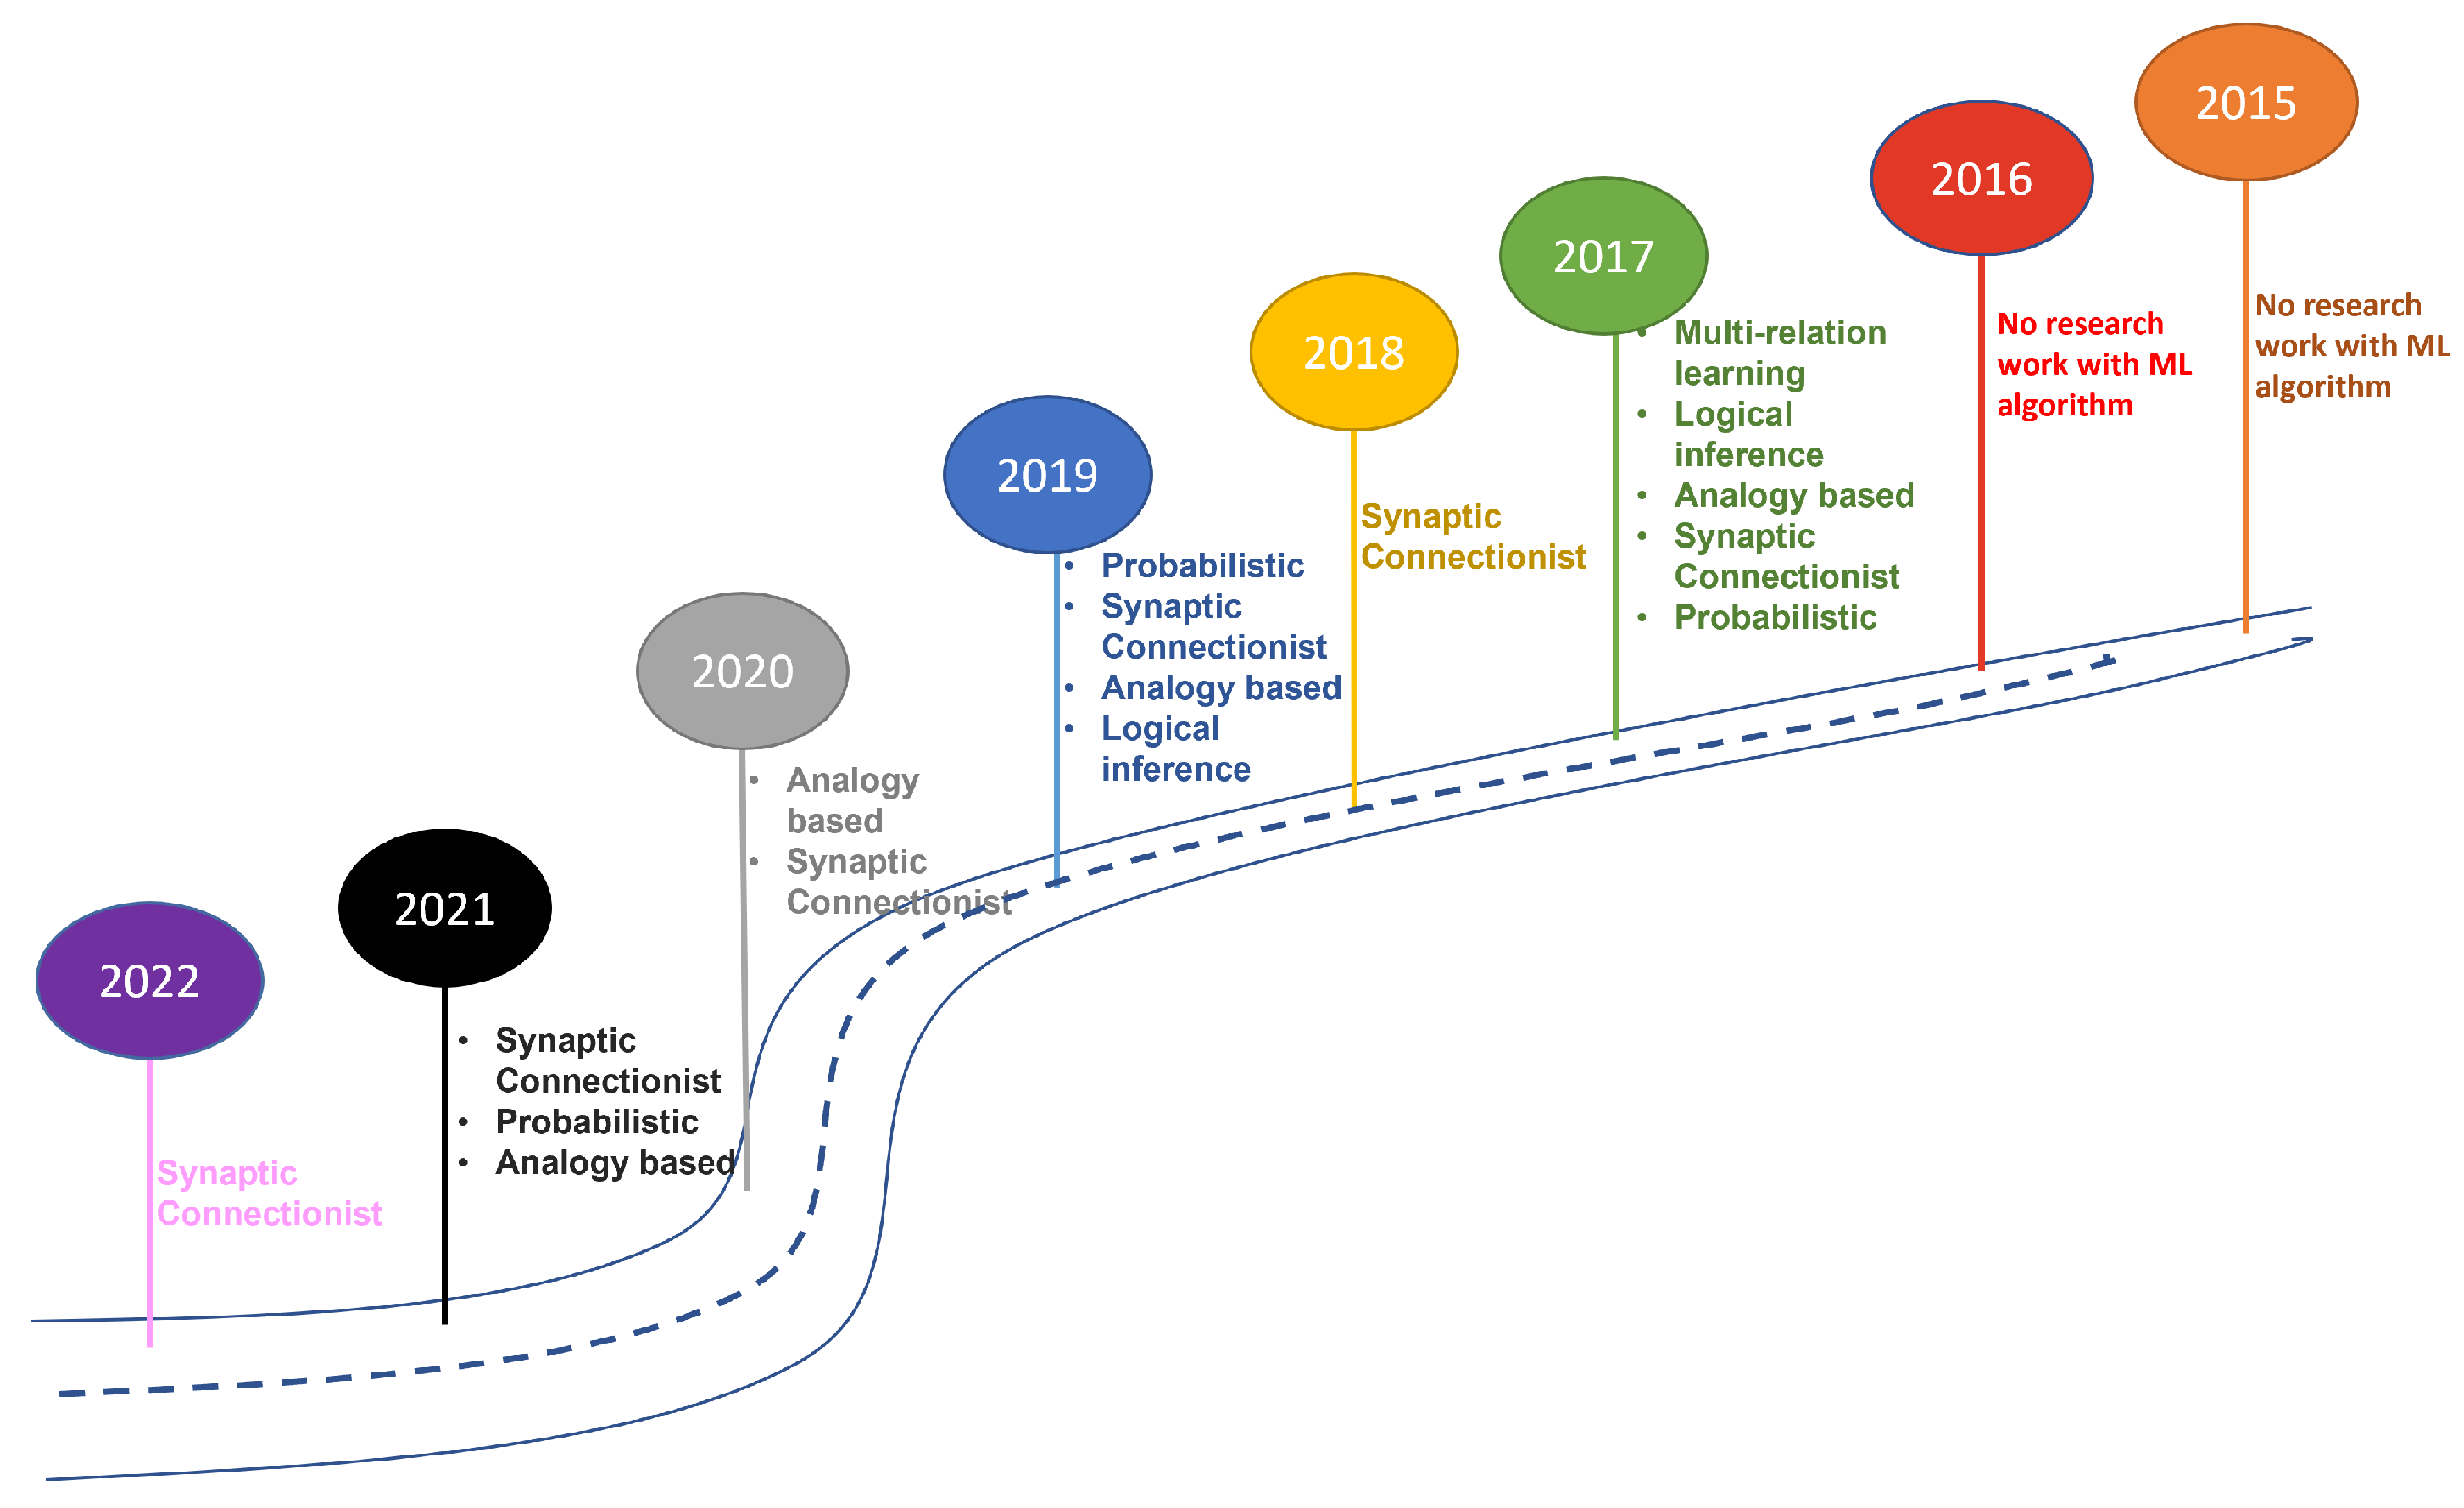
A summary of the ML algorithm applied to DT is shown in Figure 12. As shown in the figure, ML algorithms can be classified into several classes based on their working strategy, that is, (a) synaptic connectionists, which work based on the synaptic signalling method of the human nervous system, for example, an artificial neural network. (b) Evolutionary: Based on Charles Darwin’s theory of natural evolution, for example, genetic algorithms. (c) Multirelation learning: representation of knowledge-preserving linguistic meaning, for example, the kg embedding model. (d) Logical inference: process of logical conclusion from premises, for example, decision tree or rule mining. (e) Analogy-based: separates data points based on analogical features, for example, Support Vector Machine (SVM). (f) Probabilistic: inferring the probability of an event or variable based on a few values of that variable or event, for example, Bayesian learning and Markov-chain-based models.
It has been shown that synaptic connectionist ML algorithm, i.e., neural network, is dominant in the period 2015–2022. In 2015 and 2016, no work was published on ML-based DT. However, over time, neural networks have been used for data fusion [12], data error compensation [29], real-time control [34], etc. The neural network architecture has become application-oriented over time, such as in the conventional neural network in 2018 [3], Bayesian neural network [29] in 2019, deep Q network [35] in 2020, GAN [36] in 2021, and Gaussian kernel extreme-learning machine [37] in 2022 (Figure 13).
Neural network architecture is evolving by incorporating new types of transfer function, uncertainty, and optimization. All these changes can be mapped to application-specific requirements and improved performance. Additionally, logical inference-based algorithms such as random forest, extra random forest, and AdaBoost, and analogy-based algorithms such as SVM and k-means were discussed in the publications. However, random forest and SVM clustering have marginal variation over time, thus they are excluded from Figure 13. In the future, ML-based automation applications will be dominant in reducing pandemic effects, demand-based manufacturing, and human- and computer-integrated manufacturing.
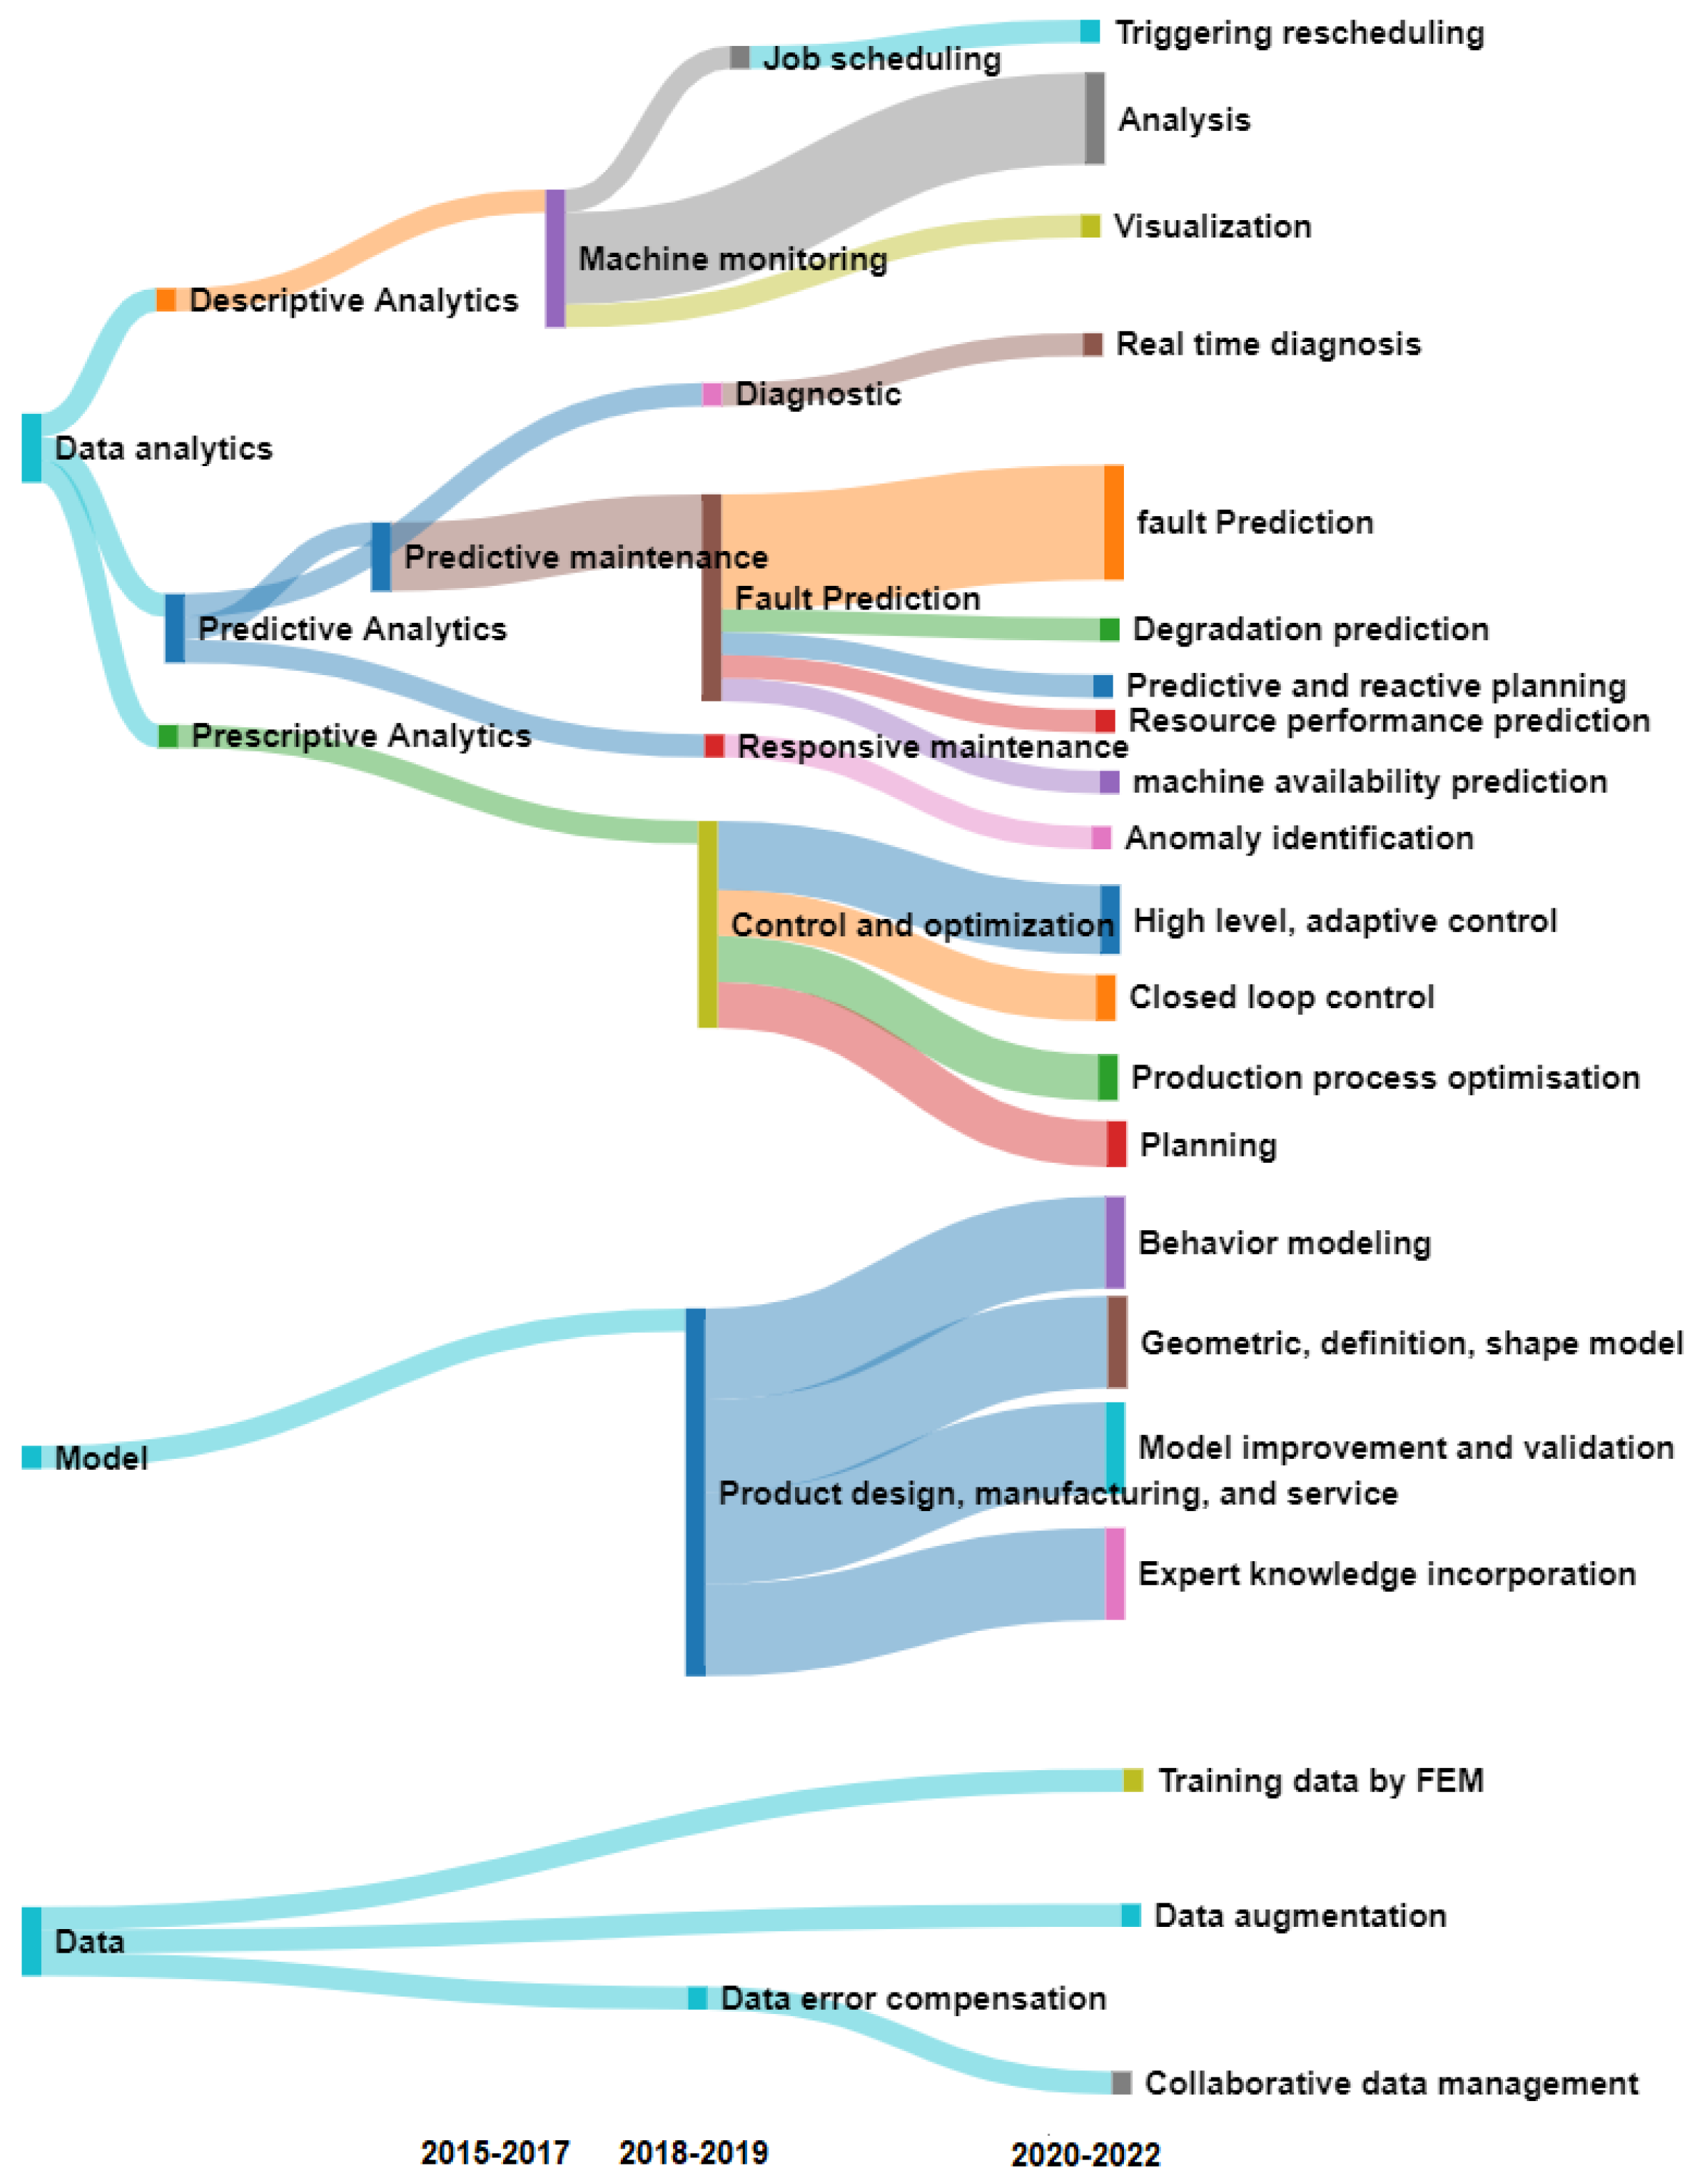
The tasks performed by ML algorithms in ML-based DT can be classified into three categories (shown in Figure 14)
  • Data analytics.
    -
    Predictive data analytics.
    -
    Descriptive data analytics.
    -
    Prescriptive data analytics.
  • Model-based task.
  • Data-based task.
Figure 14. Evolution of tasks performed by ML algorithm. A sanky diagram showing evolution of the task over three periods of time.
Applsci 12 06512 g014
Data analytics: As can be seen from the figure, for the period 2015–2017, predictive data analytics were limited to machine monitoring. However, both in 2018–2019 and 2020–2022, predictive maintenance emerged as fault prediction method, with a significant number of publications focusing on it.
In the period 2020–2022, predictive maintenance evolved into resource performance prediction and machine availability prediction.
In the case of descriptive data analytics, the period 2015–2017 showed basic tasks, such as machine monitoring [12,38]. In the period 2018–2019, only one publication was published with descriptive analytics, which was job scheduling [7]. Conversely, in the period 2020–2022, several descriptive analytics emerged, such as visualisation [39], rescheduling [24], and analysis [25].
No publication in the period 2015–2017 focused on prescriptive data analytics. However, in the period of 2018–2019, control and optimisation of the manufacturing system was the focus [29,34]. In the period 2020–2022, high-level adaptive control and closed-loop control with the help of ML was focused on [9,35,40,41,42].
Model-based task: In the period 2015–2017, only one publication focused on model-based tasks, such as design, manufacturing, and service (PLM) [4]. Several models have been proposed, including geometric and definition models [7] in the period 2018–2019. In the following period, 2020–2022, several models were implemented, such as the behaviour model [40]. Additionally, the focus was on model improvement and expert knowledge incorporation [27,43,44,45,46].
Data-based task: This was the least-focused-on area. Data error compensation [29] was performed using ML-based DT during the period 2018–2019. However, in the period 2020–2022, training data generation [26], data augmentation [36], and collaborative data management [47] were implemented using ML-based DT.
Data analytics has been the most-focused-on area from the past to the present. Versatile prediction tasks are performed to move from responsive maintenance to predictive maintenance. Conversely, a data-based task associated with an ML-based DT was the least-focused-on area. In the future, this area will emerge as a game changer because high-quality data are a prerequisite for good performance.

4.3. Third Research Question

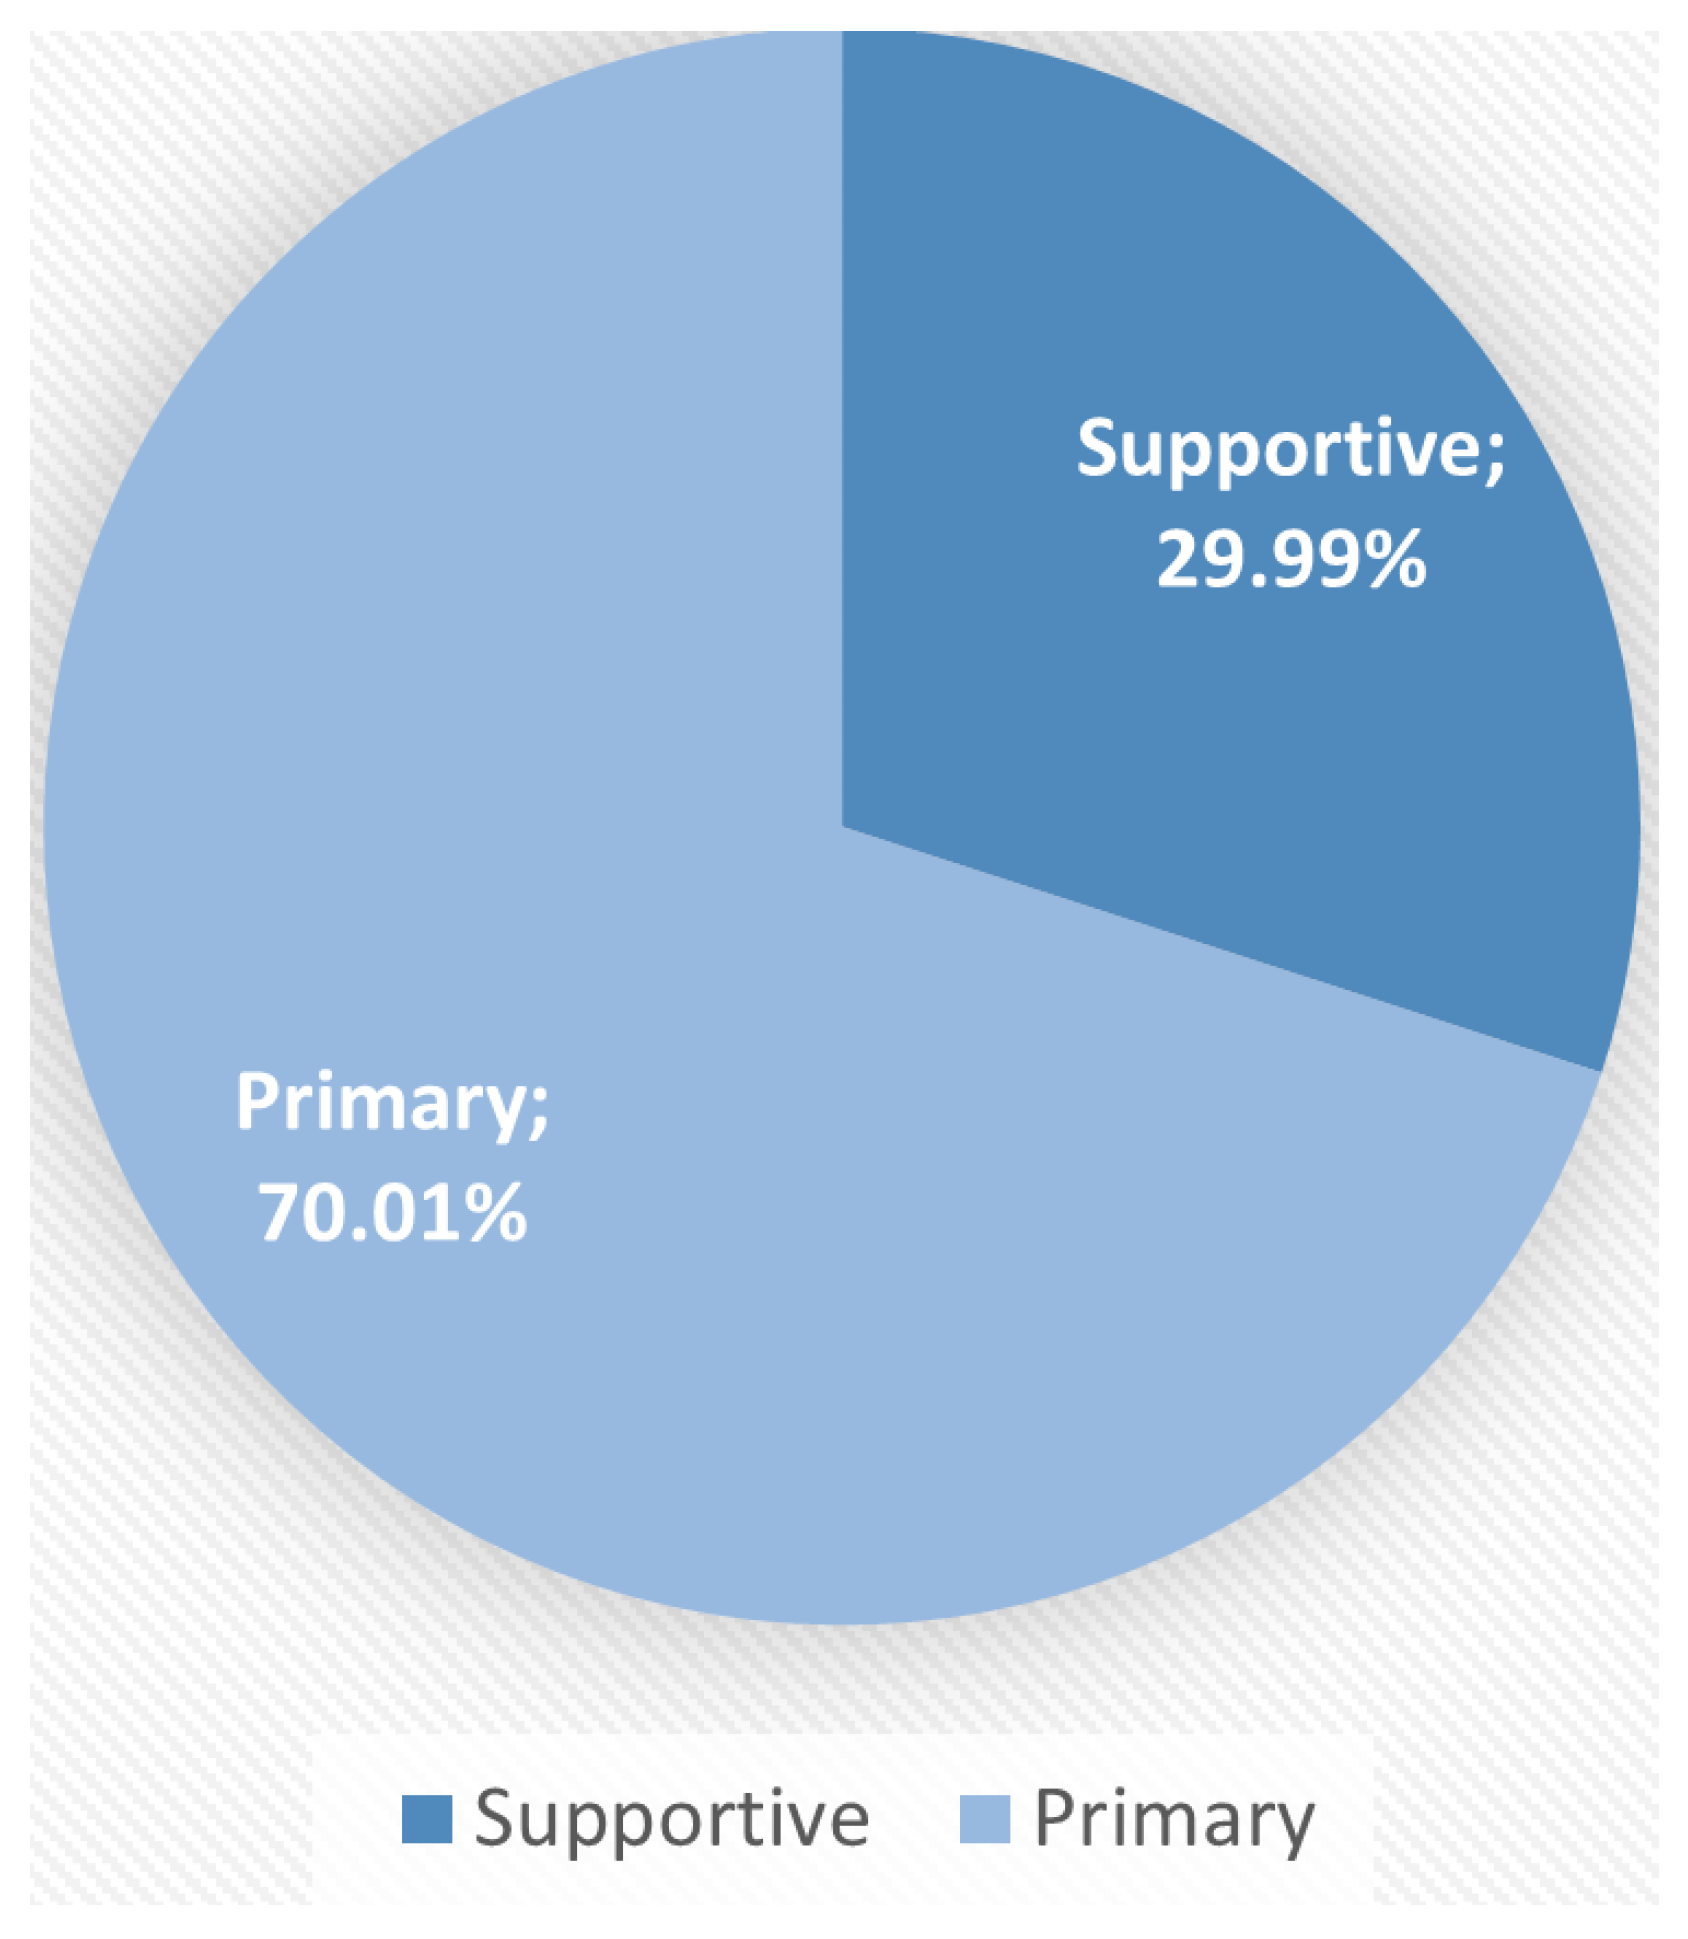
In the reviewed publications, nearly 70% of the ML models played a primary role (Figure 15) such as training of the DT model [24,26,34,39,48,49], fault prediction [3,27,30,31,39,41,50,51,52], process planning [53,54], and classification [26,50]. ML performed the task directly mapped to the DT task in a primary role.
Conversely, nearly 30% of the publications showed ML in a supportive role, such as data quality enhancement [12,29], DT as environment [12], approximation and planning [55,56], and data mining [57].
The eight dimensions of DT described by the CIRP encyclopaedia [16] are listed in Table 2. The ML tasks contributing to the DT dimensions are listed in the Table. The criteria column states the criteria that need to be fulfilled by ML to consider the ML task as a contribution to the DT dimension [16,58]. Major ML contributions map to CPS intelligence. This contribution ranged from central control, maintenance, and prediction to quality inference in 2020 and 2021. Apart from this digital model, richness, simulation capability, and connectivity mode are the DT dimensions contributed to by the ML.
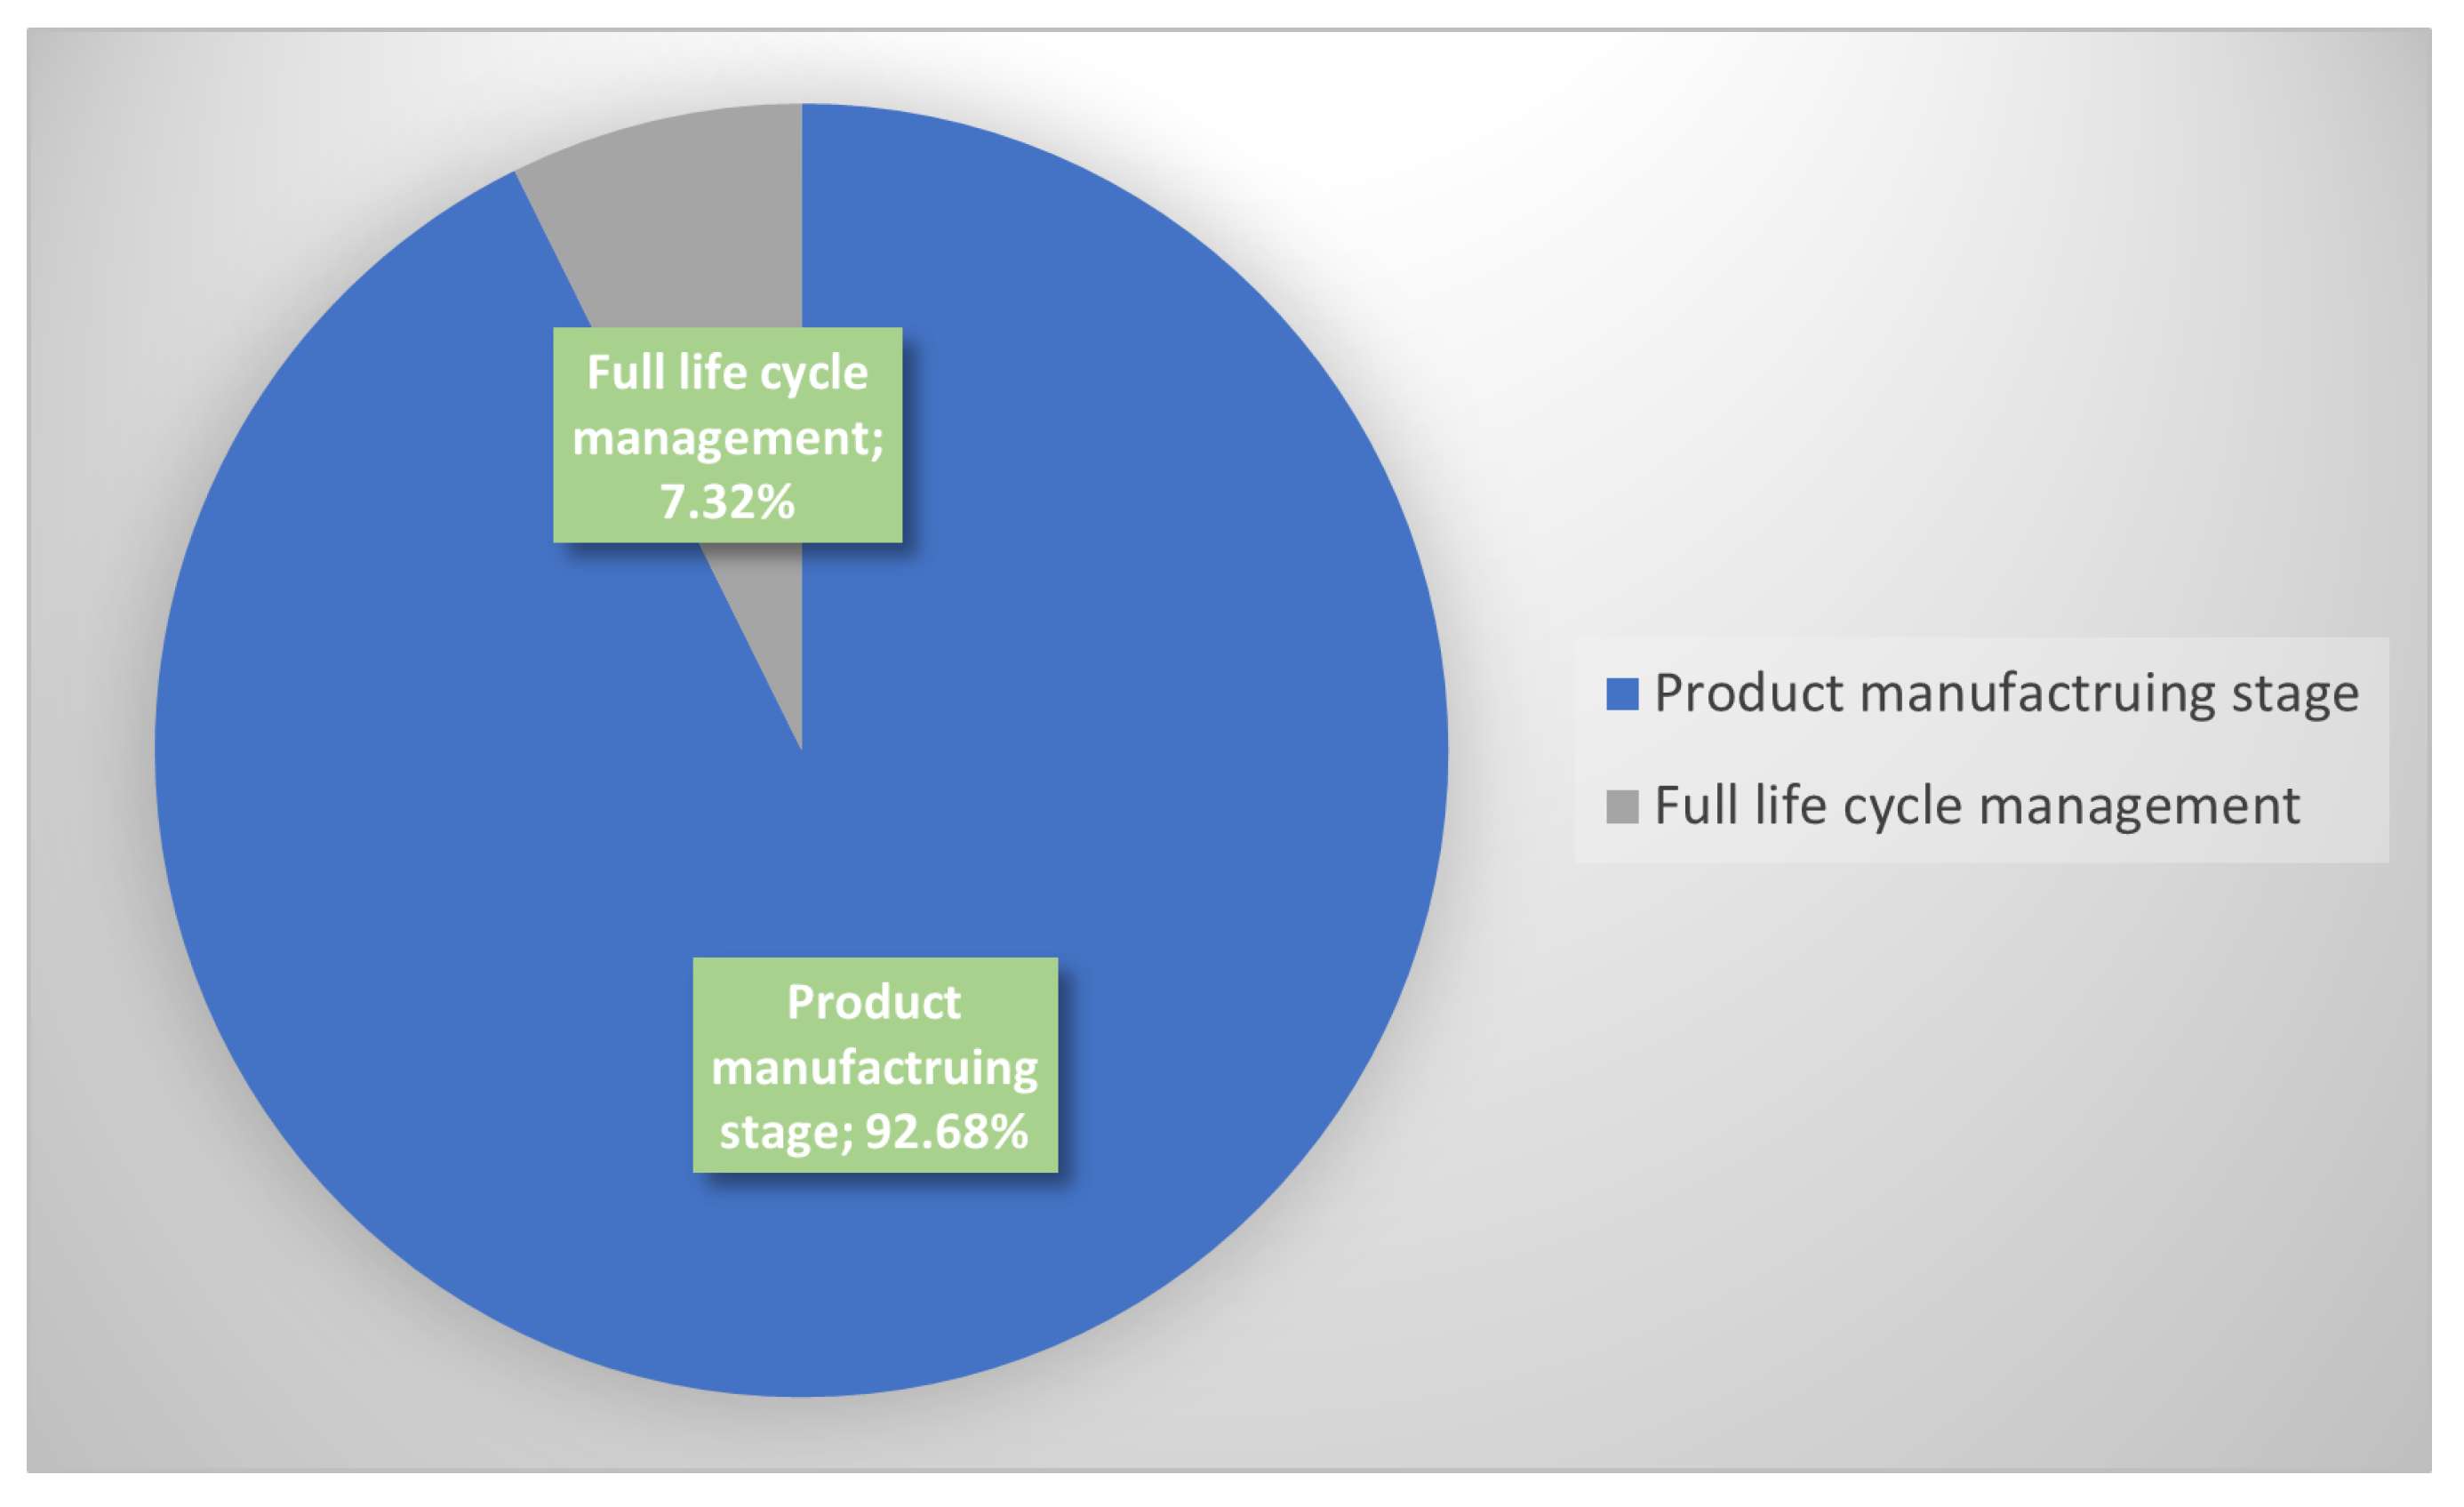
Figure 16 shows contribution of ML-based DT in manufacturing PLM. ML-based DT is marginally used in full product life-cycle management [37,63,65]. Conversely, in 92.68% of cases, ML-based DT is used for the product manufacturing stage.

4.4. Fourth Research Question

The future work stated in the corpus can be categorised into three classes (Figure 17), similar to research question 2:
  • Data analytics.
    -
    Predictive data analytics.
    -
    Prescriptive data analytics.
  • Model-based task.
  • Data-based task.
Figure 17. Evolution of future work over time. A sanky diagram showing evolution of future work over three periods of time.
Applsci 12 06512 g017
Data analytics
Predictive data analytics
It is shown in Figure 14 that fault prediction received major research attention in the periods 2018–2019 [66] and 2020–2022 [27]. In the period 2018–2019, accuracy improvement, predictive maintenance, and encapsulation of dynamicity [3,66] are stated as the future research directions (Figure 17). Following this research, path degradation prediction [40], resource availability prediction [41], and machine availability prediction [24] were implemented in the period 2020–2022 (Figure 14) In this period, resilience of manufacturing systems, accuracy improvement [54], fault prediction [41], and detailed encapsulation of dynamicity [67] were stated as the future research directions. By 2022, these directions will be dominant in the manufacturing industry.
Prescriptive data analytics
In 2020–2022, high-level adaptive control, closed-loop control, and production process optimisation [9,35,40,41,42] were stated as the future research directions (Figure 17). This wave of optimisation and control will continue from 2022 onwards.
Model-based task
In the period 2015–2017, design, manufacturing, and services [4] were stated as future research directions, which were narrowed down to the service management [12] of manufacturing systems. According to Figure 14, geometric, definition, and behaviour models were implemented following this theme in the period 2018-2019. Additionally, model improvement [43] and expert knowledge incorporation [64] were implemented, which are not stated as future research alternatives.
In the period 2018–2019, validation [66] was emphasised as one of the future research alternatives, which evolved to generalization [60], common benchmark and standard [40] in the period 2020–2022. This research alternative was embraced by the scientific community through case-study implementation, review work with generalized DT definitions, contributing technology, etc. [16].
Another key future research direction is improved safety [29] from the period 2018-2019, which was not embraced by the scientific community because there was no ML-based DT relating to this topic in the period 2020–2022.
In 2022 and onwards, encapsulation of scalable systems [68], detailed DT models [24], higher digital design level [21], explainability [35], cybersecurity [40], sustainability [16], benchmarks, and standards [62] will be dominant.
Data-based task
In the period 2015–2017, the future research path was set to incorporate semantic data models [38] and two-way connections [12] in DT. In the period 2018-2019, industrial applications with the help of industrial data was emphasised as a future research direction [34,66]. Marginal success has been achieved through the use of industrial case studies. Additionally, big data analytics [67] and information weighting [40] appeared as a dominant future research directions in the period 2020–2022. In 2022 and onwards, the incorporation of time-series [65] and categorical data [36], encapsulation of works in progress [68], data heterogeneity [43], real-time data [63], and data quality improvement will be dominant in ML-based DT.

5. Discussion and Conclusions

In the proposed review study, 71 documents were included, ranging from 2015 to March 2022. The screening of 1050 publications from Web of Science, IEEE, Scopus, and ScienceDirect resulted in 71 finally selected publications. The novelty of the proposed study lies in exhaustive research on ML-based DT from bibliometric and evolutionary perspectives.
RQ1: This research question attempts to accumulate quantitative and qualitative knowledge associated with ML-based DT. Based on the citation trend, it can be concluded that there is a reciprocal increase in interest in ML-based DT. Most publications belong to the subject category of computer science rather than manufacturing. Additionally, a marginal number of authors continued their contribution to ML-based DT over time. Clustering the author keywords resulted in four clusters: (a) computer-integrated manufacturing, (b) Industry 4.0, (c) smart manufacturing, and (d) data models. The analysis of keywords showed that the past trend was to create a common knowledge base of definition, characteristics, and applications of DT. The current trend indicates application-oriented performance improvement instead of complete DT architecture improvement. However, it is necessary to quantify the loss caused by considering only application-oriented improvement instead of complete architecture improvement.
The total time span was divided into three periods, (a) Period 1 (2015–2017), (b) Period 2 (2018–2019), and (c) Period 3 (2020–2022), in order to analyse the thematic evolution. Analysing these three periods indicates that the themes ML, IoT, and deep learning are emerging over the trajectory of time, while CPS and virtual reality are well developed themes. The relevance of ML to DT has increased over time. Similarly, big data, data models, and real-time systems have become more relevant to ML-based DT.
RQ2: The dominant ML algorithm in ML-based DT is the neural network. Neural networks have evolved over time using different activation functions, parameters, and learning techniques. All these changes were introduced to address application-specific requirements, such as increased performance, reduced data size, reduced uncertainty, and increased cognition. In the future, neural networks will evolve to incorporate explainability, causality, expert knowledge, resilience, and so on.
ML is predominantly used for data analytics, such as fault prediction in DT. The maturity of the other tasks was marginal. The data-oriented ML task received the lowest focus. In the future, ML can contribute to the improvement of DT data quality through procedure creation, issue monitoring, and requirement improvement. In the case of model-based tasks, ML can be used for DT model problem exploration, creation of DT model architecture, development of DT model test cases, and deployment of DT models in industrial scenarios.
In the future, ML can contribute to DT confidence via error-free simulation of the physical system, DT fidelity by instant updates in the model, DT quality assurance by advanced data analytics, and minimised DT carbon footprint via using a less resource-hungry platform.
RQ3: DT’s eight dimensions from the CIRP encyclopaedia were considered to assess the contribution of ML to DT dimensions. The CPS intelligence characteristics of the DT were mainly enhanced by ML. Digital model richness, such as DT fidelity, can be improved by ML through a lifelong-learning ML model. The update frequency of DT can be real-time, daily, monthly, or yearly. However, the ML model can trigger this update process in real-time. In the case of human interaction with DT, ML has potential in virtual and augmented reality, or a hybrid of the two, bridging the gap between machines and humans. The role of ML in developing DT shows that it plays a vital role in DT functionality. This trend is expected to continue in the future. Conversely, ML-based DT participates in the manufacturing stage of PLM in most cases. ML-based DT has the potential to identify design schematics and concepts of new products, optimisation, consistency, and design validation. In the service stage of the PLM, ML-based DT can manage real-time data, trigger diagnostic procedures, perform data analytics for fault prognosis, and optimise features.
RQ4: Issues identified by the scientific community can be categorised into three classes: data analytics, model-based tasks, and data-based tasks. A comparison of future work with current work shows that the scientific community is focused on data analytics, while future work emphasises model-based tasks such as validation and DT-driven PLM.
Data-driven future directions are also being emphasised by the scientific community. DT-based ML has good potential for managing data heterogeneity, encapsulating dynamic environments, and working in progress. This trend in industrial applications will continue in the future. In addition, the success of deploying DT in real industrial cases requires quantification.
DT is a replica of a physical system. Information about the physical system resides in the DT, which requires extra safety from leakage. Therefore, the cybersecurity and security of communication protocols must be the focus. Additionally, causality, explainability, and semantic ontology will be future trends.
The main concluding points are listed below:
  • Based on the bibliometric analysis, it can be concluded that there has been a reciprocal increase in interest in ML-based DT. However, the improvements introduced in ML-based DT are focused primarily on the ML part rather than complete DT architecture or manufacturing processes. A collaborative work between authors with ML and manufacturing backgrounds can create a consolidated ML-based DT for use in manufacturing.
  • It can also be concluded that ML tasks are becoming more advanced over time in ML-based DT. The sole application of ML in manufacturing is no longer considered as a significant contribution to the state of the art. However, the advancement in ML tasks needs quantification and comparison with other domains such as healthcare.
  • Additionally, it can be concluded that ML acts as the main player in cyberphysical system intelligence enhanced by ML-based DT. ML has potential in enhancing each dimension of DT. In the future, industrial application and encapsulation of dynamic processes will be focused on primarily.

Author Contributions

S.S.S. collected the publications, analysed them and wrote the proposed review work. M.U.A. and S.B. helped in creating research questions, styling, and structuring the proposed review work through review and discussion. All authors have read and agreed to the published version of the manuscript.

Funding

The study was conducted through the project DIGICOGS which is financed by Vinnova (Vinnovas Diarienr: 2019-05322) under the innovation program Process Industrial IT and Automation (PiiA).

Institutional Review Board Statement

Not applicable.

Informed Consent Statement

Not applicable.

Data Availability Statement

The data that support the findings of this study areavailable in: https://doi.org/10.5281/zenodo.6542836. These data were derived from the following resources available in the public domain: Mälardalen University library, accessed on 15 March 2022.

Conflicts of Interest

The authors declare no conflict of interest.

Definitions

The ML based DT is explored in the proposed study to create a consolidated knowledge and future path.

References

  1. Mazhar Rathore, M.; Shah, S.A.; Shukla, D.; Bentafat, E.; Bakiras, S. The Role of AI, Machine Learning, and Big Data in Digital Twinning: A Systematic Literature Review, Challenges, and Opportunities. IEEE Access 2021, 9, 32030–32052. [Google Scholar] [CrossRef]
  2. Tao, F.; Zhang, M.; Nee, A.Y.C. Digital Twin Driven Smart Manufacturing; Academic Press: London, UK, 2019. [Google Scholar]
  3. Luo, W.; Hu, T.; Zhu, W.; Tao, F. Digital twin modeling method for CNC machine tool. In Proceedings of the IEEE 15th International Conference on Networking, Sensing and Control (ICNSC), Zhuhai, China, 27–29 March 2018; pp. 1–4. [Google Scholar]
  4. Tao, F.; Cheng, J.; Qi, Q.; Zhang, M.; Zhang, H.; Sui, F. Digital twin-driven product design, manufacturing and service with big data. Int. J. Adv. Manuf. Technol. 2017, 94, 3563–3576. [Google Scholar] [CrossRef]
  5. Wang, T.; Li, J.; Kong, Z.; Liu, X.; Snoussi, H.; Lv, H. Digital twin improved via visual question answering for vision-language interactive mode in human-machine collaboration. J. Manuf. Syst. 2021, 58, 261–269. [Google Scholar] [CrossRef]
  6. Wan, J.; Tang, S.; Li, D.; Wang, S.; Liu, C.; Abbas, H.; Vasilakos, A.V. A Manufacturing Big Data Solution for Active Preventive Maintenance. IEEE Trans. Ind. Inform. 2017, 13, 2039–2047. [Google Scholar] [CrossRef]
  7. Zhang, H.; Zhang, G.; Yan, Q. Digital twin-driven cyber-physical production system towards smart shop-floor. J. Ambient. Intell. Humaniz. Comput. 2018, 10, 4439–4453. [Google Scholar] [CrossRef]
  8. Cunbo, Z.; Liu, J.; Xiong, H. Digital twin-based smart production management and control framework for the complex product assembly shop-floor. Int. J. Adv. Manuf. Technol. 2018, 96, 1149–1163. [Google Scholar]
  9. Piros, A.; Trautmann, L.; Baka, E. Error handling method for digital twin-based plasma radiation detection. Fusion Eng. Des. 2020, 156, 111592. [Google Scholar] [CrossRef]
  10. Boschert, S.; Rosen, R. Digital twin—The simulation aspect. In Mechatronic Futures; Springer International Publishing: Cham, Switzerland, 2016; pp. 59–74. [Google Scholar]
  11. Grieves, M.; Vickers, J. Digital twin: Mitigating unpredictable, undesirable emergent behavior in complex systems. In Transdisciplinary Perspectives on Complex Systems; Springer International Publishing: Cham, Switzerland, 2016; pp. 85–113. [Google Scholar]
  12. Tao, F.; Zhang, M. Digital Twin Shop-Floor: A New Shop-Floor Paradigm Towards Smart Manufacturing. IEEE Access 2017, 5, 20418–20427. [Google Scholar] [CrossRef]
  13. Lu, Y.; Liu, C.; Wang, K.I.K.; Huang, H.; Xu, X. Digital Twin-driven smart manufacturing: Connotation, reference model, applications and research issues. Robot. Comput. Integr. Manuf. 2020, 61, 101837. [Google Scholar] [CrossRef]
  14. Glaessgen, E.; Stargel, D. The digital twin paradigm for future NASA and US Air Force vehicles. In Proceedings of the 53rd AIAA/ASME/ASCE/AHS/ASC Structures, Structural Dynamics and Materials Conference 20th AIAA/ASME/AHS Adaptive Structures Conference 14th AIAA, Honolulu, HI, USA, 23–26 April 2012; p. 1818. [Google Scholar]
  15. Reifsnider, K.; Majumdar, P. Multiphysics stimulated simulation digital twin methods for fleet management. In Proceedings of the 54th AIAA/ASME/ASCE/AHS/ASC Structures, Structural Dynamics, and Materials Conference, Boston, MA, USA, 8–11 April 2013; p. 1578. [Google Scholar]
  16. Jones, D.; Snider, C.; Nassehi, A.; Yon, J.; Hicks, B. Characterising the Digital Twin: A systematic literature review. CIRP J. Manuf. Sci. Technol. 2020, 29, 36–52. [Google Scholar] [CrossRef]
  17. Kritzinger, W.; Karner, M.; Traar, G.; Henjes, J.; Sihn, W. Digital Twin in manufacturing: A categorical literature review and classification. In Proceedings of the IFAC PapersOnLine, Shenyang, China, 25–27 July 2018; Volume 51, pp. 1016–1022. [Google Scholar]
  18. Cimino, C.; Negri, E.; Fumagalli, L. Review of digital twin applications in manufacturing. Comput. Ind. 2019, 113, 103130. [Google Scholar] [CrossRef]
  19. Barricelli, B.R.; Casiraghi, E.; Fogli, D. A Survey on Digital Twin: Definitions, Characteristics, Applications, and Design Implications. IEEE Access 2019, 7, 167653–167671. [Google Scholar] [CrossRef]
  20. He, B.; Bai, K.J. Digital twin-based sustainable intelligent manufacturing: A review. Adv. Manuf. 2020, 9, 1–21. [Google Scholar] [CrossRef]
  21. Liu, M.; Fang, S.; Dong, H.; Xu, C. Review of digital twin about concepts, technologies, and industrial applications. J. Manuf. Syst. 2021, 58, 346–361. [Google Scholar] [CrossRef]
  22. Keele, S. Guidelines for Performing Systematic Literature Reviews in Software Engineering; Report; Citeseer: Princeton, NJ, USA, 2007. [Google Scholar]
  23. Busalim, A.H. Understanding social commerce: A systematic literature review and directions for further research. Int. J. Inf. Manag. 2016, 36, 1075–1088. [Google Scholar] [CrossRef]
  24. Zhang, M.; Tao, F.; Nee, A. Digital Twin Enhanced Dynamic Job-Shop Scheduling. J. Manuf. Syst. 2021, 58, 146–156. [Google Scholar] [CrossRef]
  25. Wang, T.; Li, J.; Deng, Y.; Wang, C.; Snoussi, H.; Tao, F. Digital twin for human-machine interaction with convolutional neural network. Int. J. Comput. Integr. Manuf. 2021, 34, 888–897. [Google Scholar] [CrossRef]
  26. Zhang, S.; Kang, C.; Liu, Z.; Wu, J.; Ma, C. A Product Quality Monitor Model With the Digital Twin Model and the Stacked Auto Encoder. IEEE Access 2020, 8, 113826–113836. [Google Scholar] [CrossRef]
  27. Gaikwad, A.; Yavari, R.; Montazeri, M.; Cole, K.; Bian, L.; Rao, P. Toward the digital twin of additive manufacturing: Integrating thermal simulations, sensing, and analytics to detect process faults. IISE Trans. 2020, 52, 1204–1217. [Google Scholar] [CrossRef]
  28. Lugaresi, G.; Matta, A. Automated manufacturing system discovery and digital twin generation. J. Manuf. Syst. 2021, 59, 51–66. [Google Scholar] [CrossRef]
  29. Cronrath, C.; Aderiani, A.R.; Lennartson, B. Enhancing Digital Twins through Reinforcement Learning. In Proceedings of the 2019 IEEE 15th International Conference on Automation Science and Engineering (CASE), Vancouver, BC, Canada, 22–26 August 2019; pp. 293–298. [Google Scholar]
  30. Xu, Y.; Sun, Y.; Liu, X.; Zheng, Y. A Digital-Twin-Assisted Fault Diagnosis Using Deep Transfer Learning. IEEE Access 2019, 7, 19990–19999. [Google Scholar] [CrossRef]
  31. Lacueva-Perez, F.J.; Hermawati, S.; Amoraga, P.; Salillas-Martinez, R.; Del Hoyo Alonso, R.; Lawson, G. SHION: Towards An Interactive Digital Twin Supporting Shopfloor Operations on Real Time. IEEE Internet Comput. 2020. [Google Scholar] [CrossRef]
  32. Callon, M.; Courtial, J.P.; Laville, F. Co-word analysis as a tool for describing the network of interactions between basic and technological research: The case of polymer chemsitry. Scientometrics 1991, 22, 155–205. [Google Scholar] [CrossRef]
  33. Cobo, M.J.; López-Herrera, A.G.; Herrera-Viedma, E.; Herrera, F. An approach for detecting, quantifying, and visualizing the evolution of a research field: A practical application to the Fuzzy Sets Theory field. J. Inf. 2011, 5, 146–166. [Google Scholar] [CrossRef]
  34. Min, Q.; Lu, Y.; Liu, Z.; Su, C.; Wang, B. Machine Learning based Digital Twin Framework for Production Optimization in Petrochemical Industry. Int. J. Inf. Manag. 2019, 49, 502–519. [Google Scholar] [CrossRef]
  35. Ali, M.A.; Guan, Q.; Umer, R.; Cantwell, W.J.; Zhang, T. Deep learning based semantic segmentation of mu CT images for creating digital material twins of fibrous reinforcements. Compos. Part A-Appl. Sci. Manuf. 2020, 139, 106131. [Google Scholar] [CrossRef]
  36. Zotov, E.; Tiwari, A.; Kadirkamanathan, V. Conditional StyleGAN modelling and analysis for a machining digital twin. Integr. Comput. Aided Eng. 2021, 28, 399–415. [Google Scholar] [CrossRef]
  37. Li, H.; Yang, D.; Cao, H.; Ge, W.; Chen, E.; Wen, X.; Li, C. Data-driven hybrid petri-net based energy consumption behaviour modelling for digital twin of energy-efficient manufacturing system. Energy 2022, 239, 122178. [Google Scholar] [CrossRef]
  38. Ringsquandl, M.; Lamparter, S.; Lepratti, R.; Kroeger, P. Knowledge fusion of manufacturing operations data using representation learning. In Advances in Production Management Systems: The Path to Intelligent, Collaborative and Sustainable Manufacturing; Lodding, H., Riedel, R., Thoben, K., VonCieminski, G., Kiritsis, D., Eds.; Springer International Publishing: Cham, Switzerland, 2017; Volume 514, pp. 302–310. [Google Scholar]
  39. Stieber, S.; Hoffmann, A.; Schiendorfer, A.; Reif, W.; Beyrle, M.; Faber, J.; Richter, M.; Sause, M. Towards real-time process monitoring and machine learning for manufacturing composite structures. In Proceedings of the 2020 25th IEEE International Conference on Emerging Technologies and Factory Automation (ETFA), New York, NY, USA, 8–11 September 2020; pp. 1451–1454. [Google Scholar]
  40. Borangiu, T.; Trentesaux, D.; Leitão, P.; Cardin, O.; Lamouri, S. Service Oriented, Holonic and Multi-Agent Manufacturing Systems for Industry of the Future: Proceedings of SOHOMA 2020, Paris, France, 1–2 October 2020; Springer: Berlin/Heidelberg, Germany, 2021; Volume 952. [Google Scholar]
  41. Borangiu, T.; Răileanu, S.; Silişteanu, A.; Anton, S.; Anton, F. Smart manufacturing control with cloud-embedded digital twins. In Proceedings of the 24th International Conference on System Theory, Control and Computing (ICSTCC), Sinaia, Romania, 8–10 October 2020; pp. 915–920. [Google Scholar]
  42. Park, K.T.; Son, Y.H.; Ko, S.W.; Noh, S.D. Digital Twin and Reinforcement Learning-Based Resilient Production Control for Micro Smart Factory. Appl. Sci. 2021, 11, 2977. [Google Scholar] [CrossRef]
  43. Selvaraj, H.; Chmaj, G.; Zydek, D. Lecture Notes in Networks and Systems. In Proceedings of the 27th International Conference on Systems Engineering, ICSEng 2020, Las Vegas, NV, USA, 25–27 August 2020; Springer: Berlin/Heidelberg, Germany, 2021; Volume 182. [Google Scholar]
  44. Vrabic, R.; Erkoyuncu, J.A.; Farsi, M.; Ariansyah, D. An intelligent agent-based architecture for resilient digital twins in manufacturing. CIRP Ann. Manuf. Technol. 2021, 70, 349–352. [Google Scholar] [CrossRef]
  45. Liu, J.; Gui, H.; Ma, C. Digital twin system of thermal error control for a large-size gear profile grinder enabled by gated recurrent unit. J. Ambient. Intell. Humaniz. Comput. 2021. [Google Scholar] [CrossRef]
  46. Sommer, M.; Stjepandic, J.; Stobrawa, S. Automated generation of a digital twin of a manufacturing system by using scan and convolutional neural networks. In Proceedings of the 27th ISTE International Conference on Transdisciplinary Engineering, Warsaw, Poland, 1–10 July 2020; Volume 12, p. 363. [Google Scholar]
  47. Liu, C.; Le Roux, L.; Körner, C.; Tabaste, O.; Lacan, F.; Bigot, S. Digital Twin-enabled Collaborative Data Management for Metal Additive Manufacturing Systems. J. Manuf. Syst. 2022, 62, 857–874. [Google Scholar] [CrossRef]
  48. Lin, T.Y.; Jia, Z.; Yang, C.; Xiao, Y.; Lan, S.; Shi, G.; Zeng, B.; Li, H. Evolutionary digital twin: A new approach for intelligent industrial product development. Adv. Eng. Inform. 2021, 47, 101209. [Google Scholar] [CrossRef]
  49. Qiao, Q.; Wang, J.; Ye, L.; Gao, R.X. Digital Twin for Machining Tool Condition Prediction. In Proceedings of the 52nd CIRP Conference on Manufacturing Systems (CMS), Ljubljana, Slovenia, 12–14 June 2019; pp. 1388–1393. [Google Scholar] [CrossRef]
  50. Scheffel, R.M.; Frohlich, A.A.; Silvestri, M. Automated fault detection for additive manufacturing using vibration sensors. Int. J. Comput. Integr. Manuf. 2021, 34, 500–514. [Google Scholar] [CrossRef]
  51. Luo, W.; Hu, T.; Ye, Y.; Zhang, C.; Wei, Y. A hybrid predictive maintenance approach for CNC machine tool driven by Digital Twin. Robot.-Comput.-Integr. Manuf. 2020, 65, 101974. [Google Scholar] [CrossRef]
  52. Eirinakis, P.; Kalaboukas, K.; Lounis, S.; Mourtos, I.; Rožanec, J.M.; Stojanovic, N.; Zois, G. Enhancing Cognition for Digital Twins. In Proceedings of the IEEE International Conference on Engineering, Technology and Innovation (ICE/ITMC), Cardiff, UK, 15–17 June 2020; pp. 1–7. [Google Scholar]
  53. Xia, K.; Sacco, C.; Kirkpatrick, M.; Saidy, C.; Nguyen, L.; Kircaliali, A.; Harik, R. A digital twin to train deep reinforcement learning agent for smart manufacturing plants: Environment, interfaces and intelligence. J. Manuf. Syst. 2021, 58, 210–230. [Google Scholar] [CrossRef]
  54. Zhang, C.; Zhou, G.; Hu, J.; Li, J. Deep learning-enabled intelligent process planning for digital twin manufacturing cell. Knowl.-Based Syst. 2020, 191, 105247. [Google Scholar] [CrossRef]
  55. Zhou, G.; Zhang, C.; Li, Z.; Ding, K.; Wang, C. Knowledge-driven digital twin manufacturing cell towards intelligent manufacturing. Int. J. Prod. Res. 2020, 58, 1034–1051. [Google Scholar] [CrossRef]
  56. Jaensch, F.; Csiszar, A.; Scheifele, C.; Verl, A. Digital Twins of Manufacturing Systems as a Base for Machine Learning. In Proceedings of the 25th International Conference on Mechatronics and Machine Vision in Practice (M2VIP), Stuttgart, Germany, 20–22 November 2018; pp. 7–12. [Google Scholar]
  57. Lee, J.; Azamfar, M.; Singh, J.; Siahpour, S. Integration of digital twin and deep learning in cyber-physical systems: Towards smart manufacturing. IET Collab. Intell. Manuf. 2020, 2, 34–36. [Google Scholar] [CrossRef]
  58. Stark, R.; Fresemann, C.; Lindow, K. Development and operation of Digital Twins for technical systems and services. CIRP Ann. 2019, 68, 129–132. [Google Scholar] [CrossRef]
  59. Chhetri, S.R.; Faezi, S.; Canedo, A.; Al Faruque, M.A. QUILT: Quality inference from living digital twins in IoT-enabled manufacturing systems. In Proceedings of the International Conference on Internet of Things Design and Implementation (IoTDI), Montreal, QC, Canada, 15–18 April 2019. [Google Scholar] [CrossRef]
  60. Latif, H.; Shao, G.; Starly, B. A Case Study of Digital Twin for a Manufacturing Process Involving Human Interactions. In Proceedings of the 2020 Winter Simulation Conference (WSC), Orlando, FL, USA, 14–18 December 2020; pp. 2659–2670. [Google Scholar]
  61. Ladj, A.; Wang, Z.; Meski, O.; Belkadi, F.; Ritou, M.; Da Cunha, C. A knowledge-based Digital Shadow for machining industry in a Digital Twin perspective. J. Manuf. Syst. 2021, 58, 168–179. [Google Scholar] [CrossRef]
  62. Mueller-Zhang, Z.; Antonino, P.O.; Kuhn, T. Integrated Planning and Scheduling for Customized Production using Digital Twins and Reinforcement Learning. IFAC Pap. 2021, 54, 408–413. [Google Scholar] [CrossRef]
  63. Ren, Z.; Wan, J. Strengthening Digital Twin Applications based on Machine Learning for Complex Equipment. In Proceedings of the Design, Automation & Test in Europe Conference & Exhibition (DATE), Grenoble, France, 1–5 February 2021; pp. 609–614. [Google Scholar]
  64. Friederich, J.; Francis, D.P.; Lazarova-Molnar, S.; Mohamed, N. A framework for data-driven digitial twins of smart manufacturing systems. Comput. Ind. 2022, 136, 103586. [Google Scholar] [CrossRef]
  65. Ren, Z.; Wan, J.; Deng, P. Machine-Learning-Driven Digital Twin for Lifecycle Management of Complex Equipment. IEEE Trans. Emerg. Top. Comput. 2022, 10, 9–22. [Google Scholar] [CrossRef]
  66. Schönfuß, B.; McFarlane, D.; Athanassopoulou, N.; Salter, L.; Silva, L.d.; Ratchev, S. Prioritising low cost digital solutions required by manufacturing SMEs: A shoestring approach. In Proceedings of the International Workshop on Service Orientation in Holonic and Multi-Agent Manufacturing, Paris, France, 1–2 October 2019; pp. 290–300. [Google Scholar]
  67. Farsi, M.; Daneshkhah, A.; Hosseinian-Far, A.; Jahankhani, H. Digital Twin Technologies and Smart Cities; Springer: Berlin/Heidelberg, Germany, 2020. [Google Scholar]
  68. Abideen, A.Z.; Sundram, V.P.K.; Pyeman, J.; Othman, A.K.; Sorooshian, S. Digital Twin Integrated Reinforced Learning in Supply Chain and Logistics. Logistics 2021, 5, 84. [Google Scholar] [CrossRef]
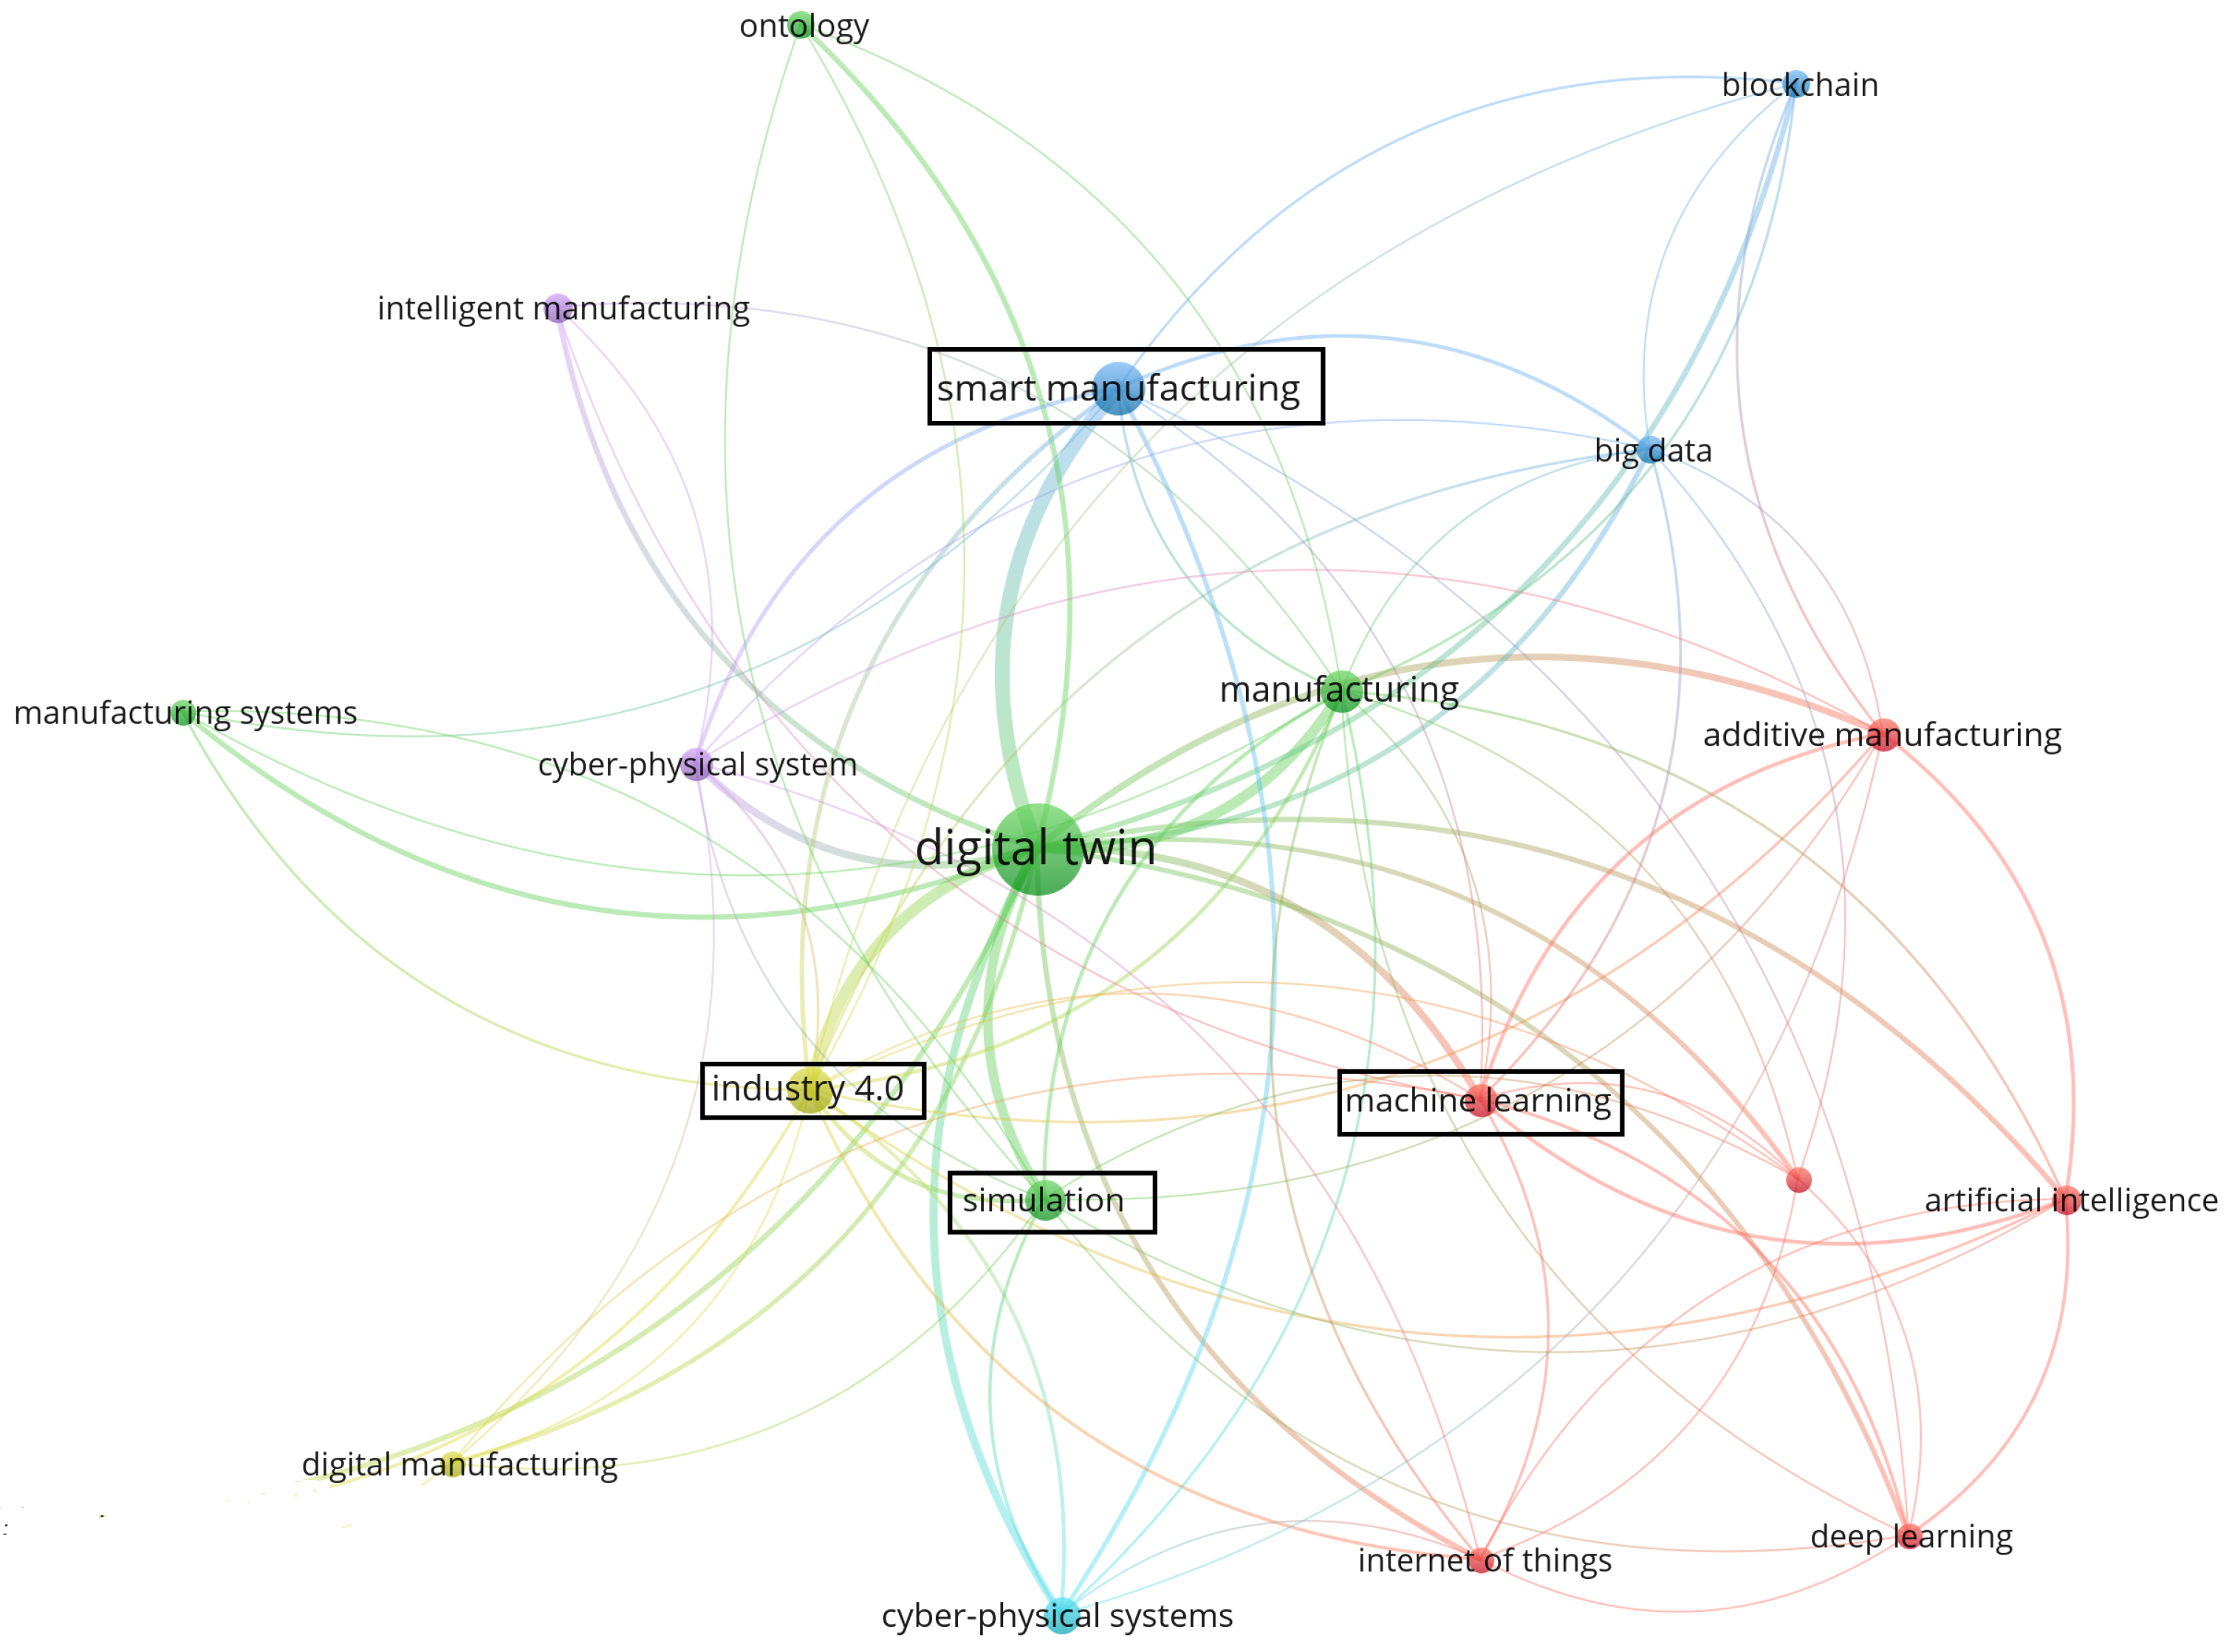
Figure 1. DT in manufacturing. Network graph of keywords. Each keyword is represented with a circle and connections between keywords with connecting lines.
Applsci 12 06512 g001
Figure 3. The process to identify the primary studies. Screening method shown with help of numbers, icons and connecting arrows.
Applsci 12 06512 g003
Figure 4. Citation trend from 2015 to 2022. Citation trend and paper production rate change over years shown with two lines.
Applsci 12 06512 g004
Figure 5. Percentage of publications by subject category. Bar chart with each bar representing a subject category. Size of the bar implies percentage of publications included in the category.
Applsci 12 06512 g005
Figure 6. Top authors with citation. A chart with circle size representing number of articles and circle colour representing citation rate for top authors.
Applsci 12 06512 g006
Figure 7. Top journal and conference productivity and impact factor. Top journal and conference productivity shown with bar chart and impact factor shown with line.
Applsci 12 06512 g007
Figure 8. Topic dendrogram with four clusters. A dendrogram with four clusters of author keywords. Distance between keywords is directly proportional to co-occurrence rate.
Applsci 12 06512 g008
Figure 10. Thematic evolution period 2, 2018–2019. A figure with four quadrants representing specific relevance and development degree. Several motor themes and emerging themes in period 2, 2018–2019.
Applsci 12 06512 g010
Figure 11. Thematic evolution period 3, 2020–2022. A figure with four quadrants representing specific relevance and development degree. Several basic themes in period 3, 2020–2022.
Applsci 12 06512 g011
Figure 12. Summary of ML Algorithm over time.
Applsci 12 06512 g012
Figure 13. Neural network evolution. Figure with arrows indicating change in ANN over time.
Applsci 12 06512 g013
Figure 15. ML’s role in DT.
Applsci 12 06512 g015
Figure 16. Contribution of ML-based DT in manufacturing product lifecycle management (PLM).
Applsci 12 06512 g016
Table 1. Summary of corpus.
Timespan2015–2022
Documents71
Sources47
Annual Growth Rate %20.09
Document Average Age2.11
Average citations per documents104.5
Average citations per year per document27.56
Keywords Plus (ID)61
Author’s Keywords (DE)249
Authors246
Authors of single-authored documents3
Authors of multi-authored documents68
Docs with international collab %12.68
Table 2. ML contributing to DT dimensions.
DT 8 DimensionsDimension CriteriaML Contributing to DT Dimensions
Integration breadthInteraction of physical world with virtual world in the form of data acquisition and schedulingData acquisition: acquire process knowledge. Scheduling: schedule manufacturing tasks, identify optimal actions [53]
Connectivity modeContext-aware, bidirectional or unidirectional connection in between physical and virtual wordContext-aware connection: fault diagnosis, deep transfer learning (DFDD), real-time monitoring, and predictive maintenance. [30] Real-time controlling instruction [34], optimal process plan. Bidirectional connection: real-time synchronisation [54]
Update frequencyEvent-driven, hourly, daily or monthly update of digital modelEvent-driven update: real-time controlling instruction [34]
CPS intelligenceCyberphysical System enhanced by AI, cognition, and automationAI: rule mining, data fusion [12], fault prediction [3], predicting energy efficiency [37], predictive maintenance, feature extraction [30], compensating data errors in DT [29], failure prediction [31], prediction [39], resource performance prediction [41], cutting tool wear prediction [51], prediction [39]; Cognition and automation: product quality inference, accuracy evaluation [59], layer defect analysis [47], optimal process plan [54], improved decision [60], process-parallel monitoring [46], providing cognitive abilities [52], production quality classification [26], real-time monitoring [30], visualization [39], production control and resource maintenance [41], classification [27], behavior analysis [25], adaptively control manipulated variables [53], data analytics [61], tool wear analysis [24], optimized process plans and workflows [62], and visualization [39].
Simulation capabilitiesSimulation of physical process on ad hoc or continuous basisprocess simulation [63], automated simulation model generation, [64]
Digital model richnessRobustness, resilience, self-adaption, fidelity of virtual modelRobustness, resilience, self-adaption, fidelity [44], DT fidelity [53], fidelity [61], DT behaviour model [37], high-fidelity of DTs [64]
Human interactionBridging human and machineHuman–machine collaboration [5], bridges a human user and robot [25]
Product life-cycleProduct design, manufacturing and serviceService stage: service, data analytics [38], Full product life-cycle management [37,63,65], Manufacturing stage: fault prediction [3], predicting energy efficiency [37], predictive maintenance, feature extraction [30]
Publisher’s Note: MDPI stays neutral with regard to jurisdictional claims in published maps and institutional affiliations.