Featured Application
The findings of this work can be applied in the diagnosis of other joint diseases associated with arthritis such as osteoarthritis and Lupus.
Abstract
This work focuses on the evaluation of third-order simplified spherical harmonics (SP3) model-based image reconstruction with respect to its clinical utility to diagnose rheumatoid arthritis (RA). The existing clinical data of 219 fingers was reconstructed for both absorption and scattering maps in fingers by using the reduced-Hessian sequential quadratic programming (rSQP) algorithm that employs the SP3 model of light propagation. The -fold cross validation method was used for feature extraction and classification of SP3-based tomographic images. The performance of the SP3 model was compared to the DE and ERT models with respect to diagnostic accuracy and computational efficiency. The results presented here show that the SP3 model achieves clinically relevant sensitivity (88%) and specificity (93%) that compare favorably to the ERT while maintaining significant computational advantage over the ERT (i.e., the SP3 model is 100 times faster than the ERT). Furthermore, it is also shown that the SP3 is similar in speed but superior in diagnostic accuracy to the DE. Therefore, it is expected that the method presented here can greatly aid in the early diagnosis of RA with clinically relevant accuracy in near real-time at a clinical setting.
1. Introduction
Rheumatoid arthritis (RA) is a chronic, progressive, systemic, inflammatory autoimmune disorder that causes chronic inflammation of the synovial membrane of small and large joints [1,2]. Thus, people with RA can suffer from severe pain, joint stiffness, swelling of multiple joints, and lack of joint mobility. When untreated, these symptoms can lead to self-limiting arthritis or rapidly progressing multi-system inflammation with significant morbidity and mortality (including cardiac, neurological, and hematological complications). Studies show that up to 14 million people around the world [3] and approximately 1.5 million people in the US [4] are affected by RA and up to 10% of individuals suffering from RA can experience total disability [5]. In the US alone, RA leads to 9 million physician visits per year [6]. Despite recent advances in therapeutic intervention including biological therapies [7,8], there is currently no cure for RA [9]. The early treatment of RA, however, has been shown to significantly improve clinical outcomes and management of the disease. It is, therefore, important to diagnose a subject with RA as early as possible.
Early diagnosis of RA has been attempted using various imaging modalities such as X-ray, ultrasound (US), or MRI scans. X-ray imaging has the best-established role in the assessment of the severity of RA [10]. Radiography can document bone damage (erosion) that results from RA and visualize the narrowing of cartilage spaces. However, radiography is insensitive to the early manifestations of RA, namely, effusion and hypertrophy of the synovial membrane. US is more sensitive than radiography at assessing erosion and synovitis, which allows clinicians to provide early diagnostic imaging at the point of care. However, a main disadvantage of US is a high level of operator dependence for obtaining quality images [11]. MRI is most useful in assessing soft tissue problems, avascular necrosis, the degree of cartilage erosion, osteonecrosis, and carpal tunnel syndrome [12]. The study showed that contrast-enhanced MRI could achieve a sensitivity and specificity of 70 and 64% [13], respectively (82.5 and 84.5% in another study [14]) for the detection of RA. However, long data-acquisition times during which the subject needs to be immobilized, large costs, and the need for contrast agents (e.g., gadolinium to detect increased blood volume caused by neovascularization in the hypertrophic synovial membrane that can be toxic for RA patients with critical renal failure) have prevented MRI from becoming a widely used imaging modality for detection of RA. Thus, there is no single ideal modality for imaging RA diagnosis, i.e., X-ray, US, and MRI are complementary with their own strengths and drawbacks.
Optical imaging techniques [15,16,17,18,19,20,21,22,23,24,25,26,27,28,29,30,31,32,33,34,35,36] for the diagnosis of RA have also been extensively studied using a continuous wave (CW) system in early works [23,26], and later a frequency domain (FD) system [34,36], combined X-ray and photoacoustic tomography [29], and furthermore, molecular imaging approaches such as bioluminescence and fluorescence tomography [16,21,22]. The basis for optical methods is that in the early stages of RA, optical properties such as absorption and scattering are expected to increase in the synovium and the synovial fluid as the inflammatory process starts in this region. These studies were mostly based on the diffusion equation (DE) as a model of light propagation in tissue. More recently, a deep learning technique has also emerged as a viable tool for the diagnosis of RA [18]. Our research team has explored the potential of DOT imaging for detecting and characterizing RA by using the CW-ERT [25,26] and the FD-ERT [32,33,34,35,36]. We reported that the CW-ERT-based DOT images yielded a sensitivity and specificity of 78 and 76%, respectively [25], and the FD-ERT based DOT images achieved a sensitivity and specificity of 85% and higher [34]. Later, this same FD-ERT based DOT images were re-analyzed using advanced machine learning algorithms, which led to an improved sensitivity (96%) and specificity (94%) [35,36].
While all these DOT results are promising for RA diagnosis, there is still room for improvement, particularly with respect to accuracy and reconstruction speed, in order to further the clinical utility of the technique. In other words, the high diagnostic accuracy of FD-ERT based DOT imaging can only be achieved at the expense of reconstruction speed, while the DE model is much faster than the ERT but not reliable for achieving clinically relevant sensitivity and specificity. To overcome the shortcomings of these two most common models (DE and ERT), we employed here the frequency-domain third-order simplified spherical harmonics model (FD-SP3) [37] as an alternative to the FD-ERT for the diagnosis of RA, for its clinically relevant accuracy and computational efficiency. It has been shown that the SP3 model is reliable for use in much of both transport and diffusion regimes, with higher-than-DE accuracy and similar-to-DE speed [38]. In 2017, we reported that the FD-SP3 model was able to accurately capture the differences in optical properties due to the onset of RA using the forward and inverse simulations of RA-affected and healthy subjects [37].
To our best knowledge, there is no work reported on the clinical utility of FD-SP3-based DOT imaging as applied to a large-scale clinical data. Motivated by this unmet need, we have placed the focus of this work on the evaluation of the FD-SP3-based DOT imaging on its ability to diagnose RA. To this end, the FD-SP3 model [37] is used in this work to recover the absorption and scattering coefficients from the existing clinical data of 219 proximal interphalangeal (PIP) finger joints available from our previous clinical study. For feature extraction and classification of FD-SP3-based DOT images, we used the -fold cross validation method that consists of data mining and a support vector machine (SVM) algorithm. This is based on our previous findings [35,36] in which the SVM with a polynomial kernel was shown to yield the highest sensitivities and specificities in the diagnosis of RA. We compared the performance of SP3-based DOT images against the FD-ERT-based DOT images (slow but accurate) and the FD-DE-based DOT images (fast but inaccurate) with respect to diagnostic accuracy and computational efficiency. The diagnostic accuracy is presented in terms of the sensitivity () and specificity (), and computational efficiency in terms of the memory requirement and image reconstruction time. Furthermore, we compared the performance of the DE, SP3, and ERT models for their diagnostic accuracy.
In Section 2, we provide a brief description of the FD-SP3 model, the image reconstruction algorithm, and the clinical data, followed by the method of feature extraction and selection. Then, we present and discuss FD-SP3-based DOT images and their classification results in in Section 3. In Section 4, we conclude this work with a summary of the key findings presented in this work.
2. Materials and Methods
2.1. Frequency-Domain Third-Order Spherical Harmonics (FD-SP3) Light Propagation Model
The frequency-domain simplified spherical harmonics (FD-SPN) model can be obtained from the time-domain simplified spherical harmonics (TD-SPN) model, assuming that the refractive index in the medium is spatially invariant and that the discrete ordinates () are independent from spatial position (i.e., ) [39]. The SP3 model for N = 3, along with appropriate boundary conditions, is presented below,
where and denote composite moments of the fluence in units of , and and . The -th order absorption coefficient is given by , where is the absorption coefficient, is the scattering coefficient, and is the anisotropy factor. The modulation frequency of the source laser is denoted by , is the speed of light in the medium, and denotes an internal source of light.
Following the node based control volume finite element (CVFEM) discretization [33], Equations (1) and (2) can be rewritten into a system of linear equations: , where is the discretized SP3 model, is the composite moments of the fluence, and is the source vector that accounts for boundary or/and interior light sources. This linear system was solved using the restarted generalized minimal residual (GMRES) algorithm [40]. The transillumination measurement on CCD pixels can be expressed as the following linear function:
where is the measurement operator that projects the composite moments of the fluence from the mesh surface space onto the ICCD image space.
2.2. Image Reconstruction Algorithm
The spatial distribution of absorption and scattering coefficients in finger tissue was reconstructed with the reduced Hessian sequential quadratic programming (rSQP) algorithm of PDE-constrained optimization [33] tailored to use the FD-SP3 model as the forward model of light propagation in tissue.
Following the framework of PDE-constrained optimization, the FD-SP3 image reconstruction finds the composite moments vector and the optical property vector in an all-at-once manner such that:
where is the prediction of measurement and the operator (¯) denotes the complex conjugate of the complex value.
Given the current estimate of forward and inverse variables , the rSQP scheme gives the new iterate for both forward and inverse variables:
where a step length provides a sufficient decrease in the merit function, and a search direction can be obtained by solving the following quadratic programming problem:
where denotes the gradient of , denotes the reduced Hessian of the Lagrangian functional , and represents the gradient of the constraint . Details on the theory and implementation of the rSQP method can be found in [33].
Note that the existing clinical data has no reference measurement taken—therefore, standard calibration is not possible. Instead, we normalized the data by dividing the measurement at each detector location by the average intensity taken over all source–detector measurements [34]. This procedure eliminates the effects by various unknown factors such as unknown power source and unknown detector response function. As a result, the normalized and are given as
The indices and denote all possible sources and detectors, respectively. Here, and represent the average measured intensity and the averaged predicted intensity, respectively, and are given by
To improve convergence, each element of the product in Equation (4) is further normalized by each element of the measurement norm as
which is implemented into Equations (4) and (6) of the rSQP algorithm with SP3 model.
2.3. Clinical Data
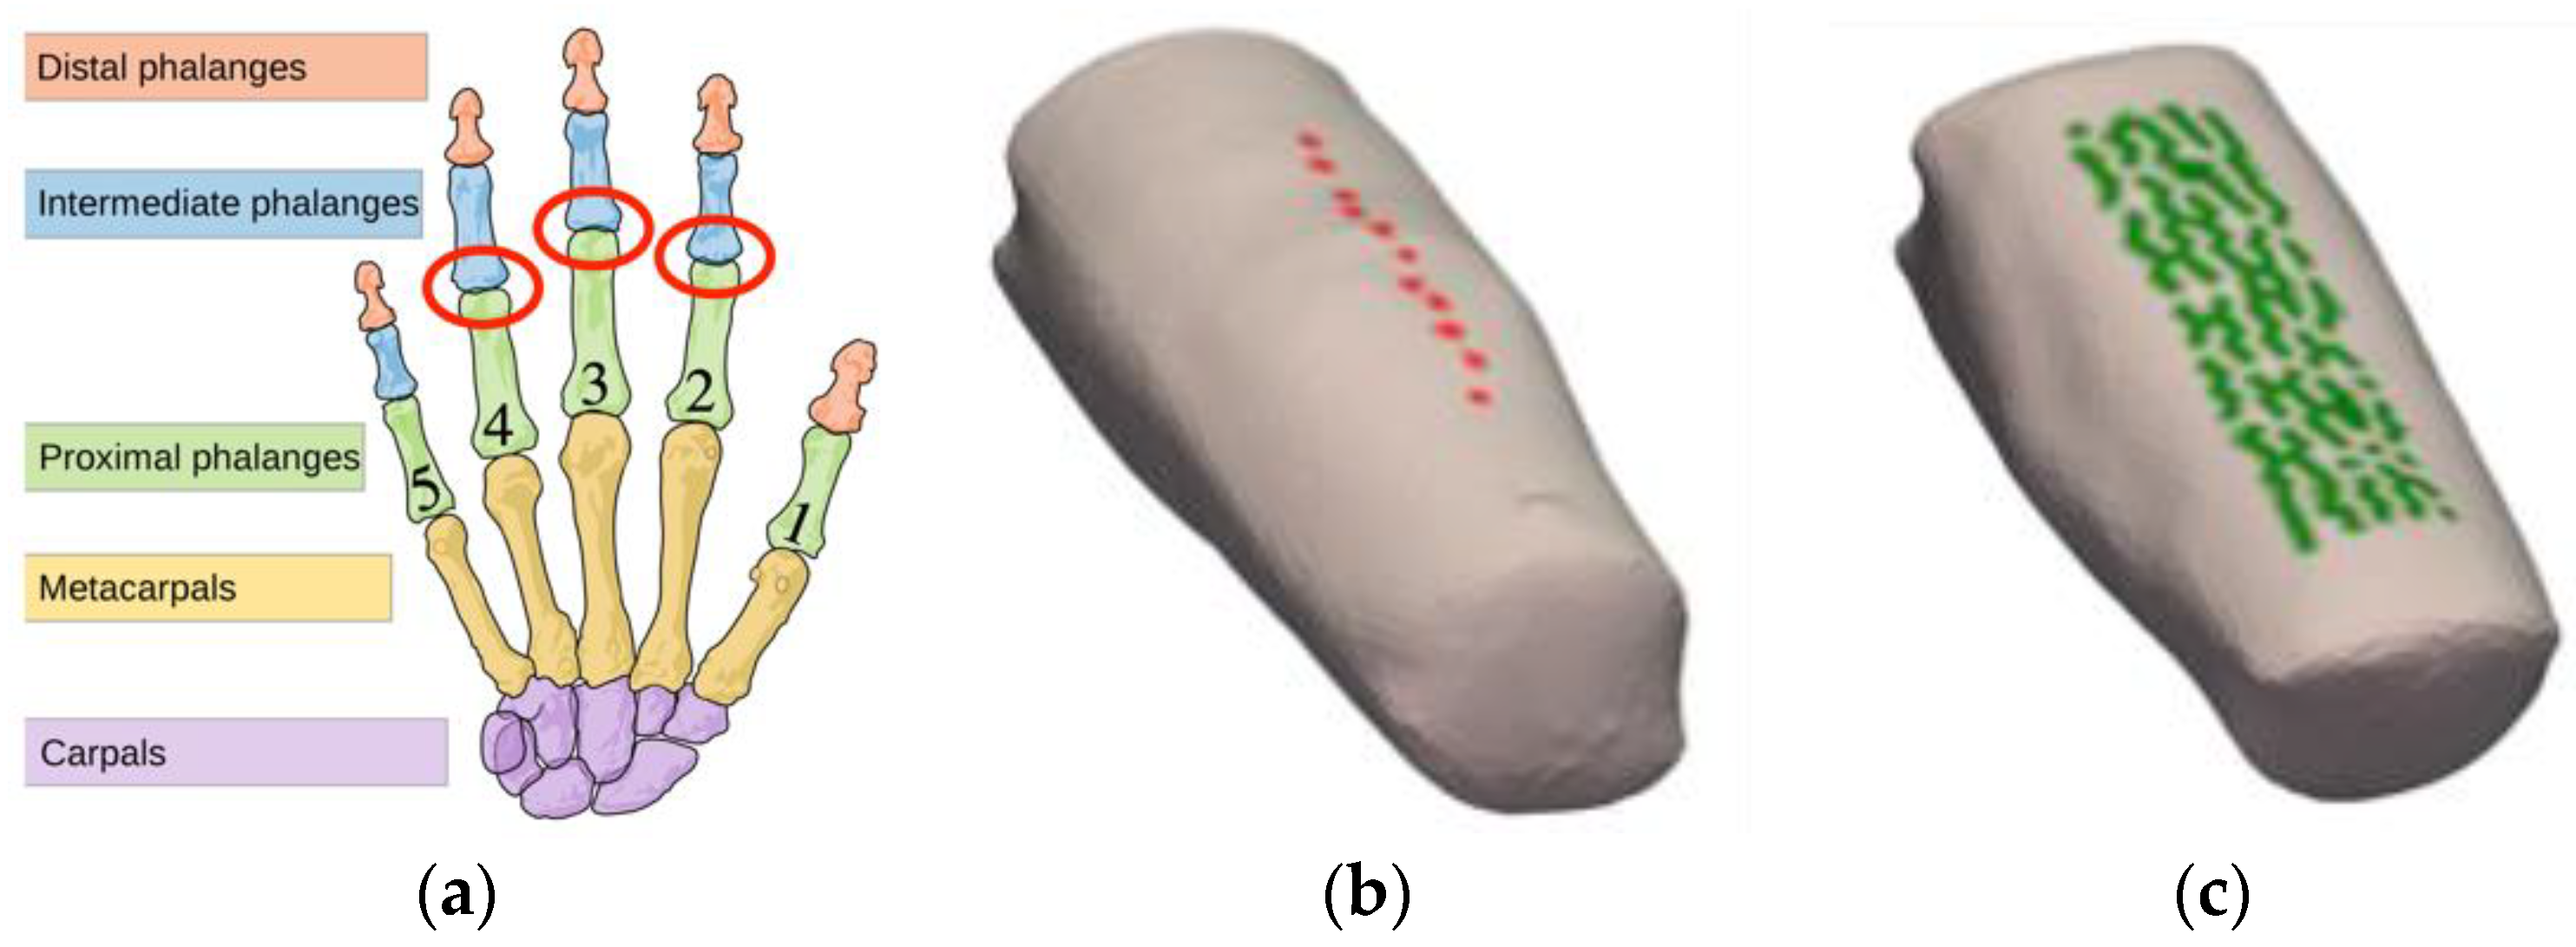
We reported a clinical study that imaged 219 PIP joints with the frequency-domain DOT system [31] and analyzed their ERT-based DOT images for the diagnosis of RA [34]. Anatomically, PIP joints are located approximately in the middle of the finger, as shown in Figure 1a, and are also primarily affected by RA. PIP joints II-IV were imaged on the dominant hand of 33 subjects with RA and on both hands of 20 healthy control subjects, resulting in 99 joints from subjects with RA and 120 joints of subjects without RA. The ground truth, which is the “true” diagnosis of each joint classified either as RA or healthy, is available from the previous study in which each subject was evaluated and diagnosed for RA by a rheumatologist according to the guidelines set by the American College of Rheumatology (ACR) [41]. The source laser illuminated the finger joint on the posterior (dorsal) side and escaping photons were measured on the anterior (palmar) side using an intensified CCD-based detection system. In total, 11 distinct point sources (Figure 1b) and over 100 detector points (Figure 1c) were used for each finger.
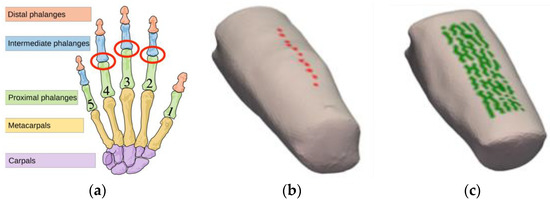
Figure 1.
An illustration of joints and a typical finger in the human hand. (a) The PIP joint (marked in red circle) is located approximately in the middle of the finger, referred to as PIP II-IV (index, middle, and ring fingers, respectively). (b) The positions of the 11 sources are indicated on the posterior surface of the finger. (c) The positions of detectors (i.e., mesh nodes that map directly to a pixel on the CCD camera-based detection system) are shown on the anterior surface of the finger section.
An example of a transillumination measurement from a single point source on the finger surface, as captured by the ICCD-based detector system, on the posterior (or palmar) surface of the finger is presented in Figure 2. The measurement operator (Equation (3)) is used to extract the region of pixels that corresponds to the finger surface projected onto the CCD image. Thus, transillumination measurements at those corresponding CCD pixel locations were used as an input to the image reconstruction algorithm. Details of the frequency-domain imaging system can be found in [34].
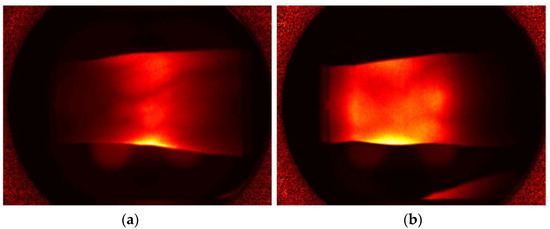
Figure 2.
Transillumination captured by the ICCD camera on the posterior (palmar) surface of a PIP joint belonging to (a) a subject with RA and (b) a healthy control.
2.4. Feature Extraction
We provide here a detailed description of the procedure of feature extraction used in this work. For each of reconstructed and images, we first selected various regions of interest and defined all data points in each region of interest as the unique data set, and then features were extracted from each unique data set [34].
In total, 11 unique data sets were generated: two 3D volume data sets and nine 2D image data sets. These 11 data sets comprise the entire unstructured or structured volume data (UV, SV), the data sets from the summation of all coronal, sagittal, transverse slices respectively (SC, SS, ST), the data sets from the variance between all coronal, sagittal, transverse slices, respectively (VC, VS, VT), and also the data sets from the average of all coronal, sagittal, transverse slices in the joint region (i.e., within ±2 mm from the center of the PIP joint), respectively (JC, JS, JT).
From each of all 11 data sets (UV, SV, SC, SS, ST, VC, VS, VT, JC, JS, JT), the following 76 features were extracted and denoted by F01 to F76 consecutively: (1) five basic features, (2) seven Gaussian mixture model (GMM) parameters, and (3) 13 (in 2D) or 63 (in 3D) FFT (fast Fourier transform) coefficients. The seven basic statistical features are the maximum, minimum, mean, variance, and the ratio of maximum to minimum of the data set. Except for the unstructured volume data set, the additional seven features were extracted by fitting DOT images with a 2D or 3D multivariate GMM [42] as
where amplitude , covariance matrix ∑, and Gaussian mean are estimated. The extracted features with Equation (10) are the absolute error (1 feature) between the mixture model and the original data and the eigenvalues of the dominant positive (3 features) and negative (3 features) Gaussians. In addition, we performed a discrete FFT of the 2D or 3D data sets, extracted the distinct FFT coefficients that best represent the original image, and used those coefficients as the features—13 FFT coefficients for the 2D data set and 63 coefficients for the 3D data set. All data sets and features used in this work are summarized in Table A1, Table A2, Table A3 and Table A4 in Appendix A.
To succinctly refer to all the features, we use the notation “Feature #:Data Set:Optical Property” throughout the rest of this work, in which Feature # represents F1 to F76, Data Set represents UV to JT, and Optical Property represents the (denoted by “a”) or (denoted by “s”) distribution. For example, F1:JS:a indicates the maximum value (“F1”) of the joint sagittal (“JS”) slices in image (“a”). The FFT feature starts with F13 and ends with F26 (in the 2D data set) and F76 (in the 3D data set). As a result, this leads to a total of 572 features (= (55 basic features + 52 GMM features + 170 FFT features) × 2 optical property maps). This is too a large number of features to consider all the possible combinations of features (i.e., possible combinations) in classification analysis. Therefore, we first selected the top 30 features using the augmented Youden index given by
where the lower bounds of the confidence intervals of and are given by and , respectively. The scaling factors , , and control the contribution of the lower bound values ( and ) and the dimensionality () of the selected feature combination, and were all set to 0.001. In this way, feature combinations with higher lower bounds and low dimensionality are preferred. These top 30 features corresponded to 13% of the sample size, which is acceptable for the size of feature space, as the size of feature set needs to be 10–20% of the sample size, in general [42].
2.5. Cross-Validation Algorithm
Given the top 30 features based on Equation (11), we performed the -fold cross validation to evaluate the ability to diagnose RA using the SP3 based DOT data. With , the entire data set was segmented into two sets, a training set and a testing set. Here, approximately 2/3 of the data was used to train and 1/3 was used to test. The training set consisted of 22 subjects with RA (or 66 PIP joints) and 14 healthy individuals (or 84 PIP joints), together resulting in 150 distinct joints. The testing set included 11 subjects with RA (or 33 PIP joints) and six healthy patients (or 36 PIP joints). The allocation of subjects into the training group or the testing group was done randomly to help minimize any potential bias.
The training set was subject to the data mining process, which yields a set of optimal feature vectors and the corresponding choice of classification algorithm for the training data. The testing set was not used until the optimal classifier (features and classification algorithm) was chosen. The resulting classifier was used to subsequently evaluate the ability to diagnose RA with the testing data. The cross validation process is summarized by the flow chart in Figure 3. Note that the optimal classification algorithm is fixed to the SVM [43], as described earlier in the Introduction section.
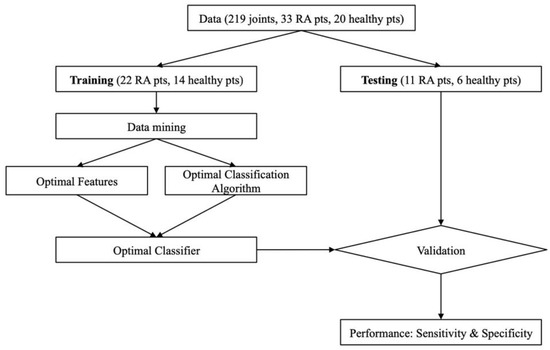
Figure 3.
Flow chart of -fold cross-validation.
As shown in Figure 3, this so-called -fold process provides additional safety layers to ensure our classification results are as unbiased as possible and thus more reliable. The data mining process used in this work is also summarized by the flow chart in Figure 4. Note that the leave-one-out cross validation (LOOCV) procedure was used in the data mining process (Figure 4) to remove any bias that may be introduced into the testing. This process was performed on DOT images obtained with the DE, SP3, and ERT models.
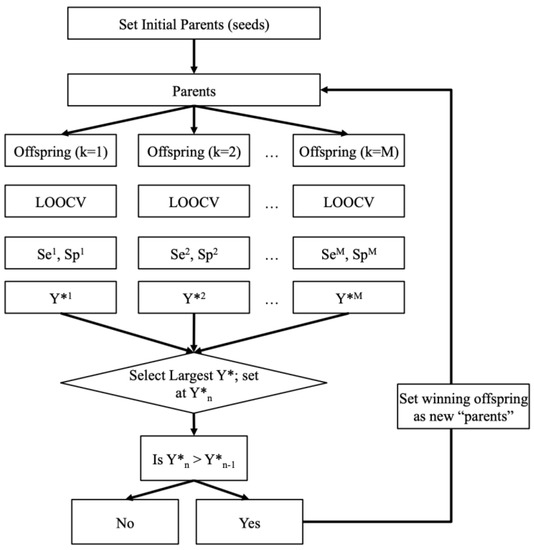
Figure 4.
Flow chart of the data mining process that selects the optimal features and the best classification algorithm for diagnosing RA from DOT images.
3. Results
3.1. Reconstructed Absorption and Scattering Coefficients with SP3 Model
The SP3 model was used to reconstruct the absorption and scattering coefficients of all 219 fingers. The reconstruction parameters used to obtain these results are summarized in Table 1. The absorption and scattering coefficients were rescaled by transforming the absorption range of [0.0, 0.4] and the scattering range of [0.0, 400.0] to [0.0, 1.0] . Each reconstruction required between 150 to 200 MB of RAM and took less than 1 min on an Intel Core i9 processor.

Table 1.
Summary of the values assigned to reconstruction variables.
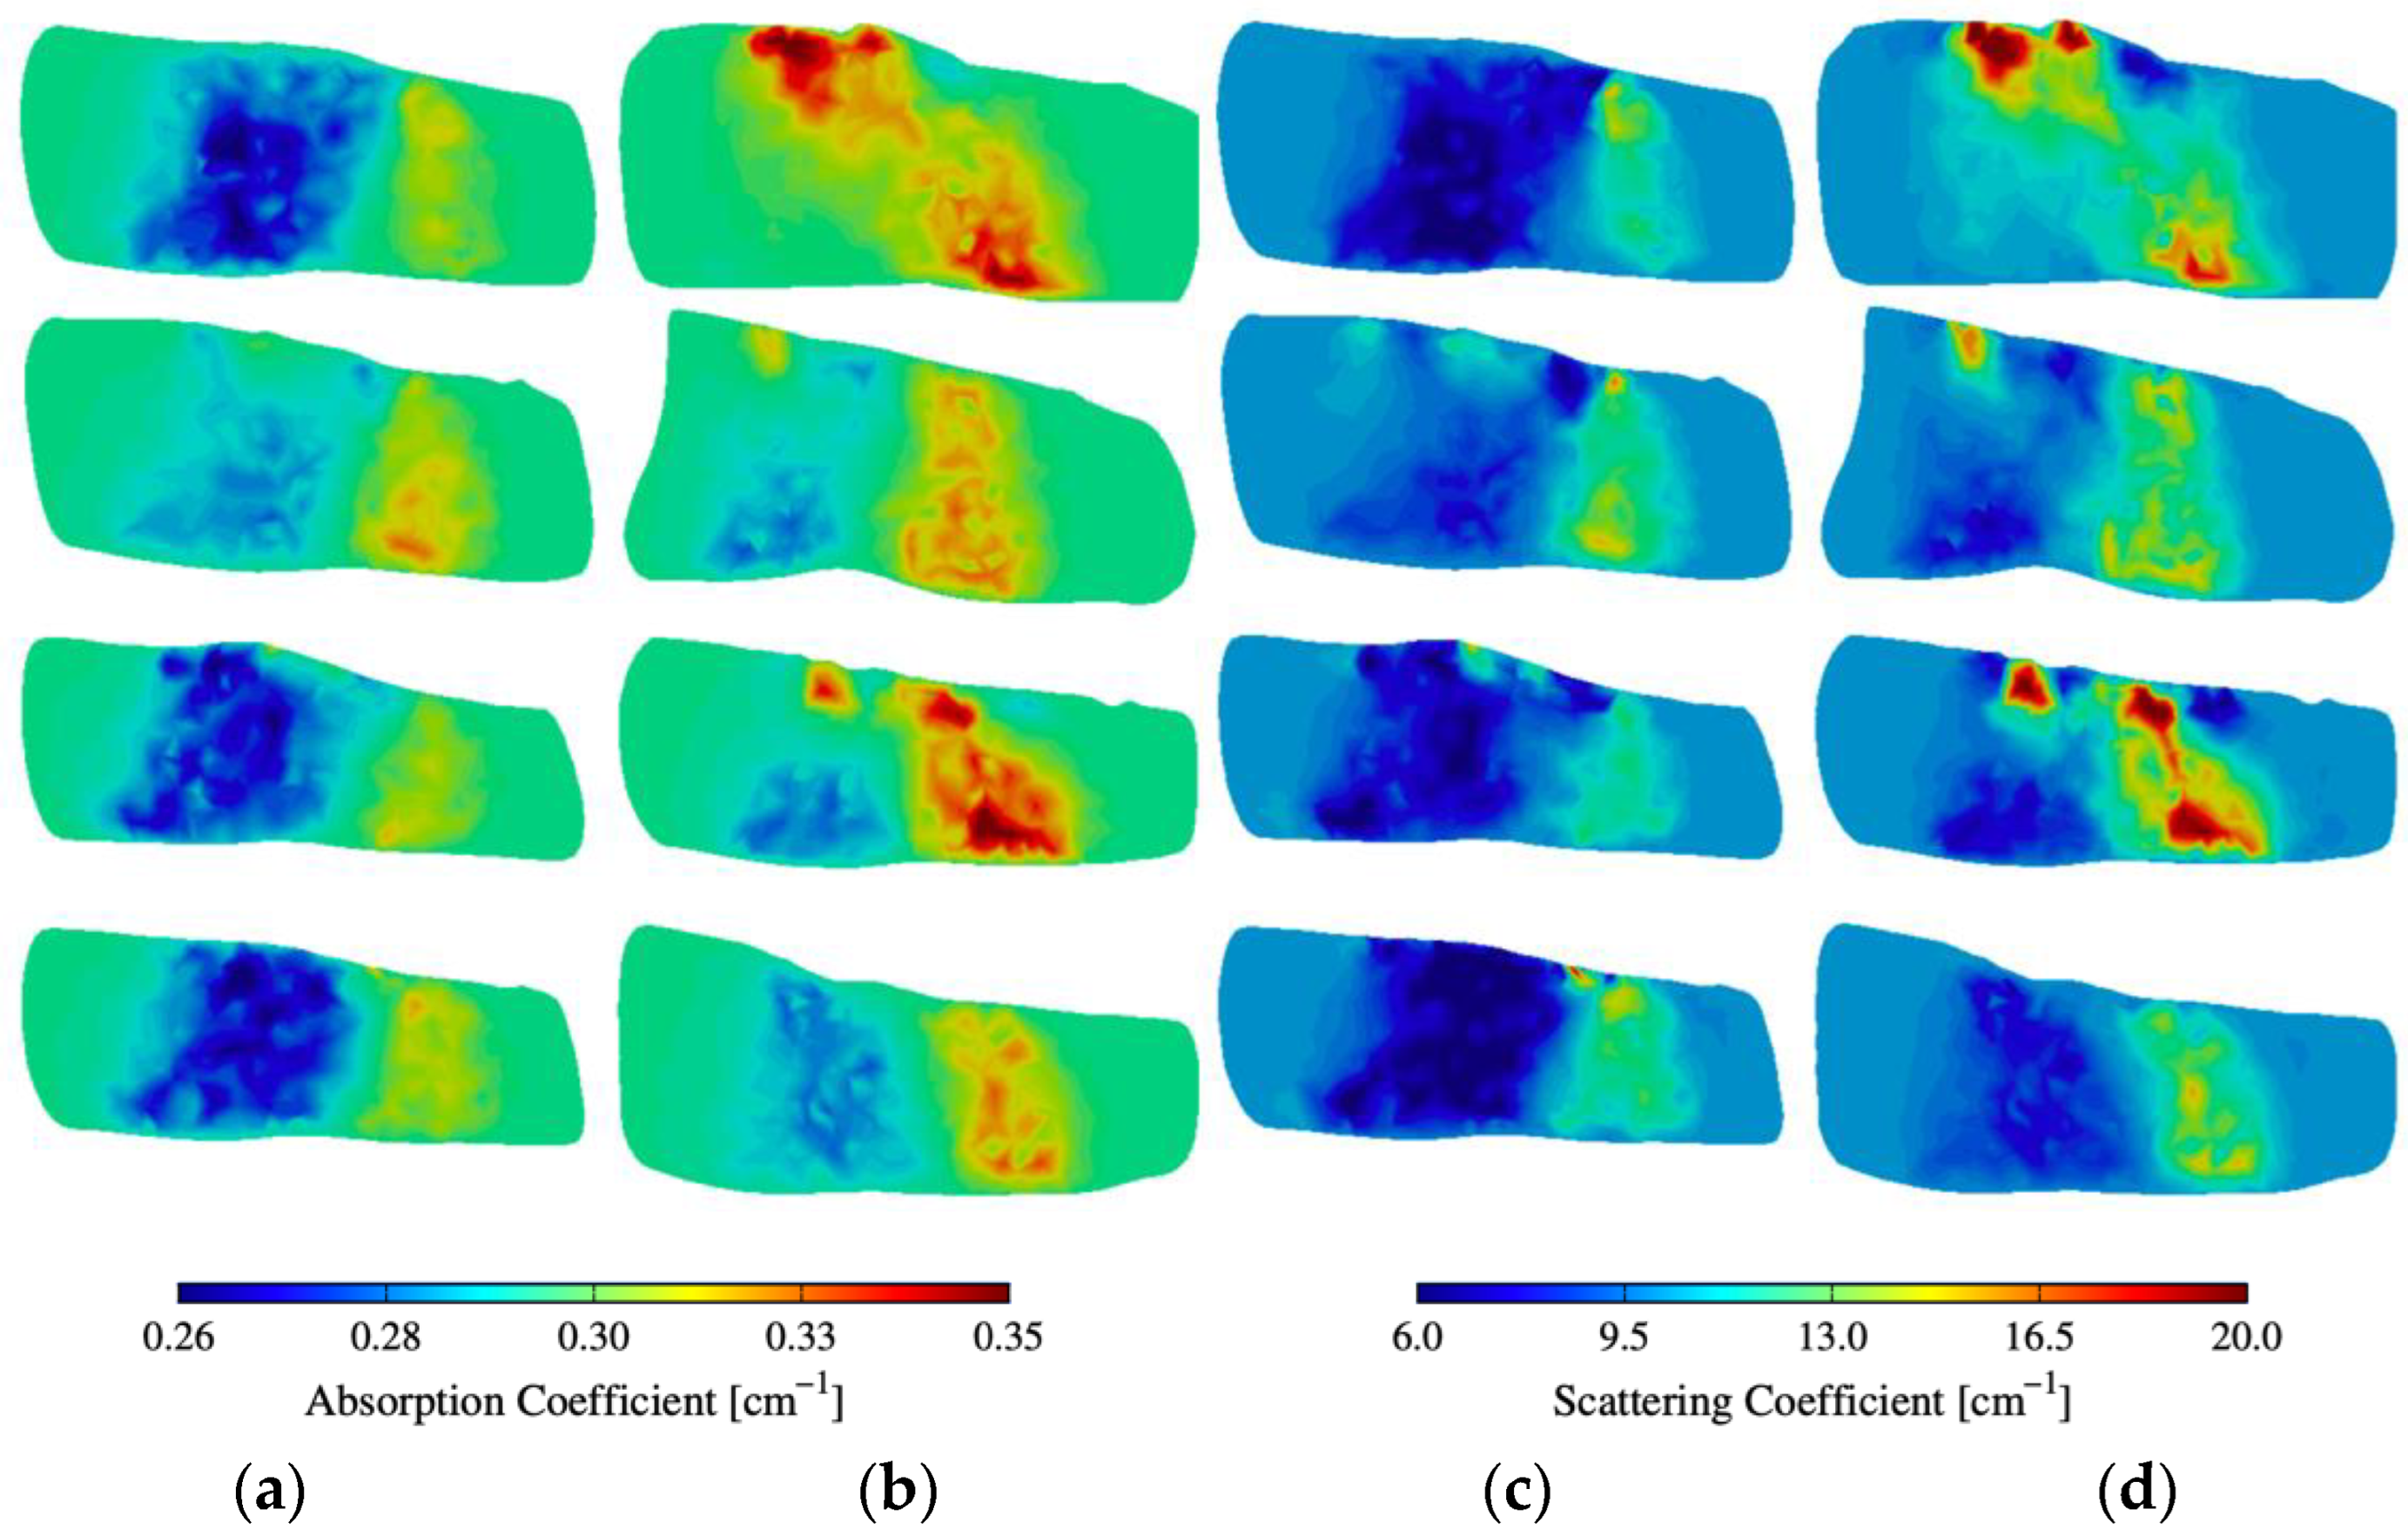
Figure 5 shows some of the reconstruction images of absorption () and scattering () within and around PIP joints—more reconstruction images (32 fingers) are available in Figure A1 and Figure A2 in the Appendix A. The images clearly show distinct differences between subjects with RA and the control group. The region of interest is within and around the PIP joint that corresponds to the synovial cavity of the joint, which we expect has lower absorption and scattering compared to the surrounding tissues (bone, muscle, ligament, tendon). All the joints of healthy subjects are of a lower absorption and scattering in this region of interest. However, subjects with RA exhibit elevated absorption and scattering in that same region when compared to the control group. This suggests that the synovial cavity of these joints has experienced significant changes in physiology due to the onset of symptoms associated with RA.

Figure 5.
(a,b) Absorption and (c,d) scattering cross-sections of distinct joints from 4 subjects with and without RA.
3.2. Classification Results of SP3 DOT Images
For each data set of the DOT images obtained with DE, SP3, or ERT, we report the sensitivity and the specificity obtained when the data mining results were used to classify the testing data. We report the sensitivity and the specificity at the 95% confidence intervals (CI), which indicates the lower and upper bounds of the sensitivity and the specificity within which we are confident that the true performance of the classifier is located (with up to 95% confidence). The CI was computed to account for the effective sample size of our data, which removes bias that may be introduced into our statistical parameters through correlation between joints of the same subject [36,44].
Table 2 shows the classification results. The sensitivity and specificity and their respective confidence intervals in the parenthesis achieved when using the reconstruction images generated with the DE, SP3, and ERT models are summarized in Table 2. The number of true positives (TP), false negatives (FN), true negatives (TN), and false positives (FP) is also presented in Table 2.
Table 2.
Classification results for SP3, DE, ERT based reconstructions with the -fold method.
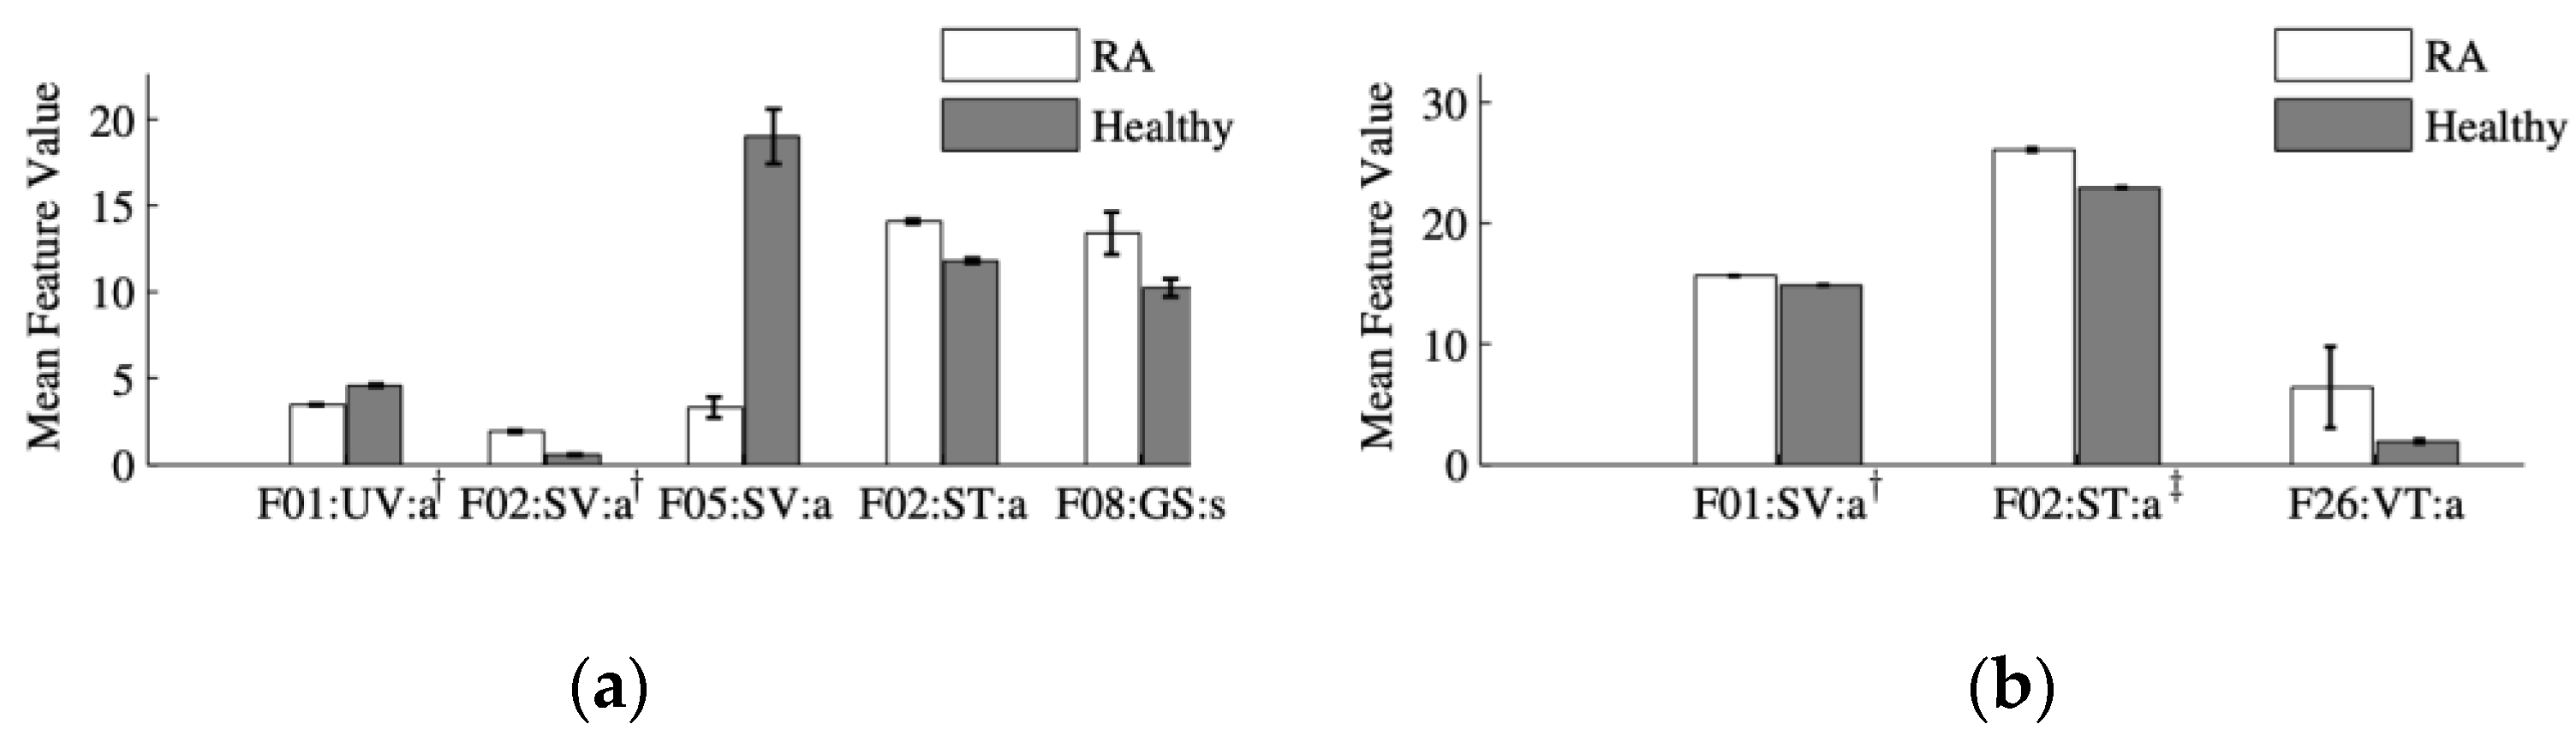
The names of the optimal features selected during the training phase and used in the testing phase are presented in Table 3. The mean and standard error of the optimal features corresponding to the DE, SP3, and ERT models are plotted in Figure 6. The three optimal features chosen using the SP3 model were F01:SV:a, F02:ST:a, and F13:VT:a. The first two features are the maximum and minimum values of the three-dimensional data and the sum of transverse slices, respectively (refer to Appendix A for details on the naming convention). The third feature corresponds to the largest coefficient of the FFT transform of the variance between transverse slices.
Table 3.
Names of the optimal features selected during the training phase of the -fold method using the SP3, the DE-, and the ERT-based reconstructions.
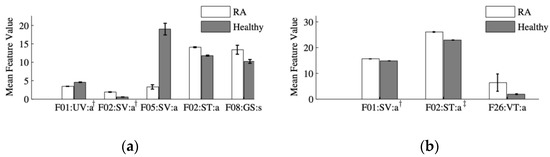
Figure 6.
Mean value and standard error of the optimal features selected from analysis of the (a) ERT and (b) SP3-based reconstruction images. A two-sample Student’s t-test shows that the differences between the features from subjects with RA and without RA are statistically significant at the α = 0.01 level. (a) Features denoted by † are scaled by a factor of 10. (b) Features denoted by † and ‡ are scaled by a factor of 50 and 500, respectively.
The five optimal features chosen using ERT-based reconstruction images were F01:UV:a, F02:SV:a, F05:SV:a, F02:ST:a, and F08:JT:s. The first three features are the maximum, minimum, and ratio values of the three dimensional data, respectively. The fourth feature is the minimum of the sum of transverse slices. The fifth feature is the second eigenvalue of the dominant positive Gaussian from a Gaussian mixture model (GMM).
Together, it can be generally concluded that the optimal features are associated with the global absolute values of the absorption and scattering data, as well as their spatial variation within the imaged section of the finger. The difference in optimal features is attributed to the difference in the rule for selecting the top 30 features and in the use of the -fold method as an additional cross-validation step.
4. Discussion
We compared the performance of the DE, SP3, and ERT models with respect to three categories: feature extraction optimality, image classification performance, and computational efficiency.
The first category is feature extraction optimality, where we compared the number of “optimal” features selected during the training process. In general, we prefer optimal feature vectors with low-dimensionality as this helps reduce the probability of over-fitting the data [36,43]. Over-fitting can result in classification results that do not generalize well and therefore may be an unreliable predictor of future performance. In this work, the number of optimal features was eight for the DE model, three for the SP3 model, and five for the ERT model. As we are generally interested in the fewest possible features to avoid over-fitting problems, it is clear that the SP3 model is superior in this category to the ERT and DE models.
The second category to compare was the classification performance of the three models. Here, we were primarily concerned with the sensitivity and the specificity that are computed by processing the data set reserved for testing with the classifier that results from the training phase. In addition to seeking values of the sensitivity and the specificity as close to 100.0% as possible, we were also interested in comparing the 95% confidence interval for each parameter. The CI is important because it informs us of the range within which we expect the true values of the sensitivity and the specificity to exist [35,36,44].
The reconstruction images computed with the SP3 model allow for higher sensitivity and specificity values than the images obtained with the DE model. The DE model yielded a sensitivity of 67% at CI (47, 100)% and a specificity of 81% at CI (65, 100)%. The SP3 model yielded a sensitivity of 88% at CI (78, 100)% and a specificity of 93% at CI (84.6, 100)%. Images computed with the ERT-based algorithm yielded a sensitivity of 91% at CI (83, 100)% and specificity of 98% at CI (85, 100)% specificity. Thus, the SP3 model clearly outperformed the DE model and compares favorably to the ERT.
We note that the upper bound of the CI for all models is 100%. The lower bound varies between the models and between the sensitivity and the specificity. As in the case of the sensitivity and the specificity values, the CI of the ERT was smaller than those obtained with the DE and SP3 models. However, the lower bounds of the SP3 model are significantly higher than the lower bounds of the DE model. The lower bound of the sensitivity with the DE model is in only 47%, which is significantly lower than the 78% lower bound that was computed with the SP3 model. Furthermore, the sensitivity computed with the DE images (67%) is even lower than the lower bound of the sensitivity computed with the SP3 model (78%). Similar results were observed when comparing the specificity values.
The third category in which we compared the models was computational efficiency, which consists of the total reconstruction time and the total system resources needed. The reconstruction times with the DE and SP3 models were similar, typically requiring less than 1 min to complete one reconstruction process on an Intel Core i9 processor. In contrast, the reconstruction time with the ERT model exceeded 100 min on the same computing platform [33]. Additionally, reconstructions with the ERT always required over 6 GB of RAM, while the DE and SP3 models always required less than 200 MB of RAM [37,38]. In the computational efficiency category, thus, the DE and SP3 models outperform the ERT model.
Overall, all these results discussed in this section indicate that the SP3-based reconstruction algorithm provides significant computational advantages over the ERT-based algorithm without compromising classification accuracy. In contrast, the DE model provides computational advantages when compared to the ERT but only at the expense of classification accuracy.
5. Conclusions
The SP3-model-based image reconstruction was performed on a set of 219 human PIP joints, with 99 joints belonging to subjects with RA and 120 joints belonging to healthy subjects. The k-fold cross validation was employed to evaluate the diagnostic performance of SP3-based DOT images of absorption and scattering coefficients in the fingers. A comparison of sensitivity and specificity values was made between SP3-based images, DE-based images, and ERT-based images. The sensitivity and specificity values were 88 and 93% with the SP3 based images, 91 and 98% with the ERT based images, and 67 and 81% with the DE based images, respectively. It was also shown that the SP3 model performs better in achieving the fewest optimal features than the DE and ERT models. In terms of computational efficiency, the SP3 model is approximately 100 times faster and takes 30-fold less memory than the ERT model. In conclusion, the results presented here demonstrate that the SP3 model provides sufficiently accurate DOT images with a sensitivity of 88% and specificity of 93% to achieve clinically significant diagnostic results that compare favorably to the ERT model, while leading to a significant reduction in computation time and system resources. Therefore, it is expected that the SP3-based DOT reconstruction can translate into direct clinical benefits, allowing researchers to image finger joints in near real-time and to evaluate DOT images for RA diagnosis at its early stage and treatment monitoring at a clinical setting.
Future work involves the application of the algorithms and classifiers presented in this work to therapeutic areas of monitoring drug responses in a longitudinal clinical study, refinement of fragmented algorithms into a clinically useful all-in-one package, and further enhancement of the SP3 reconstruction algorithm through the use of parallel computing neural network techniques.
Author Contributions
Conceptualization, methodology, software, data analysis, and visualization, L.M. and S.H.K.; writing—original draft preparation, S.H.K. and L.M.; writing—review and editing, S.H.K. and A.H.; resources, supervision, project administration, and funding acquisition, A.H. All authors have read and agreed to the published version of the manuscript.
Funding
This research was funded by the National Institute of Arthritis and Musculoskeletal and Skin Diseases, Grant number 5R01AR050026, and the National Heart, Blood, and Lung Institute, Grant number 1R01-HL115336. Furthermore, support was provided partially by the National Institute of Arthritis and Musculoskeletal and Skin Diseases, Grant Number 5 T32 AR059038 02.
Institutional Review Board Statement
Not applicable.
Informed Consent Statement
Informed consent was obtained from all subjects involved in the study.
Data Availability Statement
Not applicable.
Acknowledgments
The authors would like to thank Jingfei Jia for his insightful comments and suggestions on feature extraction, data mining and classification.
Conflicts of Interest
The authors declare no conflict of interest.
Abbreviations
| CI | Confidence interval |
| CT | Computed tomography |
| CVFEM | Control volume finite element method |
| DE | Diffusion equation |
| DOT | Diffuse optical tomography |
| ERT | Equation of radiative transfer |
| FD | Frequency domain |
| GMRES | Generalized minimum residual solver |
| LOOCV | Leave-one-out cross validation |
| MRI | Magnetic resonance imaging |
| PDE | Partial differential equation |
| PIP | Proximal interphalangeal |
| RA | Rheumatoid arthritis |
| rSQP | Reduced space sequential quadratic programming |
| SP3 | Simplified spherical harmonics with order N = 3 |
| SVM | Support vector machine |
| TD | Time domain |
| US | Ultrasound |
Appendix A
Table A1.
Definition of data sets.
Table A1.
Definition of data sets.
| Name | Description |
|---|---|
| UV | Unstructured entire volume data |
| SV | Structured entire volume data |
| SS | Summation of all sagittal slices |
| SC | Summation of all coronal slices |
| ST | Summation of all transverse slices |
| VS | Variance of all sagittal slices |
| VC | Variance of all coronal slices |
| VT | Variance of all transverse slices |
| JS | Average of all sagittal slices in the joint region |
| JC | Average of all coronal slices in the joint region |
| JT | Average of all transverse slices in the joint region |
Table A2.
Definition of basic statistic features.
Table A2.
Definition of basic statistic features.
| # | Description |
|---|---|
| 1 | Maximum |
| 2 | Minimum |
| 3 | Mean |
| 4 | Variance |
| 5 | Ratio of maximum to minimum |
Table A3.
Definition of GMM features.
Table A3.
Definition of GMM features.
| # | Description |
|---|---|
| 6 | Absolute error between original image and GMM |
| 7 | 1st eigen value of ∑ of largest positive Gaussian |
| 8 | 2nd eigen value of ∑ of largest positive Gaussian |
| 9 | 3rd eigen value of ∑ of largest positive Gaussian (3D) |
| 10 | 1st eigen value of ∑ of largest negative Gaussian |
| 11 | 2nd eigen value of ∑ of largest negative Gaussian |
| 12 | 3rd eigen value of ∑ of largest negative Gaussian (3D) |
Table A4.
Definition of FFT features.
Table A4.
Definition of FFT features.
| # | Description |
|---|---|
| 13 | Absolute error between original image and image captured by the first 5 frequencies of the FFT |
| 14~26 | Absolute value of 2D FTT coefficients |
| 14~76 | Absolute value of 3D FTT coefficients |
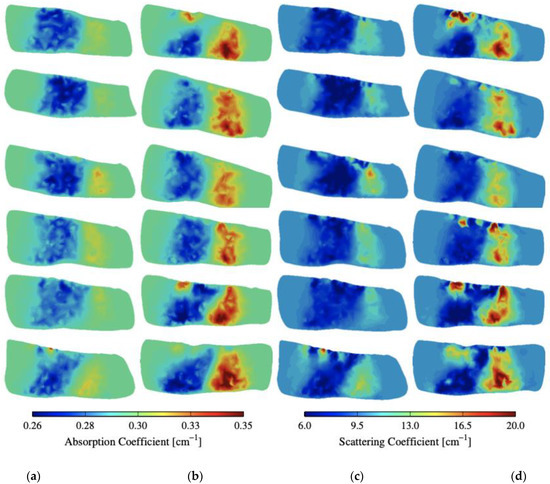
Figure A1.
(a,b) Absorption and (c,d) scattering cross-sections of distinct joints from 12 subjects with and without RA.
Figure A1.
(a,b) Absorption and (c,d) scattering cross-sections of distinct joints from 12 subjects with and without RA.

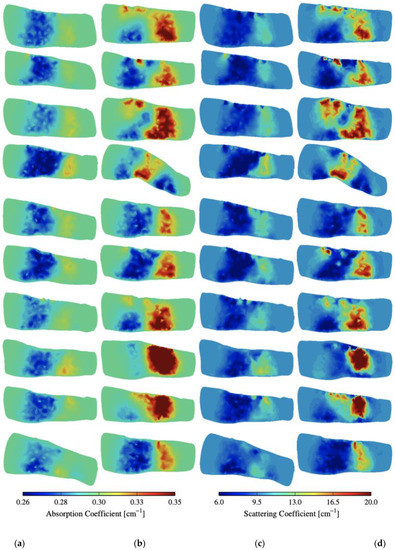
Figure A2.
(a,b) Absorption and (c,d) scattering cross-sections of distinct joints from another 20 subjects with and without RA.
Figure A2.
(a,b) Absorption and (c,d) scattering cross-sections of distinct joints from another 20 subjects with and without RA.

References
- Banal, F.; Dougados, M.; Combescure, C.; Gossec, L. Sensitivity and specificity of the American College of Rheumatology 1987 criteria for the diagnosis of rheumatoid arthritis according to disease duration: A systematic literature review and meta-analysis. Ann. Rheum. Dis. 2009, 68, 1184–1191. [Google Scholar] [CrossRef] [PubMed] [Green Version]
- O’Dell, J.R.; Smolen, J.S.; Aletaha, D.; Robinson, D.R.; St. Clair, E.W. Rheumatoid arthritis. In A Clinician’s Pearls and Myths in Rheumatology; Stone, J.H., Ed.; Springer: London, UK, 2010; pp. 1–13. [Google Scholar]
- Cieza, A.; Causey, K.; Kamenov, K.; Hanson, S.W.; Chatterji, S.; Vos, T. Global estimates of the need for rehabilitation based on the Global Burden of Disease study 2019: A systematic analysis for the Global Burden of Disease Study 2019. Lancet 2020, 396, 2006–2017. [Google Scholar] [CrossRef]
- Hunter, T.M.; Boytsov, N.N.; Zhang, X.; Schroeder, K.; Michaud, K.; Araujo, A.B. Prevalence of rheumatoid arthritis in the United States adult population in healthcare claims databases, 2004–2014. Rheumatol. Int. 2017, 37, 1551–1557. [Google Scholar] [CrossRef] [PubMed]
- Pincus, T. The underestimated long term medical and economic consequences of rheumatoid arthritis. Drugs 1995, 50 (Suppl. S1), 1–14. [Google Scholar] [CrossRef]
- Majithia, V.; Geraci, S.A. Rheumatoid arthritis: Diagnosis and management. Am. J. Med. 2007, 120, 936–939. [Google Scholar] [CrossRef]
- Sharp, J.T.; Strand, V.; Leung, H.; Hurley, F.; Loew-Friedrich, I. Treatment with leflunomide slows radiographic progression of rheumatoid arthritis: Results from three randomized controlled trials of leflunomide in patients with active rheumatoid arthritis. Leflunomide Rheumatoid Arthritis Investigators Group. Arthritis Rheum. 2000, 43, 495–505. [Google Scholar] [CrossRef]
- Fishman, P.; Bar-Yehuda, S. Rheumatoid arthritis: History, molecular mechanisms and therapeutic applications. In A3 Adenosine Receptors from Cell Biology to Pharmacology and Therapeutics; Borea, P.A., Ed.; Springer: Dordrecht, The Netherlands, 2010; pp. 291–298. [Google Scholar]
- El-Gabalawy, H.D.; Lipsky, P.E. Why do we not have a cure for rheumatoid arthritis? Arthritis Res. 2002, 4 (Suppl. S3), 297–301. [Google Scholar] [CrossRef] [PubMed]
- Brown, J.H.; Deluca, S.A. The radiology of rheumatoid arthritis. Am. Fam. Physician 1995, 52, 1372–1380. [Google Scholar]
- Gibson, N.; Kissin, E.Y. The pros and cons of ultrasonography for rheumatologic conditions. J. Musculoskelet. Med. 2011, 28, 289. [Google Scholar]
- Tan, A.L.; Wakefield, R.J.; Conaghan, P.G.; Emery, P.; McGonagle, D. Imaging of the musculoskeletal system: Magnetic resonance imaging, ultrasonography and computed tomography. Best Pract. Res. Clin. Rheumatol. 2003, 17, 513–528. [Google Scholar] [CrossRef]
- Solau-Gervais, E.; Legrand, J.L.; Cortet, B.; Duquesnoy, B.; Flipo, R.M. Magnetic resonance imaging of the hand for the diagnosis of rheumatoid arthritis in the absence of anti-cyclic citrullinated peptide antibodies: A prospective study. J. Rheumatol. 2006, 33, 1760–1765. [Google Scholar]
- Tamai, M.; Kawakami, A.; Uetani, M.; Takao, S.; Rashid, H.; Tanaka, F.; Fujikawa, K.; Aramaki, T.; Nakamura, H.; Iwanaga, N.; et al. Early prediction of rheumatoid arthritis by serological variables and magnetic resonance imaging of the wrists and finger joints: Results from prospective clinical examination. Ann. Rheum. Dis. 2006, 65, 134–135. [Google Scholar] [CrossRef] [PubMed] [Green Version]
- Hasan, A.A.; Reimann, F.; Veeger, N.J.; Bergstra, S.A.; Zhang, D.; Bourgonje, A.R.; Hendriks, L.; Beertsen, T.; Riofrio, L.Z.; Wink, F.; et al. Optical imaging compared to clinical examination in 484 rheumatoid arthritis patients: The Leeuwarden Handscan Registry. Rheumatol. Int. 2022, 1–8. [Google Scholar] [CrossRef] [PubMed]
- Kawashiri, S.Y.; Nishino, A.; Shimizu, T.; Takatani, A.; Umeda, M.; Koga, T.; Iwamoto, N.; Ichinose, K.; Tamai, M.; Nakamura, H.; et al. Fluorescence optical imaging in patients with active rheumatoid arthritis: A comparison with ultrasound and an association with biomarkers. Scand. J. Rheumatol. 2021, 50, 95–103. [Google Scholar] [CrossRef] [PubMed]
- Triantafyllias, K.; Heller, C.; de Blasi, M.; Galle, P.R.; Schwarting, A. Diagnostic value of optical spectral transmission in rheumatoid arthritis: Associations with clinical characteristics and comparison with joint ultrasonography. J. Rheumatol. 2020, 47, 1314–1322. [Google Scholar] [CrossRef]
- Feng, Y.; Lighter, D.; Zhang, L.; Wang, Y.; Dehghani, H. Application of deep neural networks to improve diagnostic accuracy of rheumatoid arthritis using diffuse optical tomography. Quantum Electron. 2020, 50, 21. [Google Scholar] [CrossRef]
- Lighter, D.; Filer, A.; Dehghani, H. Detecting inflammation in rheumatoid arthritis using Fourier transform analysis of dorsal optical transmission images from a pilot study. J. Biomed. Opt. 2019, 24, 066008. [Google Scholar] [CrossRef] [Green Version]
- Lighter, D.; Hughes, J.; Styles, I.; Filer, A.; Dehghani, H. Multispectral, non-contact diffuse optical tomography of healthy human finger joints. Biomed. Opt. Express 2018, 9, 1445–1460. [Google Scholar] [CrossRef]
- Glimm, A.M.; Sprenger, L.I.; Haugen, I.K.; Mansmann, U.; Hermann, S.; Häupl, T.; Hoff, P.; Burmester, G.R.; Backhaus, M.; Le, L.; et al. Fluorescence optical imaging for treatment monitoring in patients with early and active rheumatoid arthritis in a 1-year follow-up period. Arthritis Res. Ther. 2019, 21, 209. [Google Scholar] [CrossRef] [Green Version]
- Bhatnagar, S.; Khera, E.; Liao, J.; Eniola, V.; Hu, Y.; Smith, D.E.; Thurber, G.M. Oral and subcutaneous administration of a near-infrared fluorescent molecular imaging agent detects inflammation in a mouse model of rheumatoid arthritis. Sci. Rep. 2019, 9, 4661. [Google Scholar] [CrossRef]
- Scheel, A.K.; Krause, A.; Rheinbaben, I.M.V.; Metzger, G.; Rost, H.; Tresp, V.; Mayer, P.; Reuss-Borst, M.; Muller, G.A. Assessment of proximal finger joint inflammation in patients with rheumatoid arthritis, using a novel laser-based imaging technique. Arthritis Rheum. 2002, 46, 1177–1184. [Google Scholar] [CrossRef]
- Schwaighofer, A.; Tresp, V.; Mayer, P.; Krause, A.; Beuthan, J.; Rost, H.; Metzger, G.; Muller, G.; Scheel, A. Classification of rheumatoid joint inflammation based on laser imaging. IEEE Trans. Biomed. Eng. 2003, 50, 375–382. [Google Scholar] [CrossRef]
- Klose, C.D.; Klose, A.D.; Netz, U.; Beuthan, J.; Hielscher, A.H. Multiparameter classifications of optical tomographic images. J. Biomed. Opt. 2008, 13, 050503. [Google Scholar] [CrossRef]
- Klose, C.D.; Klose, A.D.; Netz, U.J.; Scheel, A.K.; Beuthan, J.; Hielscher, A.H. Computer-aided interpretation approach for optical tomographic images. J. Biomed. Opt. 2010, 15, 066020. [Google Scholar] [CrossRef]
- Yuan, Z.; Zhang, Q.; Sobel, E.; Jiang, H. Three-dimensional diffuse optical tomography of osteoarthritis: Initial results in the finger joints. J. Biomed. Opt. 2007, 12, 034001. [Google Scholar] [CrossRef]
- Yuan, Z.; Zhang, Q.; Sobel, E.; Jiang, H. High-resolution x-ray guided three-dimensional diffuse optical tomography of joint tissues in hand osteoarthritis: Morphological and functional assessments. Med. Phys. 2010, 37, 4343–4354. [Google Scholar] [CrossRef] [Green Version]
- Xiao, J.; Yao, L.; Sun, Y.; Sobel, E.S.; He, J.; Jiang, H. Quantitative two-dimensional photoacoustic tomography of osteoarthritis in the finger joints. Opt. Express 2010, 18, 14359–14365. [Google Scholar] [CrossRef]
- Biswal, S.; Resnick, D.L.; Hoffman, J.M.; Gambhir, S.S. Molecular imaging: Integration of molecular imaging into the musculoskeletal imaging practice. Radiology 2007, 244, 651–671. [Google Scholar] [CrossRef]
- Netz, U.J.; Beuthan, J.; Hielscher, A.H. Multipixel system for gigahertz frequency-domain optical imaging of finger joints. Rev. Sci. Instrum. 2008, 79, 034301. [Google Scholar] [CrossRef] [Green Version]
- Kim, H.K.; Netz, U.; Beuthan, J.; Hielscher, A.H. Optimal source-modulation frequencies for transport-theory-based optical tomography of small-tissue volumes. Opt. Express 2008, 16, 18082–18101. [Google Scholar] [CrossRef]
- Kim, H.K.; Hielscher, A.H. A PDE-constrained SQP algorithm for optical tomography based on the frequency-domain equation of radiative transfer. Inverse Probl. 2009, 25, 015010. [Google Scholar] [CrossRef] [Green Version]
- Hielscher, A.H.; Kim, H.K.; Montejo, L.; Blaschke, S.; Netz, U.; Zwaka, P.; Müller, G.; Beuthan, J. Frequency domain optical tomographic imaging of finger joints. IEEE Trans. Med. Imaging 2011, 30, 1725–1736. [Google Scholar] [CrossRef]
- Montejo, L.D.; Jia, J.; Kim, H.K.; Netz, U.J.; Blaschke, S.; Muller, G.A.; Hielscher, A.H. Computer-aided diagnosis of rheumatoid arthritis with optical tomography. Part 1: Feature extraction. J. Biomed. Opt. 2013, 18, 076001. [Google Scholar] [CrossRef] [Green Version]
- Montejo, L.D.; Jia, J.; Kim, H.K.; Netz, U.J.; Blaschke, S.; Muller, G.A.; Hielscher, A.H. Computer-aided diagnosis of rheumatoid arthritis with optical tomography. Part 2: Image classification. J. Biomed. Opt. 2013, 18, 076002. [Google Scholar] [CrossRef] [Green Version]
- Kim, H.K.; Montejo, L.; Jia, J.; Hielscher, A.H. Frequency-domain optical tomographic image reconstruction algorithm with the simplified spherical harmonics (SP3) light propagation model. Int. J. Therm. Sci. 2017, 116, 265–277. [Google Scholar] [CrossRef]
- Klose, A.D.; Larsen, E.W. Light transport in biological tissue based on the simplified spherical harmonics equations. J. Comput. Phys. 2006, 220, 441–470. [Google Scholar] [CrossRef]
- Domínguez, J.B.; Bérubé-Lauzière, Y. Diffuse light propagation in biological media by a time-domain parabolic simplified spherical harmonics approximation with ray-divergence effects. Appl. Opt. 2010, 49, 1414–1429. [Google Scholar] [CrossRef]
- Saad, Y.; Schultz, M.H. GMRES: A generalized minimal residual algorithm for solving nonsymmetric linear systems. SIAM J. Sci. Stat. Comput. 1986, 7, 856–869. [Google Scholar] [CrossRef] [Green Version]
- Aletaha, D.; Neogi, T.; Silman, A.J.; Funovits, J.; Felson, D.T.; Bingham, C.O., III; Birnbaum, N.S.; Burmester, G.R.; Bykerk, V.P.; Cohen, M.D.; et al. 2010 Rheumatoid arthritis classification criteria: An American College of Rheumatology/European League against rheumatism collaborative initiative. Arthritis Rheum 2010, 62, 2569–2581. [Google Scholar] [CrossRef]
- Theodoridis, S.; Koutroumbas, K. Pattern Recognition; Elsevier Academic Press: Amsterdam, The Netherlands, 2006. [Google Scholar]
- Cortes, C.; Vapnik, V. Support-vector networks. Mach. Learn. 1995, 20, 273–297. [Google Scholar] [CrossRef]
- Wilson, E.B. Probable inference, the law of succession, and statistical inference. J. Am. Stat. Assoc. 1927, 22, 209–212. [Google Scholar] [CrossRef]


Publisher’s Note: MDPI stays neutral with regard to jurisdictional claims in published maps and institutional affiliations. |
© 2022 by the authors. Licensee MDPI, Basel, Switzerland. This article is an open access article distributed under the terms and conditions of the Creative Commons Attribution (CC BY) license (https://creativecommons.org/licenses/by/4.0/).