Abstract
The corrosion of reinforced concrete could reduce its mechanical properties and cause concrete cracking. Electrophoretic deposition is a new method for repairing rust-cracked reinforced concrete. In this study, we observed the crack surface morphology, mass growth, epoxy resin film thickness, ultrasonic rate, and epoxy resin filling depth of rust-cracked reinforced mortar specimens during the repair process and investigated internal microstructure and phase composition of the repaired mortar, and clarified the principle behind the electrophoretic deposition of cationic epoxy resin and curing agent molecules in the repair solution. The result of research shows that longer repair times decreased the carbonization depth and water absorption of the specimens. After repair, the porosity of the surface mortar decreased, owing to the filling of epoxy resin, and the newly generated epoxy resin film had a dense structure. Thus, the carbonization resistance and waterproof performance of the repaired specimens improved. The repair process of electrophoretic deposition can be divided into the immersion, repair, and curing stages, and the physical and chemical principles of each stage were explained.
1. Introduction
Reasonable material ratios, structural designs, and fine maintenance construction can control the development of cracks to a certain extent [1,2]. However, given the material characteristics of concrete and other factors, the cracking of reinforced concrete structures cannot be completely inhibited [3,4]. When cracks form on a structure, its bearing capacity decreases, further increasing the number, depth, and width of cracks [5,6]. Crack formation not only affects the safety and reliability of a building structure, but also seriously deteriorates its durability and normal use functions [7,8]. Indeed, even “harmless” cracks can affect the appearance of a building and cause fear and anxiety among users [9,10,11]. Therefore, when cracks in concrete structures become visible, they must be repaired to ensure that the structures remain safe, reliable, and durable [12,13,14,15].
The slotting filling method is applicable in cases where the structure to be repaired features small cracks with large widths, such as the cracks of pier or pavement concrete [16,17]. In this method, a chisel and flat shovel are used to create a U-shaped groove along the crack, with a groove depth and width of approximately 3–5 cm. A brush is then used to evenly coat a layer of interface treatment slurry at the bottom and two walls of the groove. A mixed polymer cement mortar is then pressed into the groove with a spatula, compacted, and wiped flat before the slurry hardens. Grouting is another commonly used crack repair method, and grouting materials can be mainly divided into inorganic and organic materials [18,19,20,21,22]. Epoxy-based grouting materials are widely used in the industry, owing to their many advantages, including good stability, room-temperature curing, minimal shrinkage, and strong bonding force; thus, these materials are considered highly effective reinforcement materials [23,24]. When grout is filled into concrete cracks, the two sides of the crack are closely bonded together, thereby restoring the integrity of the structure. Moreover, because of the high bond strength and cohesive properties of the grout, the repaired concrete is stronger than the original concrete. However, the high viscosity of epoxy resin limits its use for filling tiny cracks. Thus, grouting equipment is required to achieve a certain pressure that can push the resin into the cracks [17,25]. Electrochemical deposition has been proposed as a repair method for marine reinforced concrete cracking. This method employs a steel bar as a cathode and a titanium plate in salt solution as an anode [26,27]. Under a direct current, cations in the salt solution accumulate in the concrete cracks and salt deposits are generated to fill the cracks via a series of chemical reactions [28,29,30]. Because cracks affect the mechanical properties of concrete structures, using a reinforcement method to treat the concrete structure is necessary [31,32]. The following methods are commonly used to enhance the mechanical properties of concrete structures: increasing the load surface area of the concrete structure, applying steel plates at the corners of the structure [33,34], prestressing [35], adding a fulcrum, and spraying concrete [36,37,38].
The repair methods described above are applicable to different fields and, thus, can be implemented according to the needs of a project. Rust expansion cracking is a special cracking form observed in concrete structures; this type of cracking is accompanied by steel corrosion and, thus, is quite harmful to building structures [39,40]. To address this type of damage, Wang et al. [41] proposed the electrophoretic deposition repair method. In this method, an electric field is used to electrophorese cationic ammonium epoxy resin curing agent molecules filled into corrosive cracks. After restoration, the epoxy deposited on the surface and inner cracks of the concrete will be cured; thus, the durability properties of the original reinforced concrete are enhanced. In addition, Wang et al. explored the influence of concentration of repair solution, temperature [42], type of epoxy resin [43], and type of anode material [44] on the repair effect and the corresponding influence mechanism. It was pointed out that, when the solution concentration was 0.05–0.2 mol·L−1, the higher the solution concentration, the faster the repair effect was. In addition, when the solution temperature was controlled at 20–30 °C and a graphite plate was selected as anode material, the repair effect was relatively better.
Reasonable repair time can not only guarantee the repair effect, but also control the repair cost, but the impact of repair time on carbonation resistance and water resistance of repaired concrete is not clear, and there is also a lack of relevant research on the basic repair principle of electrophoretic deposition method. Therefore, this study mainly adopts accelerated carbonation test and water absorption test to explore the influence of repair time on carbonation resistance and water resistance of repaired concrete, and these were combined with SEM, TG-DSC analysis, and other testing methods to explain the repair principle. The results of this investigation could lay a strong foundation for the application of this method to engineering tasks.
2. Materials and Test Methods
2.1. Preparation of Repair Solution
The epoxy resin repair solution was prepared by mixing cationic epoxy resin solution with cationic ammonia curing agent solution. Cationic epoxy resin is obtained by the chemical modification of epoxy resin. The specific synthesis method is as follows:
Step 1: Add a certain amount of epoxy resin (E-51type) to the four-necked flask. Raise the temperature to 60 °C and stir continuously with a self-stirring paddle.
Step 2: Slowly add diethanolamine to it at 60 °C under nitrogen, and increase the temperature to 70 °C for 180 min after dropping.
Step 3: After the temperature drops to 60 °C, begin to slowly added anhydrous acetic acid dropwise, and stop the reaction after continuous stirring for 30 min.
The mole ratio of anhydrous acetic acid, diethanolamine, and epoxy resin was 0.8:1:1. The synthesis method of cationic epoxy resin is shown in Figure 1.
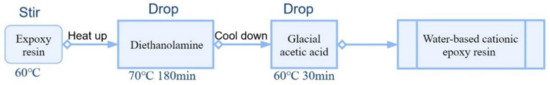
Figure 1.
Synthesis method of cationic epoxy resin.
The synthesis of cationic epoxy curing agent can be divided into three main steps as follows:
Step 1: Under the condition of nitrogen protection, add epoxy resin (E-51type) slowly into a four-necked flask filled with trethylenetetramine at 70 °C and stir for 180 min.
Step 2: Drop benzyl glycidyl ether into the flask at 75 °C for 180 min.
Step 3: Drop anhydrous acetic acid into the flask after lowering the reaction temperature to 60 °C, and stop heating after 30 min of reaction.
The molar ratio between triethylene tetramine, epoxy resin, benzyl glycidyl ether, and anhydrous acetic acid was 2.1:1:2.2:2.1. The synthesis method of cationic ammonia curing agent is shown in Figure 2.
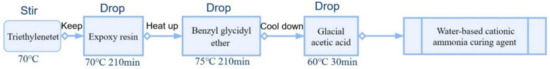
Figure 2.
Synthesis method of curing agent.
Cationic epoxy resin solution with 0.1 mol·L−1 epoxy group concentration and curing solution with 0.1 mol·L−1 amine hydrogen concentration were prepared by adding deionized water to cationic epoxy resin and curing, respectively. The basic properties of the two solutions are shown in Table 1. The epoxy resin repair solution was prepared by mixing the two solutions with equal mass; the concentration of repair solution used in this study was 0.1 mol·L−1.

Table 1.
Basic properties of solutions.
2.2. Preparation of Rust-Cracked Mortar Specimen
Firstly, a smooth circular steel bar with diameter of 6 mm, cement of PI 42.5 grade, sand of ISO standard China, and tap water were used to prepare a reinforced cement mortar specimen with a size of 40 × 40 × 160 mm3. The mass ratio of water, sand, and cement, was 0.5:3:1. Table 2 shows the chemical composition of the cement. The steel wire was then welded to the end of the rebar, and the exposed surfaces were sealed with polyurethane adhesive, leaving one surface for rust cracking. The samples were transferred to a 5% concentration salt solution, with a graphite rod as the anode and a reinforcement as the cathode. A test specimen with a crack width of 0.6 mm was fabricated using a DC current of 0.2 A·m−2.
Table 2.
Chemical composition of cement (wt%).
2.3. Electrophoretic Deposition Test Method
The graphite plate (120 × 130 × 5 mm3) was placed at the bottom of the liquid container (210 × 120 × 160 mm3), the prepared specimen was placed on the steel wire frame above the liquid container, and the surface of the specimen and graphite plate distance was 10 mm. Then, the prepared epoxy repair solution was poured into the container. Finally, the corroded steel bar and graphite board were used as cathode and anode to connect the DC power supply. During the repair process, the voltage was set to 40 V and the maximum current was 0.25 A. Each specimen was repaired at 20 °C for 24 h; the repair solution was configured and used on site. Figure 3 is a schematic diagram of the experimental setup.
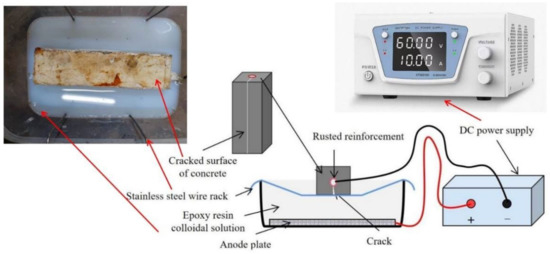
Figure 3.
Schematic illustration of the experimental setup.
3. Test Methods
3.1. Mass Increment Test
The weight of specimens was measured by an electronic balance at different repair times. Formula (1) is the calculation formula of mass increment.
where Wt (kg·m−2) is mass increment; M0 (kg) and Mt (kg) are the average mass of each specimen before and after repair; and S (m2) is the crack surface area of the specimen
3.2. Crack Filling Depth and Surface Deposition Thickness of Epoxy Resin
The upper surface of the split mortar specimen and epoxy resin–mortar interface are used as the upper and lower boundary. The distance between the upper and lower boundaries was measured with a vernier caliper, and the mean was the epoxy filling depth. The total thickness of repaired specimens was measured every 2 cm with vernier calipers; the deposition thickness of epoxy resin can be obtained by comparing the thickness of specimens before and after repair.
3.3. Resistance
The real-time current in the trial repair process was monitored, and the mortar resistance in the repair process was calculated using Formula (2).
where R (R) is the mortar resistance, U (V) is the setting voltage value, and It (A) is the current value at different times in the repair process; the average value of three specimens was considered the test value.
3.4. Ultrasonic Velocity Test
Refer to standard [45] after cleaning the parts to be tested. Using industrial-grade Vaseline as a lubricating coupling agent, the sensor was placed at the test position on both sides of the specimens. Each test point was tested 10 times; the unit of sound velocity was 0.001 km/s.
3.5. Water Absorption Test of Specimen
The specimen was placed in the oven and dried to constant weight at 40 °C. Then, the specimen was taken out and its crack face down invaded the water by 2 mm, and was weighed at the set time. The calculation formula of water absorption is shown in Formula (3).
where I (kg·m−2) is water absorption per unit area; Mt (kg) and M0 (kg) are the mass of the specimen at the beginning and after the test, respectively; and A (m2) is the immersion surface area of the specimen.
3.6. Accelerated Carbonization Depth Test
The test was carried out according to standard [46]; the repaired specimens were put into the carbonization chamber to accelerate carbonization, and the temperature, humidity, and carbon dioxide concentration were set at 20 °C, 70% and 20%, respectively. After 56 days of accelerated carbonization, the specimen was split with a chisel and sprayed with 1% phenolphthalein ethanol solution on the splitting surface of the sample. After the solution evaporated, the upper and lower boundaries of the purple region of the splitting surface were measured with vernier calipers as the carbonization depth.
3.7. Microstructural Analysis
The microscopic morphology of the samples was analyzed using a ZEISS Gemini 300 scanning electron microscope. The specimen was crushed with a press, and the sample with a size of about 10 × 10 × 10 mm3 and a mass of about 3 g was found for the hole structure test. The test instrument is a high-performance automatic mercury injection instrument with a maximum mercury intrusion pressure of 210 MPa and contact angle of 130°.
3.8. Differential Thermal Scanning and X-ray Diffraction Analysis
TG-DSC analysis was carried out under nitrogen protection, and the heating rate was 10 °C/min. XRD of the samples was tested using a Bruker D8 Advance Powder machine (manufacture: Germany Bruker: producing place: Berlin, Germany).
4. Results and Discussion
4.1. Crack Surface Morphology
Figure 4 shows evolution in the crack surface morphology of the mortar during repair. In the repair process, cationic epoxy resin molecules and curing agent molecules under the electric field drive continuously to the crack and surface electrophoresis deposition, so that the crack of mortar gradually healed, and epoxy resin film thickness gradually increased and tended to be uniform. The newly deposited epoxy resin was mainly milky gelatinous substance, which was eventually transformed into light-yellow epoxy resin curing substance with the extension of repair time. It can be seen from the picture that there are some holes on the surface of the epoxy resin cover. Through observation, we believe that there are three reasons. Firstly, there are some holes on the surface of the mortar, and the epoxy resin will sink into the holes. Secondly, the anode graphite plate electrolyzes water to produce oxygen, and oxygen bubbles float to the surface of the specimen from the bottom, resulting in epoxy resin loss in local areas, resulting in small holes. Finally, the cathode-corroded rebar will electrolyze water to produce hydrogen, which creates small holes in the crack area. Therefore, in pursuit of better repair effect, the concrete surface can be treated to reduce its surface holes, and the voltage should be appropriately reduced in the repair process, so as to avoid a large number of bubbles on the surface of the anode and cathode, resulting in uneven deposition of epoxy resin molecules on the surface of concrete.
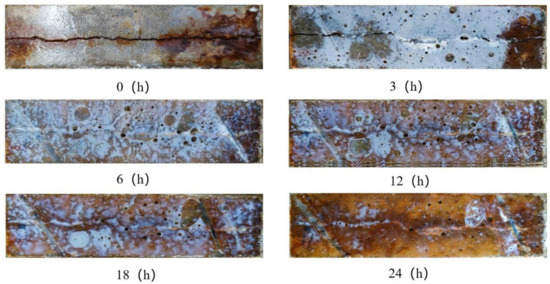
Figure 4.
Crack surface morphology.
4.2. Mass Increment and Resin Film Thickness
Figure 5 shows statistics of the mass increment of the mortar and thickness of the epoxy resin film during the repair process. The mass growth of the mortar is positively correlated with the thickness of the epoxy resin film. Specifically, the greater the mass increment of the mortar, the thicker the epoxy film. A positive correlation could be observed between the mass growth rate of the mortar and the epoxy resin film growth rate. During the first 12 h of repair, the mass increase rate of the mortar and the epoxy resin film thickness increased rapidly, after which the growth rates gradually decreased. Figure 4 shows that the increase in epoxy resin deposition on the mortar is responsible for the increase in the mass and resin film thickness of the mortar.
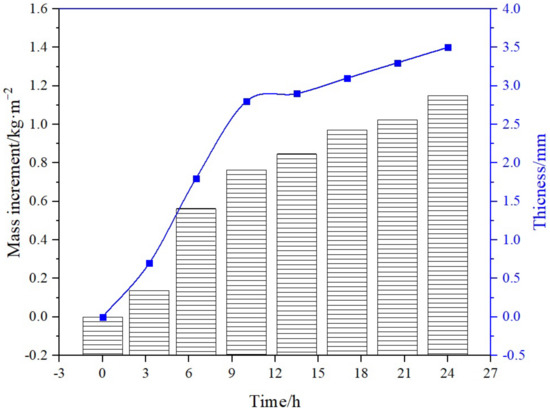
Figure 5.
Mass increment and resin film thickness.
4.3. Resistance
Figure 6 shows the change in the overall resistance of the reinforced mortar during the repair process. It can be seen that the resistance of the mortar keeps increasing with the increase in the repair time. Figure 4 shows that epoxy resin will be deposited on the surface and cracks of mortar in the repair process. As epoxy resin is an insulating material, the resistance of reinforced mortar system deposited with epoxy resin will increase. It can be seen from Figure 5 that the quality and thickness of epoxy resin on the mortar specimen in the repair process keep increasing, so its total resistance keeps increasing.
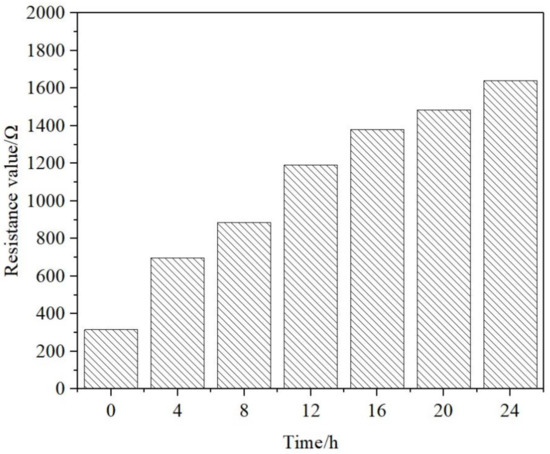
Figure 6.
Resistance.
4.4. Ultrasonic Velocity
Figure 7 shows the variation in the ultrasonic sound velocity of the rust-expanded cracking mortar over time. The ultrasonic velocity can make known the compactness of a specimen. The larger the defect and crack within a specimen, the slower the sound velocity. As shown in Figure 7, the ultrasonic speed of the specimen gradually increased during the repair process, indicating that, as the repair time increases, the cracks inside the mortar are slowly filled and compacted. Moreover, the ultrasonic velocity of the specimen increased rapidly up to 12 h before repair but slowed down 12 h after repair. Only slight differences between the sonic velocities of the specimen were observed 18 and 24 h after repair, indicating that the two specimens had similar compactness.
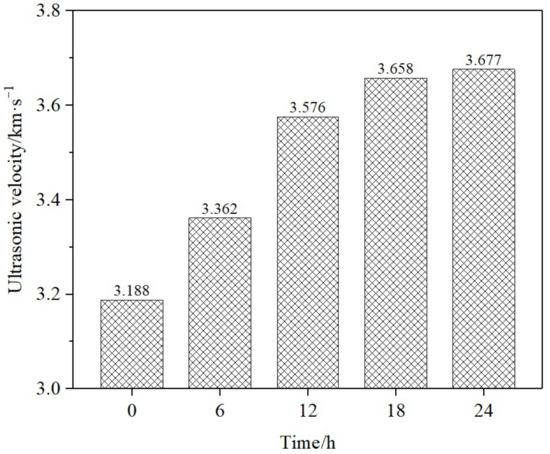
Figure 7.
Ultrasonic velocity.
4.5. Crack Filling Depth
To observe the filling of epoxy resin into rust-expanded cracks, we split the specimens along their cracks and cut them with a cutting machine. Figure 8 shows the filling situation of epoxy resin to mortar cracks at different times, and the statistics of the average filling depth of epoxy resin in each mortar crack are shown in Table 3. Corresponding to the electrophoretic deposition repair duration of 6, 12, 18, and 24 h, the mortar specimen numbers were P-T-6, P-T-12, P-T-18, and P-T-24, respectively. As can be seen in Figure 8 and Table 3, longer repair times led to wider deposition ranges of resin in the cracks, larger filling depths, and better filling effects. After 12 h of repair, the filling speed of resin slowed down, and the filling depths of the P-T-18 and P-T-24 were similar. This finding indicates that the deep cracks of the mortar cannot easily be filled with the cationic curing agent and cationic epoxy resin in the repair solution by using electrophoretic deposition, which agrees with the results of the ultrasonic sound velocity test. The filling of cracks by the epoxy resin increased the compactness of the mortars and their ultrasonic sound velocity. After 18 and 24 h of restoration, the filling depths of epoxy resin in the cracks were similar; thus, the ultrasonic sound velocities of the mortars at these time points were also similar.
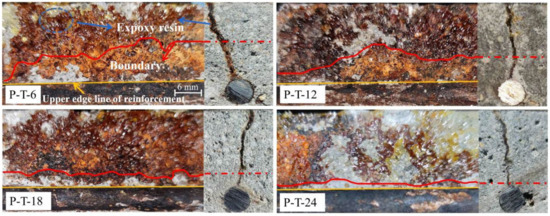
Figure 8.
Epoxy resin filling in cracks.
Table 3.
Average filling depth of resin for mortars.
4.6. Accelerate Carbonization Depth and Water Absorption
Figure 9 shows changes in the accelerated carbonization depths of the repaired mortars observed over 112 d. The accelerated carbonization depths of the repaired mortars decreased and their carbonization resistance improved with increasing repair time. After 112 d of carbonization, the accelerated carbonization depths of the P-T6, P-T-12, P-T-18, and P-T-24 mortars were 0.48, 0.38, 0.20, and 0.14 mm, respectively. The uncracked mortar carbonation depth was up to 5.2 mm, indicating that the carbonization resistance of mortars after electrophoretic deposition repair was significantly improved. Figure 10 shows the influence of the repair time on the water absorption of the repaired mortars. Compared with the cracked mortar without repair, the waterproofing performance of the repaired mortars was significantly improved, and longer repair times decreased the water absorption rates of the mortars. The maximum water absorption amounts of the P-T6, P-T12, P-T18, and P-T24 mortars were 0.435, 0.292, 0.135, and 0.089 kg∙m−2, respectively, which are significantly lower than that of the unrepaired mortar (1.391 kg∙m−2). The 7-day maximum water absorption amounts of the P-T12, P-T18, and P-T24 mortars were even lower than that of the uncracked mortars (0.375 kg∙m−2).
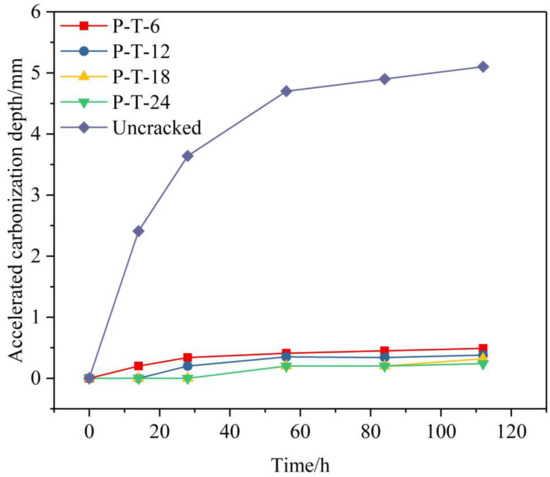
Figure 9.
Accelerated carbonization depth of different mortars.
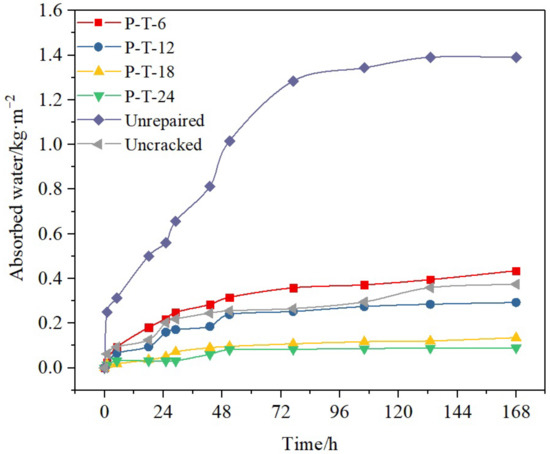
Figure 10.
Water absorption of different mortars.
Figure 9 and Figure 10 also show that the maximum accelerated carbonization depths and maximum water absorption amounts of the P-T18 and P-T24 mortars are relatively similar. This finding indicates that increases in repair time do not greatly improve the anti-carbonation performance and water resistance of the mortars after 18 h of repair. Therefore, the electrophoretic deposition time can be shortened according to actual needs.
4.7. Microstructural Analysis
As shown in Figure 11, mortar at different positions of the mortar was selected for pore structure analysis. Figure 12 shows the distribution of pores of different diameters in each sample. Table 4 details the statistics of the total porosity and proportions of different pore sizes of each sample. Wu [47] classified holes into four categories according to the effect of pore size on concrete performance as follows: no harmful apertures (<20 nm), slightly harmful apertures (20–50 nm), harmful apertures (50–200 nm), and strongly harmful apertures (>200 nm). The lower the total porosity of mortar, the fewer the number of harmful holes, indicating improved concrete performance. Table 4 shows that, compared with the mortar at the crack edges of the unrepaired mortar, the total porosity and proportion of harmful pores of the surface mortar (Repaired-S) and mortar around the original cracks (Repaired-C) of the repaired mortar significantly decreased after electrophoretic deposition. Moreover, the decrease in amplitude of the total porosity of the Repaired-S sample was 6.42%, which is higher than that of the Repaired-C sample (4.67%).
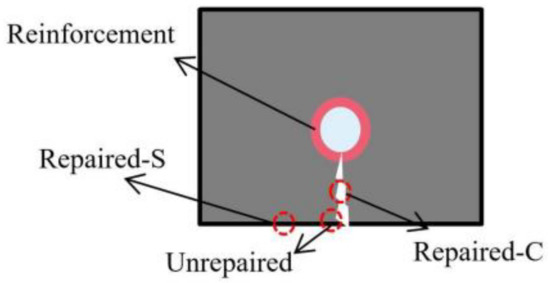
Figure 11.
Schematic diagram of sampling location for pore size analysis.
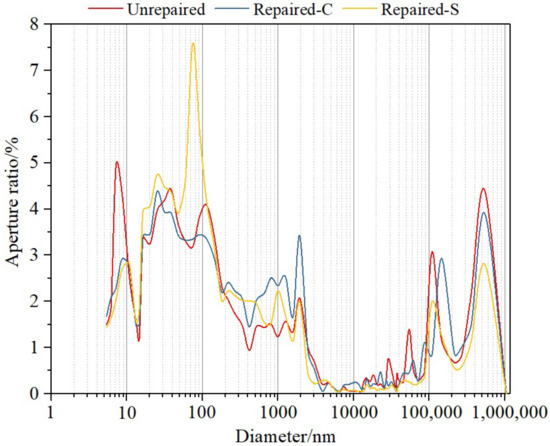
Figure 12.
Pore size distribution of different samples.
Table 4.
Porosity distribution of different samples (%).
According to the results of the pore structure test, the overall porosity and proportion of harmful pores in the surface area of the mortar decreased after repair, indicating that the internal structure of the surface mortar was dense. In this case, external gas and liquid cannot come into contact with the internal mortar through the surface pores, which could explain the improvement in the carbonization and waterproofing performance of the mortar after repair. Figure 13 shows the microscopic morphology of the deposited resin layer. The structure of the cured epoxy resin is extremely dense. This dense structure can help the epoxy resin deposited on the crack surface of the mortar (Figure 4) resist the invasion of external erosion media, which is another important factor for the improved anti-carbonation and waterproofing performance of the repaired mortar. Figure 5, Figure 7 and Figure 8 show that longer repair times increase the thickness of the epoxy resin film deposited and improve its filling effect on cracks. Thus, the greater the improvement of the anti-carbonation performance and waterproofing performance of the mortar.
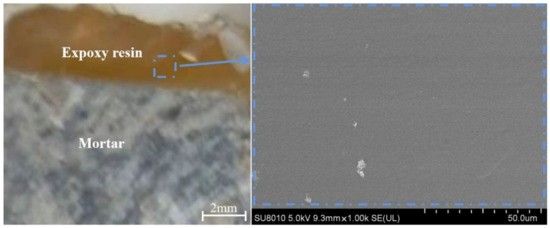
Figure 13.
Microstructure of epoxy resin film.
4.8. Analysis of Components
Figure 14 shows the XRD patterns of the surface mortar before and after restoration; here, Q represents the peak of silica and P represents the peak of calcium hydroxide. No significant change in the mineral phase composition of the concrete within the mortar was observed before and after restoration. This finding indicates that electrophoretic deposition exerts no significant effect on the mineral phase composition of the mortar, likely because the repair solution is only weak alkaline (Table 1) and the repair time is only 24 h.
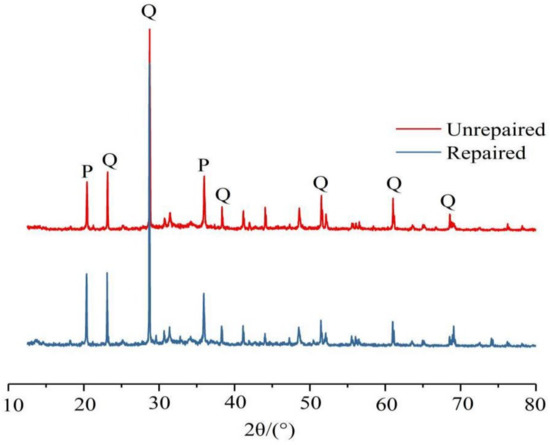
Figure 14.
XRD patterns of mortar samples before and after repair.
Figure 15a,b, respectively, show the TG-DSC curves of the surface mortar of the mortars before and after electrophoretic deposition and restoration. The quality loss of the mortar samples before repair is mainly distributed in three temperature ranges of 31–91 °C, 417–448 °C, and 557–700 °C. The mass loss of the cement mortar in the range of 50–250 °C is mainly related to the loss of physically bound water. The mass loss in the range of 350–500 °C is mainly related to the decomposition of calcium hydroxide and the loss of water bound to the C-S-H gel. Finally, the mass loss in the temperature range above 550 °C is mainly related to the decomposition of some carbonates [48]. Comparison of the TG curves before and after repair indicated that the mass loss ratio of the repaired mortar is approximately 20%, which is significantly higher than that of the unrepaired mortar (14%). This difference in mass ratio may be attributed to the decomposition of some cationic epoxy resin and curing agent molecules that had penetrated into the interior of the mortar during repair after high-temperature heating. Figure 15b shows that the mass loss of the repaired mortar samples is mainly distributed in four temperature ranges, that is, one more temperature range (265–326 °C) than unrepaired mortar. The occurrence of endothermic reactions in this range is related to the decomposition of the organic epoxy resin. Owing to cationic epoxy resin and curing agent molecules being hydrophilic, some water may enter the mortar along with these molecules. Thus, a comparison of these two figures (Figure 15a,b) reveals that the proportion of physically bound water in the repaired mortar (2.26%) is significantly higher than that in the unrepaired mortar (0.96%) in the range of 50–250 °C. TG-DSC analysis showed that the decrease in the porosity and the proportion of harmful pores in the surface mortar after repair is related to the infiltration and filling of the molecules from repair solution. Because the surface of the mortar was located on the vertical plane of the electrophoresis direction of colloidal particles, the porosity of the sample in this position is lower than that in the internal crack area.
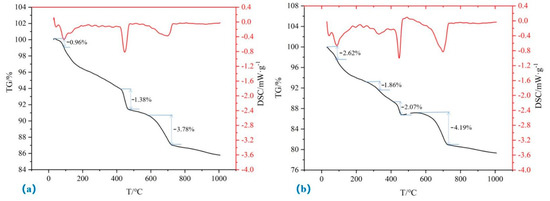
Figure 15.
TG-DSC spectra of mortar samples before and after repair.
4.9. Physical and Chemical Principle of Electrophoretic Deposition
Figure 16 shows a schematic of the electrophoretic deposition repair process. According to our observation of the whole repair process and the analysis above, the repair process of electrophoretic deposition can be divided into three main stages as follows.
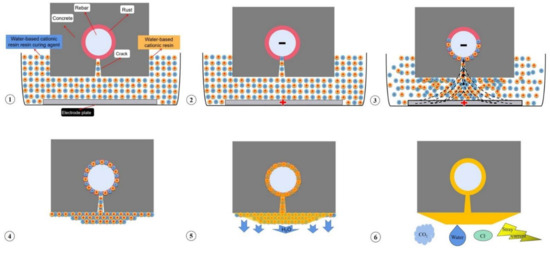
Figure 16.
Schematic diagram of electrophoretic deposition repair process.
Immersion Stage: as shown in Figure 16①, during the immersion stage, charged colloidal particles (i.e., cationic epoxy resin and ammonia curing agent molecules) in the repair solution come into contact with the corroded steel bar through the concrete cracks via osmosis and capillary adsorption with the help of aqueous solvents. This contact ensures that an electrical circuit can be formed between the corroded steel bar and anode material.
Repair Stage: as shown in Figure 16②, the corroded steel bar and anode plate are, respectively, used as the positive and negative poles of the electric field. An electric field is formed between these poles under a direct current. Because the electrical resistance is lowest inside cracks, the current density at this location is higher than that at the sides of the cracks. As shown in Figure 16③, under the action of an electric field force, the colloidal particles are electrophoresed. Because the cationic epoxy resin and curing agent molecules are positively charged, according to the like-charges-repel/unlike-charges-attract principle, they aggregate on the negative reinforcement. Given the high current density in the cracks, charged molecules are more likely to gather at these locations. When the charged molecules encounter steel bars or concrete, they cannot continue to electrophorese; instead, they gradually deposit and consolidate. As the molecules continue to accumulate, the epoxy resin layer changes from a milky colloidal state to a light-yellow solid state (Figure 4).
Curing Stage: when the cracks are completely plugged and the epoxy film gains sufficient thickness, the repair device is removed (Figure 16④) and the deposited wet epoxy film is exposed to air. As the water molecules evaporate, the distance between the deposited cationic epoxy resin and curing agent molecules decreases, and a tight accumulation is formed under the action of capillary pressure. The curing reaction between the two types of molecules is accelerated (Figure 16⑤), and the epoxy resin finally achieves consolidation hardening. The epoxy resin deposited in the cracks and on the surface of the reinforcement can bond the reinforced concrete damaged by rust expansion and cracking. The epoxy resin film deposited on the surface of the concrete can also prevent external erosive media (e.g., carbon dioxide, water, chloride ions, etc.) from coming into contact with the damaged concrete. In addition, it can be seen from Figure 6 that the resistance of the reinforced mortar system increases significantly after the repair, and, when the applied voltage is constant, the greater the resistance of the system, the smaller the current that can reach the internal reinforcement. Thus, it can be seen that electrophoretic deposition repair can improve the performance of the repaired specimen against stray current erosion (Figure 16⑥). Due to the crack location, the resistance is smaller and the molecular aggregation to the middle is easier. Therefore, when the repair work is completed, the epoxy resin film deposited on the surface of the concrete presents an inverted trapezoidal distribution that is thick in the middle and thin at both ends.
5. Conclusions
Electrophoretic deposition method is a new method for the repair of rust-cracked reinforced concrete; it can be seen from the test results that this method can not only seal concrete cracks, but also form epoxy resin protective film on the concrete surface and improve the performance of the reinforced concrete system against the overall performance of the hybrid current, carbonization resistance, and waterproof performance, and the method can be repaired within 24 h. Other repair methods cannot simultaneously achieve the repair goal of this method. In this study, the influence of repair time on the waterproofing and carbonization resistance of the cracking reinforced mortar specimens repaired by electrophoretic deposition was explored, and the improvement principle of the two properties of repaired specimens was analyzed and explained by using MIP, SEM, and other test methods. Finally, based on the observation of the experimental process and the analysis of the experimental results, this paper summarizes three main stages of the electrophoretic deposition repair process. Obtaining a comprehensive understanding of the repair principle of electrophoretic deposition is necessary to enable the reasonable development and application of this method. Moreover, the corresponding repair equipment and process must be further designed and optimized to establish the applicability of this method. The main conclusions of this study are as follows:
- Longer electrophoretic deposition repair time increases the thickness of the resin film on the mortar surface, the filling depth of resin in the cracks, the resistance of the mortars, the more obvious the anti-carbonation, waterproof performance, and anti-stray current ability of the mortar are improved. However, the maximum carbonization depth and water absorption of specimens after 18 h and 24 h of repair are not very different, so the repair time can be appropriately shortened according to actual needs and cost consideration.
- After electrophoretic deposition repair, the epoxy resin penetrates into the interior of the mortar, and the porosity and number of harmful pores on the mortar surface and inside edges of cracks decrease. After electrophoretic deposition, epoxy resin penetrates into the mortar and fills the harmful pores in the mortar, reducing the porosity and the number of harmful pores on the mortar surface and the inner edge of cracks. In addition, the generated epoxy resin film has a dense structure. These findings can well explain the observed improvements in the carbonization and waterproofing performance of the specimens after repair.
- The physical and chemical processes of electrophoretic deposition restoration can be divided into three stages. During the immersion stage, the solution penetrates into the cracks and comes into contact with the steel bars, thereby laying a foundation for electrophoretic deposition repair. During the repair stage, an electric field is generated, and the charged cationic curing agent and cationic epoxy resin molecules are deposited onto the mortar surface by electrophoresis under the action of this force. During the curing stage, the water between deposited molecules slowly evaporates, and the epoxy resin is gradually consolidated and hardened.
Author Contributions
Conceptualization, Y.W.; methodology, Y.W.; validation, C.W.; formal analysis, Y.W.; investigation, Y.W.; data curation, S.Z.; writing—original draft preparation, Y.W.; writing—review and editing, Y.W.; visualization, C.W.; supervision, S.Z. All authors have read and agreed to the published version of the manuscript.
Funding
This work was supported by the National Nature Science Foundation of China (Grant No. 51778485 and 51608384).
Acknowledgments
We would like to thank Zhiting Qian, Zipei Zhou, Haibo Jiang, and Wenjie Ma for their help with preparing the experiment. We also would like to thank Congfeng Zong from Shiyanjia Lab (www.shiyanjia.com, accessed on 1 June 2022) for the TG-DSC analysis.
Conflicts of Interest
The authors declare that they have no known competing financial interests or personal relationships that could have appeared to influence the work reported in this paper.
References
- Kwon, S.J.; Na, U.J.; Sang, S.P.; Sang, H.J. Service life prediction of concrete wharves with early-aged crack: Probabilistic approach for chloride diffusion. Struct. Saf. 2009, 31, 75–83. [Google Scholar] [CrossRef]
- Chitte, C. Study on Causes and Prevention of Cracks in Building. Int. J. Eng. Sci. 2018, 6, 452–460. [Google Scholar] [CrossRef]
- Qiao, X.; Chen, J. Correlation of propagation rate of corrosive crack in concrete under sulfate attack and growth rate of delayed ettringite. Eng. Fract. Mech. 2019, 209, 333–343. [Google Scholar] [CrossRef]
- Korte, S.; Boel, V.; Corte, W.D.; Schutter, G.D. Behaviour of fatigue loaded self-compacting concrete compared to vibrated concrete. Struct. Concr. 2015, 15, 575–589. [Google Scholar] [CrossRef]
- Raghavendra, D.S.; Sivasubramanian, K.; Sivakumar, A.; Hareesh, M. Experimental evaluation of crack depth in concrete specimens using time-of-flight technique. J. Struct. Eng. 2016, 43, 311–318. [Google Scholar] [CrossRef]
- Zhang, Z.Q.; Li, Y.L.; Zhu, X.Y.; Liu, X.H. Meso-scale corrosion expansion cracking of ribbed reinforced concrete based on a 3d random aggregate model. J. Zhejiang. Univ-Sci. A 2021, 22, 924–940. [Google Scholar] [CrossRef]
- Trmpczyński, W.; Goszczyńska, B.; Bacharz, M. Acoustic emission for determining early age concrete damage as an important indicator of concrete quality/condition before loading. Materials 2020, 13, 3523. [Google Scholar] [CrossRef]
- Stewart, M.G.; Wang, X.; Nguyen, M.N. Climate change impact and risks of concrete infrastructure deterioration. Eng. Struct. 2011, 33, 1326–1337. [Google Scholar] [CrossRef]
- Khan, I.; François, R.; Castel, A. Prediction of reinforcement corrosion using corrosion induced cracks width in corroded reinforced concrete beams. Cem. Concr. Res. 2010, 40, 157–166. [Google Scholar] [CrossRef]
- Chen, H.P.; Alani, A.M. Optimized maintenance strategy for concrete structures affected by cracking due to reinforcement corrosion. Aci. Struct. J. 2013, 110, 229–238. [Google Scholar] [CrossRef]
- Song, X.F.; Wei, J.F.; He, T.S. A method to repair concrete leakage through cracks by synthesizing super-absorbent resin in situ. Constr. Build. Mater. 2009, 23, 386–391. [Google Scholar] [CrossRef]
- Morgan, R.D. Compatibility of concrete repair materials and systems. Constr. Build. Mater. 1996, 10, 57–67. [Google Scholar] [CrossRef]
- Wang, J.; Tittelboom, K.V.; Belie, N.D.; Verstraete, W. Use of silica gel or polyurethane immobilized bacteria for self-healing concrete. Constr. Build. Mater. 2012, 26, 532–540. [Google Scholar] [CrossRef]
- Mo, L.; Li, V.C. High-early-strength engineered cementitious composites for fast, durable concrete repair-material properties. Aci. Mater. J. 2011, 108, 3–12. [Google Scholar]
- Momayez, A.; Ehsani, M.R.; Rajaie, H. Comparison of methods for evaluating bond strength between concrete substrate and repair materials. Cem. Concr. Res. 2005, 35, 748–757. [Google Scholar] [CrossRef]
- Jiang, Z.W.; Long, G.C.; Sun, Z.P. Concrete Repair: Principles, Techniques and Materials; Chemical Industry Press: Hongkong, China, 2009; Available online: https://read.bookresource.net/pdf/4717.html (accessed on 1 June 2022).
- Bertolini, L.; Elsener, B.; Pedeferri, P.; Polder, R. Corrosion of Steel in Concrete: Prevention, Diagnosis, Repair; Wiley-vch Verlag Gmbh & Co. KGaA: Weinheim, Germany, 2013. [Google Scholar] [CrossRef]
- Wang, W.; Zhao, W.; Zhang, J.; Zhou, J. Epoxy-based grouting materials with super-low viscosities and improved toughness. Constr. Build. Mater. 2020, 267, 121104. [Google Scholar] [CrossRef]
- Hong, Z.J.; Zuo, J.P.; Zhang, Z.S.; Liu, C.; Liu, H.Y. Effects of nano-clay on the mechanical and microstructural properties of cement-based grouting material in sodium chloride solution. Constr. Build. Mater. 2020, 245, 118420. [Google Scholar] [CrossRef]
- Gallagher, S. Mechanical Resistance of Cracked Mass Concrete Repaired by Grouting: Experimental Study. Aci. Struct. J. 2012, 111, 799–807. [Google Scholar] [CrossRef]
- Liu, Y.H.; Yang, P.; Ku, T.; Gao, S.W. Effect of different nanoparticles on the grouting performance of cement-based grouts in dynamic water condition. Constr. Build. Mater. 2020, 248, 118663. [Google Scholar] [CrossRef]
- Bras, A.; Gião, R.; Lúcio, V.; Chastre, C. Development of an injectable grout for concrete repair and strengthening. Cem. Concr. Compos. 2013, 37, 185–195. [Google Scholar] [CrossRef] [Green Version]
- Wang, C.; Fan, Z.; Li, C. Preparation and engineering properties of low-viscosity epoxy grouting materials modified with silicone for microcrack repair. Constr. Build. Mater. 2021, 290, 123270. [Google Scholar] [CrossRef]
- Shu, X.; Zhao, Y.; Liu, Z.; Zhao, C. A study on the mix proportion of fiber-polymer composite reinforced cement-based grouting material. Constr. Build. Mater. 2022, 328, 127025. [Google Scholar] [CrossRef]
- Harrison, D.M. The Grouting Handbook, 2nd ed.; Gulf Professional Publishing: Houston, TX, USA, 2013; Available online: https://www.sciencedirect.com/book/9780884158875/the-grouting-handbook (accessed on 1 June 2022).
- Otsuki, N. Crack closure of reinforced concrete by electrodeposition technique. Cem. Concr. Res. 2002, 32, 159–164. [Google Scholar] [CrossRef]
- Ryu, J.S.; Otsuki, N. Rehabilitation of cracked reinforced concrete using electrodeposition method. J. Meteorol. Soc. Jpn. 2001, 50, 122–126. [Google Scholar] [CrossRef] [Green Version]
- Chu, H.; Jiang, L.; Song, Z.; Xu, Y.; Zhao, S.; Xiong, C. Repair of concrete crack by pulse electro-deposition technique. Constr. Build. Mater. 2017, 148, 241–248. [Google Scholar] [CrossRef]
- Otsuki, N.; Nishida, T.; Minagawa, H.; Yodsudjai, W. Investigation of durability of reinforced concrete member on land repaired by electrodeposition method. J. Meteorol. Soc. Jpn. 2002, 51, 1278–1283. [Google Scholar] [CrossRef]
- Yan, Z.; Chen, Q.; Zhu, H.; Ju, J.W.; Zhou, S.; Jiang, Z. A multi-phase micromechanical model for unsaturated concrete repaired using the electrochemical deposition method. Int. J. Solids. Struct. 2013, 50, 3875–3885. [Google Scholar] [CrossRef] [Green Version]
- Jiang, Y.; Chen, H.; Nie, X.; Tao, M. Experimental study on bond and anchorage of steel bars in precast concrete structures with new-to-old concrete interface. Eng. Struct. 2021, 247, 113086. [Google Scholar] [CrossRef]
- Ronanki, V.S.; Aaleti, S. Experimental and analytical investigation of UHPC confined concrete behavior. Constr. Build. Mater. 2022, 325, 126710. [Google Scholar] [CrossRef]
- Almassri, B.; Halahla, A.M. Corroded RC beam repaired in flexure using NSM CFRP rod and an external steel plate. Structures 2020, 27, 343–351. [Google Scholar] [CrossRef]
- Hasan, M.A.; Akiyama, M.; Kashiwagi, K. Flexural behaviour of reinforced concrete beams repaired using a hybrid scheme with stainless steel rebars and CFRP sheets. Constr. Build. Mater. 2020, 265, 120296. [Google Scholar] [CrossRef]
- Sanchez, M.; Faria, P.; Ferrara, L.; Horszczaruk, E.; Jonkers, H.M.; Kwiecien, A.; Mosa, J.; Peled, A.; Pereira, A.S.; Snoeck, D. External treatments for the preventive repair of existing constructions: A review. Constr. Build. Mater. 2018, 193, 435–452. [Google Scholar] [CrossRef] [Green Version]
- Huang, B.T.; Li, Q.H.; Xu, S.L. Strengthening of reinforced concrete structure using sprayable fiber-reinforced cementitious composites with high ductility. Compos. Struct. 2019, 220, 940–952. [Google Scholar] [CrossRef]
- Gokyigit-Arpaci, E.Y.; Oktay, D.; Yuzer, N.; Ulukaya, S.; Eksi-Akbulut, D. Performance evaluation of lime-based grout used for consolidation of brick masonry walls. J. Mater. 2019, 31, 04019059. [Google Scholar] [CrossRef]
- Xu, S.; Mu, F.; Wang, J.; Li, W. Experimental study on the interfacial bonding behaviors between sprayed uhtcc and concrete substrate. Constr. Build. Mater. 2019, 195, 638–649. [Google Scholar] [CrossRef]
- Cairns, J.; Plizzari, G.A.; Du, Y.; Law, D.W.; Franzoni, C. Mechanical properties of corrosion-damaged reinforcement. Aci. Mater. J. 2005, 102, 256–264. [Google Scholar] [CrossRef]
- Zhao, Y.; Jiang, Y.; Hu, B.; Jin, W. Crack shape and rust distribution in corrosion-induced cracking concrete. Corros. Sci. 2012, 55, 385–393. [Google Scholar] [CrossRef]
- Wang, C.; Wang, Y.; Liu, K.; Zhou, S. Effect of colloid solution concentration of epoxy resin on properties of rust-cracked reinforced concrete repaired by electrophoretic deposition. Constr. Build. Mater. 2022, 318, 126184. [Google Scholar] [CrossRef]
- Wang, Y.; Liu, K.; Wang, C.; Zhou, S. Influence of solution concentration and temperature on the repair effect for electrophoretic deposition of rust-cracked reinforced concrete. J. Build. Eng. 2022, 56, 104772. [Google Scholar] [CrossRef]
- Wang, Y.; Liu, K.; Wang, C.; Zhou, S. Influence of cationic epoxy resin type on electrophoretic deposition effect on repair of rust-cracked reinforced concrete. Constr. Build. Mater. 2022, 324, 126714. [Google Scholar] [CrossRef]
- Wang, Y.; Wang, C.; Zhou, S.; Liu, K. Influence of anode material on the effect of electrophoretic deposition for the repair of rust-cracked reinforced concrete. Constr. Build. Mater. 2022, 335, 127466. [Google Scholar] [CrossRef]
- China Association for Engineering Construction Standardization. Technical Specification for Inspection of Concrete Defects by Ultrasonic Method; CECS 21:2000; China Architecture & Building Press: Beijing, China, 2001. [Google Scholar]
- China Academy of Building Research. Standard for Test Methods of Long-term Performance and Durability of Ordinary Concrete; GB/T 50082-2009; China Architecture & Building Press: Beijing, China, 2009. [Google Scholar]
- Wu, Z.W. An Approach to the Recent Trends of Concrete Science and Technology. J. Chin. Ceram. Soc. 1979, 7, 262–269. [Google Scholar]
- Pelisser, F.; Gleize, P.J.P.; Mikowski, A. Structure and micro-nanomechanical characterization of synthetic calcium–silicate–hydrate with Poly(Vinyl Alcohol). Cem. Concr. Compos. 2014, 48, 1–8. [Google Scholar] [CrossRef]
Publisher’s Note: MDPI stays neutral with regard to jurisdictional claims in published maps and institutional affiliations. |
© 2022 by the authors. Licensee MDPI, Basel, Switzerland. This article is an open access article distributed under the terms and conditions of the Creative Commons Attribution (CC BY) license (https://creativecommons.org/licenses/by/4.0/).