1. Introduction
In the process of the continuous improvement of China’s highway and railway transportation system, a large number of tunnels have needed to be constructed in the loess strata [
1]. However, due to the macropore characteristics of loess soil and its structural features [
2,
3], the surrounding rock pressure is different in loess tunnels than that of rock [
4,
5]. Several disasters generally occur in the construction of loess tunnels, such as lining cracks, water seepage, tunnel collapses, and even ground cracks in shallow tunnels [
6,
7,
8,
9,
10,
11]. The reasons for these disasters have been the inadequate understanding of the surrounding rock and the fact that the surrounding rock pressure used at the design stage of the lining structure was not the same as in the actual model [
12,
13,
14,
15]. After excavation, along with the release of surrounding rock stress, the rock around the outline of tunnels deformed into the tunnel [
16,
17]. The deformation of the surrounding rock was restrained after the support structure was applied, and the load acted on the support structure, generating the surrounding rock pressure [
18,
19].
For shallow tunnels, calculation methods based on stress transfer and pillar self-weight have been proposed. In deep tunnels, due to the existence of tensile stress at the top of the cavern after excavation, some of the rock masses lose their stability and slip downward and eventually collapse. After collapsing, the rock mass would no longer slide downward and was in a new equilibrium state [
20,
21,
22]. Therefore, the surrounding rock pressure in deep tunnels is usually not related to the cover depth. In China, Terzaghi’s theory [
23], Protodyakonov’s theory [
24], and China’s Specifications for Design of Highway Tunnels [
25] (SDHT) are often used as the calculation method for surrounding rock pressure.
In Terzaghi’s theory, based on the limit equilibrium theory, the minimum surrounding rock pressure required to maintain the stability of the soil is obtained when the soil above the tunnel is about to fail. In Protodyakonov’s theory, the surrounding rock pressure is the weight of the soil between the pressure arching and the lining, and the vertical stress along the arch axis has zero effect on the bending moment at the crown. In SDHT, the surrounding rock pressure is the weight of the soil from the collapse contour to the crown. The surrounding rock on the collapse contour is in a damaged state, and the radial stress is zero.
Terzaghi’s theory takes soil as load without considering the bearing capacity of tunnel surrounding rock, which is often used in shallow tunnels. The theoretical basis of Protodyakonov’s theory and the SDHT are obtained by taking the rock tunnel as the research object. It is thought that when the cover depth is deep enough, the pressure arching could be formed after tunnel excavation. However, there is a lack of systematic research on whether pressure arching is formed after soil tunnel excavation and the formation conditions of pressure arching.
When the surrounding rock pressure calculation methods of rock tunnels are applied to a soil tunnel, what are the characteristics of the surrounding rock pressure and what are the differences between the surrounding rock pressure of soil tunnels and rock tunnels? It is necessary to analyze the surrounding rock pressure of the existing soil tunnels.
In this study, through statistical analysis of the surrounding rock pressure of loess tunnels in China, the characteristics of surrounding rock pressure were studied, the applicability of surrounding rock pressure calculation methods in soil tunnels were discussed, and a surrounding rock pressure calculation method based on statistical analysis was proposed.
2. Calculation Methods of Surrounding Rock Pressure
2.1. Terzaghi’s Theory
In the Terzaghi theory [
25], it is assumed that the rock mass is a loose medium, while containing certain cohesiveness. Tunnel excavation causes the surrounding soil to move down, and moving soil is subjected to resistance action on both sides. Overburdened pressure on the support structure originates in the moving soil, as shown in
Figure 1.
Terzaghi expressed that tunnel pressure is caused by the gravity of all upper strata of the tunnel and that the pressure is correlated with the gravity of the rock, the friction coefficient, and the cohesion of rock masses on both sides. The calculation formula for surrounding rock pressure is shown in Equation (1):
where
is the vertical uniform load acting on the supporting structure,
is the surrounding rock density,
H represents the depth of the tunnel,
is the half-span of the arch,
B is the span of the tunnel,
denotes height of the tunnel,
denotes the real internal friction angle of the rock mass,
is the cohesion of the rock mass, and
is the lateral pressure coefficient of the rock mass.
When Terzaghi’s theory is used to calculate soil pressure, the soil pressure tends to be constant when the soil cover depth, H, is not less than 5 ().
2.2. Protodyakonov’s Theory
Protodyakonov’s theory represents the situation where the rock mass, after being cut by joints, forms loose rock mass after excavation. These rock masses change their stress state and form pressure arching. Two sliding surfaces are generated along the direction of 45° −
/2 with the side wall of tunnels. A diagram of the calculation process is shown in
Figure 2. The surrounding rock pressure acting on the top of the tunnel is only the weight of the rock mass under the pressure arching. The rock mass of the pressure arching can only bear the compressive stress and can not bear the tensile stress.
where
denotes the calculated friction angle of the rock mass,
f is the rock solidity coefficient, and
represents the shear strength of rock mass.
According to Protodyakonov’s theory, the relationship for cover depth threshold
is as follows:
2.3. China’s Specifications for Design of Highway Tunnels (SDHT)
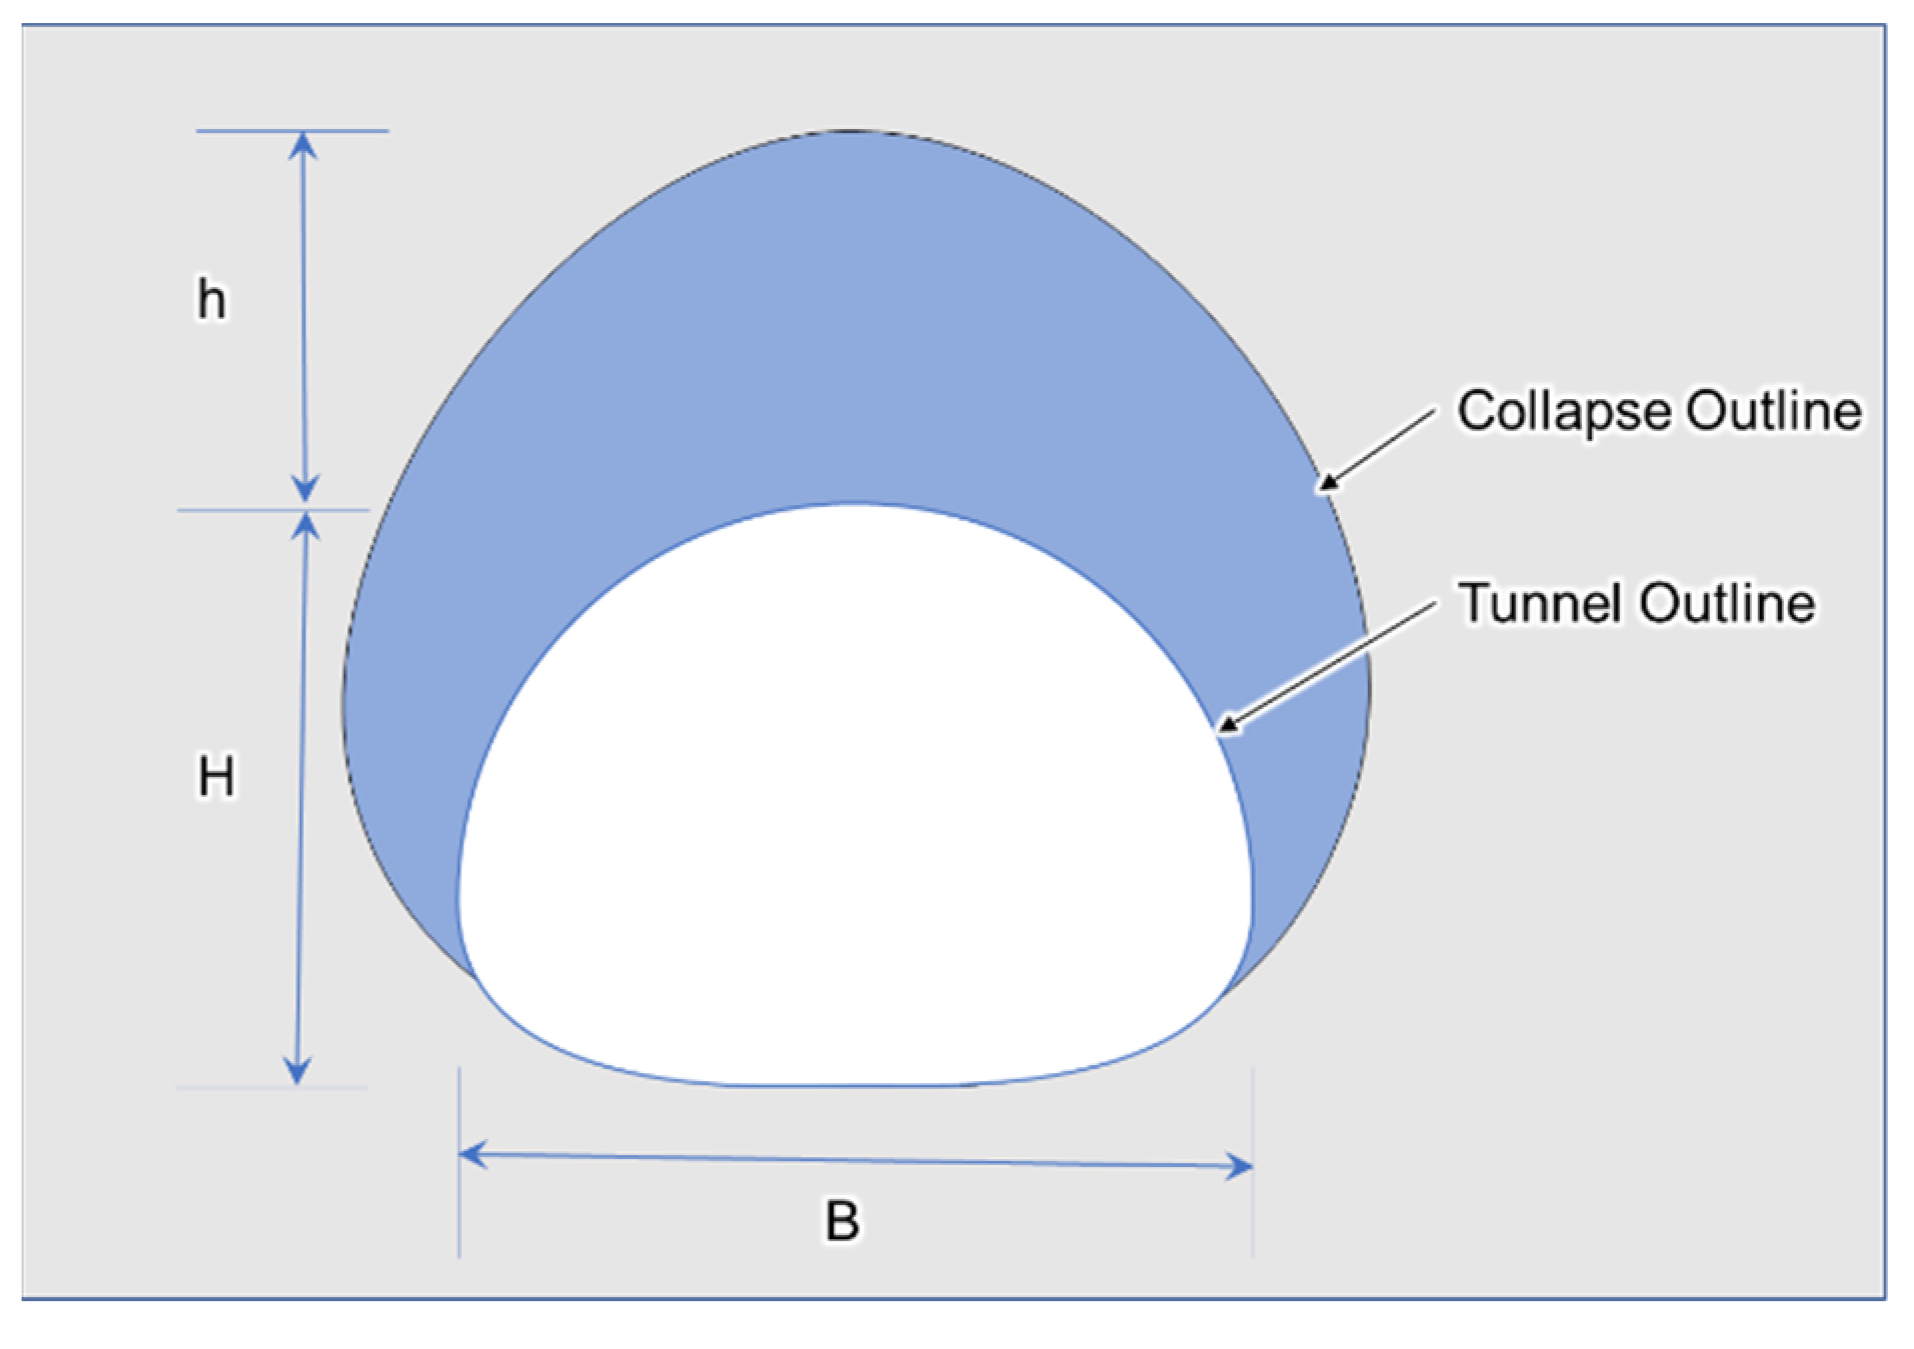
2.3.1. Surrounding Rock Pressure of Deep Tunnels
In 1979, according to the statistics on the collapse of 357 rock tunnel profiles in southwest China, a functional relationship between the classification of surrounding rock (
Table A1) and the height of collapse was obtained, wherein surrounding rock gravity in the height range of collapse was taken as the vertical pressure of surrounding rock that was of equivalent load.
Figure 3 illustrates the parameters in the statistical data. The relationship between excavation size (
) and collapse height (
) was as follows:
where
n is the load coefficient. The relationship between
n and surrounding rock classification
S was as follows:
The vertical loads on the supporting structure were as follows:
The calculation method is suitable for deep tunnels.
2.3.2. Surrounding Rock Pressure of Shallow Tunnels
Xie proposed a method for calculating stratum pressure in shallow tunnels [
26]. The calculation schematic diagram is shown in
Figure 4.
It was assumed that in shallow tunnels, the support strength is insufficient and the W1 will sink. Due to the internal shear and friction of soil, W1 would drive W2 on both sides to move down together, which makes W2 and soil form a breaking slip surface with a
angle to the horizontal plane. During the moving process of the soil W2 on both sides, the rock stratum produces resistance F to the wedge body on both sides W2, and the wedge body on both sides W2 transmits resistance to W1. According to the static equilibrium condition, the vertical force
on AA′ was obtained.
where,
Considering that the pressure of surrounding rock is slightly higher, it is beneficial to structural safety, so enlarging load,
In shallow tunnel, the vertical uniform load is as follows,
when the tunnel depth
h is less than the equivalent height,
θ is 0.
2.3.3. China’s Specifications for Design of Highway Tunnels
China’s “Specifications for Design of Highway Tunnels (SDHT) (2018) [
27]” is based on the statistics of tunnel collapse [
20]. Due to the difference of section size between highway tunnels and railway tunnels, some parameters were revised when referring to the formula.
The calculation formula of the load of loose surrounding rock in deep tunnel was as follows,
where
is the classification grade of surrounding rock in SDHT. The rock classification method combines qualitative and quantitative analyses, considering the rock strength, rock integrity, groundwater, initial stress, and joint surface. While a brief illustration is available in
Appendix A,
is rock density,
= 1 +
i(
B − 5) is the influence coefficient of the width,
B is tunnel width, and
i represents variation of surrounding rock pressure with variation in
B. Herein,
B = 5 m was adopted as a benchmark. When
B < 5 m, consider
i = 0.2, and when
B > 5 m, consider
i = 0.1.
In accordance with SDHT, the cover depth threshold was as follows:
where
is the cover depth threshold and
is load-equivalent height. The calculation formula was as follows:
Vertical pressure was calculated in two parts. When the cover depth h was greater than the cover depth threshold , it was determined as a deep tunnel, and the vertical pressure was calculated according to Equation (17). When the cover depth h was less than the cover depth threshold , it was determined as a shallow tunnel, and the vertical pressure was calculated according to Equation (16).
2.4. Tunnel Code for Railway Tunnel in Loess
Xie Jiaxiao’s formula was also used to calculate the load of shallow tunnel in the Tunnel Code for Railway Tunnel in Loess (2014) (TCRTL) [
28,
29]. However, it took the condition of zero vertical load by Equation (16) as the judgment basis of deep and shallow tunnels. Namely,
Cover depth threshold was defined as
When the cover depth was less than , it was a shallow tunnel. The calculation method of vertical pressure was the same as the SDHT.
When the cover depth was greater than
, it was a deep tunnel. The revised Terzaghi’s formula was adopted as follows:
The revised formula had two functions: one was that the surrounding rock pressure does not change with the cover depth; the other was that the result was larger than that of the calculation of Terzaghi’s, which made structures safer.
2.5. Applicability Analysis
From
Table 1, in Terzaghi’s theory, based on the limit equilibrium theory, the minimum surrounding rock pressure required to maintain the stability of the soil can be obtained when the soil above the tunnel is about to fail. In Protodyakonov’s theory, the surrounding rock pressure is the weight of the soil between the pressure arch and the lining, and the vertical stress along the arch axis has zero effect on the bending moment at the crown. In SDHT, the surrounding rock pressure is the weight of the soil from the collapse contour to the crown. The surrounding rock on the collapse contour is in a damaged state, and the radial stress is zero.
Terzaghi’s theory takes soil as load without considering the bearing capacity of tunnel surrounding rock, which is often used in shallow tunnels. The theoretical basis of Protodyakonov’s theory and the SDHT are obtained by taking the rock tunnel as the research object. It is thought that when the cover depth is deep enough, the pressure arching will be formed after tunnel excavation. However, there is a lack of systematic research on whether pressure arching is formed after soil tunnel excavation or the formation conditions of pressure arching.
3. Methodology
3.1. Statistical Data
The published data of the surrounding rock pressure of the loess tunnel were statistically sorted and screened by the same construction method and geological conditions [
1,
26,
27,
28,
29]. The statistical data are listed in
Table A2 according to cover depth, span, and distribution position. The distribution positions of surrounding rock pressure are shown in
Figure 5.
3.2. Methodology
Figure 6 shows the statistical analysis approach. The significance of the influence of cover depth on surrounding rock pressure was studied via analysis of variance (ANOVA). If it was significant, the function relationship between the cover depth and the surrounding rock pressure was further studied via regression analysis. If it was not significant, the distribution law of surrounding rock pressure was analyzed, and its statistical characteristic value was obtained [
30].
For the statistical data, the analysis processes were as follows:
For random variables, the distribution form of data was explored, and the distribution hypothesis test was performed. The statistical characteristics such as expectation, variance and so on could be given by the analysis of distribution law.
4. Statistical Analysis of Surrounding Rock Pressure
4.1. Variance Analysis
To study the influence of cover depth on surrounding rock pressure, one-way ANOVA was used. For different positions of lining structure, the difference of influence of cover depth on surrounding rock pressure was analyzed. Following the method of reference [
30], the data were grouped and analyzed. The results are listed in
Table 2,
Table 3 and
Table 4. F was the value of F-Distribution, F-crit was critical value of F-Distribution, and P-value was the probability of F-Distribution.
Table 2 and
Table 3 show that when the cover depths were 30 m, 35 m, and 44 m, and the spans were 12.6 m and 15.2 m, the influence of the tunnel depths on the surrounding rock pressure was not significant. However,
Table 4 shows that when the cover depths were 44 m, 62 m and 95 m, and the span was 15.2 m, the influence of the tunnel depths on the surrounding rock pressure was significant. It was concluded that the influence of tunnel depth on surrounding rock pressure was not significant in shallow tunnels, but significant in deep tunnels.
4.2. Vertical Pressure in Shallow Tunnel
The influence of cover depth levels on surrounding rock pressure in shallow tunnels was not significant, which meant that the data were random. Assuming that the vertical surrounding rock pressure obeyed the normal distribution, the Kolmogorov–Smirnov test was used to test the hypothesis.
The Kolmogorov–Smirnov statistic was 0.17640027, which was less than the critical value of 0.266717944. Therefore, the hypothesis that the surrounding rock pressure follows a normal distribution in shallow tunnels was accepted. The mean was 61.155 kPa, while the standard deviation was 49.06 kPa.
Considering that the surrounding rock pressure needed contains 95% data, the pressure is
where
μ is the subsample mean,
σ is the subsample standard deviation.
From Equation (23), the vertical pressure of loess tunnel at 44 m depth and 15.2 m span was 141.85 kPa.
4.3. Vertical Pressure in Deep Tunnel
The cover depth had a significant influence on the surrounding rock pressure in deep tunnels. The function relationship between the cover depth and the surrounding rock pressure was studied. Single-factor linear regression was used to study the variation of surrounding rock pressure at 44 m and 95 m depth. The regression equation is
y = a
x − b, such that the regression equation between pressure and cover depth was as follows:
The chart of Equation (24) is shown in
Figure 7.
Figure 7 shows that r-square was 0.95, which means that linear fitting was effective.
The upper limit of 95% estimation for parameter a was 4.051 and for parameter B was 6.808. The regression equation of cover depth and pressure was as follows:
Equation (25) was suitable for calculating the vertical pressure of tunnels with a depth of 44 to 90 m.
Generally, the dimensional weight of loess is 16.7 kN/m
3.
Figure 7 shows that the surrounding rock pressure in Equation (25) was equal to 0.24 times the gravitational stress.
4.4. Cover Depth Threshold Based on Statistical Analysis
According to the difference of the significance level of cover depth to the pressure of surrounding rock in deep tunnels and shallow tunnels, a method for determining the cover depth threshold by statistical method was proposed. When cover depth had no significant effect on pressure, it was a shallow tunnel. When cover depth had a significant effect on pressure, it was a deep tunnel.
Combining Equations (23) and (25),
Figure 8 shows the distribution of surrounding rock pressure to the 95% upper confidence level. The depth of intersection point of surrounding rock pressure of deep tunnels and shallow tunnels by combining ANOVA and regression analysis was taken as the cover depth threshold. The cover depth threshold was 33.3 m.
5. Characteristics of Vertical Pressure in Deep Tunnels
Table 5 shows the comparison of material parameters between rock and soil of the same classification. The difference between rock and soil tunnels in density, Poisson’s ratio, and internal friction angle was small, while the elastic modulus of rock tunnel was 100 times larger than that of soil tunnels and the cohesion was 25 times larger.
The statistical analysis results showed that the surrounding rock pressure of deep tunnels was related to the cover depth, while the surrounding rock pressure of deep tunnels in traditional methods (SDHT, Protodyakonov’s theory, etc.) was not related to the cover depth. The difference was that the traditional method considers the surrounding rock pressure as the loosening pressure under the pressure arching, and the occurrence of loosening pressure required the full stress release of the surrounding rock.
Figure 9 shows the curve of surrounding rock stress with tunnel deformation by convergence–confinement method. Correlated to the release of surrounding rock stress, the surrounding rock pressure first decreased and then increased. The stress of section AB was not fully released, and the surrounding rock pressure was elastic deformation pressure. Correlated to the gradual release of the surrounding rock stress, the plastic zone appeared after exceeding point B, the elastic pressure gradually decreased, the plastic zone gradually increased, and the loosening pressure gradually increased. When the deformation exceeded point C, adverse loosening occurred.
Sun [
31] and Oke [
32] analyzed the convergence–confinement curve, and the minimum stress was about 20% of the initial stress. The statistical analysis results showed that the surrounding rock pressure of deep loess tunnels was 0.31 times of the initial stress. The surrounding rock pressure of deep tunnels was located in section AB, and the surrounding rock pressure was deformation pressure, which increased with the increase of cover depth. This is consistent with the conclusions of statistical analysis.
6. Applicability of Surrounding Rock Pressure on Statistical Analysis
6.1. Vertical Pressure in Shallow Tunnel
Tujiawan Tunnel, located in Yuzhong County, Lanzhou City, Gansu Province, China, is a loess tunnel. The physical and mechanical parameters of the rock mass are as follows: cohesion, 26 kPa; bulk density, 1.62 g/cm
3; friction angle, 27; cover depth, 28 m; tunnel width, 14 m; tunnel height, 12 m. According to the mentioned formulas, the results of the cover depth threshold are listed in
Table 6.
As seen in
Table 6, all methods established that the tunnel is a shallow tunnel. For surrounding rock pressure, Protodyakonov’s theory yielded 226.8 kPa, Terzaghi’s theory yielded 255.4 kPa, SDHT and TCRTL yielded 119.1 kPa, and statistical analysis based on Equation (23) yielded 141.8 kPa. The pressure result by statistical analysis was closest to the onsite test, which yielded 136.8 kPa.
6.2. Vertical Pressure in Deep Tunnel
Xinzhuangling Tunnel, located in Yuzhong County, Lanzhou City, Gansu Province, China, is a loess tunnel. The physical and mechanical parameters of the rock mass are as follows: cohesion, 26 kPa; bulk density, 1.62 g/cm
3; friction angle, 27; cover depth, 82 m; tunnel width, 14 m; tunnel height, 12 m. According to the mentioned formulas, the results of the cover depth threshold are listed in
Table 7.
As seen in
Table 7, all methods established that the tunnel is a deep tunnel. For surrounding rock pressure, Protodyakonov’s theory yielded 226.8 kPa, Terzaghi’s theory yielded 398.8 kPa; SDHT yielded 221.6 kPa, TCRTL yielded 424.8 kPa, and statistical analysis based on Equation (25) yielded 391.68 kPa. The pressure result by TCRTL, Terzaghi, and statistical analysis were closest to the onsite test, which yielded 424.1 kPa.
7. Discussion
In tunnel construction, the surrounding rock experiences three stages of stress changes. First, the surrounding rock has initial stress before tunnel excavation. For loess tunnel, the main initial stress is self-weight. At the second stage, the free surface formed during the tunnel excavation releases the stress and deformation of surrounding rock. The stress of the surrounding rock near the tunnel face is changed and redistributed. At the third stage, after the construction of the tunnel support structure, the support structure restrains the excavation surface, which restricts the deformation and stress release of the surrounding rock, and the surrounding rock stress near the tunnel is once again redistributed. The calculation method for the surrounding rock pressure via Protodyakonov’s theory, Terzaghi’s theory, SDHT, and TCRTL apply to the second stage of surrounding rock. It was thought that a certain range of surrounding rock near the free surface forms a pressure arching after stress release, and the surrounding rock under the arch has a loose pressure. The loose pressure in this range could therefore be calculated as the surrounding rock pressure, such that the surrounding rock pressure would not change with cover depth.
However, the conclusions from statistical analysis were the opposite. This was because the statistical analysis was based on the test data of the tunnel in the third stage. These data were the result of interaction between surrounding rock and supporting structure. In shallow tunnels studied, the surrounding rock pressure was dominated by loose pressure. Loose pressure was dispersed, which showed that the influence of cover depth on surrounding rock pressure was not significant in statistics. However, with the increase of tunnel depth, the initial stress increased gradually. After tunnel excavation and construction of support structure, the surrounding rock around the tunnel would produce limited deformation, which should not be regarded as loose pressure, but as deformation pressure.
Additionally, the deformation pressure was related to initial stress and support structure parameters. When the cover depth was less than 500 m, the initial stress was mainly gravity stress, which was related to the tunnel depth [
33]. Therefore, the surrounding rock pressure increased with the increase of cover depth. At the same time, the parameters of support structure determined the release degree of initial stress, which had a great influence on the surrounding rock pressure. In the follow-up study, the influence of support structure parameters on the surrounding rock pressure should be especially studied. As the sample and factor levels of statistical analysis data were not abundant, the results of this study are only applicable to similar tunnel engineering. The tunnel span was within 15 m and the tunnel depth was within 100 m. The amount of data and factor levels should be increased in later studies to obtain a more accurate variation law of surrounding rock pressure with cover depth.
8. Conclusions
- (1)
In soil tunnels, the surrounding rock pressure of shallow tunnels was loose pressure, and the surrounding rock pressure of deep tunnels was deformation pressure.
- (2)
The parameters of surrounding rock differ greatly between soil stratum and rock stratum. Under the same deformation, the stress of soil tunnels was not fully released compared with rock tunnels. The surrounding rock pressure of deep tunnels in soil stratum was related to the initial stress.
- (3)
The surrounding rock pressure of shallow tunnels does not change with the cover depth, while that of deep tunnels increases linearly with the increase of cover depth. According to the significant difference of the influence of cover depth on surrounding rock pressure between deep and shallow tunnels, a method for cover depth thresholds for deep and shallow tunnels is proposed, where the depth of intersection point of surrounding rock pressure of deep tunnels by regression analysis and shallow tunnels by ANOVA is the cover depth threshold.
- (4)
The surrounding rock pressure of shallow tunnels obeyed a positive distribution. When the span was 15.2 m, the vertical pressure could be 141.8 kPa. The surrounding rock pressure of deep tunnels within 100 m could be calculated with a regression equation.
Author Contributions
Conceptualization, J.Q.; statistical analysis, Z.W.; writing—original draft preparation, Z.H.; discussion and conclusions, J.Q. and Y.X.; funding acquisition, Z.H.; review & editing, J.Z., Y.Y., S.H. and X.W. All authors have read and agreed to the published version of the manuscript.
Funding
This research was funded by the Fundamental Research Funds for the Central Universities, Chang’an University (No. 300102219716, No. 300102219723, No. 300102219711, No. 300102219117), the Chinese National Natural Science Foundation (No. 51978066), the National Key Research and Development Project (2018YFC0808706) and the Project on Social Development of Shaanxi Provincial Science and Technology Department (2021SF-513). And The APC was funded by the Fundamental Research Funds for the Central Universities, Chang’an University (No. 300102219716).
Institutional Review Board Statement
The study did not require ethical approval.
Informed Consent Statement
Not applicable.
Data Availability Statement
The study did not report any data.
Conflicts of Interest
The authors declare no conflict of interest.
Appendix A
Table A1.
Classification table for the SDHT.
Table A1.
Classification table for the SDHT.
| Rock Grade | I | II | III | IV | V | VI |
|---|
| S | 1 | 2 | 3 | 4 | 5 | 6 |
| [BQ] | >550 | 550~451 | 450~351 | 350~251 | ≤250 | Soft plastic clay |
denotes uniaxial saturated compressive strength of rock, is elastic longitudinal wave velocity of rock mass, denotes elastic longitudinal wave velocity of rock, is influence correction coefficient of groundwater, is influence correction coefficient of the main weakness surface, and is influence correction factor of initial stress state.
Table A2.
Surrounding rock pressure data between rock and initial lining.
Table A2.
Surrounding rock pressure data between rock and initial lining.
| Classification | Pressure on Different Position/kPa |
|---|
| Cover Depth/m | Span/m | A | B | C | D | E | F | G |
|---|
| 30 | 15.2 | 34.77 | | 52.84 | | 38.19 | 119.45 | 19.93 |
| 30 | 15.2 | | | 56.12 | | 168.14 | 67.84 | 94.06 |
| 30 | 15.2 | 58.38 | | 164.83 | | 136.61 | 36.09 | 26.79 |
| 30 | 15.2 | | | 52.07 | | 111.53 | 16.11 | 70.9 |
| 30 | 15.2 | 85.7 | | 48.04 | | 90.86 | | |
| 30 | 15.2 | | | 37.8 | | 57.01 | | |
| 35 | 15.2 | 13.1 | 3.3 | | 29.8 | 27.7 | 40.1 | 43.6 |
| 35 | 15.2 | | 64.8 | | 75.8 | 172.5 | 6 | 48.6 |
| 35 | 15.2 | 78 | 35 | | 56.6 | 78.1 | 49.9 | 39.8 |
| 35 | 15.2 | | 215.5 | | 52.3 | 63.8 | 60.3 | 35.3 |
| 35 | 15.2 | 96.8 | 29 | | 27 | 20.4 | 8.7 | 16.2 |
| 35 | 15.2 | | 3.9 | | 152.1 | 54.2 | | 16.6 |
| 35 | 15.2 | 32 | 79.4 | | 13.1 | 133.2 | 65.2 | 168.2 |
| 35 | 15.2 | | 146.7 | | 26.8 | 282.8 | 22.64 | 208.8 |
| 44 | 15.2 | 39.31 | 44.51 | | 126.78 | 151.01 | 12.34 | 101.76 |
| 44 | 15.2 | | 55.19 | | 55.96 | 124.77 | 29.63 | |
| 44 | 15.2 | 26.09 | 36.32 | | 88.1 | 43.55 | 51.02 | 66.82 |
| 44 | 15.2 | | 81.04 | | 80.95 | 21.7 | 45.32 | |
| 44 | 15.2 | | 13.44 | | 46.44 | 82.26 | 57.43 | 37.1 |
| 44 | 15.2 | | 56.6 | | 27.04 | 92.26 | 59.69 | 25.64 |
| 44 | 15.2 | 88.46 | 27.31 | | 45.24 | | 16.94 | 14.8 |
| 44 | 15.2 | | 145.41 | | 26.23 | 18.82 | | |
| 62 | 15.2 | 52.8 | 120.4 | | 79.8 | 181.9 | 101.5 | 35.4 |
| 62 | 15.2 | | 53.6 | | 98.6 | 127.4 | 104.5 | 34.6 |
| 62 | 15.2 | 28.9 | 245.4 | | 27.8 | 34.3 | 102.6 | 44.9 |
| 62 | 15.2 | | 180 | | 97.9 | 95.1 | 115.8 | 39.1 |
| 62 | 15.2 | 120 | 246.9 | | 60.5 | 122.8 | 134 | 44.9 |
| 62 | 15.2 | | 50.7 | | 38.6 | 71.1 | 172.1 | 124.6 |
| 62 | 15.2 | 28.8 | 57.6 | | 85 | 19.2 | 191.4 | 26.5 |
| 62 | 15.2 | | 104.1 | | 34.5 | 37.1 | 94 | 104 |
| 95 | 15.2 | 238.62 | 243.52 | | 210.91 | 313.66 | 129.38 | 154.52 |
| 95 | 15.2 | | 178.62 | | 154.51 | 131.02 | 182.1 | 252.59 |
| 95 | 15.2 | 236.79 | 172.21 | | 145.17 | 156.94 | 73.55 | 96.63 |
| 95 | 15.2 | | 141.03 | | 172.73 | 132.48 | 202.26 | 61.67 |
References
- Zhao, Y.; Li, G.; Yu, Y. Loess Tunnel Engineering; China Railway Publishing House: Beijing, China, 2011; ISBN 978-7-113-13837-0. (In Chinese) [Google Scholar]
- Lin, Z.; Wang, S. Collapsibility and deformation characteristics of deep-seated loess in China. Eng. Geol. 1988, 25, 271–282. [Google Scholar] [CrossRef]
- Zhang, Y.; Song, Z.; Weng, X. A constitutive model for loess considering the characteristics of structurality and anisotropy. Soil Mech. Found. Eng. 2022, 59, 32–43. [Google Scholar] [CrossRef]
- Wu, K.; Shao, Z. Effects of pipe roof support and grouting pre-reinforcement on the track settlement. Adv. Civ. Eng. 2018, 2018, 6041305. [Google Scholar] [CrossRef]
- Jiang, M.; Sima, J.; Cui, Y.; Hu, H.; Zhou, C.; Lei, H. Experimental Investigation of the Deformation Characteristics of Natural Loess under the Stress Paths in Shield Tunnel Excavation. Int. J. Geomech. 2017, 17, 04017079. [Google Scholar] [CrossRef]
- Shi, W.; Qiu, J.; Zhang, C.; Wang, Q.; Lai, J.; Li, B.; Mao, Z. Immersion mode and spatiotemporal distribution characteristic of water migration in loess tunnel. Arab. J. Geosci. 2022, 15, 654. [Google Scholar] [CrossRef]
- Qin, Y.; Qiu, J.; Lai JLiu, F.; Wang, L.; Luo, Y.; Liu, T. Seepage Characteristics in Loess Strata Subjected to Single Point Water Supply. J. Hydrol. 2022, 609, 127611. [Google Scholar] [CrossRef]
- Zhang, Y.; Fan, S.; Yang, D.; Zhou, F. Investigation About Variation Law of Frost Heave Force of Seasonal Cold Region Tunnels: A Case Study. Front. Earth Sci. 2022, 9, 806843. [Google Scholar] [CrossRef]
- Li, Z.; Lai, J.; Li, Y.; Qiu, J.; Shi, Y.; Li, B.; Fan, F. Ground fissure disasters and mitigation measures for hazards during metro system construction in Xi’an, China. Arab. J. Geosci. 2022, 15, 5. [Google Scholar] [CrossRef]
- Li, J.; Shao, S.; Shao, S. Collapsible characteristics of loess tunnel site and their effects on tunnel structure. Tunn. Undergr. Space Technol. 2019, 83, 509–519. [Google Scholar] [CrossRef]
- Sun, H.; Wang, Q.; Zhang, P.; Zhong, Y.; Yue, X. Spatialtemporal Characteristics of Tunnel Traffic Accidents in China from 2001 to Present. Adv. Civ. Eng. 2019, 2019, 4536414. [Google Scholar] [CrossRef] [Green Version]
- Liu, T.; Xie, Y.; Feng, Z.; Luo, Y.; Wang, K.; Xu, W. Better understanding the failure modes of tunnels excavated in the boulder-cobble mixed strata by distinct element method. Eng. Fail. Anal. 2022, 116, 104712. [Google Scholar] [CrossRef]
- Luo, Y.; Chen, J.; Gao, S.; Deng, X.; Diao, P. Stability analysis of super-large-section tunnel in loess ground considering water infiltration caused by irrigation. Environ. Earth Sci. 2017, 76, 763. [Google Scholar] [CrossRef]
- He, S.; Lai, J.; Li, Y.; Wang, K.; Wang, L.; Zhang, W. Pile group response induced by adjacent shield tunnelling in clay: Scale model test and numerical simulation. Tunn. Undergr. Space Technol. 2022, 120, 104039. [Google Scholar] [CrossRef]
- Qin, Y.; Lai, J.; Yang, T.; Zan, W.; Feng, Z.; Liu, T. Failure analysis and countermeasures of a tunnel constructed in loose granular stratum by shallow tunnelling method. Eng. Fail. Anal. 2022. [Google Scholar] [CrossRef]
- Xue, Y.; Zhang, X.; Li, S.; Qiu, D.; Su, M.; Li, L.; Tao, Y. Analysis of factors influencing tunnel deformation in loess deposits by data mining: A deformation prediction model. Eng. Geol. 2018, 232, 94–103. [Google Scholar] [CrossRef]
- Qiu, J.; Fan, F.; Zhang, C.; Lai, J.; Wang, K.; Niu, F. Response Mechanism of Metro Tunnel Structure under Local Collapse in Loess Strata. Environ. Earth Sci. 2022, 81, 164. [Google Scholar] [CrossRef]
- Liu, X.; Ma, E.; Liu, J.; Zhang, B.; Niu, D.; Wang, Y. Deterioration of an industrial reinforced concrete structure exposed to high temperatures and dry-wet cycles. Eng. Fail. Anal. 2022, 134, 106150. [Google Scholar] [CrossRef]
- Skrzypkowski, K. Case Studies of Rock Bolt Support Loads and Rock Mass Monitoring for the Room and Pillar Method in the Legnica-Głogów Copper District in Poland. Energies 2020, 13, 2998. [Google Scholar] [CrossRef]
- Guan, B. Statistical Analysis of Surrounding Rock Pressure of Railway Tunnel. Railw. Stand. Des. 1979, 6, 17–20. (In Chinese) [Google Scholar] [CrossRef]
- He, S.; Lai, J.; Zhong, Y.; Wang, K.; Xu, W.; Wang, L.; Liu, T.; Zhang, C. Damage behaviors, prediction methods and prevention methods of rockburst in 13 deep traffic tunnels in China. Eng. Fail. Anal. 2021, 121, 105178. [Google Scholar] [CrossRef]
- Wu, K.; Shao, Z.; Qin, S.; Li, B. Determination of deformation mechanism and countermeasures in silty clay tunnel. J. Perform. Constr. Facil. 2020, 34, 04019095. [Google Scholar] [CrossRef]
- Terzaghi, K. Rock Defects and Loads on Tunnel Supports, Rock Tunneling with Steel Supports; Proctor, R.V., White, T.L., Terzaghi, K., Eds.; Commercial Shearing and Stamping Co.: Youngstown, OH, USA, 1946. [Google Scholar]
- Protodyakonov, M.M. Mechanical Properties and Drill Ability of Rocks. In Proceedings of the Fifth Symposium on Rock Mechanics, Minneapolis, MN, USA, May 1962; Fairhurst, C., Ed.; University of Minnesota: Minneapolis, MN, USA, 1962; pp. 103–118. [Google Scholar]
- China Merchants Chongqing Communications Technology Research & Design Institute Co., Ltd. Specifications for Design of Highway Tunnels, Section 1 Civil Engineering; JTG 3370.1-2018; China Communications Press Co., Ltd.: Beijing, China, 2018. [Google Scholar]
- Zhao, Y.; Li, P. A Statistical Analysis of China’s Traffic Tunnel Development Data. Engineering 2018, 4, 3–5. [Google Scholar] [CrossRef]
- Hu, Z. The Statistics Regulation on Pressure and Deformation of Surrounding Rock in Loess Tunnel. Master’s Thesis, Chang’an University, Xi’an, China, 2015. (In Chinese). [Google Scholar]
- Li, P.; Zhao, Y. Performance of a multi-face tunnel excavated in loess ground based on field monitoring and numerical modeling. Arab. J. Geosci. 2016, 9, 640. [Google Scholar] [CrossRef]
- Li, P.; Zhao, Y.; Zhou, X. Displacement characteristics of high-speed railway tunnel construction in loess ground by using multi-step excavation method. Tunn. Undergr. Space Technol. 2016, 51, 41–55. [Google Scholar] [CrossRef]
- Hu, Z.; Du, K.; Lai, J.; Xie, Y. Statistical Analysis of Influence of Cover Depth on Loess Tunnel Deformation in NW China. Adv. Civ. Eng. 2019, 2019, 2706976. [Google Scholar] [CrossRef] [Green Version]
- Sun, J. Study and Application on Key Technology of Tunnel Structure Design; China Communications Press Co., Ltd.: Beijing, China, 2014. (In Chinese) [Google Scholar]
- Oke, J.; Vlachopoulos, N.; Diederichs, M. Improvement to the convergence-confinement method: Inclusion of support installation proximity and stiffness. Rock Mech. Rock Eng. 2018, 51, 1495–1519. [Google Scholar] [CrossRef]
- Brown, E.T.; Hoek, E. Trends in relationships between measured in-situ stresses and depth. Int. J. Rock Mech. Min. Sci. Geomech. Abstr. 1978, 15, 211–215. [Google Scholar] [CrossRef]
| Publisher’s Note: MDPI stays neutral with regard to jurisdictional claims in published maps and institutional affiliations. |
© 2022 by the authors. Licensee MDPI, Basel, Switzerland. This article is an open access article distributed under the terms and conditions of the Creative Commons Attribution (CC BY) license (https://creativecommons.org/licenses/by/4.0/).


 ,
, 
