Article

The Establishment and Application of Models for Recommending Formula Fertilization for Different Maturing Genotypes of Broccoli

1
Horticulture Research Institute, Shanghai Academy of Agricultural Sciences, Shanghai Key Laboratory of Protected Horticultural Technology, Shanghai 201403, China
2
Biotechnology Research Institute, Shanghai Academy of Agricultural Sciences, Shanghai 201106, China
*
Author to whom correspondence should be addressed.
Appl. Sci. 2022, 12(12), 6147; https://doi.org/10.3390/app12126147
Submission received: 19 May 2022 / Revised: 10 June 2022 / Accepted: 13 June 2022 / Published: 17 June 2022
(This article belongs to the Special Issue Genetics and Breeding of Broccoli)

Abstract

:
According to the requirements of different fertilizers for early-maturing and late-maturing broccoli, this study aimed to establish the models of formula fertilization to apply them in the recommendation of fertilization by the aid of soil testing performed in main broccoli-producing areas. In this paper, based on the effective functions of for nitrogen- (N), phosphorous- (P), and potassium (K)-balanced fertilizers for broccoli of two different mature types, the models of formula fertilization were established. The recommend formula fertilization was accomplished in 12 different plots in the same broccoli-producing areas. The analysis of N, P, and K fertilizer contributions to broccoli yield indicated that the application rate of N, P, and K fertilizers for early-maturing variety was higher than that for late-maturing variety, when the yield contribution rate of N, P, and K fertilizers reached the extreme value. The contribution of K fertilization to the yield even had a significantly negative effect with the continuous increase of K fertilizer application for the late-maturing broccoli variety. The results showed that the different optimal combinations of applying N, P, and K fertilizers could be recommended, according to the different genotypes and soil nutrient levels.

1. Introduction

Proper fertilization is an essential measure to achieving high-yield and high-quality crops. Formula fertilization via soil testing is a scientific fertilization technology, which has been widely adopted worldwide. It can increase the fertilization utility rate, reduce the agricultural production cost, boost the economic benefit, and raise farmers’ income.
Broccoli (Brassica oleracea var. italica) is an important field vegetable in the world, which is rich in vitamins, proteins, mineral elements, and sulforaphane (an anticancer active substance) [1,2,3,4]. From the main production areas of broccoli in China, excessive nitrogen (N) and phosphorus (P) fertilizers and unbalanced proportions of N, P, and potassium (K) are common during the production and planting of broccoli. Under the traditional fertilization management mode, the yield is not high, the utilization rate of fertilizers is low, and a series of environmental pollution problems are produced. The excessive application of chemical fertilizers may not only reduce the nutritional quality and taste of crops but also cause soil structural damage and ecological environmental pollution [5,6]. Therefore, reducing the use of chemical fertilizers in vegetable farming activities has a positive effect on the growth, quality, and soil conditions of vegetables. Balanced fertilization of N, P, and K is beneficial to the increase of crop yield [7].
Broccoli needs adequate nutrients throughout its growth. In the growth of broccoli, which has different genotypes, especially early-maturing and late-maturing varieties, there are relatively important differences in the demand for N, P, K, and other fertilizers [1,8]. N, P and K are vital factors in soil testing and fertilization recommendation, significantly influencing both the yield and quality of broccoli [9,10,11]. Developing fertilization function is the basis of formula fertilization via soil testing for the production of crops and vegetables. Some formulated fertilization models have been presented for various field crops, such as wheat and corn [12,13], while no significant application of model for recommend formula fertilization has been proposed for vegetables, including broccoli and cauliflower. Thilagam et al. studied the effects of application of N, P, and K fertilizers on cauliflower yield [14,15].
In the integrated technological process of “soil testing-formulation-fertilizer supplying”, the precise formulation is the core of formula fertilization [16,17], and soil testing is an important part of formula fertilization. The fertilizer response functions in domestic and foreign models of broccoli and cauliflower have been investigated [18,19,20], while few studies have concentrated on how to apply the optimal results of fertilizer response functions to the formula fertilization recommendation. In some cases, the optimal fertilization recommendation was directly used in recommended plots [10,18,19,20], which is obviously inconsistent with the principle of formula fertilization via soil testing and cannot reach the expected results. Therefore, combining the determination of soil nutrient content with fertilizer effect function, the application of models for recommend formula fertilization could be better extended.
Nonetheless, there were few reports on the recommendation of N, P, and K fertilizers based on the response function of the yield of broccoli to fertilization. In our previous study, the fertilizer response functions reflecting the relationships between fertilizer rate and yield were presented for cauliflower and broccoli in field experiments using the 311-A optimization regression design [11,18,20].
To date, the functions of N, P, and K fertilizers in broccoli production have not been deeply studied. In addition to response functions of N, P, and K fertilizers, the fertilization recommendation based on the soil testing is a successful tool for crop fertilization management, requiring a reasonable recommendation model for predicting fertility.
With this aim, based on the established effect functions of N-, P-, and K-balanced fertilization for different genotypes, especially early-maturing and late-maturing varieties, the purpose of this study is to establish the models for recommending formula fertilization and to apply the recommended fertilization according to the different results of soil testing in different field plots from the main producing areas of broccoli, allowing the possibility of improving the yield and quality of broccoli and reducing pollution.

2. Materials and Methods

2.1. Design Methodology of Effective Function of Balanced Fertilization

‘ZSHL’ broccoli is an early-maturing variety, taking 55–60 days from field planting to harvesting; ‘HL-5’ broccoli is a late-maturing variety, taking 90–100 days from field planting to harvesting. Both varieties were provided by the Horticulture Research Institute of, Shanghai Academy of Agricultural Sciences (Shanghai, China). Field experiments designed to estimate the yield of broccoli were conducted in the Modern Agricultural District of the Chongming county, Shanghai. The soil basic agricultural traits were detected, the content of organic matter was 1.79%, pH value was 7.38, the available N content was 62.52 mg/kg, the available P content was 24.70 mg/kg, and the available K content was 170.0 mg/kg. Sources of N, P2O5, and K2O were urea, superphosphate, and potassium chloride (KCl), respectively.
The experiment was conducted according to the ‘311-A optimization regression design of supposed saturation [11]. Each variety included 11 treatment combinations with 3 repeats, accounting for a total of 33 test plots, and there were 40 plants in each individual plot. Plant spacing and row spacing were both set to 50 cm, and coded values and fertilizer rates are summarized in Table 1. Plants were sown on 25 July and transplanted to the field on 25 August in 2020. According to the current production situation in Shanghai, the maximum amounts of N, P2O5, and K2O are 500, 180, and 300 kg/ha, respectively. For each basic fertilizer, topdressing period and proportion were as follows:
For N (50%) fertilizer as a basic fertilizer, topdressing was carried out at two time points. The first topdressing was performed before the formation of leaf clusters treated with 25% of total N fertilizer; the second topdressing was conducted in the treatment period with 25% of total N fertilizer. For P (80%) fertilizer as a basic fertilizer, topdressing was carried out in the treatment period with 20% of total P fertilizer. For K (50%) fertilizer as a basic fertilizer, topdressing was performed in the treatment period with 50% of total K fertilizer.

2.2. Method of Sampling and Soil Testing

Soil samples (Nos. 1~12) were, respectively, derived from the 12 broccoli field plots in the Modern Agricultural Distinct of Chongming county in Shanghai, where the core model of the base of 400 ha in total was prevalent. The soil samples were collected after the last crop was harvested with a sampling depth of 20 cm.
According to the field shape of each plot, soil samples were collected by the “X” style mixed random sampling method, and from each sample about 0.5 kg was taken from different field plot points. The samples from different points of each plot were mixed and sampled as 0.5~1.0 kg using the quartering method. The soil samples were spread out on a table; impurities were removed, dried naturally, and crushed; and the soil samples were preserved in jar after being filtered through the 2 mm sieve.
The potassium dichromate titrimetric method was used to determine the content of the soil organic matter (SOM). The potential method was used to measure the pH of soil. The semi-micro quantitative analysis method was utilized to indicate the total N content in the soil. The conventional alkaline hydrolysis diffusion method was used to determine the available N content. The Mo-Sb anti-spetrophotography method with 0.5 mol/L NaHCO3 was used to indicate the available P content. Flame photometry was employed to determine the available K content [11,20].
The results of the soil testing of 12 different field plots (Nos. 1~12) are presented in Table 2.

2.3. Determination Method of Broccoli

According to the effective function of balanced fertilization, when the curd diameter reached 14 cm, broccoli curds were harvested from each plot. The curd weight of each treatment was investigated one by one during the cultivation period, and the actual yield of broccoli in each plot was recorded. The main indices of harvested curds included shape and color, diameter of floral bud, and a variety of adverse appearance traits.
The disqualified products had irregular spherical and uneven morphological characteristics. Bud diameter was above 4 mm, which was not qualified; the curd color was deep green as the standard, and obvious red buds were regarded as disqualifying products.
Any one of the following appearance traits of the curd were considered disqualifying, which are specifically described as follows: dry yellow buds; some buds appearing as pale green or pale yellow spots; curd stem harvest cross section forming cavity; small leaves in curds; diseases, mainly black stem disease.
Statistical analysis of yield was conducted in each plot. The eligibility criteria included no bracts, no hollow stem, no purple or yellow curd, without other abnormalities [10,11].
Data were plotted using Excel software. The statistical analysis was performed by DPS 7.05 software.

3. Results

3.1. Yield Effective Function and Marginal Analysis of Broccoli

3.1.1. Yield Effective Function and Marginal Analysis of Early-Maturing Broccoli

The numerical values of yield of early-maturing broccoli are presented in Table 1, and the effective function between yield and N, P, and K amounts is formulated as follows:
Y = 3480.1106 + 39.8225X1 + 23.2894X2 + 16.9134X3 − 0.0527X12 − 0.1236X22 − 0.0361X32 + 0.0041X1X2 − 0.0084X1X3 + 0.0022X2X3
According to F = 97.63 ** > F0.01(9,1), the F-value reached an extremely significant level, and correlation coefficient (R = 0.9994) was over the limit. The results indicated that the yield of ZSHL was significantly correlated with the amounts of N, P, and K fertilizer. The effective function (1) was solved and optimized by marginal analysis. When X1 = 365.95, X2 = 101.97, and X3 = 194.52 (N = 365.95 kg/ha, P2O5 = 101.97 kg/ha, K2O = 194.52 kg/ha, N:P2O5:K2O = 1:0.279:0.532), the highest yield was 13,608.59 kg/ha.

3.1.2. Yield Effective Function and Marginal Analysis of Late-Maturing Broccoli

The numerical values of the yield of late-maturing broccoli are presented in Table 1, and the effective function between yield and N, P, and K amounts is formulated as follows:
Y = 4027.7660 + 32.5341X1 + 85.6018X2 + 34.6805X3 − 0.0660X12 − 0.4592X22 − 0.1849X32 + 0.0093X1X2 + 0.0996X1X3 − 0.0026X2X3
According to F = 2.46 ** > F0.01(9,1), F-value reached an extremely significant level, and the correlation coefficient (R = 0.9781) was over the limit. The results indicated that the yield of HL-5 was significantly correlated with the amounts of N, P, and K fertilizer. The effective function (2) was solved and optimized by marginal analysis. When X1 = 405.83, X2 = 96.74, and X3 = 202.44 (N = 405.83 kg/ha, P2O5 = 96.74 kg/ha, K2O = 202.44 kg/ha, N:P2O5:K2O =1:0.238:0.499), the highest yield was 18,288.05 kg/ha.

3.2. Analysis of N, P, K Fertilizer Contribution to Broccoli Yield

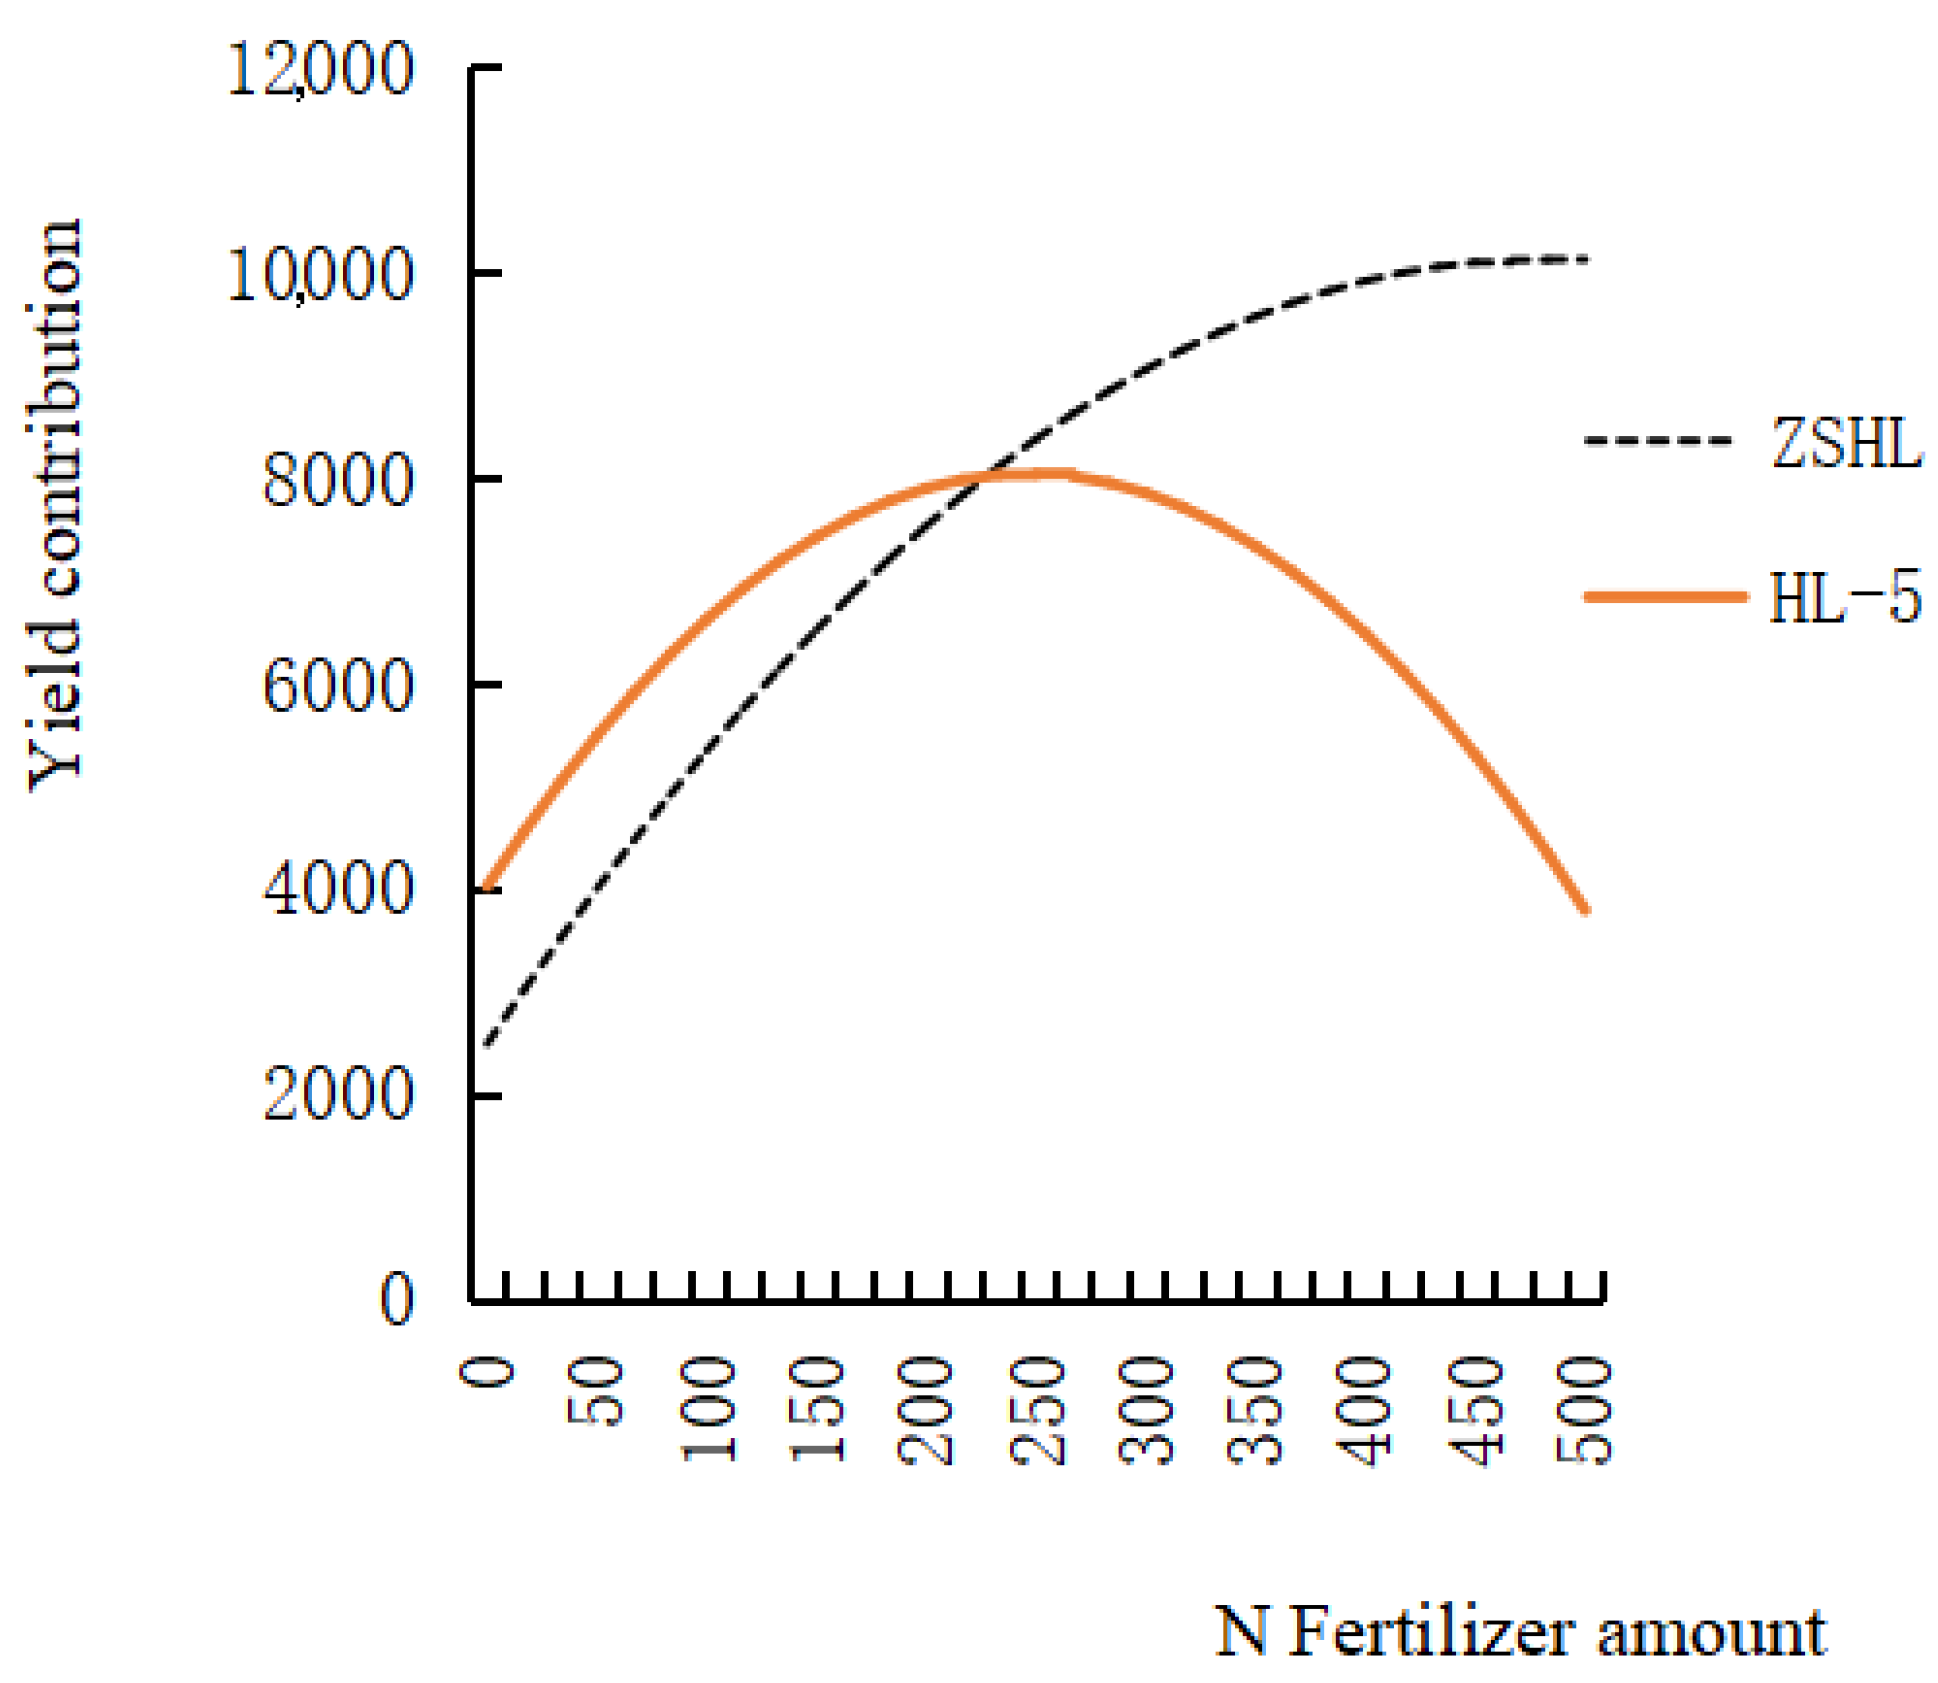
3.2.1. Analysis of N Fertilizer Contribution to Broccoli Yield

The sub-models of the yield related to both ZSHL and HL-5 were obtained by dimensionality reduction, in which P and K factors were set to 0 in the regression equation.
Y-N(ZSHL) = 3480.1106 + 39.8225X1 − 0.0527X12
Y-N(HL-5) = 4027.7660 + 32.5341X1 − 0.0660X12
The linear graph of these two regression equations (Figure 1) can be used to analyze the changes in the yield contribution of the N fertilizer amount of two different maturity broccoli varieties. Let dyi/dxi = 0 (i = 1), then the X1 values corresponding to the extreme points of the two regression equations can be obtained, respectively. For early-maturing broccoli ZSHL, when X1 = 483.3 (equivalent to 483.3 kg/ha of N application), the yield contribution reached the maximum value; for late-maturing broccoli HL-5, when X1 = 250 (equivalent to 250 kg/ha N fertilizer), the yield contribution reached the maximum value.
For the early-maturing variety, ZSHL, with the increase in the N fertilizer application level, its contribution to the yield in the early stage was an almost exponential growth, and it tended to be flat to a certain extent. For the late-maturing variety, HL-5, with the increase in N fertilizer application rate, its contribution to the yield curve had a parabolic form, its contribution to yield was initially elevated, and then decreased with the increase in N fertilizer application.

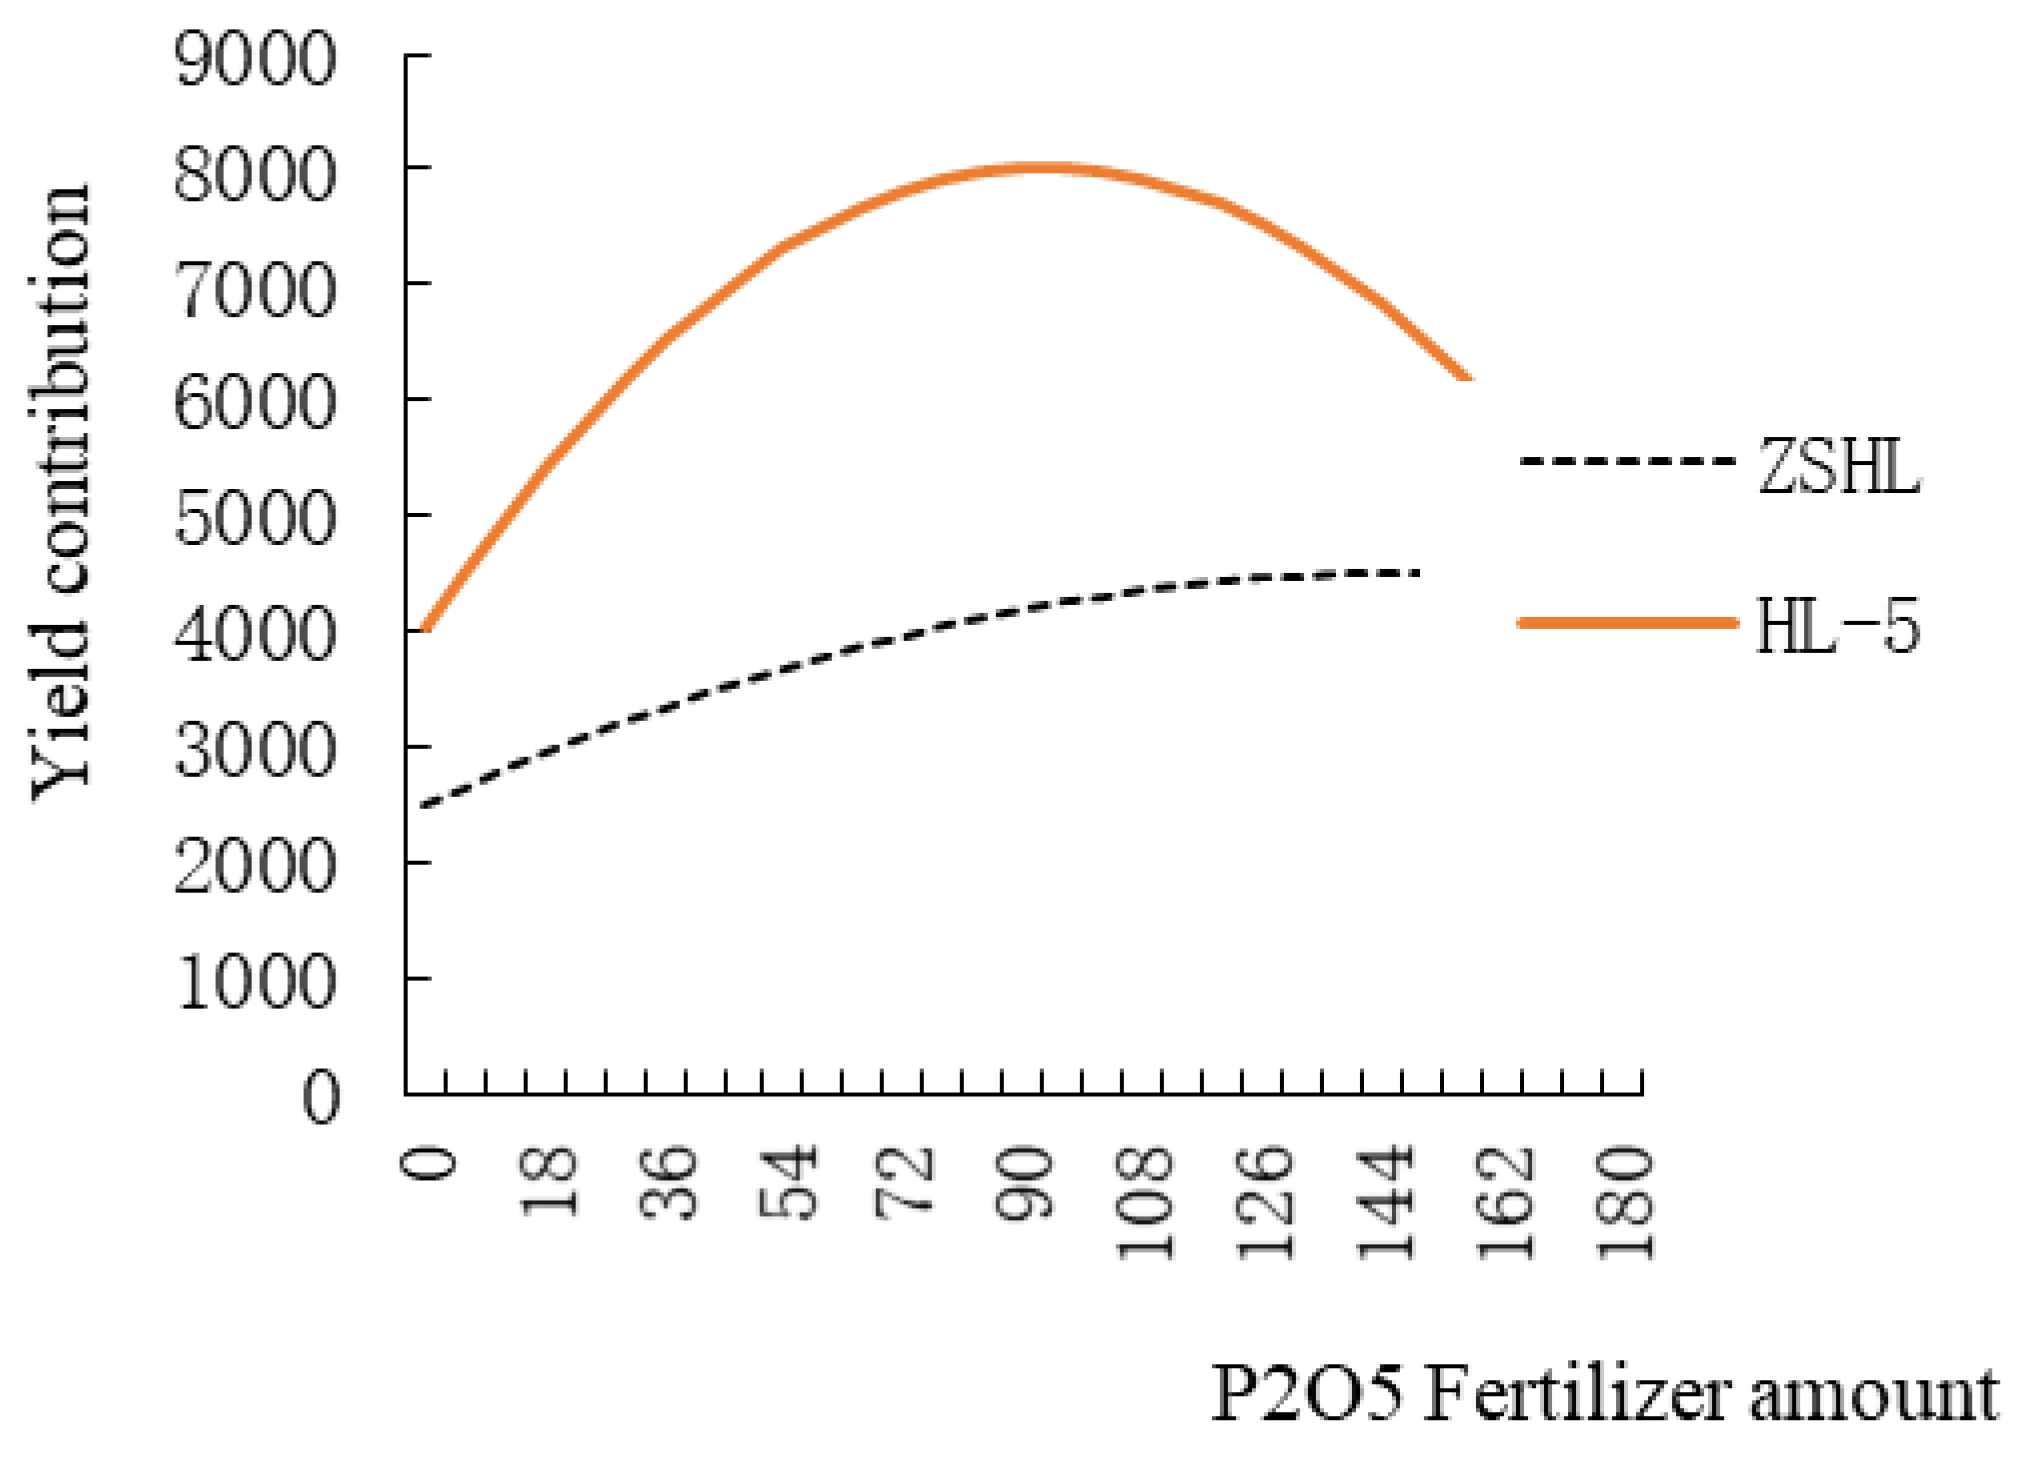
3.2.2. Analysis of P Fertilizer Contribution to Broccoli Yield

The sub-models of yield related to both ZSHL and HL-5 were obtained by dimensionality reduction, in which N and K factors were set to 0 in the regression equation.
Y-P(ZSHL) = 3480.1106 + 23.2894X2 − 0.1236X22
Y-P(HL-5) = 4027.7660 + 85.6018X2 − 0.4592X22
The linear graph of these two regression equations (Figure 2) can be used to analyze the changes in the yield contribution of the P fertilizer amount on two different maturity broccoli varieties. Let dyi/dxi = 0 (i = 2), then the X2 values corresponding to the extreme points of the two regression equations can be obtained, respectively. For early-maturing broccoli, ZSHL, when X2 = 150.0 (equivalent to 150.0 kg/ha of P application), the yield contribution reached the maximum value; for late-maturing broccoli, HL-5, when X2 = 96.0 (equivalent to 96.0 kg/ha P fertilizer), the yield contribution reached the maximum value.
For the early-maturing variety, ZSHL, its contribution to the yield slowly increased with the elevation of the P fertilizer application level, and the curve that reached the maximum value was gentle. For the late-maturing variety, HL-5, its contribution curve to the yield also had a parabolic shape with the increase in the P fertilizer application level. Its contribution to the yield initially increased and then decreased with the increase in the P fertilizer application level.

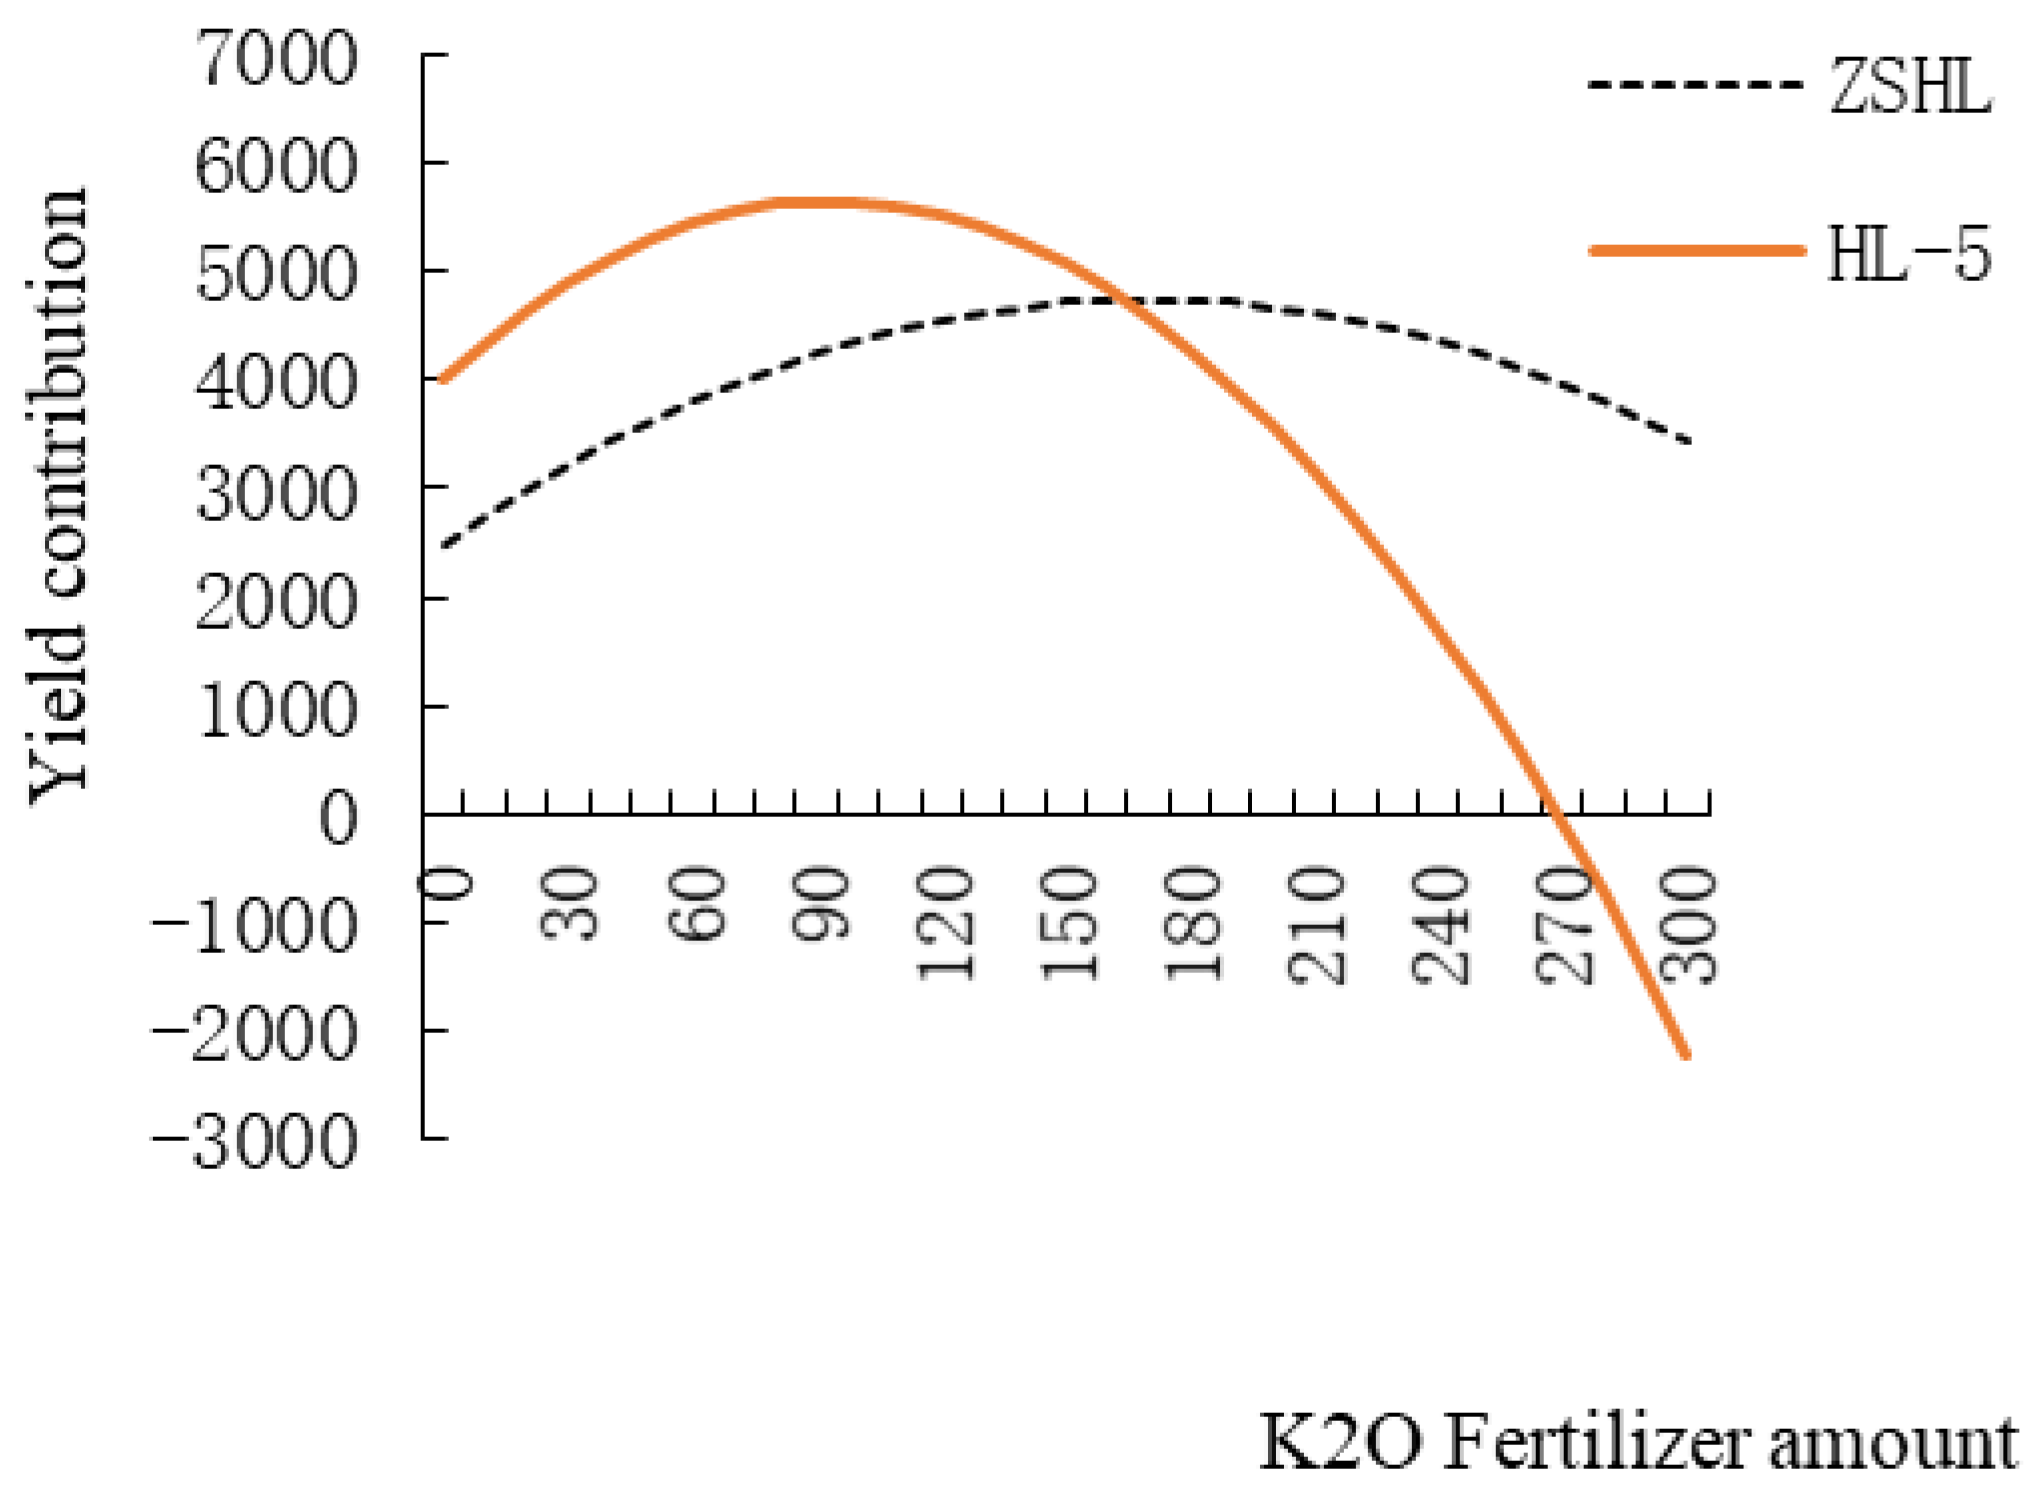
3.2.3. Analysis of K Fertilizer Contribution to Broccoli Yield

The sub-models of the yield related to both ZSHL and HL-5 were obtained by dimensionality reduction, in which N and P factors were set to 0 in the regression equation.
Y-K(ZSHL) = 3480.1106 + 16.9134X3 − 0.0361X32
Y-K(HL-5) = 4027.7660 + 34.6805X3 − 0.1849X32
The linear graph of these two regression equations (Figure 3) can be used to analyze the changes in the yield contribution of K fertilizer amount on two different maturity broccoli varieties. Let dyi/dxi = 0 (i = 3), then the X3 values corresponding to the extreme points of the two regression equations can be obtained, respectively. For early-maturing broccoli, ZSHL, when X3 = 170.0 (equivalent to 170.0 kg/ha of K application), the yield contribution reached the maximum value; for late-maturing broccoli, HL-5, when X3 = 90.0 (equivalent to 90.0 kg/ha K fertilizer), the yield contribution reached the maximum value.
For the early-maturing variety, ZSHL, its contribution to the yield increased slowly at first and then decreased gradually after reaching the extreme value with the increase in K fertilizer application amount. For the late-maturing variety, HL-5, its contribution to the yield curve is another type of ‘rapidly rising and then rapidly decreasing’ parabolic shape with the increase in the K fertilizer application amount. In addition, with the increase in K fertilizer application, its contribution to the yield initially increased and then decreased, and even when the K fertilizer application amount was more than 270 kg/ha, the contribution to the yield was negative.

3.3. The Application of Formula Fertilization Models

3.3.1. The Establishment of Formula Fertilization Models

The models of recommended formula fertilization for broccoli were established. The total nutrient amount from soil and fertilizer meeting the demand of the same production goal was equal in all farmland blocks, including different recommended fields and fertilizer response functions in trial fields. However, the recommended field was the same as production area, with the same soil characteristics as the fertilizer effect function in the trial fields. The plots indicate the same crop variety with the uniform culture model, which can be expressed as follows:
FR + SR = FT + ST
FR is the nutrient amount of recommended fertilizer in the recommended plot;
SR is the nutrient amount of soil supply in the recommended plot;
FT is the nutrient amount of recommended fertilizer in the fertilizer effect function trial plot;
ST is the nutrient amount of soil supply in the fertilizer effect function trial plot
From the Equation (9),
FR = FO + ST − SR.
where FO represents the optimal nutrient amount from a recommended N, P, or K fertilizer as different production targets in trial plot, and it was obtained from the response function of a N, P, or K fertilizer as part of the target of maximum yield; for instance, the amount of optimally recommended N, P, and K fertilizers are N (ZSHL) 365.95 kg/ha, N (HL-5) 405.83 kg/ha; P2O5 (ZSHL) 101.97 kg/ha, P2O5 (HL-5) 96.74 kg/ha; and K2O (ZSHL) 194.52 kg/ha, K2O (HL-5) 202.44 kg/ha, respectively, the maximum yields were 13,608.59 kg/ha (ZSHL) and 18,288.05 kg/ha (HL-5) in the establishing trial for the effect functions of N, P, and K fertilizers.
ST and SR can be calculated from:
ST(SR) = DT(DR) × CE
DT and DR were determined as values of soil nutrients from the recommended and the trial plot, respectively.
CE is a revised coefficient, which can be calculated as follows:
CE = AL/(DR × 2.25)
AL is the absorbed nutrient amount of the crop in the non-fertilized plot, which can be calculated as follows:
AL = AUP × PL
AUP is the absorbed nutrient amount of crop unit production, and the N, P, and K values of unit production in cabbage vegetables were 0.41, 0.05, and 0.38, respectively [8]. PL is crop production in the lack of fertilizer plot.
Equation (13) can be formulated using the Equations (9)~(12).
FR = FO + (DT − DR) × AUP × PL/2.25DR
FO and PL can be obtained from the response function of the N, P, and K fertilizer [11,18]. DT and DR can be determined using soil nutrient testing on the different recommended plots and the function establishment trial plot. The Equation (13) can be used to recommend N, P, and K fertilization under different production targets in different plots.

3.3.2. Recommended Amounts of N, P, and K Fertilizers in 12 Different Field Plots

According to Equation (13), combined with the nutrient contents of soil samples (Table 2), the recommend amounts of N, P, and K fertilizers in 12 different field plots were calculated according to the maximum yield target of the early-maturing variety, ZSHL. The recommended amounts of N, P, and K fertilizers in different plots are summarized in Table 3.
The recommended amounts of fertilizers were different in plots of different soil nutrient levels. The recommended amounts of N were 338.36~514.65 kg/ha under different soil N levels, and the maximum recommended amount of N was elevated by 52.10% compared with the minimum recommended amount of N. The recommended amounts of P were 52.81~125.45 kg/ha in different soil P levels, and the maximum recommended amount of P was increased by 137.55% compared with the minimum recommended amount of P. The recommended amounts of K were 146.12~242.92 kg/ha in different soil K levels, and the maximum recommended amount of K was elevated by 66.25% compared with the minimum recommended amount of K.
For late-maturing variety HL-5, according to the Equation (13) and the response function with the maximum yield, combined with the nutrient contents of soil samples (Table 2), the recommended amounts of N, P, K fertilizers that produce the maximum yield could be calculated. The recommended amounts of N were 373.93~577.93 kg/ha in different soil N levels, and the maximum recommended amount of N was increased by 54.56% compared with the minimum recommended amount of N. The recommended amounts of P were 39.85~123.92 kg/ha in different soil P levels, and the maximum recommended amount of P was increased by 210.97% compared with the minimum recommended amount of P. The recommended amounts of K were 146.42~258.46 kg/ha in different soil K levels, and the maximum recommended amount of K was elevated by 76.52% compared with the minimum recommended amount of K.

4. Discussion

The N, P, and K fertilizer needs of crops can vary widely, and these variations in the responses of crops to N, P, and K fertilizers have been attributed to the differences in soil nutrient supply, crop N, P, and K use efficiency, and crop N, P, K demand [16,21]. The accurate recommendation of N, P, and K fertilizers has important environmental implications by reducing residual N, P, and K, which are likely to move from the soil profile into ground or surface waters [16,22]. The recommendation of fertilizers must balance the pollution risk of overuse to our ecological environment with the reduction output risk of under-application to the profitability of the farmers.
As traditional experience-based fertilizer, N, P, and K recommendations are derived from the mass balance approach. The limited ability of experience-based N, P, and K recommendations in yield goal alone is weaker than N, P, and K recommendation systems based on models developed to accurately predict fertilization [22,23]. Thus, an economically optimum N, P, and K rate can be obtained from formula fertilization via soil testing, creating a balance between yield goal and N, P, and K input, because it is based on fertilization model and soil tests, rather than depending on experience.
Formula fertilization via soil testing aims to set down the scheme of fertilizers on the basis of the formula fertilization model of different crops and different soil types [23,24,25]. The method of formula fertilization mainly includes the nutrient balanced method, soil nutrient abundance or deficiency indices method and fertilizer response function method. The fertilizer response function method based on the fertilization field experiment objectively reflects the effects of a fertilizer under specific conditions with excellent feedback. The assessment of the N, P, and K fertilization response functions of crops is an important indicator for studying the effects of fertilizers [26]. In a previous study, it was revealed that cauliflower and broccoli responded well to optimum fertilizer levels in terms of both yield and quality [17,22]. However, a high rate of N fertilization can produce excessive vegetative growth that delays maturity and harvest and reduces cotton lint yield and N uptake [17,27].
Equally, the demand of the same production goal of the total nutrient amount from soil and fertilizer in any recommended field and response function trial field needed to be met. The model of recommended formula fertilization was established according to the above-mentioned assumptions. An appropriate fertilization scheme with an optimum fertilizer rate and an optimum N, P, and K proportion can be directly recommended, and the fertilization recommendations were able to be obtained [11,22,24].
Kim et al. demonstrated that broccoli yields were highly relevant to the application of N fertilizers, and at high N content, yield was barely changed. Liu and Conversa established correlation models between the N fertilization level and attribution for yield and the quality of broccoli curds, respectively. The yield of broccoli had a ‘low–high–low’ binominal curve with the increase of nitrogen level. They considered that an adequate N availability must be ensured in broccoli. Our conclusion was different from findings by Kim et al., but it was consistent with Liu and Conversa’s outcome [28,29,30,31]. Bai et al. found that the yield of broccoli significantly increased with the application of N and P fertilizers; however, there was no significant difference among different K fertilizer treatments [32]. Our conclusion on the contribution of K fertilizer to broccoli yield is different, as we found that the efficiency of fertilization decreased with the increase of K fertilizer application. In the present study, the field experiments showed that adequate N, P, and K nutrients were important to the improvement of yield in broccoli. Balanced fertilization of N, P, and K can improve yield and quality of curds by regulating the absorption and distribution of broccoli’s main mineral nutrients, accelerating the accumulation of nutrition relevant to curd.
Through the analysis of the contribution rates of N, P, and K fertilizer to yield, it was revealed that when the yield contribution rate of N, P, and tK fertilizer reached the extreme value, the application rate of the N, P, and K fertilizer of early maturing varieties was higher than that of late maturing varieties, which may be related to the short time of early maturing varieties in the field and the insufficient transformation of fertilizer into the nutrients needed by plants, that is, the utilization rate of nutrient transformation is lower, and the late maturing varieties are associated with a relatively higher efficiency. Our study showed that the K fertilization contribution to yield even had a significantly negative effect with the continuous increase of K fertilizer application on late-maturing broccoli varieties. Our results concerning K fertilization contribution to yield were basically consistent with Wyatt et al.’s findings. Wyatt et al. found that fertilization with K supplementation significantly increased broccoli yield over the control. Higher K concentrations applied two weeks after planting were detrimental to broccoli growth. Incidence of hollow stem increased in field tests by the application of the K fertilization with higher concentrations [33].
In the present study, according to the recommendation models of early-maturing and late-maturing varieties under yield target, the recommended amounts of fertilizers deduced by the model were different in plots with different soil nutrient levels. For early-maturing and late-maturing varieties, under the maximum yield, the maximum recommended amounts of N, P, and K compared with minimum amounts were elevated by 52.10%/54.56%, 137.55%/210.97%, and 66.25%/76.52%, respectively. Therefore, in the soil conditions of the investigated broccoli area, the effects of N and P fertilization on the yield of broccoli were the greatest among the N, P, and K fertilizers. Moreover, the difference in the fertility of P fertilizers in soil was relatively large. These speculations have been confirmed in plots and crop arrangement records. It was also proven that the former effective functions of the N, P, and K fertilizers were highly compatible with formula fertilization recommendations.
Abouel-Magd et al. [9] and Kaniszewski et al. [34] found that soil type is one of the most important factors affecting the yield and quality of cauliflower and broccoli. It is noteworthy that the recommendation model could only be used in a recommended plot with the same soil characteristics as a fertilizer effect function trial plot. This plot was planted with the same crop rotation and arrangement mode of tillage. As for a plot with different soil characteristics from the fertilizer effect function trial plot, the parameters of formula fertilization should be modified by further experiments. That is to say, there are stricter regional limitations of the formula fertilization using the fertilizer response function method. In addition, because the parametric values of AUP (N, P, and K uptake of nutrients of crops per unit of output) in Equation (4) only accorded to the previously reported values that were not obtained experimentally [8], the reliability of the model should be tested in the next experiments.
This study established the recommended formula fertilization models via soil testing based on the response functions of N, P, and K fertilizers for broccoli, particularly for early-maturing and late-maturing genotypes. The N, P, and K fertilizers in different plots under yield targets were scientifically recommended by two models and soil testing results, which are of great significance to the precise formulation of fertilizers for broccoli and other vegetables.

Author Contributions

G.L. and Z.X. designed and performed the experiments. The data investigation was conducted by X.Y., C.L. (Chunqing Liu), L.H. and C.L. (Chenghong Liu); G.L. wrote and revised the manuscript. All authors have read and agreed to the published version of the manuscript.

Funding

This research was funded by the the national tackling program of China (High quality broccoli cultivation project), supported by SAAS Program for Excellent Research Team (Grant No.2022018), the agricultural S&T Supporting Project of Shanghai Academy of Agricultural Sciences (2022(03)), the Shanghai Academy of Agricultural Sciences Fund (Grant Nos. 2017YFD 0101805-2018MATCH).

Institutional Review Board Statement

Not applicable.

Informed Consent Statement

Not applicable.

Data Availability Statement

Not applicable.

Acknowledgments

We thank Shuangxi Li for experimental assistance from Institute of Eco-environment Protection, Shanghai Academy of Agricultural Sciences.

Conflicts of Interest

The authors declare that there is no conflict of interest. The funder had no role in the design of the study.

References

  1. Branca, F. Cauliflower and broccoli. Vegetables I. In Handbook of Plant Breeding; Springer Sciences+Business Media, LLC: New York, NY, USA, 2008; Volume 1, pp. 151–186. [Google Scholar]
  2. Li, Z.; Liu, Y.; Fang, Z.; Yang, L.; Zhang, M.; Zhang, Y.; Liu, H.; Siu, P. Study on difference of sulforaphane in cabbage head and different organs of broccoli. J. Nucl. Agric. Sci. 2017, 31, 447–454. [Google Scholar]
  3. Fujime, Y.; Okuda, N. The physiology of flowering in brassicas, especially about cauliflower and broccoli. Acta Hortic. 1996, 407, 247–254. [Google Scholar] [CrossRef]
  4. Galan, M.V.; Kishan, A.A.; Silverman, A.L. Oral broccoli sprouts for the treatment of Helicobacter pylori infection: A preliminary report. Dig. Dis. Sci. 2004, 49, 1088–1090. [Google Scholar] [CrossRef] [PubMed]
  5. Ongley, E.D.; Zhang, X.; Yu, T. Current status of agricultural and rural non-point source pollution assessment in China. Environ. Pollut. 2010, 158, 1159–1168. [Google Scholar] [CrossRef]
  6. Huang, S.; Tang, J.-W.; Li, C.; Zhang, H.; Yuan, S. Reducing potential of chemical fertilizers and scientific fertilization countermeasure in vegetable production in China. J. Plant Nutr. Fertil. 2017, 23, 1480–1493. [Google Scholar]
  7. Geng, Y.; Yuan, Y.; Miao, Y.; Zhi, J.; Huang, M.; Zhang, M.; Wang, H.; Shen, Q.; Zou, J.; Li, S. Decreased nitrousoxide emissions associated with functional microbial genes under bio-organic fertilizer application in vegetable fields. Pedosphere 2021, 31, 279–288. [Google Scholar] [CrossRef]
  8. Ciancaleoni, S.; Negri, V. A method for obtaining flexible broccoli varieties for sustain- able agriculture. BMC Genet. 2020, 21, 51. [Google Scholar] [CrossRef]
  9. Abouel-Magd, M.M.; Abdel-Fattah, A.A.; Selim, E.M. Influence of Mineral and Organic Fertilization Methods on Growth, Yield and Nutrients Uptake by Broccoli Crop. World J. Agric. Sci. 2009, 5, 582–589. [Google Scholar]
  10. Zhang, C.; Xie, Z.; Chen, S.; Wu, Z. Effect of nitrogen, phosphorus, potassium and boron on nutrient absorption, distribution, yield and quality of broccoli. Acta Hortic. Sin. 2008, 35, 591–594. [Google Scholar]
  11. Li, G.; Xie, Z.; Yao, X.; Chen, X. Study on the mathematical model of the effects of NPK on winter cauliflower. Math. Comput. Model. 2011, 54, 1128–1137. [Google Scholar] [CrossRef]
  12. Gelson, T.; Brorsen, B.W.; Francis, M.; Epplin, E.T. Crop Input Response Functions with Stochastic Plateaus. Am. J. Agric. Econ. 2008, 90, 424–434. [Google Scholar]
  13. Lanzer, E.A.; Paris, Q.; Williams, W.A. Dynamic model for technical and economic analysis of fertilizer recommendations. Agron. J. 1981, 73, 733–737. [Google Scholar] [CrossRef]
  14. Thilagam Kasthuri, V.; Natesan, R.  Fertilizer prescription equations for desired yield targets of cauliflower under integrated plant nutrient system based on targeted yield model. Agric. Sci. Dig. 2009, 29, 250–253. [Google Scholar]
  15. Huang, M. Study on effect of cauliflower economic yield and quality balanced fertilization with NPK. Chin. Agric. Sci. Bull. 2007, 23, 261–266. [Google Scholar]
  16. Meisinger, J.J. Evaluating plant-available nitrogen in soil-crop systems. In Nitrogen in Crop Production; Hauck, R.D., Ed.; ASA, CSSA & SSSA: Madison, WI, USA, 1984; pp. 391–416. [Google Scholar]
  17. Xingren, W.; Fusuo, Z. Modern Fertilizer Experiment Design; China Agriculture Press: Beijing, China, 1996; pp. 81–185. [Google Scholar]
  18. Li, G.; Xie, Z.; Yao, X. Effect function of NPK fertilization, N fertilization in different stages and its application in formula fertilization on Cauliflower. Sci. Agric. Sin. 2011, 44, 2070–2080. [Google Scholar]
  19. Everaarts, A.P.; Vandenberg, W. A comparison of three nitrogen response models for cauliflower. Acta Hortic. 1996, 428, 171–179. [Google Scholar] [CrossRef] [Green Version]
  20. Zhang, C.; Xie, Z.; Yao, Z.; Wu, Z. Effects of balanced application of nitrogen phosphorus and potassium fertilizers on yield and rate of finished products of export broccoli. Acta Agric. Shanghai 2007, 23, 22–25. [Google Scholar]
  21. Lory, J.A.; Scharf, P.C. Yield goal versus delta yield for predicting fertilizer nitrogen need in corn. Agron. J. 2003, 95, 994–999. [Google Scholar] [CrossRef]
  22. Monbiela, F.; Nicholaides, J.J.; Nelson, L.A. A method to determine the appropriate mathematical form for incorporating soil test levels in fertilizer response models for recommendation purposes. Agron. J. 1981, 73, 937–941. [Google Scholar] [CrossRef]
  23. Quaggio, J.A.; Cantarella, H.; van Raij, B. Phosphorus and potassium soil test and nitrogen leaf analysis as a base for citrus fertilization. Nutr. Cycl. Agroecosyst. 1998, 52, 67–74. [Google Scholar] [CrossRef]
  24. Mulvaney, R.L.; Khan, S.A.; Ellsworth, T.R. Need for a soil-Based approach in managing nitrogen fertilizers for profitable corn production. Soil Sci. Soc. Am. J. 2005, 70, 172–182. [Google Scholar] [CrossRef] [Green Version]
  25. Wu, P.; Fang, P.; Wu, L.; Tao, Q.; Yang, Y. Application of a rice field Experimental error distribution function to nitrogen-phosphorus-potassium fertilizer response model analysis. Nutr. Cycl. Agroecosyst. 1997, 47, 1–5. [Google Scholar] [CrossRef]
  26. Anderson, R.L.; Nelson, L.A. A family of models involving intersecting straight lines and concomitant experimental designs useful in evaluating response to fertilizer nutrients. Biometrics 1975, 31, 303–318. [Google Scholar] [CrossRef]
  27. Kage, H.; Alt, C.; Stützel, H. Nitrogen concentration of cauliflower organs as determined by organ size, N supply, and radiation environment. Plant Soil 2002, 246, 201–209. [Google Scholar] [CrossRef]
  28. Kim, S.; Kim, S.; Kiniry, J.R.; Ku, K.-M. A hybrid decision tool for optimizing broccoli production in a changing climate. Hortic. Environ. Biotechnol. 2021, 62, 299–312. [Google Scholar] [CrossRef]
  29. Liu, W.; Wang, E.; Lin, J. Mathematical modeling for the influence of nitrogen fertilization level on vegetative growth and yield attributes of broccoli. In Proceedings of the International Conference on Artificial Intelligence, Soft Computing, Puebla, Mexico, 26 November–4 December 2011; Springer: Berlin/Heidelberg, Germany, 2011. [Google Scholar]
  30. Conversa, G.; Lazzizera, C.; Bonasia, A.; Elia, A. Growth, N uptake and N critical dilution curve in broccoli cultivars grown under Mediterranean conditions. Sci. Hortic. 2019, 244, 109–121. [Google Scholar] [CrossRef]
  31. Funda, Y.; Safak, C.; Bulent, Y.; Nilgun, M. Effects of Nitrogen Fertilizer on Yield quailty and Nutrien Content in Broccoli. J. Plant Nutr. 2008, 31, 1333–1343. [Google Scholar]
  32. Bai, J.; Chen, Z.; Ding, Y.; Zhang, L.; Huang, P.; Zhao, Y. Effects of N, P, K application rates on yield, nutrients accumulation and fertilizers use efficiency of open field broccoli. Chin. Agric. Sci. Bull. 2018, 34, 112–118. [Google Scholar]
  33. Wyatt, J.E.; Mullins, J.A.; Mullins, C.A. Potassium fertilization of broccoli transplants. Fertil. Res. 1989, 21, 13–18. [Google Scholar] [CrossRef]
  34. Kaniszewski, S.; Rumpel, J. Effect of irrigation, nitrogen fertilization and soil type on yield and quality of cauliflower. J. Veg. Crop Prod. 1998, 4, 67–75. [Google Scholar] [CrossRef]
Figure 1. Nitrogen fertilizer contribution to broccoli yield.
Applsci 12 06147 g001
Figure 2. Phosphate fertilizer contribution to broccoli yield.
Applsci 12 06147 g002
Figure 3. Potassium fertilizer contribution to broccoli yield.
Applsci 12 06147 g003
Table 1. The yields of broccoli under various fertilization treatments.
TreatmentCoded ValueFertilization Rate (kg/ha)Yield of ZSHL (kg/ha)Yield of HL-5 (kg/ha)
X1X2X3NP2O5K2O
10022259027012,548.712,352.3
200−22250011,365.213,275.6
3−1.414−1.414165.92526.37202.58521.48606.7
41.414−1.4141384.0826.37202.512,654.316,452.3
5−1.4141.414165.925153.63202.58754.38995.1
61.4141.4141384.08153.63202.513,072.617,258.4
720−14509067.512,243.512,952.3
8−20−109067.55637.39033.2
902−122518067.511,434.511,855.8
100−2−1225067.511,032.110,942.0
110002259013512,768.916,973.3
Table 2. The results of the soil testing of 12 different field plots.
Field CodeTotal N Content (%)Available N Content (mg/kg)Available P Content (mg/kg)Available K Content (mg/kg)Organic Matter Content (%)pH
10.1162.3535.61561.737.72
20.1256.8231.21661.567.53
30.1260.8740.41631.767.51
40.1361.2232.61741.717.69
50.1365.2423.81811.787.55
60.1247.8622.91751.417.56
70.1363.1325.31721.477.69
80.1157.3921.41841.167.52
90.1061.2519.41661.597.51
100.1163.2221.41731.527.64
110.1062.6617.21571.497.55
120.1260.8818.61651.467.72
Table 3. The recommended amounts of N, P, and K fertilizers in different field plots.
Field PlotMaximum Yield
N
kg/ha
P2O5
kg/ha
K2O
kg/ha
ZSHLHL-5ZSHLHL-5ZSHLHL-5
1367.67407.8367.8457.24242.92258.46
2423.77472.7481.6273.19208.35218.45
3382.69425.2052.8139.85218.72230.45
4379.14421.0977.2468.11180.69186.43
5338.36373.90104.79100.00156.49158.42
6514.65577.93107.61103.26177.23182.43
7359.76398.67100.0994.57187.61194.44
8417.98466.05112.30108.70146.12146.42
9378.83420.74118.56115.95208.35218.45
10358.85397.61112.30108.70184.15190.44
11364.53404.19125.45123.92239.47254.46
12382.58425.08121.07118.84211.81222.45
Publisher’s Note: MDPI stays neutral with regard to jurisdictional claims in published maps and institutional affiliations.

