1. Introduction
Due to the subduction of the Cocos Plate under the Caribbean Plate along the Middle America Trench [
1], El Salvador is characterized by intense tectonic activity and a number of active volcanoes, meaning that severe earthquakes and volcanic eruptions frequently affect the country. As a consequence, volcanic rocks (from Cenozoic hard rocks to pseudo-coherent recent ones) and their weathered products largely outcrop [
2] along very highly steep slopes in this country. In particular, the tropical-humid climate setting of El Salvador [
3], with a mean annual rainfall above 1846 mm and a temperature between 20 and 30 °C [
4], is responsible for the intense weathering of the topsoil, resulting in poor geotechnical properties. At the same time, intense rainfall events associated with recurrent hurricanes frequently result in water saturation and neutral pression increasing in the regolithic mantle, causing the triggering of slope failures [
5,
6,
7]. As a consequence, the volcanoes and the caldera’s inner flanks are very frequently affected by landslides of a debris slide/flow type. These failures, in light of the high steepness of the initiation zones, very frequently take the form of very fast and long-runout debris flow phenomena, threatening those villages, which are set along the track channels or at the foot of the slopes. In recent years, the Nepaja (2020) [
8] and San Vicente (2009) [
9,
10] disasters clearly illustrated this kind of phenomenon, resulting in widespread damage to houses and high numbers of injured and dead.
Differing from rockfall susceptibility studies [
11,
12,
13], slide- and flow-type landslides are typically analyzed on a basin to regional scale, meaning that large inventories are required for robust modelling. In particular, a need arises to detect the potential initiation sites of landslides. To this end, landslide susceptibility modelling based on statistical analysis can offer a suitable approach for obtaining quantitative, objective, and validated prediction images of the potential triggering sites, which can then be processed with propagation tracking algorithms for a full hazard assessment.
Indeed, civil protection urgently requires regional-scale landslide susceptibility scenarios attempting to define statistically based national maps, eventually even exploiting limited but available landslide inventories for their calibration. To this end, grouping multiple clustered available datasets is frequently adopted as a solution to obtain landslide inventories large enough to train the statistical models. However, such landslide datasets can result in heterogeneity in terms of spatial distribution, the expertise of the operators, classification and mapping criteria, survey recognition methods and resolution (field, remote, reports), epoch and related triggering events, etc. It is worth noting that these limits could hamper the resolution and precision of the predictive models without giving clear effects down from standard validation procedures.
A number of landslide susceptibility studies have been conducted in the last fifteen years. In particular, post-Hurricane Mitch (1998) and post the 2001 earthquake, landslide inventories were processed through principal component analysis for assessing landslide susceptibility of an area in the extreme north-western sector of the country [
14]. At the same time, regional susceptibility assessment studies in El Salvador have been carried out, exploiting the same 2001 seismically induced inventory (set on the epicentral area), both through binary logistic regression [
15] and neural networks [
16]. More recently, a regional landslide susceptibility scenario with a 30-arcsecond resolution was also proposed by applying a fuzzy-based heuristic approach [
17]. Rotigliano et al. [
5,
6] and Mercurio et al. [
7] extensively applied logistic regression and MARS to assess landslide susceptibility in two limited volcanic sectors (Ilopango caldera and San Vicente, respectively). Regarding the civil protection authorities, MARN (Ministerio de Medio Ambiente y Recursos Naturales) adopted a 1:50,000 scale landslide susceptibility map for the whole country [
18] by applying the heuristic approach of [
19,
20]. However, all of the proposed regional models [
14,
15,
16,
17] were obtained through a calibration in very small sectors, with very weak, if any, validation procedures.
In this paper, an application to the El Salvador territory was carried out, aimed at suggesting approaches and strategies suitable for correctly investigating the actual quality of a susceptibility map obtained by calibrating a predictive model through a heterogeneous landslide inventory. In spite of its relevance, few other scientists have faced similar issues [
21,
22].
The susceptibility modelling was based on applying Multivariate Adaptive Regression Splines (MARS; [
23]) and implemented by exploiting open source software (QGIS [
24], SAGA GIS [
25], RStudio [
26]).
2. Materials and Methods
2.1. Study Areas
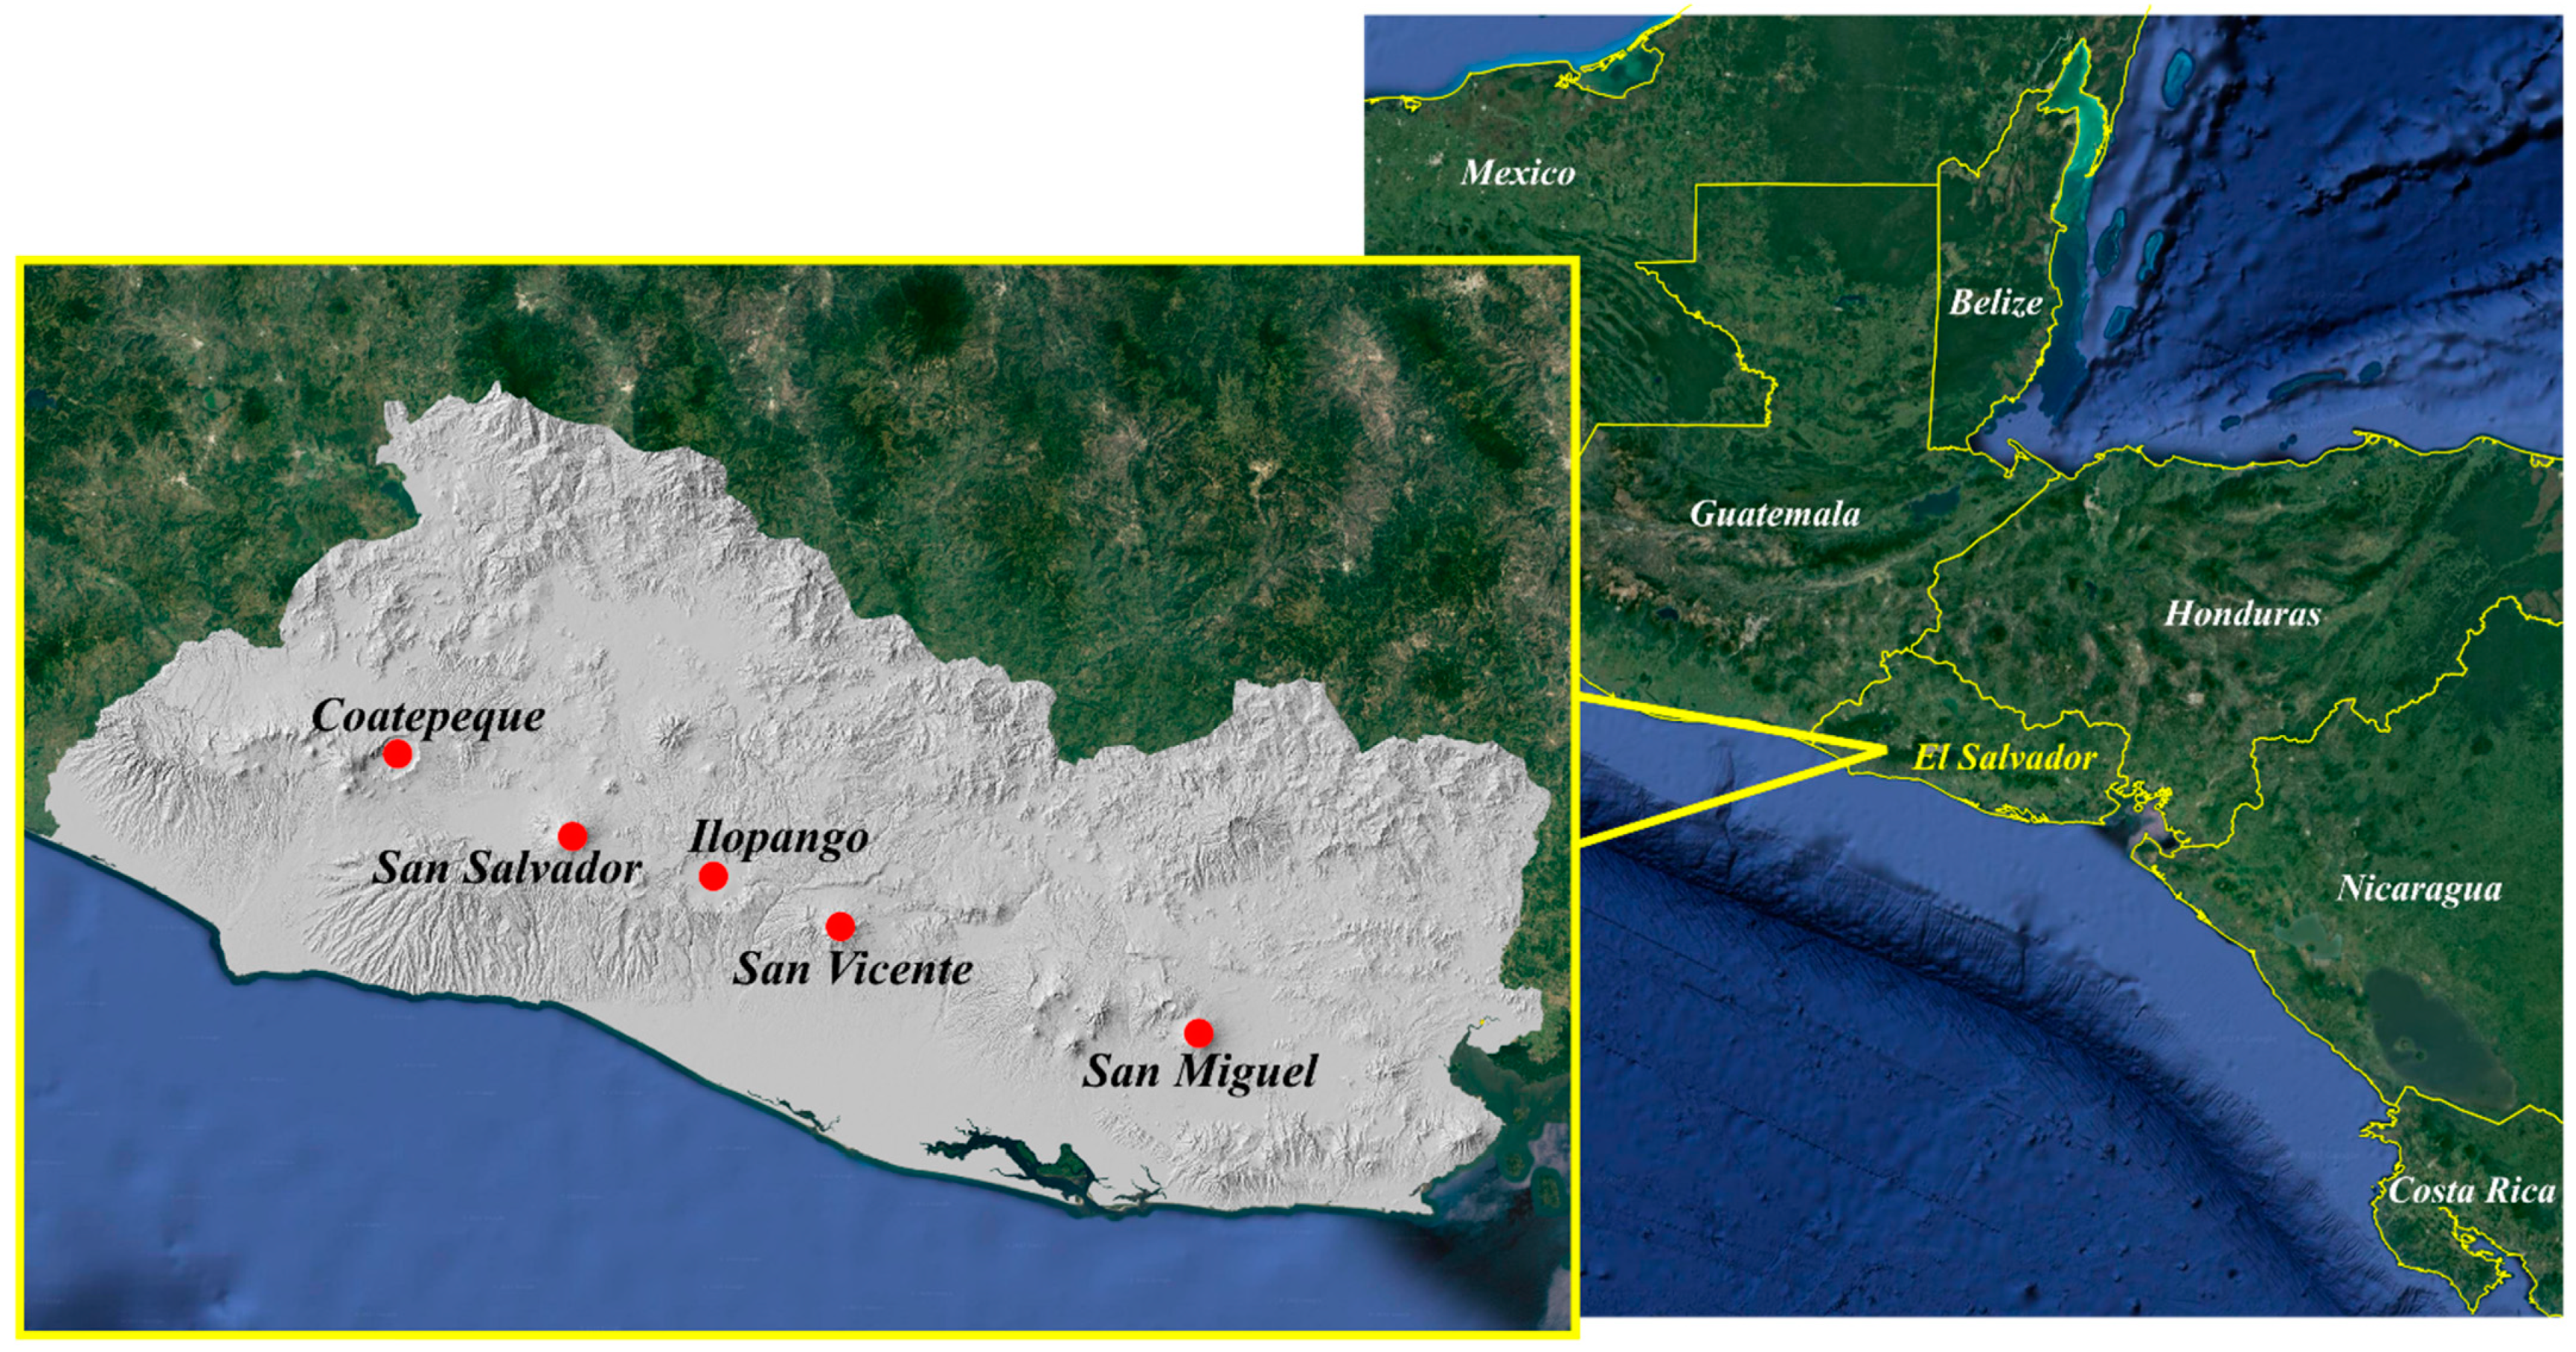
In this research, landslide susceptibility assessment was focused on the slopes of a set of volcano/caldera areas where debris flows are frequently activated (
Figure 1): (i) the Coatepeque area, which extends for about 82 km
2 east of the homonymous caldera lake; (ii) the San Salvador area, surrounding the homonymous volcano for about 144 km
2; (iii) the watershed inner basins of the Ilopango caldera, covering a total area of about 121 km
2; (iv) the San Vicente area, which includes the whole homonymous volcano, extending for about 287 km
2; and (v) the tip sector of the San Miguel volcano, covering a total area of about 11 km
2.
Focusing on the five study areas, the lithologic units of the San Salvador formation are the most frequently outcropping rocks: Holocene pyroclastites named “Tobas color café”, in the Coatepeque area (77%), “Tierra Blanca”, in the Ilopango area (45%) and to a lesser extent in the San Salvador area. Accumulation cones dominate the San Miguel area (72%), while Pleistocene effusive rocks prevail in the San Salvador area (57%) largely outcropping also in the San Vicente area. In addition, acid pyroclastites of the Cuscatlán formation are widely diffused both in the Ilopango and the San Vicente areas. Finally, with very limited outcropping areas, the pyroclastic and effusive rocks of the Bálsamo formation are observed in the Coatepeque, Ilopango, and San Vicente areas.
2.2. Landslides Inventory and Related Triggering Rainfall Events
The main task of this research was to test the suitability of aggregated regional landslide archives in the evaluation of landslide susceptibility assessment. For this reason, a set of independent available debris flows/slides archives were exploited for training and validating a regional landslide susceptibility map. Archives from five different sectors of the El Salvador territory were considered, which, even in the same sector, were considered as un-uniform in terms of operators, methods (field/remote), and epoch (which means grouping debris flows/slides linked to multiple and/or different extreme rainfall). These landslide inventories were prepared in the framework of different studies (master’s degree thesis, PhD thesis and so on, see Author Contributions), many of which have been part of the RIESCA project (Proyecto Regional de Formación Aplicada a los Escenarios de Riesgos con Vigilancia y Monitoreo de los Fenómenos Volcánicos, Sísmicos e Hidrogeológicos en Centro América). For this reason, the study areas were not a priori limited and as mentioned above, they were restricted to the sectors affected by the activation of the inventoried debris flows/slides: the Ilopango (ILO), Coatepeque (COA), San Miguel (SMG), San Vicente (SVC), and San Salvador (SSV) areas. The ILO and the COA inventories were mapped through systematic remote analysis and integrated by some random file checks, consisting of 38,525 and 1895 debris flows/slides, respectively. The SVC inventory included 4975 phenomena, which were remotely recognized according to an irregular spatial scheme. The debris flows/slides of the SMG (233 cases) were extracted by a historical simplified archive inventory, whilst the SSV inventory (382 cases) merged the results of some spot field surveys. At the same time, the expertise and perspective of the operators were different, with ILO and COA having been mapped in the framework of scientific research, all the other inventories coming from civil protection tasks and SMG collecting a number of historical reports. The main triggering events for these landslide scenarios were Hurricane Ida and the tropical depression 12 E (TD12 E). The tropical-humid climate setting of El Salvador produces, in the rainy season between May and October, very high rainfall amounts (above 1846 mm, on average) that, usually, occur in the form of intense storms. Therefore, rapid saturation of the regolithic mantle and powerful surface runoff trigger a huge number of landslides even in the case of a normal rainfall season [
5].
Between November 7th and 8th, Hurricane Ida, and the low-pressure system 96 E, simultaneously struck the central area of El Salvador, with cumulated rainfall exceeding 300 mm/24 h in the Ilopango and San Vicente villages [
5,
6,
27,
28]. Floods and landslides lashed these areas, causing around 200 deaths and huge economic losses [
9], with damages to cropland, rural houses, and roads. In particular, the most devastating debris flows were triggered from the north-western flank of the San Vicente Volcano, hitting the villages of Verapaz and Guadalupe [
5,
7].
Tropical depression 12 E affected El Salvador during the period from the 10th to 20th October. With a cumulative maximum of 1513 mm, equivalent to 42% of the mean annual rainfall of the period 1971–2000 [
28], DT12 E was classified as the most severe meteorological event recorded in the region. Additionally, in this case, with 10% of the national territory affected, especially along the coastal plains and the volcanic mountains, El Salvador was heavily hit by the related floods and landslides, reporting 35 victims and an economic loss of more than USD nine hundred million [
10,
28].
The Coatepeque debris flows were triggered by the tropical depression (TD) 12 E in 2011. The same extreme rainfall event activated the debris flows/slides of the San Salvador dataset. Hurricane Ida was the trigger of the phenomena mapped in the San Vicente archive, while both TD12 E and Ida activated the debris flows/slides of the Ilopango dataset. Finally, the landslides of the San Miguel archive were triggered by several rainfall events from 2001 to 2018.
All of the mapped phenomena were individuated by exploiting Google Earth images, and the landslide identification point (LIP), which was generated for each of the mapped phenomena corresponding to the highest point along the landslide crown, was also taken as indicating the area that effectively represents the activation conditions for surface debris flows [
5,
6,
29,
30,
31,
32,
33].
2.3. Model Building and Validation Strategy
2.3.1. Predictors and Mapping Units
The selection of a set of geo-environmental variables potentially expressing the landslide preparatory causes (
Table 1) was based on widely adopted geomorphological criteria [
5,
6,
7,
34,
35,
36,
37]. In particular, outcropping lithology (GEO) and soil use (USE) were derived from an available thematic map [
38] and a remote survey, respectively. By processing a 10 m pixel digital terrain model (DTM), the following continuous variables were derived: elevation (ELE), steepness (STP), plan (PLN), and profile (PRF) curvatures, topographic wetness index (TWI), and aspect, the latter expressed in terms of easternness (EASTNS) and northernness (NORTHNS). In addition, the landform classification (LCL) categorical variable was obtained. In this way, a set of three categorial and seven continuous variables was prepared.
With regard to lithology, based on the geomechanical expected response, the outcropping lithologies were grouped as soft, medium, and hard rocks and very soft, soft, medium, and hard soils. On the basis of the landslide distribution in the study areas, very soft and hard soils account for more than 80% of the mapped cases. The very low number of landslides recognized in soft soils has to be ascribed to the very limited extension of the outcropping areas.
All of the controlling factors were arranged in 10 × 10 m raster layers. The same grid cell structure was then adopted as the susceptibility mapping unit, assigning a stable/unstable status depending on the intersection of LIPs. In fact, according to a number of debris flow susceptibility assessment studies (e.g., [
7,
22,
29,
31,
32,
36,
37,
44,
45,
46,
47,
48,
49,
50]), we considered the instability conditions of each inventoried landslides to be effectively captured in the highest crown 10 × 10 m pixel. In order to optimize the final selected predictors that were included in the MARS modelling procedure, the variance inflation factor (VIF) [
51] test was performed for multicollinearity analysis through the continuous variables.
2.3.2. Modelling and Validation Tools
Multivariate adaptive regression splines (MARS; [
23]), which was successfully applied in a number of recent landslide and soil erosion susceptibility studies [
5,
6,
7,
35,
37,
52,
53,
54,
55,
56,
57,
58,
59], was then applied to regress the outcome (stable/unstable status) onto the covariates set from the controlling factor layers. MARS is a non-parametric regression method that exploits the splitting of each independent variable into hinge functions to boost the maximum likelihood-based adaptation skill of the logistic regression method, according to:
where
y is the dependent variable (the outcome) predicted by the function
f(
x),
α is the model intercept, and
βi is the coefficient of the
hi basis functions, given the
N number of basis functions. MARS analysis was performed by exploiting the “earth” R-package [
60].
The MARS statistical modelling of landslide susceptibility conditions requires the random extraction of a sample made of a balanced number of stable and unstable cases to be split into calibration and validation subsets: the first is exploited for regressing the outcome status on the set of covariates that express the adopted controlling factors, while the latter furnishes the unknown-to-model target pattern whose status has to be blindly predicted. In a pixel-based method, where the number of stable cases is typically largely greater than the unstable, balanced samples are obtained by merging all the positives to an equal number of randomly extracted negatives. To account for any potential unrepresentativeness of the extracted negatives, by adopting recurrent random selection routines, multiple samples were produced. Similarly, to control the influence of the specific cases which feed the calibration subsets, multiple (75/25%) calibration/validation splitting was applied to each sample as well. In this way, one hundred samples were split one hundred times so that each pixel was classified ten thousand times, allowing us to estimate the model resolution and precision. Finally, to fully evaluate the prediction skill of the model, the regression coefficients gained in the calibration/validation subset were applied to the whole investigated area.
Receiver operating curve (ROC) [
61,
62,
63] and confusion matrices analyses were the tools employed to investigate the model’s accuracy. In particular, ROC plot analysis is based on evaluating true- versus false-positive rates for decreasing susceptibility scores, with a larger area under the curve (AUC) [
64,
65] attesting to more effective classifications. The score at the maximum gradient of the ROC is then used as an optimized cut-off [
66] for building a binarized (positive/negative-observed/predicted) confusion matrix. In this way, the accuracy of the model can be evaluated both with score-independent (ROC_AUC) and -dependent (ACC) indices.
2.3.3. Research Design and Model Building Strategy
In the following, we will refer to a super area (ALL), considering that it is obtained by merging all the positive and negative cases of each of the five sectors (volcanic areas), the latter defining five local datasets (ILO, COA, SMG, SVC, and SSV).
It is worth noting that, in light of the number of causes that have been here claimed as responsible for the inventory incompleteness, a different approach from Steger et al. [
21] was designed for evaluating the influence of the bias landslide inventory. In particular, to explore the topic of the research, the following model building procedure was designed by submitting the hypothesizing of completeness of the inventory to a strict validation procedure.
First, a grand model (ALL) was prepared by applying the typical approach aimed at obtaining a regional model from the available landslide inventories, including in the processed dataframe the whole set of positives and negatives from the five sectors. To maintain control over the variability of the negatives and the calibration/validation subset assignment of positives, a suite of one thousand multiple datasets were obtained by randomly extracting one hundred sets of negatives and submitting each dataset to ten random calibration/validation (75/25%) splitting processes.
Once the grand model was prepared, it was first validated with respect to the spatial distribution of the landslides in the whole super area (ALL_ALL), according to a self-validation scheme [
5,
6,
7,
32,
35,
36,
37,
46,
67,
68]. The validation performance of the grand model was then locally evaluated by restricting the validation dataset to a single sector in turn (e.g., ALL_ILO). For comparison, independent local models (e.g., LOC_ILO) were prepared for the five sectors by limiting the application of the modelling procedure to every single dataset and applying a local self-validation scheme. Finally, five one-leave-out models were prepared by applying the same above-described procedure but adopting a 4/1 sectors calibration/validation splitting in the modelling scheme; a local validation was then obtained, by assessing the predictive skill in recognizing the specific positives and negatives of the extracted (left-out) target sector. In the following, these models are referred to as OLO models (e.g., OLO_ILO).
Table 2 provides a summary of the prepared models, including the specification of the main characteristics.
According to the main task of the research, the ALL_ALL is considered as the model that one can take as representative for a regional prediction image. At the same time, the imported models (ALL_local), in re-defining the validation set on a local basis, could furnish a useful warning in case the performance of the grand models is actually locally misleading. The local models give an estimation of the reference performance that the imported model (ALL or OLO) should achieve to be considered more informative. Finally, the one-leave-out modelling procedure simulates the results of applying the model to totally unknown sectors (such as a hypothetical sixth unknown volcanic area in our research).
3. Results
For each of the models described above, the results of the validation are reported both in
Figure 2,
Figure 3 and
Figure 4, where ROC curves and related AUCs are drawn, and in
Table 3, where binarized positive/negative status comparisons between predicted/observed target cases are given.
The performance of the ALL_ALL model is very high, with excellent AUC and accuracy (0.87 and 0.76, respectively) and highly satisfactory sensitivity (0.82) and specificity (0.76). Comparing these values to the ones obtained in importing the grand model into the specific sectors (ALL_local), satisfactory to excellent AUC and ACC values still hold, with the exception of ILO and SSV. However, lower sensitivity and higher specificity were recorded for all the models, with the exception of ILO. It is worth noting that only the SVC imported local model still performs with acceptable scores for all the main indices (sensitivity, specificity, ACC, AUC). At the same time, the local models are in general characterized by higher (0.8–0.9) AUC values, with a much more balanced sensitivity/specificity ratio, as a result of higher sensitivity and lower specificity. Again, the opposite behavior is observed for ILO.
Finally, the one-leave-out models confirm the general trend of performance indices’ variation, which was observed for ALL_local validations.
With regard to the role of the predictors, the results obtained from the local modelling highlight two very different responses (
Figure 5): SMG and SSV are fully controlled by elevation and steepness, whilst ILO, COA, and SVC also required the discriminating contribution of either landform classification (COA and SVC) or outcropping lithology (ILO and SVC) or soil use (for COA and ILO). Elevation, steepness, outcropping lithology, and soil use are all selected by the ALL grand model.
In
Figure 6, a comparison between the ALL and LOC landslide susceptibility maps for two representative sectors (Ilopango and San Salvador) is given, highlighting either coherent or incoherent spatial patterns among the models for the two sectors.
4. Discussion
The local landslide distribution in five different volcanic sectors was predicted both from imported (both ALL and OLO models) and locally calibrated models. The latter resulted in smoothly (with the exception of SSV) higher AUC values, with a proportional decrease in the cut-off-dependent accuracy, but driven by a marked sensitivity increase and a slight specificity decrease. In particular, the greater the LIP% incidence of a single sector, the higher the TPR decrease recorded for the imported models. A relevant exception that was highlighted by the results is the very odd behavior of ILO, whose local model produced a worse performance in recognizing its own positives. At the same time, in terms of scoring and status prediction, ALL and LOC models can result in different prediction images.
The ILO sector includes the great majority of landslides (83.7%) and, in light of its limited extension (18.4%), the maximum ratio between unstable and stable pixels. When trying to discriminate the status of the ILO pixels, on the basis of the ALL or OLO imported model, a better performance arises in positive detection when compared to the skill of the local model. This is due to the undifferentiated presence of positives and negatives in the same geomorphologic conditions, and this effect could have been enhanced by the severe triggering conditions (IDA tropical storm) that activated landslides even in less susceptible areas. In fact, the better performance of ALL and OLO relies on the circumstance that these models take their cases outside ILO, for positive and negative cases of OLO, or prevalently outside ILO, for the negatives of ALL. As a consequence, the local dataset confuses the binary discrimination whilst recurring for the outside pixels, which allowed us to better understand the unstable conditions. At the same time, for a more geomorphologically differentiated setting, the sub-catchment of ILO (“Arenal de Cujuapa”), Rotigliano et al. [
5,
6] obtained, with the same MARS modelling approach, higher AUC and accuracy values (0.83 and 0.73, respectively). Moreover, the same loss in the model performance was observed when trying to temporally predict the landslide inventory of 2003 (produced by a non-extreme rainfall triggering event) from the model calibrated with the same 2009 hurricane-induced inventory that was used in the present research.
Once the potentially hampering specific conditions of the ILO sector arose, a new grand model (ALL*) was tested excluding ILO from all sectors (which were reduced to four) and obtaining better locally imported results (
Table 4). With the exception of SSV, these new imported models performed with similar, largely satisfactory AUCs to the local models and even higher sensitivity.
5. Conclusions
On the basis of the obtained results, it is confirmed that grouping landslide inventories from different areas to increase the number of cases can lead to very unreliable results unless further validation tests are carried out. In particular, depending on both the number of landslides and frequency distribution of all the predictors in each of the grouped sectors, the grand model can be seen as having very high performance on average, but is very misleading and unstable on a local scale. In light of this effect, locally calibrated models can have better performance even if trained with a lower number of cases. This would typically lead to attaining a sense of security and considering the obtained prediction image as reliable for the study area, eventually suggesting that the obtained model also be exported to new neighboring unrecognized sectors (e.g., those between the five mapped ones). In this paper, a new approach was adopted, and related tools were proposed for verifying the inventory completeness hypothesis. This approach can be involved in any model building procedure so as to obtain warnings about the quality of the source data and its influence on the resolution of the derived susceptibility models.
Comparing grand to local models should be a standard procedure when assembling large landslide inventories, even in the case of secondary catchments in large basin-scale studies. The main factors controlling the performance of the grand model are the number of total pixels and the number of positives and the spatial distribution of the predictors. Two main factors hamper the accuracy and reliability of any grand model, based on a presence/absence method: depending on the relative spatial extension of the classes of each covariate, in light of the need to randomly extract the negatives to prepare balanced datasets, using the more diffused classes results in stable conditions; depending on the different levels of completeness of the merged landslide inventories, unstable conditions may come to light in the sectors or catchments with a higher number of mapped landslides. These two effects are much more severe for the categorical variables in the case of inhomogeneous geologic/geomorphologic settings, whilst DTM-derived variables are more unlikely to be so largely different as to mislead the modelling. It is worth noting that the limits produced by the qualitative and quantitative differences in the landslide inventories suggest that the adoption of presence-only methods is not suitable, also in light of the strong influence produced by any unrepresentativeness of the landslide inventories.
Optimizing susceptibility models for predicting new debris flow activation sites in volcanic areas is of crucial importance in El Salvador. In fact, under the triggering of the recurrent tropical storms which frequently strike the country, this kind of landslide rapidly evolves along the steep volcano flanks into very destructive debris flow phenomena hitting the hillside areas and causing damage and life losses. Investigating the reliability of prediction images for landslide activation constitutes a mandatory step in obtaining the starting base to be coupled with propagation algorithms for producing complete debris flow event scenarios.
Author Contributions
Conceptualization, C.M. (Chiara Martinello), C.M. (Claudio Mercurio), C.C. (Chiara Cappadonia), and E.R.; methodology, C.M. (Chiara Martinello), C.C. (Chiara Cappadonia), and E.R.; software, C.M. (Chiara Martinello) and C.M. (Claudio Mercurio); validation, C.M. (Chiara Martinello), C.M. (Claudio Mercurio), C.C. (Chiara Cappadonia), and C.C. (Christian Conoscenti); formal analysis, C.M. (Chiara Martinello), C.M. (Claudio Mercurio), C.C. (Chiara Cappadonia), and M.E.R.M.; investigation, M.E.R.M., M.Á.H.M. and C.M. (Claudio Mercurio); resources, C.M. (Claudio Mercurio) and M.Á.H.M.; M.E.R.M. and J.Y.R.A.; data curation, C.M. (Chiara Martinello), C.M. (Claudio Mercurio), M.E.R.M. and M.Á.H.M.; writing—original draft preparation, C.M. (Chiara Martinello), C.C. (Chiara Cappadonia), and C.M. (Claudio Mercurio); writing—review and editing, C.M. (Chiara Martinello), C.C. (Chiara Cappadonia), and E.R.; visualization, C.M. (Chiara Martinello), C.M. (Claudio Mercurio), and C.C. (Chiara Cappadonia); supervision, E.R., C.C. (Chiara Cappadonia) and C.C. (Christian Conoscenti); project administration, C.C. (Christian Conoscenti), J.Y.R.A. and E.R.; funding acquisition, J.Y.R.A., C.C. (Christian Conoscenti), and E.R. All authors have read and agreed to the published version of the manuscript.
Funding
This research was supported by the project RIESCA (Escenarios de Riesgos con Vigilancia y Monitoreo de los Fenómenos Volcánicos, Sísmicos e Hidrogeológicos en Centro América; coord. Prof. G. Giunta), funded by the Ministry of Foreign Affair of the Italian Government and realized by the University of Palermo, University of San Salvador and Ministerio de Medio Ambiente y Recursos Naturales—Gobierno de El Salvador.
Institutional Review Board Statement
Not applicable.
Informed Consent Statement
Not applicable.
Data Availability Statement
The landslide inventory, digital elevation model, soil use and geologic layers adopted for this study can be acquired from any of the authors. No remotely accessible databank is presently online.
Conflicts of Interest
The authors declare no conflict of interest.
References
- DeMets, C. A New Estimate for Present-Day Cocos-Caribbean Plate Motion:Implications for Slip along the Central American Volcanic Arc. Geophys. Res. Lett. 2001, 28, 4043–4046. [Google Scholar] [CrossRef] [Green Version]
- Agostini, S.; Corti, G.; Doglioni, C.; Carminati, E.; Innocenti, F.; Tonarini, S.; Manetti, P.; di Vincenzo, G.; Montanari, D. Tectonic and Magmatic Evolution of the Active Volcanic Front in El Salvador: Insight into the Berlín and Ahuachapán Geothermal Areas. Geothermics 2006, 35, 368–408. [Google Scholar] [CrossRef]
- Von Köppen, W. Handbuch Der Klimatologie in Fünf Bänden Das Geographische System der Klimate; Gebrüder Borntraeger Verlagsbuchhandlung: Berlin, Germany, 1936. [Google Scholar]
- The World Bank Group Climate Change Knowledge Portal. Available online: https://climateknowledgeportal.worldbank.org/ (accessed on 14 April 2022).
- Rotigliano, E.; Martinello, C.; Hernandéz, M.A.; Agnesi, V.; Conoscenti, C. Predicting the Landslides Triggered by the 2009 96E/Ida Tropical Storms in the Ilopango Caldera Area (El Salvador, CA): Optimizing MARS-Based Model Building and Validation Strategies. Environ. Earth Sci. 2019, 78, 210. [Google Scholar] [CrossRef]
- Rotigliano, E.; Martinello, C.; Agnesi, V.; Conoscenti, C. Evaluation of Debris Flow Susceptibility in El Salvador (CA): A Comparison between Multivariate Adaptive Regression Splines (MARS) and Binary Logistic Regression (BLR). Hung. Geogr. Bull. 2018, 67, 361–373. [Google Scholar] [CrossRef] [Green Version]
- Mercurio, C.; Martinello, C.; Rotigliano, E.; Argueta-Platero, A.A.; Reyes-Martínez, M.E.; Rivera-Ayala, J.Y.; Conoscenti, C. Mapping Susceptibility to Debris Flows Triggered by Tropical Storms: A Case Study of the San Vicente Volcano Area (El Salvador, CA). Earth 2021, 2, 66–85. [Google Scholar] [CrossRef]
- OCHA (Oficina para la Coordinación de Asuntos Humanitarios). El Salvador: Deslizamiento Por Lluvias—Nejapa; OCHA: New York, NY, USA, 2020. [Google Scholar]
- MARN (Ministerio de Medio Ambiente y Recursos Naturales). Síntesis de Los Informes de Evaluación Técnica de Las Lluvias Del 7 y 8 de Noviembre 2009 En El Salvador: Análisis Del Impacto Físico Natural y Vulnerabilidad Socio Ambiental; MARN: San Salvador, El Salvador, 2010.
- MARN. Depresión Tropical 12E/Sistema Depresionario Sobre El Salvador y Otros Eventos Extremos Del Pacífico; MARN: San Salvador, El Salvador, 2011.
- Cappadonia, C.; Cafiso, F.; Ferraro, R.; Martinello, C.; Rotigliano, E. Rockfall Hazards of Mount Pellegrino Area (Sicily, Southern Italy). J. Maps 2021, 17, 29–39. [Google Scholar] [CrossRef]
- Cafiso, F.; Cappadonia, C.; Ferraro, R.; Martinello, C. Rockfall hazard assessment of the Monte Gallo oriented nature reserve area (Southern Italy). In IOP Conference Series: Earth and Environmental Science, Proceedings of the Mechanics and Rock Engineering, from Theory to Practice, Turin, Italy, 20–25 September 2021; IOP Publishing Ltd.: Bristol, UK, 2021; Volume 833. [Google Scholar]
- Cafiso, F.; Cappadonia, C. Landslide Inventory and Rockfall Risk Assessment of a Strategic Urban Area (Palermo, Sicily). Rend. Online Soc. Geol. Ital. 2019, 48, 96–105. [Google Scholar] [CrossRef]
- KopaČková, V.; Šebesta, J. An approach for GIS-based statistical landslide susceptibility zonation: With a case study in the northern part of El Salvador. In Proceedings of the SPIE—The International Society for Optical Engineering, Florence, Italy, 17 September 2007; Volume 6749. [Google Scholar]
- García-Rodríguez, M.J.; Malpica, J.A.; Benito, B.; Díaz, M. Susceptibility Assessment of Earthquake-Triggered Landslides in El Salvador Using Logistic Regression. Geomorphology 2008, 95, 172–191. [Google Scholar] [CrossRef] [Green Version]
- García-Rodríguez, M.J.; Malpica, J.A. Assessment of Earthquake-Triggered Landslide Susceptibility in El Salvador Based on an Artificial Neural Network Model. Nat. Hazards Earth Syst. Sci. 2010, 10, 1307–1315. [Google Scholar] [CrossRef]
- Kirschbaum, D.; Stanley, T.; Yatheendradas, S. Modeling Landslide Susceptibility over Large Regions with Fuzzy Overlay. Landslides 2016, 13, 485–496. [Google Scholar] [CrossRef]
- MARN. Memoria Técnica Para El Mapa de Susceptibilidad de Deslizamientos de Tierra En El Salvador; MARN: San Salvador, El Salvador, 2004. [Google Scholar]
- Mora, C.S.; Vahrson, W.G. Macrozonation Methodology for Landslide Hazard Determination. Environ. Eng. Geosci. 1994, 31, 49–58. [Google Scholar] [CrossRef]
- Mora, S.; Vahrson, W.G. Determinación “A Priori” de la amenaza de deslizamientos en grandes áreas utilizando indicadores morfodinámicos. In Memoria Del Primer Simposio Internacional Sobre Sensores Remotos Y Sistemas De Información Geografica (SIG) Para El Estudio De Riesgos Naturales; IGAC: Bogotá, Colombia, 1992; pp. 259–273. [Google Scholar]
- Steger, S.; Brenning, A.; Bell, R.; Glade, T. The Influence of Systematically Incomplete Shallow Landslide Inventories on Statistical Susceptibility Models and Suggestions for Improvements. Landslides 2017, 14, 1767–1781. [Google Scholar] [CrossRef] [Green Version]
- Steger, S.; Mair, V.; Kofler, C.; Pittore, M.; Zebisch, M.; Schneiderbauer, S. Correlation Does Not Imply Geomorphic Causation in Data-Driven Landslide Susceptibility Modelling—Benefits of Exploring Landslide Data Collection Effects. Sci. Total Environ. 2021, 776, 145935. [Google Scholar] [CrossRef]
- Friedman, J.H. Multivariate Adaptive Regression Splines. Ann. Stat. 1991, 19, 1–67. [Google Scholar] [CrossRef]
- QGIS.org. QGIS Geographic Information System; QGIS Association, 2022; Available online: http://www.qgis.org (accessed on 26 April 2022).
- Conrad, O.; Bechtel, B.; Bock, M.; Dietrich, H.; Fischer, E.; Gerlitz, L.; Wehberg, J.; Wichmann, V.; Böhner, J. System for Automated Geoscientific Analyses (SAGA) v. 2.1.4. Geosci. Model Dev. 2015, 8, 1991–2007. [Google Scholar] [CrossRef] [Green Version]
- RStudio Team. RStudio: Integrated Development for R; RStudio Team: Boston, MA, USA, 2020. [Google Scholar]
- CEPAL (Comisión Económica para América Latina y el Caribe). El Salvador: Impacto Socioeconómico, Ambiental y de Riesgo Por La Baja Presión Asociada a La Tormenta Tropical Ida En Noviembre de 2009; Cepal: Santiago, Chile, 2010. [Google Scholar]
- CEPAL (Comisión Económica para América Latina y el Caribe). Evaluación de Daños y Pérdidas En El Salvador Ocasionados Por La Depresión Tropical 12E; Cepal: Santiago, Chile, 2011. [Google Scholar]
- Rotigliano, E.; Agnesi, V.; Cappadonia, C.; Conoscenti, C. The Role of the Diagnostic Areas in the Assessment of Landslide Susceptibility Models: A Test in the Sicilian Chain. Nat. Hazards 2011, 58, 981–999. [Google Scholar] [CrossRef]
- Lombardo, L.; Cama, M.; Maerker, M.; Rotigliano, E. A Test of Transferability for Landslides Susceptibility Models under Extreme Climatic Events: Application to the Messina 2009 Disaster. Nat. Hazards 2014, 74, 1951–1989. [Google Scholar] [CrossRef]
- Costanzo, D.; Chacón, J.; Conoscenti, C.; Irigaray, C.; Rotigliano, E. Forward Logistic Regression for Earth-Flow Landslide Susceptibility Assessment in the Platani River Basin (Southern Sicily, Italy). Landslides 2014, 11, 639–653. [Google Scholar] [CrossRef] [Green Version]
- Cama, M.; Lombardo, L.; Conoscenti, C.; Agnesi, V.; Rotigliano, E. Predicting Storm-Triggered Debris Flow Events: Application to the 2009 Ionian Peloritan Disaster (Sicily, Italy). Nat. Hazards Earth Syst. Sci. 2015, 15, 1785–1806. [Google Scholar] [CrossRef] [Green Version]
- Lombardo, L.; Cama, M.; Conoscenti, C.; Märker, M.; Rotigliano, E. Binary Logistic Regression versus Stochastic Gradient Boosted Decision Trees in Assessing Landslide Susceptibility for Multiple-Occurring Landslide Events: Application to the 2009 Storm Event in Messina (Sicily, Southern Italy). Nat. Hazards 2015, 79, 1621–1648. [Google Scholar] [CrossRef]
- Costanzo, D.; Rotigliano, E.; Irigaray, C.; Jiménez-Perálvarez, J.D.; Chacón, J. Factors Selection in Landslide Susceptibility Modelling on Large Scale Following the Gis Matrix Method: Application to the River Beiro Basin (Spain). Nat. Hazards Earth Syst. Sci. 2012, 12, 327–340. [Google Scholar] [CrossRef]
- Vargas-Cuervo, G.; Rotigliano, E.; Conoscenti, C. Prediction of Debris-Avalanches and -Flows Triggered by a Tropical Storm by Using a Stochastic Approach: An Application to the Events Occurred in Mocoa (Colombia) on 1 April 2017. Geomorphology 2019, 339, 31–43. [Google Scholar] [CrossRef]
- Martinello, C.; Cappadonia, C.; Conoscenti, C.; Agnesi, V.; Rotigliano, E. Optimal Slope Units Partitioning in Landslide Susceptibility Mapping. J. Maps 2020, 17, 152–162. [Google Scholar] [CrossRef]
- Martinello, C.; Cappadonia, C.; Conoscenti, C.; Rotigliano, E. Landform Classification: A High-Performing Mapping Unit Partitioning Tool for Landslide Susceptibility Assessment—A Test in the Imera River Basin (Northern Sicily, Italy). Landslides 2022, 19, 539–553. [Google Scholar] [CrossRef]
- Weber, H.S.; Wiesemann, G.; Lorenz, W. Schmidt-Thome Mapa Geologico de La Republica de El Salvador/America Central, 1:100,000; Bundesanstalt fur Geowissenschaften und Rhhstoffe: Hannover, Germany, 1978.
- Wilson, J.P.; Gallant, J.C. Primary topographic attributes. In Terrain Analysis: Principles and Applications; Wilson, J.P., Gallant, J.C., Eds.; John Wiley & Sons: Hoboken, NJ, USA, 2000. [Google Scholar]
- Burrough, P.A.; McDonnell, R.A. Principle of Geographic Information Systems CODRA—Creating Opportunities to Develop Resilient Agriculture View Project Groundwater Governance in the Arab World: Taking Stock and Addressing the Challenges View Project; Oxford University Press: Oxford, UK, 1998. [Google Scholar]
- Zevenbergen, L.W.; Thorne, C.R. Quantitative Analysis of Land Surface Topography. Earth Surf. Process. Landf. 1987, 12, 47–56. [Google Scholar] [CrossRef]
- Beven, K.J.; Kirkby, M.J. A Physically Based, Variable Contributing Area Model of Basin Hydrology. Hydrol. Sci. Bull. 1979, 24, 43–69. [Google Scholar] [CrossRef] [Green Version]
- Schmidt-Thomé, M. The Geology in the San Salvador Area (El Salvador, Central America), a Basis for City Development and Planning; Geologisches Jahrbuch der BGR: Hanover, Germany, 1975. [Google Scholar]
- Cama, M.; Conoscenti, C.; Lombardo, L.; Rotigliano, E. Exploring Relationships between Grid Cell Size and Accuracy for Debris-Flow Susceptibility Models: A Test in the Giampilieri Catchment (Sicily, Italy). Environ. Earth Sci. 2016, 75, 238. [Google Scholar] [CrossRef]
- Mokhtari, M.; Abedian, S. Spatial Prediction of Landslide Susceptibility in Taleghan Basin, Iran. Stoch. Environ. Res. Risk Assess. 2019, 33, 1297–1325. [Google Scholar] [CrossRef]
- Cama, M.; Lombardo, L.; Conoscenti, C.; Rotigliano, E. Improving Transferability Strategies for Debris Flow Susceptibility AssessmentApplication to the Saponara and Itala Catchments (Messina, Italy). Geomorphology 2017, 288, 52–65. [Google Scholar] [CrossRef]
- Lombardo, L.; Bachofer, F.; Cama, M.; Märker, M.; Rotigliano, E. Exploiting Maximum Entropy Method and ASTER Data for Assessing Debris Flow and Debris Slide Susceptibility for the Giampilieri Catchment (North-Eastern Sicily, Italy). Earth Surf. Process. Landf. 2016, 41, 1776–1789. [Google Scholar] [CrossRef] [Green Version]
- Nicu, I.C.; Asăndulesei, A. GIS-Based Evaluation of Diagnostic Areas in Landslide Susceptibility Analysis of Bahluieț River Basin (Moldavian Plateau, NE Romania). Are Neolithic Sites in Danger? Geomorphology 2018, 314, 27–41. [Google Scholar] [CrossRef]
- Sameen, M.I.; Pradhan, B.; Bui, D.T.; Alamri, A.M. Systematic Sample Subdividing Strategy for Training Landslide Susceptibility Models. Catena 2020, 187, 104358. [Google Scholar] [CrossRef]
- Erener, A.; Sivas, A.A.; Selcuk-Kestel, A.S.; Düzgün, H.S. Analysis of Training Sample Selection Strategies for Regression-Based Quantitative Landslide Susceptibility Mapping Methods. Comput. Geosci. 2017, 104, 62–74. [Google Scholar] [CrossRef]
- Naimi, B. Package “Usdm”. Uncertainty Analysis for Species Distribution Models. Available online: https://cran.r-project.org/web/packages/usdm/usdm.pdf (accessed on 26 April 2022).
- Felicísimo, Á.M.; Cuartero, A.; Remondo, J.; Quirós, E. Mapping Landslide Susceptibility with Logistic Regression, Multiple Adaptive Regression Splines, Classification and Regression Trees, and Maximum Entropy Methods: A Comparative Study. Landslides 2013, 10, 175–189. [Google Scholar] [CrossRef]
- Pourghasemi, H.R.; Rossi, M. Landslide Susceptibility Modeling in a Landslide Prone Area in Mazandarn Province, North of Iran: A Comparison between GLM, GAM, MARS, and M-AHP Methods. Theor. Appl. Climatol. 2017, 130, 609–633. [Google Scholar] [CrossRef]
- Conoscenti, C.; Ciaccio, M.; Caraballo-Arias, N.A.; Gómez-Gutiérrez, Á.; Rotigliano, E.; Agnesi, V. Assessment of Susceptibility to Earth-Flow Landslide Using Logistic Regression and Multivariate Adaptive Regression Splines: A Case of the Belice River Basin (Western Sicily, Italy). Geomorphology 2015, 242, 49–64. [Google Scholar] [CrossRef]
- Conoscenti, C.; Rotigliano, E.; Cama, M.; Caraballo-Arias, N.A.; Lombardo, L.; Agnesi, V. Exploring the Effect of Absence Selection on Landslide Susceptibility Models: A Case Study in Sicily, Italy. Geomorphology 2016, 261, 222–235. [Google Scholar] [CrossRef]
- Liu, C.-C.; Luo, W.; Chung, H.-W.; Yin, H.-Y.; Yan, K.-W. Influences of the Shadow Inventory on a Landslide Susceptibility Model. ISPRS Int. J. Geo-Inf. 2018, 7, 374. [Google Scholar] [CrossRef] [Green Version]
- Lay, U.S.; Pradhan, B.; Yusoff, Z.B.M.; Abdallah, A.F.B.; Aryal, J.; Park, H.-J. Data Mining and Statistical Approaches in Debris-Flow Susceptibility Modelling Using Airborne LiDAR Data. Sensors 2019, 19, 3451. [Google Scholar] [CrossRef] [Green Version]
- Wang, L.J.; Guo, M.; Sawada, K.; Lin, J.; Zhang, J. Landslide Susceptibility Mapping in Mizunami City, Japan: A Comparison between Logistic Regression, Bivariate Statistical Analysis and Multivariate Adaptive Regression Spline Models. Catena 2015, 135, 271–282. [Google Scholar] [CrossRef]
- Conoscenti, C.; Martinello, C.; Alfonso-Torreño, A.; Gómez-Gutiérrez, Á. Predicting Sediment Deposition Rate in Check-Dams Using Machine Learning Techniques and High-Resolution DEMs. Environ. Earth Sci. 2021, 80, 380. [Google Scholar] [CrossRef]
- Milborrow, S. Notes on the Earth Package. 2014, pp. 1–60. Available online: http://mtweb.cs.ucl.ac.uk/mus/lib/R/earth/doc/earth-notes.pdf (accessed on 26 April 2022).
- Fawcett, T. An Introduction to ROC Analysis. Pattern Recognit. Lett. 2006, 27, 861–874. [Google Scholar] [CrossRef]
- Lasko, T.A.; Bhagwat, J.G.; Zou, K.H.; Ohno-Machado, L. The Use of Receiver Operating Characteristic Curves in Biomedical Informatics. J. Biomed. Inform. 2005, 38, 404–415. [Google Scholar] [CrossRef] [PubMed] [Green Version]
- Goodenough, D.J.; Rossmann, K.; Lusted, L.B. Radiographic Applications of Receiver Operating Characteristic (ROC) Curves. Diagn. Radiol. 1974, 110, 89–95. [Google Scholar] [CrossRef]
- Hosmer, D.W.; Lemeshow, S. Applied Logistic Regression; John Wiley & Sons, Inc.: Hoboken, NJ, USA, 2000; ISBN 0471722146. [Google Scholar]
- Hanley, J.A.; McNeil, B.J. The Meaning and Use of the Area under a Receiver Operating Characteristic (ROC) Curve1. Radiology 1982, 143, 29–36. [Google Scholar] [CrossRef] [Green Version]
- Youden, W.J. Index for Rating Diagnostic Tests. Cancer 1950, 3, 32–35. [Google Scholar] [CrossRef]
- Chung, C.J.F.; Fabbri, A.G. Validation of Spatial Prediction Models for Landslide Hazard Mapping. Nat. Hazards 2003, 30, 451–472. [Google Scholar] [CrossRef]
- Guzzetti, F.; Reichenbach, P.; Ardizzone, F.; Cardinali, M.; Galli, M. Estimating the Quality of Landslide Susceptibility Models. Geomorphology 2006, 81, 166–184. [Google Scholar] [CrossRef]
| Publisher’s Note: MDPI stays neutral with regard to jurisdictional claims in published maps and institutional affiliations. |
© 2022 by the authors. Licensee MDPI, Basel, Switzerland. This article is an open access article distributed under the terms and conditions of the Creative Commons Attribution (CC BY) license (https://creativecommons.org/licenses/by/4.0/).


 ,
, 


