Article

Experimental Study of the Plastic Zone and Stress Asymmetric Distribution in Roadway Layered Surrounding Rocks

1
Work Safety Key Lab on Prevention and Control of Gas and Roof Disasters for Southern Goal Mines, Hunan University of Science and Technology, Xiangtan 411201, China
2
School of Resources, Environment and Safety Engineering, Hunan University of Science and Technology, Xiangtan 411201, China
3
China Occupational Safety and Health Association, Beijing 100013, China
4
Railway No. 5 Bureau Group First Engineering Co., Ltd., Changsha 411104, China
5
State Key Laboratory of Mining Response and Disaster Prevention and Control in Deep Coal Mines, Anhui University of Science and Technology, Huainan 232001, China
*
Author to whom correspondence should be addressed.
Appl. Sci. 2022, 12(12), 6108; https://doi.org/10.3390/app12126108
Submission received: 2 April 2022 / Revised: 7 June 2022 / Accepted: 10 June 2022 / Published: 16 June 2022

Abstract

:

Featured Application

The research in this paper is of great significance for grasping the development pattern of the plastic zone and the stress distribution of the roadway (tunnel) layered surrounding rock. It has an important reference value for the support problem of a roadway (tunnel) and the design of the surrounding rock support scheme.

Abstract

A three-axis experimental simulation model was established for a roadway with layered surrounding rock by a 20 MPa true triaxial analog simulation equipment, and the corresponding layered surrounding rock numerical simulation model was established by discrete element software. The simulation results showed that the deformation of the roadway layered surrounding rock showed asynchronous deformation with time and asymmetric deformation in space. The measured results of the multipoint displacement meter inside the surrounding rock showed that the order of displacement of surrounding rock from the four corners of the roadway to the center of the roadway were upper right, lower left, upper left, and lower right. Under the influence of the surrounding rock bedding, the shape of the plastic zone of the roadway surrounding rock was irregular. In the area where the rock layer and the surface of the roadway were tangent and in the vertical area between the rock layer and the surface of the roadway, the plastic zone had a large development depth. In other regions, the development depth of the plastic zone was smaller. As a result, the stress values obtained at the monitoring points in the surrounding rock at the same distance from the roadway surface were different, and the stress increase value of the monitoring points in the plastic zone was not large (No. 929). With the expansion of the plastic zone, the monitoring point change from outside the plastic zone to inside the plastic zone, its stress first increased and then decreased (No. 2 and No. 872). The experimental results are of great significance for understanding and controlling the development law of the plastic zone of a layered inclined rock roadway and the deformation control of the roadway layered surrounding rock.

1. Research Status of the Roadway Layered Surrounding Rock Plastic Zone

The occurrence of coal resources is complicated, and more than 50% of coal mines are in inclined rock formations. As a result, most of the roadway-surrounding rock in the coal mining process is layered surrounding rock. After the coal mine enters deep mining, the secondary stress distribution range of roadway surrounding rock increases, the influence of the plastic zone on the stability of the roadway surrounding rock increases. Li et al. [1] put forward the concept of an equivalent excavation zone based on plastic zone distribution. Jia et al. [2] studied the distribution law of the butterfly leaf plastic zone in the layered roof roadway, Ma et al. [3] studied the occurrence mechanism and judgment criterion on circular tunnel butterfly rockburst in a homogeneous medium, and Li et al. [4] clarified the mechanical mechanism of the roof fall of the roadway caused by the penetration distribution of the butterfly leaf plastic zone. Liu et al. [5] studied the principal stress change law and the expansion characteristics of the plastic zone in the double-entry face and clarified the reasons for the asymmetric deformation of the entry retention. At the same time, the research on the distribution characteristics of the surrounding rock plastic zone in the deep roadway mainly focuses on theoretical analysis and numerical simulation analysis. According to the deformation characteristics of the surrounding rock during the construction of a high-stress soft rock tunnel, Li et al. [6] believes that the surrounding rock is mainly dam-aged by shearing, the crack expansion phenomenon is obvious, and the effect of grouting on strengthening the surrounding rock and maintaining the bolt is significant. Multilayer support can release the deformation of the surrounding rock in a controlled manner, improve the structural stress, and reduce the influence of the rheological characteristics of the surrounding rock. Liu et al. [7] carried out further research on the theoretical calculation of the loose circle range of roadway-surrounding rock and put forward the factors that need to be considered in a theoretical calculation. Wang et al. [8] used FLAC3D and other simulation analyses to find that the development of a plastic zone generally goes through five stages, namely the appearance of a plastic point, the formation of a plastic ring, local distortion of a plastic ring, non-uniform expansion of the plastic zone, and malignant expansion of the plastic zone. Yuan et al. [9] believed that the instability of the roadway-surrounding rock is mainly caused by the malignant expansion of the plastic zone caused by the local distortions of the plastic ring, and Wang et al. [10] analyzed the influence of the lateral pressure coefficient on the morphological distribution of the plastic zone. Zhang et al. [11] used the FLAC3D simulation software to compare and analyze the stress field, the displacement field, and the plastic zone range of the surrounding rock before and after the typical cross-layer roadway support. Shao et al. [12] used FLAC3D to simulate and analyze the slippage mechanism and support countermeasures of the roadway in a gangue-containing mudstone coal seam. Yu et al. [13] found that the process of roadway deformation and failure has obvious stages, obtained the distribution law of surrounding rock stress and the plastic zone in the roadway without the support. Zhao et al. [14,15] studied the distribution law of the plastic zone of a large deformation mining roadway and the failure characteristics of the roadway surrounding rock. The mechanism of the “butterfly-shaped” plastic zone rotating with the principal stress direction of the superimposed stress field during mining and causing the large asymmetrical deformation of the surrounding rock of the mining roadway was revealed.
In terms of the deformation characteristics of roadway layered surrounding rock. Yang et al. [16] believes that the deformation and failure of steeply inclined soft and hard interlayer roadways are asymmetric, and the bias effect is obvious. Chen et al. [17] also conducted a certain experimental study on the main reasons for the asymmetric deformation of a roadway and believes that the main reason for the asymmetric deformation of a roadway is the effect of non-uniform loads. Ma et al. [18] carried out a model test study on the law of deformation and failure of excavation in a deep rock mass with multilayer joints with different dip angles. It is considered that the extent of the plastic zone around the cave increases with the increase of the inclination angle of the fracture. The greater the inclination angle of the fracture, the more easily the plastic zone around the cave is connected with the upper and lower fracture surfaces of the cavern. Yin et al. [19] carried out an experimental study on the effect of the intermediate principal stress on the plastic zone around the mean surrounding rock hole. Yaylaci M. [20] simulated the edge and an internal crack problem, and an estimation of the stress intensity factor through the finite element method and the stress-intensity factor (SIF) were obtained. Öner et al. [21] studied the frictionless double receding contact problem for two functionally graded (FG) layers pressed by a uniformly distributed load. The obtained results help in designing multibody indentation systems with FGMs. Yaylaci Murat et al. [22] analyzed the contact problem of a functionally graded layer resting on an elastic half-plane with the theory of elasticity, the finite element method, and a multilayer perceptron. Yaylaci M. et al. [23] solved the contact problem of functionally graded layers resting on an HP and pressed with a uniformly distributed load by analytical and numerical methods. However, these studies still have shortcomings such as a relatively small simulation analysis of layered surrounding rock and insufficient experimental research results. In this paper, a triaxial experimental simulation model for layered roadway-surrounding rock is established. Through the loading experiment of true triaxial high stress, combined with a corresponding layered surrounding rock numerical simulation model, the influence range and distribution characteristics of the plastic zone of the roadway-surrounding rock are studied.

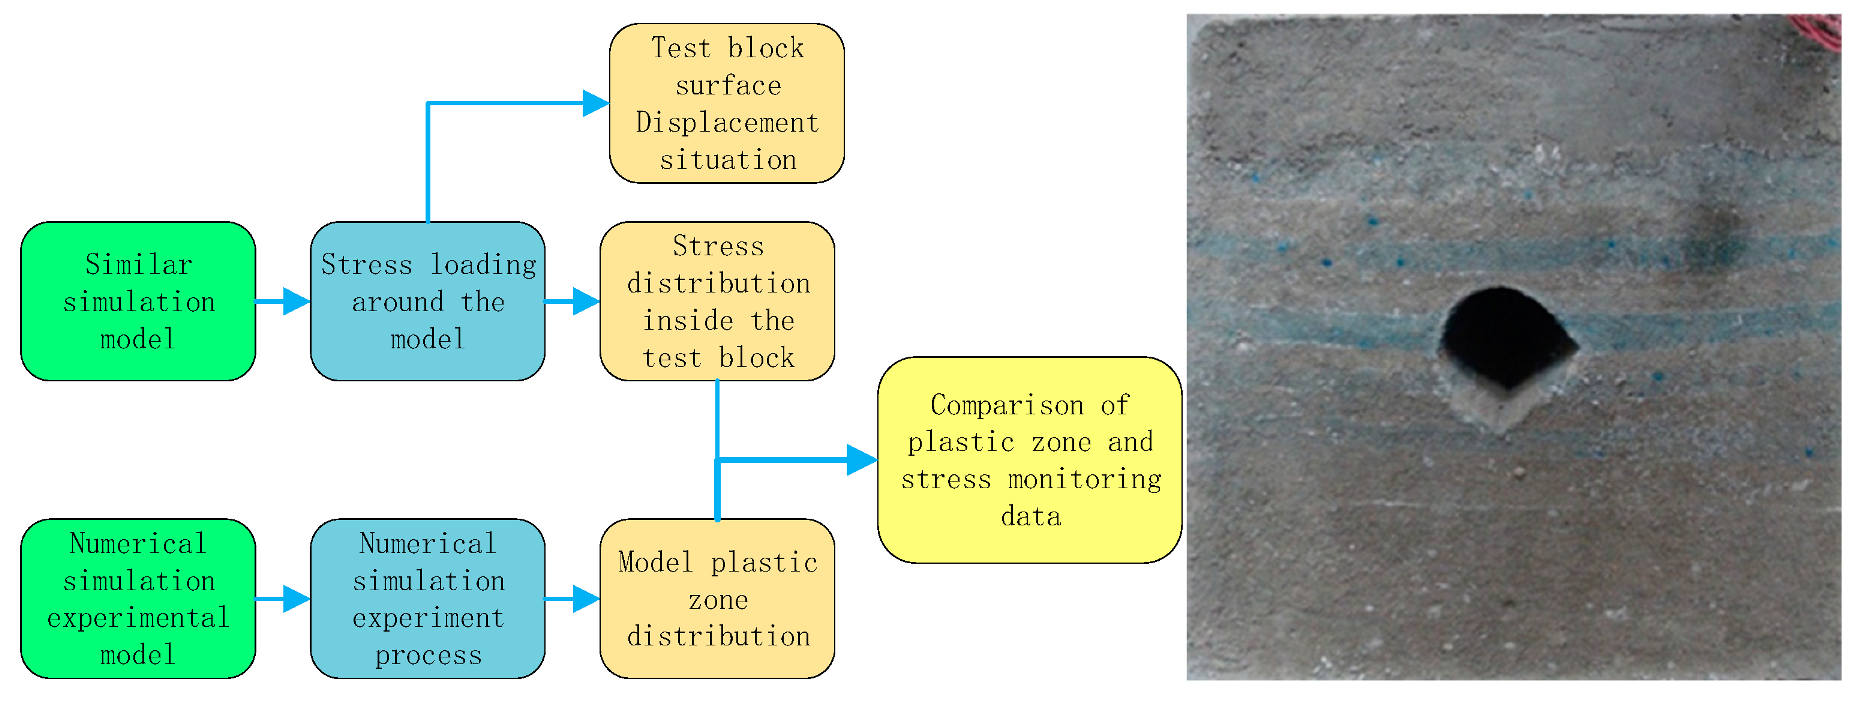
2. Establishment and Simulation Analysis of the Experimental Model of Roadway Layered Surrounding Rock

2.1. Introduction of the Experimental Equipment

The 20 MPa “three directions and five planes” vertical main loading experimental system consists of four parts: host system, electro-hydraulic servo system, measurement and control system, and sample preparation system, and realizes “three directions and five planes” independent active loading. It can independently adjust the loading size, speed, and holding time of each surface, and the maximum loading stress of each surface is 20 MPa. The system adopts a separate design in which test-block-making and the experimental loading process are independent of each other. Multiple test blocks with different parameters can be prefabricated in advance, and multiple loading experiments can be carried out continuously. Loading surfaces in the vertical direction: length × width = 1000 × 1000 mm, four surfaces in the horizontal direction: length × width = 1000 × 400 mm. The experimental procedure is shown in Figure 1.

2.2. Production of Experimental Models

The main materials of similar simulation materials were cement, gypsum, and river sand, and the ratio was 4:0.7:0.3. To prevent the test block from collapsing after failure, a certain amount of polypropylene fiber for construction was added, the fiber length was 12 mm, and the dosage was 5 kg/m3. Borax was used as the retarder, and the dosage was 5% of the water amount. The uniaxial compressive strength of similar materials reached 3.8 MPa [24]. The size of the experimental test block was: length × width × height = 1000 × 1000 × 400 mm, and the excavation radius of the roadway in the model was 90 mm. The prepared experimental model is shown in Figure 1.

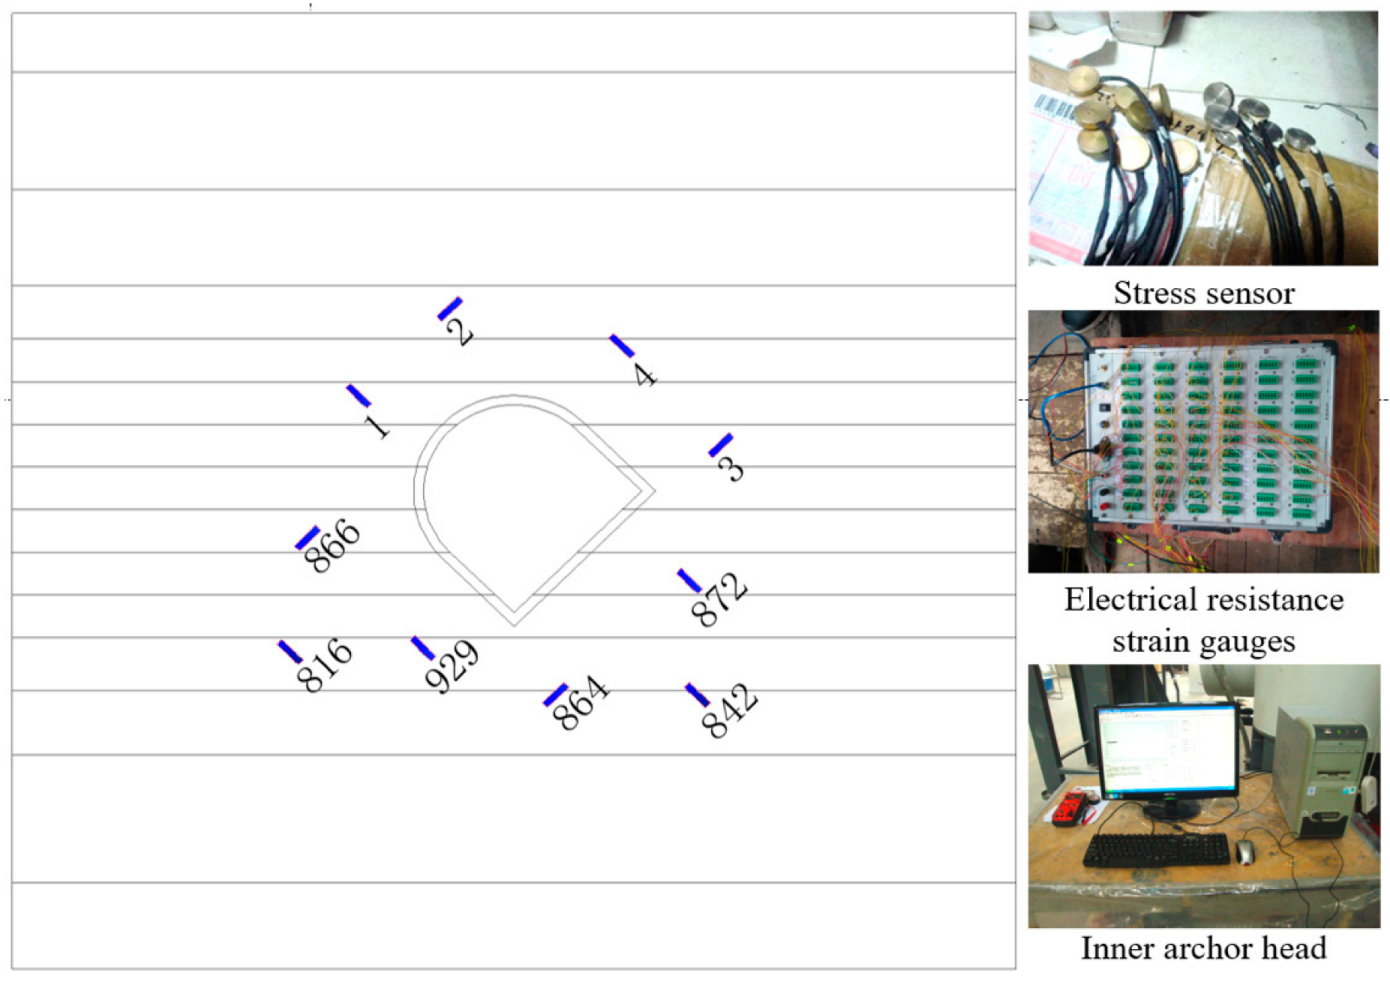
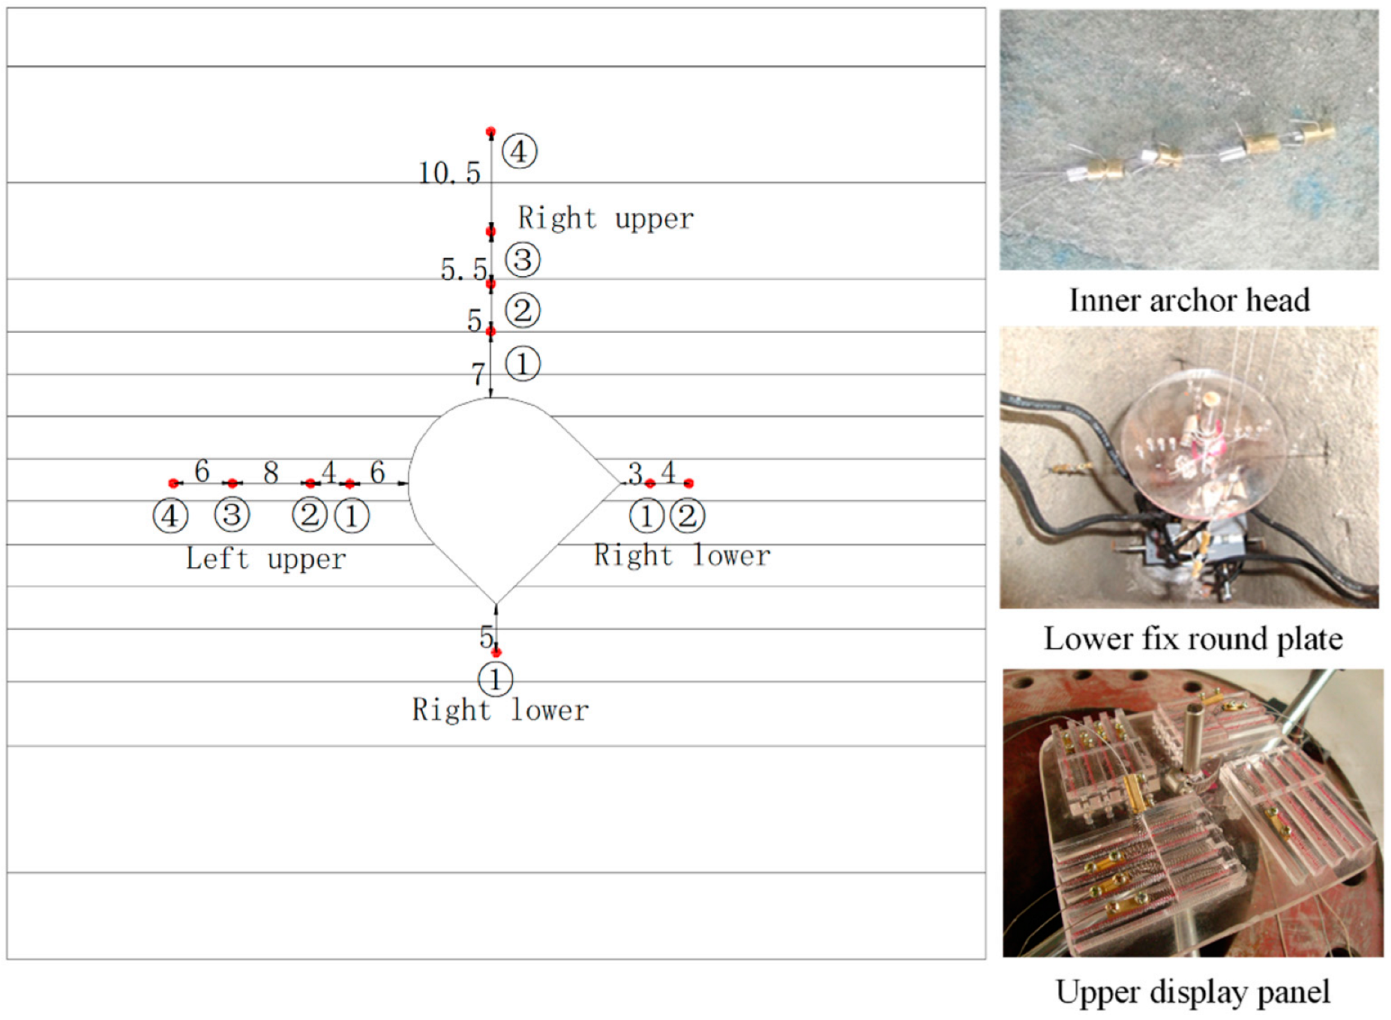
2.3. Experiment-Related Data Acquisition

(1) Use a Tianyuan three-dimensional photogrammetry system to measure the deformation and displacement of the roadway surrounding rock. The system can obtain the three-dimensional displacement of the monitoring point by comparing the taken pictures; (2) A pressure cell is arranged in the surrounding rock of the roadway to measure the stress increase at different positions inside the surrounding rock. The layout of the monitoring points is shown in Figure 2, The pressure boxes are connected to the strain resistance box and are exported to Excel through the soft data of the resistance box, and the stress change value is obtained by conversion; (3) The displacement of monitoring points in the surrounding rock of the roadway is measured by a self-made multipoint displacement meter, as shown in Figure 3. the multipoint displacement meter readings are recorded according to the stress loading steps to obtain the change value of the monitoring points inside the surrounding rock.

2.4. Experimental Stress-Loading Scheme

The stress-loading in the experimental process was divided into two steps: (1) Stress adjustment and preparation stage. The vertical, front, rear, left, and right stresses are simultaneously loaded from 0 to 3 MPa. (2) Experimental stage. The surrounding rock stress starts from 3 MPa, and the stress increases by 0.2 MPa each time. After each stress increase, the stress is kept unchanged for 5 min; then, continue to increase the stress by 0.2 MPa until the destruction of the simulation model.

3. Analysis of Simulation Results

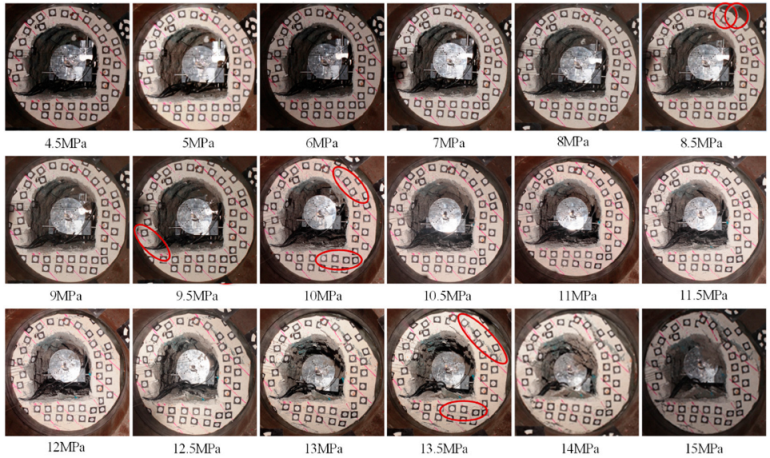
3.1. Surface Deformation and Analysis of Roadway Surrounding Rock

The observations show that (Figure 4) when the stress value of the roadway surrounding rock was less than 8.5 MPa, there was no obvious crack in the surrounding rock of the roadway. When the surrounding rock stress increased to 8.5 MPa, cracks began to occur in the roadway floor and in the zone where the upper zone of the roof was tangent to the parallel line of the rock stratum inclination, as show in Figure 4, 8.5 MPa red circle; with the increase of the surrounding rock stress, the cracks in these two zones gradually expanded. When the surrounding rock stress was 9.5 MPa, as show in Figure 4, 9.5 MPa red circle, the interlayer joint surface in the high and bottom corners of the roadway was separated; when the surrounding rock stress was 10 MPa, as show in Figure 4, 10 MPa red circle, the development of the upper of the roadway floor and the roof was very obvious.
With the further increase of surrounding rock stress, the cracks in the roadway surrounding rock gradually expanded. When the surrounding rock stress was greater than 13.5 MPa, as show in Figure 4, 13.5 MPa red circle, the low upper zone of the roadway showed obvious layer separation along the joint surface of the rock formation. At the same time, there was also the phenomenon of interlayer slippage at the high-top bottom corner of the roadway, and the floor of the roadway had an obvious bottom bulge phenomenon in the center of the roadway.
When the surrounding rock stress increased to 15 MPa (Figure 4), the roadway was structurally damaged, and in the upper zone where the roof and the low side intersected occurred a large deformation and damage, and the roadway floor heaving phenomenon was serious. This shows that these two areas were the weak links in the stability of the surrounding rock structure of the roadway, and the damage to the roadway surrounding rock first occurred in these two areas.

3.2. Data Analysis of Surface-Surrounding Rock Deformation

The monitoring points arranged on the surface of the model were observed by photogrammetry, the coordinate data of the monitoring points of the model were extracted, and the position change of the monitoring points of the roadway surrounding rock under the surrounding rock stress of 4 and 15 MPa was drawn in combination with the Origin analysis-drawing software, as shown in Figure 5.
Figure 5 shows that the deformation and failure of the roadway-surrounding rock were obviously non-uniform, and the roof and the lower side of the roadway were greatly deformed, while the deformation in the floor of the roadway was still small. The deformation of the roadway floor showed that the displacement near the center point in the floor was the largest, and the displacement on both sides was small. The deformation of the high and low sides of the roadway showed that the displacement of the high sides was small and the integrity was better. In the low-top upper area where the low-top zone and the roof intersected, the displacement of the tangent position between the roadway surface and the rock formation was the largest, and there was an obvious interlayer separation.
Continuous observation of the multipoint displacement meter can help obtain the displacement data of the monitoring points inside the surrounding rock under the stress of the roadway-surrounding rock.
The multipoint displacement meter reading value of the roadway-surrounding rock (Figure 6) shows that with the increase of the roadway surrounding rock stress, the displacement of the monitoring points in the surrounding rock of the model roadway had the following characteristics: The surrounding rock of the roadway was displaced towards the center of the roadway, and the displacement of the surrounding rock to the center of the roadway increased gradually with the increase of the surrounding rock stress of the roadway. As the distance from the roadway surface increased, the displacement of the surrounding rock to the roadway center decreased gradually. The surface displacement of the right upper zone was the largest. With the increase of the surrounding rock stress of the roadway, it reached 16 mm. When the surrounding rock stress was lower than 10 MPa, the displacement growth rate was slow, and the displacement growth rate was faster with the increase of surrounding rock stress. As the distance from the roadway surface increased, the displacement of the surrounding rock to the center of the roadway gradually decreased, and the maximum displacement of the No. 4 point on the right upper zonewas 10 mm. The surface displacement of the left upper zone reached 12 mm. When the surrounding rock stress was lower than 9.5 MPa, the displacement growth rate was slow. With the increase of the surrounding rock stress, the displacement growth rate was faster. As the distance from the roadway surface increased, the maximum displacement of point 4 on the left upper was 5 mm. The surface displacement of the left bottom corner is 15 mm, and the surface displacement larger than the right bottom corner is 9 mm. The figure also shows that the displacement of point 4 near the outer boundary of the model was smaller than that of point 3. As the distance from the roadway surface increased, the displacement of the surrounding rock to the center of the roadway gradually decreased, mainly because of the loading around the model. The displacement of the surrounding rock of the high gangway was only 1/2 of that of the low gangway, and the displacement of the roof and floor was the same. From the perspective of deformation characteristics, the displacement of the upper of the right side and the lower of the left side of the roadway was large, and the displacement of the upper of the left side and the lower of the right side was small.
The stress monitoring change curve (Figure 7) shows that the stress distribution in the model had the following characteristics: With the increase of the surrounding rock stress, the stress value of the monitoring point almost always increases Before the surrounding rock stress reached 6 MPa, the stress increased slowly, and then the stress growth rate increased significantly. Among them, three monitoring points had 866, 842, and 3 failures without monitoring stress values. Point 1 was located in the stable area of the high upper zone of the roadway, and the maximum stress reached 9.2 MPa. No. 816 monitoring point was far from the roadway surface, so the stress value was 8.5 MPa. No. 864 monitoring point was closer to the roadway surface than No. 816, so the stress value was 6 MPa. The stress values of monitoring points 872 and 929 did not change much, and the stress values were very small during the whole process. The stress of monitoring points No. 2 and No. 4 gradually increased before the large deformation of the upper of the right side and the low side. When the large deformation occurred, the stress increase value gradually decreased. With the withdrawal of the compressive stress of the model, the internal stress of the surrounding rock decreased sharply.

4. Numerical Simulation Analysis of Roadway Layered Surrounding Rock Deformation

4.1. Numerical Model Establishment

The numerical simulation model was established by discrete element software to compare and verify similar simulation results. The model size was set according to the physical model size of 100 × 100 × 10 cm, and the Mohr–Coulomb model was used. The stress conditions of the model were as follows: pressure was applied to the top, front and rear, left and right and left boundaries of the model, and the bottom edge was fixed. According to a similar proportion, an arched roadway with a diameter of 18 cm was excavated, and the gravitational acceleration of 10 m/s2 in the −Z direction, see Figure 8a model a. At the same time, to compare the development of the plastic zone, a simulation model without joints and the same conditions was established, as shown in Figure 8b model b. The model’s zone edge was 1 cm. The model was simplified, and the same mechanical parameters were used for all rock layers, and the same parameters were used for the contact parameters of the bedding interface.

4.2. Analysis of Simulation Results

After the model ran, the distribution of the plastic zone of the roadway surrounding rock was obtained, as shown in Figure 9. The results show that the existence of the joint plane had a significant impact on the development of the plastic zone:
(1)
Without the influence of the joint surface, the development depth of the plastic zone of the roadway roof and the two sides was the same, the development depth of the plastic zone of the roadway floor was larger, and the plastic zone was less developed at the intersection of the two sides and the floor of the roadway.
(2)
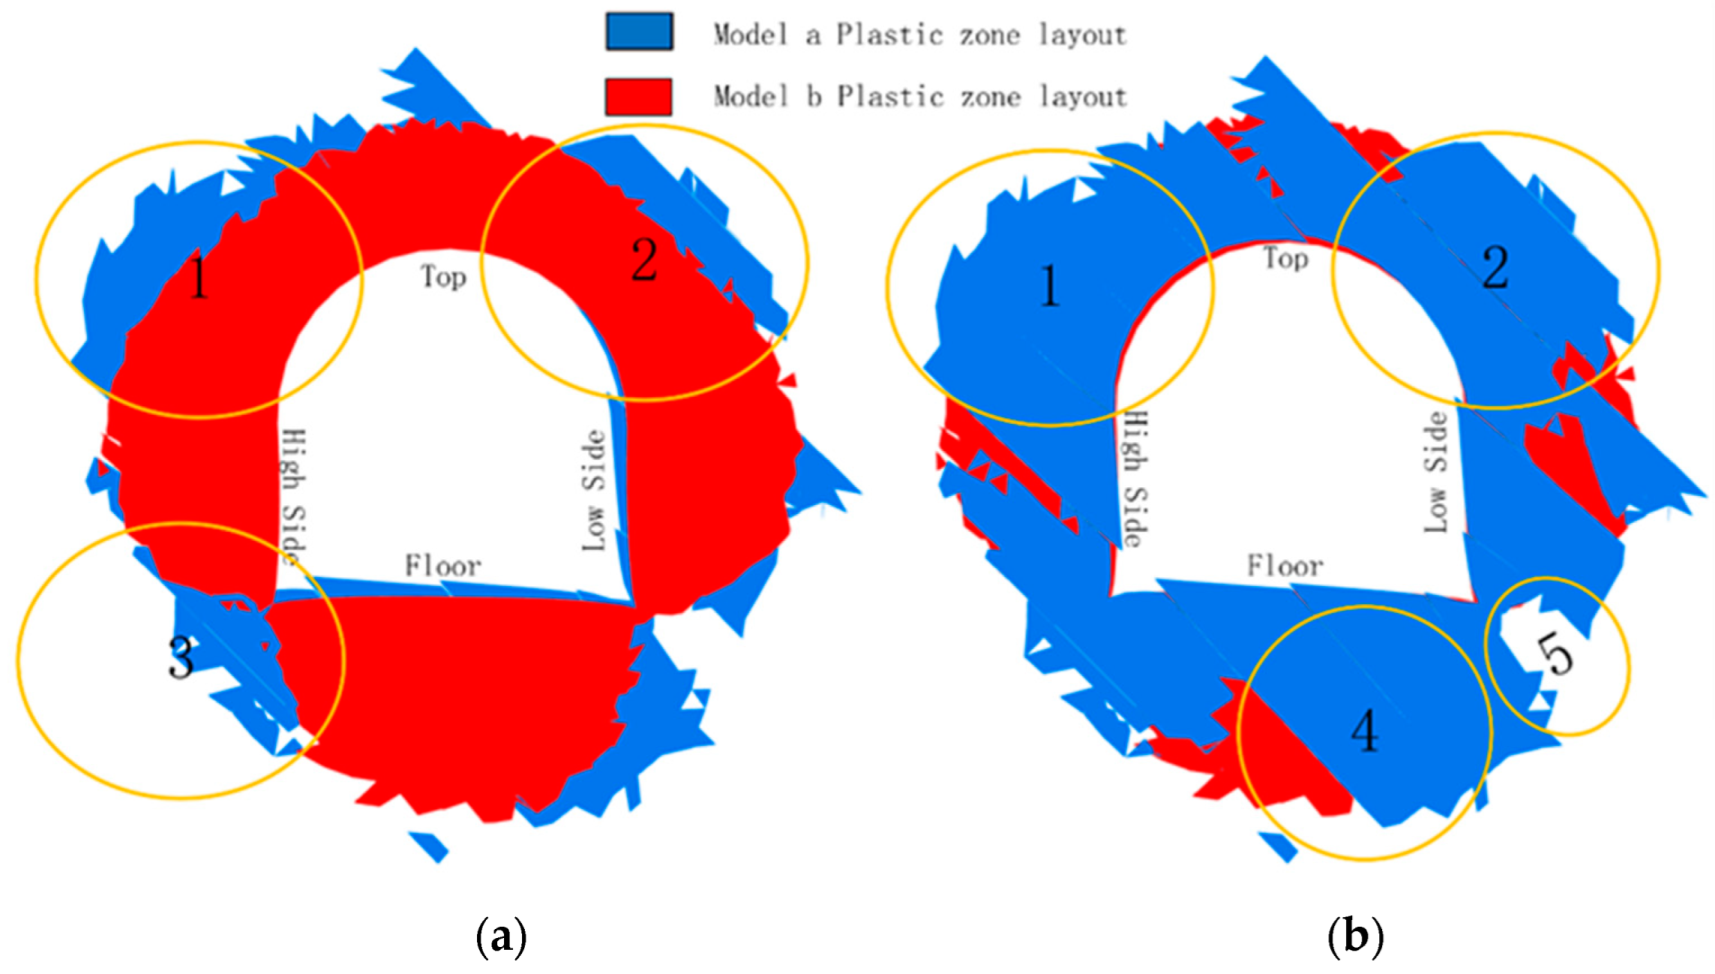
When there was a joint surface, the shape of the plastic zone changed, and the depth of the plastic zone increased to a certain extent at the junction of the high top and the roof and the junction of the low-cut zone and the roof, as shown in Figure 9a zone 1 and zone 2. There wass no plastic zone at the junction of the high top and the bottom plate, Figure 9a zone 3. In the roadway floor, the deepest zone of the plastic zone moved to the lower side of the roadway, Figure 9a zone 4. Under the influence of joints, in the junction of the lower side and the floor of the roadway, there was still a blind area for the development of the plastic zone, as shown in Figure 9a zone 5.
According to the displacement monitoring results inside the surrounding rock during similar simulations, the displacement comparison diagrams of the monitoring points at the same position from the roadway surface in the four monitoring areas were drawn, as shown in Figure 10. The figure shows that the displacement of the right upper monitoring point was the largest, followed by the displacement of the left lower monitoring point, and the displacement of the left upper monitoring point was slightly larger than that of the right lower monitoring point. Comparing Figure 9, it could be found that the right upper and left lower monitoring points were located in the tangent zone between the rock formation and the roadway boundary (zone 2 and zone 3). The depth of the plastic zone in the area where the right upper point was located was larger than that in the area where the left lower point was located. At the same time, the roadway surface in the right upper area was parallel to the rock formation, while the roadway surface in the left lower area intersected at right angles. The left upper zone was located in the tangential vertical area between the rock formation and the roadway, and the right lower zone was in zone 5 at the junction of the low side and the floor.
Further analysis of the stress monitoring point layout and stress monitoring results during a similar simulation and the distribution of the plastic zone in numerical simulation experiments’ results are in Figure 11. The roadway adopted the straight wall and arc top, so it could be considered that the roadway was a circular excavation, and then the bottom plate was excavated at a right angle. To mark the distance of the monitoring point from the roadway surface, position reference lines 1 and 2 were drawn. Figure 11 shows the relationship between the position of the monitoring point and the plastic zone and the resulting difference in the stress monitoring data. The data of sensors No. 866 and No. 842 in the monitoring point fluctuated greatly, indicating that these two sensors were invalid. No. 816 was the farthest from the roadway surface, so the measured data was the largest; No. 1 and No. 2 sensors were close to the roadway surface, but the measurement directions of No. 1 and No. 2 were different, which led to different stress values measured by the two sensors. No. 1 was parallel to the tangential direction of the roadway, and the measured stress value was large, and No. 2 was perpendicular to the tangential direction of the roadway and the boundary of the plastic zone, and the stress value first increased and then decreased. It showed that the development of the plastic zone had an impact on the stress value of the monitoring point. No. 4 and No. 929 were the same distance from the roadway surface, but No. 4 was farther away from the plastic zone, so the stress of No. 4 was greater than that of No. 929. No. 872 was located on the plastic boundary, which caused the stress value of No. 872 to increase first and then decrease. No. 864 was located outside the position reference line 1, and the stress observations were increasing. From the relationship between the observed stress value and the position reference line 1, the stress value perpendicular to the tangential direction of the position reference line was generally low, and the stress was larger when the stress direction and the tangential direction of the reference line were parallel.
Figure 11 shows that the distribution range of plastic zone obtained by the numerical simulation and the stress value and stress direction obtained by similar simulation monitoring could verify each other. The accuracy of the numerical simulation and similar simulation results was illustrated, and the stress value of the stress monitoring point could be estimated for the expansion of the plastic zone in a similar simulation experiment.

5. Conclusions

Both a numerical simulation and a similar simulation showed that under the action of high stress and the conditions of a 45° surrounding rock inclination, the deformation and failure of the roadway-surrounding rock had the following conclusions:
(1)
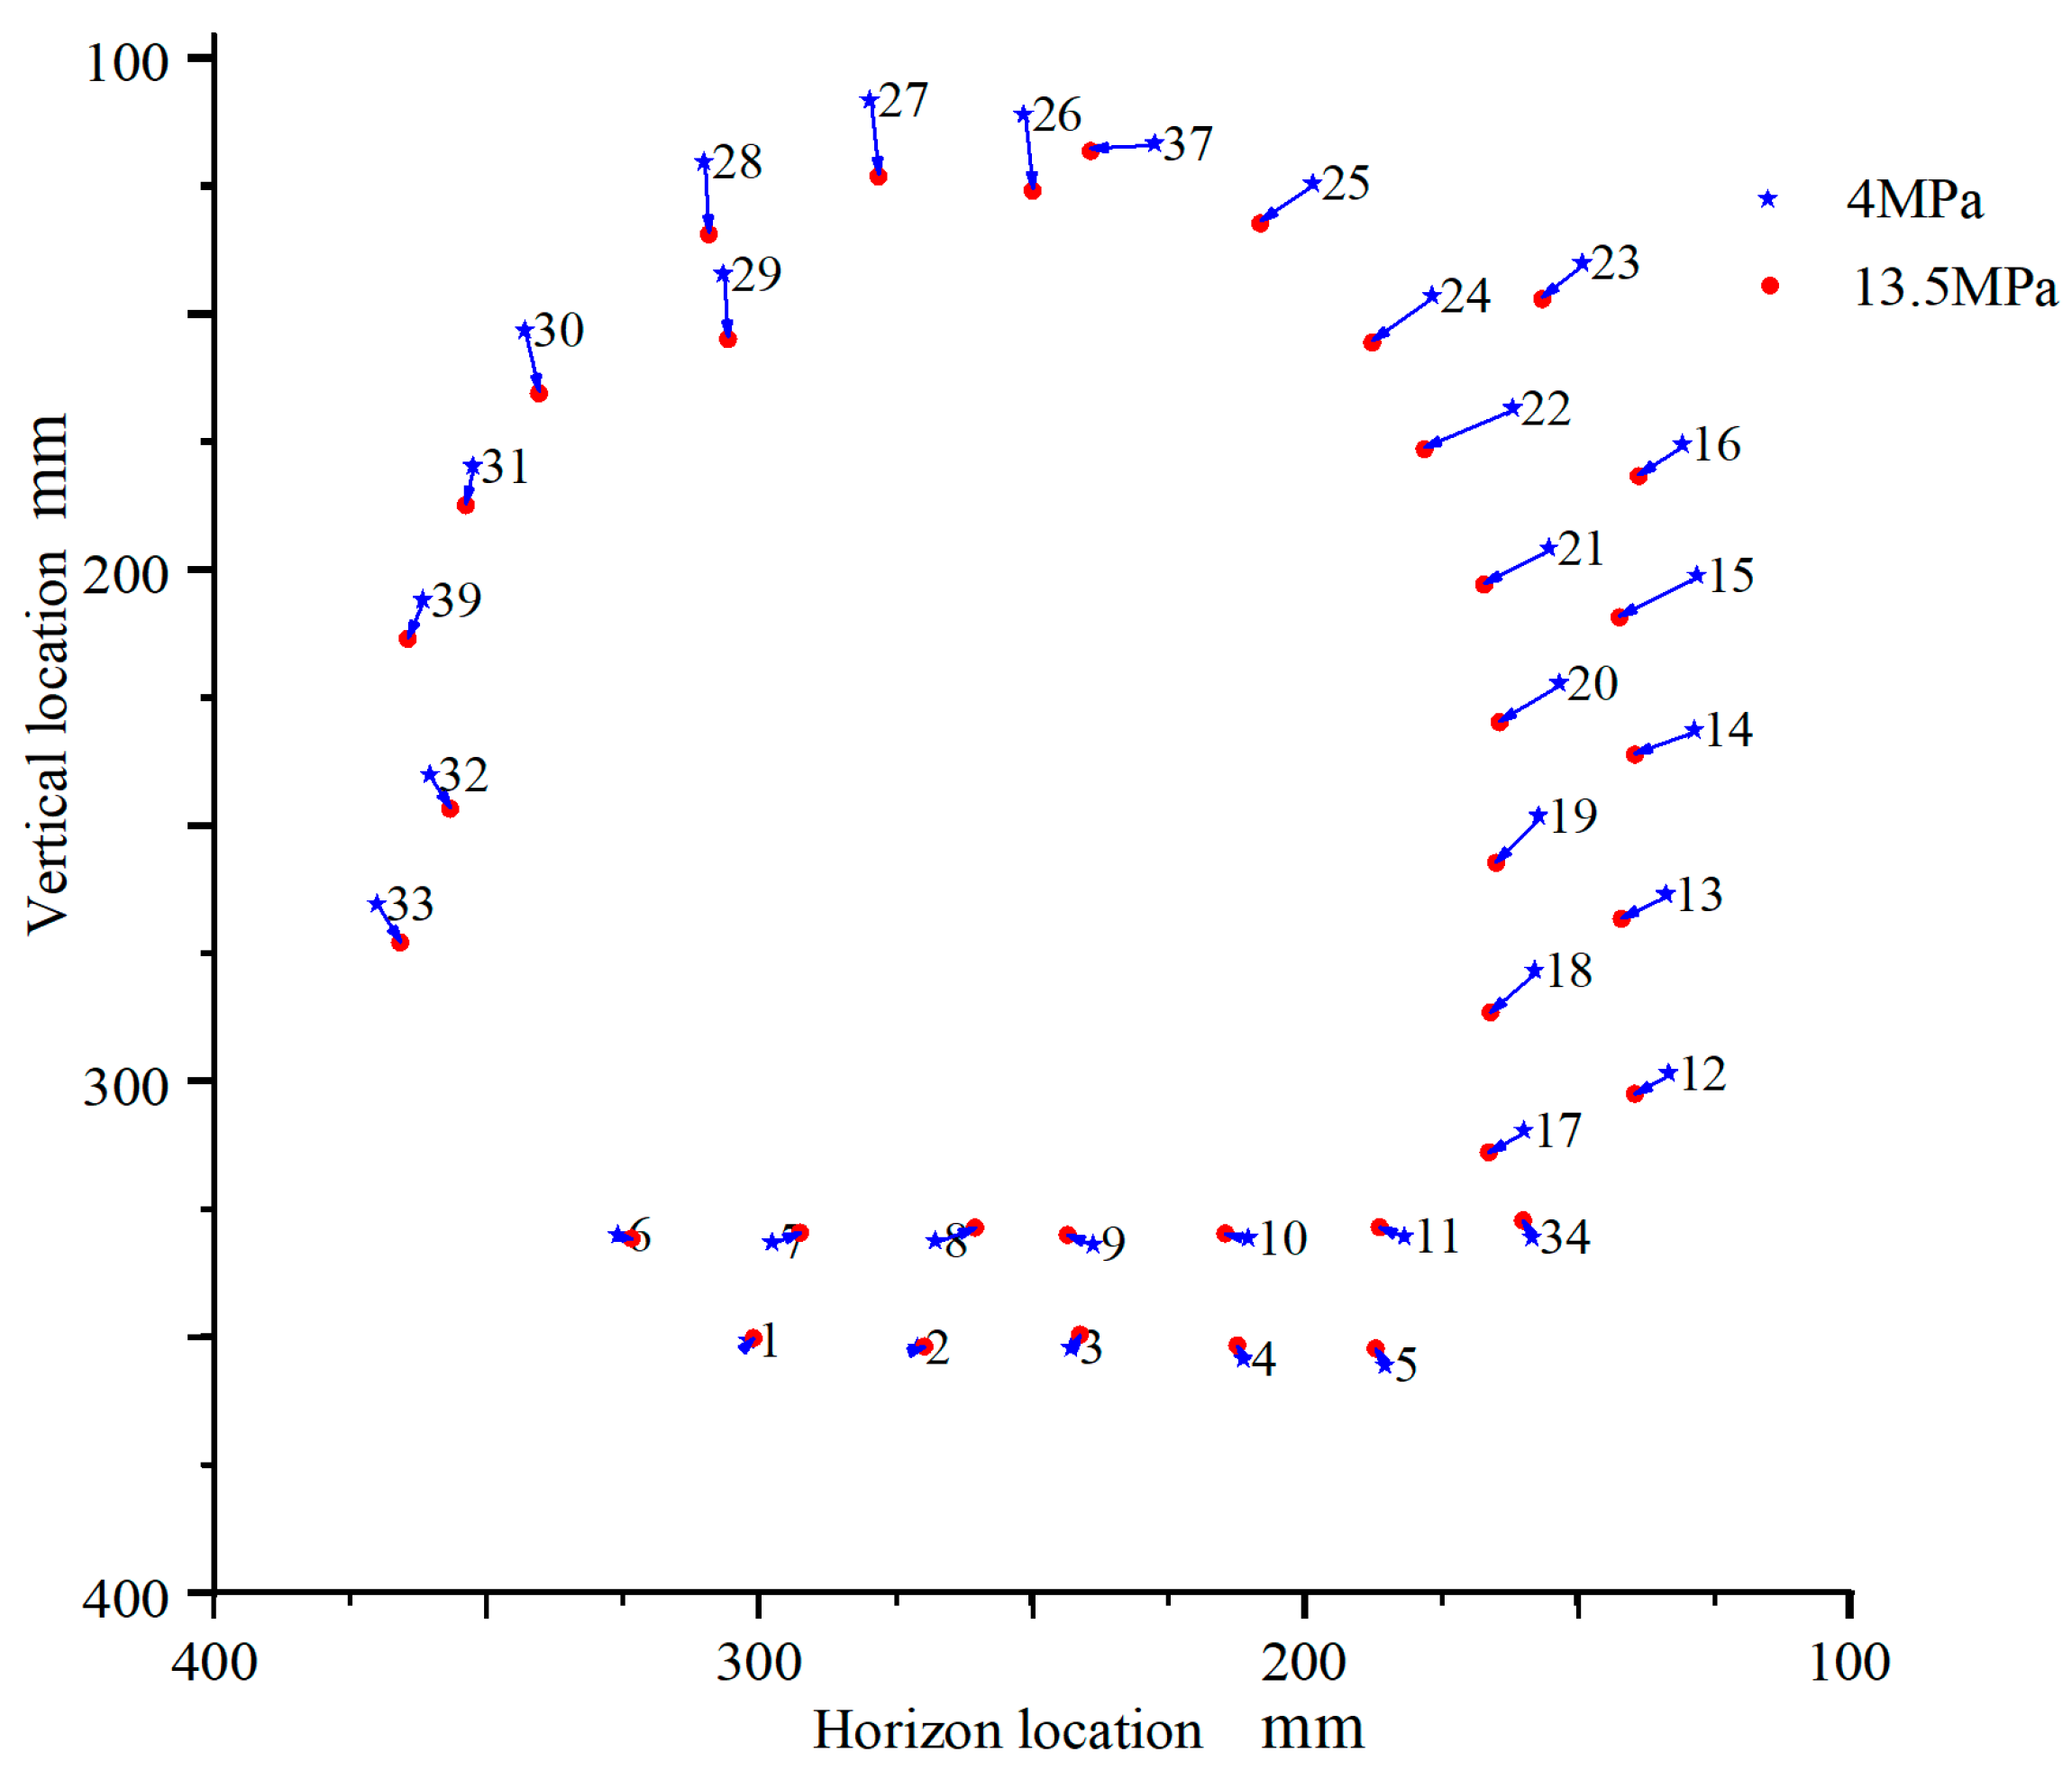
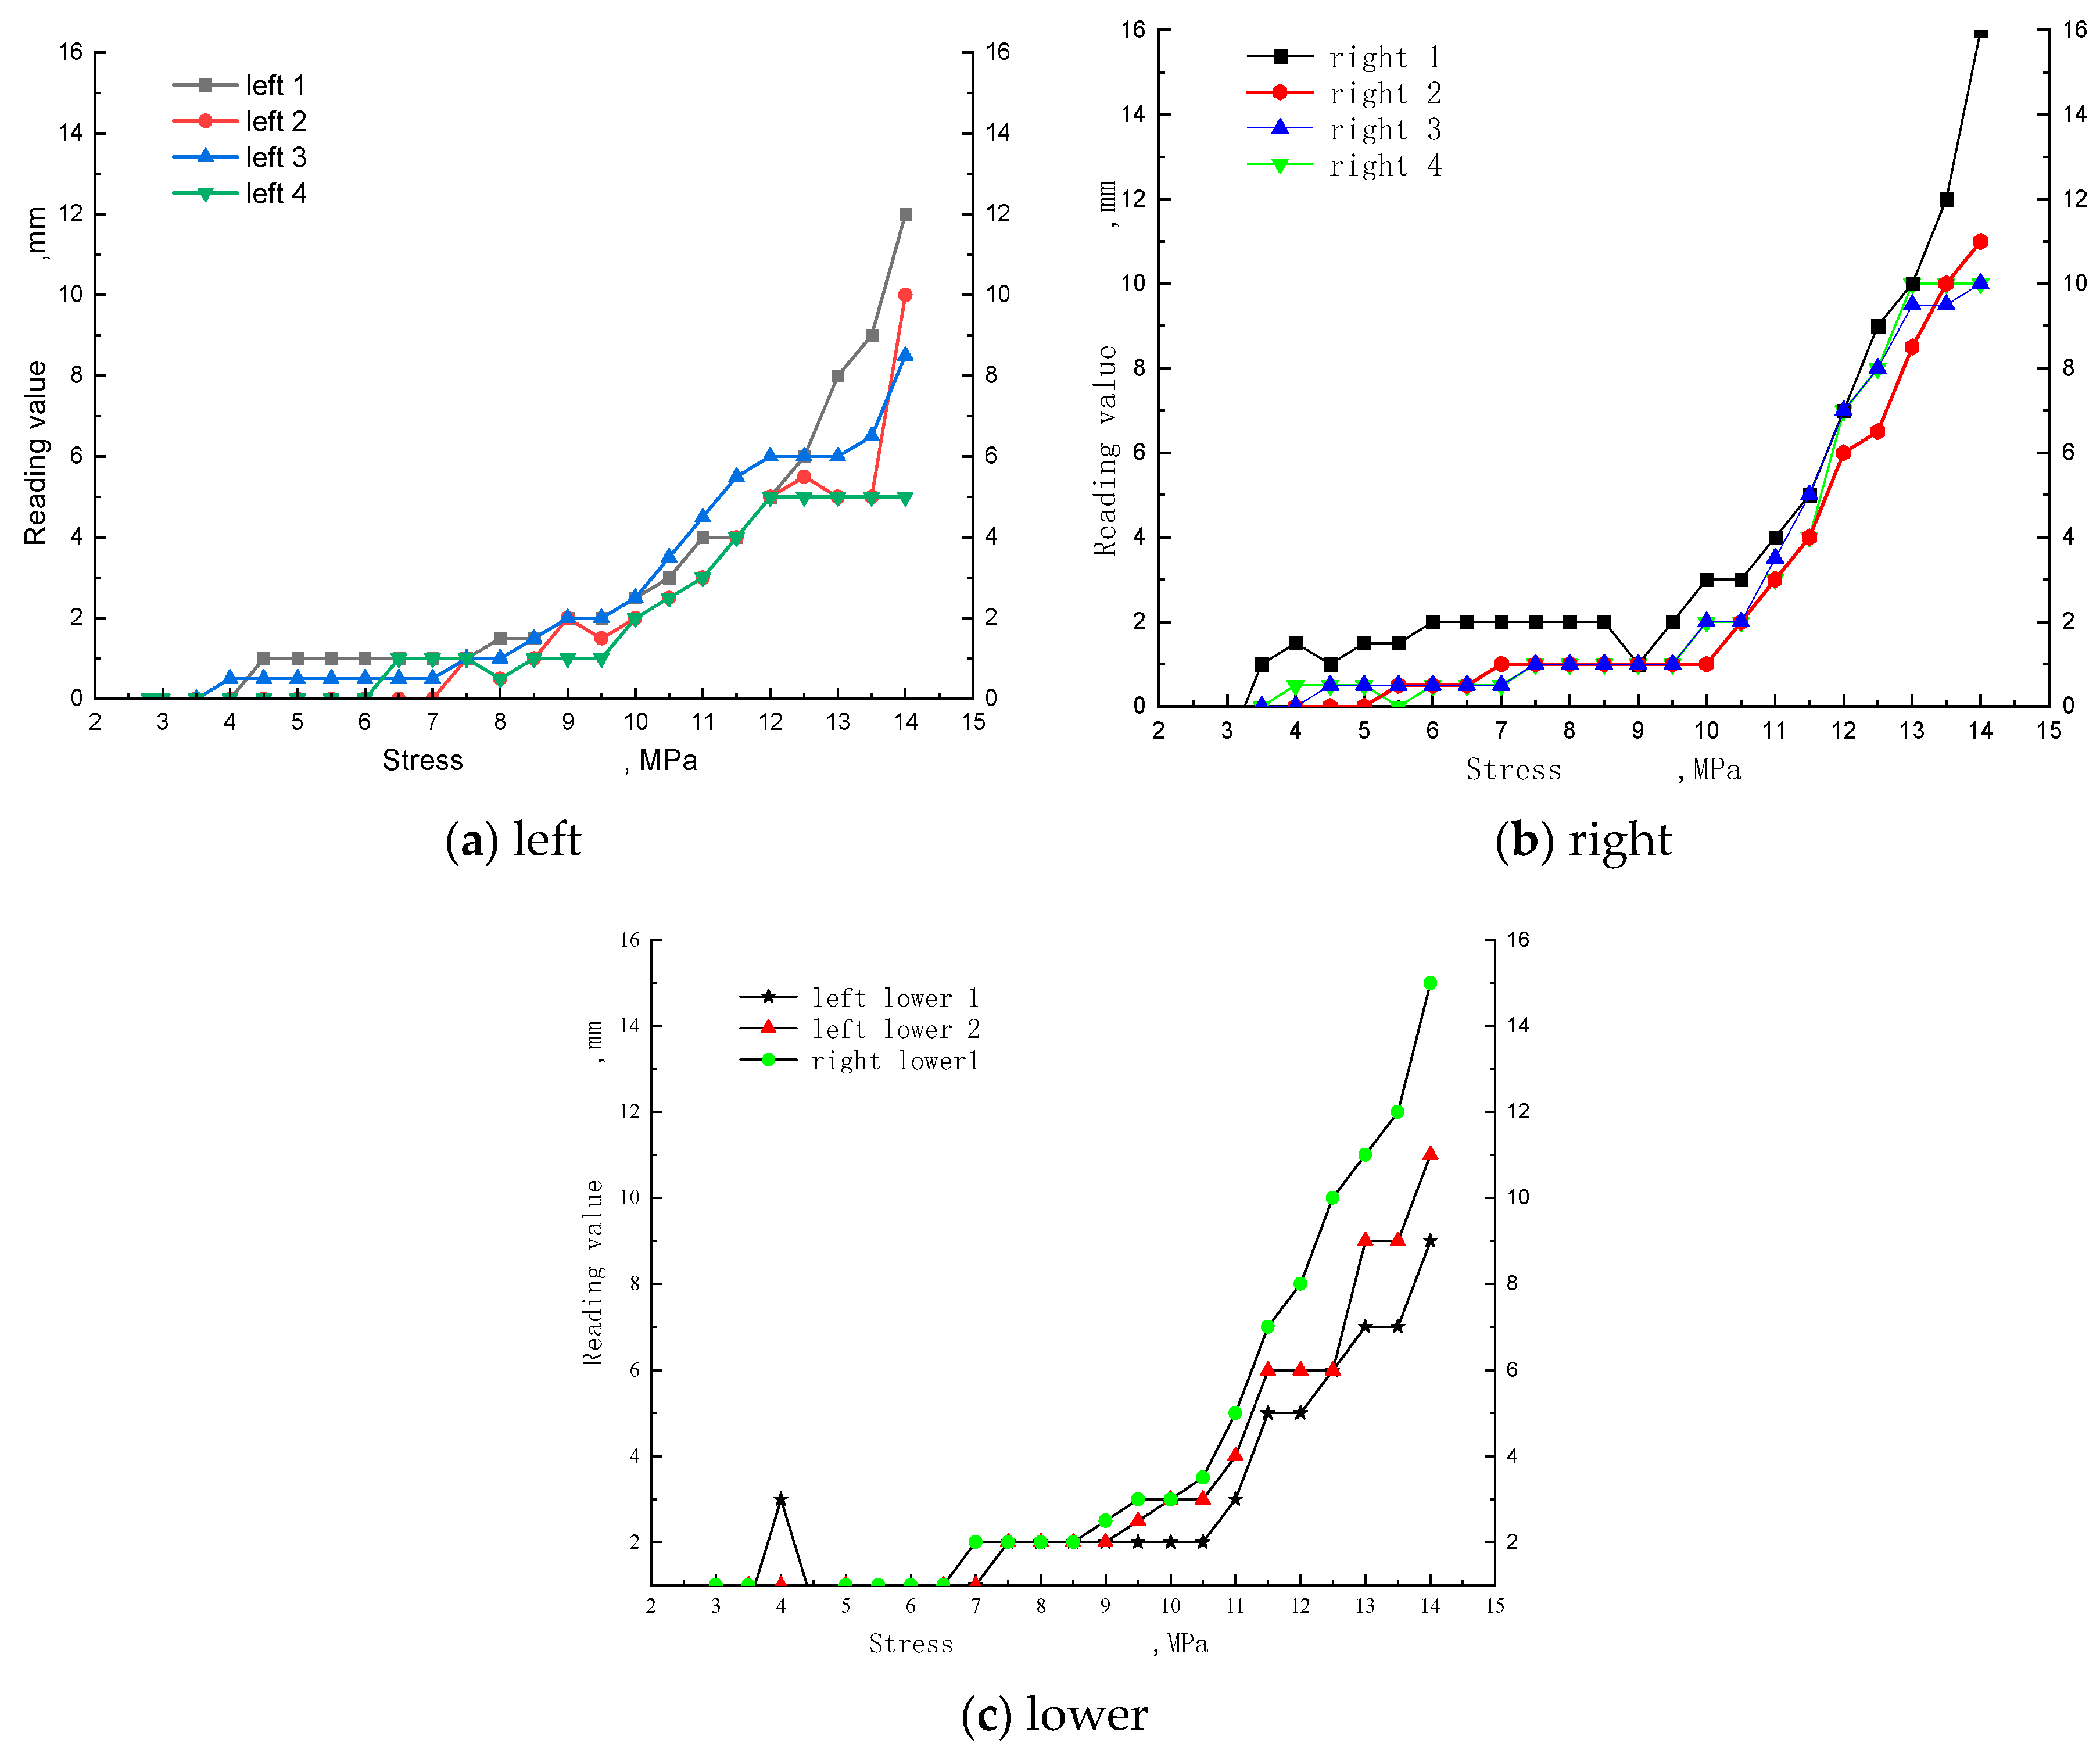
The deformation of the surrounding rock in roadway layered surrounding rock was asynchronous in time and asymmetric in space. The temporal asynchrony manifested in the order of appearance of the deformation area of the roadway surrounding rock, showing that the tangent area between the layered surrounding rock and the roadway surface was the earliest, followed by the layered surrounding rock and the vertical area of the roadway surface. The spatially asymmetric deformation of the surrounding rock of the layered roadway manifested in that the deformation amount was different in different areas of the surrounding rock of the roadway. The order of the displacement of surrounding rock at the four corners of the roadway was upper right, lower left, upper left, and lower right.
(2)
The layered surrounding rock conditions affected the shape symmetry of the plastic zone of the roadway. The specific performance was that in the area where the rock layer and the roadway surface were tangent, and in the vertical area between the rock layer and the roadway surface, the plastic zone had a large development depth, while other areas had a small plastic zone development depth, and there was a blind zone in the lower right area.
(3)
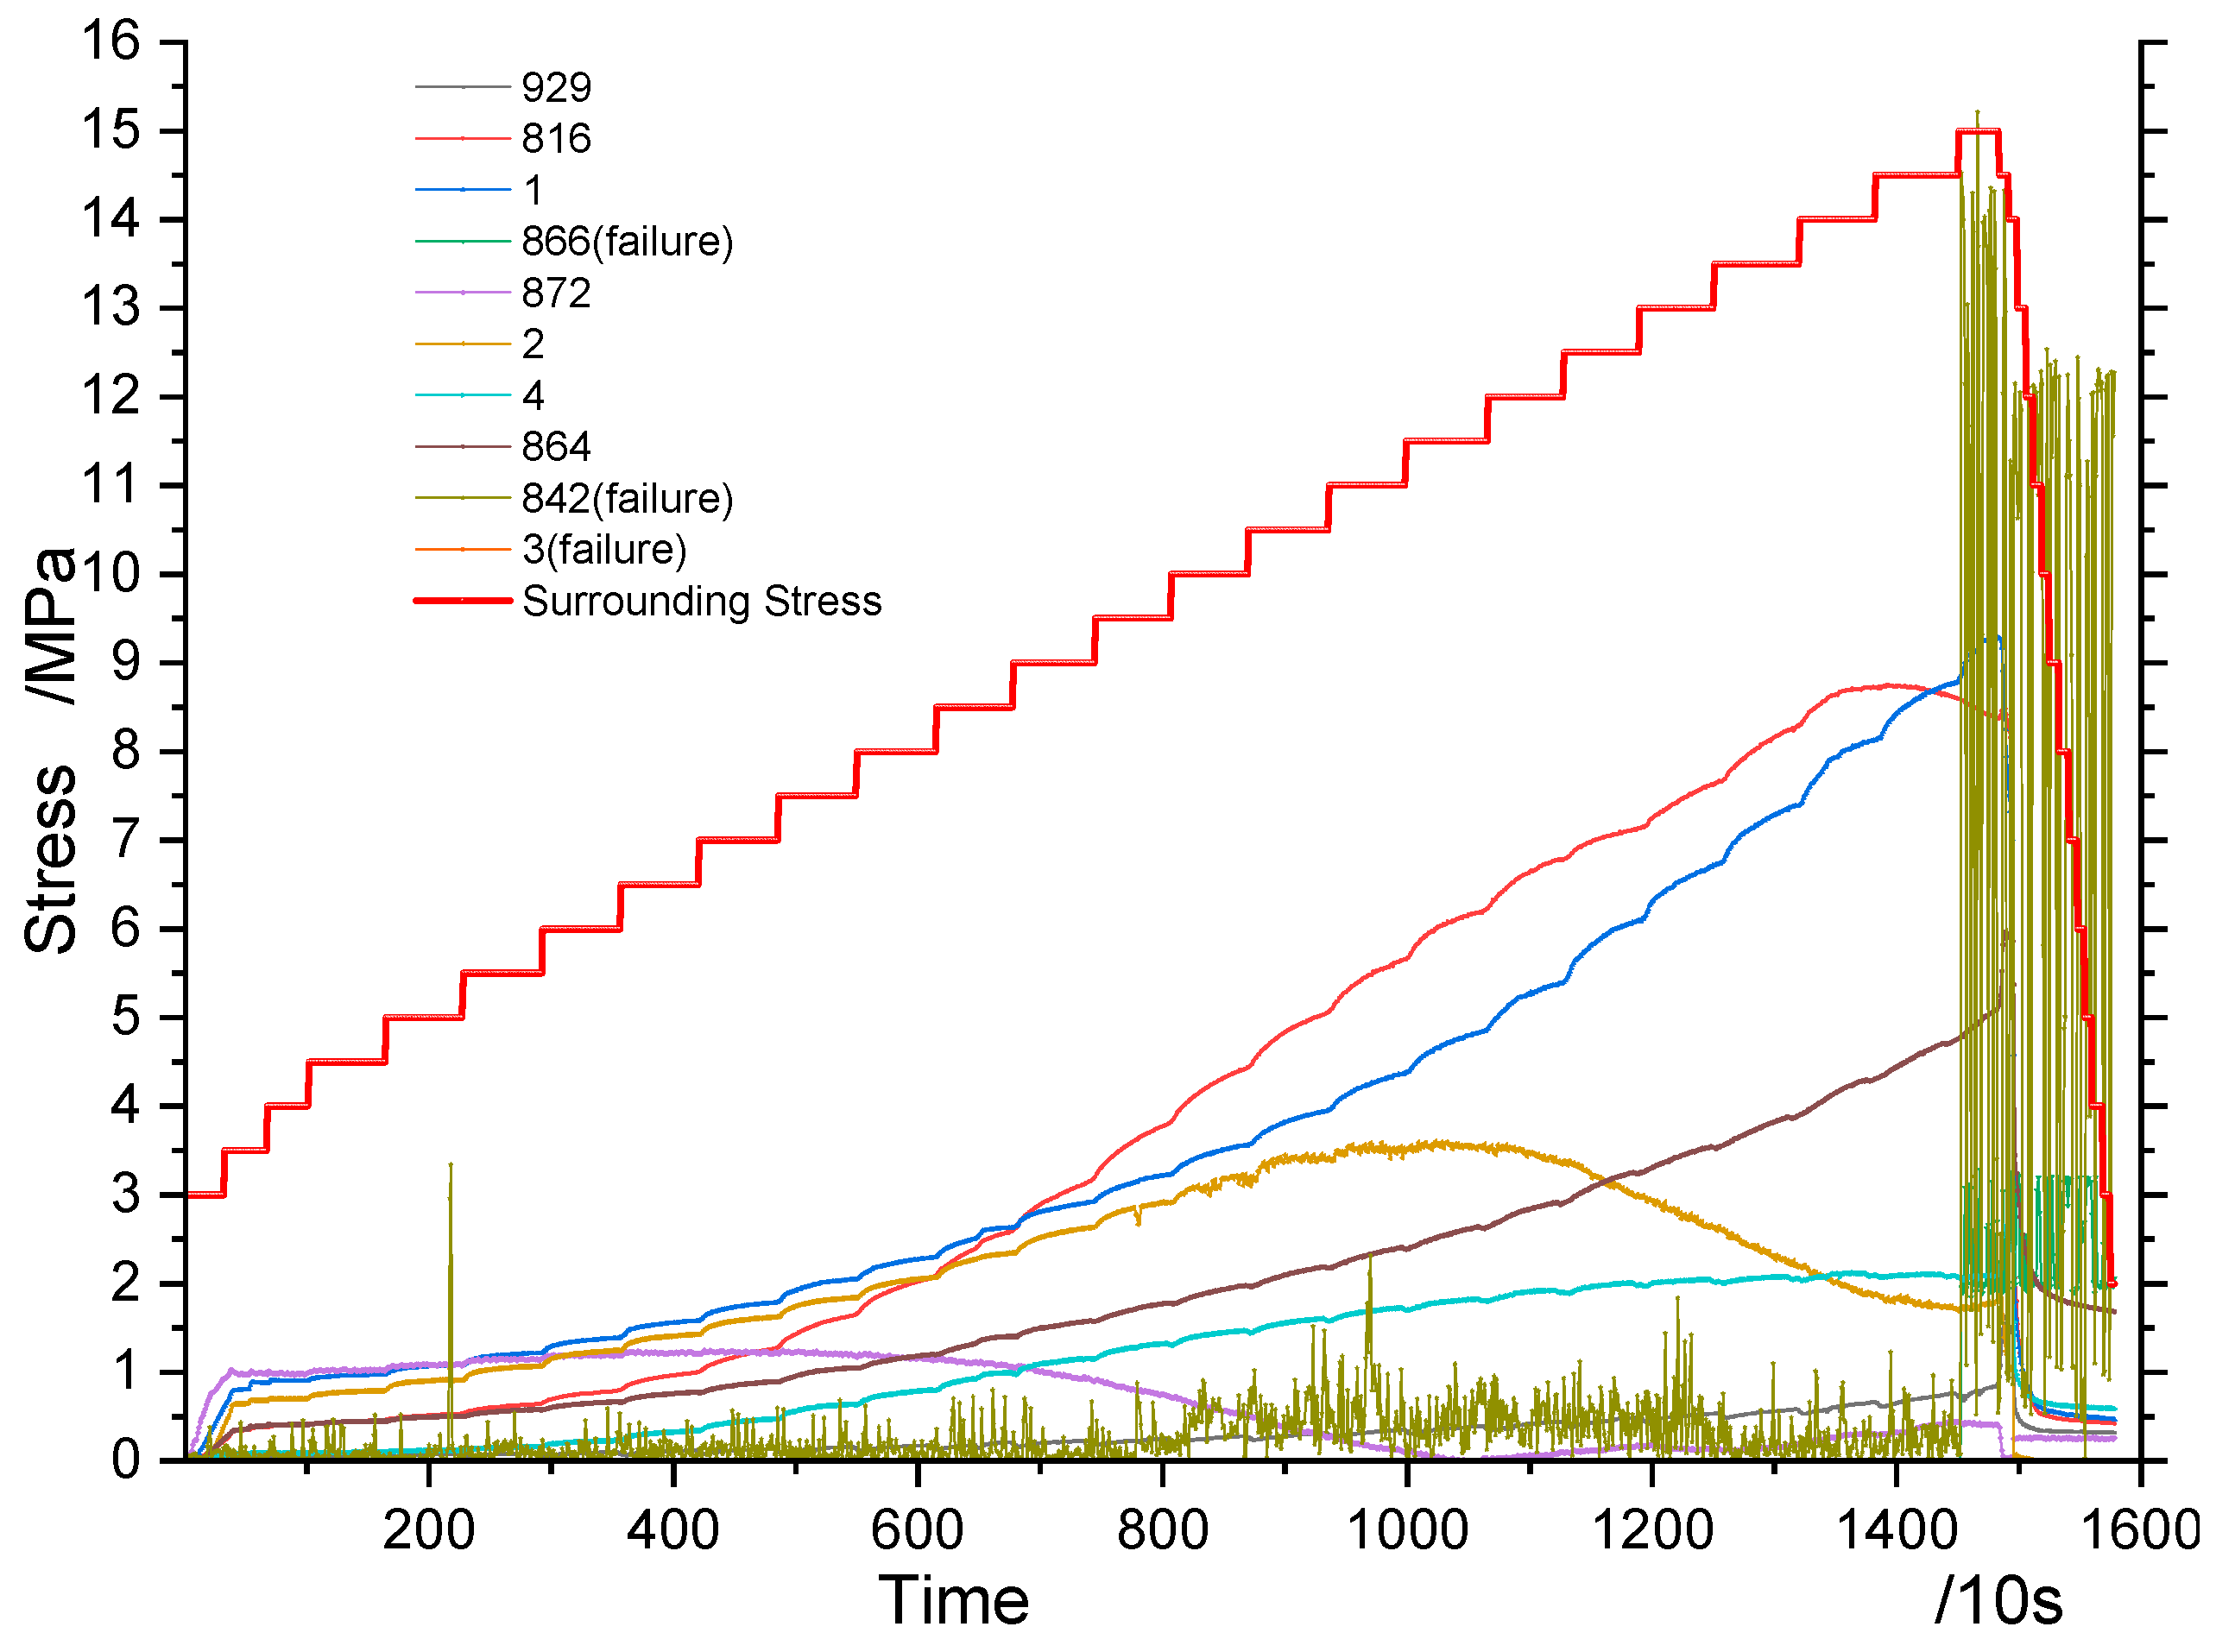
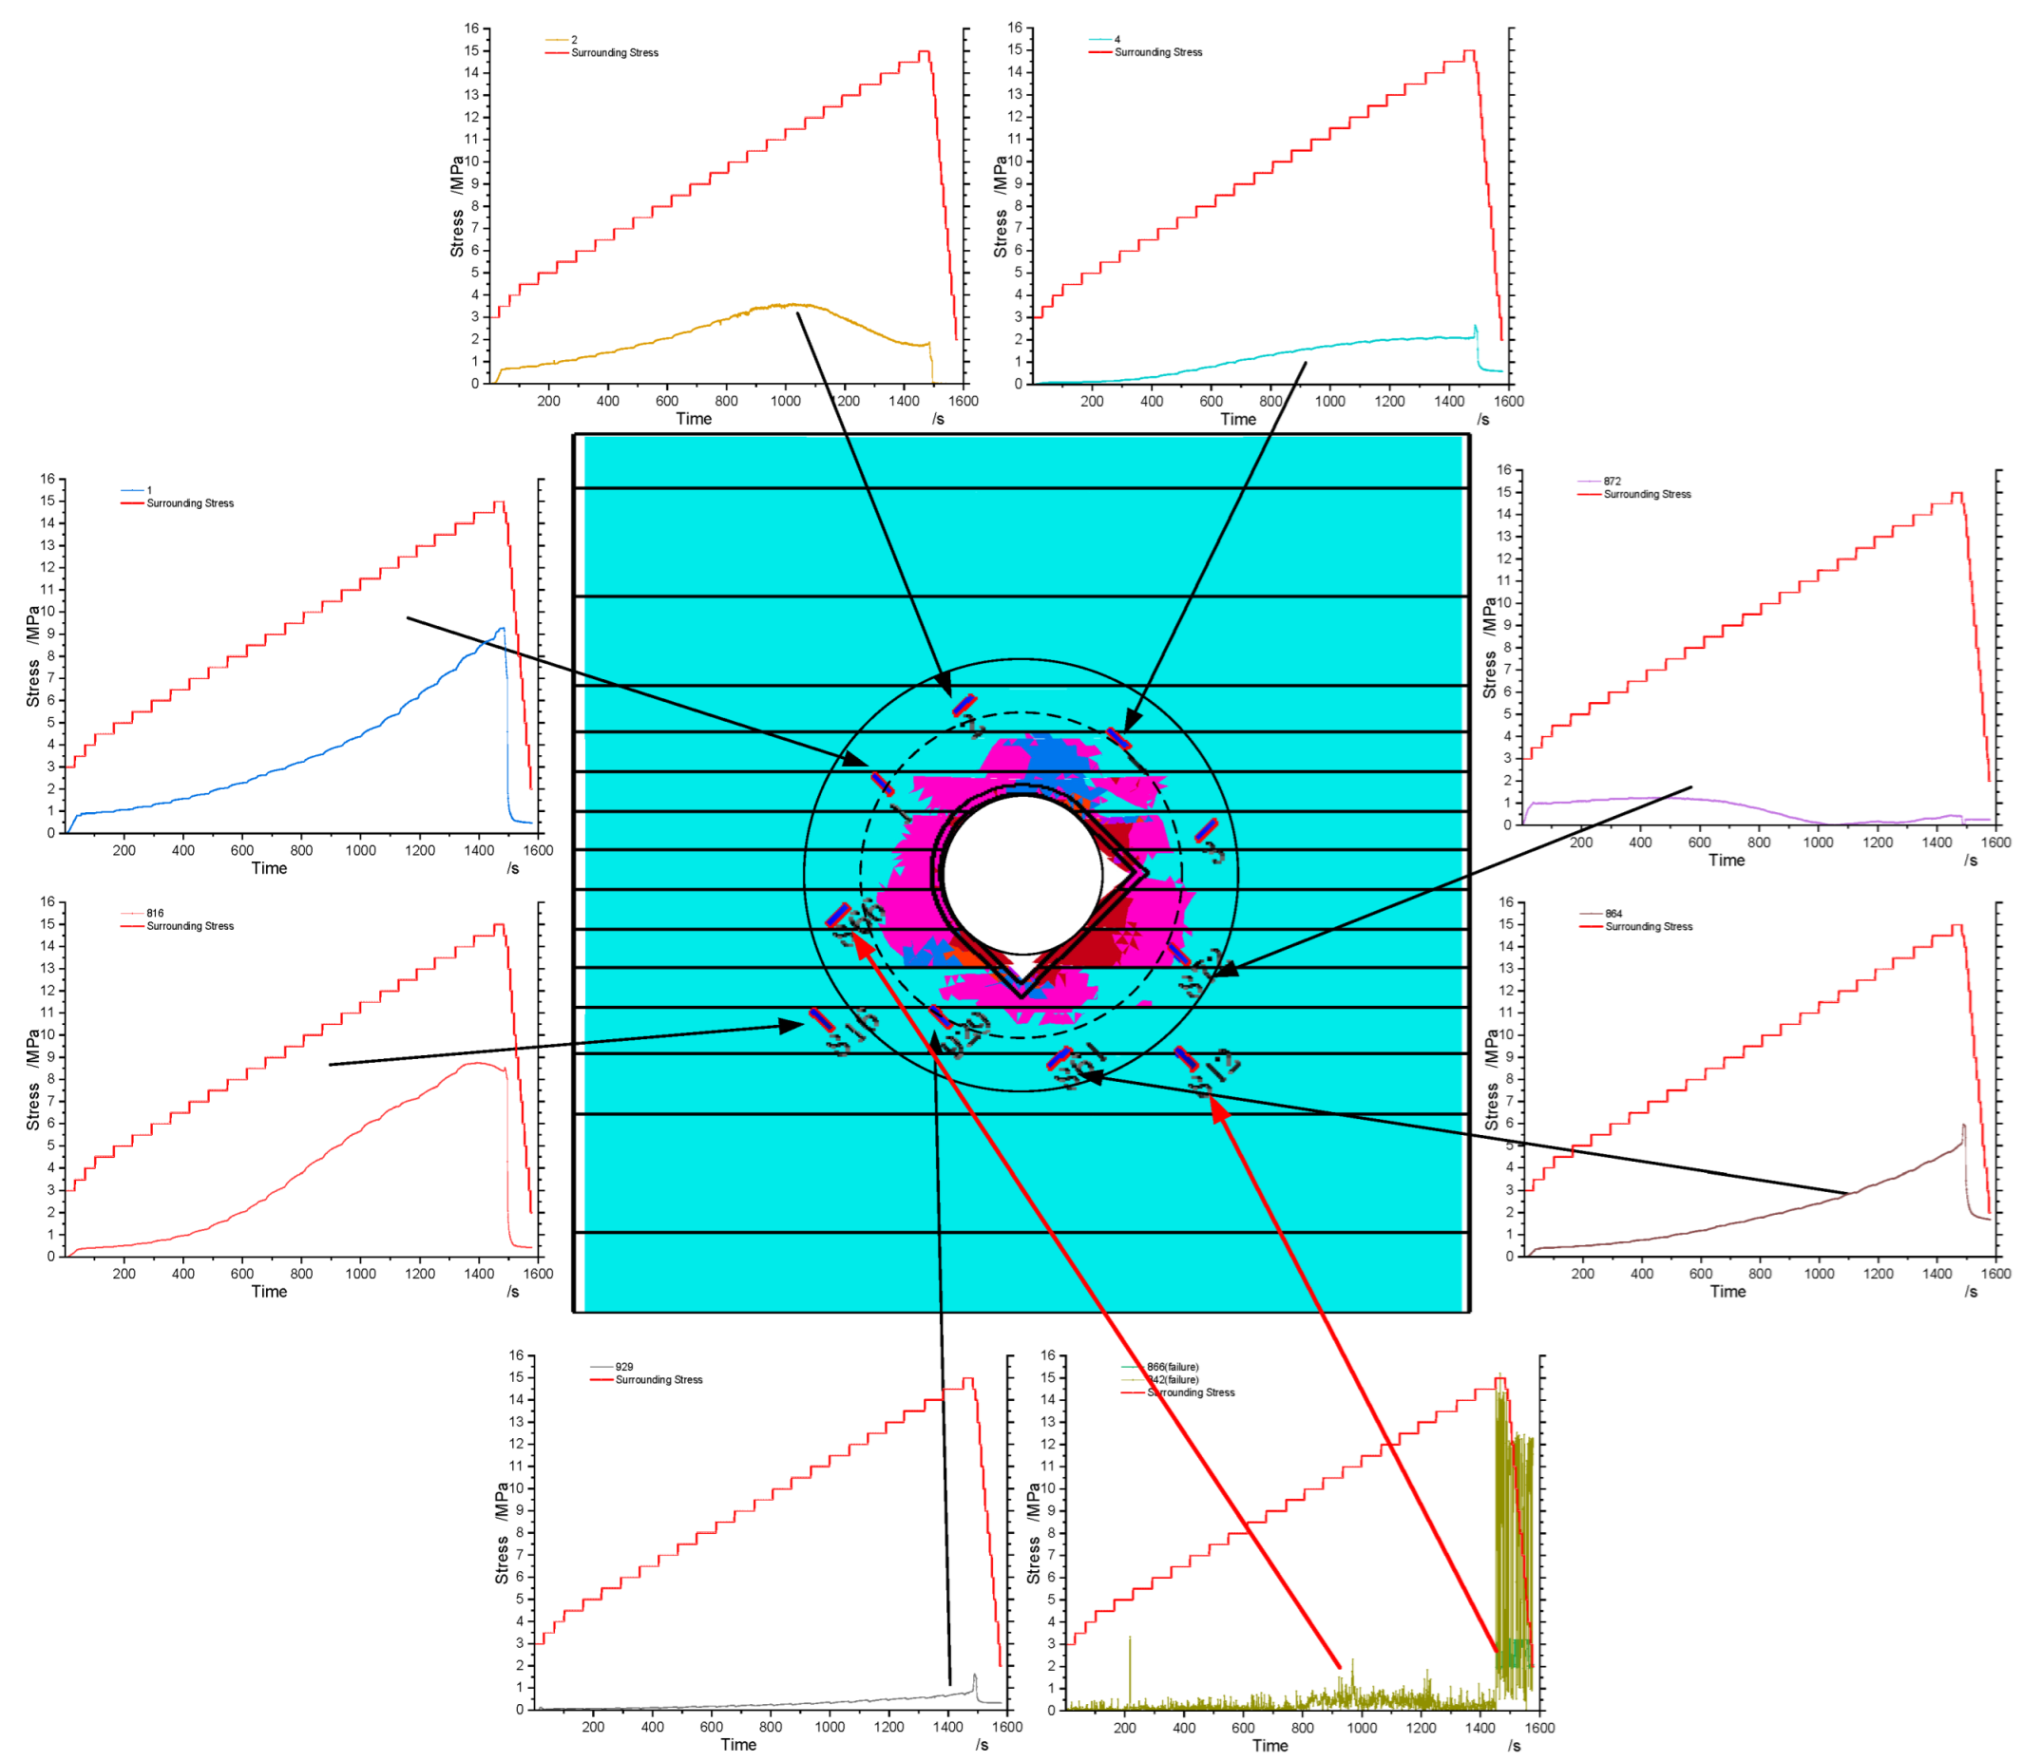
Affected by the development shape of the layered surrounding rock and the plastic zone, the internal stress value of the surrounding rock at the same distance from the roadway surface was different. With the increase of the surrounding rock stress, the plastic zone inside the surrounding rock of the roadway expanded, and the stress at the stress monitoring point first increased and then decreased; the perpendicular radial stress inside the surrounding rock of the roadway was smaller than the tangential stress.
(4)
Similar simulation stress monitoring results and numerical simulation plastic zone distribution showed that the stress monitoring value increased with an increase of the model’s confining pressure when monitoring points were outside the plastic zone. With the plastic zone expanding, the monitoring points which closer to the roadway surface moved from outside of the plastic zone into the plastic zone, and the monitoring points’ stress value first increased and then decreased.
(5)
From the point of view of the arrangement direction of the pressure box at the monitoring point, on the same radius from the center of the roadway, if the normal direction of the pressure box was tangent to the concentric circle of the roadway, the stress value of the monitoring point increased greatly, and if it was vertical, the stress value increased more slowly.

Author Contributions

Software, Z.Z.; resources, X.G. and T.L.; writing—original draft preparation, X.Z.; writing—review and editing, J.C.; project administration and funding acquisition, H.W. All authors have read and agreed to the published version of the manuscript.

Funding

This research was funded by the National Natural Science Foundation of China, grant number 52074117, 51774133, and by the Open Fund of the State Key Laboratory of Mining Response and Disaster Prevention and Control in Deep Coal Mines, Anhui University of Science and Technology (No. SKLMRDPC20KF08). The APC was funded by the National Natural Science Foundation of China, grant number 52074117, 51774133.

Institutional Review Board Statement

Not applicable.

Informed Consent Statement

Not applicable.

Data Availability Statement

Data is available on request due to privacy restrictions.

Conflicts of Interest

The authors declare that there is no conflict of interests regarding the publication of this article.

References

  1. Li, G.C.; Zhang, N.; Wang, C.; Zhang, N.C.; Li, B.Y. Optimizing the Section Shape of Roadways in High-Stress Ground by Numerical Simulation. J. China Univ. Min. Technol. 2010, 39, 652–658. (In Chinese) [Google Scholar]
  2. Jia, H.; Ma, N.; Zhu, Q. Mechanism and control method of roof fall resulted from butterfly plastic zone penetration. J. China Coal Soc. 2016, 41, 1384–1392. (In Chinese) [Google Scholar]
  3. Ma, N.J.; Guo, X.F.; Zhao, Z.Q.; Zhao, X.D.; Liu, H.T. Occurrence mechanisms and judging criterion on circular tunnel butterfly rockburst inhomogeneous medium. J. China Coal Soc. 2016, 41, 2679–2688. (In Chinese) [Google Scholar]
  4. Li, J.; Ma, N.; Zhao, Z. Butterfly leaf type roof falling mechanism and control technology of mining gateway. J. China Coal Soc. 2017, 45, 46–52. (In Chinese) [Google Scholar]
  5. Liu, H.; Wu, X.; Hao, Z.; Zhao, X.; Guo, X. Evolution law and stability control of plastic zones of retained entry of working face with double roadways layout. J. Min. Saf. Eng. 2017, 34, 689–697. (In Chinese) [Google Scholar]
  6. Li, L.; Tan, Z. Characteristic and mechanism research for large deformation problem in squeezing-shattered soft rock tunnel. Chin. J. Rock Mech. Eng. 2018, 37, 3593–3603. (In Chinese) [Google Scholar]
  7. Liu, G.; Xiao, Y.; Zhu, J.; Jing, H. Overview of the theoretical calculation method of broken rock zone. J. China Coal Soc. 2021, 46, 46–56. (In Chinese) [Google Scholar]
  8. Wang, W.J.; Guo, G.Y.; Zhu, Y.J.; Yu, W. Malignant development process of the plastic zone and control technology of high stress and soft rock roadway. J. China Coal Soc. 2015, 40, 2747–2754. (In Chinese) [Google Scholar]
  9. Yue, Y.; Weijun, W.; Chao, Y.; Weijian, Y.; Hai, W.; Wenqing, P. Large deformation failure mechanism of surrounding rock for gate road under dynamic pressure in deep coal mine. J. China Coal Soc. 2016, 41, 2940–2950. (In Chinese) [Google Scholar]
  10. Wang, W.; Dong, E.; Yuan, C. Boundary equation of plastic zone of circular roadway in non-axisymmetric stress and its application. J. China Coal Soc. 2019, 44, 105–114. (In Chinese) [Google Scholar]
  11. Zhang, S.; Wang, X.; Jia, Z.; Ju, S. Study on application of asymmetrical support technology to mine roadway with multi-layer inclined rock strata. Coal Sci. Technol. 2018, 46, 74–80. (In Chinese) [Google Scholar]
  12. Shao, S.; Huang, Q.; Zhang, Q.; Ma, K.; Zhao, M. Study on Outward Sliding Mechanism of Roadway in Mudstone Interlayers Coal Seam and Support Method. Coal Sci. Technol. 2014, 42, 124–128. (In Chinese) [Google Scholar]
  13. Yu, Y.; Bo, J.; Wang, X.; Shen, W.; Lian, C. Study on asymmetric distortion and failure characteristics and stability control of soft rock roadway. J. Min. Saf. Eng. 2014, 31, 340–346. (In Chinese) [Google Scholar]
  14. Zhao, Z. Mechanism of Surrounding Rock Deformation and Failure and Control Method Research in Large Deformation Mining Roadway. Ph.D. Thesis, China University of Mining, Beijing, China, 2014. (In Chinese). [Google Scholar]
  15. Zhao, Z.Q.; Ma, N.J.; Liu, H.; Guo, X.F. A butterfly failure theory of rock mass around roadway and its application prospect. J. China Univ. Min. Technol. 2018, 47, 969–978. (In Chinese) [Google Scholar]
  16. Yang, F.; Chen, W.; Zheng, P.Q. Research on mechanism of deformation and failure for steeply inclined roadways in soft-hard alternant strata and its support technology. Rock Soil Mech. 2014, 35, 2367–2374. (In Chinese) [Google Scholar]
  17. Chen, J.; Yan, R.; Liu, K. Asymmetric deformation mechanism of the roadway at steeply inclined thick coal seam. J. China Coal Soc. 2018, 43, 3007–3015. (In Chinese) [Google Scholar]
  18. Ma, T.; Li, S.; Xu, X. Model experimental study of deformation and failure law in excavation of deep rock mass with multi-cleftiness of different angles. Rock Soil Mech. 2016, 37, 2899–2908. (In Chinese) [Google Scholar]
  19. Yin, G.; Lu, J.; Li, X. Stability and plastic zone characteristics of surrounding rock under true triaxial stress conditions. J. China Coal Soc. 2018, 43, 2709–2717. (In Chinese) [Google Scholar]
  20. Yaylaci, M. Simulate of edge and an internal crack problem and estimation of stress intensity factor through finite element method. Adv. Nano Res. 2022, 12, 405–414. [Google Scholar] [CrossRef]
  21. Öner, E.; Şabano, B.Ş.; Yaylacı, E.U.; Adıyaman, G.; Yaylacı, M.; Birinci, A. On the plane receding contact between two functionally graded layers using computational, finite element and artificial neural network methods. Z. Angew. Math. Mech. 2022, 102, e202100287. [Google Scholar] [CrossRef]
  22. Murat, Y.; Mujgen, Y.; Uzun, Y.E.; Hasan, O.; Ahmet, B. Analyzing the contact problem of a functionally graded layer resting on an elastic half plane with theory of elasticity, finite element method and multilayer perceptron. Struct. Eng. Mech. 2021, 78, 585–597. [Google Scholar] [CrossRef]
  23. Yaylaci, M.; Sabano, B.S.; Ozdemir, M.E.; Birinci, A. Solving the contact problem of functionally graded layers resting on a HP and pressed with a uniformly distributed load by analytical and numerical methods. Struct. Eng. Mech. 2022, 82, 401–416. [Google Scholar] [CrossRef]
  24. Wu, H.; Jia, Q.; Wang, W.; Zhong, N.; Zhao, Y. Experimental Test on Nonuniform Deformation in the Tilted Strata of a Deep Coal Mine. Sustainability 2021, 13, 13280. [Google Scholar] [CrossRef]
Figure 1. The experimental procedure and experimental model.
Applsci 12 06108 g001
Figure 2. Stress-measuring equipment and its layout.
Applsci 12 06108 g002
Figure 3. Multipoint displacement meter and its installation layout.
Applsci 12 06108 g003
Figure 4. Roadway surface deformation from 4.5 to 15 MPa.
Applsci 12 06108 g004
Figure 5. Comparison of position changes of monitoring points.
Applsci 12 06108 g005
Figure 6. Left, right, lower left, and lower right multipoint displacement meter readings.
Applsci 12 06108 g006
Figure 7. Stress change curve of the stress monitoring point.
Applsci 12 06108 g007
Figure 8. The numerical simulation model.
Applsci 12 06108 g008
Figure 9. Comparison chart of plastic zone distribution.
Applsci 12 06108 g009
Figure 10. Displacement comparison of roadway-surrounding-rock monitoring points.
Applsci 12 06108 g010
Figure 11. Plastic zone shape, stress measurement points, and stress distribution.
Applsci 12 06108 g011
Publisher’s Note: MDPI stays neutral with regard to jurisdictional claims in published maps and institutional affiliations.

