Article

Energy Dissipation and Stress Equilibrium Behavior of Granite under Dynamic Impact

1
School of Mining Engineering, University of Science and Technology Liaoning, Anshan 114051, China
2
Engineering and Technology Research Center of High-Efficiency Mining-Processing and Utilization of Metal Mineral Resources, Anshan 114051, China
3
School of Architecture and Civil Engineering, Shenyang University of Technology, Shenyang 110870, China
4
Chengyuan Mining Development Co., Ltd., Shenyang 110870, China
*
Author to whom correspondence should be addressed.
Appl. Sci. 2022, 12(12), 6107; https://doi.org/10.3390/app12126107
Submission received: 18 May 2022 / Revised: 9 June 2022 / Accepted: 13 June 2022 / Published: 16 June 2022

Abstract

:
Stress equilibrium time is an important index to judge the homogeneity of rocks. In order to study the relationship between stress equilibrium time and crushing energy consumption before rock destruction, Hopkinson tests were conducted on granite specimens with different length-to-diameter ratios. In this paper, by studying the size and strain rate effects of rocks, five different sizes of granite specimens with different aspect ratios were prepared and Hopkinson impact tests were conducted under four strain rate conditions. Data analysis and processing using the three-wave method to investigate the stress uniformity of granite specimens under impact loading. The energy balance factor was introduced to compare and analyze the stress equilibrium time of five kinds of long-diameter granite specimens, and it was found that the stress equilibrium time of rocks with the same length–diameter ratio decreased with the increase of loading strain rate, while the granite specimens with length–diameter ratio of 0.8 showed a better stress equilibrium time. In order to better find the aspect ratio and loading strain rate that can crush better and maintain a long equilibrium time, the energy consumption of rock crushing is further analyzed. The energy dissipation of granite specimens with loading strain rate of 156.8 s−1 and 253.2 s−1 was found to be more concentrated, and the energy dissipation rate was stable at about 48%. Subsequently, the relationship between stress equilibrium time and energy dissipation was established, and it was proved that the fastest growing time period of the energy dissipation curve was approximately equal to the rock stress equilibrium time, while the length-to-diameter ratio of the granite specimen that could better maintain the stress uniformity before rock crushing was 0.8 and the loading strain rate was 156.8 s−1.

1. Introduction

The stress uniformity of rock material under impact loading is one of the most meaningful indicators in the rock dynamic study by the Split Hopkinson pressure system. The dynamic characteristics of rock are influenced by the size effect, shape effect, strain rate effect, various environments, etc. of the specimen [1]. Moreover, the crack morphology, intrinsic relationships, macro- and microcracks, and dynamic equilibrium of rock can be studied by the dynamic compressive test and the Brazilian disc test, which use the Split Hopkinson pressure system [2]. The stress uniformity is to evenly reflect the distributed stress in the specimen and the deformation of the rock specimen under the impact loading. Additionally, the stress equilibrium statement usually exists before the rock is broken.
Research on the rock dynamic characteristics of strain rate effect and size effect under the impact loading has been verified extensively. Regarding the strain rate effect, Daryadel et al., experimented with high strain rate on four types of glasses and the high strain rate was shown to have a big influence on glass dynamic characteristics [3]. Borosilicate performed higher destructive strain and compressive strength and energy absorption. Mostafa Hassan et al., used DIC to monitor the strain rate from 30 s−1 to 200 s−1 of ultra-high-performance concrete under impact compressive tests, and found that the strain rate and stress equilibrium tend to be constant at 200 MPa [4]. Fu et al., conducted the compressive strength and specific energy absorption of different asphalt/water-to-cement ratios increased with increasing strain rate, and built a model of statistically continuous damage constitution [5]. Gong et al., used the triaxial SHPB system to study the sandstone under the confining pressure of 5 MPa, 7.5 MPa, 10 MPa, 12.5 MPa, and 15 MPa with a strain rate of 40–160 s−1. It was found that the peak strain was independent from the confining pressure, but increased with strain. The secant modulus was independent from the confining pressure and strain rate [6].
The size effect has also been studied widely. Xiong et al., performed the carbon fiber polymer and confined the length–diameter ratios of 0.5 and 2 in SHPB test. The results showed that the concrete specimens had no significant effect on strain rate [7]. Yuan et al., studied different length–diameter ratios of coal specimen and proposed a new approach to determine the stress equilibrium [8]. Among length–diameter ratios of 0.3, 0.4, 0.5, 0.6, 0.7, 0.8, 0.9, and 1, the critical length–diameter ratios of 0.6, 0.3, and 0.4 are optimal. By comparing the stress states and damage patterns of cylindric and cubic specimens, Mei Li et al., proposed conversion factors for the compressive strength of cylinders and cubes that vary with the strain rate [9].
At present, there are many studies on rock dynamic behavior and energy dissipation, while there are few studies on energy dissipation and stress equilibrium time under impact loading with different length–diameter ratios. They have simply investigated the effect of damage characteristic based on fractal rock mechanics and fracture mechanics theory [10]. Q Yuan et al., defined a stress balance coefficient and performed Hopkinson tests on coal samples with length-to-diameter ratios of 0.3–0.9 to study the stress uniformity and deformation behavior during dynamic compression [11]. Jiong Wang et al., monitored the strain behavior of granite impact damage by DIC, and the strain was 0.52% before reaching the stress equilibrium [12].
The Hopkinson’s test allows for a variety of analyses of strain rates and fracture patterns of rock specimens. For harder rocks such as granite, longer stress equilibrium time can be maintained before damage. However, there are no more studies on the relationship between rock crushing dissipation energy and stress equilibrium. To this end, research is needed on combing the energy equilibrium factor to define the stress uniformity of granite specimens. The stress equilibrium time was investigated by varying length–diameter ratios and strain rates. An analysis of dissipated energy and energy dissipation rate of specimens was conducted under different loading conditions. Then, we analyzed the relationship between the stress equilibrium time and dissipated energy, thereby providing a reference for determining the size of the granite sample under similar circumstances.
The study of stress equilibrium focuses on the precision of the SHPB. Energy is the main parameter to analyze the dynamic behaviors, dissipated energy, and other research on theory. This study aims to establish the relationship between dissipated energy and stress equilibrium time, which provides a new direction to analyze the stress equilibrium time and text accuracy.

2. Methods

2.1. Material

Granite is one of the most common rock types in iron ore mines, with higher strength than sandstone and grey stone, and relatively high stress uniformity. Granite has more obvious crushing characteristics under laboratory conditions, which helps to analyze the nodes of stress equilibrium time. Therefore, according to the test requirements, we selected white and grey granite specimens.
The density of the granite is 2.8 × 10³ kg/m3 and the Young’s modulus is 36.5 GPa. The cross-sectional dimension of specimen is 50 mm × 50 mm.
As shown in Figure 1, the granite specimens were divided into five groups of length–diameter ratios of 0.6, 0.8, 1.0, 1.2, and 1.4, respectively. The diameters of the specimen remained the same and the lengths were changed by 30 mm, 40 mm, 50 mm, 60 mm, and 70 mm, in order to better study the effect of size on stress equilibration time.

2.2. SHPB System

We used the Split Hopkinson pressure (SHPB) system at the University of Science and Technology, Liaoning to measure the pulse waveform and stress–strain relationship of materials under impact loading. The system is composed of an air gun, incident bar, transmission bar, and absorption bar, as shown in Figure 2. The ultra-high dynamic strain meter is connected with two strain gauges that are to collect the strain signal of the test. The three waveforms of incident, transmitted, and reflected waves are displayed on the high-speed data collection equipment, while the waveforms and data can be processed on a computer. We added a fixing device at the end of the incident bar, which can resolve the data error caused by the repeated impact of two rods to break the rock [13]. The air gun, incident bar, transmitted bar, and absorption bar of this test stress equilibrium time up are 50 Cr steel with a Young’s modulus of 240 GPa. The density of the bar is 7800 kg/m3, the longitudinal wave speed is 5580 m/s, and the wave impedance is 4.35 × 10⁷ MPa/s.

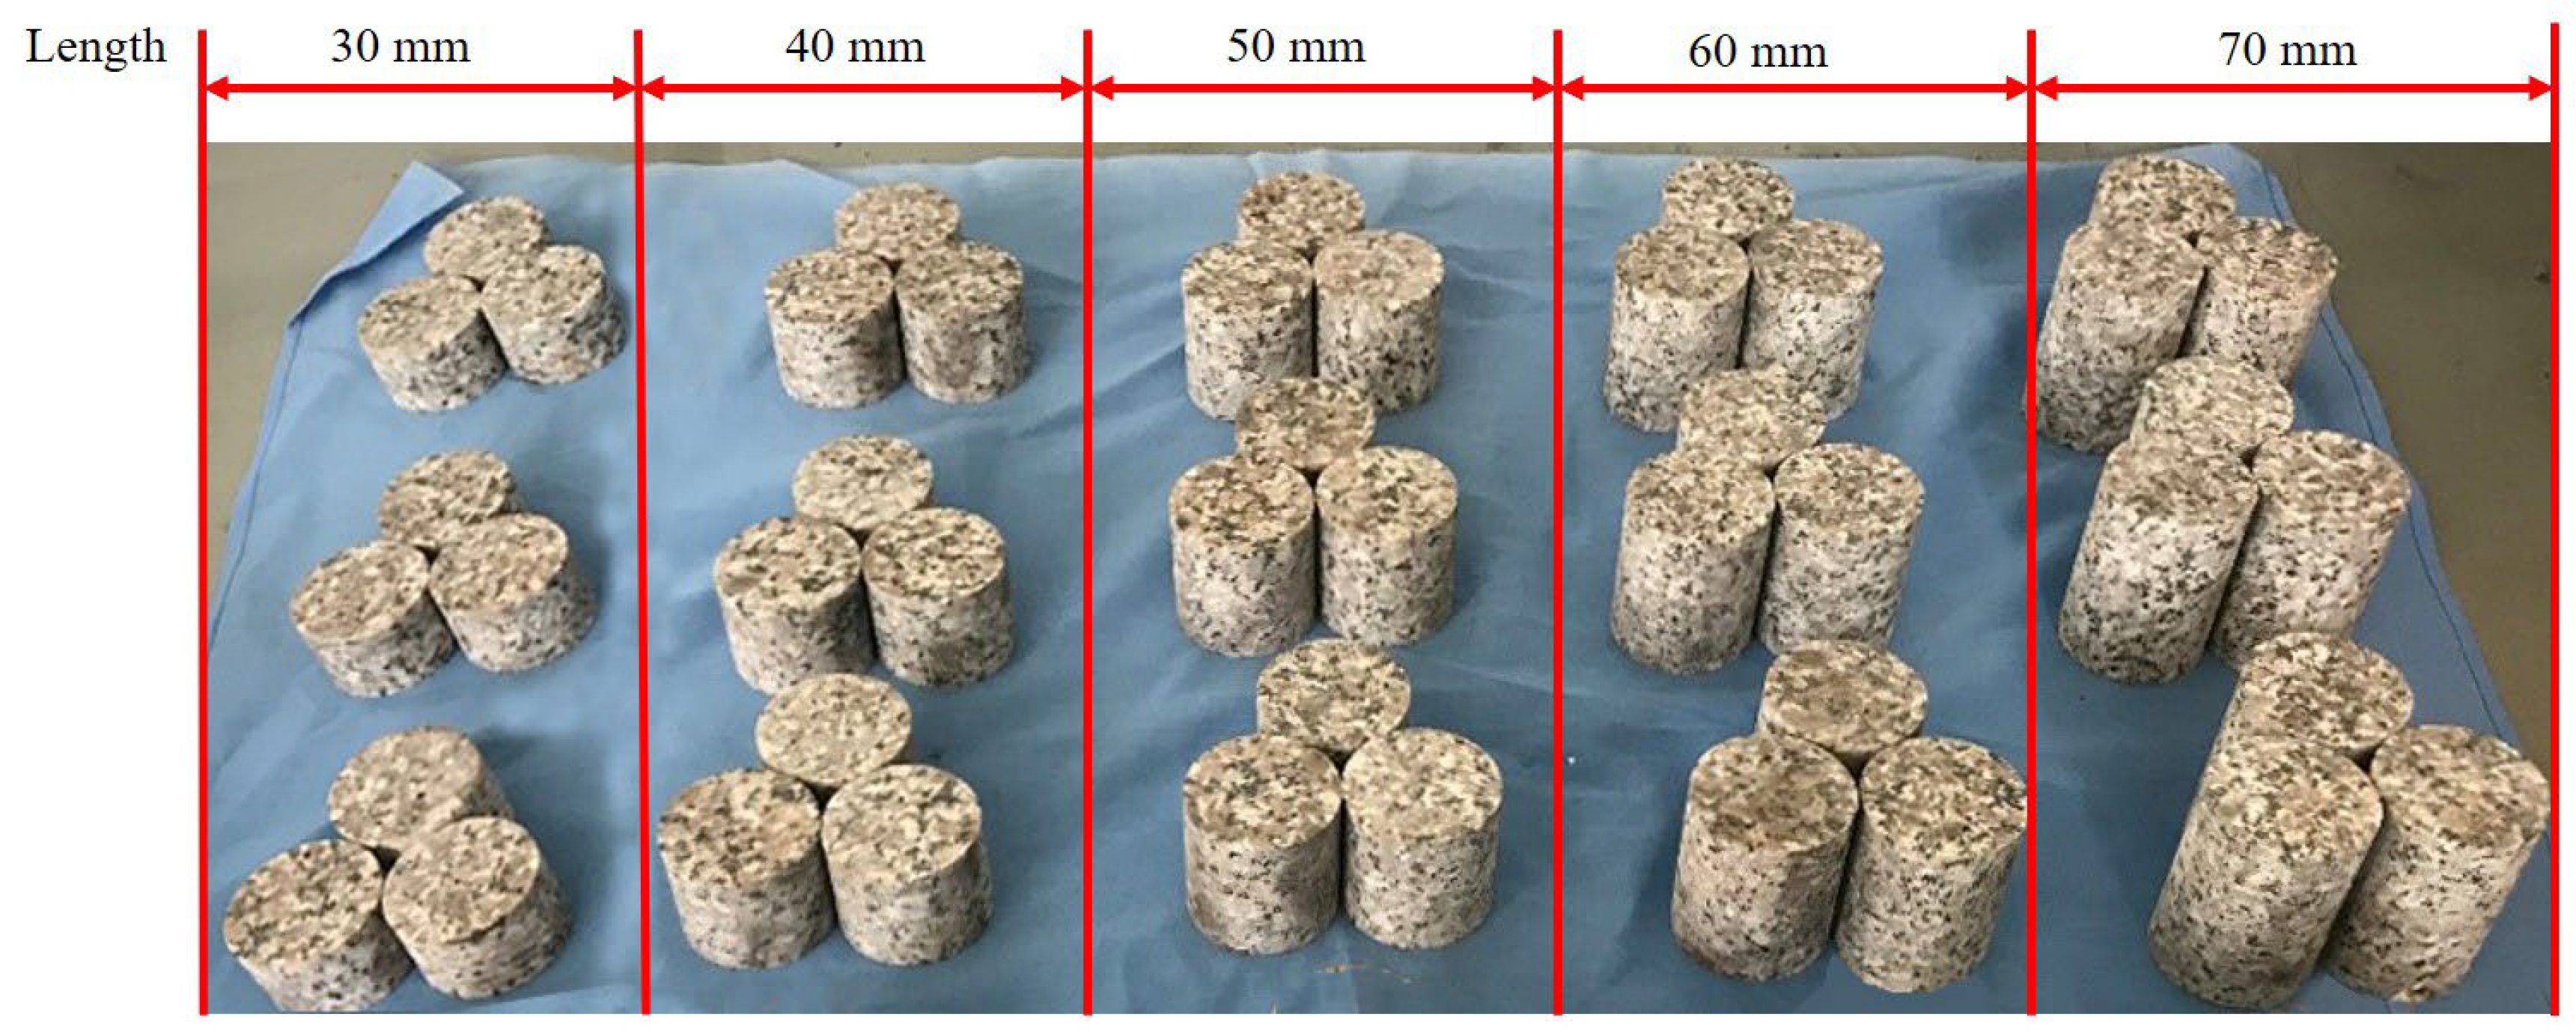
2.3. Test Preparation

To check whether the incident wave and the transmission wave of the initial waveform diagram are semi- sinusoidal waves, we preform Hopkinson impact with no specimen before the formal test. The amplitude attenuation of the transmission wave is much smaller than that of the incident wave, indicating that the incident rod and the transmission rod of the device are well connected. The transmission rate of the wave energy at the two-bar connection is large. The incident wave rises slowly and has enough time to allow the rock to reach the stress balance.
(1)
Option of length–diameter ratio
In order to obtain test data closer to the intrinsic relationship of the rock, it is necessary to ensure that the granite specimen is in a uniform state of stress during the loading process. Different length–diameter ratios change the time of single propagation of stress waves within the rock and the number of transverse reflections within the rock. The length–diameter ratio has an effect on the rock stress equilibrium process, which leads to differences in rock fragmentation patterns. The diameter of the granite specimen used in the test is 50 mm. In order to better reflect the stress wave response characteristics in the range of mechanical properties of granite rocks, the selected length–diameter ratios are 0.6, 0.8, 1.0, 1.2, and 1.4, respectively.
(2)
Option of strain rate
The strain rate is the essence of reflecting the dynamic load response characteristics of the rock, and the strain rate is controlled by the impact air pressure and impact loading during the test. We chose impact velocity of 8 m/s, 10 m/s, 12 m/s, and 14 m/s. The corresponding strain rates are 63.8 s−1, 109.8 s−1, 156.8 s−1, and 253.2 s−1. Determining a reasonable range of strain rate can provide a longer constant strain rate loading time before specimen fracture. The reason for the low uniformity of rock crushing under the action of high strain rate may be that the high-speed impact cannot reach the stress equilibrium state, and the study of strain rate can be helpful to the uniformity of rock crushing to improve the stress equilibrium time.
(3)
Option of data range
In order to determine the appropriate loading range, impact tests were conducted on 1.0 length–diameter ratio specimens. When the impact strength is lower than 0.1 MPa, the specimen has no obvious fracture deformation and the rock longitudinal wave velocity has no obvious change. The impact test data at this point are invalid and are not included within the experimental study. When the impact strength exceeds 0.23 MPa (the strain rate is about 253.2 s−1), the rock is violently deformed under the action of a single impact. The degree of rock fragmentation is higher and it is more difficult to obtain effective data during the propagation of stress waves. The loading data are shown in Table 1.
In order to research the stress equilibrium time before the rock broken, we performed pre-experiments to choose the loading test data, such as loading strain rate, length–diameter ratio, and impact velocity.
The feasibility of the experiment is ensured by the above theory and pre-experiments.
(4)
Analysis methods
The most common processing methods for the electrical signals obtained from strain gauges on the incident and transmission rods are the two-wave and three-wave methods. We use the three-wave method to process the strain signal because the three-wave method can reduce the perceived measurement error and is more reliable for brittle materials [14].
When the compression bar is in an elastic state, the waveform of the one-dimensional elastic stress wave is the same at any position when propagates in the bar. The incident strain signal εI and the reflected strain wave εR measured by the strain gauge at the incident rod are used to replace the incident strain wave εI(t) and the reflected strain wave εR(t) at the intersection of the incident rod and the rock, respectively. Moreover, the transmitted strain wave εT(t) at the intersection of the transmitted rod and the rock can be replaced by the strain signal εT measured by the strain gauge at the transmitted rod. The equations of stress, strain, and strain rate calculated by the three-wave method are as follows [15]:
{ σ S = A 0 E 0 2 A S ( ε I + ε R + ε T ) ε S = C 0 l S 0 t ( ε I ε R ε T ) d t R S = C 0 l s ( ε I ε R ε T )
where σs is the axial pressure of the specimen, εs is the strain of the specimen, RS is the strain rate of the specimen, A0 is the cross-sectional area of the bar, E0 is the Yong’s modulus of the elastic bars, C0 is the wave speed of elastic bar, As is the cross-sectional area of the specimen, and ls is the length of specimen.

3. Energy Dissipation and Stress Equilibrium Time

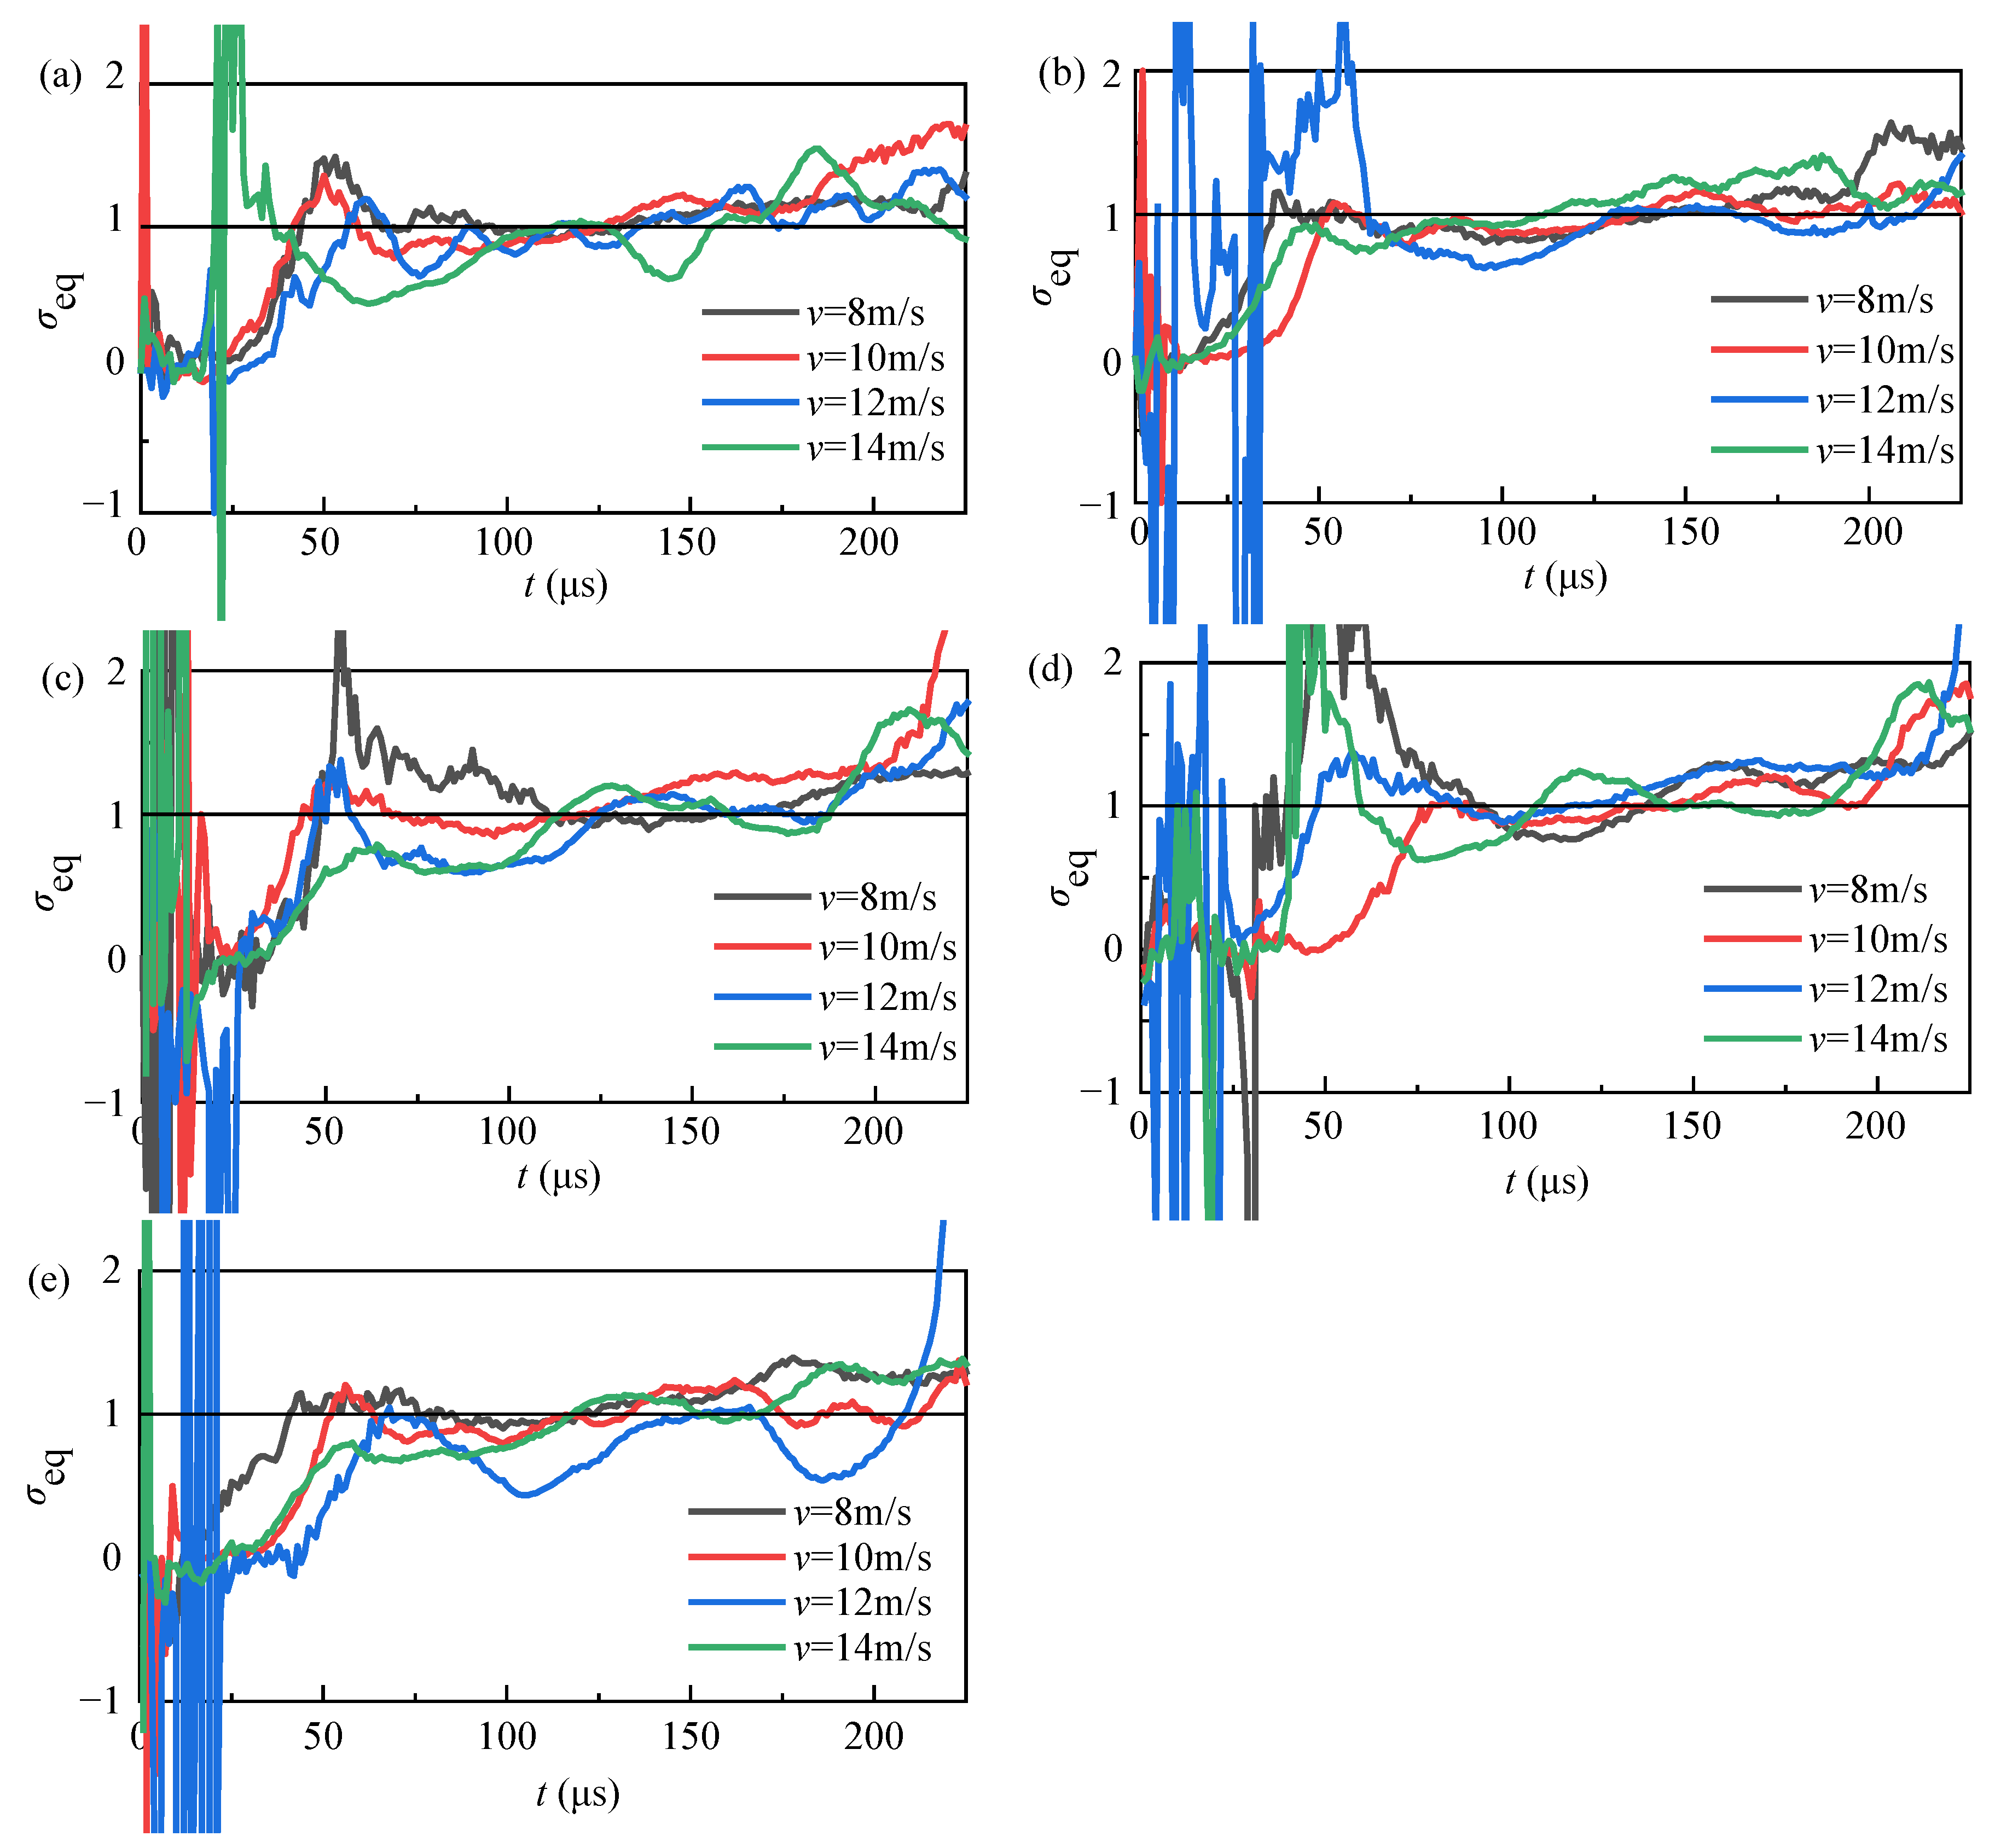
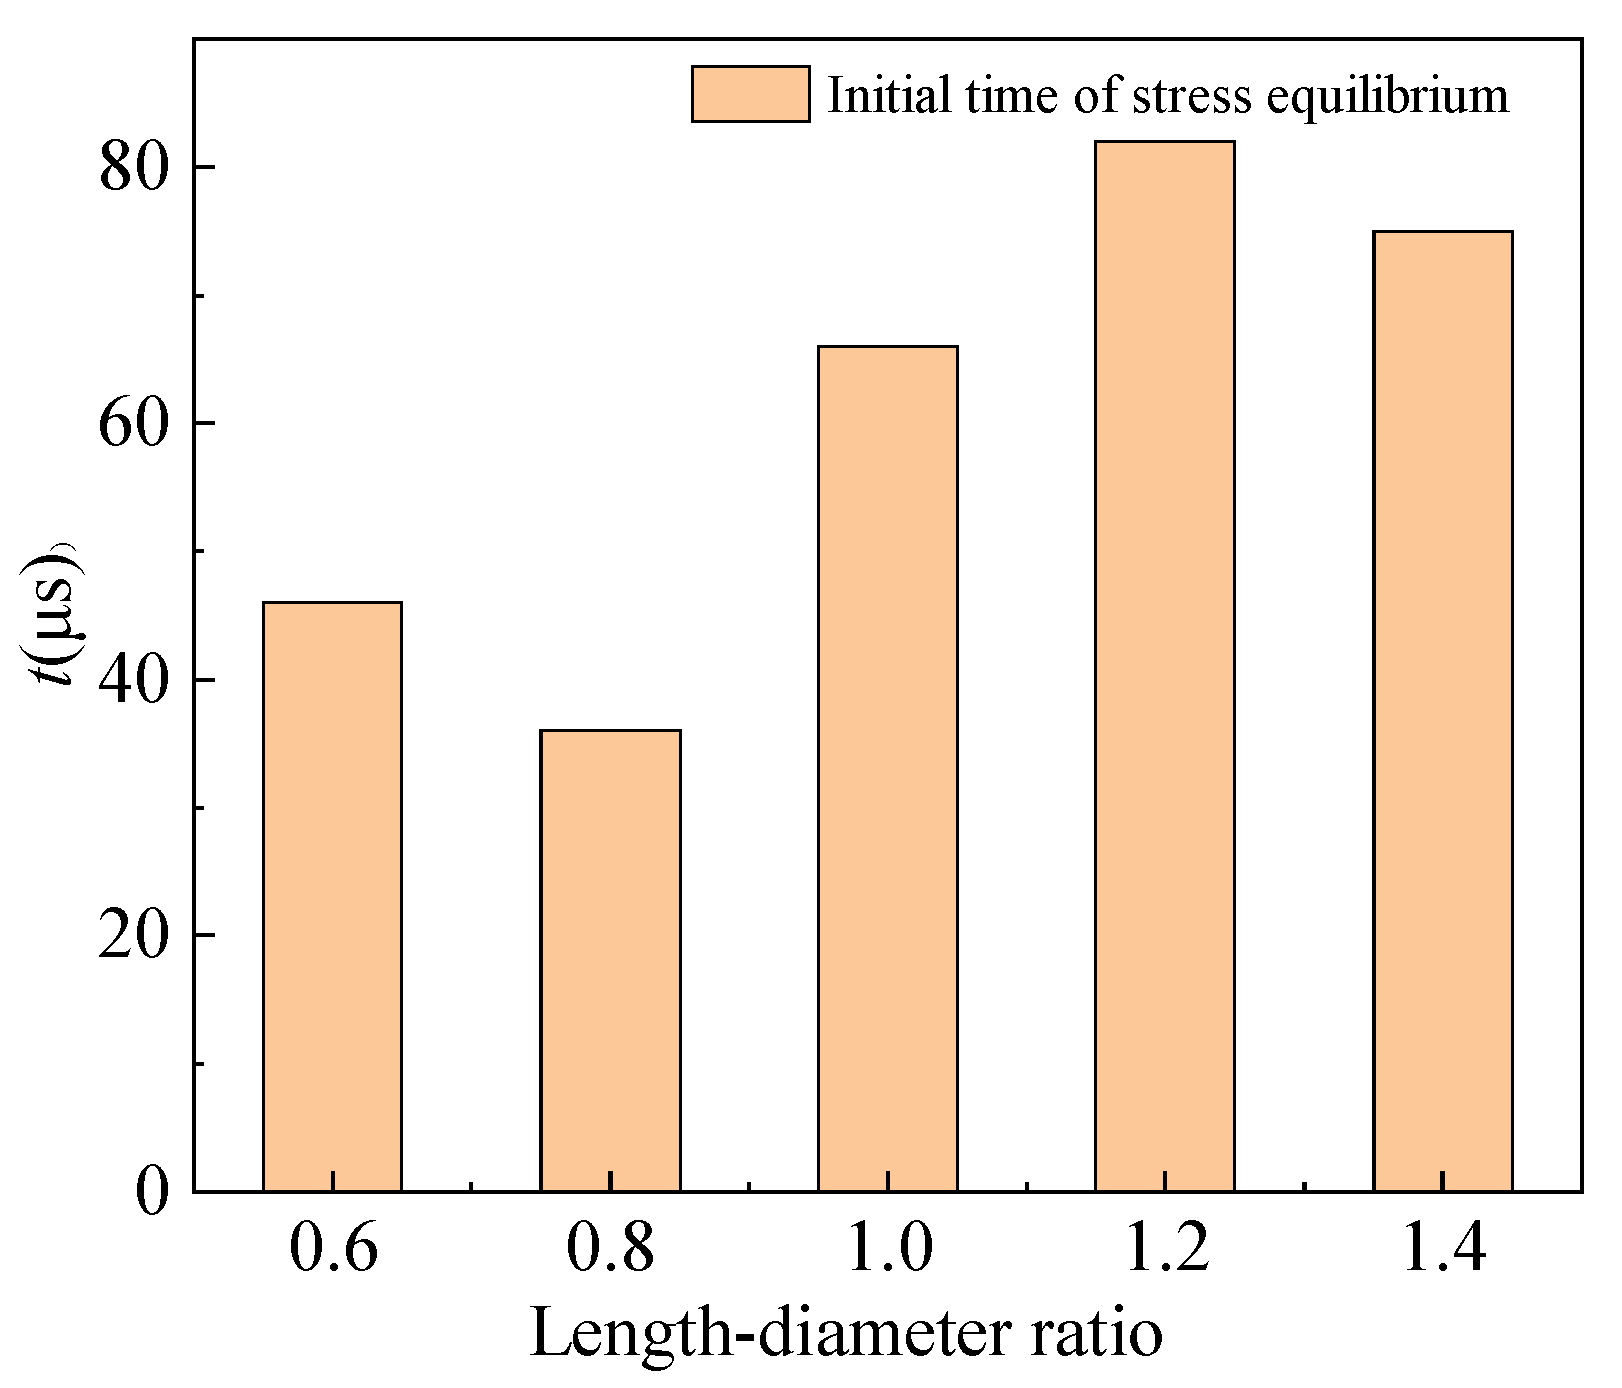
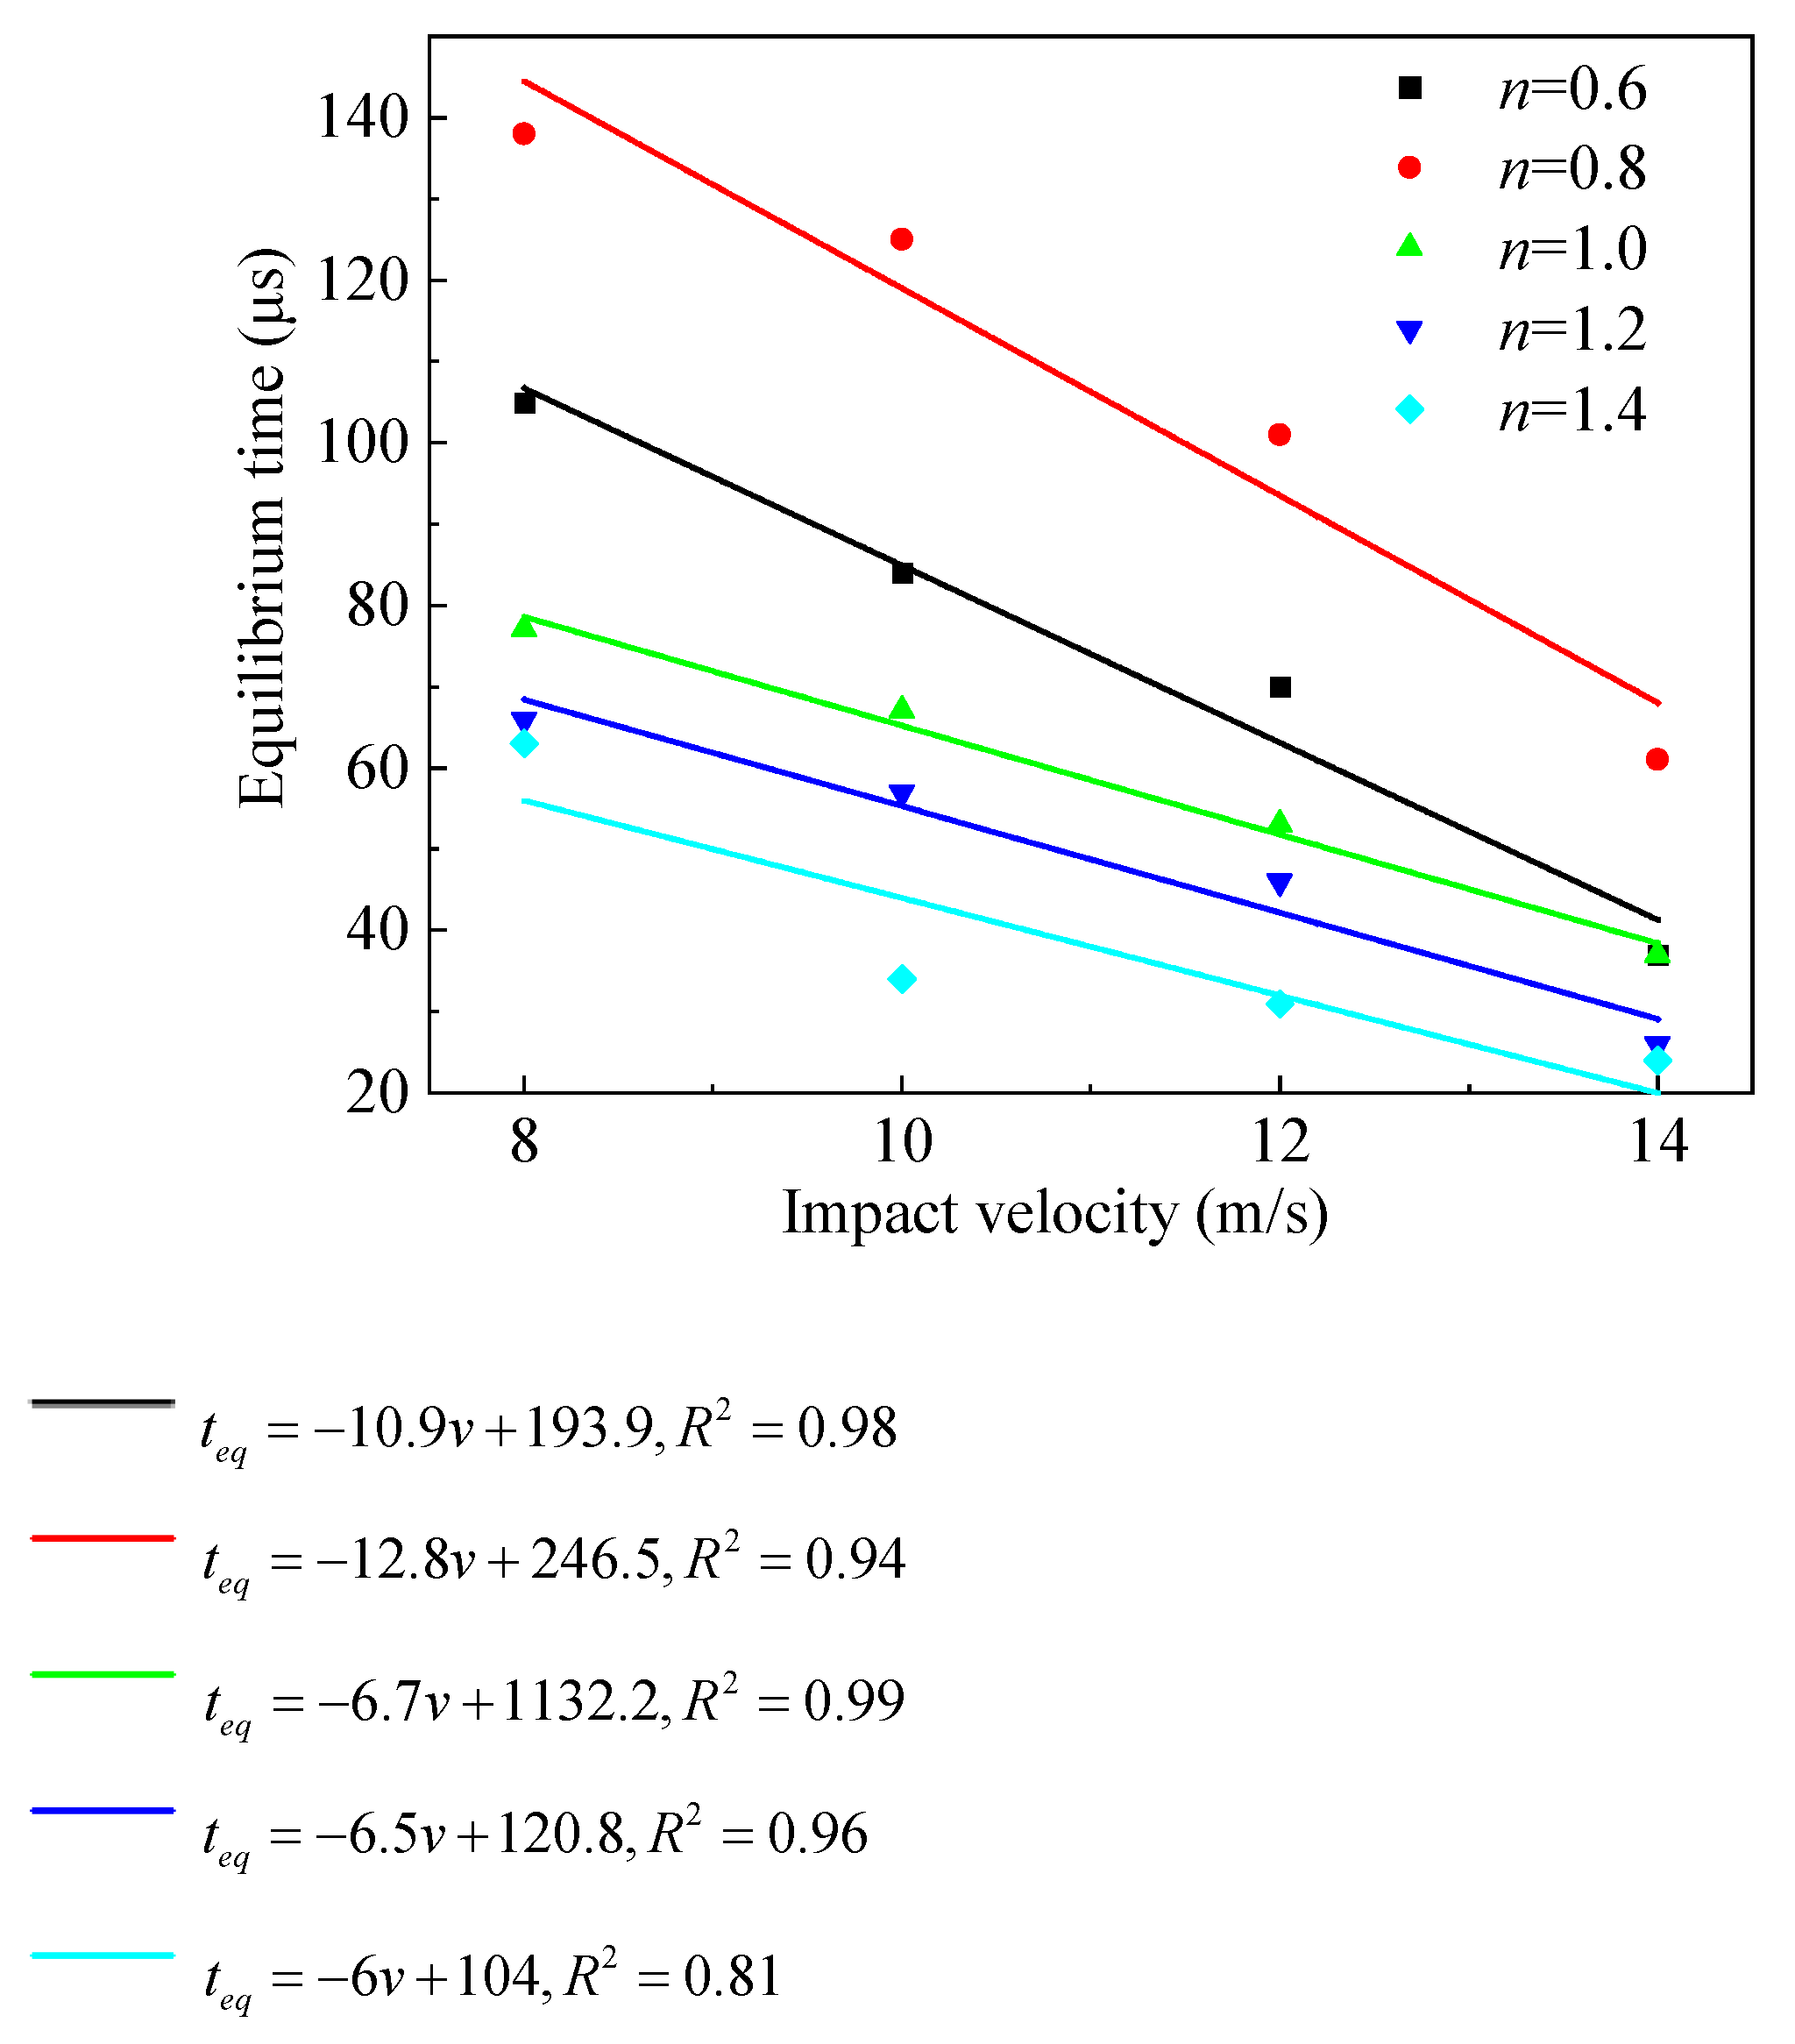
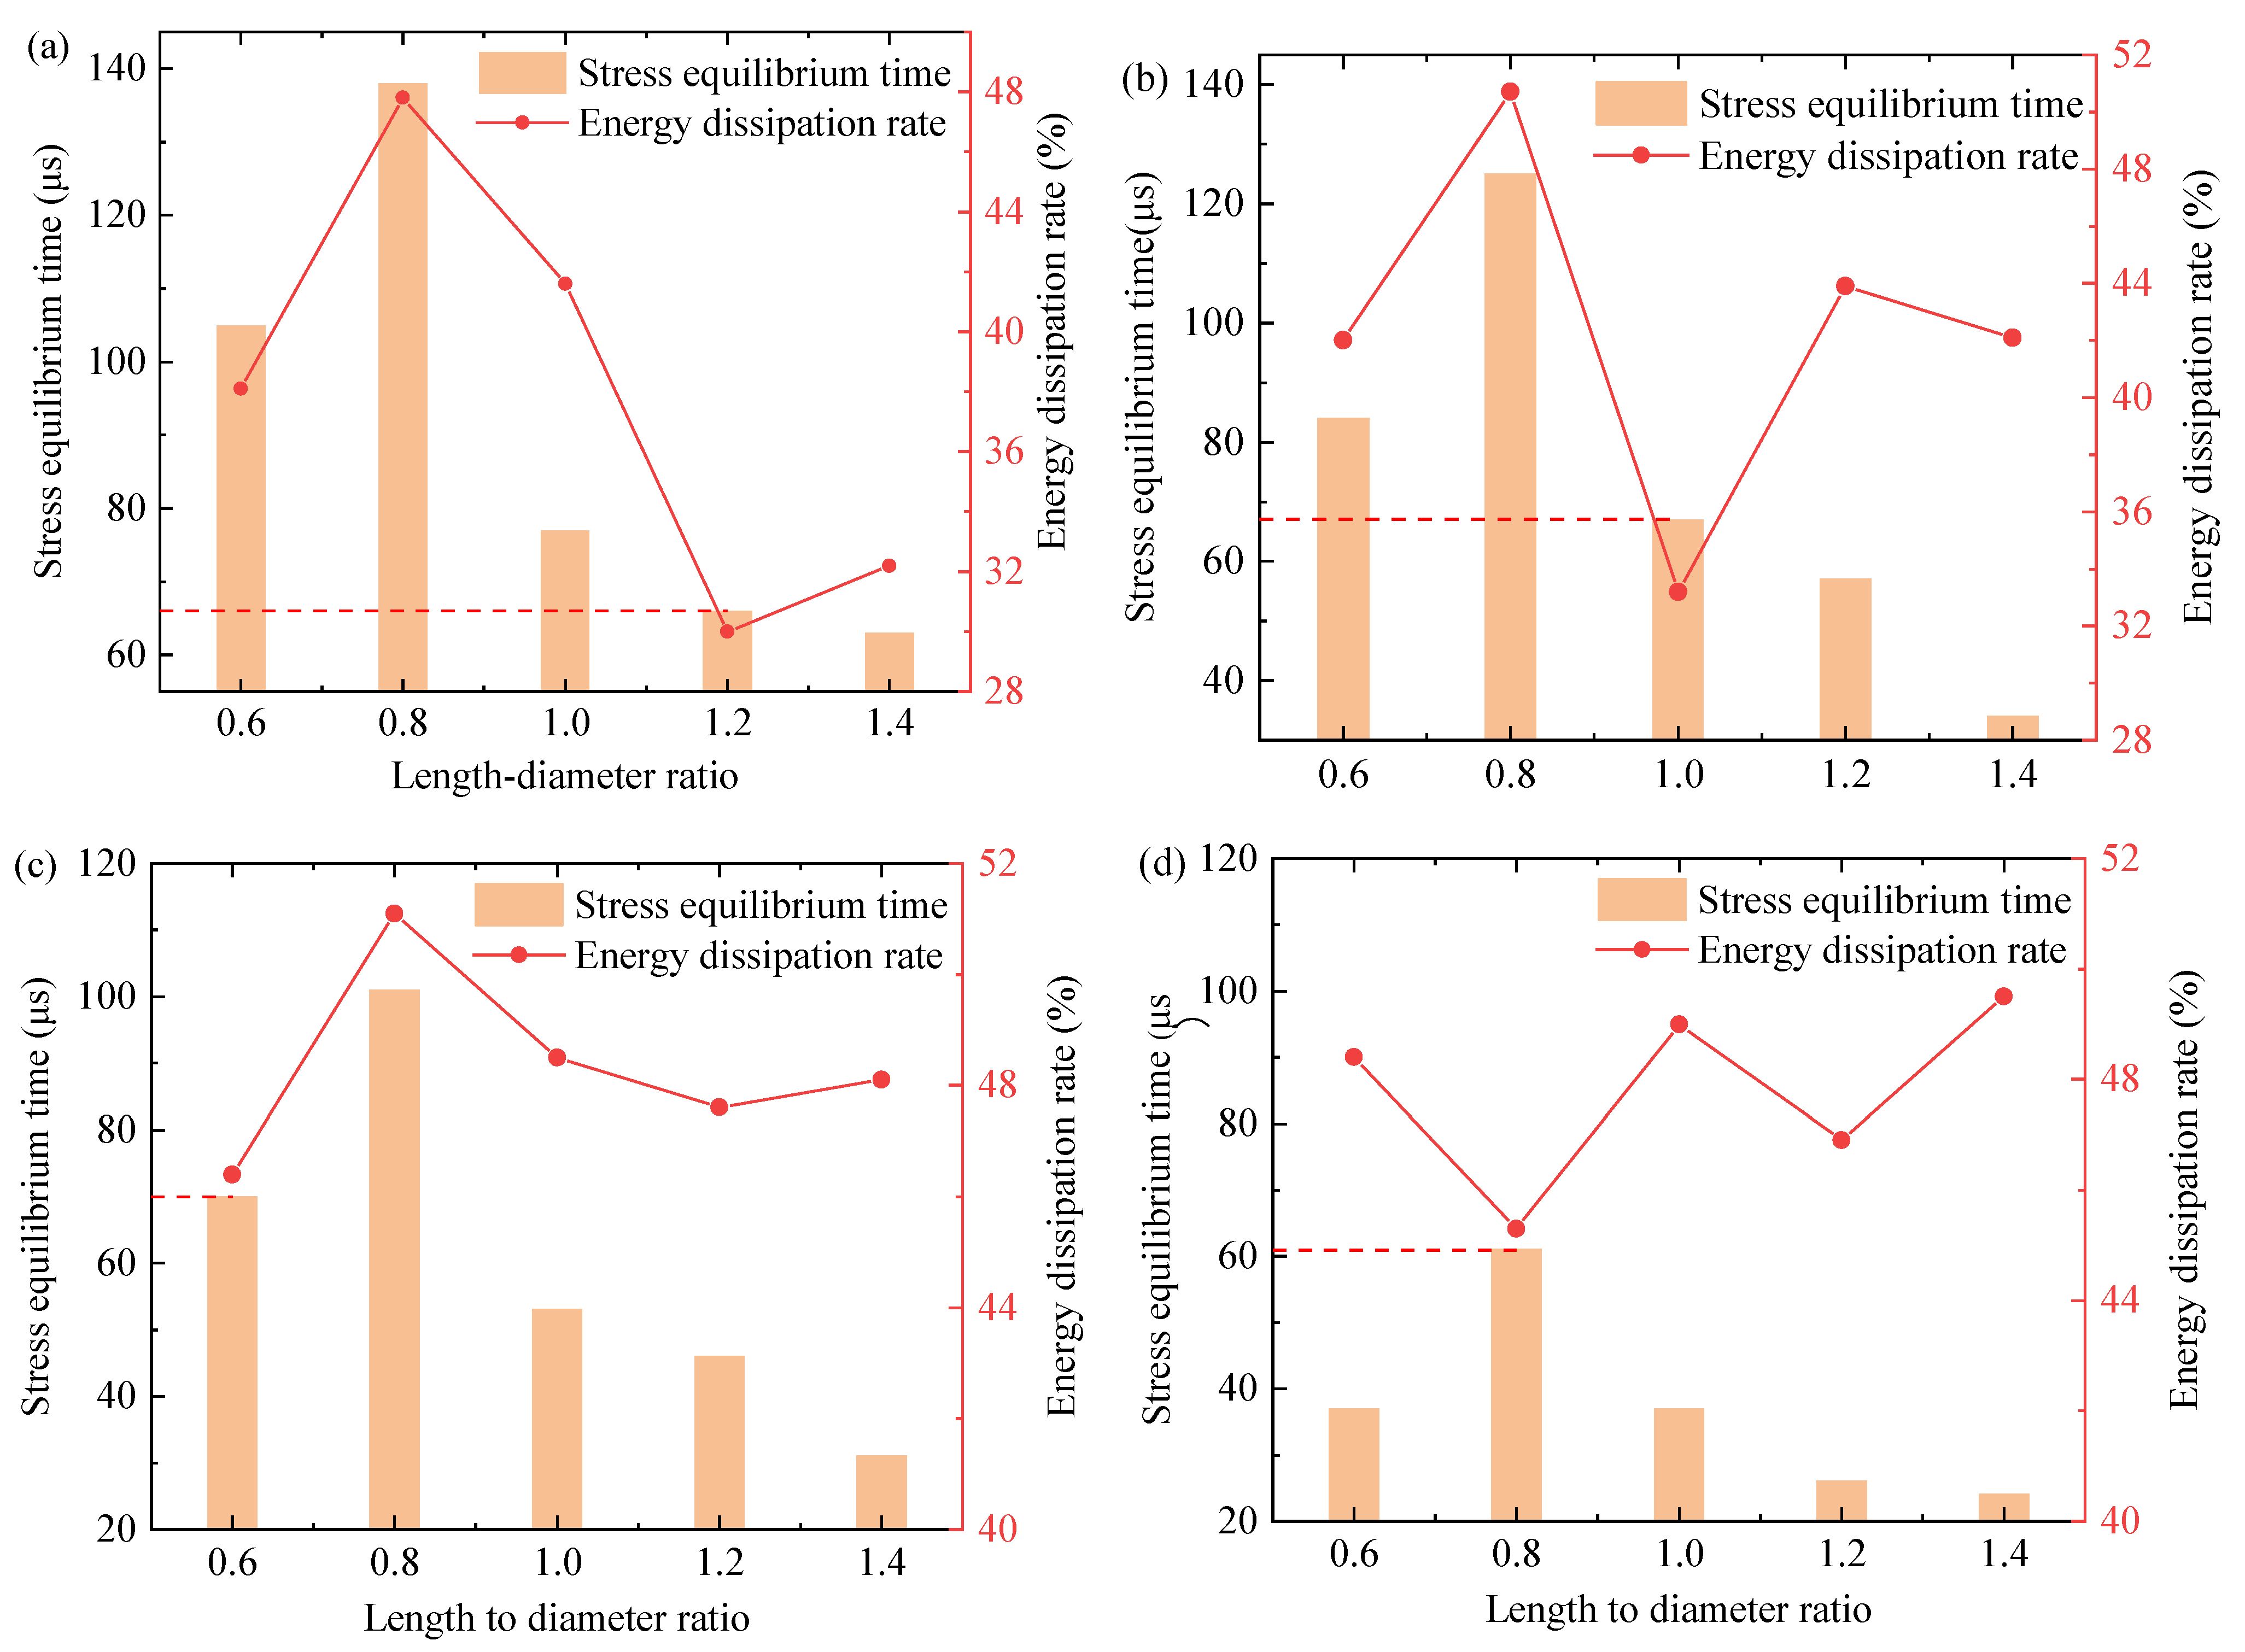
3.1. Stress Equilibrium Time

3.1.1. Equilibrium Factor

In order to study the stress equilibrium time of granite specimens under the SHPB impact test, the equilibrium factor is introduced to judge whether the specimens are in stress equilibrium status at both ends [11]. The stress equilibrium factor (σeq) was defined as in Equation (2):
σ eq = σ T σ I + σ R
The σI, σR, and σT are the incident stress, reflected stress, and transmitted stress, respectively. They can be obtained by the conversion of strain signals. When the stress equilibrium factor (σeq) approaches 1, stress at both ends of the specimen is in complete equilibrium. In order to analyze the stress equilibrium time, the granite specimens are in stress equilibrium within a σeq of 1 ± 0.05.

3.1.2. Stress Equilibrium Factor Curve

The stress balance factor curves of granite specimens with a length–diameter ratio of 0.6 shown as Figure 3a under different strain rates are taken as examples. According to the above-mentioned stress equilibrium time (Table 2) when the strain rate is 63.8 s−1, the stress balance factor waveform of 0–46 μs fluctuates sharply and is in a state of stress disorder. The stress difference between the two ends of the specimen is very large, resulting in uneven internal stress distribution. The stress balance factor waveform of 46–151 μs is close to the stable state and in the stress balance period. After 151 μs, the waveform rises rapidly and appears irregular, which is caused by the deformation failure at both ends of the specimen.
Under the same impact load, the granite specimens with a length–diameter ratio from 0.8 to 1.4 are in the stress equilibrium period of 46–151 μs, 36–174 μs, 108–185 μs, 82–148 μs, and 75–138 μs, respectively. By comparison, the waveform of stress balance factor with a length–diameter ratio of 0.8 is the most stable.
Figure 4 shows the stress equilibrium time and correlation equations for each combination of impact velocities and equilibrium time with length–diameter ratios of 0.6~1.4. The initial time of the stress equilibrium with the length–diameter ratio of 0.8 occurs at 36 μs; for a length–diameter ratio of 1.0, this is 108 μs. Figure 5 shows that the duration of stress equilibrium with a length–diameter ratio of 0.8 is up to 138 μs. The time to maintain the stress equilibrium state for a length–diameter ratio of 1.4 is 63 μs, which is the shortest duration between five length–diameter ratios of granite specimen. The granite specimen with a length–diameter ratio of 0.8 has the most favorable stress equilibrium initial time and duration among the five length–diameter specimens. Additionally, the duration of stress equilibrium is more than twice as long compared to that of the granite specimen with a length–diameter ratio of 1.4, which can provide a reference for subsequent studies on the effect of the length–diameter ratio on stress uniform.
In general, according to the degree of waveform fluctuation, the stress state of the specimen is divided into three stages: stress disorder, stress equilibrium, and stress imbalance. With the increase of the strain rate, the emergence of stress equilibrium in the same length–diameter ratio granite specimen was postponed successively, and the duration of stress equilibrium was reduced. However, the fluctuation of the granite specimen with the length–diameter ratio of 1.0 was unstable, with “W” type fluctuation.
Under the same impact load, the degree of fluctuation of the stress balance factor curve shows a significant negative correlation with the length–diameter ratio. The two ends of stress balance factor curves performed dramatic fluctuations with small length–diameter ratios, but the stress equilibrium can be maintained for a longer period. Moreover, the stress equilibrium factor of rocks with large length to-diameter ratio changes abruptly at the beginning and end, and the duration of stress equilibrium is relatively short.

3.2. Energy Calculation

When the SHPB test is performed, the incident rod transfers energy under a dynamic load. During the test, the incident energy reflects part of the energy at the moment of contact with the specimen, and the rock absorbs part of the energy and transmits it to the transmission rod. Energy losses due to other temperatures, collisions between bars, etc., are ignored. Discussions are mainly on the change law of energy absorbed, i.e., dissipated energy, Ed, and stress equilibrium under different length–diameter ratios and strain rates. The energy carried by the incident wave, reflected wave, and transmitted wave is calculated according to the strain signal [11], as shown in Equation (3):
E int ( t ) = E C A 0 t ε 1 2 ( t ) d t E re ( t ) = E C A 0 t ε R 2 ( t ) d t E tra ( t ) = E C A 0 t ε T 2 ( t ) d t
where Eint(t), Ere(t), and Etra(t) are the energy of incident, reflection, and transitions, respectively.
In the dynamic compression test, following the law of conservation of mass, the dissipation energy Ed(t) of the rock sample is calculated by Equation (4):
E d ( t ) = E int ( t ) E re ( t ) E tra ( t )
where Ed(t) is the energy dissipation of rock.

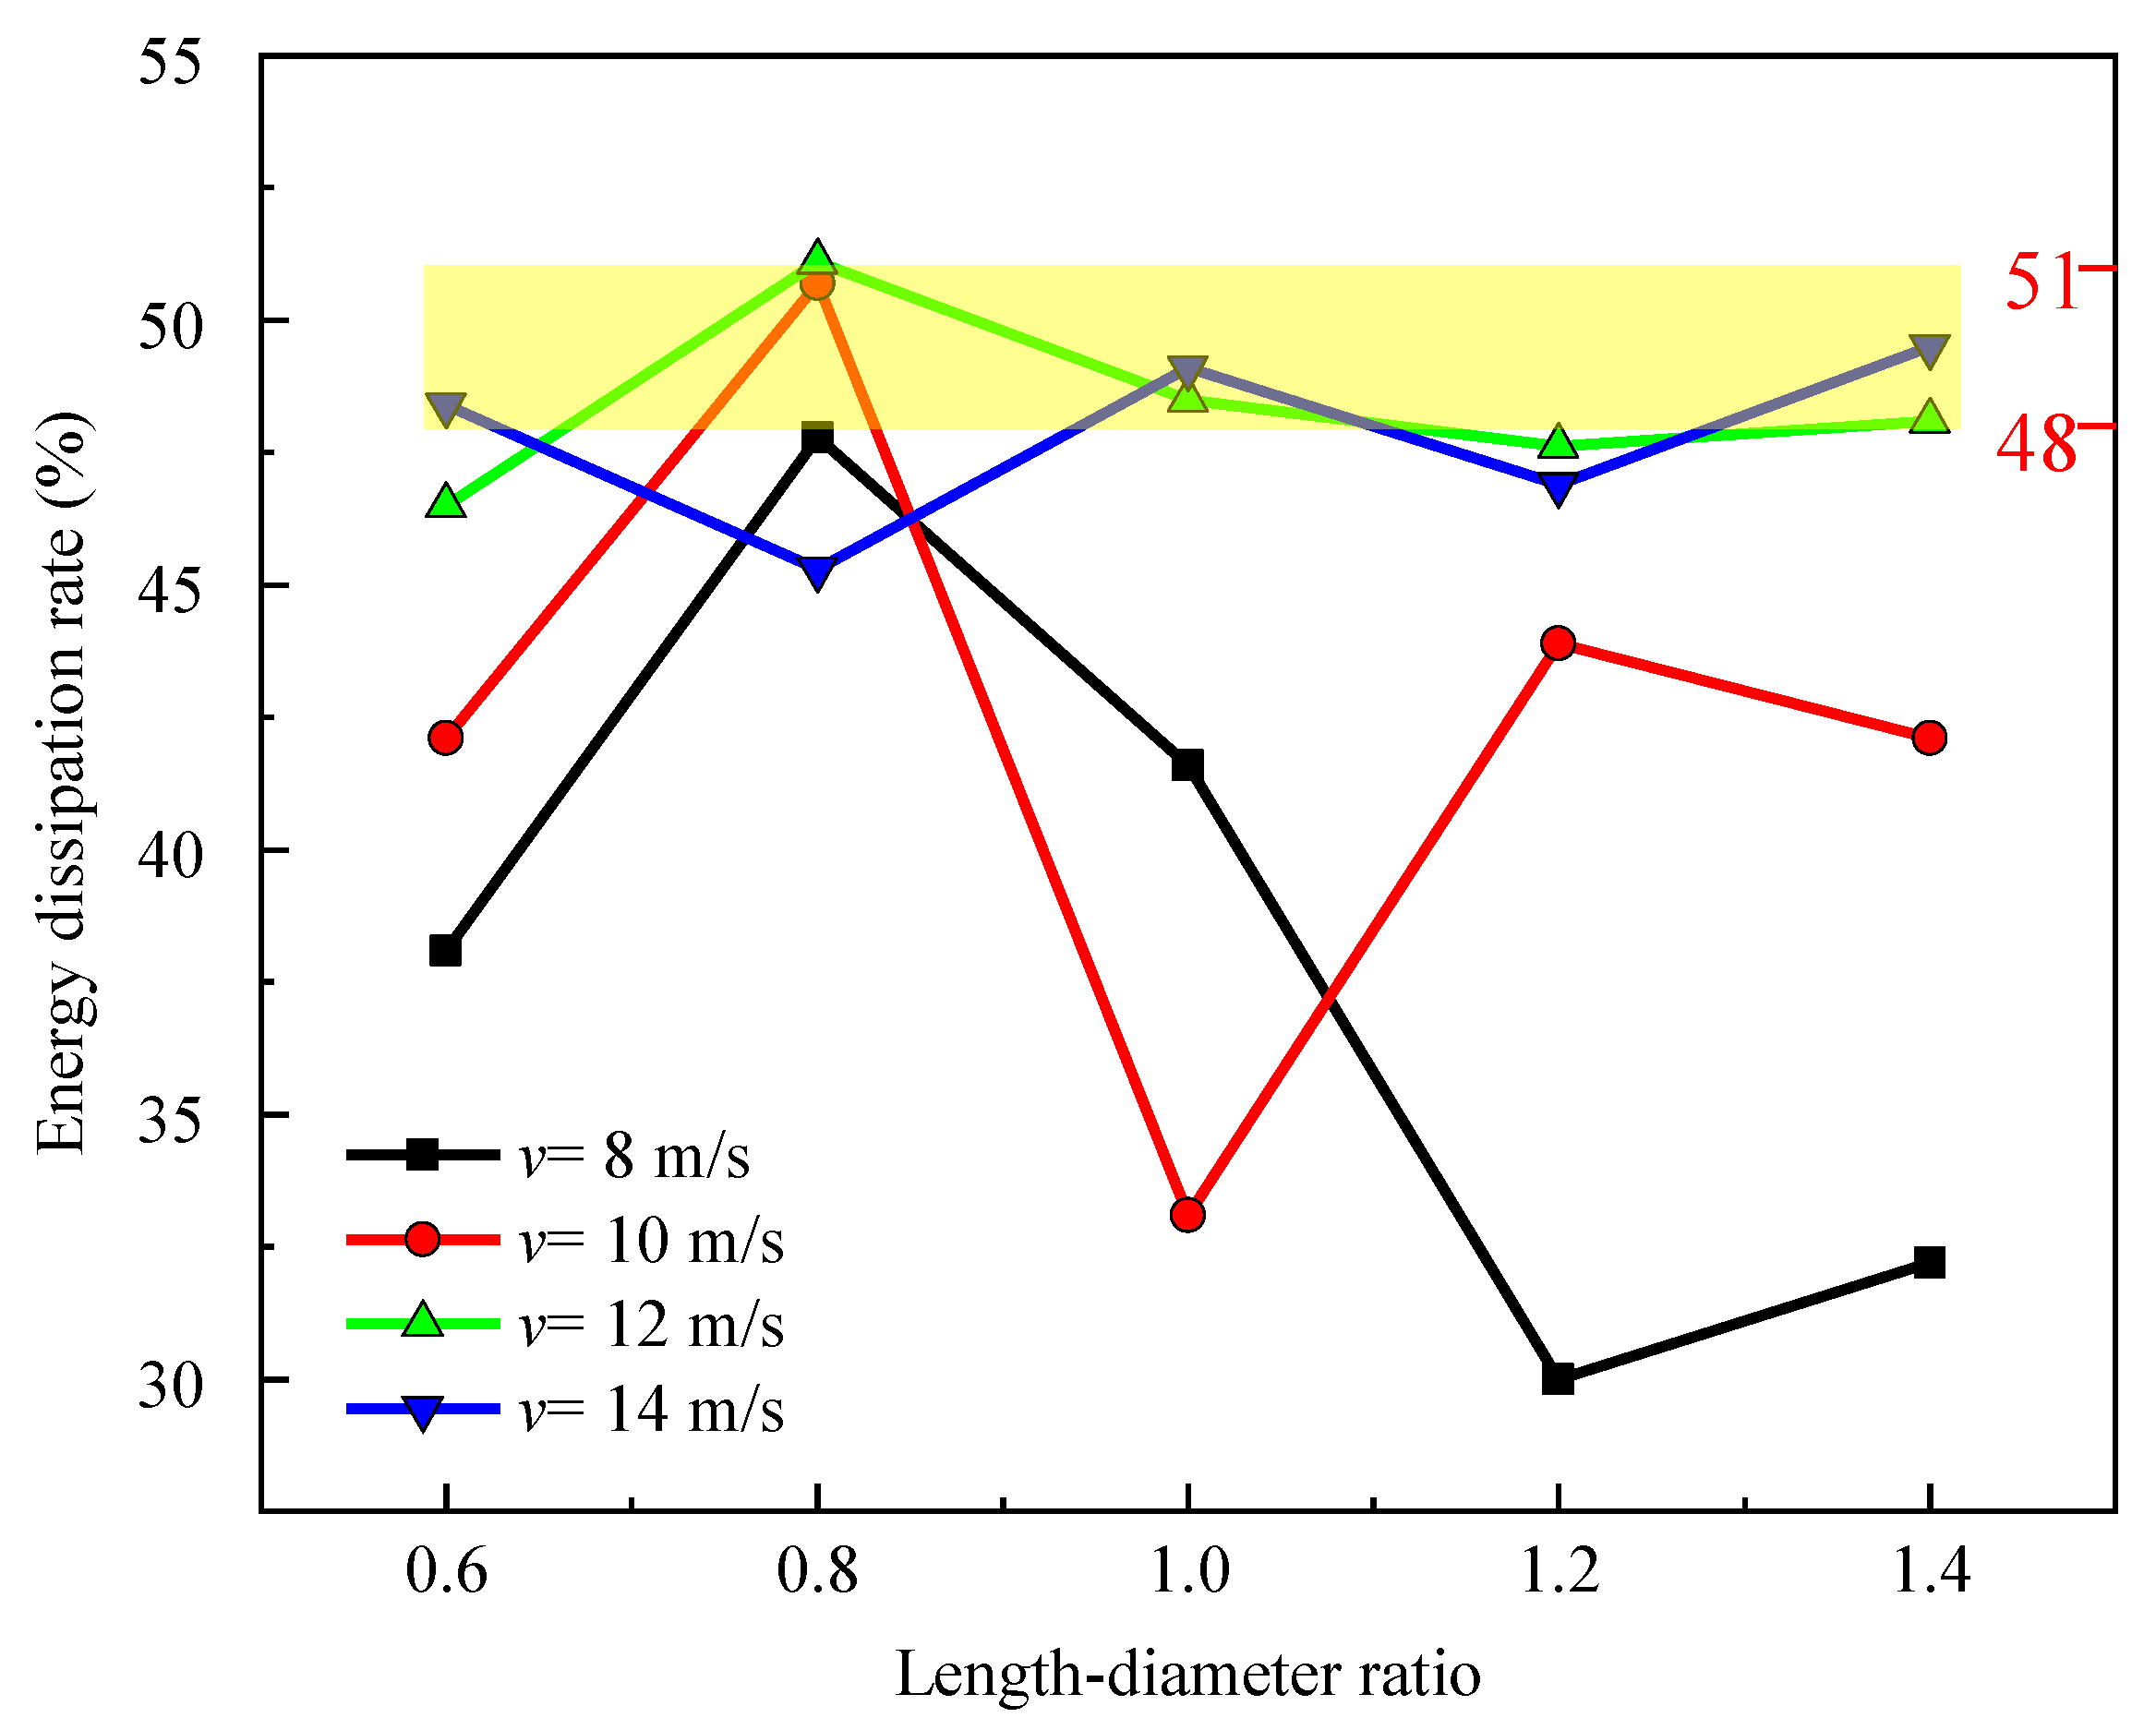
3.3. Energy Dissipation Rate

The time history curves of incident energy, reflected energy, transmitted energy, and dissipated energy are shown in the Figure 6. As can be seen in Figure 6a, the length–diameter ratio of 0.6 is 63.8 s−1. The energy action mechanism presents three main stages:
First, four energy curve bases approximate to zero before 46 μs. At this moment, the rock is in the elastic compression stage. The pre-existing fissures in the specimen are gradually closed under the impact load. The elastic energy is stored inside the rock.
As the compression continues, the stress equilibrium occurs at 46 μs. During the period of 46 μs~151 μs, the incident energy and dissipation energy curves increase linearly, and the reflected energy increment is not significant. The dissipated energy increments faster than transmitted energy. A portion of the energy is absorbed by the granite specimen for pre-existing fissure expansion and the generation of new crack.
After 151 μs, the slope of dissipated energy curve decreased, the transmitted energy increment is over the dissipated energy. During this period, the internal cracks expand rapidly and penetration occurs. The granite specimen releases energy by breaking. The dissipated energy curve stabilizes at first and then decreases. The slope of the dissipated energy curve becomes negative. The curves of incident energy, reflected energy, and transmitted energy tend to be a constant value.
In the stress equilibrium time, the slope of the incident and dissipated energy curve increases linearly. Increased energy is absorbed by the rock and it is the largest increment during the whole energy process. At the end of the stress equilibrium time, the slope of the incident energy and the dissipated energy curves decrease. The rock absorbs a large amount of energy during the stress equilibrium time, and the energy is released after reaching the peak strength of the rock.

3.4. Effect on Impact Loading

With the same length–diameter ratio, the dissipated energy of granite specimen increases with the increase of load strain, as shown in Figure 7.
The dissipated energy curves with an impact velocity at 12 m/s and 14 m/s have a clear downward trend after achieving the peak. At other impact velocities, the curves tend to be stable. The reason is that the stress equilibrium time cannot last too long under the high-speed impact loading. The elastic energy stored in the rock is released instantly, leading to premature plastic deformation or failure of the granite specimens.
Figure 8 shows the relationship of the dissipated energy rate and length–diameter ratio. When the impact velocity is 14 m/s, the energy dissipation rate is stable in the range of 45~50%. When the impact velocity is 12 m/s, the energy dissipation rate is stable in the range of 46~51%. When the impact velocity is lower than 12 m/s, the dissipated energy curves with different length–diameter ratios fluctuate wildly. Thus, we can receive a critical velocity of 12 m/s. When the impact velocity exceeds 12 m/s, the energy dissipation rates of different aspect ratios are stable within a certain range. If it is less than this critical velocity, the rock dissipation energy varies widely in different length–diameter ratios. Overall, the difference of energy dissipation rate is more uniform when the length–diameter ratio is 0.6, and the energy dissipation rate of the granite specimen is more concentrated at a length–diameter ratio of 0.8. When the length–diameter ratio of granite specimen is larger than 0.8, the dissipated energy rate performs large differences.
The energy dissipation rate approximately corresponds to the stress equilibrium time. The higher energy dissipation rate is, the longer stress equilibrium time is. However, there is a sudden decrease in some values. By comparing the specific data of the stress equilibration time, we find that the lower energy dissipation rate corresponds to a stress equilibrium time in the range of 60~70 μs. The low energy dissipation rate is 30~33% at impact velocities of 8 m/s and 10 m/s, and 45~47% at impact velocities of 12 m/s and 14 m/s.
Taken together, these results suggest these results suggest that a critical impact velocity exists as shown in Figure 9. Above the velocity, the energy dissipation rate is significantly higher, and the energy dissipation rate for different length–diameter ratios is relatively stable within a certain range. Under the critical velocity, the energy dissipation rate has no clearly regularity.
In addition, there exists a critical length–diameter ratio of 0.8. The length–diameter ratios below this value maintain the stress equilibrium for a longer period, and the energy dissipation rate is decreased. Above a 0.8 length–diameter ratio, it is difficult for the rock to maintain the stress equilibrium for a longer period.

4. Dynamic Behavior

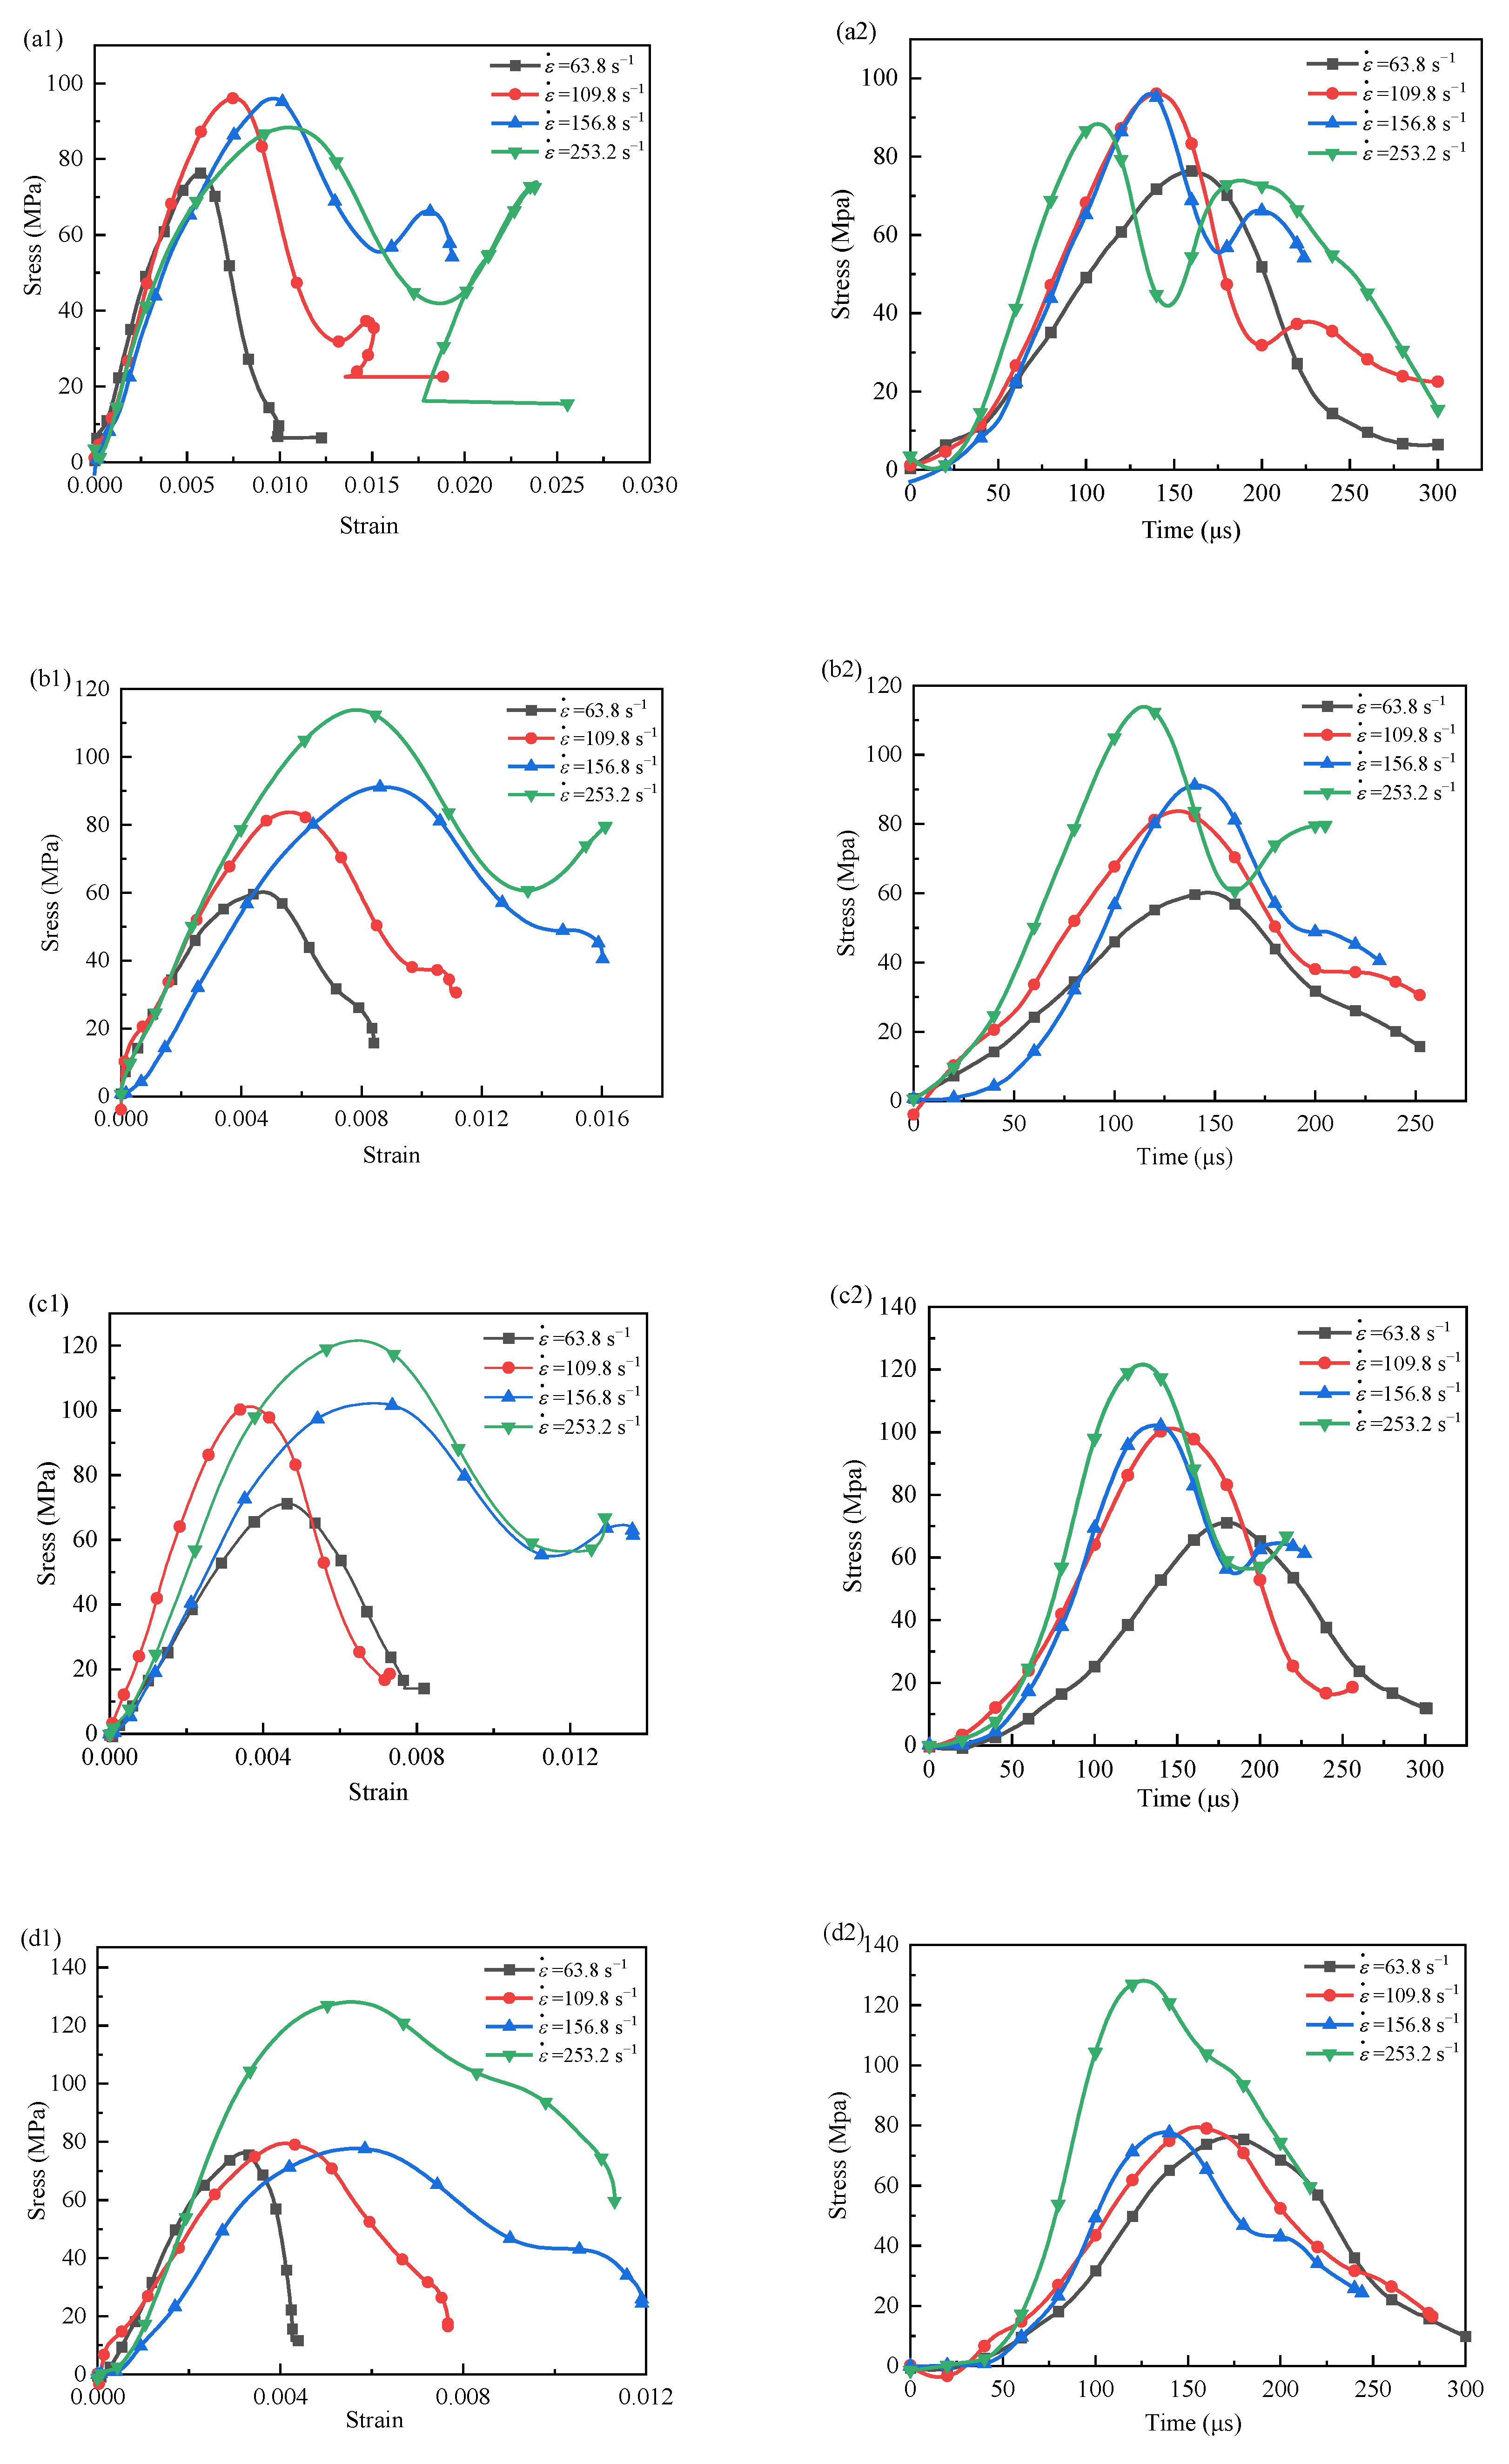
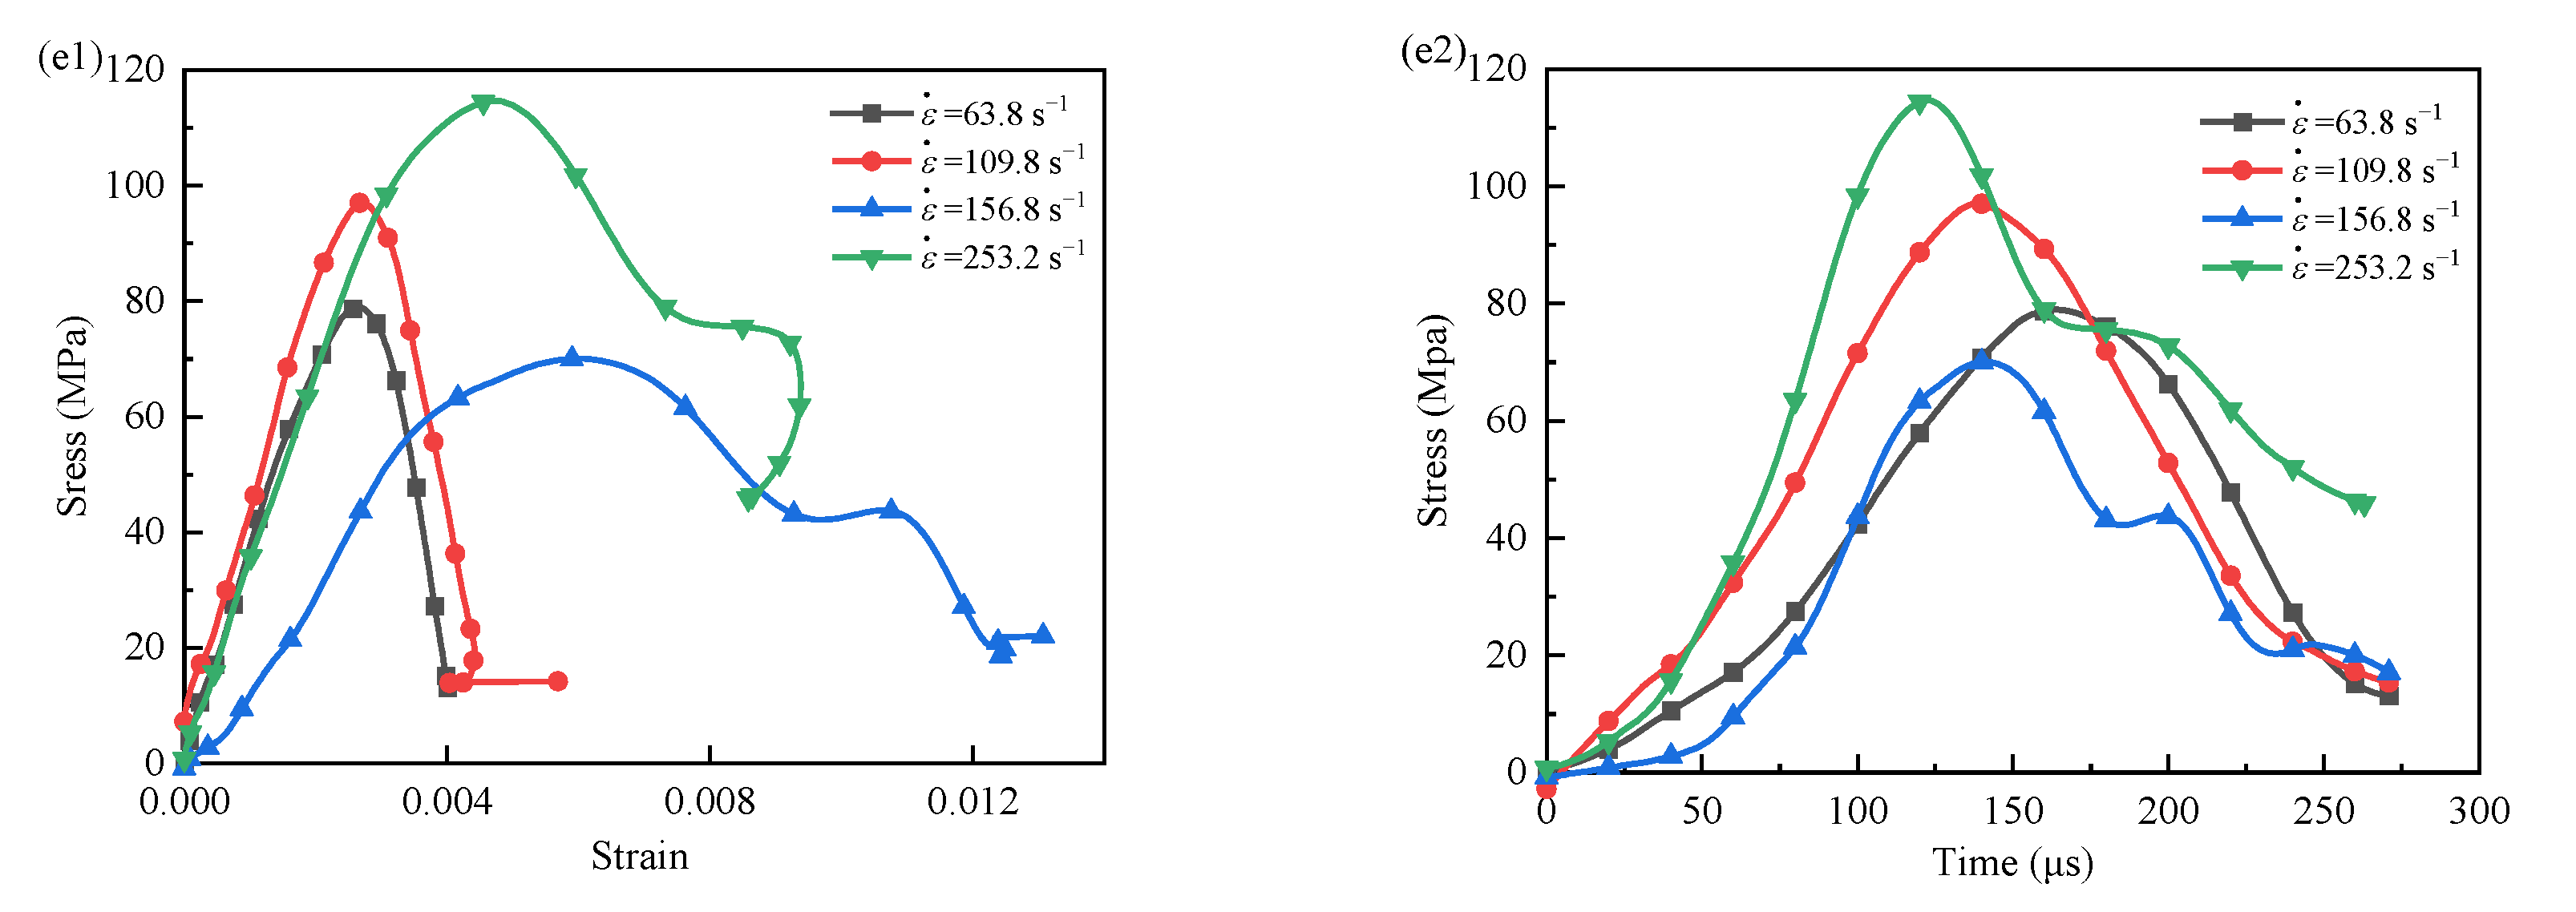
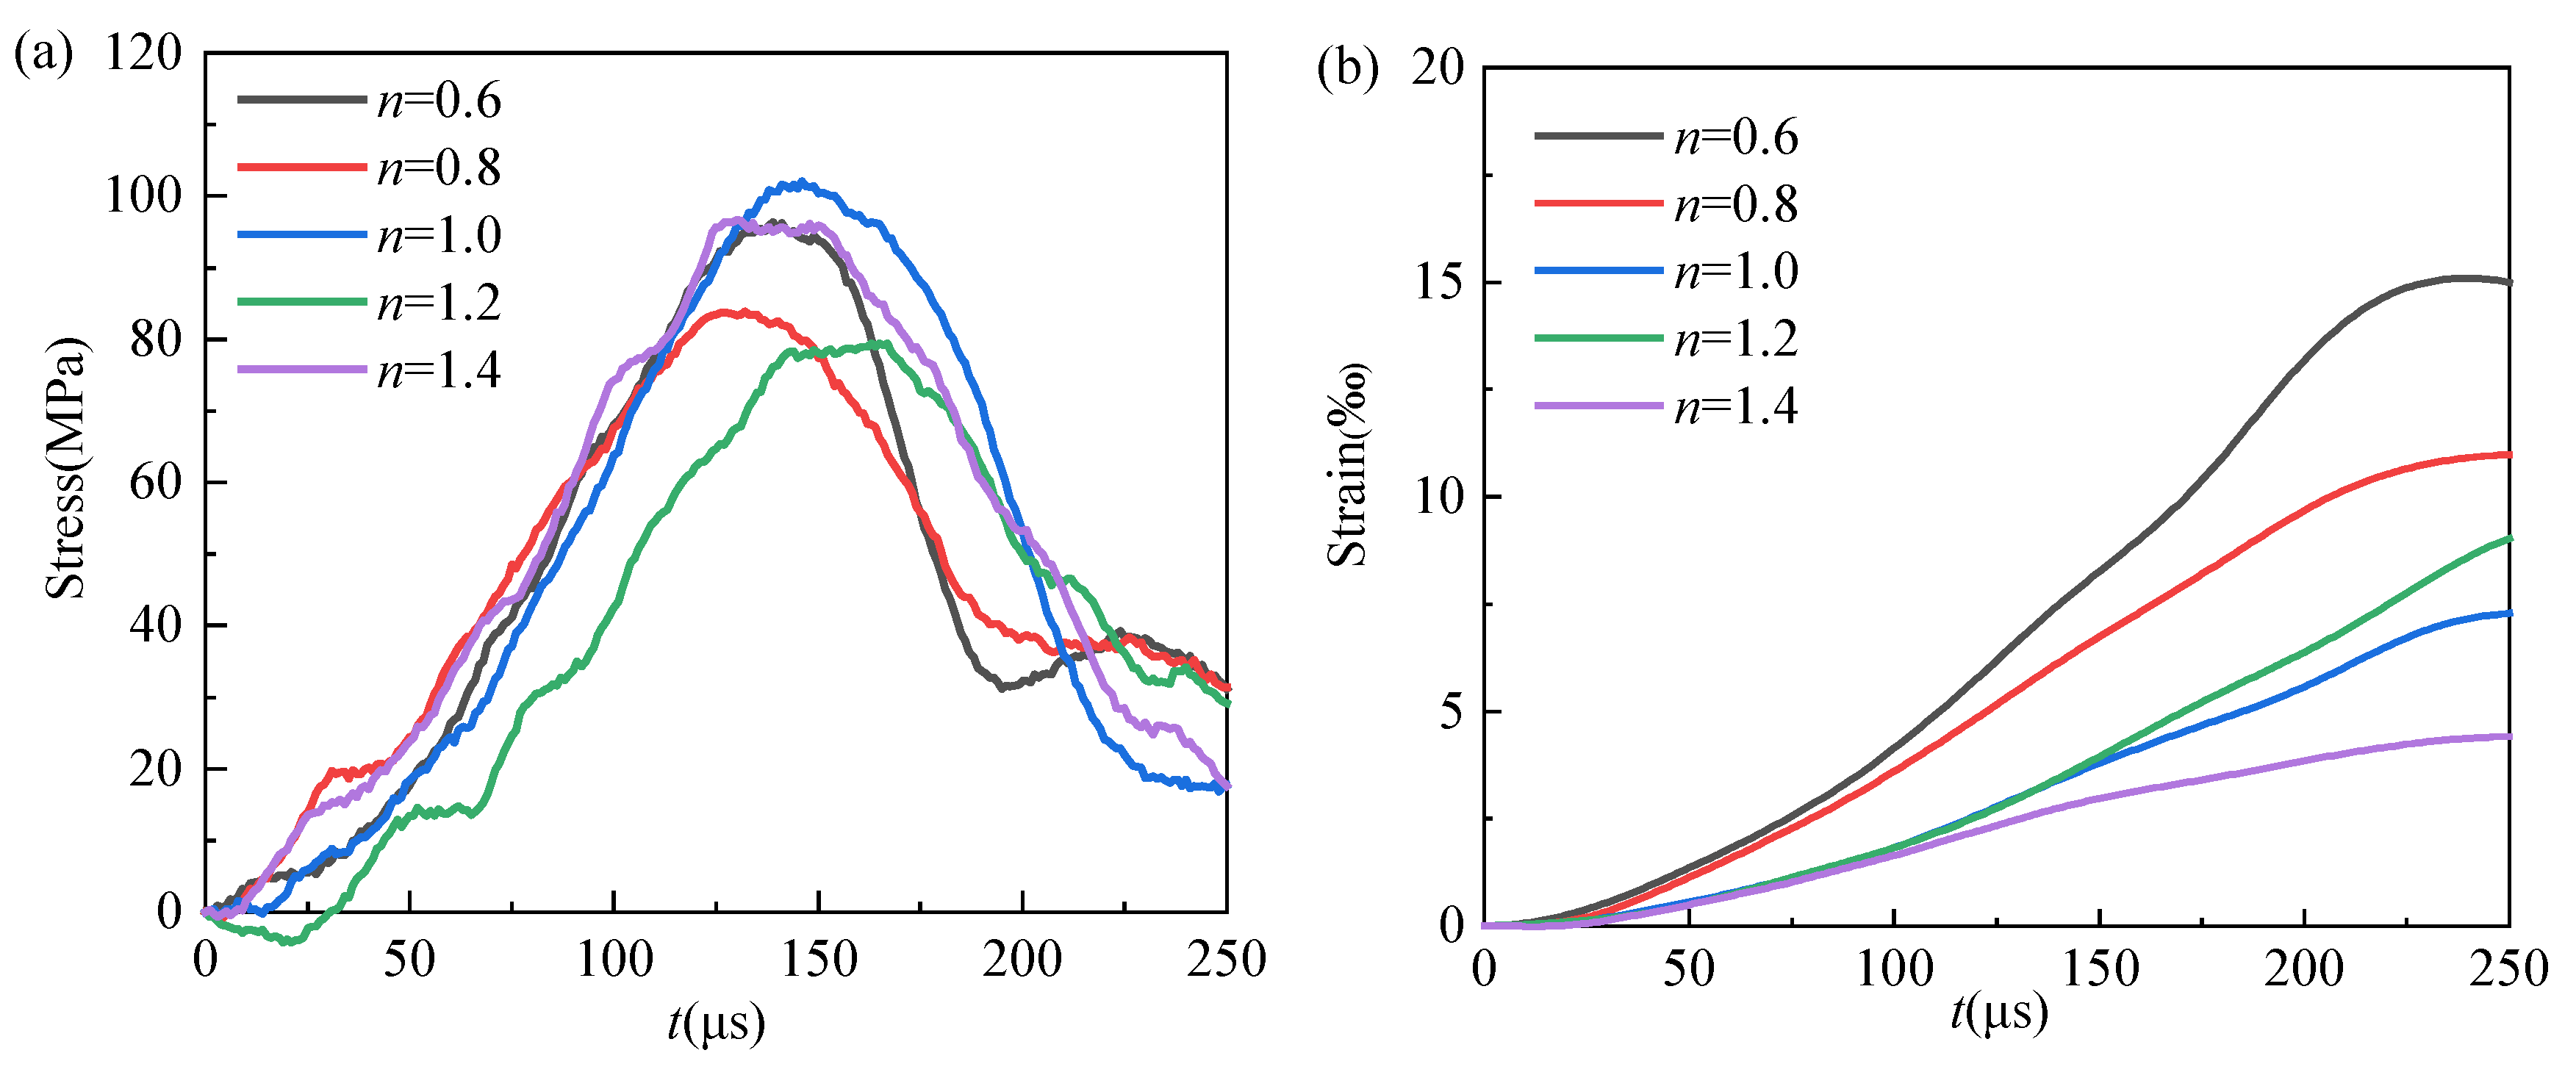
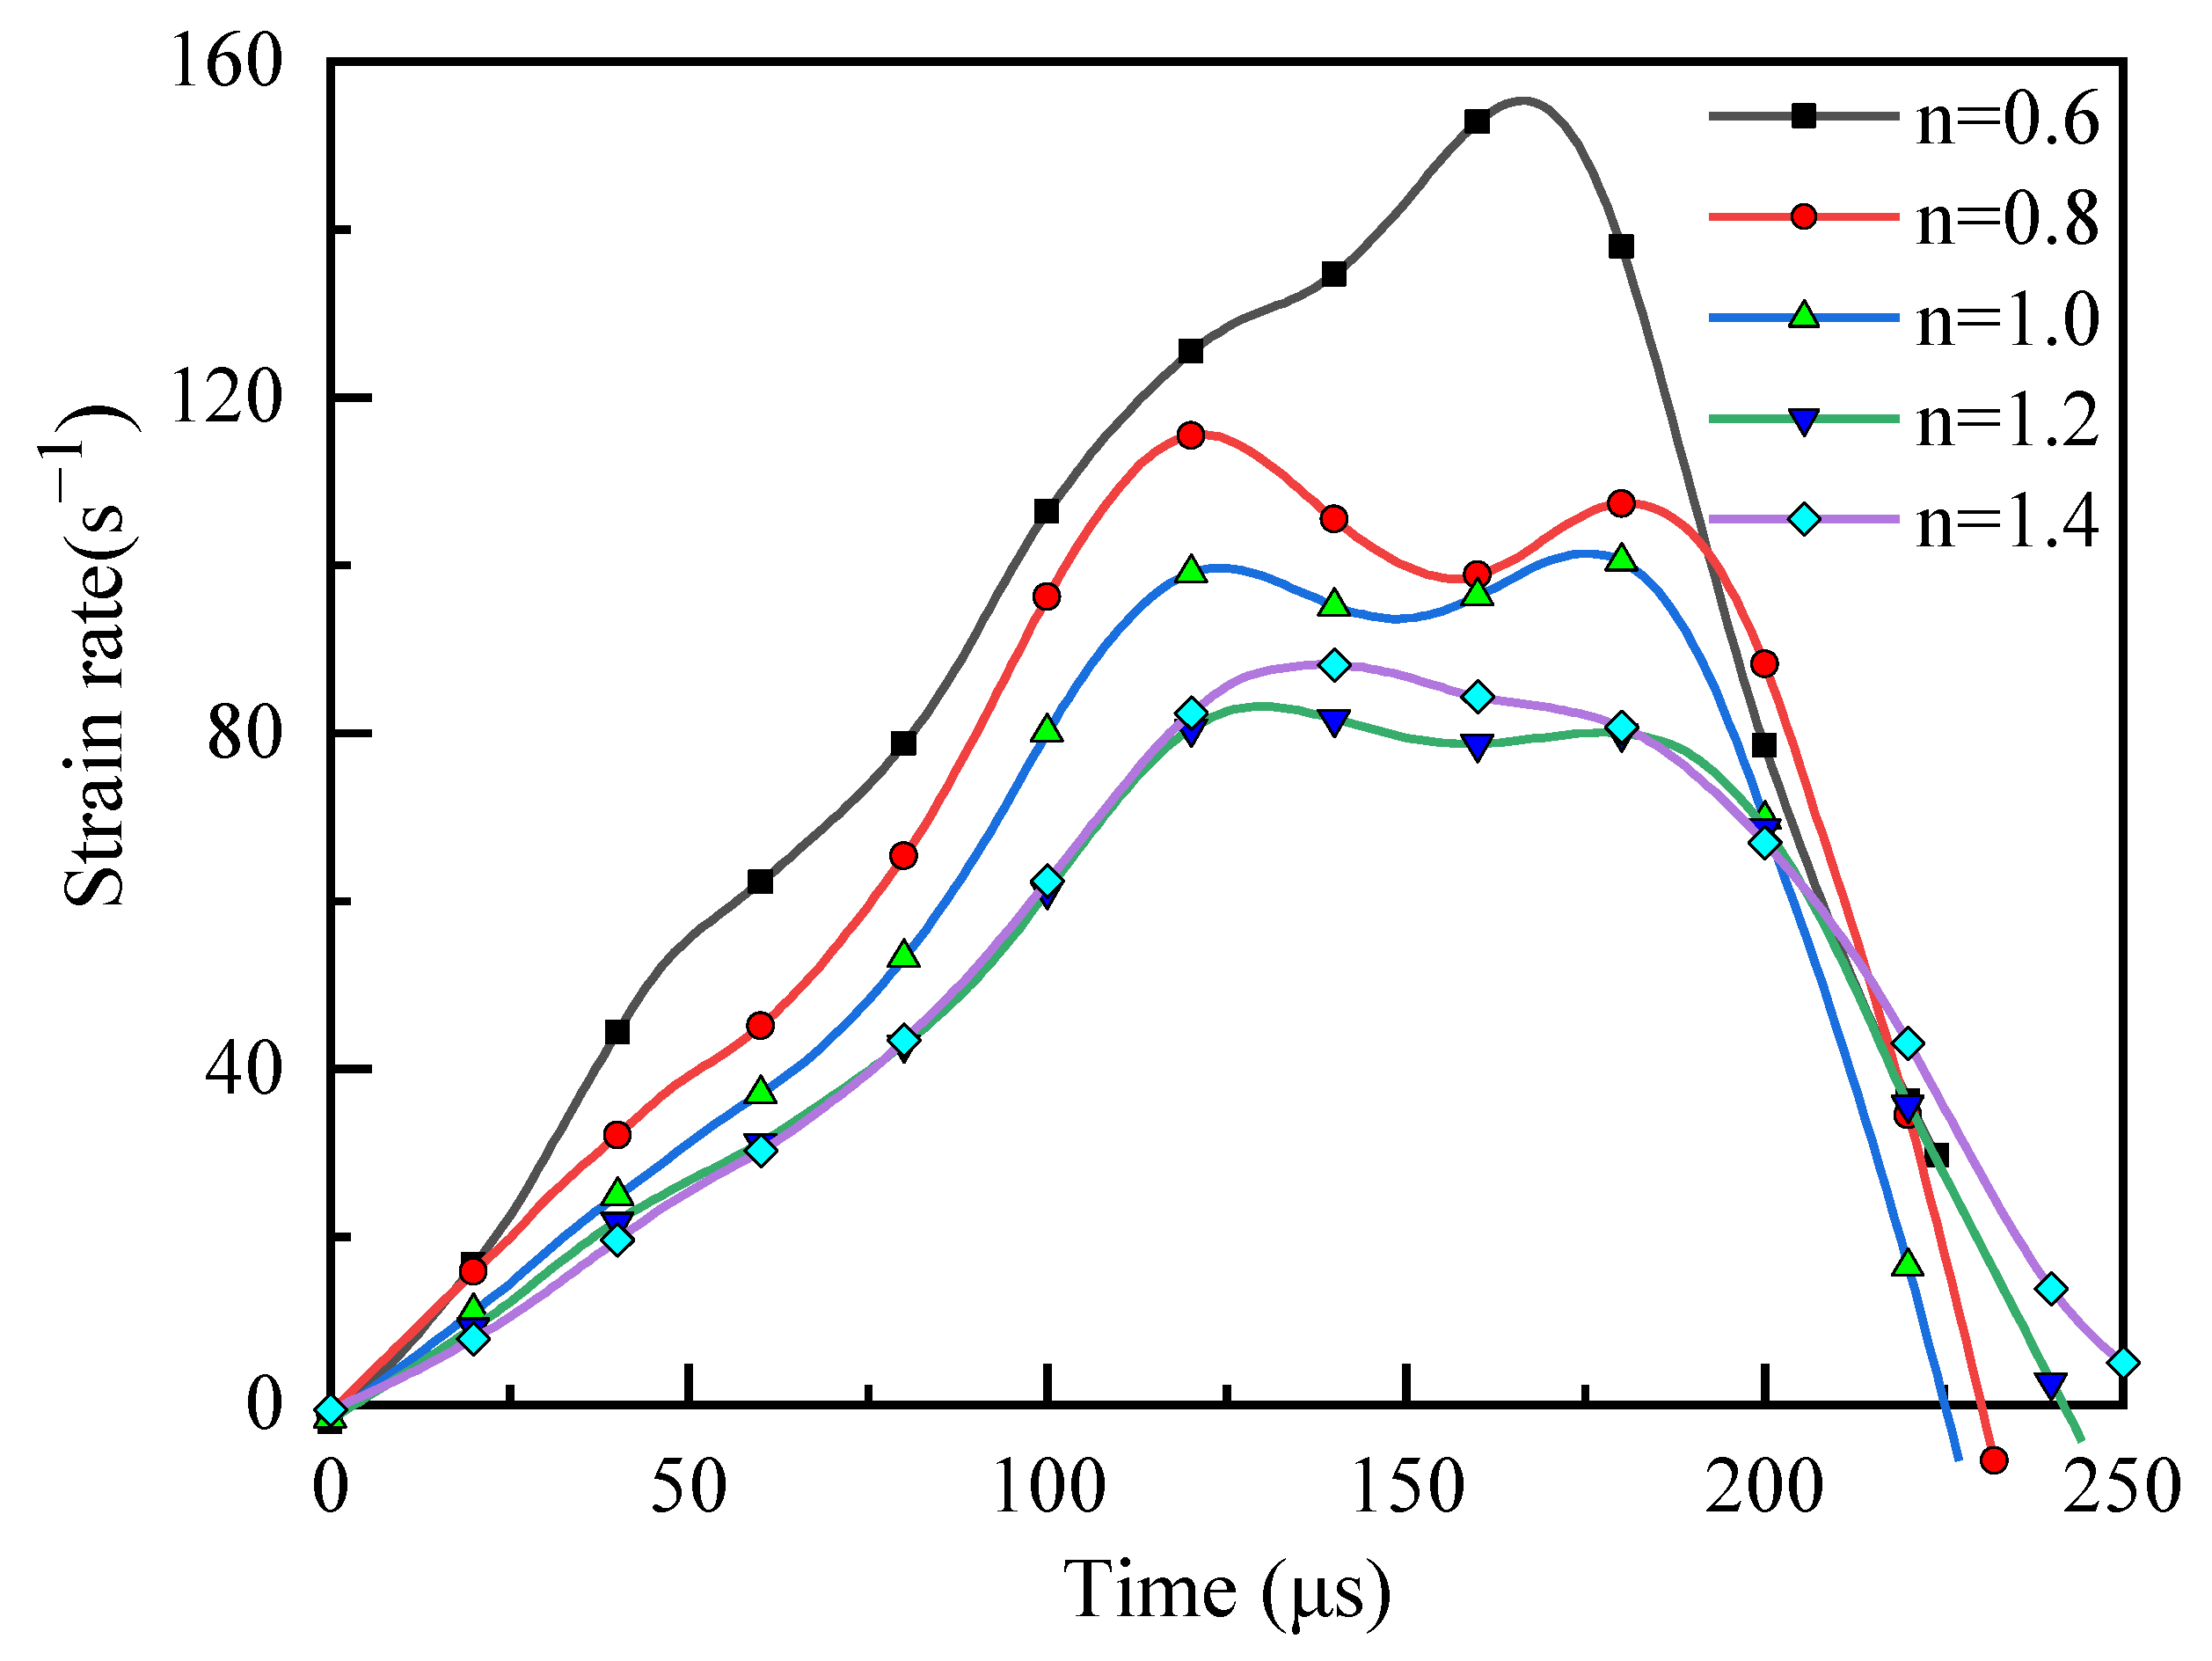
4.1. Strain Character

As shown in Figure 10, there are stress-strain curves with different length–diameter ratios of 0.6, 0.8, 1.0, 1.2, and 1.4 and stress history curves with different loading strain rates of 63.8 s−1, 109.8 s−1, 156.8 s−1, and 253.2 s−1. Under the dynamic load, the rock presents four stages of microcrack closure, elastic, plasticity, and failure, respectively. The stress-strain curves of specimens with length–diameter ratios of 0.6 and 0.8 are similar. First, the upper concave part of the early curve is the microcrack closure stage, and the curve rises slowly. Second, the curve appears in a linear growth phase and the rock undergoes elastic deformation. Then, the slope of curve decreases due to plastic deformation of rock. When the peak strength is reached, the slope of the curve negatively correlated with the rock damage [16]. After the peak strength, depending on the length of the specimen, faster curve falling and more brittleness can be pressent [17].
Under the same strain rate of 156.8 s−1, the block size characteristics of granite specimens are shown in Figure 11. It is clear from the figure that the fragmentation of granite specimens with length–diameter ratios of 1.2 and 1.4 is large, while the fragmentation of granite specimens with length–diameter ratios of 1.0 is very small. The fragmentation of the specimens with length–diameter ratios of 0.6 and 0.8 is relatively uniform and the fragmentation size is moderate.
According to the stress-strain curves of several groups of tests with different length–diameter ratios, the overall stress-strain variation law is basically the same and the stress increases approximately linearly before reaching the peak. With the decrease of the length–diameter ratio, the peak strength is reached more slowly. This means that a rock with a small length–diameter ratio can maintain a longer stress equilibrium state before failure under the impact test. Before the stress of the specimen reached the peak, the curve fluctuated under different degrees, which was caused by the different duration of uniform stress inside the rock and the uniform deterioration of stress after the microdeformation and failure of the rock mass.

4.2. Peak Strength

Under dynamic impact conditions, size effect and strain rate effect are coupled. In the SHPB text, the size effects of granite specimens were discussed in a similar strain rate range using a controlled loading rate method [13]. The prerequisite for using SHPB to obtain the intrinsic characteristics of rocks is to obtain measurements when the rock is in stress equilibrium, and to ensure that the stress equilibrium is maintained long enough to obtain valid data. Additionally, the change of the length–diameter ratio changes the rock stress wave single propagation time, which affects the stress equilibrium process. At the same time, rocks are internally anisotropic and the fracture damage strain of brittle materials such as rocks is generally only a few parts per thousand, as shown in Figure 12. This also leads to the existence of inhomogeneity in rock deformation under impact loading.
According to the stress history curve of granite specimens with different length–diameter ratios and loading strain rate (Figure 11), the time of the peak strength can be seen in Table 3. With the increasing load strain rate, the peak strength time is achieved earlier and peak strength id increased with loading strain rate. The granite with lower loading strain rate can maintain longer complete stage before the peak strength and can obtain a longer stress equilibrium time.
The incident energy is basically closed under the same impact load, but the change of the granite length–diameter ratio changes the strength of the rock. From Figure 13, the strain rate of the specimen increases with decreasing length–diameter ratio at the same strain rate. The previously mentioned 0.6 aspect ratio specimen provides more time to maintain the stress equilibrium period. However, specimens with a length–diameter ratio of 0.6 are only able to exhibit this property during the first period of stress equilibrium and are not able to sustain the stress equilibrium time. The strain rate of a length–diameter ratio of 0.6 granite was as high as 160.46 s−1, which is nearly 30% higher than the strain rate of 0.8 and 1.0 aspect ratio granite.
For the rock of same size, the strain rate curve of the specimen fluctuates sharply with increasing loading strain rate. According to the stress equilibrium time data, it can be seen that the time corresponding to the maximum value of the strain rate coincides with the equilibrium end time.
The strain rate waveform is stable within the period before the maximum strain rate, and the corresponding time is consistent with the stress equilibrium time of the granite specimen. The strain rate time curve can also basically reflect the duration of stress equilibrium. Additionally, after the maximum value of the strain rate, the rock is damaged internally by the uneven distribution of stress, resulting in a sudden drop in the strain rate, and the strain rate curve loses efficacy after the specimen is broken.

4.3. Elastic Modulus

The Young’s modulus or the elastic modulus reflects the strength and deformation characteristics of the rock. Under the dynamic impact, the pore or crack in the rock has been closed after the microcrack closure stage The elastic modulus is calculated from the slope of the elastic stage in the stress-strain curve, as shown in Equation (5) [11]:
E = σ ε
where E is the elastic modulus, Δσ is the axial stress difference, and Δε is the axial strain in the elastic stage.
The elastic modulus of the granite with different length and loading strain rate can be seen in Figure 14. With different loading strain rate, the trend of elastic modulus approximately consistent. With the granite length increases, the elastic modulus increases.

5. Discussion

In the study, we illustrated the incident energy, reflected energy, transmitted energy, and dissipated energy curves of granite specimens with different length–diameter ratios in the SHPB test. With the increase of time, four types of energy increased. During the stress equilibrium time, the increment of dissipated energy is faster than the transmitted energy. The slope of the dissipated energy and transmitted energy curves is larger than the reflected energy curve. Wang et al. [18] studied the energy dissipation test on the sandstone under the impact loading. They suggested that the incident stress is too high and the rock will be crushed excessively. However, the incident energy can only transfer energy to the transmission bar at the initial stress equilibrium state. When the rock is crushed, the transmitted energy transfer stops and tends to maintain a certain value. The same conclusion was reached by Li et al. [19] from the analysis of the energy transfer of magnetite.
The best crushing effect is the stress uniform achieved before damage to the granite specimen occurs and it can improve the accuracy of the impact of SHPB on test results [20]. The stress equilibrium time is measured by the stress equilibrium factor. Normally, the longer the stress equilibrium time, the better the stress uniform can be achieved before the damage of the specimen occurs. This can provide more energy for rock crushing, and a higher energy utilization for rock crushing.
Nevertheless, we found that the stress equilibrium time is not as long as possible. During a stress equilibrium time of 60–70 μs, the energy dissipation rate of granite specimen is lower than other durations. The stress equilibrium time in the granite specimens will be unstable with higher strain rate, caused by the martensitic transformation under higher strain rates [21]. To make it simple the energy used to crush the rock is minimal. According to the length–diameter ratio of the granite specimens and impact loading, our results suggest a possibility of matching relationship between the length–diameter ratio and the impact loading. A large aspect ratio with low impact loading and a small aspect ratio with high impact loading are not better options.
Before peak strength, the granite specimens with length–diameter ratios of 0.6, 1.0, 1.2, and 1.4 achieved stress equilibrium at impact velocity of 8 m/s and 10 m/s. The length–diameter ratio of 0.8 achieved a stress at impact velocity of 8, 10, 12, and 14 m/s. Compared with different length–diameter ratios and impact load, 0.6 and 0.8 length–diameter ratios can maintain stress equilibrium easily. Yuan et al. [8] drew a similar conclusion in their study about the stress uniform of coal samples. Moreover, the critical aspect ratio is related to the achievement of stress equilibrium. Further studies are needed on whether the stress equilibrium time after peak strength is effective. If the stress equilibrium time after peak is invalid, a future study can combine the stress equilibrium time judged by the equilibrium factor and the peak strength time in order to fit a new relationship between the energy dissipation rate and stress equilibrium time.
Overall, we have noticed that smaller length–diameter ratios with an impact velocity of over 12 m/s gives better results in the SHPB test. Compared with the five length–diameter ratios, the granite specimens with a length–diameter ratio of 0.8 can maintain the longest stress equilibrium and achieve the most stable energy dissipation rate. The optimal matching relationship between an impact velocity of 12 m/s and a length–diameter ratio of 0.8 is presented in this study.

6. Conclusions

In this paper, SHPB tests were conducted on five types of granite specimen with length–diameter ratios of 0.6, 0.8, 1.0, 1.2, and 1.4, respectively. In order to study the stress uniformity of granite under the different impact loading, the energy equilibrium factor has been quoted to define the stress equilibrium time. The next step is to analyze the stress equilibrium time with different length–diameter ratios, impact velocities, and dissipated energy, respectively. The main conclusions are as follows.
(1) The stress equilibrium time showed a trend of increasing and then decreasing with the increase of length–diameter ratio, and the granite with a length–diameter ratio of 0.8 was able to maintain a longer stress equilibrium time. The stress equilibrium time at the impact rate of 63.8 s−1 was 138 μs. With the increase of impact load, the stress equilibrium time showed a decreasing trend, and in the test, the stress equilibrium time at a loading strain rate of 63.8 s−1 was 253.2 s−1, which was 2~3 times higher.
(2) The relationship between the energy dissipation curve and the stress equilibrium time is established. The stress equilibrium time is consistent with the time corresponding to the phase with the largest slope of the energy dissipation curve, and the dissipation energy does not vary much with different length–diameter ratio times under the same loading strain rate condition, and the dissipation energy increases linearly with the loading strain rate for the same length–diameter ratio specimen. The dissipated energy decreases from the loading strain rate of 253.2 s−1 to 63.8 s−1, with a reduction of approximately 60–80 J.
(3) In the study, there exists a critical impact velocity of 12 m/s, which causes the energy dissipation rate of the rock to vary in two parts. In the first part, above an impact velocity of 12 m/s, the energy dissipation rate of granite specimens was not related to the different length–diameter ratios. The energy dissipation rate is stable in the range of 45% to 50%. In the second part, when the impact velocity is below 12 m/s, the energy dissipation rate varies widely and the stress equilibrium time is only for 60 μs~70 μs because the small aspect ratio and high velocity are not well matched with each other, and the large aspect ratio and low velocity are not well matched with each other.
(4) Due to the limitation of the experimental program, the selection of length–diameter ratios is not comprehensive enough. In the future, we will further compare the energy dissipation and stress equilibrium time relationship for different types of rocks and more length–diameter ratios and shapes, so as to provide theoretical basis and data support for the study of rock crushing characteristics.

Author Contributions

Conceptualization, Z.X.; data curation, Z.H.; funding acquisition, L.G.; visualization, X.L.; writing—original draft, Y.W.; writing—review & editing, Y.W. All authors have read and agreed to the published version of the manuscript.

Funding

This research was funded by [National Natural Science Foundation of China (NSFC)—Study on the energy dissipation mechanism of rock impact crushing based on fine features] grant number [51974187].

Institutional Review Board Statement

Not applicable.

Informed Consent Statement

Not applicable.

Data Availability Statement

Not applicable.

Conflicts of Interest

The authors declare no conflict of interest.

References

  1. Zhang, Q.B.; Zhao, J. A Review of Dynamic Experimental Techniques and Mechanical Behaviour of Rock Materials. Rock Mech. Rock Eng. 2014, 47, 1411–1478. [Google Scholar] [CrossRef] [Green Version]
  2. Dai, F.; Huang, S.; Xia, K.; Tan, Z. Some Fundamental Issues in Dynamic Compression and Tension Tests of Rocks Using Split Hopkinson Pressure Bar. Rock Mech. Rock Eng. 2010, 43, 657–666. [Google Scholar] [CrossRef]
  3. Daryadel, S.S.; Mantena, P.R.; Kim, K.; Stoddard, D.; Rajendran, A.M. Dynamic response of glass under low-velocity impact and high strain-rate SHPB compression loading. J. Non Cryst. Solids 2016, 432, 432–439. [Google Scholar] [CrossRef]
  4. Hassan, M.; Wille, K. Experimental impact analysis on ultra-high performance concrete (UHPC) for achieving stress equilibrium (SE) and constant strain rate (CSR) in Split Hopkinson pressure bar (SHPB) using pulse shaping technique. Constr. Build. Mater. 2017, 144, 747–757. [Google Scholar] [CrossRef]
  5. Fu, Q.; Xie, Y.; Long, G.; Niu, D.; Song, H.; Liu, X. Impact characterization and modelling of cement and asphalt mortar based on SHPB experiments. Int. J. Impact Eng. 2017, 106, 44–52. [Google Scholar] [CrossRef]
  6. Gong, F.Q.; Si, X.F.; Li, X.B.; Wang, S.Y. Dynamic triaxial compression tests on sandstone at high strain rates and low confining pressures with split Hopkinson pressure bar. Int. J. Rock Mech. Min. Sci. 2019, 113, 211–219. [Google Scholar] [CrossRef]
  7. Xiong, B.; Demartino, C.; Xiao, Y. High-strain rate compressive behavior of CFRP confined concrete: Large diameter SHPB tests. Constr. Build. Mater. 2019, 201, 484–501. [Google Scholar] [CrossRef]
  8. Yuan, Q.; Xie, G.; Wang, L.; Jiao, Z.; Zou, P.; Liu, H.; Khan, N.M. Experimental Study on Stress Uniformity and Deformation Behavior of Coals with Different Length-to-Diameter Ratios under Dynamic Compression. Shock Vib. 2021, 2021, 6675200. [Google Scholar] [CrossRef]
  9. Li, M.; Hao, H.; Cui, J.; Hao, Y.F. Numerical investigation of the failure mechanism of cubic concrete specimens in SHPB tests. Def. Technol. 2022, 18, 1–11. [Google Scholar] [CrossRef]
  10. Deng, Y.; Chen, M.; Jin, Y.; Zou, D. Theoretical analysis and experimental research on the energy dissipation of rock crushing based on fractal theory. J. Nat. Gas Sci. Eng. 2016, 33, 231–239. [Google Scholar] [CrossRef] [Green Version]
  11. Li, X.; Zou, Y.; Zhou, Z. Numerical Simulation of the Rock SHPB Test with a Special Shape Striker Based on the Discrete Element Method. Rock Mech. Rock Eng. 2014, 47, 1693–1709. [Google Scholar] [CrossRef]
  12. Wang, J.; Ma, L.; Zhao, F.; Lv, B.; Gong, W.; He, M.; Liu, P. Dynamic Strain Field for Granite Specimen under SHPB Impact Tests Based on Stress Wave Propagation. Undergr. Space 2022, 2467–9674. [Google Scholar] [CrossRef]
  13. Xia, K.; Wang, S.; Xu, Y.; Chen, R.; Wu, B. Advances in experimental studies for deep rock dynamics. Chin. J. Rock Mech. Eng. 2021, 40, 448–474. [Google Scholar]
  14. Song, L.; Hu, S.S. Two-Wave and Three-Wave Method in SHPB Data Processing; Explosion & Shock Waves: Beijing, China, 2005. [Google Scholar]
  15. Zhou, Y.X.; Xia, K.W.; Li, X.B.; Li, H.B.; Ma, G.W.; Zhao, J.; Zhou, Z.L.; Dai, F. Suggested methods for determining the dynamic strength parameters and mode-I fracture toughness of rock materials. Int. J. Rock Mech. Min. Sci. 2011, 49, 35–44. [Google Scholar]
  16. Yu, Y.; Zhang, W.; Fan, L.; Gong, J.; Yang, M.; Sun, L. Strain rate effect and energy dissipation characteristics of sandstone in coal measures under impact loading. J. China Coal Soc. 2021, 46, 2281–2293. [Google Scholar]
  17. Zhou, J.; Meng, X.; Liu, C.; Liu, Z.; Xu, W.; Cheng, X. Study on the Rock Size Effect of Quasistatic and Dynamic Compression Characteristics. Adv. Mater. Sci. Eng. 2021, 2021, 9974606. [Google Scholar] [CrossRef]
  18. Wang, M.; Wang, H.; Zong, Q. Experimental study on energy dissipation of mudstone in coal mine under im-pact loading. J. China Coal Soc. 2019, 6, 1716–1725. [Google Scholar]
  19. Li, Z.; Hao, J.; Gan, D.; Liu, Z. Energy dissipation characteristic of magnetite ore crushing under impact load. Harbin Inst. Technol. 2020, 52, 150–159. [Google Scholar]
  20. Liu, X.; Guo, L.J.; Zhang, D.N. Experimental study for stress uniformity of rock specimen in SHPB test. Eng. Blasting 2016, 22, 24–27. [Google Scholar]
  21. Wu, X.; Jiang, F.; Wang, Z.; Yuan, D.; Gao, G.; Guo, C. Mechanical behavior and microstructural evolution of a bainite-based quenching-partitioning (BQ&P) steel under high strain rates. Mater. Sci. Eng. A 2021, 818, 141414. [Google Scholar]
Figure 1. Granite specimens with five length–diameter ratios.
Applsci 12 06107 g001
Figure 2. Schematic diagram of the SHPB experimental device.
Applsci 12 06107 g002
Figure 3. Stress equilibrium factor curve with different strain rates includes length–diameter ratio of 0.6 (a), 0.8 (b), 1.0 (c), 1.2 (d), and 1.4 (e).
Applsci 12 06107 g003
Figure 4. Initial time of stress equilibrium.
Applsci 12 06107 g004
Figure 5. Duration of stress equilibrium.
Applsci 12 06107 g005
Figure 6. Energy time history curves of the specimen with different length–diameter ratios (a) n = 0.6 (b) n = 0.8 (c) n = 1.0 (d) n = 1.2 (e) n = 1.4.
Applsci 12 06107 g006
Figure 7. Dissipated energy with different impact velocities (a) n = 0.6 (b) n = 0.8 (c) n = 1.0 (d) n = 1.2 (e) n = 1.4.
Applsci 12 06107 g007
Figure 8. Energy dissipation rate with different impact loading.
Applsci 12 06107 g008
Figure 9. Energy dissipation rate–stress equilibrium time curve (a) v = 8 m/s (b) v = 10 m/s (c) v = 12 m/s (d) v = 14 m/s.
Applsci 12 06107 g009
Figure 10. Stress-strain curve and stress history curve with different length–diameter ratios ((ae) for 0.6~1.4).
Applsci 12 06107 g010aApplsci 12 06107 g010b
Figure 11. Impact fracture morphology of granite samples under 156.8 s−1 stain rate ((ae) for different length–diameter ratios, 0.6 to 1.4).
Applsci 12 06107 g011
Figure 12. Stress (a) and strain (b) time history curve.
Applsci 12 06107 g012
Figure 13. Strain rate curves of different length–diameter ratios with strain rate of 156.8 s−1.
Applsci 12 06107 g013
Figure 14. Young’s modulus curve.
Applsci 12 06107 g014
Table 1. Loading range.
Loading ConditionRange
Loading strain rate50 s−1~300 s−1
Impact strength0.12 MPa~0.25 MPa
Impact velocity8 m/s~14 m/s
Table 2. Stress equilibrium time.
Length–Diameter RatioStrain Rate (s−1)Initial Time (μs)End Time (μs)Duration (μs)
0.663.846151105
109.85513984
156.88615670
253.29613337
0.863.836174138
109.850175125
156.869170101
253.27313461
1.063.810818577
109.86613367
156.812217553
253.213617337
1.263.88214866
109.87913657
156.88513146
253.213616226
1.463.87513863
109.810614034
156.814117231
253.215017424
Table 3. Peak strength data.
Length–Diameter Ratioσmax-timeσmax (MPa)Length–Diameter Ratioσmax-timeσmax (MPa)
0.616076.331.217576.17
13996.0515679.42
13695.9913577.56
10688.33125128.08
0.814660.211.416378.95
13083.6414397.88
13991.0913970.23
114113.82121114.6
1.017971.15
145101.13
136102.18
129121.56
Publisher’s Note: MDPI stays neutral with regard to jurisdictional claims in published maps and institutional affiliations.

