
Eocene Sedimentary–Diagenetic Environment Analysis of the Pingtai Area of the Qaidam Basin

 , ,
, ,
Abstract
:1. Introduction
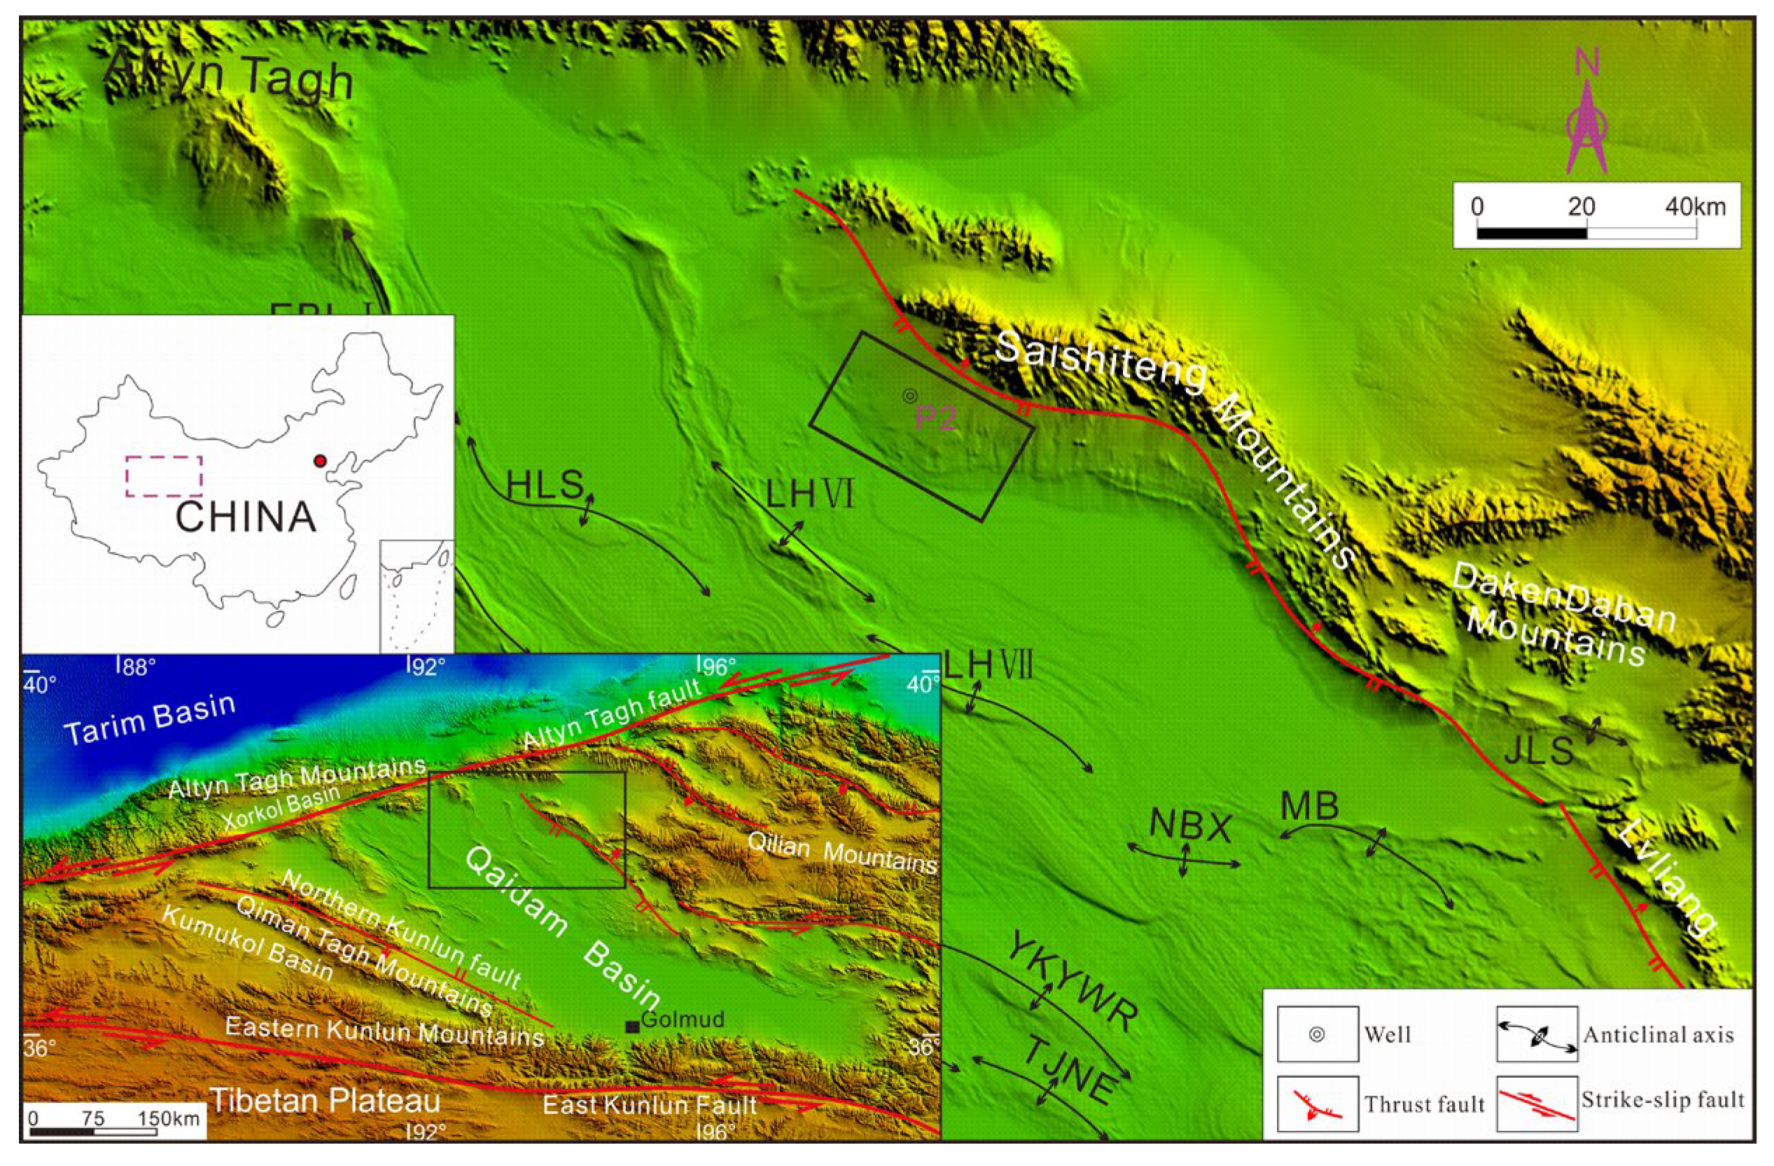
2. Geologic Setting
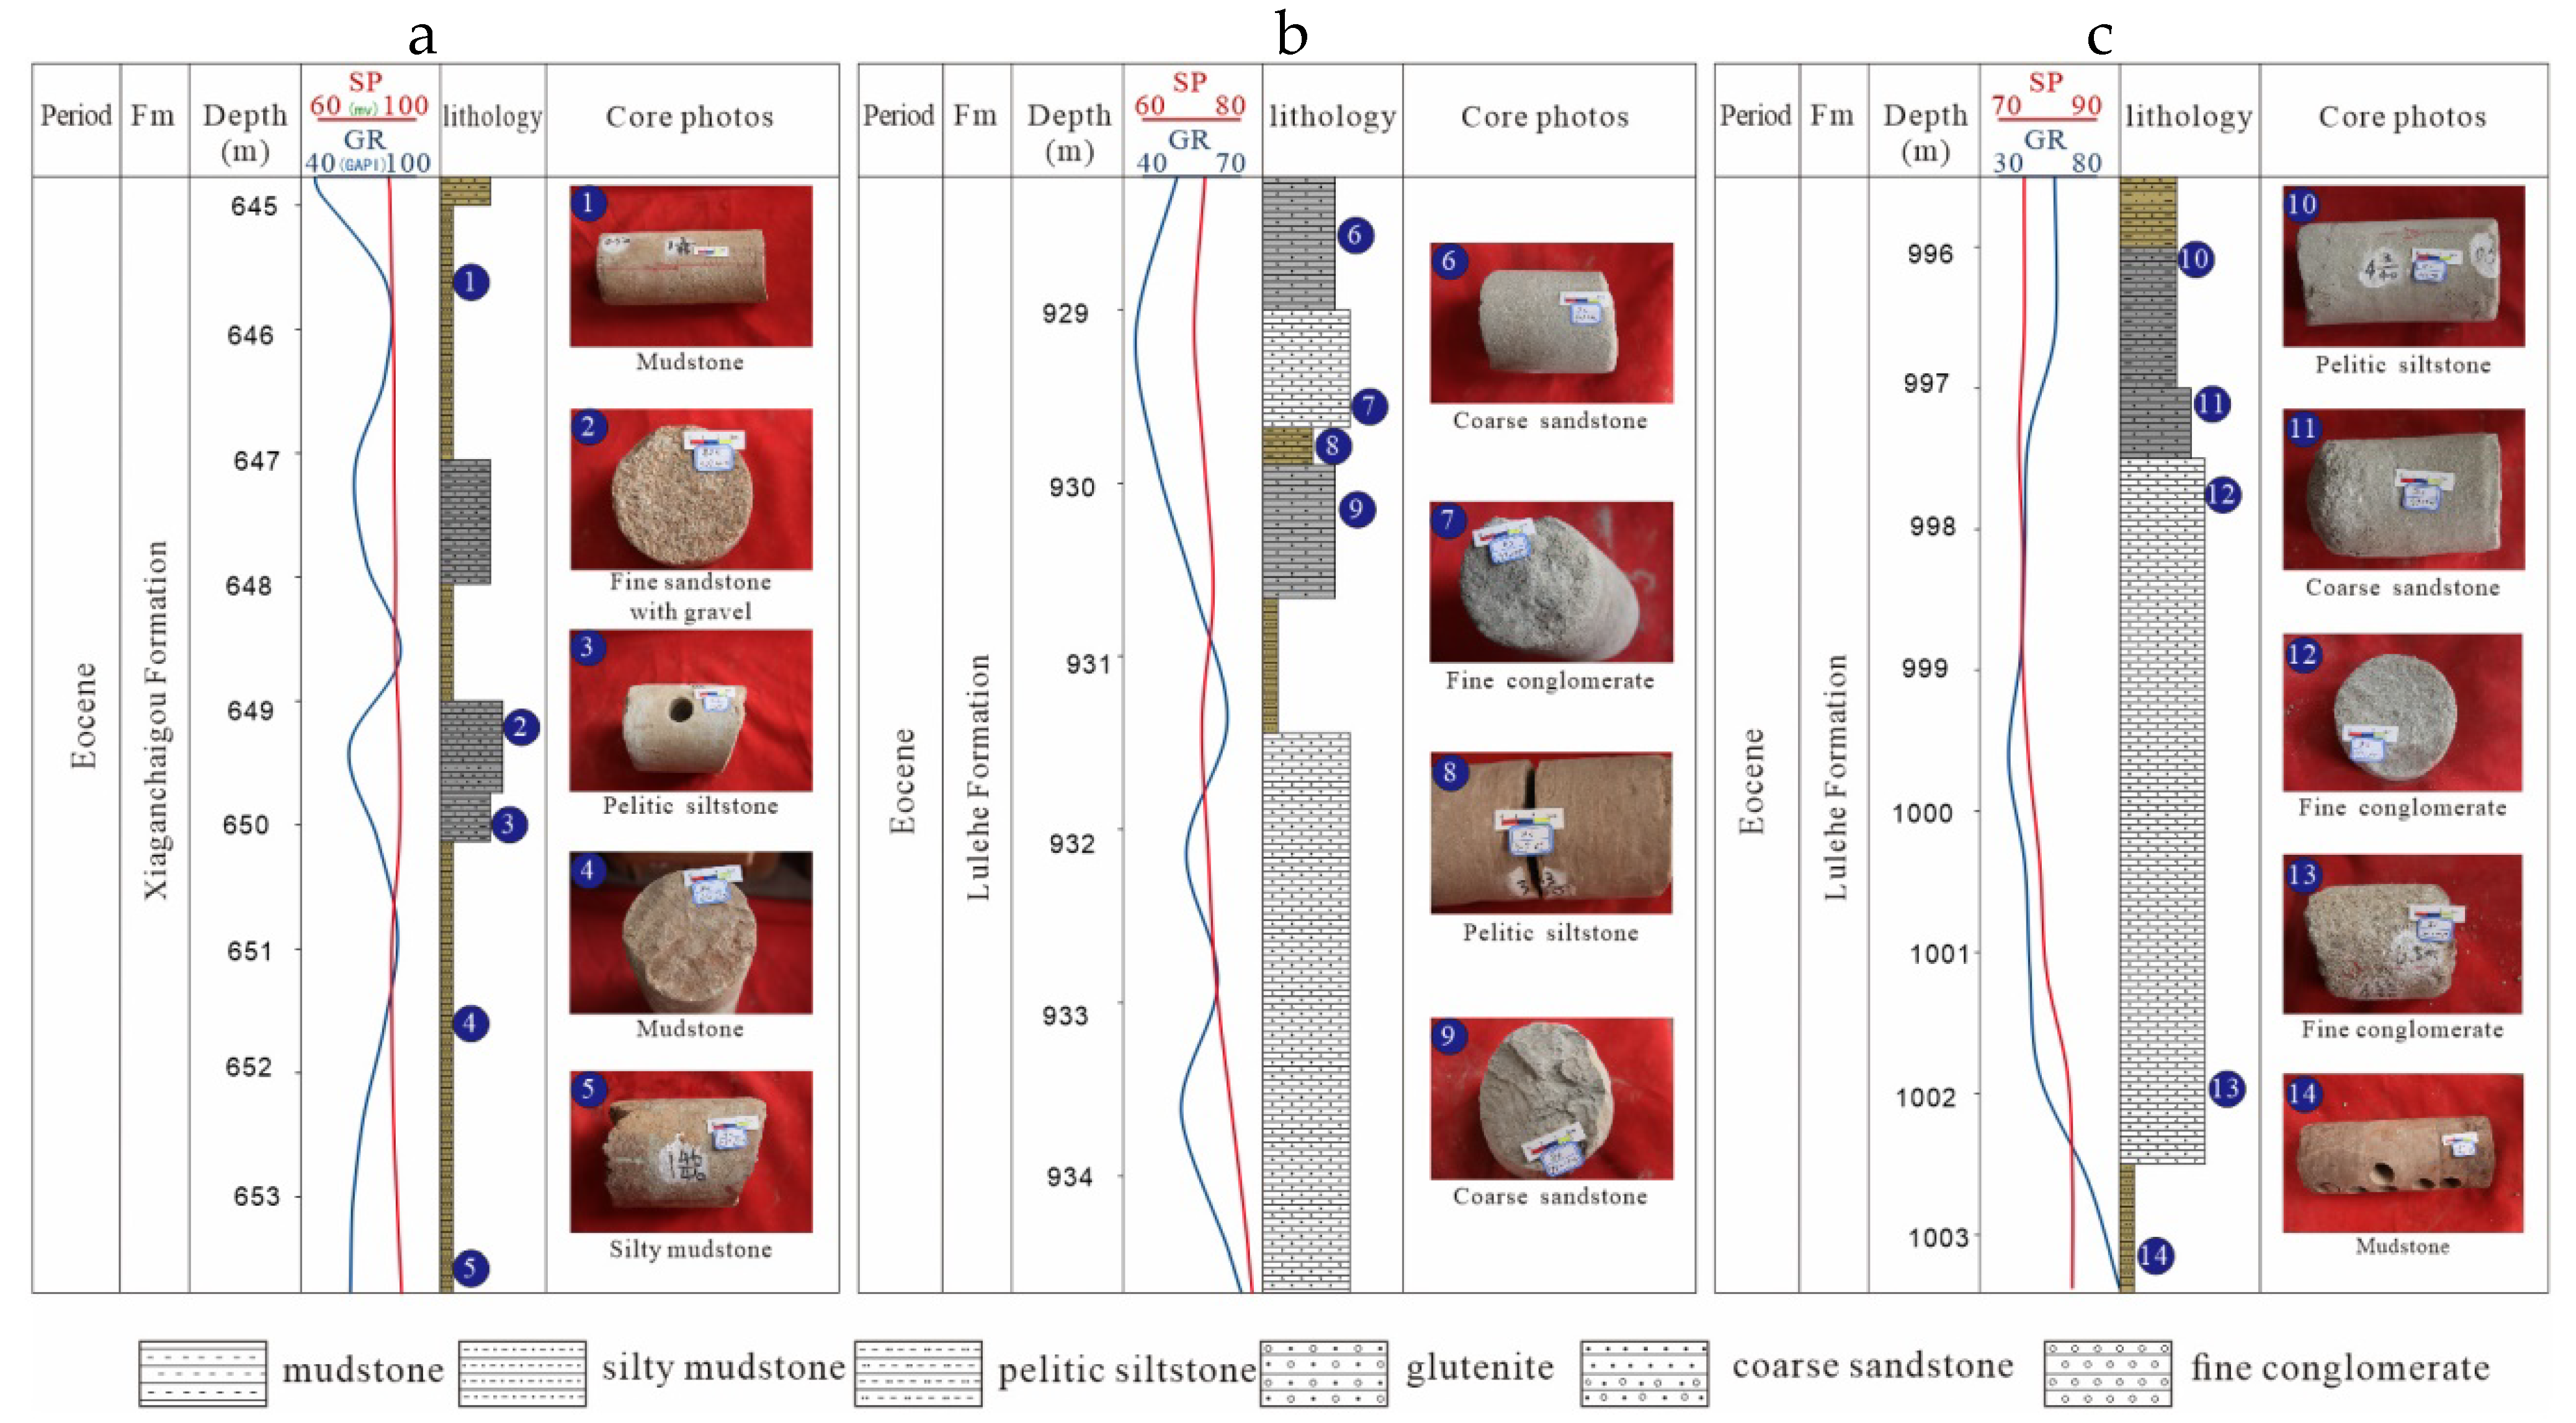
3. Materials and Methods
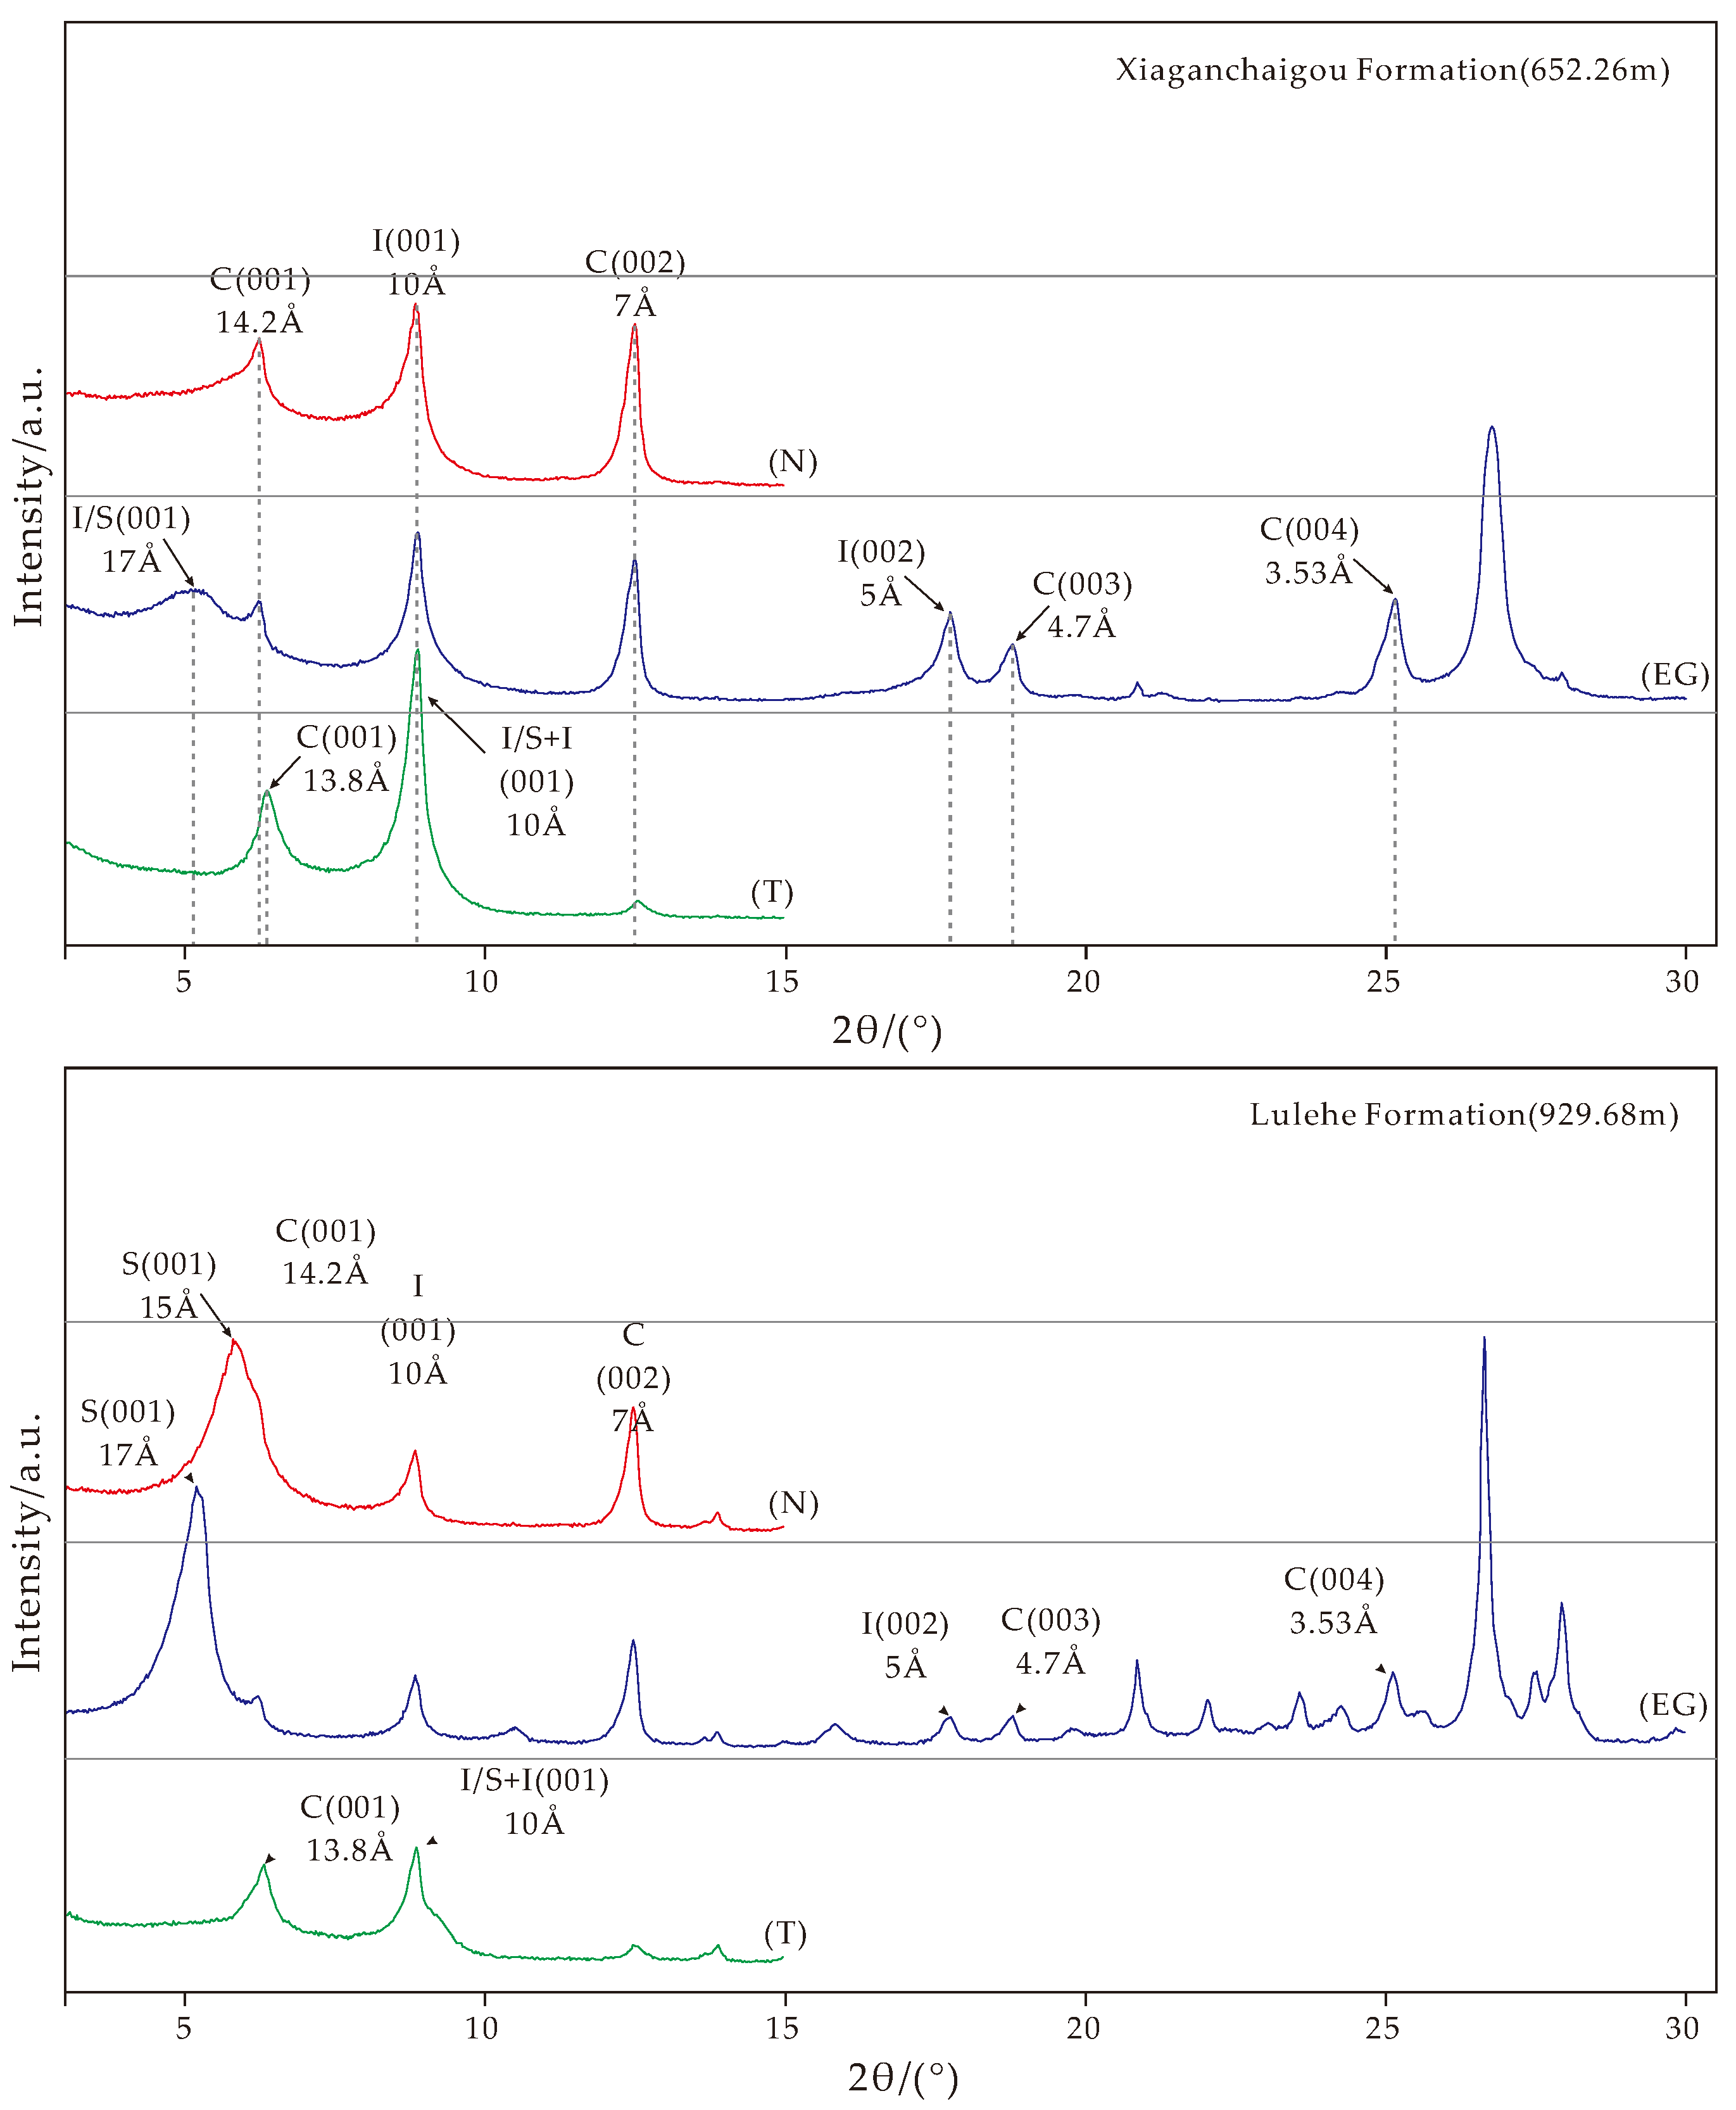
4. Clay Minerals
5. Elemental Geochemistry
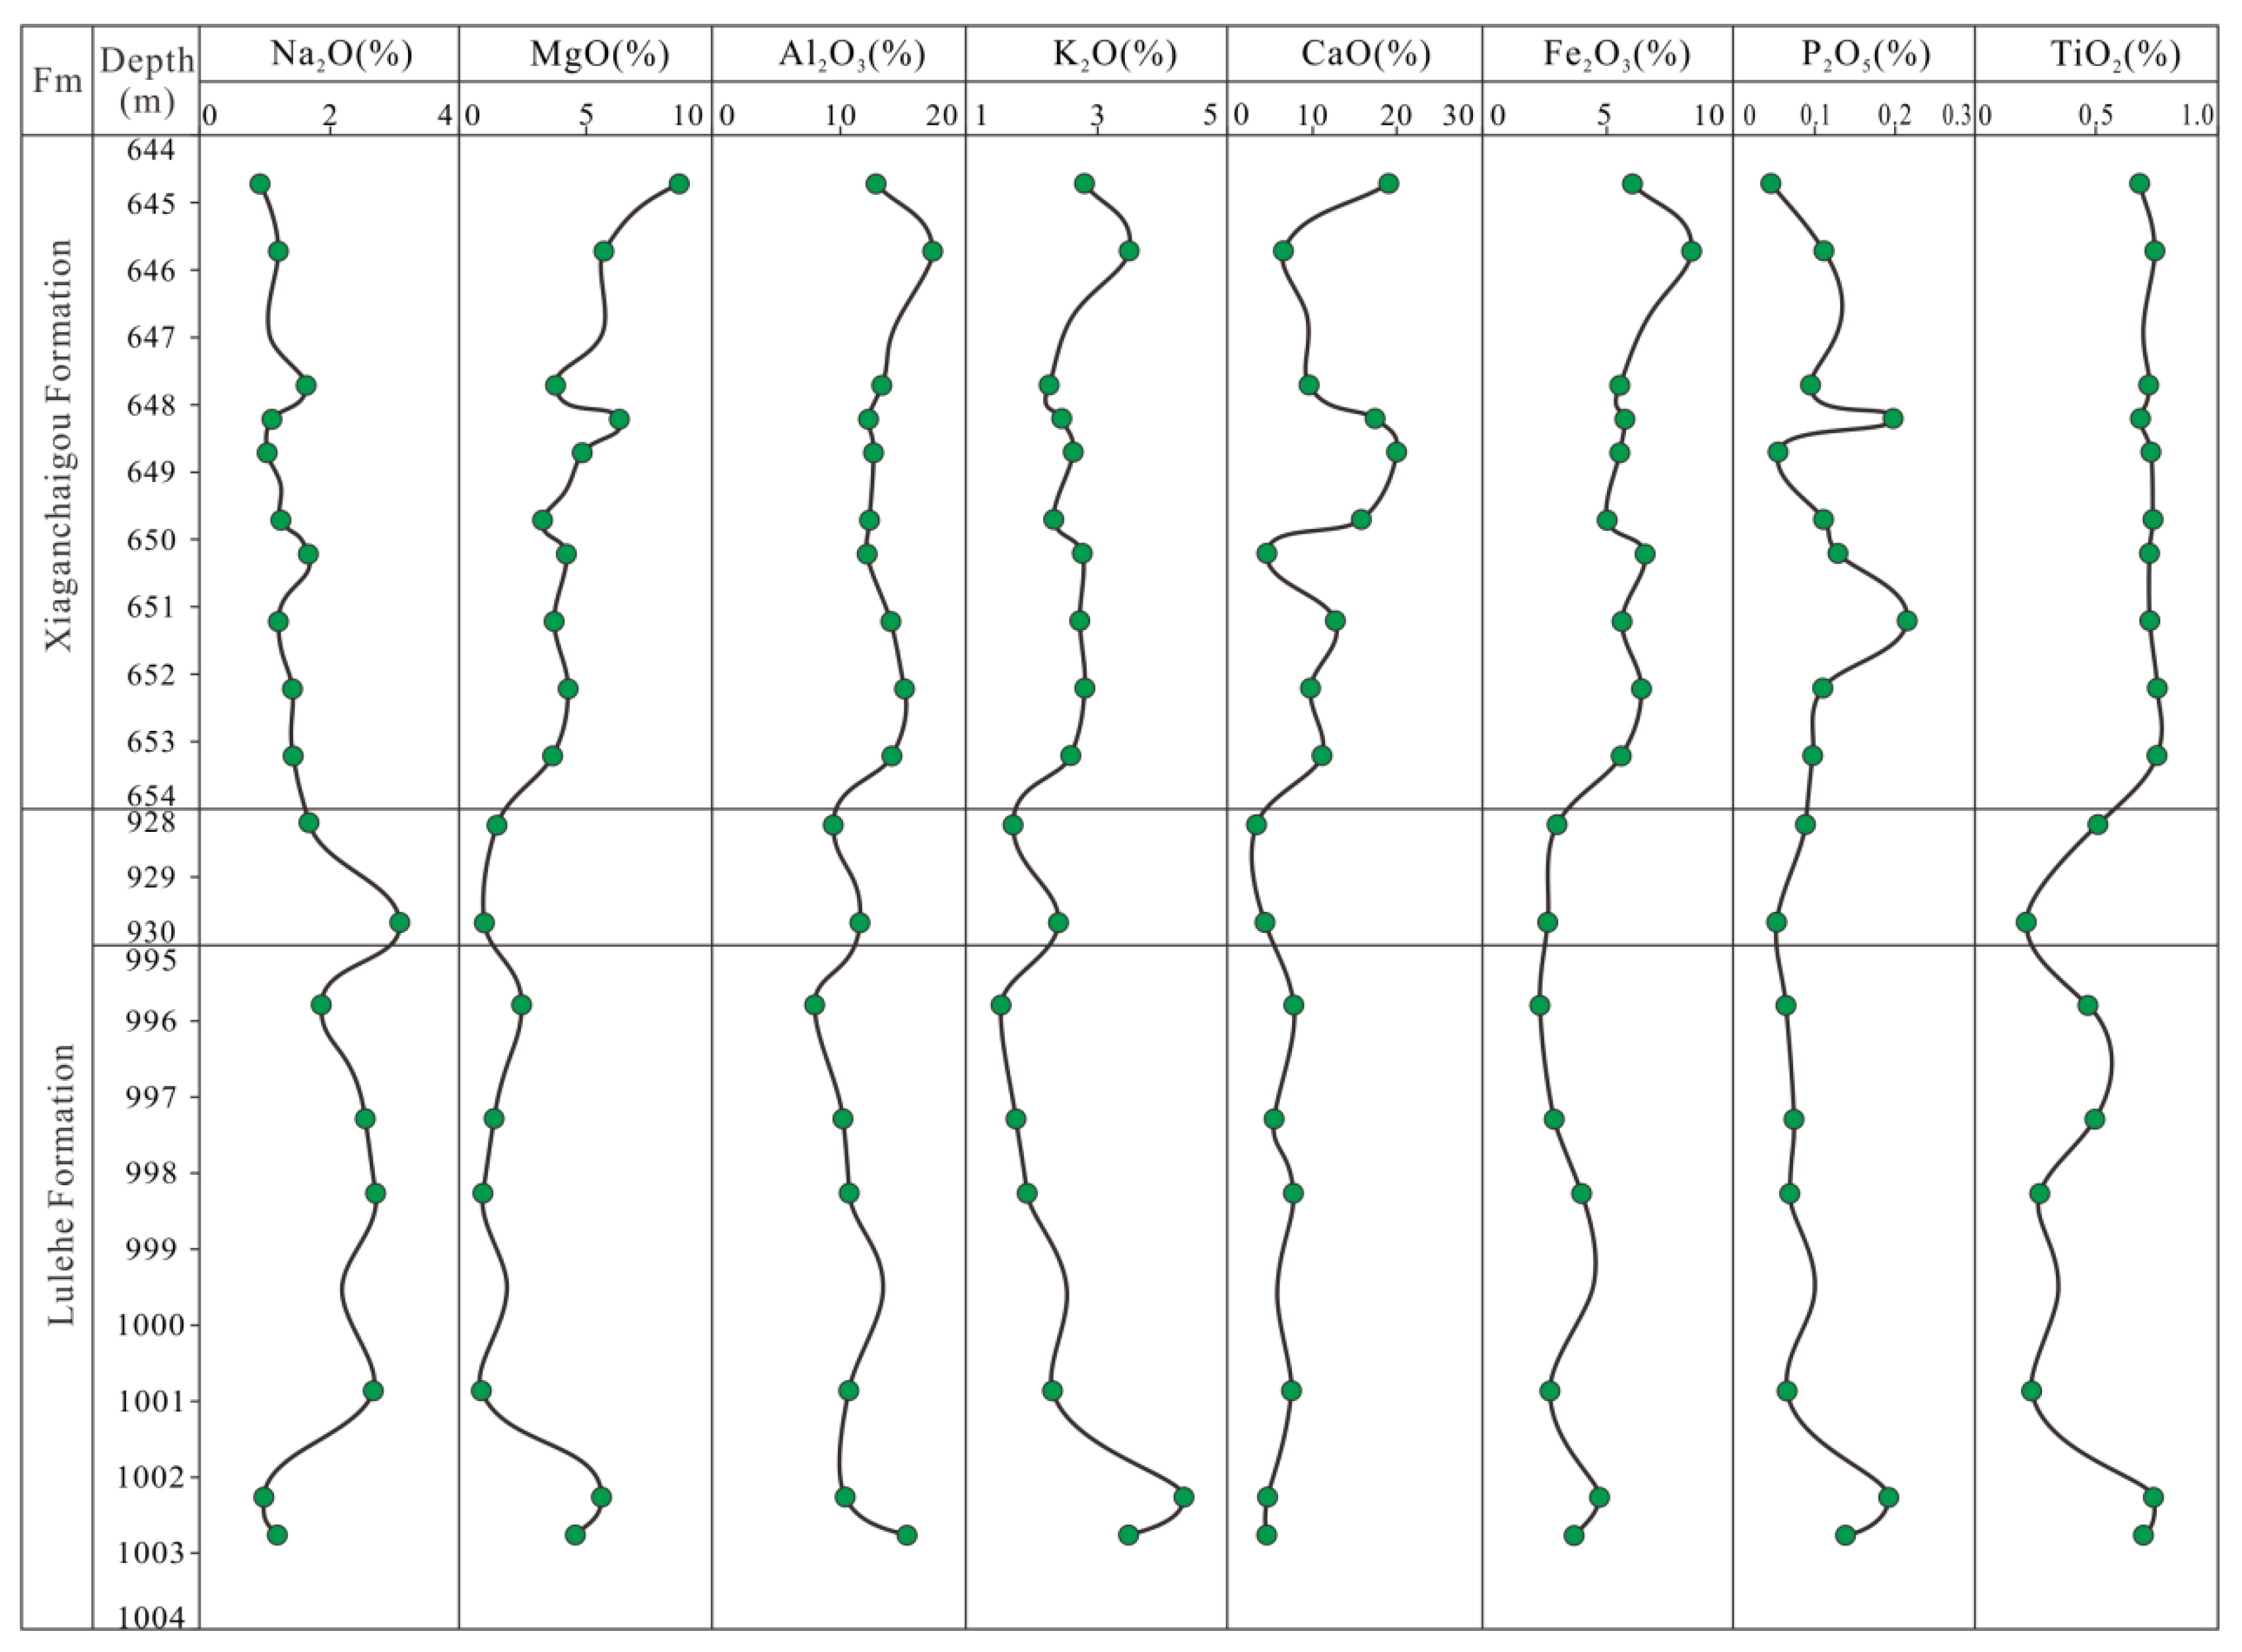
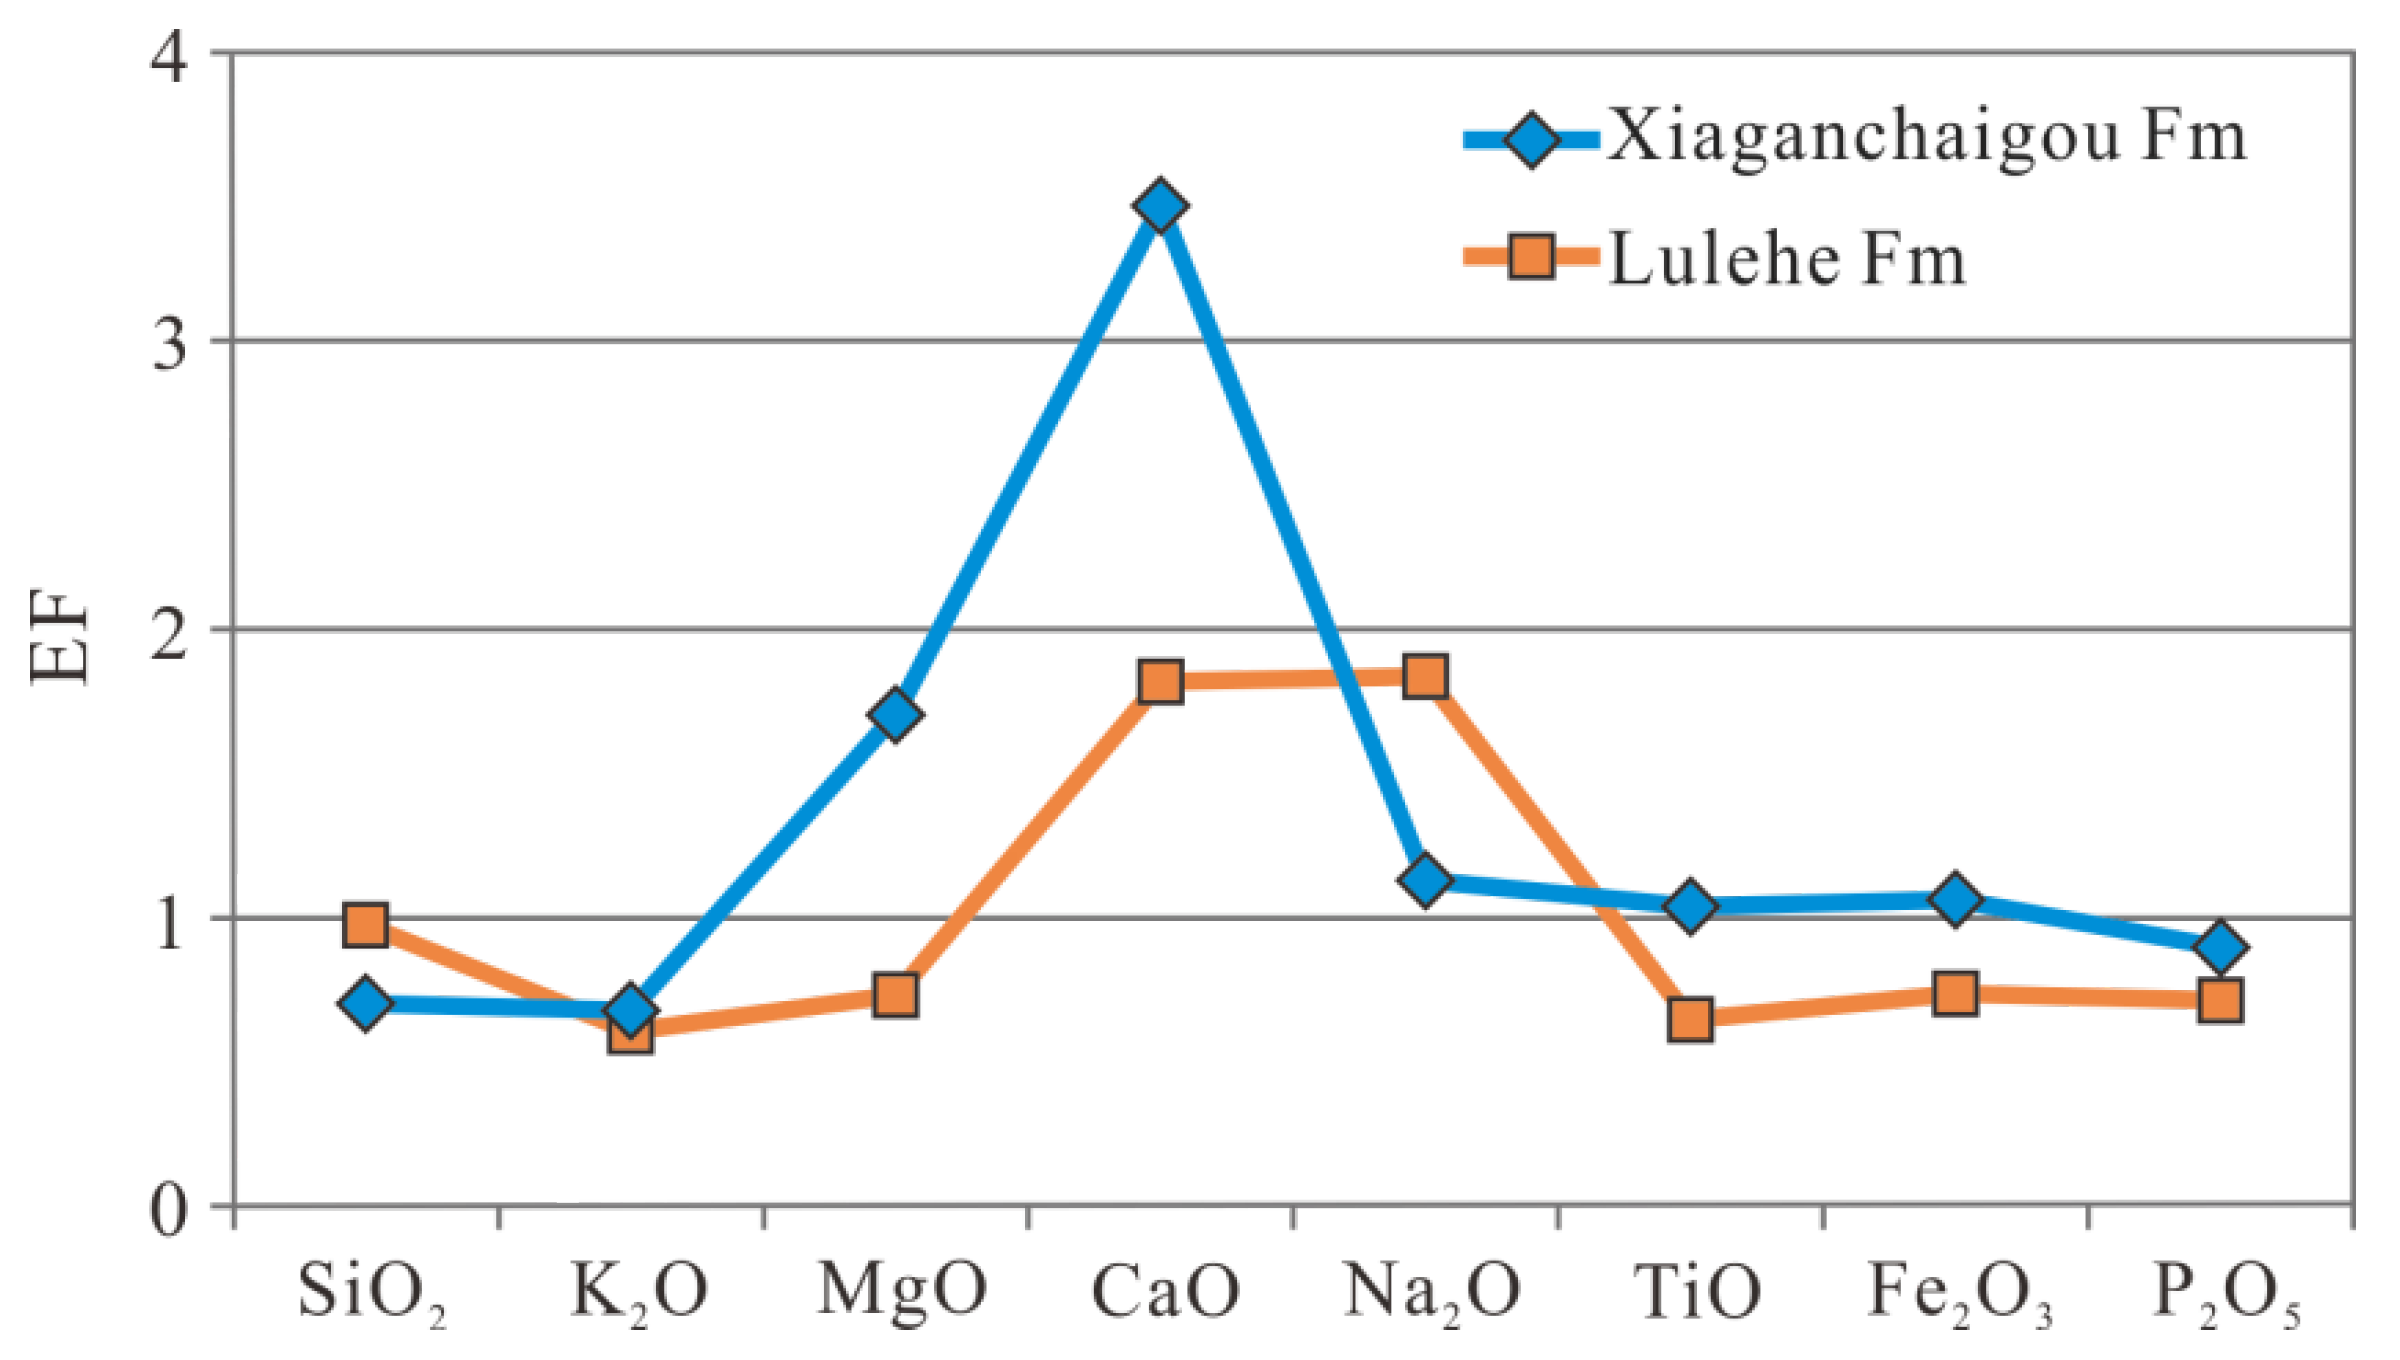
5.1. Major Element Analysis
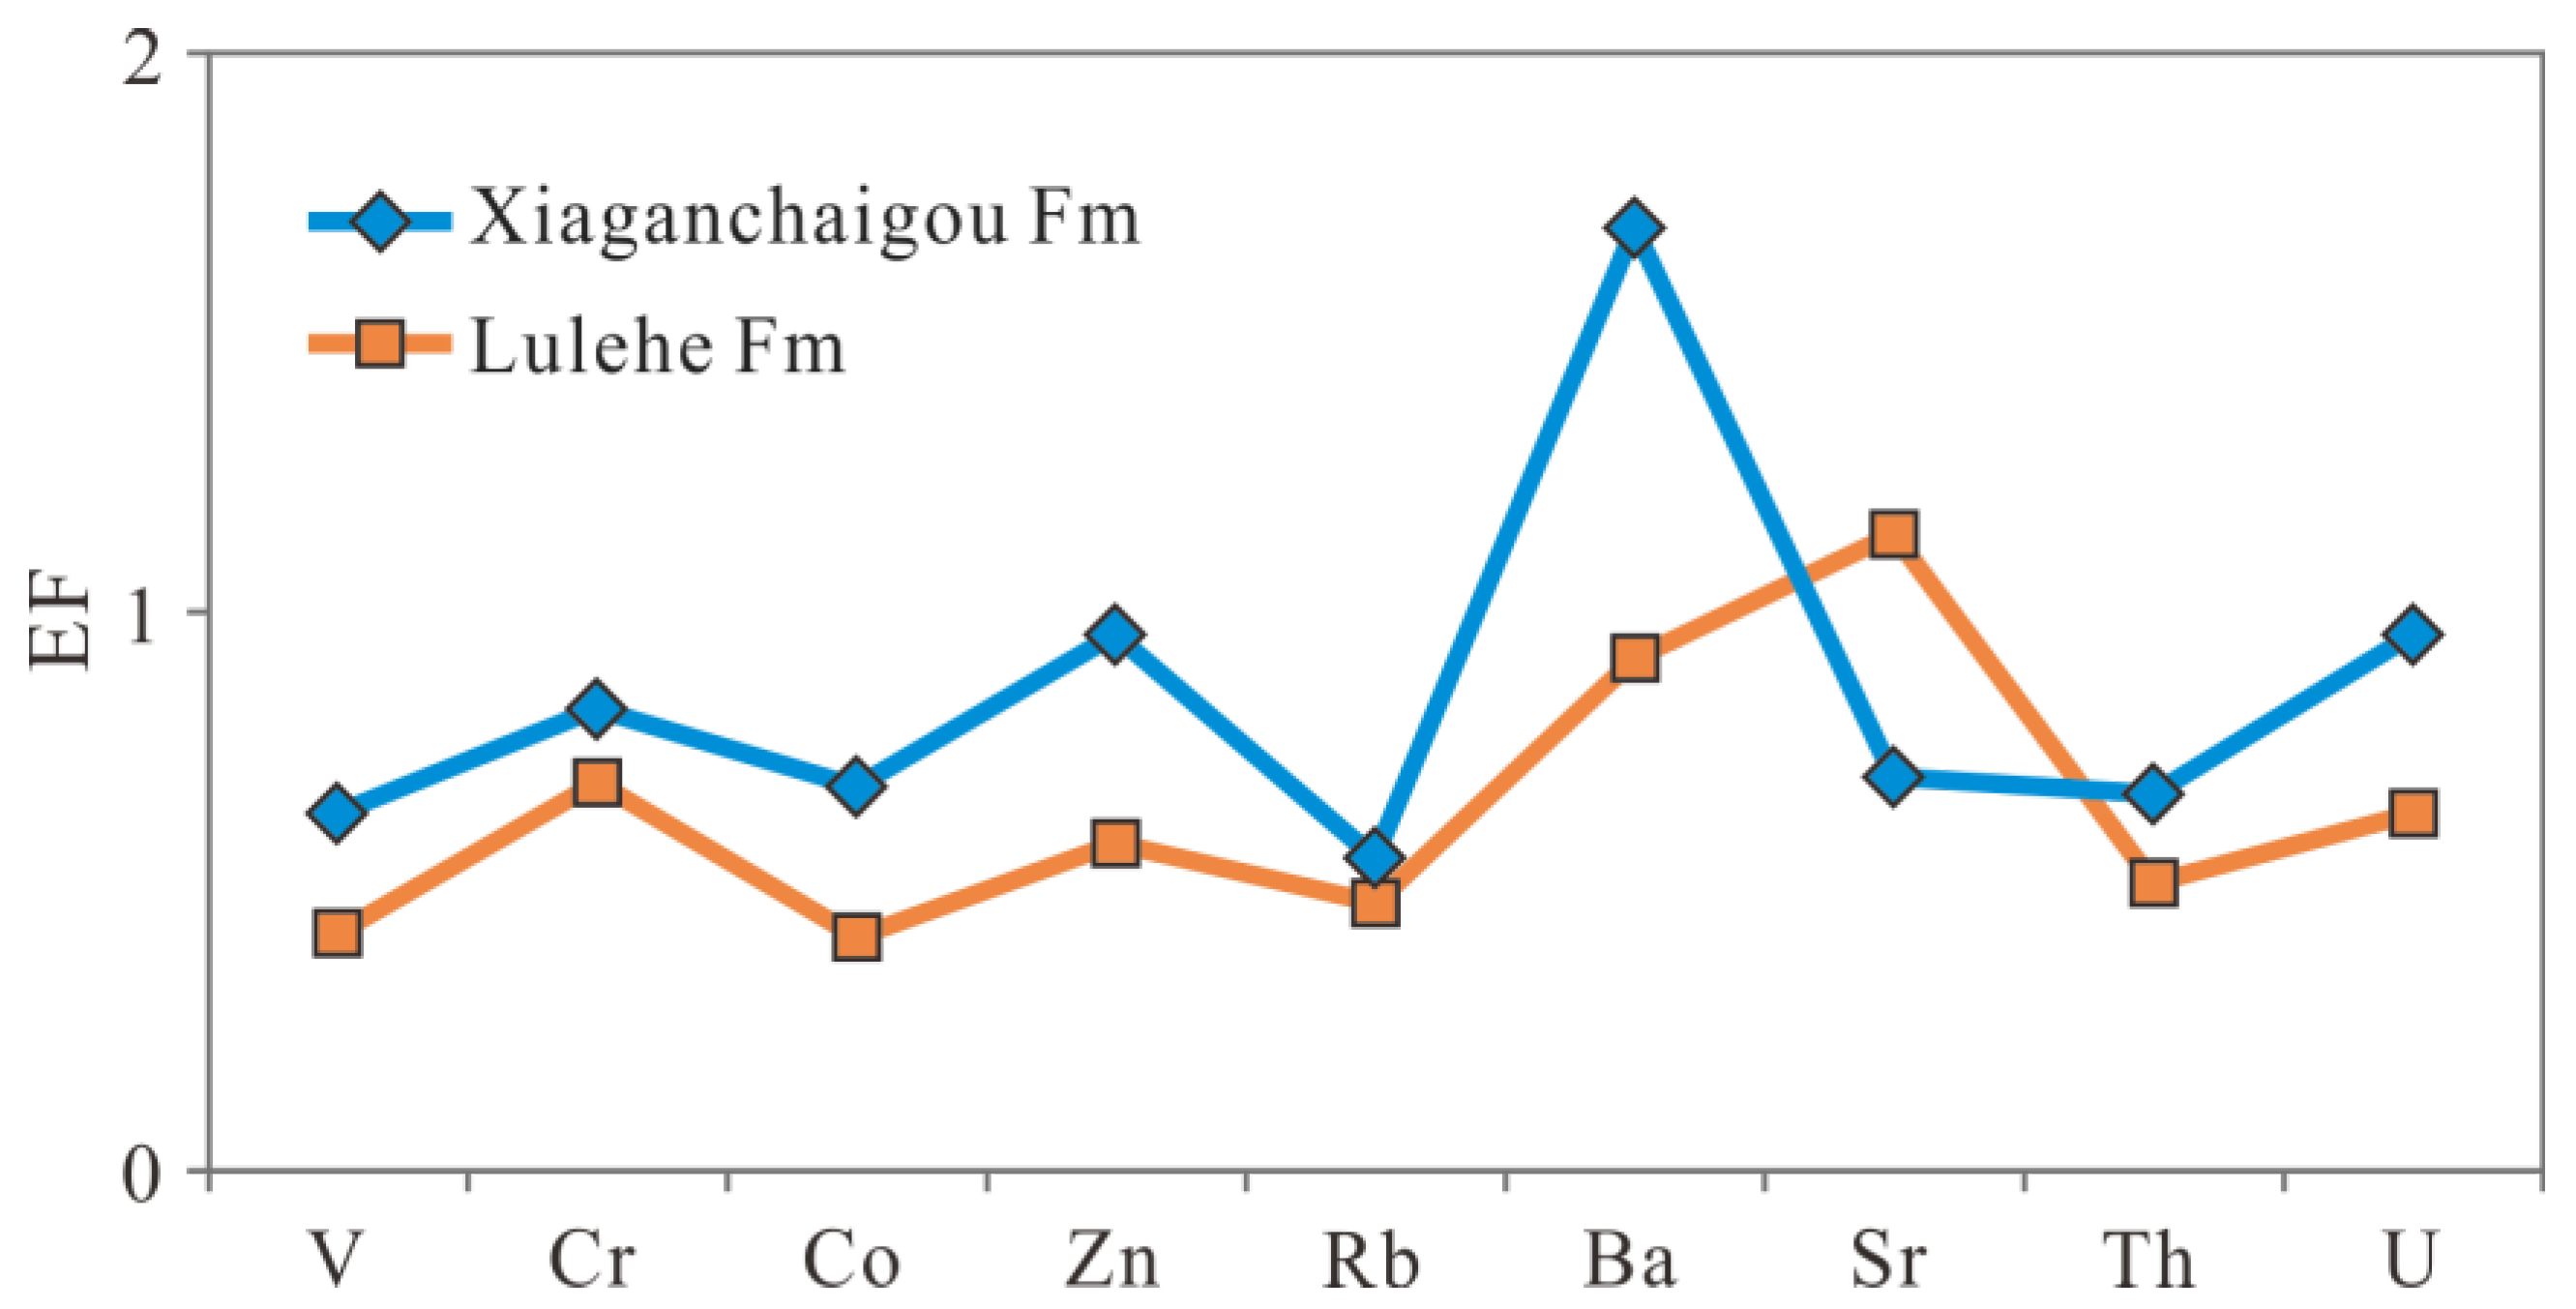
5.2. Trace Element Analysis
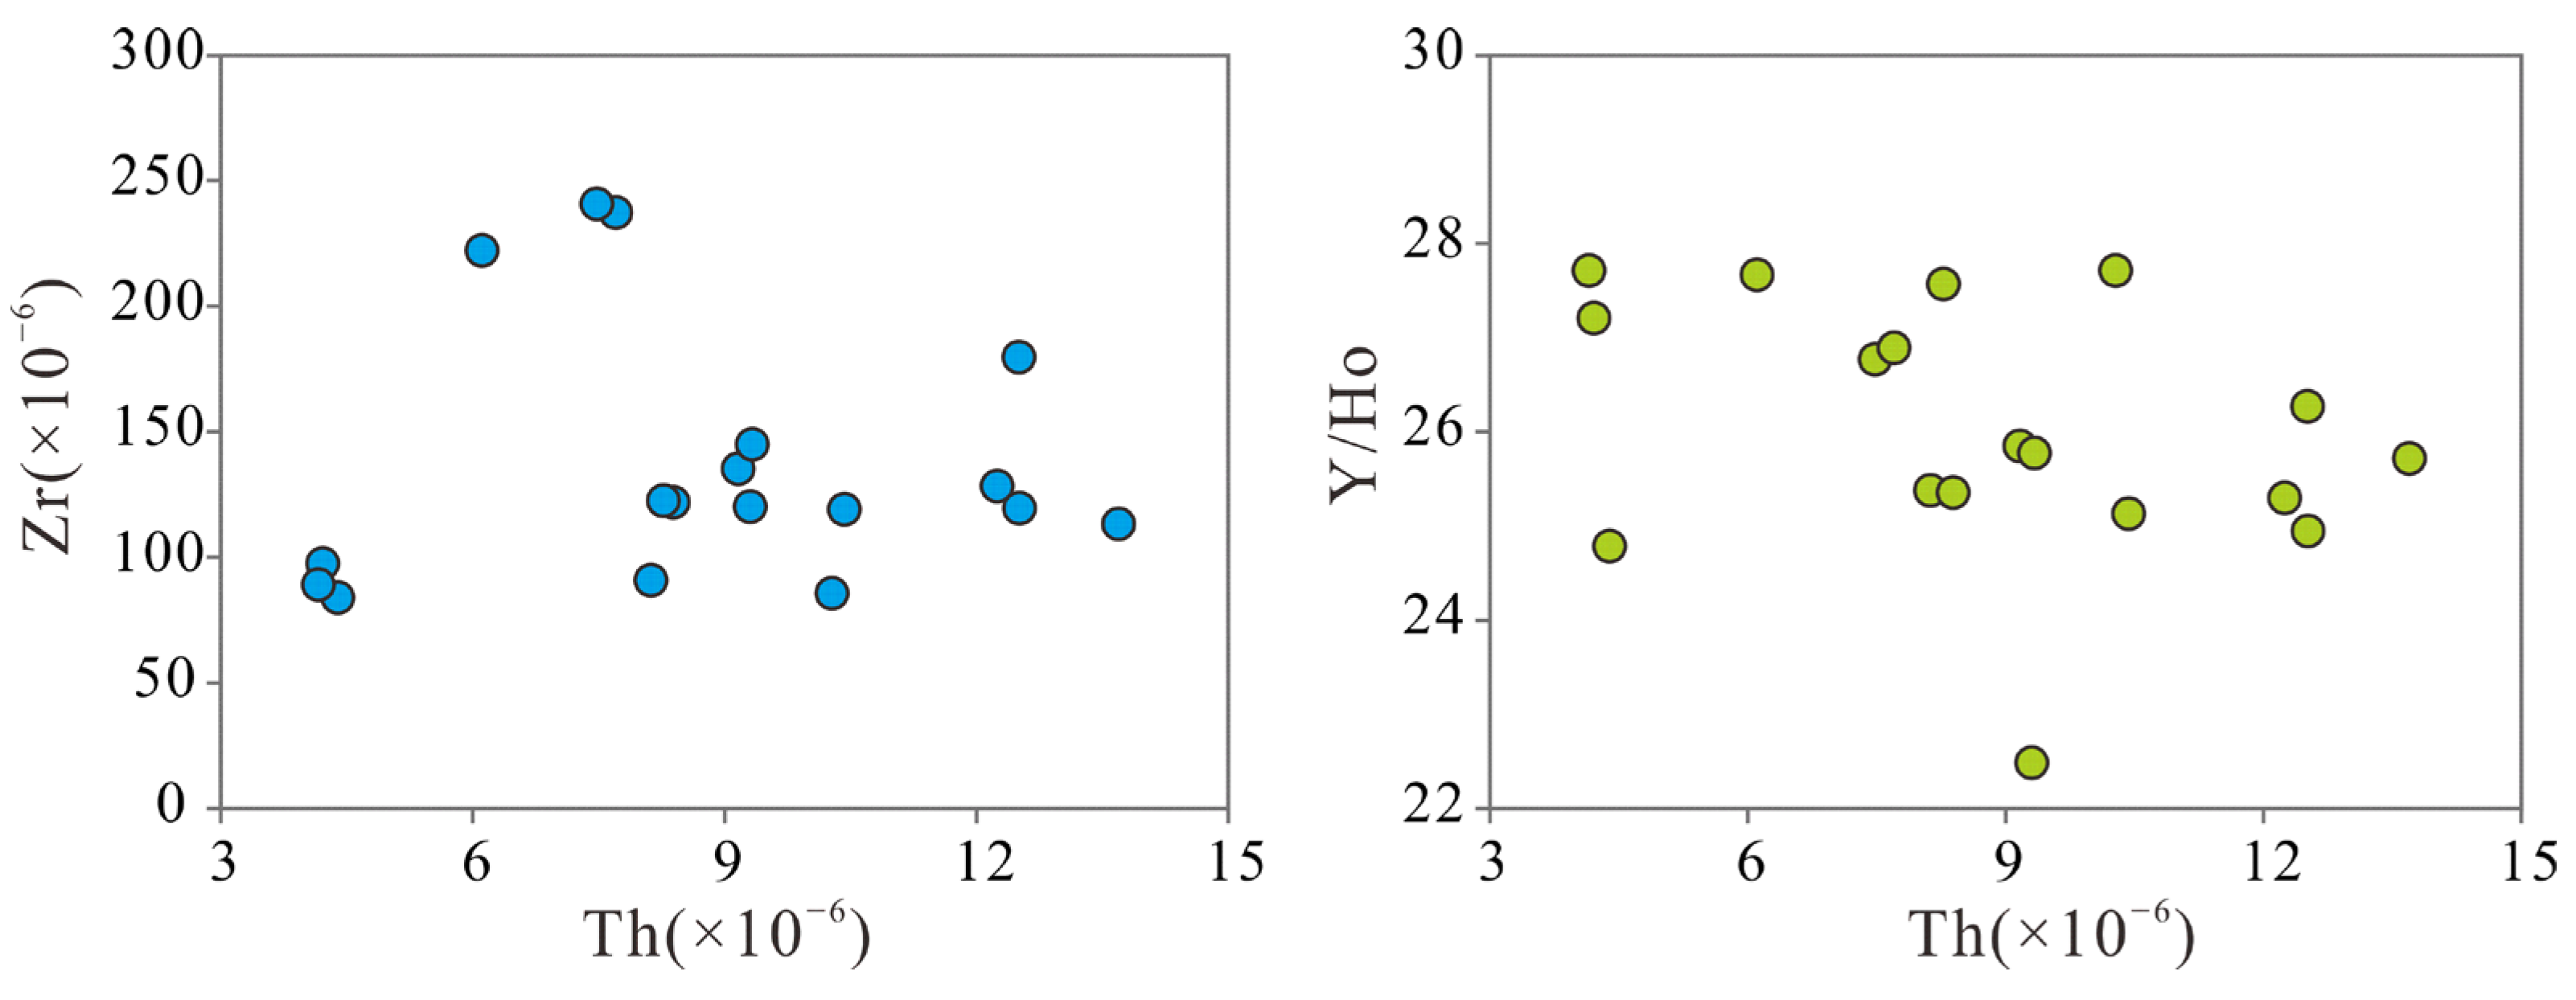
5.3. Rare Earth Elements
6. Discussion
7. Conclusions
Author Contributions
Funding
Institutional Review Board Statement
Informed Consent Statement
Data Availability Statement
Acknowledgments
Conflicts of Interest
References
- Büchl, A.; Gier, S. Petrogenesis and alteration of tuffs associated with continental flood basalts from Putorana, northern Siberia. Geol. Mag. 2003, 140, 649–659. [Google Scholar] [CrossRef]
- Singer, A. The paleoclimatic interpretation of clay minerals in soils and weathering profiles. Earth Sci. Rev. 1980, 15, 303–326. [Google Scholar] [CrossRef]
- Deconinck, J.F.; Blanc-Valleron, M.M.; Rouchy, J.M.; Camoin, G.; Badaut-Trauth, D. Palaeoenvironmental and diagenetic control of the mineralogy of Upper Cretaceous Lower Tertiary deposits of the Central Palaeo Andean basin of Bolivia (Potosi area). Sediment. Geol. 2000, 132, 263–278. [Google Scholar] [CrossRef]
- Lee, E.; Tejada, M.; Song, I.; Chun, S.; Gier, S.; Riquier, L.; White, L.; Schnetger, B.; Brumsack, H.J.; Jones, M.; et al. Petrophysical property modifications by alteration in a volcanic sequence at IODP Site U1513, Naturaliste Plateau. J. Geophys. Res. Solid Earth Am. Geophys. Union 2021, 126, e2020JB021061. [Google Scholar] [CrossRef]
- Sun, L.M.; Yang, Y.M.; Wu, Y.M.; Fang, X.F.; Li, L.H.; Li, Y.C.; Zhao, Y.F.; Tian, L.F. Sedimentary environment of Neogene laterite records in the Xihe basin, Inner Mongolia. Geol. China 2008, 35, 683–690. [Google Scholar]
- Yu, S.H.; Zheng, H.H. REE of sediments of the Chang Liushui section at Zhong Wei County of Ning Xia and the environmental significance. Acta Sedimentol. Sin. 1999, 17, 149–155. [Google Scholar]
- Li, Y.C.; Wang, S.M.; Huang, Y.S. The lake sediments rediments to environmental and climatic change. Adv. Earth Sci. 1999, 14, 412–416. [Google Scholar]
- Fan, Y.H.; Qu, H.J.; Wang, H.; Yang, X.C.; Feng, Y.W. The application of trace elements analysis to identifying sedimentary media environment: A case study of Late Triassic strata in the middle part of western Ordos Basin. Geol. China 2012, 39, 382–389. [Google Scholar]
- Zhong, W.; Fang, X.M.; Li, J.J.; Zhu, J.J. The Geochemical Record of Paleoclimate during about 7.0Ma–0.73Ma in Linxia Basin, Gansu Province. J. Arid Land Resour. Environ. 1998, 12, 36–43. [Google Scholar]
- Kuang, S.P.; Xu, Z.; Zhang, S.S.; Ma, Z.D. Applying Geochemistry to Research into Meso-Cenozoic Climate: Discussion on Jurassic Climatic change in Sichuan Basin, China. J. Qingdao Inst. Chem. Technol. 2002, 3, 4–9. [Google Scholar]
- Miller, E.K.; Blum, J.D.; Friedland, A.J. Determination of soil exchanheable-cation loss and weathering rates using Sr isotopes. Nature 1993, 362, 438–441. [Google Scholar] [CrossRef]
- Reinhardt, E.G.; Blenkinsop, J.; Patrerson, R.T. Assessment of a Sr isotope (87Sr/86Sr) vital effect in marine taxa from Lee Stocking Island, Bahamas. Geo-Mar. Lett. 1998, 18, 241–246. [Google Scholar] [CrossRef]
- Dominik, J.; Stanley, D.J. Boron, beryllium and sulfur in Holocene sediments and peats of the Nile delta, Egypt: Their use as indicators of salinity and climate. Chem. Geol. 1993, 104, 203–216. [Google Scholar] [CrossRef]
- Bailey, S.W.; Hornbeck, J.W.; Driscoll, C.T.; Gaudette, H.E. Calcium inputs and transport in a base poor forest ecosystem as interpreted by Sr isotopes. Water Resour. Res. 1996, 32, 707–719. [Google Scholar] [CrossRef]
- Fu, S.T.; Ma, D.D.; Chen, Y.; Zhang, G.Q.; Wu, K.Y. New advance of petroleum and gas exploration in Qaidam Basin. Acta Pet. Sin. 2016, 37, 1–10. [Google Scholar]
- Jiang, Y.; Pan, S.L.; Qing, C.H.; Jiang, Z.W.; Zhu, W.J.; Zhang, M.F.; Sun, G.Q. Characteristics and provenance analysis of rare earth elements in the Lower section of Xiaganchaigou Formation in the platform area of the northern margin of Qaidam Basin. Nat. Gas Geosci. 2020, 31, 1537–1547. [Google Scholar]
- Lv, J.W.; Li, Y.; Wang, P.; Kang, J.; Cai, Z.H.; Sun, G.Q. Study on Sedimentary Microfacies of Lulehe Formation in Platform Area of Qaidam Basin. Sediment. Tethys Geol. 2016, 36, 55–61. [Google Scholar]
- Sun, G.Q.; Wang, Y.T.; Guo, J.J.; Wang, M.; Jiang, Y.; Pan, S.L. Clay Minerals and Element Geochemistry of Clastic Reservoirs in the Xiaganchaigou Formation of the Lenghuqi Area, Northern Qaidam Basin, China. Minerals 2019, 9, 678. [Google Scholar] [CrossRef] [Green Version]
- Hanson, A.D.; Ritts, B.D.; Zinniker, D.; Moldowan, J.M.; Biffi, U. Upper Oligocene lacustrine source rocks and petroleum systems of the northern Qaidam basin, northwest China. AAPG Bull. 2001, 85, 601–619. [Google Scholar]
- Sun, G.Q.; Zheng, J.J.; Hu, H.F.; Zhang, D.W.; Xu, Z.Y. Discussion of the Down-warped Setting Basin: Taking Qaidam Basin as an Example. Nat. Gas Geosci. 2004, 15, 395–400. [Google Scholar]
- Sun, Z.; Yang, Z.; Pei, J.; Ge, X.; Wang, X.; Yang, T.; Li, W.; Yuan, S. Magnetostratigraphy of Paleogene sediments from northern Qaidam Basin, China: Implications for tectonic uplift and block rotation in northern Tibetan plateau. Earth Planet. Sci. Lett. 2005, 237, 635–646. [Google Scholar] [CrossRef]
- Sun, Z.; Jing, M.; Sun, N.; Lu, Y.; Cao, L. Discussion on boundary between the upper and lower members of Xiaganchaigou Formation of Paleogene in Well Kun-2 Qaidam Basin. J. Palaeogeogr. 2007, 9, 611–618. [Google Scholar]
- Wang, X.; Qiu, Z.; Li, Q.; Wang, B.; Qiu, Z.; Downs, W.R.; Xie, G.; Xie, J.; Deng, T.; Takeuchi, G.T.; et al. Vertebrate paleontology, biostratigraphy, geochronology, and paleoenvironment of Qaidam Basin in northern Tibetan Plateau. Palaeogeogr. Palaeoclimatol. Palaeoecol. 2007, 254, 363–385. [Google Scholar] [CrossRef]
- Jian, X.; Guan, P.; Zhang, D.W.; Zhang, W.; Feng, F.; Liu, R.J.; Lin, S.D. Provenance of Tertiary sandstone in the northern Qaidam basin, northeastern Tibetan Plateau: Integration of framework petrography, heavy mineral analysis and mineral chemistry. Sediment. Geol. 2013, 290, 109–125. [Google Scholar] [CrossRef]
- Tian, J.X.; Sun, P.; Zhang, L.; Guo, Z.Q.; Zhai, Z.W.; Zhou, F.; Zhao, J. Accumulation conditions of Natural Gas and exploration Domains in the Pingtai Area, Piedmont Zone of the north Qaidam. Nat. Gas Geosci. 2014, 25, 526–531. [Google Scholar]
- Chen, B.; Xue, Y.J.J.; Zhao, Y.N.; Zhong, P.; Chen, F.J. Geochemical characteristic and significance of elements in Lower Member of Lower Ganchaigou Formation in the platform area on north margin of Qaidam Basin. Spec. Oil Gas Reserv. 2019, 26, 12–17. [Google Scholar]
- Holtzapffel, T. Les minéraux argileux: Préparation, analyse diffr actométrique et determination. Soc. Géol. Nord. Publ. 1985, 12, 136. [Google Scholar]
- Sun, G.Q.; Wang, M.; Guo, J.J.; Wang, Y.T.; Yang, Y.H. Geochemical Significance of Clay Minerals and Elements in Paleogene Sandstones in the Center of the Northern Margin of the Qaidam Basin, China. Minerals 2020, 10, 505. [Google Scholar] [CrossRef]
- Sun, G.Q.; Liu, W.M.; Wang, B.; Xu, L.; Kang, J.; Wang, H.C. Reservoir Characteristics of the Lulehe Formation in the Pingtai Area of northern Qaidam Basin. Acta Sedimentol. Sin. 2016, 34, 356–363. [Google Scholar]
- Chen, T.; Wang, H.; Zhang, Z.Q.; Wang, H.J. Clay minerals as indicators of paleoclimate. Acta Petrol. Et Mineral. 2003, 22, 416–420. [Google Scholar]
- Meunier, A. Les mécanismes de l’altération des granites et le rôle des microsystemes. Etude des arenas du massif granitique de Parthenay (Deux-Sevres). Mém. Soc. Geol. Fr. 1980, 140, 1–80. [Google Scholar]
- He, L.B. The relation between clay mineral variation of marine sediment cores and paleoclimate. Chin. Sci. Bull. 1982, 27, 809–812. [Google Scholar]
- Yang, Z.S. Mineralogical assemblages and chemical characteristics of clays from sediments of the Huanghe, Changjiang, Zhujiang rivers and their relationship to the climate environment in their sediment source areas. Oceanol. Et Limnol. Sin. 1988, 19, 336–346. [Google Scholar]
- Long, H.; Wang, C.H.; Liu, Y.P.; Ma, H.Z. Application of clay minerals in paleoenviroment research. J. Salt Lake Res. 2007, 15, 21–25. [Google Scholar]
- Quigley, R.M.; Martin, R.T. Chloritized weathering products of a New England glacial till. Clays Clay Miner. 1963, 10, 107–116. [Google Scholar] [CrossRef]
- Ducloux, J.; Meunier, A.; Velde, B. Smectite, chlorite and a regular interlayered chlorite-vermiculite in soils developed on a small serpentinite body, Massif Central, France. Clay Min. 1976, 11, 121–135. [Google Scholar] [CrossRef]
- Vanderaveroet, P. Miocene to Pleistocene clay mineral sedimentation on the New Jersey shelf. Oceanol. Acta 2000, 23, 25–36. [Google Scholar] [CrossRef] [Green Version]
- Gingele, F.X.; Deckker, P.D.; Hillenbrand, C.D. Late Quaternary fluctuations of the Leeuwin Current and palaeoclimates on the adjacent land masses: Clay mineral evidence. J. Geol. Soc. Aust. 2001, 48, 867–874. [Google Scholar] [CrossRef]
- Winkler, A.; Wolf-Welling, T.C.W.; Stattegger, K.; Thiede, J. Clay mineral sedimentation in high northern latitude deep-sea basins since the Middle Miocene (ODP Leg 151, NAAG). Int. J. Earth Sci. 2002, 91, 133–148. [Google Scholar] [CrossRef]
- Segonzac, G.D.D. The transformation of clay minerals during diagenesis and low grade metamorphism: A review. Sedimentology 1970, 15, 281–346. [Google Scholar] [CrossRef]
- Keller, W.D. Environmental aspects of clay minerals. J. Sediment. Res. 1970, 40, 788–859. [Google Scholar] [CrossRef]
- Ehrmann, W. Implications of late Eocene to early Miocene clay mineral assemblages in McMurdo Sound (Ross Sea, Antarctica) on paleoclimate and ice dynamics. Palaeogeogr. Palaeoclimatol. Palaeoecol. 1998, 139, 213–231. [Google Scholar] [CrossRef]
- Fu, W.J. Influence of clay minerals on sandstone reservoir properties. J. Palaeogeogr. 2000, 2, 59–67. [Google Scholar]
- Jimenez-Espinosa, R.; Jimenez-Millan, J. Calcrete development in mediterranean colluvial carbonate systems from SE Spain. J. Arid Environ. 2003, 53, 479–489. [Google Scholar] [CrossRef]
- Jain, M.; Tandon, S.K. Quaternary alluvial stratigraphy and palaeoclimatic reconstruction at the Thar margin. Curr. Sci. 2003, 84, 1048–1055. [Google Scholar]
- Wang, J.T.; Jiao, K.Q. Geomorphology, Quaternary sediments and lake-level change in Chaiwopu-Dabancheng redion. In Researches on the Water Resources in Urumqi Region(I)Water Resources and Environment in Chaiwopu-Dabancheng Region; Shi, Y.F., Qu, Y.G., Eds.; China Science Press: Beijing, China, 1989; pp. 11–22. [Google Scholar]
- Wang, Y.F. Lacustrine carbonate chemical sedimentation and climatic-environmental evolution-a case study of Qinghai Lake and Daihai Lake. Oceanol. Et Limnol. Sin. 1993, 24, 31–35. [Google Scholar]
- Xi, X.X.; Mu, D.F.; Fang, X.M.; Li, J.J. Climatic change since the Late Miocene in west China evidence from anion chlorine in the Linxia red basin. Acta Sedimentol. Sin. 1998, 16, 155–160. [Google Scholar]
- Sun, G.Q.; Yin, J.G.; Zhang, S.C.; Lu, X.C.; Zhang, S.Y.; Shi, J.A. Diagenesis and Sedimentary Environment of Miocene Series in Eboliang III Area. Environ. Earth Sci. 2015, 74, 5169–5179. [Google Scholar] [CrossRef]
- Gromet, L.P.; Haskin, L.A.; Korotev, R.L.; Dymek, R.F. The “North American shale composite”: Its compilation, major and trace element characteristics. Geochim. Et Cosmochim. Acta 1984, 48, 2469–2482. [Google Scholar] [CrossRef]
- Ma, B.L.; Wang, Q. Distribution characteristics of elements in modern sediments of Qinghai lake. Acta Sedimentol. Sin. 1997, 15, 120–125. [Google Scholar]
- Dodson, J.R.; Ramrath, A. AnUpper Pliocene lacustrine environmental record from south-Western Australi a-preliminary results. Palaeogeogr. Palaeoclim. Palaeoecol. 2001, 167, 309–320. [Google Scholar] [CrossRef]
- Ramrath, A.; Zolitschka, B.; Wulf, S.; Negendank, J.F.W. Late Pleistocene climate variations as recorded in two ltalian maar lakes (Lago di Mezzano, Lago Grande di Monticchio). Quat. Sci. Rev. 1999, 18, 977–992. [Google Scholar] [CrossRef]
- Brauer, A.; Mingram, J.; Frank, U.; Günter, C.; Schettler, G.; Wulf, S.; Zolitschka, B.; Negendank, J.F.W. Abrupts environmental oscillations during the Early Weichselian recorded at Lago Grande di Monticchio, southern ltaly. Quat. Int. 2000, 73, 79–90. [Google Scholar] [CrossRef]
- Valero-Garcés, B.L.; González-Sampériz, P.; Delgado-Huertas, A.; Navas, A.; Machín, J.; Kelts, K. Lateglacial and Late Holocene environmental and vegetational change in Salada Mediana, central Ebro Basin, Spain. Quat. Int. 2000, 73, 29–46. [Google Scholar] [CrossRef] [Green Version]
- Battarbee, R.W.; Grytnes, J.A.; Thompson, R.; Appleby, P.G.; Catalan, J.; Korhola, A.; Birks, H.J.B.; Heegaard, E.; Lami, A. Comparing palaeolimnological and instrumental evidence of climate change for remote mountain lakes over the last 200 years. J. Paleolimnol. 2002, 28, 161–179. [Google Scholar] [CrossRef]
- Kelts, K. Environments of deposition of lacustrine petroleum source rocks: An introduction. Geol. Soc. Lond. Spec. Publ. 1988, 40, 3–26. [Google Scholar] [CrossRef]
- Liu, Z.T.; Yu, J.Q.; Zhang, B.H.; Cai, W.; Zhang, L.S. Application of Loss on Ignition to the Study of Lake Sediments and Environmental Changes. J. Salt Lake Res. 2006, 14, 67–72. [Google Scholar]
- Yuan, B.Y.; Chen, K.Z.; Bowler, J.M.; Ye, S.J. The formation and evolution of the Qinghai Lake. Quat. Sci. 1990, 10, 233–243. [Google Scholar]
- Wang, S.J.; Huang, X.Z.; Tuo, J.C.; Shao, H.S.; Yan, C.F.; Wang, S.Q.; He, Z.R. Evolutional characteristics and their Paleoclimate significance of trace elements in the Hetaoyuan Formation, Biyang Depression. Acta Sedimentol. Sin. 1997, 15, 65–70. [Google Scholar]
- Song, M.S. Sedimentary Environment Geochemistry in the Shasi Section of Southern Rama, Dongying Depression. J. Mineral. Petrol. 2005, 5, 67–73. [Google Scholar]
- Couch, E.L. Calculation of paleosalinities from boron and clay mineral data. AAPG Bull. 1971, 55, 1829–1837. [Google Scholar]
- Taylor, S.R.; McLennan, S.M. The Continental Crust: Its Composition and Evolution; Blackwell Scientific Publications: Oxford, UK, 1985; p. 312. [Google Scholar]
- Shi, J.A.; Guo, X.L.; Wang, Q.; Yan, N.Z.; Wang, J.X. Geochemistry of REE in QH1 sediments of Qinghai Lake since Late Holocene and its Paleoclimatic significance. J. Lake Sci. 2003, 15, 28–34. [Google Scholar]
- McDonough, W.F.; Sun, S.S. The composition of the earth. Chem. Geol. 1995, 120, 223–253. [Google Scholar] [CrossRef]
- Cao, J.J.; Zhang, X.Y.; Wang, D.; Zhou, J. REE geochemistry of late Cenozoic eolian sediments and the paleoclimate significance. Mar. Geol. Quat. Geol. 2001, 21, 97–101. [Google Scholar]
- Kashiwaya, K.; Yamanoto, A.; Fukuyama, K. Time variations of erosional force and grain size in Pleistocene lake sediments. Quat. Res. 1987, 28, 61–68. [Google Scholar] [CrossRef]
- Zhao, Y.Y.; Wang, J.T.; Qin, C.Y.; Chen, Y.W.; Wang, X.J.; Wu, M.Q. Rare-earth elements in continental shelf sediments of the China Seas. Acta Sedimentol. Sin. 1990, 8, 37–43. [Google Scholar]
- Chen, J.G.; Wan, G.J.; Xu, J.Y. Sediment particle sizes and the dry-humid transformation of the regional climate in Erhai Lake. Acta Sedimentol. Sin. 2000, 9, 341–345. [Google Scholar]
- Tribovillard, N.; Algeo, T.J.; Lyons, T.; Riboulleau, A. Trace metals as paleoredox and paleoproductivity proxies: An update. Chem. Geol. 2006, 232, 12–32. [Google Scholar] [CrossRef]
- Piper, D.Z. Seawater as the source of minor elements in black shales, phosphorites and other sedimentary rocks. Chem. Geol. 1994, 114, 95–114. [Google Scholar] [CrossRef]
- Xu, L.G.; Lehmann, B.; Zhang, X.G.; Zheng, W.; Meng, Q.T. Trace element distribution in black shales from the Kunyang phosphorite deposit and its geological significances. Acta Petrol. Sin. 2014, 30, 1817–1827. [Google Scholar]
- Schrӧder, S.; Grotzinger, J.P. Evidence for anoxia at the Ediacaran-Cambrian boundary: The record of redox-sensitive trace elements and rare earth elements in Oman. J. Geol. Soc. 2007, 164, 175–187. [Google Scholar] [CrossRef] [Green Version]
- Bau, M.; Dulski, P. Distribution of yttrium and rare-earth elements in the Penge and Kuruman iron-formations, Transvaal Supergroup, South Africa. Precambrian Res. 1996, 79, 37–55. [Google Scholar] [CrossRef]
- Yang, Y.H.; Sun, G.Q.; Wang, Y.T.; Wu, J.; Jiang, Y.; Wang, M.; Li, J.S. Diagenesis and sedimentary environment of the lower Xiaganchaigou formation deposited during the Eocene/Oligocene transition in the Lenghu tectonic belt, Qaidam Basin, China. Environ. Earth Sci. 2020, 79, 220. [Google Scholar] [CrossRef]
- Mei, S.Q. Application of rock chemistry in the study of Presinian sedimentary environment and the source of uranium mineralization in Hunan province. Hunan Geol. 1988, 7, 25–34. [Google Scholar]
- Steiner, M.; Wallis, E.; Erdtmann, B.D.; Zhao, Y.; Yang, R. Submarine-hydrothermal exhalative ore layers in black shales from South China and associated fossils 3/4 insights into a Lower Cambrian facies and bio-evolution. Palaeogeogr. Palaeoclimatol. Palaeoecol. 2001, 169, 165–191. [Google Scholar] [CrossRef]
- Wignall, P.B.; Twitchett, R.J. Oceanic Anoxia and the End Permian Mass Extinction. Science 1996, 272, 1155–1158. [Google Scholar] [CrossRef]
- Wright, J.; Schrader, H.; Holser, W.T. Paleoredox variations in ancient oceans recorded by rare earth elements in fossil apatite. Geochim. Cosmochim. Acta 1987, 51, 631–644. [Google Scholar] [CrossRef]
- Huang, X.F.; Qian, Z.Z.; Lu, D.X.; Wu, W.K.; Wang, C.; Lu, Y.J. Element geochemistry and depositional setting of ordovician miboshan formation in central–Southern Helan mountain. Acta Geosci. Sin. 2009, 30, 65–71. [Google Scholar]
- Rimmer, S.; Thompson, J.S.; Robl, T. Multiple controls on the preservation of organic matter in Devonian-Mississippian marine black shales: Geochemical and petrographic evidence. Palaeogeogr. Palaeoclimatol. Palaeoecol. 2004, 215, 125–154. [Google Scholar] [CrossRef]
- Zachos, J.; Pagani, M.; Sloan, L.; Thomas, E.; Billups, K. Trends, rhythms and aberrations in global climate 65 Ma to present. Science 2001, 292, 686–693. [Google Scholar] [CrossRef]
- Haq, B.U.; Hardenbol, J.; Vail, P.R. Mesozoic and Cenozoic Chronostratigraphy and cycles of sea-level change. In Sealevel Change—An Integrated Approach; Wagoner, J.C., Ed.; SEPM Special Publication: Algiers, Algeria, 1988; pp. 71–108. [Google Scholar]
- Miller, K.G.; Kominz, M.A.; Browning, J.V.; Wright, J.D.; Mountain, G.S.; Katz, M.E.; Sugarman, P.J.; Cramer, B.S.; Christie-Blick, N.; Pekar, S.F. The Phanerozoic record of global sea-level change. Science 2005, 310, 1293–1298. [Google Scholar] [CrossRef] [PubMed] [Green Version]
- Prothero, D.R. Does climatic change drive mammalian evolution? GSA Today 1999, 9, 1–7. [Google Scholar]
- Wolfe, J.A. Climatic, floristic, and vegetational changes near the Eocene/Oligocene boundary in North America. In Eocene-Oligocene Climatic and Biotic Evolution; Prothero, D.R., Berggren, W.A., Eds.; Princeton University Press: Princeton, NJ, USA, 1992; pp. 421–436. [Google Scholar]
- Ivany, L.C.; Patterson, W.P.; Lohmann, K.C. Cooler winters as a possible cause of mass extinctions at the Eocene/Oligocene boundary. Nature 2000, 407, 887–890. [Google Scholar] [CrossRef] [PubMed] [Green Version]
- Blondel, C. The Eocene-Oligocene ungulates from Western Europe and their environment. Palaeogeogr. Palaeoclimatol. Palaeoecol. 2001, 168, 125–139. [Google Scholar] [CrossRef] [Green Version]
- Buenhy, N.; Carlson, S.J.; Spero, H.J.; Lee, D.E. Evidence for the Early Oligocene formation of a proto-Subtropical Convergence from oxygen isotope records of New Zealand Paleogence brachiopods. Palaeogeogr. Palaeoclimatol. Palaeoecol. 1998, 138, 43–68. [Google Scholar]


| Fm | Buried Depth (m) | Quartz (w%) | Potassium Feldspar (w%) | Sodium Feldspar (w%) | Calcite (w%) | Dolomite (w%) | Hematite (w%) | Total Amount of Clay (w%) | Relative Content of Clay Minerals (w%) | Mixed Layer Ratio (w%) | ||||
|---|---|---|---|---|---|---|---|---|---|---|---|---|---|---|
| S | I/S | I | K | C | I/S | |||||||||
| XiaganchaigouFormation | 644.77 | 15.4 | 0.5 | 3.4 | 16.6 | 23.5 | 2.2 | 36.0 | / | 61 | 22 | / | 17 | 23 |
| 645.77 | 31.9 | 1.0 | 7.1 | 10.8 | 4.0 | 1.2 | 41.2 | / | 69 | 14 | / | 17 | 63 | |
| 647.76 | 47.5 | 2.3 | 11.2 | 18 | 3.0 | / | 16.4 | / | 76 | 4 | / | 20 | 53 | |
| 648.26 | 26.9 | 1.0 | 6.5 | 22.7 | 10.4 | 1.8 | 28.8 | / | 71 | 13 | / | 16 | 53 | |
| 648.76 | 18.2 | 0.4 | 3.7 | 28.4 | 9.2 | 1.4 | 36.6 | / | 72 | 14 | / | 14 | 56 | |
| 649.76 | 40.7 | 1.4 | 11.7 | 23.9 | 2.5 | / | 17.1 | / | 69 | 14 | / | 17 | 54 | |
| 650.26 | 56.5 | 1.9 | 11.4 | 9.5 | 1.8 | / | 18.0 | / | 69 | 13 | / | 18 | 57 | |
| 651.26 | 42.8 | 0.9 | 8.5 | 27.2 | 3.8 | / | 14.9 | / | / | / | / | / | / | |
| 652.26 | 42.8 | 1.4 | 9.1 | 20.9 | 3.0 | / | 20.7 | / | 69 | 15 | / | 16 | 56 | |
| 653.26 | 36.8 | 1.3 | 9.4 | 23.2 | 3.5 | / | 23.2 | / | 56 | 29 | / | 15 | 59 | |
| Lulehe Formation | 928.23 | 70.5 | 1.5 | 9.6 | 9.5 | / | / | 7.9 | 77 | / | 11 | / | 12 | / |
| 929.68 | 60.8 | 6.6 | 15.6 | 4.8 | 1.1 | / | 8.9 | 63 | / | 14 | / | 23 | / | |
| 995.8 | 64.5 | 2.3 | 8.3 | 18.8 | / | / | 4.9 | 74 | / | 13 | / | 13 | / | |
| 997.3 | 67.9 | 3.1 | 12.3 | 8.1 | / | / | 7.9 | 68 | / | 12 | / | 20 | / | |
| 998.28 | 50.3 | 3.1 | 12.3 | 22.9 | / | / | 9.6 | 34 | / | 21 | / | 45 | / | |
| 1000.88 | 58.8 | 3.8 | 15.8 | 11.2 | 1.0 | / | 7.6 | 32 | / | 28 | / | 40 | / | |
| 1002.28 | 61.5 | 1.6 | 6.4 | 13.1 | / | / | 7.8 | 46 | / | 45 | / | 9 | / | |
| 1002.78 | 57.6 | 2.0 | 13.3 | 8.1 | / | / | 13.0 | 36 | / | 53 | / | 11 | / | |
| Fm | Buried Depth (m) | Lithology | Na2O (%) | MgO (%) | Al2O3 (%) | SiO2 (%) | K2O (%) | CaO (%) | Fe2O3 (%) | P2O5 (%) | TiO2 (%) | MnO2 (%) | LOI |
|---|---|---|---|---|---|---|---|---|---|---|---|---|---|
| Xiaganchaigou Formation | 644.77 | Brown-red mudstone | 0.92 | 8.67 | 12.82 | 33.87 | 2.79 | 18.97 | 5.99 | 0.04 | 0.68 | 0.10 | 14.72 |
| 645.77 | Brown-red mudstone | 1.20 | 5.71 | 17.30 | 48.67 | 3.48 | 6.43 | 8.33 | 0.11 | 0.74 | 0.10 | 7.86 | |
| 647.76 | Brown-red mudstone | 1.63 | 3.80 | 13.29 | 51.25 | 2.25 | 9.49 | 5.48 | 0.09 | 0.72 | 0.13 | 11.44 | |
| 648.26 | Brown-red mudstone | 1.10 | 6.32 | 12.23 | 37.86 | 2.44 | 17.35 | 5.68 | 0.20 | 0.68 | 0.11 | 15.34 | |
| 648.76 | Brown-red mudstone | 1.03 | 4.85 | 12.64 | 37.27 | 2.62 | 19.94 | 5.49 | 0.05 | 0.73 | 0.11 | 14.71 | |
| 649.76 | Brown-red mudstone | 1.24 | 3.29 | 12.32 | 44.03 | 2.32 | 15.73 | 4.99 | 0.11 | 0.74 | 0.13 | 14.42 | |
| 650.26 | Brown-red mudstone | 1.66 | 4.23 | 12.18 | 59.85 | 2.76 | 4.46 | 6.49 | 0.13 | 0.72 | 0.10 | 7.29 | |
| 651.26 | Brown-red mudstone | 1.20 | 3.74 | 13.99 | 45.53 | 2.72 | 12.64 | 5.57 | 0.21 | 0.72 | 0.11 | 13.09 | |
| 652.26 | Brown-red mudstone | 1.42 | 4.29 | 15.08 | 48.70 | 2.80 | 9.69 | 6.34 | 0.11 | 0.75 | 0.11 | 10.25 | |
| 653.26 | Brown-red mudstone | 1.43 | 3.69 | 14.09 | 48.85 | 2.58 | 11.05 | 5.54 | 0.10 | 0.75 | 0.12 | 11.58 | |
| Average | 1.28 | 4.86 | 13.59 | 45.59 | 2.68 | 12.58 | 5.99 | 0.12 | 0.72 | 0.11 | 12.07 | ||
| Lulehe Formation | 928.23 | Grayish-brown siltstone | 1.68 | 1.45 | 9.42 | 72.30 | 1.68 | 3.14 | 3.00 | 0.09 | 0.51 | 0.13 | 5.84 |
| 929.68 | Grayish-brown siltstone | 3.08 | 0.95 | 11.54 | 71.12 | 2.38 | 4.31 | 2.62 | 0.05 | 0.21 | 0.13 | 3.41 | |
| 995.8 | Grayish-white fine sandstone | 1.87 | 1.01 | 7.95 | 66.47 | 1.50 | 7.59 | 2.3 | 0.06 | 0.47 | 0.14 | 9.89 | |
| 997.3 | Grayish-white medium sandstone | 2.55 | 1.36 | 10.16 | 68.68 | 1.73 | 5.42 | 2.87 | 0.07 | 0.49 | 0.13 | 6.17 | |
| 998.28 | Grayish-white medium sandstone | 2.71 | 0.93 | 10.64 | 65.26 | 1.90 | 7.67 | 3.95 | 0.07 | 0.26 | 0.22 | 6.27 | |
| 1000.88 | Grayish-white conglomerate | 2.67 | 0.86 | 10.61 | 66.35 | 2.29 | 7.45 | 2.7 | 0.06 | 0.23 | 0.14 | 5.95 | |
| 1002.28 | Brown-red mudstone | 0.98 | 5.59 | 10.28 | 62.43 | 4.31 | 4.64 | 3.68 | 0.19 | 0.74 | 0.12 | 7.77 | |
| 1002.78 | Brown-red mudstone | 1.19 | 4.56 | 15.18 | 59.95 | 3.46 | 4.55 | 3.15 | 0.14 | 0.70 | 0.11 | 7.95 | |
| Average | 2.09 | 2.09 | 10.72 | 66.5 | 2.41 | 5.60 | 3.03 | 0.09 | 0.45 | 0.14 | 6.66 | ||
| Fm | Buried Depth (m) | Element Content(mg/kg) | Ratio | ||||||||||
|---|---|---|---|---|---|---|---|---|---|---|---|---|---|
| V | Cr | Co | Ni | Cu | Zn | Sr | Ba | Th | U | Sr/Cu | Sr/Ba | ||
| Xiaganchaigou Formation | 644.77 | 111.85 | 114.54 | 17.07 | 43.22 | 22.69 | 77.83 | 603.14 | 447.41 | 10.28 | 3.99 | 26.58 | 1.35 |
| 645.77 | 132.07 | 107.12 | 22.46 | 55.90 | 35.00 | 116.58 | 275.48 | 506.21 | 12.52 | 3.07 | 7.87 | 0.54 | |
| 647.76 | 95.49 | 87.19 | 14.93 | 26.96 | 21.43 | 69.22 | 241.51 | 420.49 | 9.33 | 2.62 | 11.27 | 0.57 | |
| 648.26 | 85.23 | 87.83 | 15.03 | 26.23 | 36.04 | 76.32 | 669.95 | 475.25 | 8.28 | 3.54 | 18.59 | 1.41 | |
| 648.76 | 91.21 | 90.17 | 15.31 | 29.35 | 35.20 | 81.55 | 457.44 | 423.39 | 8.13 | 2.97 | 13.00 | 1.08 | |
| 649.76 | 83.71 | 82.06 | 14.65 | 25.00 | 22.28 | 69.52 | 252.86 | 401.22 | 8.39 | 2.57 | 11.35 | 0.63 | |
| 650.26 | 118.48 | 106.18 | 17.85 | 34.30 | 26.14 | 93.64 | 186.30 | 486.25 | 12.51 | 2.96 | 7.13 | 0.38 | |
| 651.26 | 79.77 | 88.92 | 14.40 | 25.60 | 26.05 | 81.72 | 255.99 | 468.11 | 9.16 | 2.72 | 9.83 | 0.55 | |
| 652.26 | 94.39 | 84.47 | 16.08 | 29.63 | 34.29 | 84.52 | 225.85 | 472.25 | 10.43 | 2.76 | 6.59 | 0.48 | |
| 653.26 | 65.41 | 58.88 | 10.13 | 25.91 | 22.51 | 63.04 | 203.10 | 469.37 | 9.30 | 2.51 | 9.02 | 0.43 | |
| Lulehe Formation | 928.23 | 44.68 | 66.14 | 7.72 | 19.11 | 14.36 | 37.95 | 139.25 | 465.93 | 7.48 | 1.82 | 9.70 | 0.30 |
| 929.68 | 36.24 | 64.78 | 4.89 | 11.66 | 12.41 | 23.26 | 243.71 | 1333.97 | 4.22 | 0.96 | 19.64 | 0.18 | |
| 995.8 | 39.17 | 54.71 | 5.90 | 10.43 | 19.53 | 33.07 | 132.27 | 531.37 | 6.11 | 2.03 | 6.77 | 0.25 | |
| 997.3 | 53.72 | 68.23 | 6.20 | 15.91 | 14.17 | 31.73 | 185.69 | 482.28 | 7.70 | 1.73 | 13.10 | 0.39 | |
| 998.28 | 51.81 | 105.45 | 6.07 | 14.90 | 13.33 | 27.86 | 233.87 | 1442.84 | 4.39 | 1.41 | 17.54 | 0.16 | |
| 1000.9 | 39.63 | 59.09 | 5.99 | 10.14 | 10.70 | 25.81 | 227.13 | 622.13 | 4.16 | 0.88 | 21.23 | 0.37 | |
| 1002.3 | 140.47 | 103.28 | 22.49 | 61.00 | 33.57 | 118.48 | 156.86 | 535.23 | 13.70 | 3.73 | 4.67 | 0.29 | |
| 1002.8 | 103.72 | 88.57 | 17.38 | 47.32 | 29.94 | 99.18 | 148.11 | 499.40 | 12.25 | 3.27 | 4.95 | 0.30 | |
| Fm | Buried Depth (m) | Rare Earth Element Content (mg/kg) | ∑REE | |||||||||||||||
|---|---|---|---|---|---|---|---|---|---|---|---|---|---|---|---|---|---|---|
| Sc | Y | La | Ce | Pr | Nd | Sm | Eu | Gd | Tb | Dy | Ho | Er | Tm | Yb | Lu | |||
| Xiaganchaigou Formation | 644.77 | 11.62 | 19.74 | 26.85 | 51.91 | 5.93 | 22.35 | 4.42 | 0.95 | 3.92 | 0.62 | 3.59 | 0.71 | 2.07 | 0.31 | 2.02 | 0.32 | 157.33 |
| 645.77 | 14.13 | 20.30 | 30.03 | 62.28 | 7.20 | 25.66 | 5.07 | 1.04 | 4.37 | 0.70 | 4.06 | 0.81 | 2.39 | 0.37 | 2.40 | 0.37 | 181.17 | |
| 647.76 | 14.60 | 20.88 | 29.25 | 56.39 | 7.04 | 25.50 | 4.85 | 1.00 | 4.33 | 0.70 | 4.08 | 0.81 | 2.34 | 0.37 | 2.33 | 0.35 | 174.82 | |
| 648.26 | 11.09 | 24.79 | 34.57 | 67.79 | 8.73 | 33.09 | 6.53 | 1.38 | 5.96 | 0.90 | 4.76 | 0.90 | 2.41 | 0.35 | 2.20 | 0.33 | 205.79 | |
| 648.76 | 10.49 | 18.69 | 30.18 | 55.20 | 6.79 | 25.08 | 4.75 | 0.97 | 4.19 | 0.67 | 3.76 | 0.74 | 2.10 | 0.32 | 2.05 | 0.31 | 166.28 | |
| 649.76 | 12.09 | 20.03 | 29.64 | 57.26 | 7.19 | 26.17 | 5.02 | 1.04 | 4.46 | 0.71 | 4.02 | 0.79 | 2.24 | 0.35 | 2.20 | 0.33 | 173.53 | |
| 650.26 | 20.10 | 23.21 | 34.62 | 69.28 | 8.35 | 32.23 | 6.09 | 1.22 | 5.20 | 0.81 | 4.51 | 0.88 | 2.54 | 0.39 | 2.54 | 0.39 | 212.36 | |
| 651.26 | 11.40 | 23.61 | 34.93 | 68.93 | 8.55 | 31.76 | 6.09 | 1.26 | 5.55 | 0.86 | 4.73 | 0.91 | 2.51 | 0.37 | 2.34 | 0.35 | 204.15 | |
| 652.26 | 12.32 | 21.72 | 31.81 | 65.59 | 7.77 | 29.37 | 5.69 | 1.15 | 4.97 | 0.79 | 4.42 | 0.86 | 2.45 | 0.38 | 2.42 | 0.37 | 192.07 | |
| 653.26 | 7.36 | 18.57 | 32.30 | 63.43 | 7.44 | 28.31 | 5.27 | 1.06 | 4.62 | 0.74 | 4.20 | 0.83 | 2.35 | 0.35 | 2.22 | 0.34 | 179.39 | |
| Lulehe Formation | 928.23 | 7.25 | 16.84 | 24.13 | 45.02 | 5.39 | 20.27 | 3.95 | 0.82 | 3.46 | 0.55 | 3.16 | 0.63 | 1.84 | 0.28 | 1.83 | 0.29 | 135.70 |
| 929.68 | 4.25 | 9.46 | 12.68 | 22.00 | 2.73 | 10.26 | 2.05 | 0.61 | 1.85 | 0.30 | 1.73 | 0.35 | 1.01 | 0.15 | 1.00 | 0.15 | 70.57 | |
| 995.8 | 6.69 | 15.21 | 19.60 | 36.50 | 4.69 | 17.52 | 3.30 | 0.67 | 2.91 | 0.47 | 2.73 | 0.55 | 1.62 | 0.26 | 1.70 | 0.27 | 114.67 | |
| 997.3 | 7.35 | 15.96 | 21.53 | 37.74 | 4.72 | 17.85 | 3.53 | 0.81 | 3.18 | 0.51 | 2.95 | 0.59 | 1.73 | 0.26 | 1.70 | 0.26 | 120.67 | |
| 998.28 | 6.29 | 10.18 | 13.99 | 25.33 | 3.02 | 11.56 | 2.25 | 0.63 | 2.14 | 0.35 | 2.05 | 0.41 | 1.18 | 0.18 | 1.19 | 0.18 | 80.94 | |
| 1000.88 | 5.78 | 9.21 | 12.97 | 22.96 | 2.93 | 10.86 | 2.07 | 0.57 | 1.86 | 0.30 | 1.68 | 0.33 | 0.96 | 0.15 | 0.97 | 0.15 | 73.73 | |
| 1002.28 | 16.98 | 26.46 | 42.28 | 85.22 | 9.46 | 35.24 | 6.97 | 1.46 | 6.06 | 0.94 | 5.26 | 1.03 | 2.92 | 0.44 | 2.79 | 0.43 | 243.94 | |
| 1002.78 | 14.94 | 22.35 | 34.77 | 72.13 | 7.85 | 28.16 | 5.56 | 1.15 | 4.86 | 0.77 | 4.44 | 0.88 | 2.56 | 0.39 | 2.49 | 0.38 | 203.70 | |
Publisher’s Note: MDPI stays neutral with regard to jurisdictional claims in published maps and institutional affiliations. |
© 2022 by the authors. Licensee MDPI, Basel, Switzerland. This article is an open access article distributed under the terms and conditions of the Creative Commons Attribution (CC BY) license (https://creativecommons.org/licenses/by/4.0/).
Share and Cite
Sun, G.; Zhang, S.; Wang, Y.; Li, Y.; Guo, H.; Bo, S. Eocene Sedimentary–Diagenetic Environment Analysis of the Pingtai Area of the Qaidam Basin. Appl. Sci. 2022, 12, 6850. https://doi.org/10.3390/app12146850
Sun G, Zhang S, Wang Y, Li Y, Guo H, Bo S. Eocene Sedimentary–Diagenetic Environment Analysis of the Pingtai Area of the Qaidam Basin. Applied Sciences. 2022; 12(14):6850. https://doi.org/10.3390/app12146850
Chicago/Turabian StyleSun, Guoqiang, Shuncun Zhang, Yetong Wang, Yaoliang Li, Hui Guo, and Shangshang Bo. 2022. "Eocene Sedimentary–Diagenetic Environment Analysis of the Pingtai Area of the Qaidam Basin" Applied Sciences 12, no. 14: 6850. https://doi.org/10.3390/app12146850
APA StyleSun, G., Zhang, S., Wang, Y., Li, Y., Guo, H., & Bo, S. (2022). Eocene Sedimentary–Diagenetic Environment Analysis of the Pingtai Area of the Qaidam Basin. Applied Sciences, 12(14), 6850. https://doi.org/10.3390/app12146850