Article

Oil Bodies Cream from Olive Paste: Extraction of a Functional Ingredient for Developing a Stable Food Emulsion

1
Institute of Applied Sciences and Intelligent Systems, National Research Council (CNR-ISASI), 80078 Pozzuoli, Italy
2
Department of Mathematics and Physics, University of Campania “L. Vanvitelli”, 81100 Caserta, Italy
3
Department of Chemical, Materials and Production Engineering, University of Naples Federico II, Piazzale Tecchio, 80, 80125 Naples, Italy
4
Engineering Department, University of Rome Niccolò Cusano, Via Don Carlo Gnocchi, 3, 00166 Rome, Italy
5
Innovation & Technology Provider (ITP), Viale Campi Flegrei, 80078 Pozzuoli, Italy
6
Institute for Agricultural and Forest Systems in the Mediterranean, National Research Council, (CNR-ISAFoM), 80055 Perugia, Italy
*
Author to whom correspondence should be addressed.
These authors contributed equally to this work.
Appl. Sci. 2022, 12(12), 6019; https://doi.org/10.3390/app12126019
Submission received: 17 May 2022 / Revised: 8 June 2022 / Accepted: 10 June 2022 / Published: 14 June 2022

Abstract

:
Oil bodies (OBs) dispersed in an aqueous medium form a natural emulsion with high physical and microbiological stability. This work was focused on the development of a new protocol for extracting OBs from olive paste, through the extraction of an olive oil body cream (OOBC) with a yield of about 43% (wt/wt) in approximately 2 h. The proximate analysis revealed the presence of moisture, lipids and proteins as well as the contents of polyphenols and flavonoids, and the antioxidant powers were determined. The rheological and tribological performances of the OOBC were evaluated. Moreover, we measured a size distribution in the range of 0.7–1.7 m, by using a standard optical microscope. The results have demonstrated clearly that the OOBC extracted from the olive paste can be used as a functional and vegan ingredient in food emulsions.

1. Introduction

Oil bodies (OBs) are one of the most important organelles in a vegetal organism and are mainly found in seeds. They are composed of a core of triacylglycerols (TAGs) and are coated by a monolayer of phospholipids and embedded proteins called oleosins (15–26 kDa molecular mass) [1,2,3,4,5] and other compounds such as tocopherol [6]. Oleosins are composed of three different regions: an N-terminal and an amphipathic region, a central and hydrophobic antiparallel β-strand domain and a C-terminal domain of variable length [7]. OBs have been observed to be particularly stable in cells and isolated preparations. In both cases, the organelles appear as individual entities, and when they are pressed together in vivo for desiccating seeds or in vitro after centrifugation, they do not aggregate or coalesce, even if the storage is prolonged [7]. These organelles are individual entities that do not coalesce even under external stresses.
The stability and rheology of an oil-in-water emulsion mostly depends on the droplet interactions, which are substantially influenced by pH. In vegetable cells, the pH is near neutral; and thus, the area is stabilised by electrostatic repulsion, and coalescence is prevented [7]. Protein-stabilised emulsions are influenced by electrolyte ions in a different way, because they interact, reducing droplets repulsion, binding to droplets emulsion, changing hydrophobic interactions between non-polar groups, and altering the water molecules’ structure [8,9]. The effect of different pH values and ionic strengths on protein-stabilised emulsions have been well documented [10,11,12,13]. Other aspects affecting the emulsion stability are the average size of the droplets and their size distribution and the volume fraction of the dispersed phase [8]. Information about the size of the particles may be obtained using various analytical methods including microscopy, light scattering and sedimentation methods [8].
The pH-dependent aggregation of the OBs is well known. At the isoelectric point (IEP), the electrostatic repulsion does not take place, and aggregation occurs, whereas the IEP does not achieve an increment of scattered OBs, which is later attained, e.g., OBs from olive seeds, at pH 7.5, remain as individual droplets, while at pH 6, they aggregate due to their IEP [14]. This scenario is useful because when OBs are suspended in water, they can be considered as a natural emulsion. Oil droplets in the form of the OBs can ensure high physical and microbiological stability of an oil-in-water emulsion based on OBs. The physical stability is attained due to the stabilising effect of the oleosine and the small average droplet size.
Currently, vegetable oils have to be added to emulsion food products; hence, a highly expensive homogenisation process is required. Conversely, the extraction of oil in the form of an OBs may be an outstanding product which is already naturally emulsified. Moreover, this natural emulsion is stable and highly nourishing because it does not require any refining treatment [12]. The extraction of OBs is usually carried out from seeds such as soybeans, sunflower seeds, pumpkin seeds, sesame seeds, rice, rapeseeds and nuts such as almonds, peanuts and olive seeds. These are some of the raw materials where OBs have been identified. Olives should be recognised for their great importance owing to their beneficial properties for human health. The olive, known by the botanical name Olea europaea, is a species of the family Oleaceae and is the only one that can produce an edible fruit [15]. The olive has largely been used for oil production but also in the cosmetic and pharmaceutical fields. Currently, olive cultivation and olive oil production occur worldwide, with a global production of 17 million tons during the past 40 years. Moreover, the approximate amount of olives produced per year in Europe is 2051 thousand tonnes [16].
The olive is classified as a drupe [17], a fruit with a kernel, with an oval form and a weight between 0.5 and 20 g. The olive structure is composed of an epidermis (epicarps), pulp (mesocarp rich in oil) and a kernel (endocarp). The epicarp is commonly called the peel or skin and represents 1–3% of drupe weight. The epicarp contains the chlorophyll responsible for the green colour in unripe fruits, as well as carotenoids and anthocyanins responsible for the dark violet colours in matured fruits. The mesocarp, known as pulp, accounts for 70–80% of fresh fruits and is rich in oil. The endocarp, known as the kernel, accounts for 18–22% of whole fruits and is composed of lignified cells with the seed inside [18]. The chemical composition of olives varies according to the variety, growth phase of the fruits and the weather. On average, olive mesocarp is composed of 22% oil, 50% water, 1.6% proteins, 19.1% carbohydrates, 5.8% cellulose and 1.5% minerals [19,20]. Other important compounds present in olive fruit are pectin, organic acids, pigments and phenols [21]. These particular nutritional and functional characteristics of the olive drupe and olive oil suggest that these OBs have great potential in food preparations. In addition to the stabilising properties of the emulsions due to the composition of OBs, the presence of antioxidant elements from the drupe can confer a non-negligible functionality and, at the same time, a longer shelf-life [22].
Another relevant consideration is related to the extraction method used to obtain the OBs. Most OBs can be extracted using an aqueous medium or an organic solvent, mainly hexane. The key difference is that in the first case, an oil-in-water emulsion is obtained, with intact or partially disrupted OBs, while a solution of oil in an organic solvent is produced in the second case, with a remarkable impact on health and environment [23]. An aqueous extraction method consists usually of a series of mechanical steps. Usually, the first step is the wet grinding in which the seeds are homogenised in a medium, and in a second step, the slurry is filtered. The filtrate is centrifuged appropriately. Successively, an upper layer called “cream” is recovered, resuspended in a fresh medium and washed by a further centrifugation step [24].
Here, for the first time, the olive paste was used as a raw material for the extraction. Olive paste is an intermediate in the olive oil production process obtained by milling olive drupes. First, we performed OBs extraction using a conventional extraction aqueous method broadly used for oleaginous seeds [24], by adapting it for our raw material. Thus, we defined a first extraction method for the olive paste, so-called “Method 1”. Despite the improvements applied, comparing it to the patent protocol [24], Method 1 was time-consuming and hence not so competitive for a desirable scenario of an industrial application. Afterwards, we were successful in defining an extremely rapid and simple protocol in order to define an enhanced method specific for olive paste, called “Method 2”.
Plainly, we chose the faster and easier method to extract the OBs and then we made a full characterisation and conducted a morphological analysis of its extracted cream. In other words, our goal was to define a simple extraction method for obtaining the “cream”, which might be adopted in the manufacture of novel food products by substituting the oil/fat droplets of the traditionally prepared food product with oil droplets naturally emulsified. Due to the proteins present in the OBs, it may be possible to use them as emulsifiers. Moreover, we have re-evaluated an intermediate product (i.e., the olive paste) as a raw and key material for an innovative process such as OBs extraction. We believe that the OBs could be used as emulsifiers in the food emulsion industries to prepare mayonnaise and whipping and cooking creams.

2. Materials and Methods

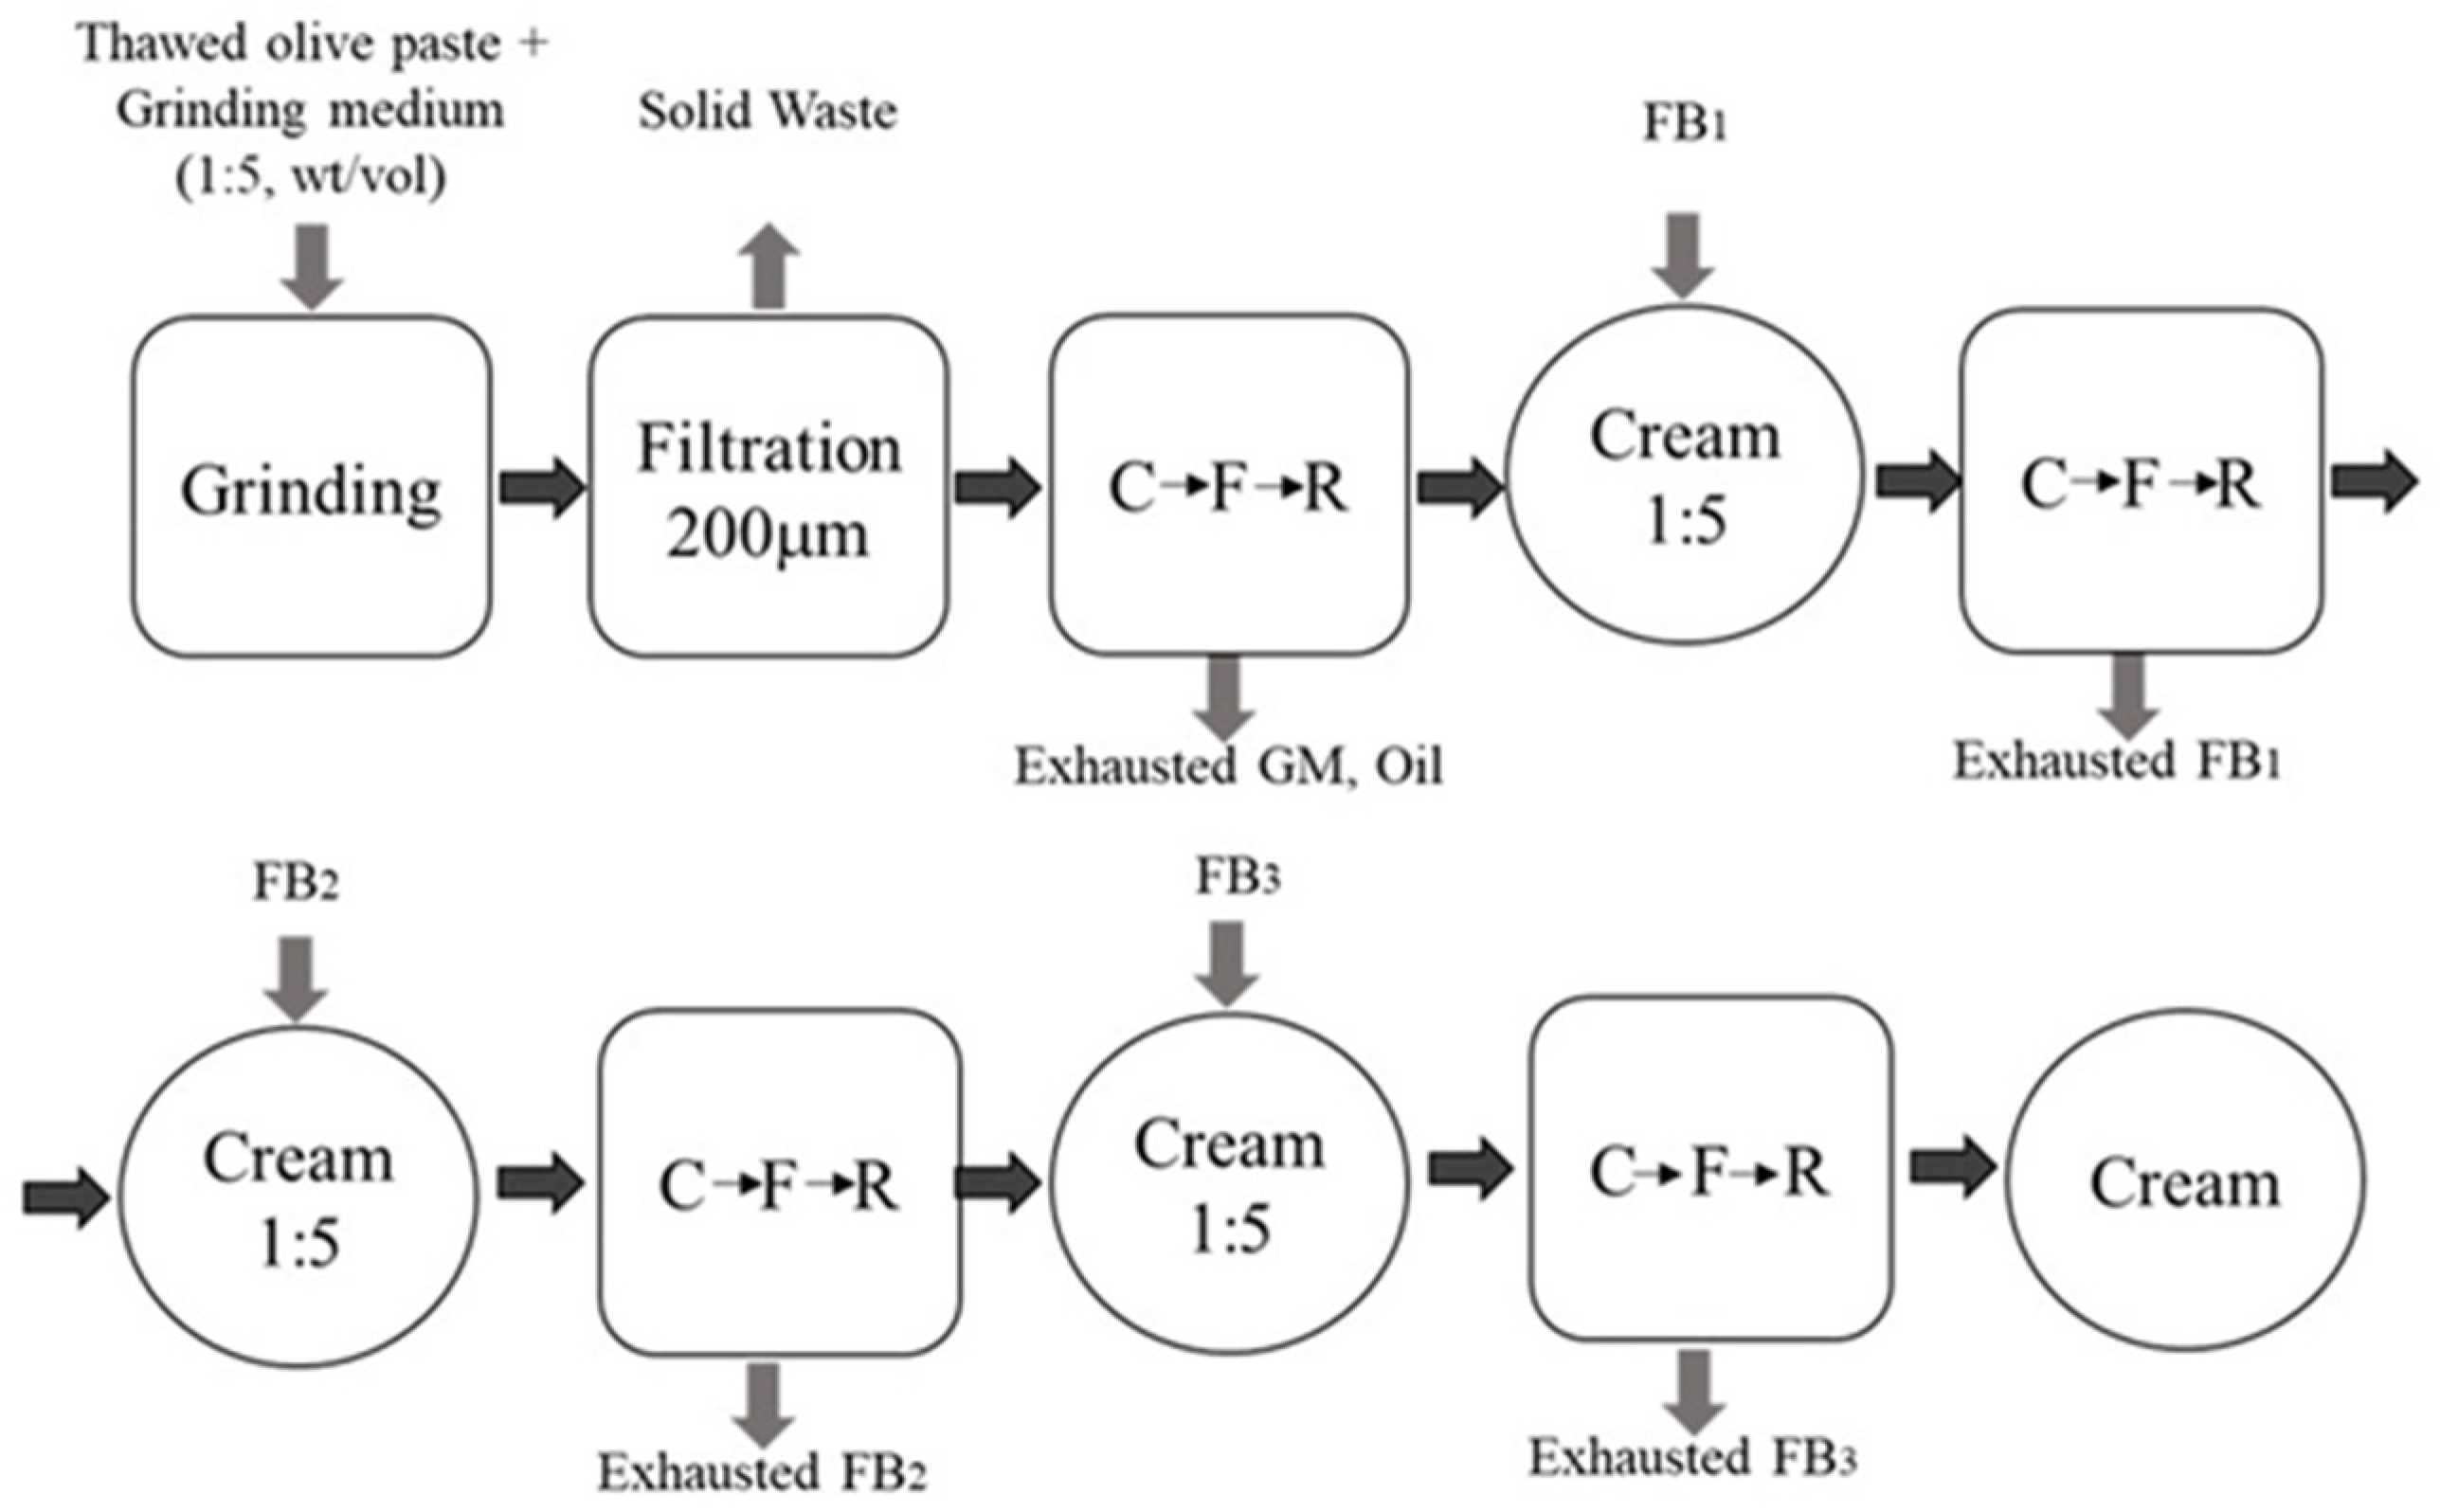
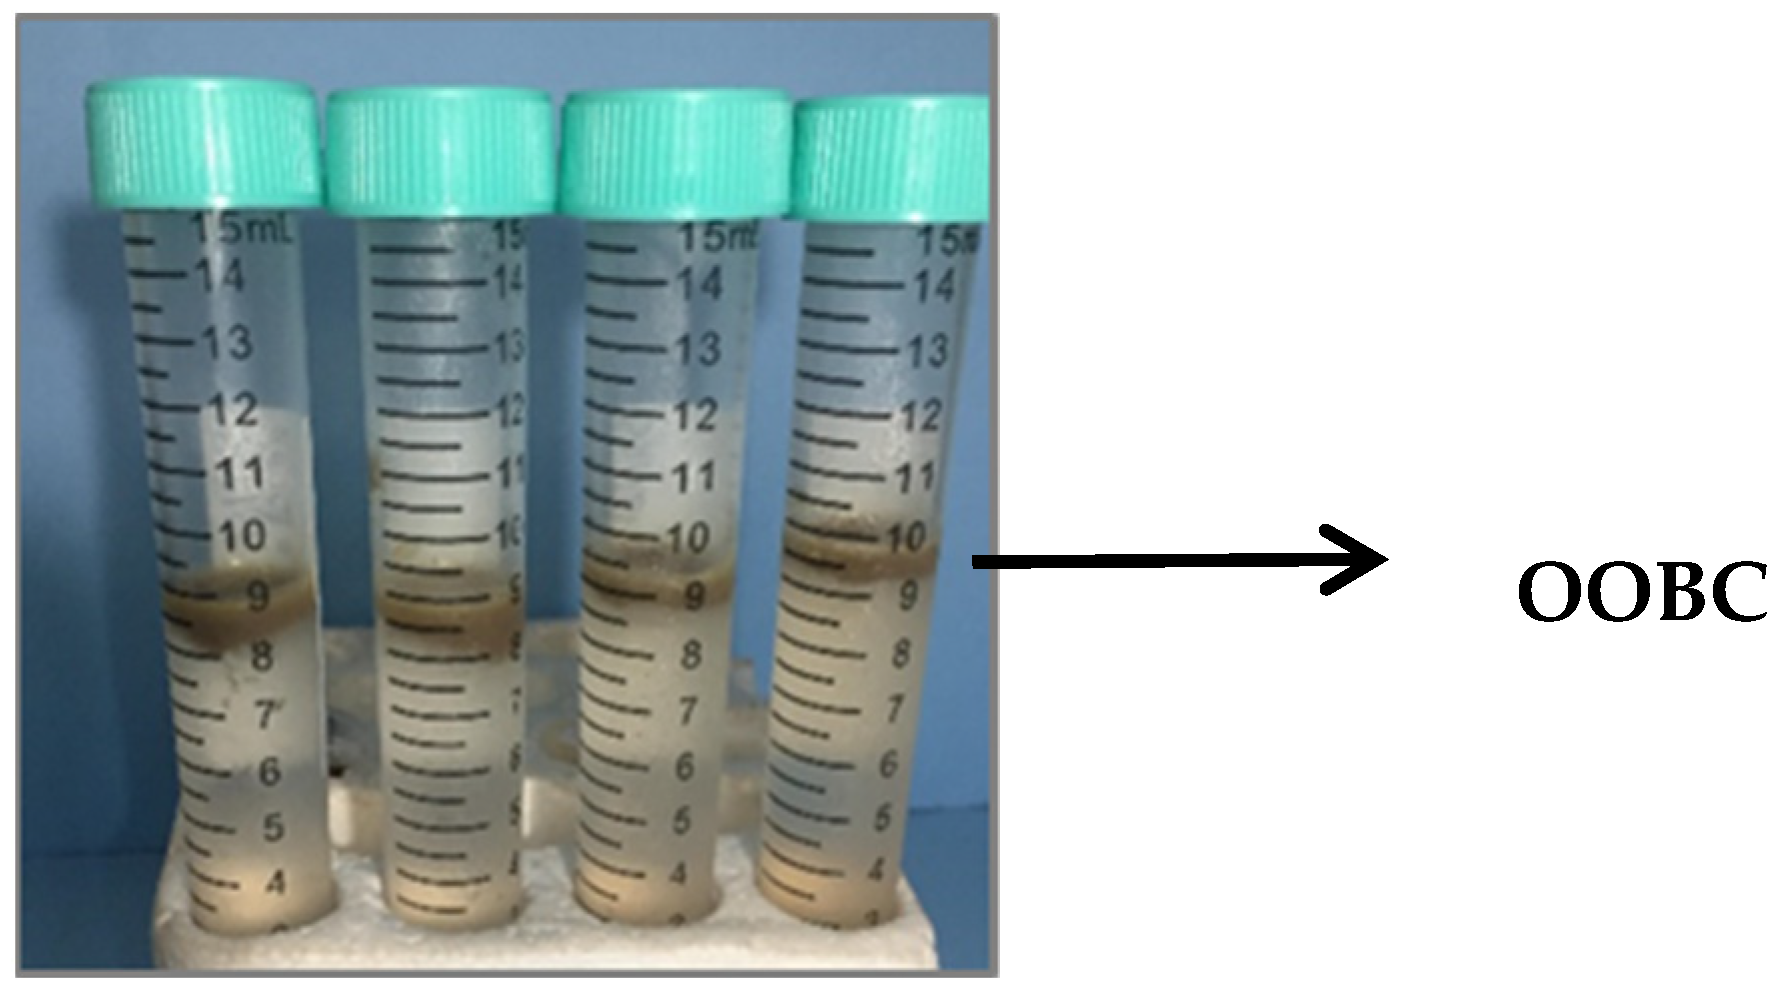
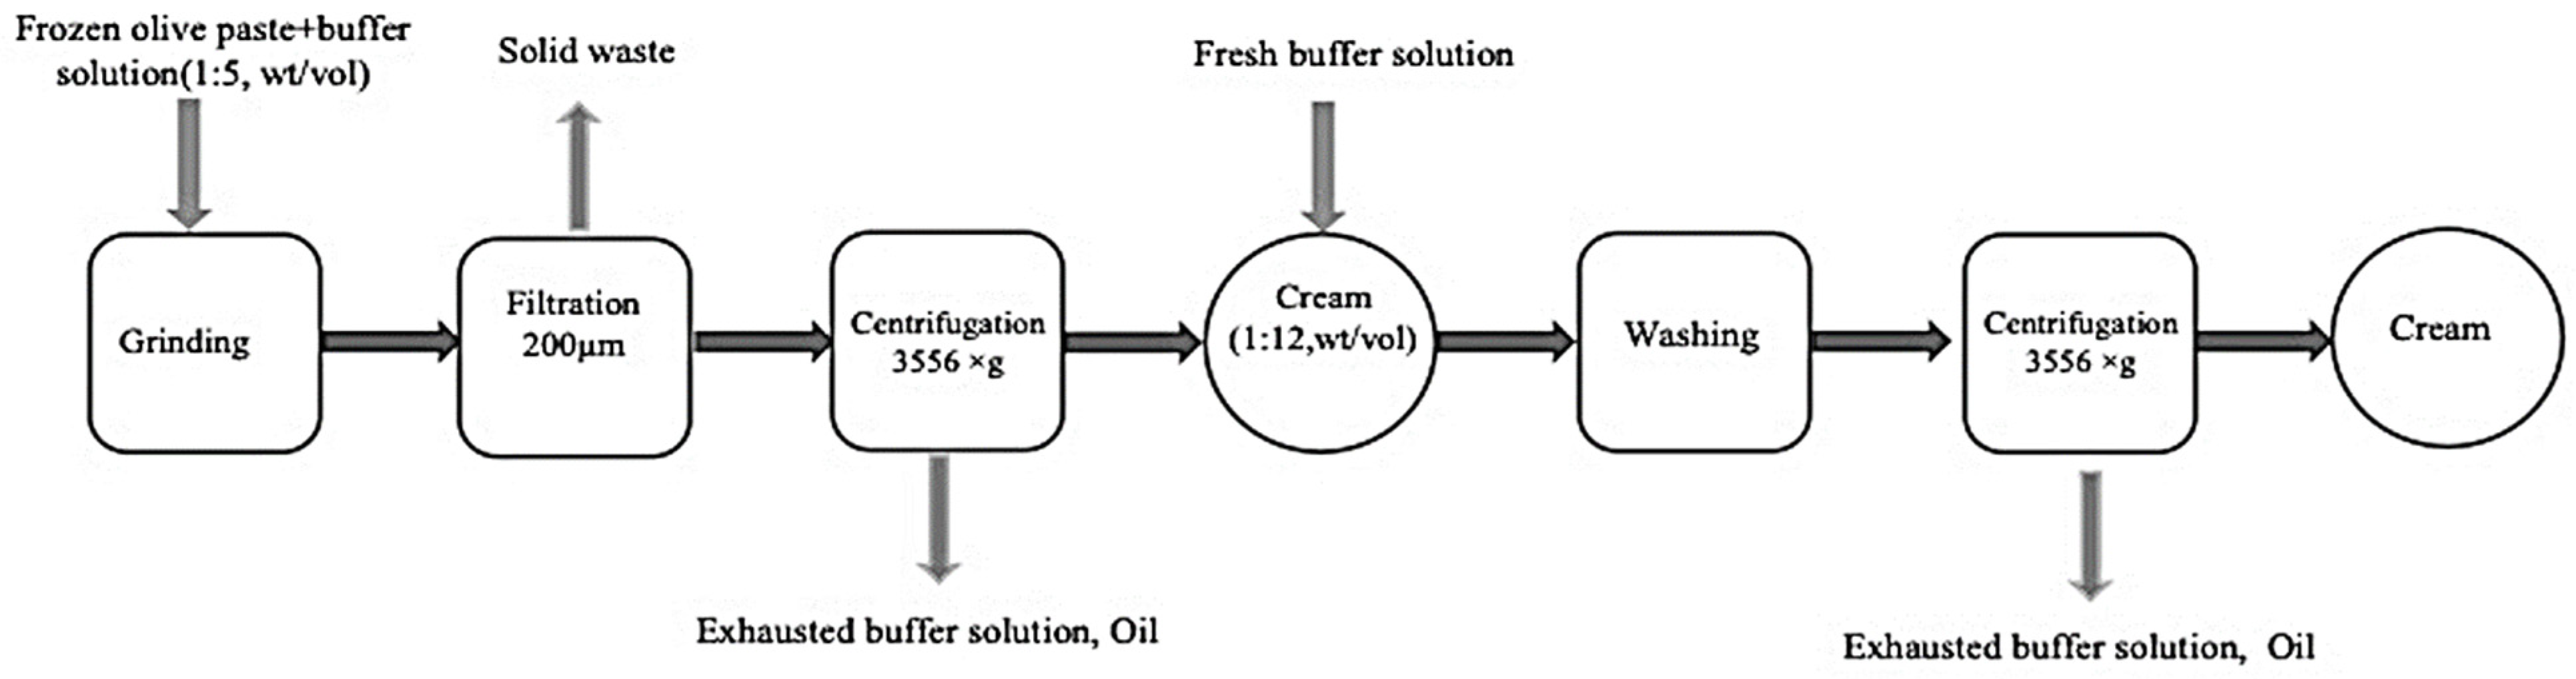
2.1. Extraction of Olive Oil Bodies

Olive paste (OP) from Leccino cultivar drupes, provided by the National Research Council—Institute for Agricultural and Forest Systems in the Mediterranean (CNR-ISAFoM) based in Perugia (Italy), was used to extract the OOBC (Olive Oil Bodies Cream) containing OBs. The OP was delivered frozen and stored at −20 °C before the experiments. The reagents used in the extraction process were: Sucrose BioUltra > 99.5%, Sodium Chloride BioUltra > 99.5%, citric acid monohydrate 99.5% and sodium hydroxide 98%. All the reagents were purchased from Merck. First, we applied an extraction protocol with some modifications which was borrowed from the patent WO2007115899 A1 [24] filed for oleaginous seeds using a sucrose/sodium chloride aqueous buffer. The patented protocol consists of four main steps. First, we performed wet grinding of the raw material by using a solution of water and sucrose at 0.6 M (grinding medium, GM, obtained by Mixer type XB98, Ceado, Venezia, Italy). The following three steps were carried out using three different floating buffers, which were aqueous solutions of sucrose and sodium chloride. Specifically, these floating buffers were FB1 (0.2 M sucrose, 1 M NaCl), FB2 (0.1 M sucrose, 1 M NaCl) and FB3 (0.2 M NaCl) [24]. Each suspension was mixed for 2 min to obtain a homogeneous suspension (by Professional Thermal mixer HotmixPRO Combi Cold, Combi, Italy), and then centrifuged at 3226× g for 40 min [24]. After each centrifugation, the cream (solid layer) was separated and resuspended in the next FB. Subsequently, in the last centrifugation step, the OOBC were extracted. Based on the patent held by Beindorff et al. [24], a new protocol was developed for the OP, optimising the composition of the grinding and buffer solutions and the operative steps to maximise the extraction yield. We called this first new protocol “Method 1”. Taking into account the results of Method 1, we defined a second novel extraction protocol, so-called “Method 2”. The protocol extractions were repeated three times. The yield was evaluated as the ratio between the total weight of the extracted product and the initial weight of the olive paste:
Yield, wt.% = Wf(product)/Wi(raw material)

2.2. OOBC Characterisations

The OOBC was stored at 4 °C for 24 h, after the following analyses in triplicate were performed.

2.2.1. Proximate Composition

We measured the water content, oil content and protein content of the OOBC. The water content was determined using a thermo-balance (DBS 60-3, Kern, Balingen, Germany), setting the drying temperature at 60 °C. The oil content was determined using a continuous soxhlet extractor filled with 40 g of the dried OOBC and 100 mL of n-hexane. The lipid extraction time was 6 h [25]. The total protein content of dried and defatted OBs was determined using the Bradford assay method [26]. The concentration of proteins was determined using a UV–visible spectrophotometer (Cary 50, Varian, Agilent Technologies, Santa Clara, CA, USA) at 595 nm. As the standard, we used bovine serum albumin (BSA) in a concentration range of 0.1–1.4 mg/mL [25].

2.2.2. Concentration of Polyphenols

We diluted the OOBC (1 g) in methanol (8 mL) and gently mixed it for 12 h at 23 °C in tubes sealed with paraffin to avoid evaporation then we centrifugated at 2000× g for 10 min, these steps are the “methanolic extraction” [6]. Afterwards, we followed the method suggested by Kim et al. [27] with minor modifications. We collected 1 mL of the supernatant and mixed it with 300 μL of Folin–Ciocalteu reagent and with 1 mL of sodium carbonate 99% (7.5% w/v) and deionised water to reach a total volume of 10 mL [27]. We determined the concentration of polyphenols by reading the absorbance curve with the UV–visible spectrophotometer at 765 nm, using gallic acid as a reference in the range of 4.00–25.00 μg/mL [27]. The total concentration of polyphenols are expressed as milligrams of gallic acid equivalent per gram of OOBC dry weight (mgGAE/gdry).

2.2.3. Concentration of Flavonoids

As for polyphenols, the first step is the “methanolic extraction” [6]. Following the method defined by Woisky et al. [28] with minor modifications, we mixed 1 mL of the supernatant with 0.500 μL of aluminium chloride 99.9% (2% w/v) and deionised water to reach a total volume of 10 mL, and we incubated the solution for 30 min in a dark place and then read the absorbance using the UV–visible spectrophotometer at 420 nm. We used the flavonoid quantification with quercetin as the standard, with a concentration between 4.00 and 20.00 μg/mL [28]. We expressed the total concentration of flavonoids as milligrams of quercetin equivalent per gram of OOBC dry weight (mgQE/gdry).

2.2.4. Antioxidant Power

Starting with “methanolic extraction”, the antioxidant power (AP) was determined using the ferric reducing ability of plasma (FRAP) assay [29]. We adopted the method stated by Benzie et al. [29] with minor modifications. We mixed 1 mL of the supernatant with 1 mL of the FRAP reagent made as indicated in [29] and added distilled water to reach a total volume of 10 mL. We incubated the prepared solution for 5 min and recorded the absorbance with the UV–visible spectrophotometer at 593 nm. We measured the AP values using two different scales: Fe (II)-sulphate heptahydrate > 99% equivalents with concentration between 1 × 10⁻⁵ and 8 × 10⁻⁵ mmol/mL, and Trolox 97% equivalents with concentration between 1.2 × 10⁻⁵ and 6 × 10⁻⁵ mmol/mL were used as standard [29]. The AP are expressed as both millimoles of iron per gram of OOBC dry weight (millimolesFe/gdry) and milligrams of Trolox equivalent per gram of OOBC dry weight (mgTroloxE/gdry).

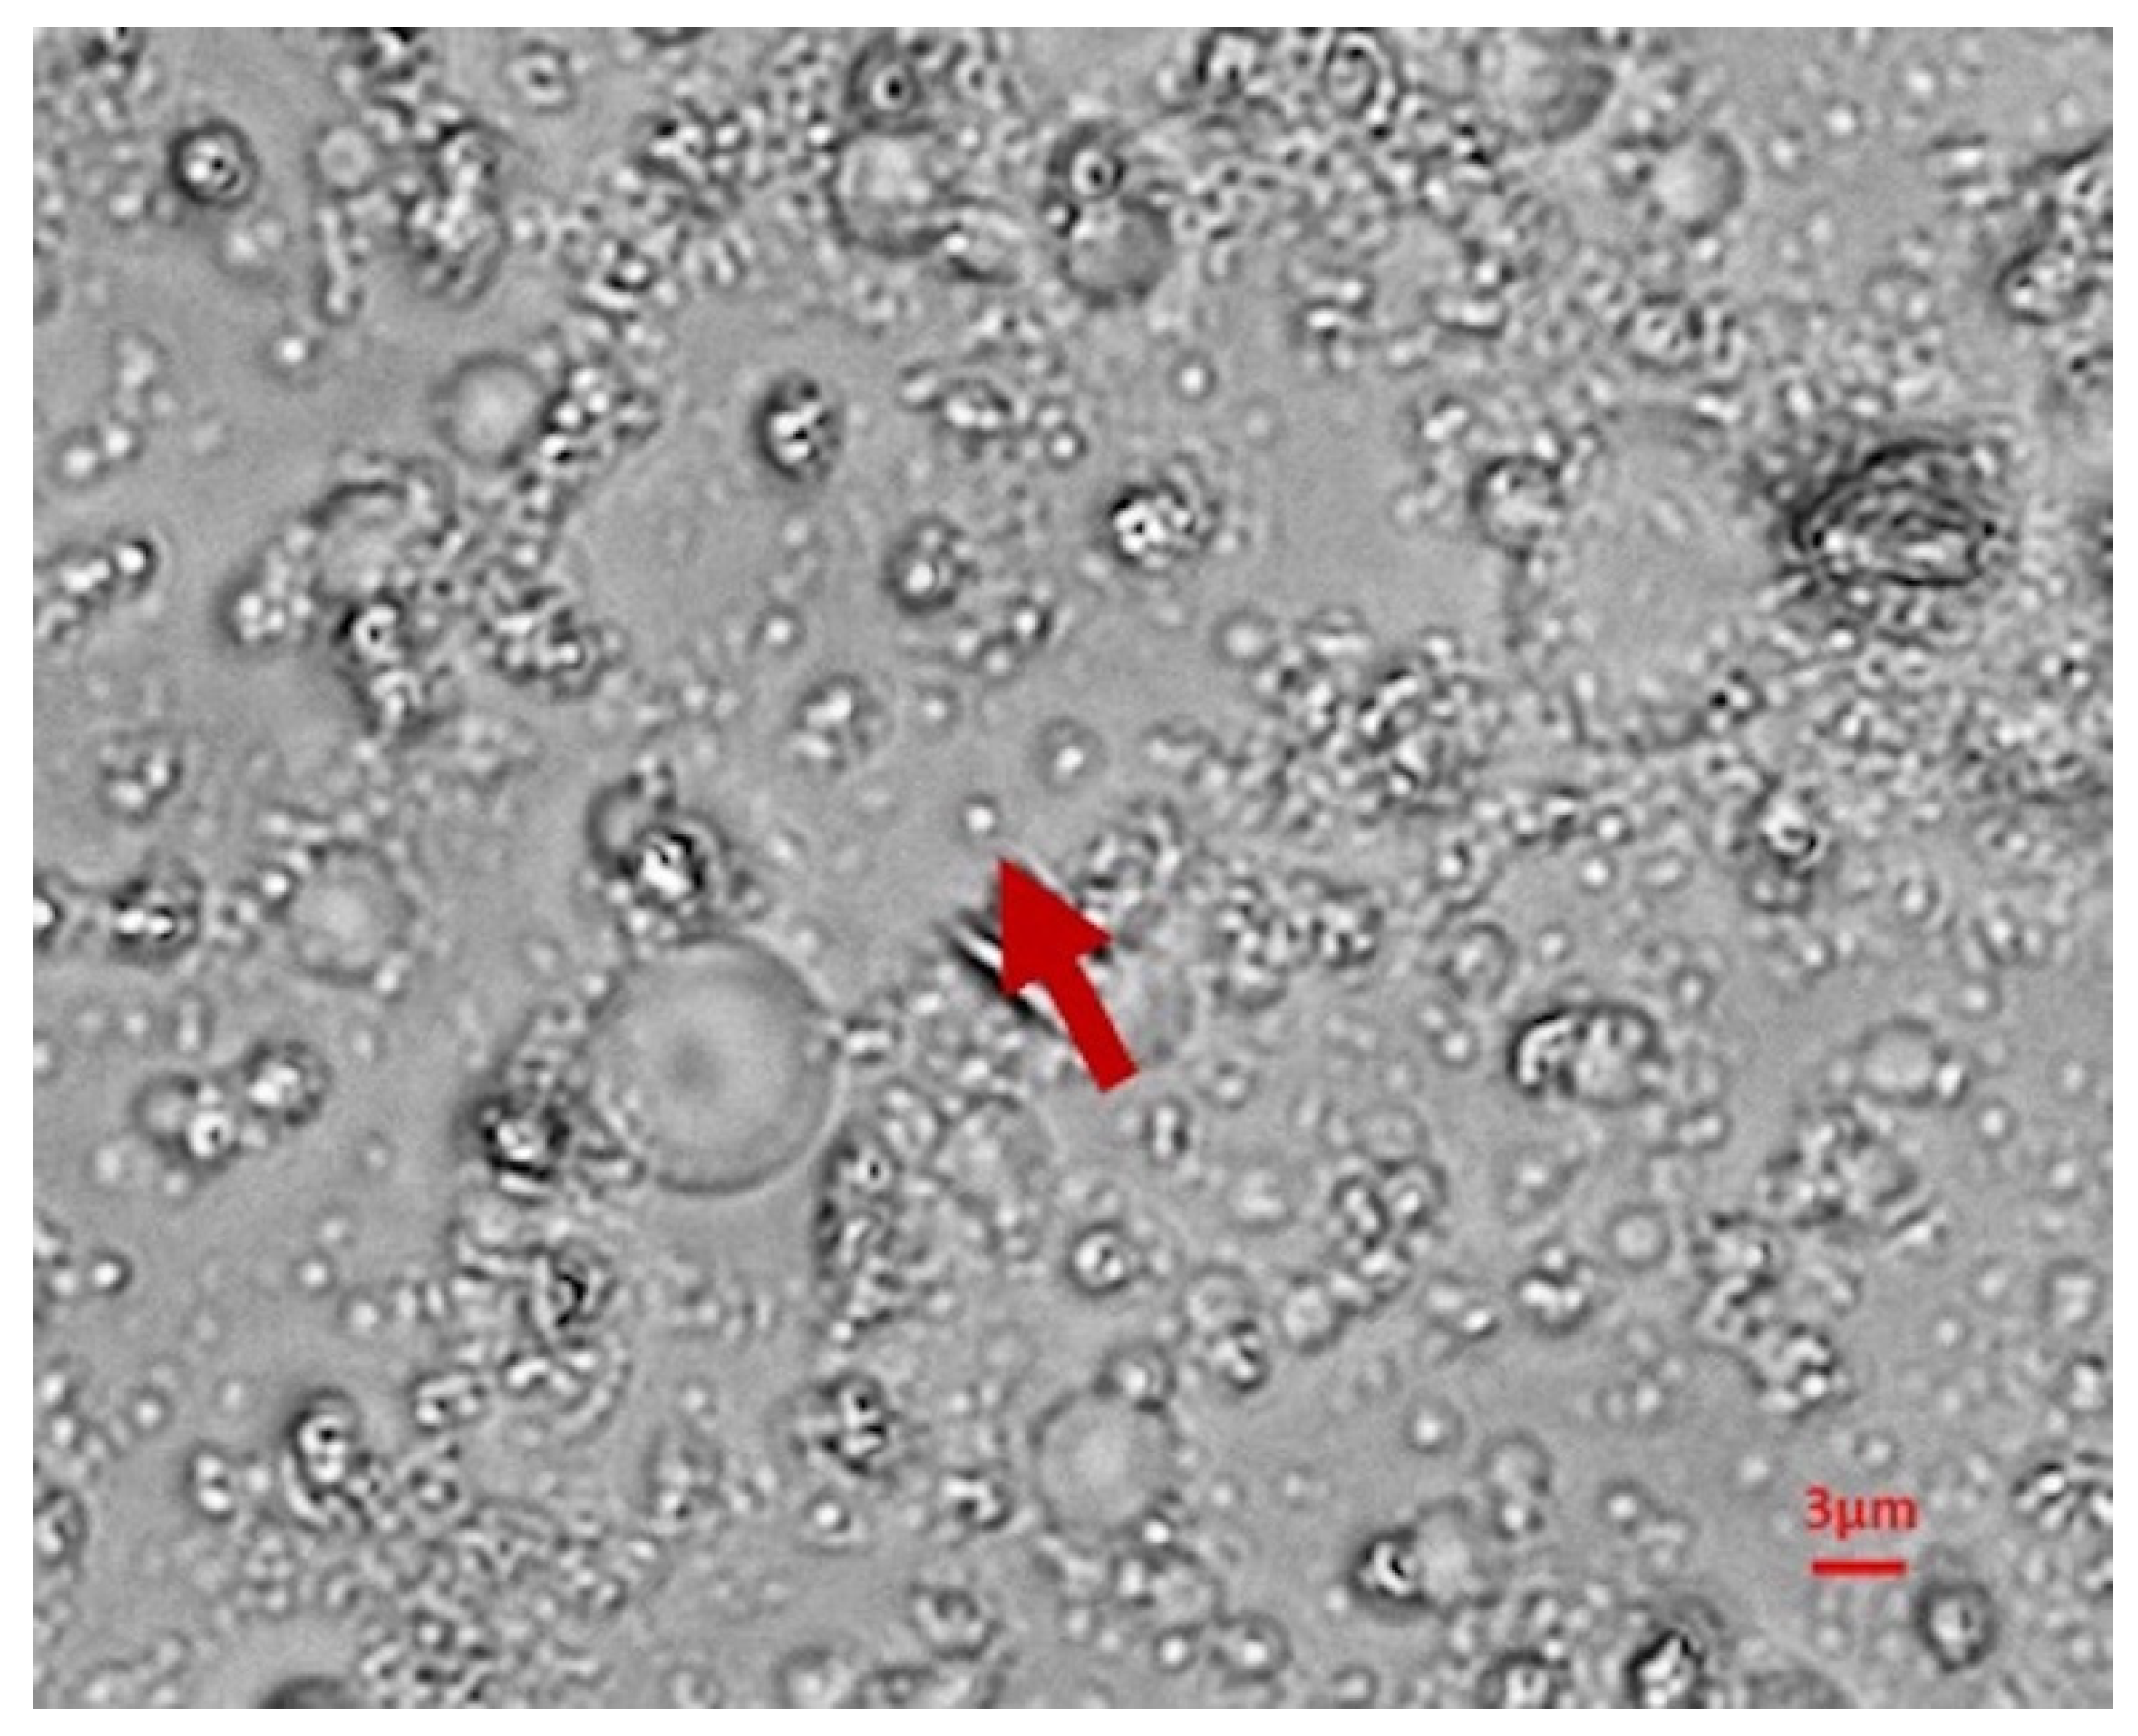
2.2.5. Size Determination and Morphological Analysis

The shape and the size of the OBs contained in the OOBC were determined using a Zeiss upright microscope (Axio Imager M1, Zeiss, Oberkochen, Germany) equipped with a 40× objective and used in the reflected light configuration. Taking into account that the OOBC had a creamy texture, we easily streaked it by using a pipette tip on an optical microscope slide, which was then placed on the mechanical stage of the microscope. Images of the layer of OOBC were recorded digitally and analysed using the Software Fiji-ImageJ (IJ2, Wayne Rasband, Bethesda, MD, USA) by adopting the “analyse particle function” and processing them using the Nobuyuki Otsu Method [30]. The Software Fiji-ImageJ allowed us to extrapolate the size and the shape data of the OBs, by calculating the diameter and the “circularity”, which indicates the OBs roundness. We were able to determine the particle size distribution of the OBs at 25 °C.

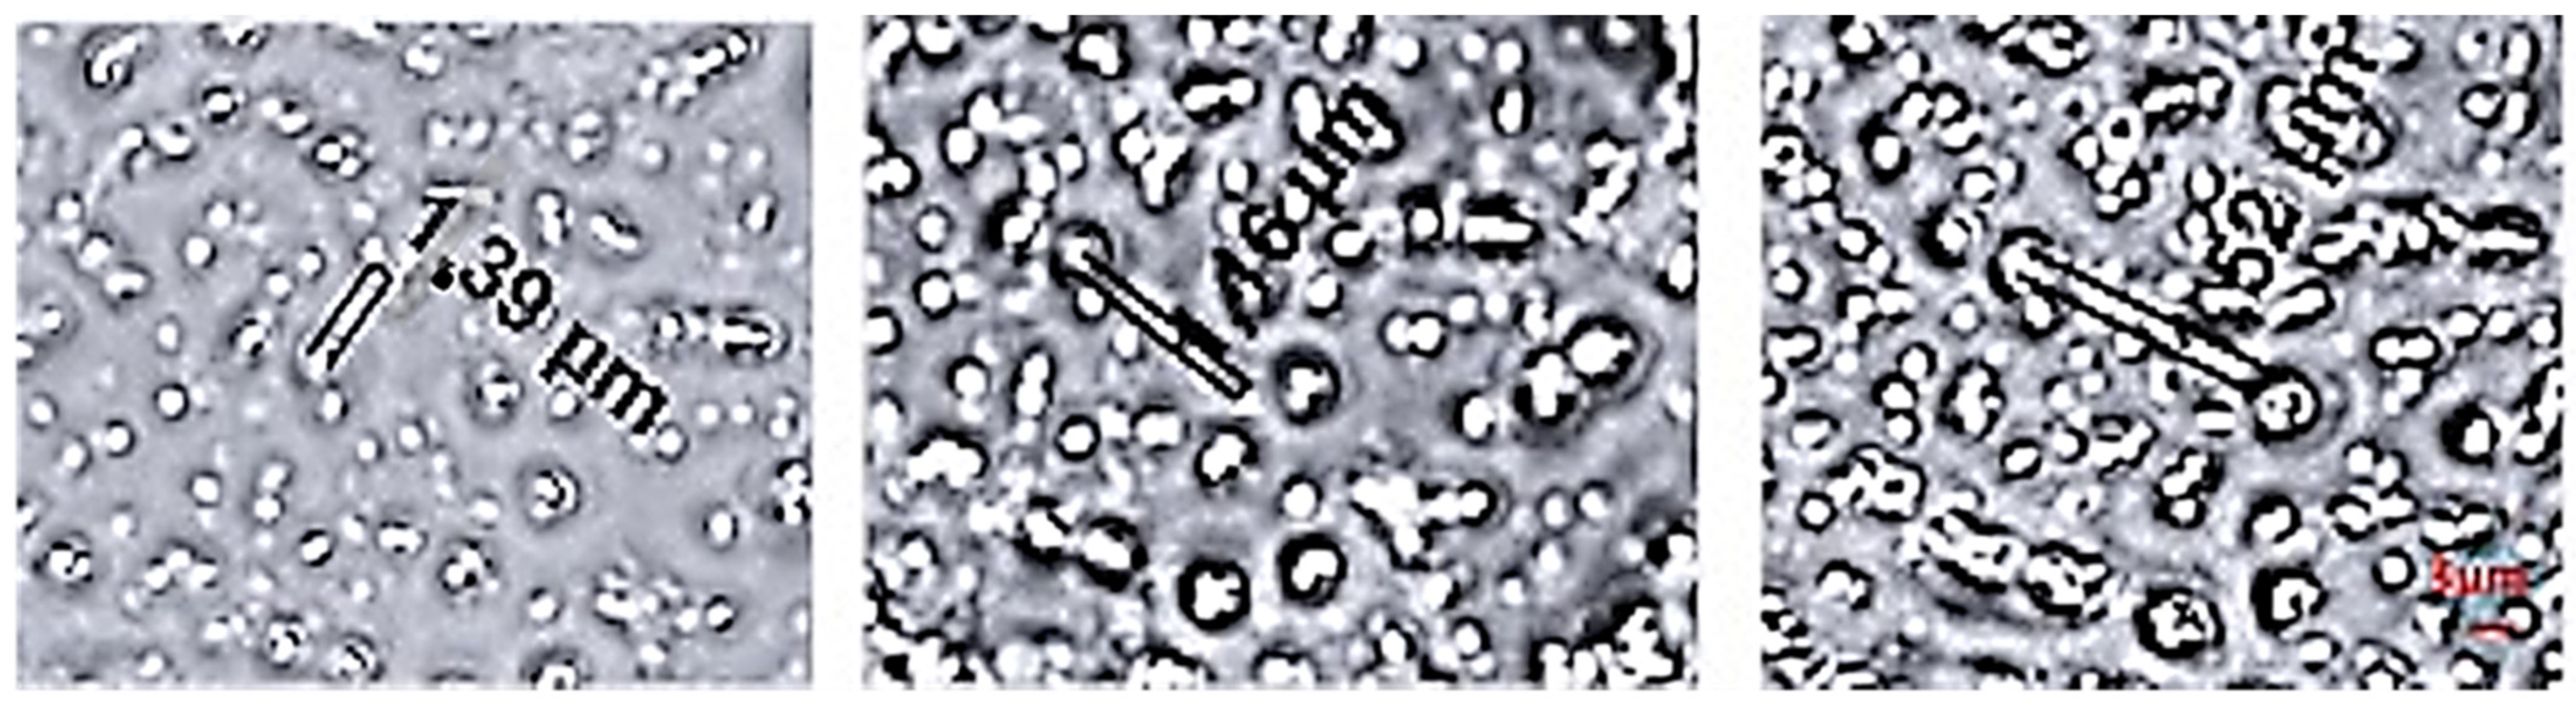
2.2.6. OBs Thermal Stability

The thermal stability of the OOBC containing the OBs was investigated by streaking a small amount of the OOBC on a microscope slide that was quickly placed on the temperature-controlled heating table (Hot Plate by Thermo Fisher, Waltham, MA, USA). After reaching the set temperature (50, 100, 150, 200 °C), the OOBC sample was held for about 10 min at this temperature and then placed on the microscope stage for the size determination and morphological analysis using the same procedure as described in Section 2.2.5 above.

2.3. Statistical Analysis

The OBs diameters recorded at the temperatures of 25, 50, 100, 150, 200 °C were determined as described in Section 2.2.5 and Section 2.2.6. Then, they were analysed with descriptive statistics. Thus, we evaluated the first percentiles, the third percentiles, the medians, the means, the standard deviations, and the minimum and maximum values of the diameters, which were recorded at the above-mentioned temperatures. Consequently, we determined the box plots of the particle size distribution at 25, 50, 100, 150, 200 °C. The characteristics of the OBs distribution were also evaluated according to the values D10, D50 and D90 (D is OBs diameter). D50, the median, is defined as the diameter where half of the population lies below this value. Similarly, 90% of the distribution lies below D90, and 10% of the population lies below D10. Additionally, we evaluated the means and the standard deviations of the circularity values. Moreover, we performed statistical tests on the OBs diameters collected in five groups corresponding to the five temperatures. The aims of these statistical tests were to assess significance and to verify if there were differences among the groups. First, the data were analysed by means of a normality test. The normality was checked using the Shapiro–Wilk test. Taking into account the Shapiro–Wilk results, we selected the non-parametric Kruskal–Wallis test for comparing the diameter groups obtained at each temperature. Furthermore, to identify which groups were different, a multiple comparison procedure with the Dunn test was applied. The tests were performed with the Bonferroni correction and were performed with Excel (version 16.37).

2.4. OOBC Stability Assessment

We performed one cycle of centrifugation in a 15 mL Falcon tube at 2064× g and at 25 °C. We measured the height of the two layers of liquid arising on top of the solid fraction (the cream), corresponding to the oil phase (above) and the water phase (below). The number of centrifugation steps depended on when the constancy of the stability index was attained. This approach has been adopted by some food industries to evaluate the stability of food emulsions (e.g., cooking cream, whipping cream). We performed this analysis on the OOBC freshly extracted (OOBC untreated, OOBC-U) and on the OOBC heated (OOBC-H) in a microwave oven (MWF 427 SL, Whirlpool, Benton Harbor, MI, USA) for 20 s, reaching a temperature of 70 °C. Then, we cooled the sample at room temperature before performing the stability assessment. We determined the stability index% ( S i ) [25] as defined in Equation (2):
S i = H s H t × 100
where Hs is the sum of the heights of the upper and lower layers measured after each centrifugation, and Ht is the total height of the product in the container.

2.5. Rheological Measurements

The OBs are naturally emulsified and are hence suitable for the preparation of commercial food emulsions such as mayonnaise. Therefore, in order to prove that the OBs can substitute both the oil/fat droplets of a traditionally prepared food product as well as the emulsifier, i.e., the egg yolk in the mayonnaise, we compared the rheological behaviour of the OOBC with that of the mayonnaise. We used a rotational rheometer (MCR 102, Anton Paar, Graz, Austria) with a cone-plate geometry (D = 50 mm, α = 1°). The samples were placed on the rotational rheometer in a standardized manner and were kept standing before measurements at the initial measurement temperatures for 1 min. To keep the samples at the chosen temperature, we used a temperature cover which prevents evaporation. We performed three different tests: the flow curves, the thermal flow curve ramp and the amplitude and frequency sweep.

2.5.1. Viscosity

The flow curve is a graphical representation of fluid viscosity when it is subjected to increasing or decreasing shear rates [31]. We tested the OOBCs’ viscosities at t0 (OOBC freshly extracted) and at t1 (OOBC after 10 days at 4 °C), as well as the commercial mayonnaise viscosity. We performed the flow curve tests using a shear rate range of 0.1–100 s−1 fixing the temperature at 25 °C for all tests, and then, we plotted the viscosity trend against shear rate.

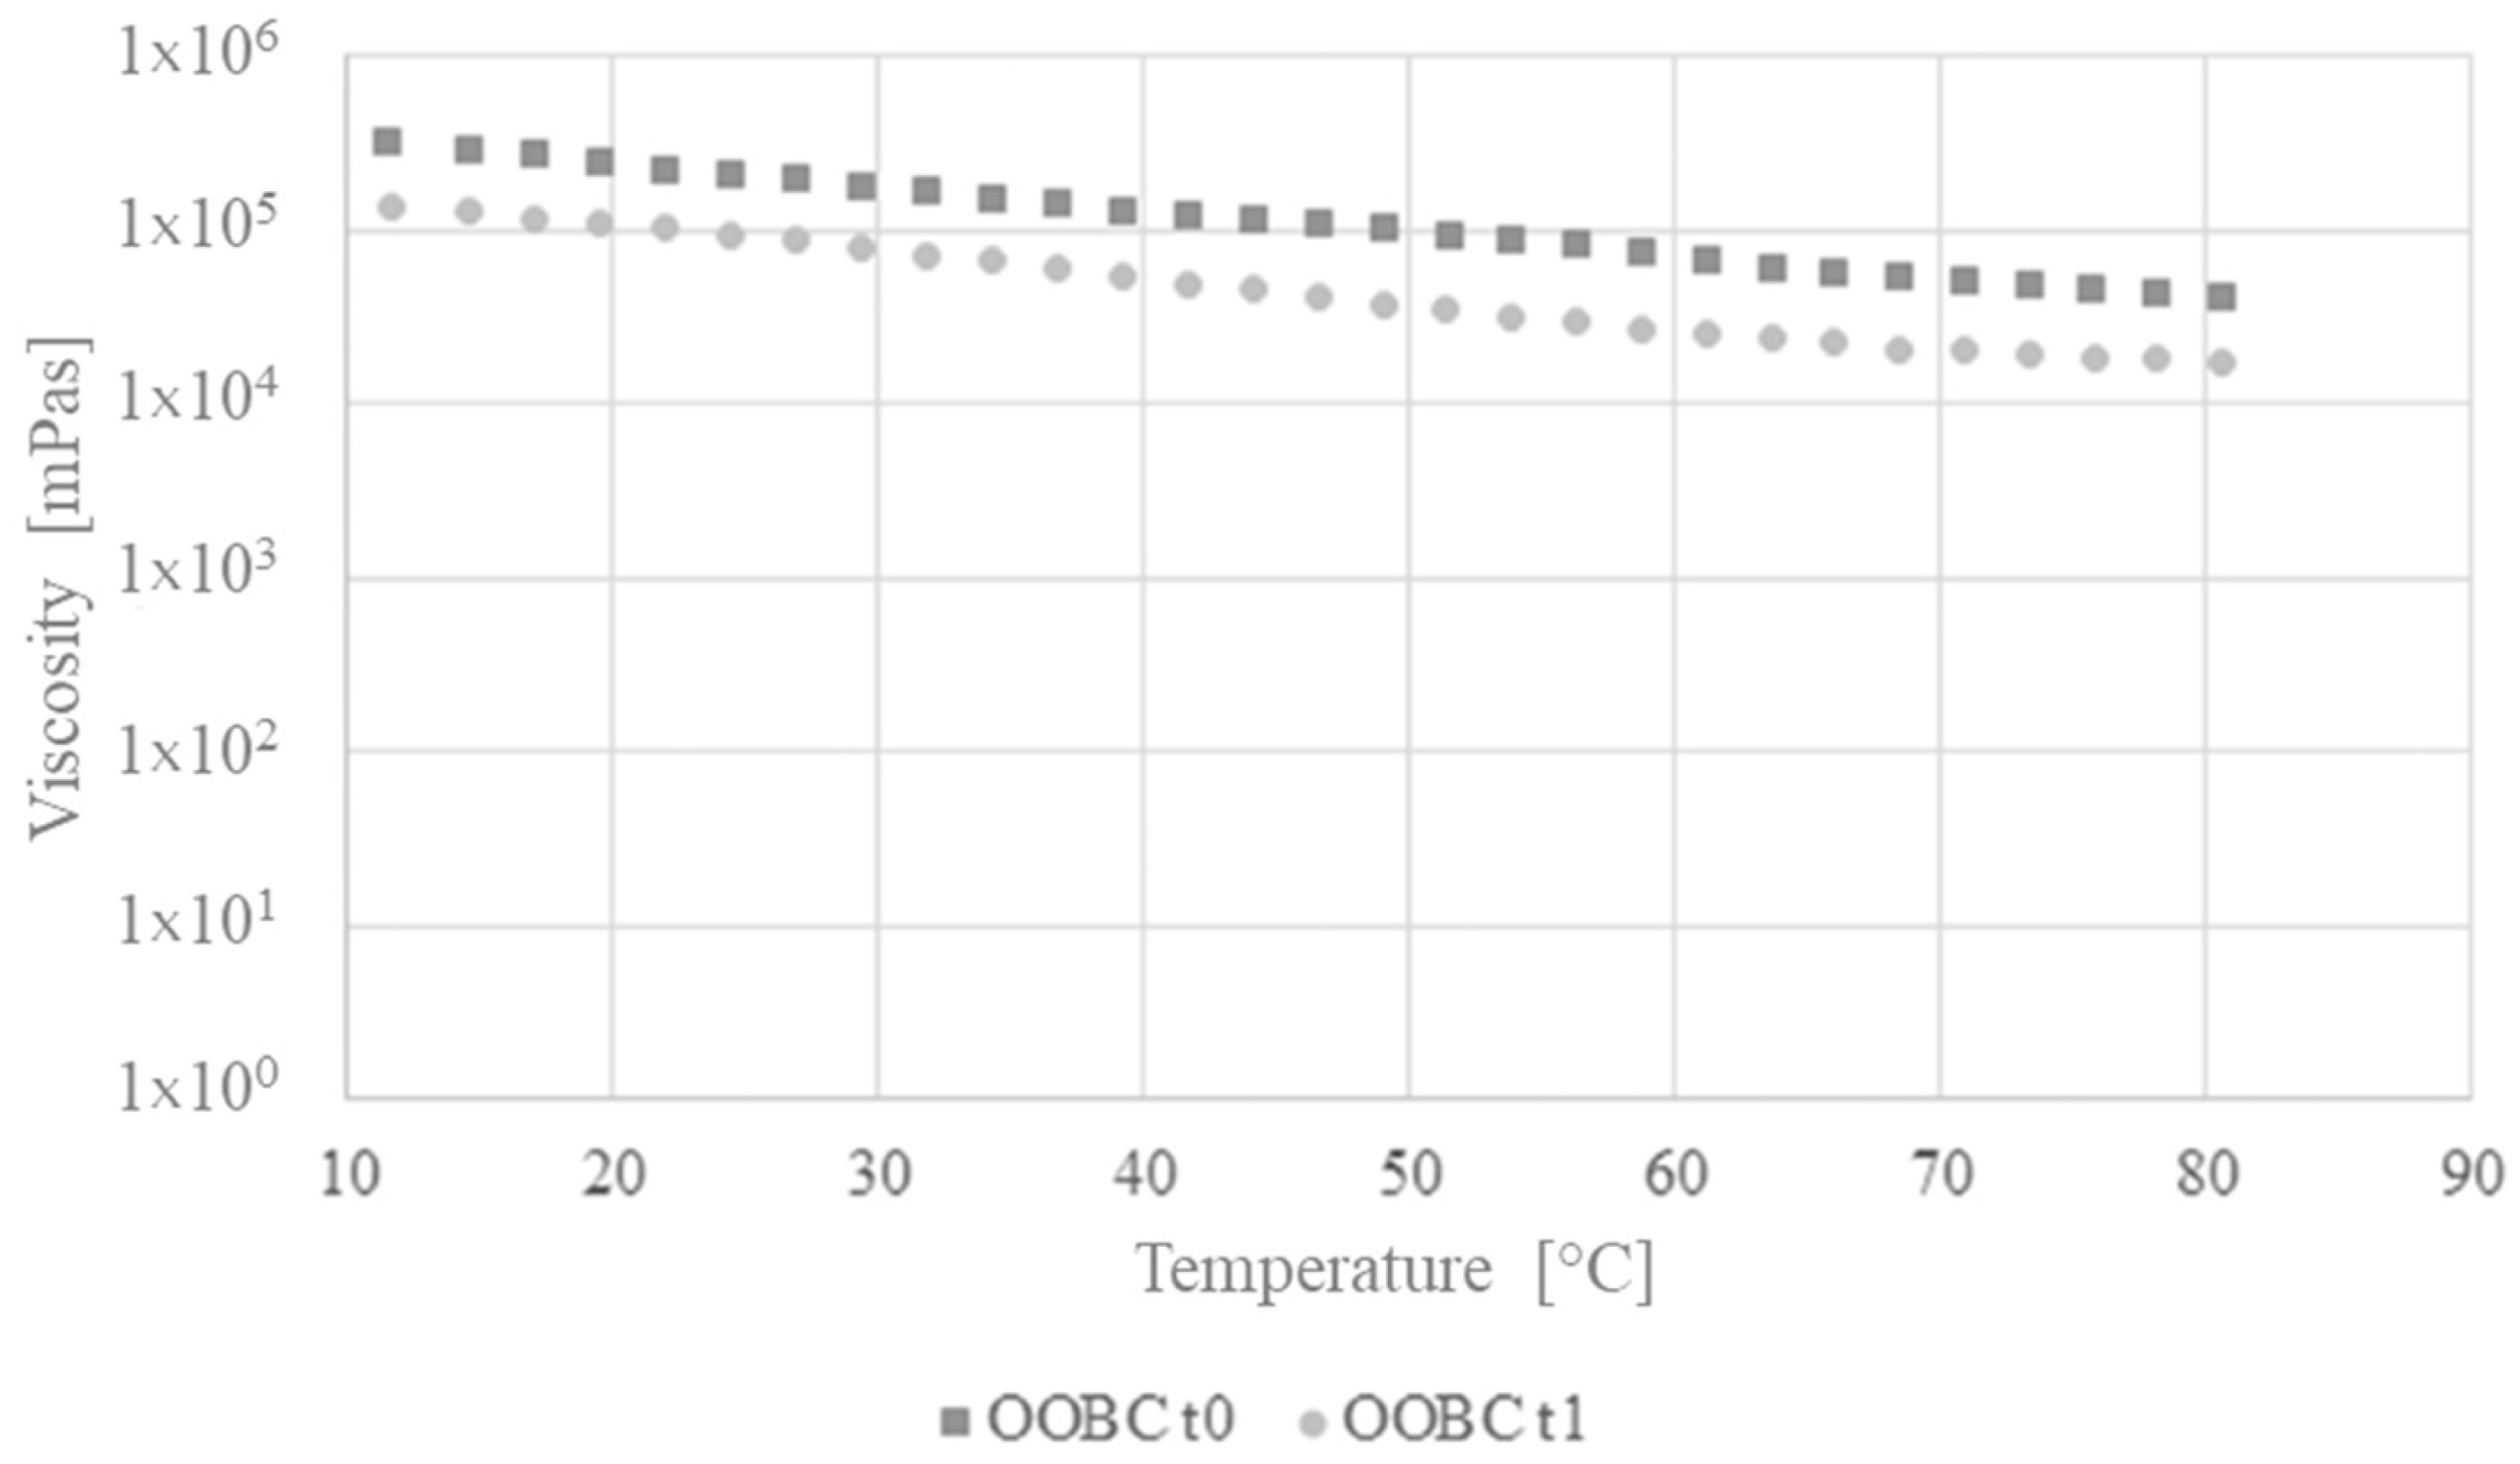
2.5.2. Thermal Flow Curve

Moreover, we investigated the OBs samples’ behaviour under an increasing temperature with the Thermal flow curve ramp within a range of 10–80 °C to evaluate the viscosity change with a heating velocity of 10 °C/min. Additionally, these curves were performed at 0.2% of strain and at a frequency of 1 rad/s. The stress data are collected during the analysis of the flow curve tests. The rheometer automatically shows viscosity and stress curves as well. According to the literature, we assumed that the yield stress is the lowest shear-stress value above which the behaviour of a certain material resembles a fluid and below which it resembles a solid [32].

2.5.3. Amplitude and Frequency Sweep

First, we performed the amplitude sweep test in order to evaluate the linear viscoelastic region. Second, with the frequency sweep, we investigated the differences in viscoelasticity by evaluating and comparing G′ (storage modulus) and G″ (loss modulus) at a constant strain of 1%, which was chosen because it is a value representative of the linear viscoelastic region previously evaluated.

2.6. Tribological Measurements—Stribeck Curve

Tribological tests describe the behaviour of a certain material during the transformation in bolus, and we used them to obtain the Stribeck Curve, giving the friction coefficient of OBs. This curve has been measured using the tribology cell T-PTD 200 mounted on a rotational rheometer (Anton Paar MCR 102). The probe is equipped with a glass sphere that simulates the tongue and PDMA pins that resemble a palate in the mouth [33,34]. This curve is divided into three regions: the boundary regime, the mixed regime and the hydrodynamic regime, which represent different friction scenarios and, in the case of oral processing, different amounts of food sample between the tongue and palate [31].
We achieved tribological tests on the OOBC at room temperature, comparing the behaviour of fresh and conserved OOBC (10 days at 4 °C) to a commercial mayonnaise. The analyses were performed at constant pressure between the glass sphere and the pins at a value of 1 N [33], varying the sliding velocity in the range from 1 × 10⁻⁹ to 1 × 10⁻¹ m/s.

3. Results and Discussion

3.1. Olive Oil Bodies Extraction

The patented protocol, mentioned above, was properly adapted to the OP by applying some modifications described in the following. First, the raw material was stored at −20 °C rather than at 25 °C, as suggested in the patent protocol for the oleaginous seeds [24]. This step was necessary to eliminate the issues linked to the seasonality of the product, which could lead to excessive process stress, and to achieve a facile separation of the free lipid fraction, here called oil, of the olive paste and water phases from the solid using cryoconcentration. Before the extraction, we thawed and homogenised the OP (40 g) in 200 mL of the GM. We chose to reduce the wt/vol ratio of the OP/GM at 1:5 instead of at 1:10 [24], because it is more suitable for olive-based raw materials [35].
Applying the protocol stated by Beindorff et al. [24], consisting of the repeated dilution of the cream collected in the three different liquid buffers (FB1, FB2, FB3), we obtained no separation of the solid phase from the liquid phase. This behaviour is due to a low difference in density between the liquid solution and solid material and an unsuitable pH. Owing to the low extraction yield obtained, we proceeded to define a new, called Method 1, described in the following. First, we increased the concentration of the solutes in GM, FB1, FB2 and FB3 to improve the density difference between the solid and the liquid phases, as suggested for the separation of liquid and solid phases in the case of olives [35,36]. Therefore, the compositions of the GM and of the FBs which we used were: GM (1.2 M sucrose), FB1 (0.8 M sucrose, 1 M NaCl), FB2 (0.4 M sucrose, 1 M NaCl), FB3 (3.2 M NaCl).
The pH of the suspensions was almost constant at 5.4. After each dispersion step, the suspension was centrifuged at 4 °C, 3226× g for 40 min [24]. The initial composition of the olive paste was 20%. After the first extraction step, the yield was 32%, to follow, in the case of the others extraction steps, the yields were 30%, 25%, and finally a yield of 21.4% was measured at the end of the extraction process.
After each centrifugation step, the liquid phase, below the cream containing the OBs, showed a cloudy appearance, highlighting small, suspended solid particles. To eliminate this phenomenon, after each centrifugation step, we introduced a novel step in the extraction protocol reported in the patent [24], called freezing. The container with the partially separated suspension was frozen at −20 °C, thus increasing the collection of OBs by more than two-fold. We recovered the cream and threw away the oil (i.e., the free lipid fraction of the olive paste). Each freezing step lasted about 3 h, resulting in an almost total recovery of solid fraction in the container. Figure 1 summarises the main steps of the new extraction, Method 1.
After the last step of the extraction protocol (see Figure 1), we obtained the cream here called OOBC. As we have stated before, the extraction protocol drives the formation of an upper layer with a creamy texture. Figure 2 illustrates the OOBC extracted.
Although the protocol described above yields high extraction efficiencies (47.5%), it is time-consuming (the extraction time was at least 1 week) and is therefore not ideal for industrial applications.
Considering these limitations, efforts were expended to determine a new, easy, and quick extraction method which we called Method 2. The outstanding novelty was that we exclusively used one buffer solution in the whole extraction process, whereas Method 1 needs GM, FB1, FB2 and FB3. This buffer solution had suitable chemical–physical characteristics such as reagents used, pH and density. Due to them, we were able to use it in the grinding and in the subsequent centrifugation steps. The efficiency of the buffer solution (yields and capability of separating the different phases) allowed us to reduce the phases of the extraction processes as well as the time processes.
Since the difference in density between the phases present in the suspension [36] and the value of pH that obtained the isoelectric point of the suspension were identified as key elements for a high recovery of the OOBC, the composition of the buffer solution has been chosen to obtain a pH value of 6, which is the IEP as suggested by Georgialaky et al. [14]. The composition of the buffer solution which we formulated is: sucrose 27.4%, citric acid monohydrate 5.2%, and sodium hydroxide 2.4%. Figure 3 shows the flow chart of the new OBs extraction method.
We used 20 g of the OP frozen and 200 mL of the buffer solution, and we recovered 17 g of OBs equivalent to a yield of 43 wt.%. Moreover, using this method, the extraction time was 2 h. We were successful in defining a straightforward method by adopting a suitable extraction buffer solution which enabled us to work at the IEP. At pH 6, oil droplets aggregated [14], and the cream layer was denser and far easier to separate as a result of the coalescence of droplets [14,23].
Even though the Method 2 yield was slightly lower than for Method 1, it was much faster and simpler than Method 1 for the above-mentioned reasons (the extraction time, the buffers number needed). Taking into account the higher performances, we chose to carry on the subsequent analyses on the OOBC extracted from Method 2. The yields reported are mean values, and the extractions were repeated three times.

3.2. Proximate Composition

Table 1 summarises the OOBC composition in percentage form. The standard deviations are lower than 10%.
The OOBCs are mainly composed of water and lipids, and this enables us to consider them as O/W emulsions. The total protein is 6%, and the other compounds are mostly fibres and ash [16].

3.3. Polyphenols, Flavonoid Contents and Antioxidant Power

Table 2 reports the values of total polyphenols, total flavonoids and FRAP (Ferric reducing antioxidant power) power. This result suggests great potential since it reveals the capacity of the OOBC to improve human health against the action of free radicals and to enhance food preservation as well.
The value of total polyphenols shown in Table 2 is in line with that reported by Ninfali et al. [37] for extra virgin olive oil, indicating a concentration of total polyphenols for extra virgin olive oil in a range between 0.2 and 1.5 mgGAE/g. Ninfali et al. [37] and Sanchez et al. [38] reported values of the antioxidant power for extra virgin olive oil (EVOO) in ranges from 0.36 to 2.88 mgTroloxE/g and from 0.38 to 1.5 mgTroloxE/g, respectively. The emulsion produced presents a much higher value of AP (antioxidant power) measured for OOBC than for the extra virgin olive oil.

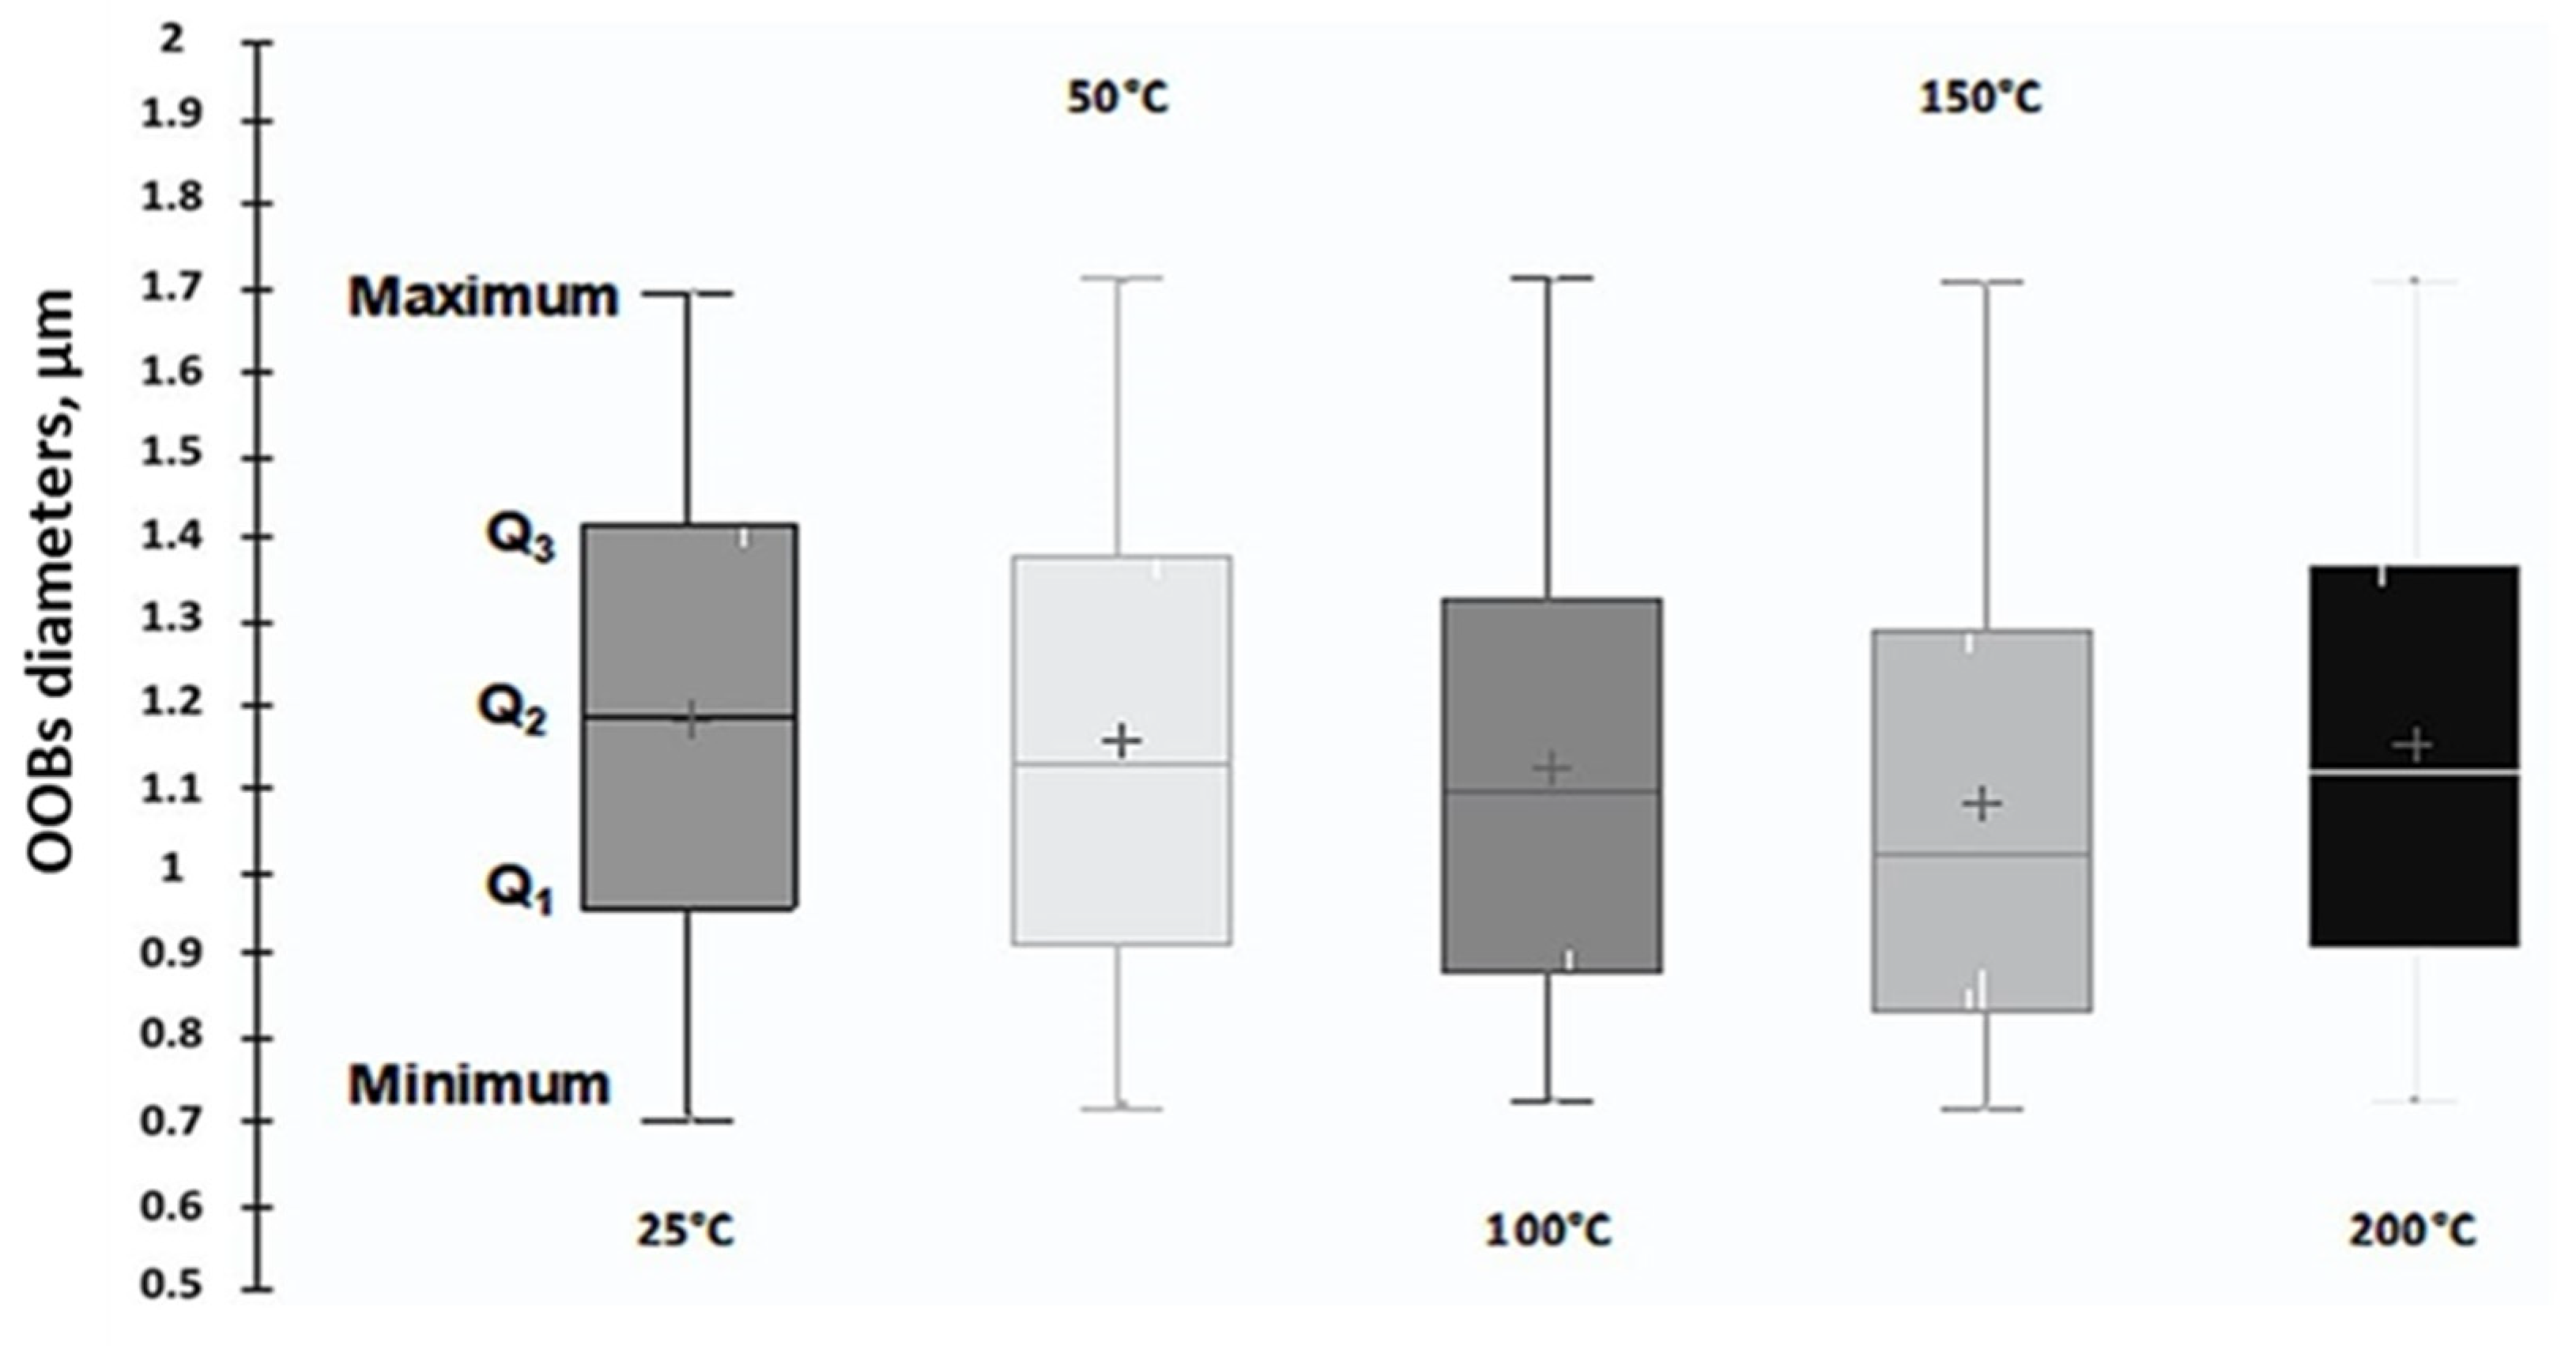
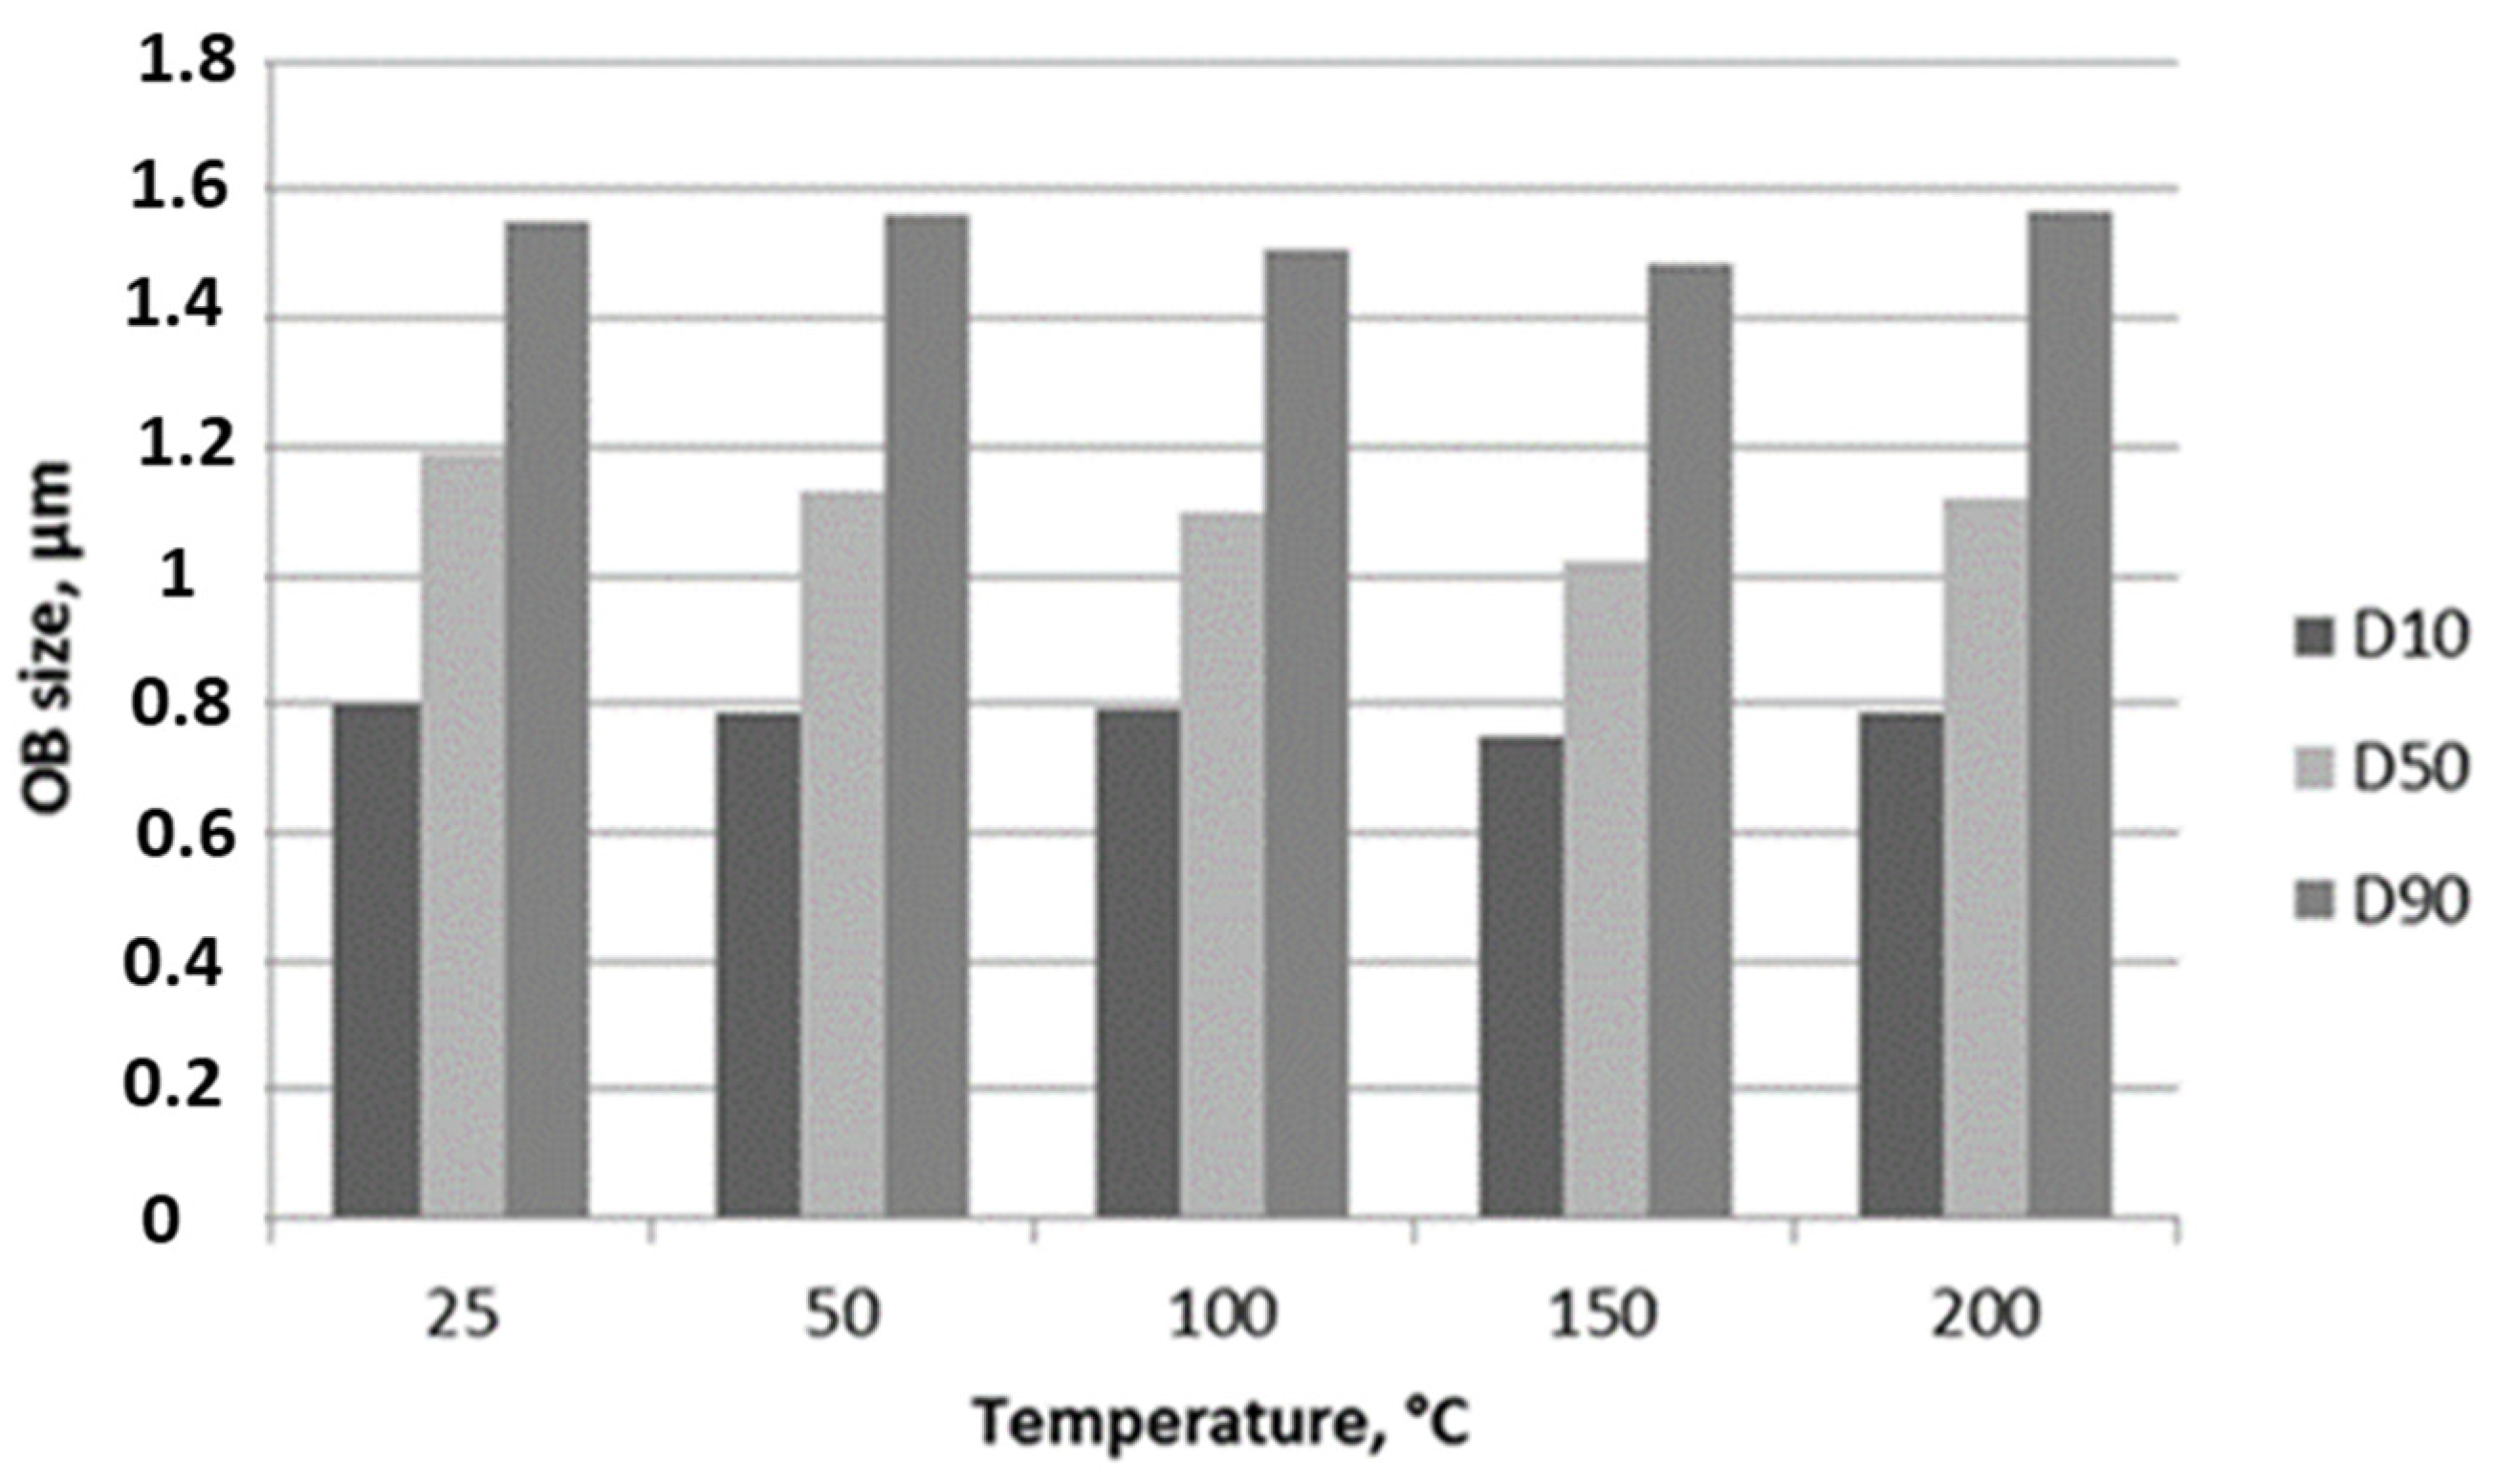
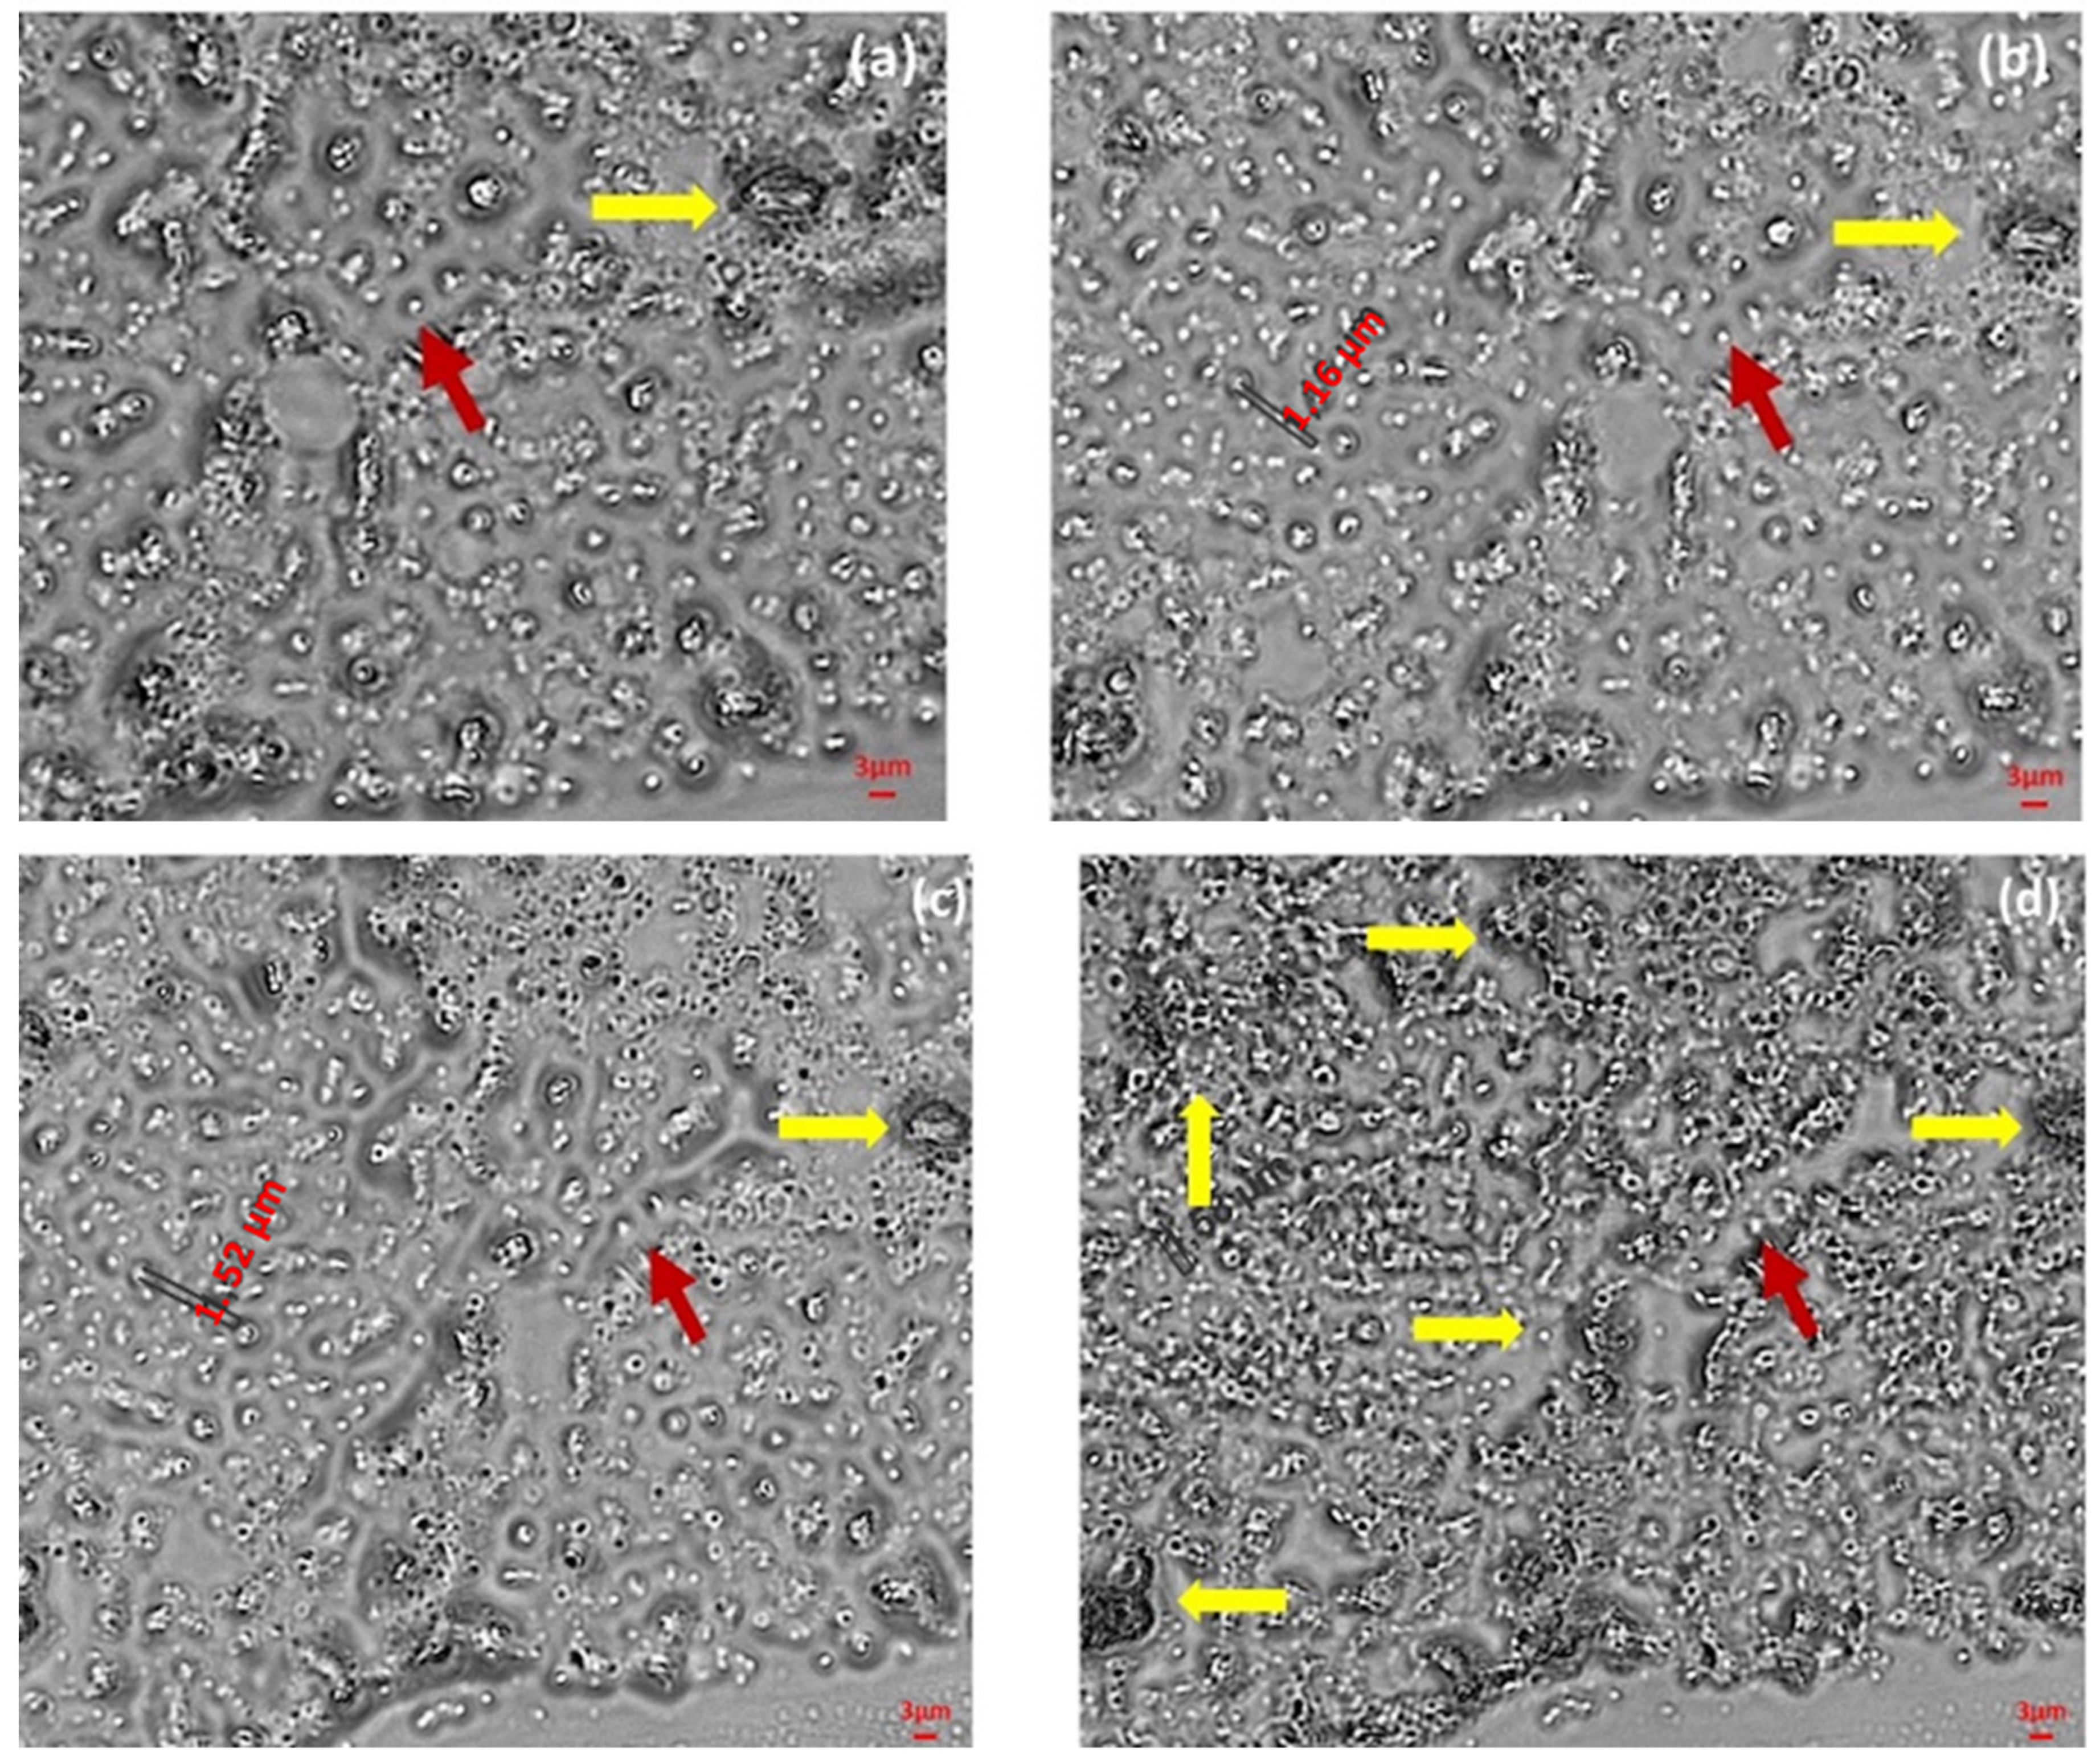
3.4. OBs Morphological Analysis and Thermal Stability

Figure 4 shows a typical optical microscope image of the OBs at room temperature in the bright field.
The red arrow in Figure 4 indicates one of the OBs, which is clearly visible in the image, and they appear bright compared to the surrounding area due to their far higher capacity to diffuse the incident light of the microscope. Moreover, the OBs appear spherical, as previously reported [5]. These microscope images represent remarkable evidence that the olive paste contains OBs and reveals, for the first time, that they are found in this by-product of olive oil production. Figure 5a–d shows the optical microscope images taken, respectively, after the first, second, third and fourth thermal steps.
The images captured using the optical microscope reveal that the OB is preserved after the thermal steps, regardless of the temperature, as indicated by red arrows that point to the same OB particles (see Figure 5a–d). This is a promising result because it demonstrates that the OBs structures did not burst under thermal treatments, which is of crucial importance for the sterilisation process. However, whereas OB structures apparently do not change shapes, there are some points (indicated by yellow arrows in Figure 5a–d) in the surrounding area which appear to have been dried out or burnt, probably due to the increase in temperature during the thermal phase.
Although the streaked OOBC still keeps its state (i.e., solid), Figure 5d shows an increment in yellow arrows, which would indicate an excessive temperature that has resulted in the evaporation of the water, which (as is well known) occurs at 100 °C, and which is at half the temperature of 200 °C considered in Figure 5d. Figure 6 shows the sizes of the images as examples of the dimensions observed using the microscope.
The OB dimensions are approximately within the range of 1–1.5 µm. This enables us to extend our investigation to a wider range between 0.7 and 1.7 µm as reported below. The box plots shown in Figure 7 report data about particle size distributions recorded for each temperature.
Table 3 reports the means and the standard deviations of the diameters and circularities values after each thermal stage. The average diameters are obtained by considering around one hundred values measured.
Concerning the circularity values, as expected, they suggest that the OB shape is rather similar to a sphere (i.e., circularity is 1 for a perfect circle) at 25 °C with a minimum value at 100 °C as shown by the mean values in Table 3. Conversely, the mean diameters had a minimum value at 150 °C. Figure 8 reports the OB parameters of D10, D50 and D90 for each temperature corresponding to the percentages 10%, 50% and 90%, respectively.
According to the microscope observations, the vast majority of OB sizes (90%) have diameters shorter than 1.5 µm and larger than 0.8 µm, are spherical in shape, and the OB structures are stable after the thermal steps. Moreover, such small sizes lead us to expect an efficient stability of an OB-based emulsion, as it is well known [8,23]. Regarding the results of the Shapiro–Wilk tests, we determined for the set temperatures that the p values < 0.05. These normality tests allowed us to define that our data significantly deviate from a normal distribution. According to these results, we chose a non-parametric statistic test for valuating if there were differences from the diameters groups at each temperature. The results of the Kruskal–Wallis tests have shown p values < 0.05; hence, there were differences among the diameters recorded at set temperatures. Afterwards, the Dunn tests identified the temperatures of 150 and 200 °C as the groups which have generated the differences. Therefore, an alteration in the OBs’ diameters was evaluated between 150 and 200 °C; this chance in diameter value is influenced by different water contents of the structures and depends on the different evaporation processes used to obtain higher temperature.

3.5. OOBC Stability Assessment

Table 4 shows the Stability Index, Si, of the untreated (U) and heated (H) cream after a sequence of six centrifugation steps.
The separation values do not differ greatly at the end of the centrifugation processes, showing a high stability of both the untreated and heated cream.

3.6. Rheological Measurements

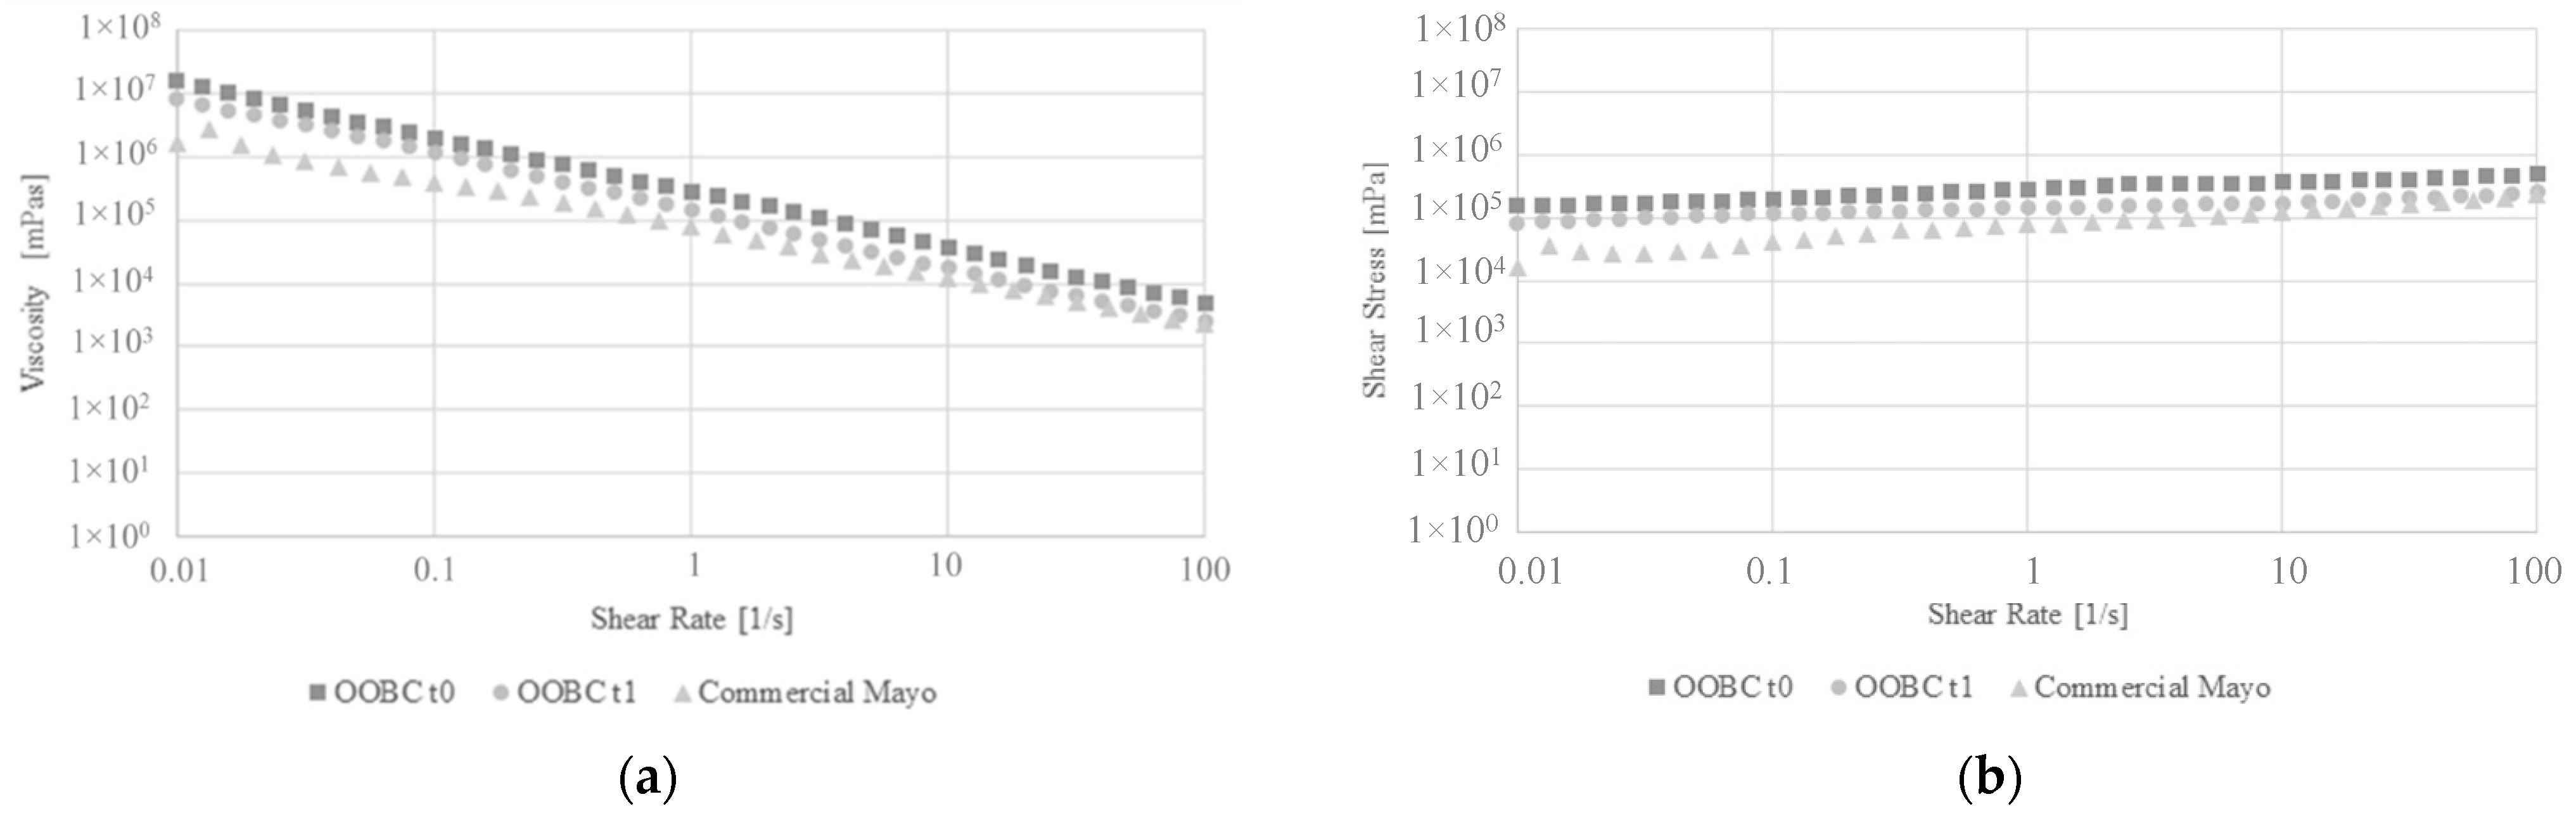
3.6.1. Flow Curve Tests and Thermal Flow Curve Ramp

Figure 9a,b, respectively, show the viscosity and the shear stress behaviour (against shear rate) of the OOBC, tested at t0 and t1, as well as the viscosity of a commercial mayonnaise used as a benchmark. Figure 10 shows the OOBC viscosity trends at t0 and t1 across a range of temperatures between 10 and 80 °C with a heating velocity of 10 °C/min.
Figure 9a shows that at the lowest shear rate (0.01 s−1), the viscosity values are 1.5 × 10⁷ mPa·s for the OOBC at t0 and 8.2 × 10⁶ mPa·s for the OOBC at t1, while it is 1.6 × 10⁶ mPa·s for the commercial mayonnaise. Even though the OOBC viscosity is reduced after ten days, it still resembles a commercial food emulsion. The shear stress values, in Figure 9b, at the lowest shear rate are 1.5 × 10⁵ mPa at t0 and 8.2 × 10⁴ mPa at t1 for the OOBC and 1.6 × 10⁴ mPa for commercial mayonnaise.
Figure 10 illustrates that the viscosity is 3.2 × 10⁶ mPa·s at the lowest temperature (10 °C) and 4.2 × 10⁴ at the highest temperature (80 °C), with a percentage variation of 86% for sample t0, while it is 1.3 × 10⁶ mPa·s at 10°C and 1.7 × 10⁴ mPa·s at 80 °C, with a percentage variation of 87% for sample t1. These results show encouraging signs, indicating that at the lowest shear rate, the OOBC viscosity is approximately five-fold higher than mayonnaise and that they have the same order of magnitude, whereas at the highest shear rate, the viscosity trends overlap. To obtain the best flow for OBs, we need a force of at least five-fold higher than that used for mayonnaise. The temperature is a factor considered to reduce the force applied during flowing, as indicated from the reduced viscosity at the highest temperature evaluated.

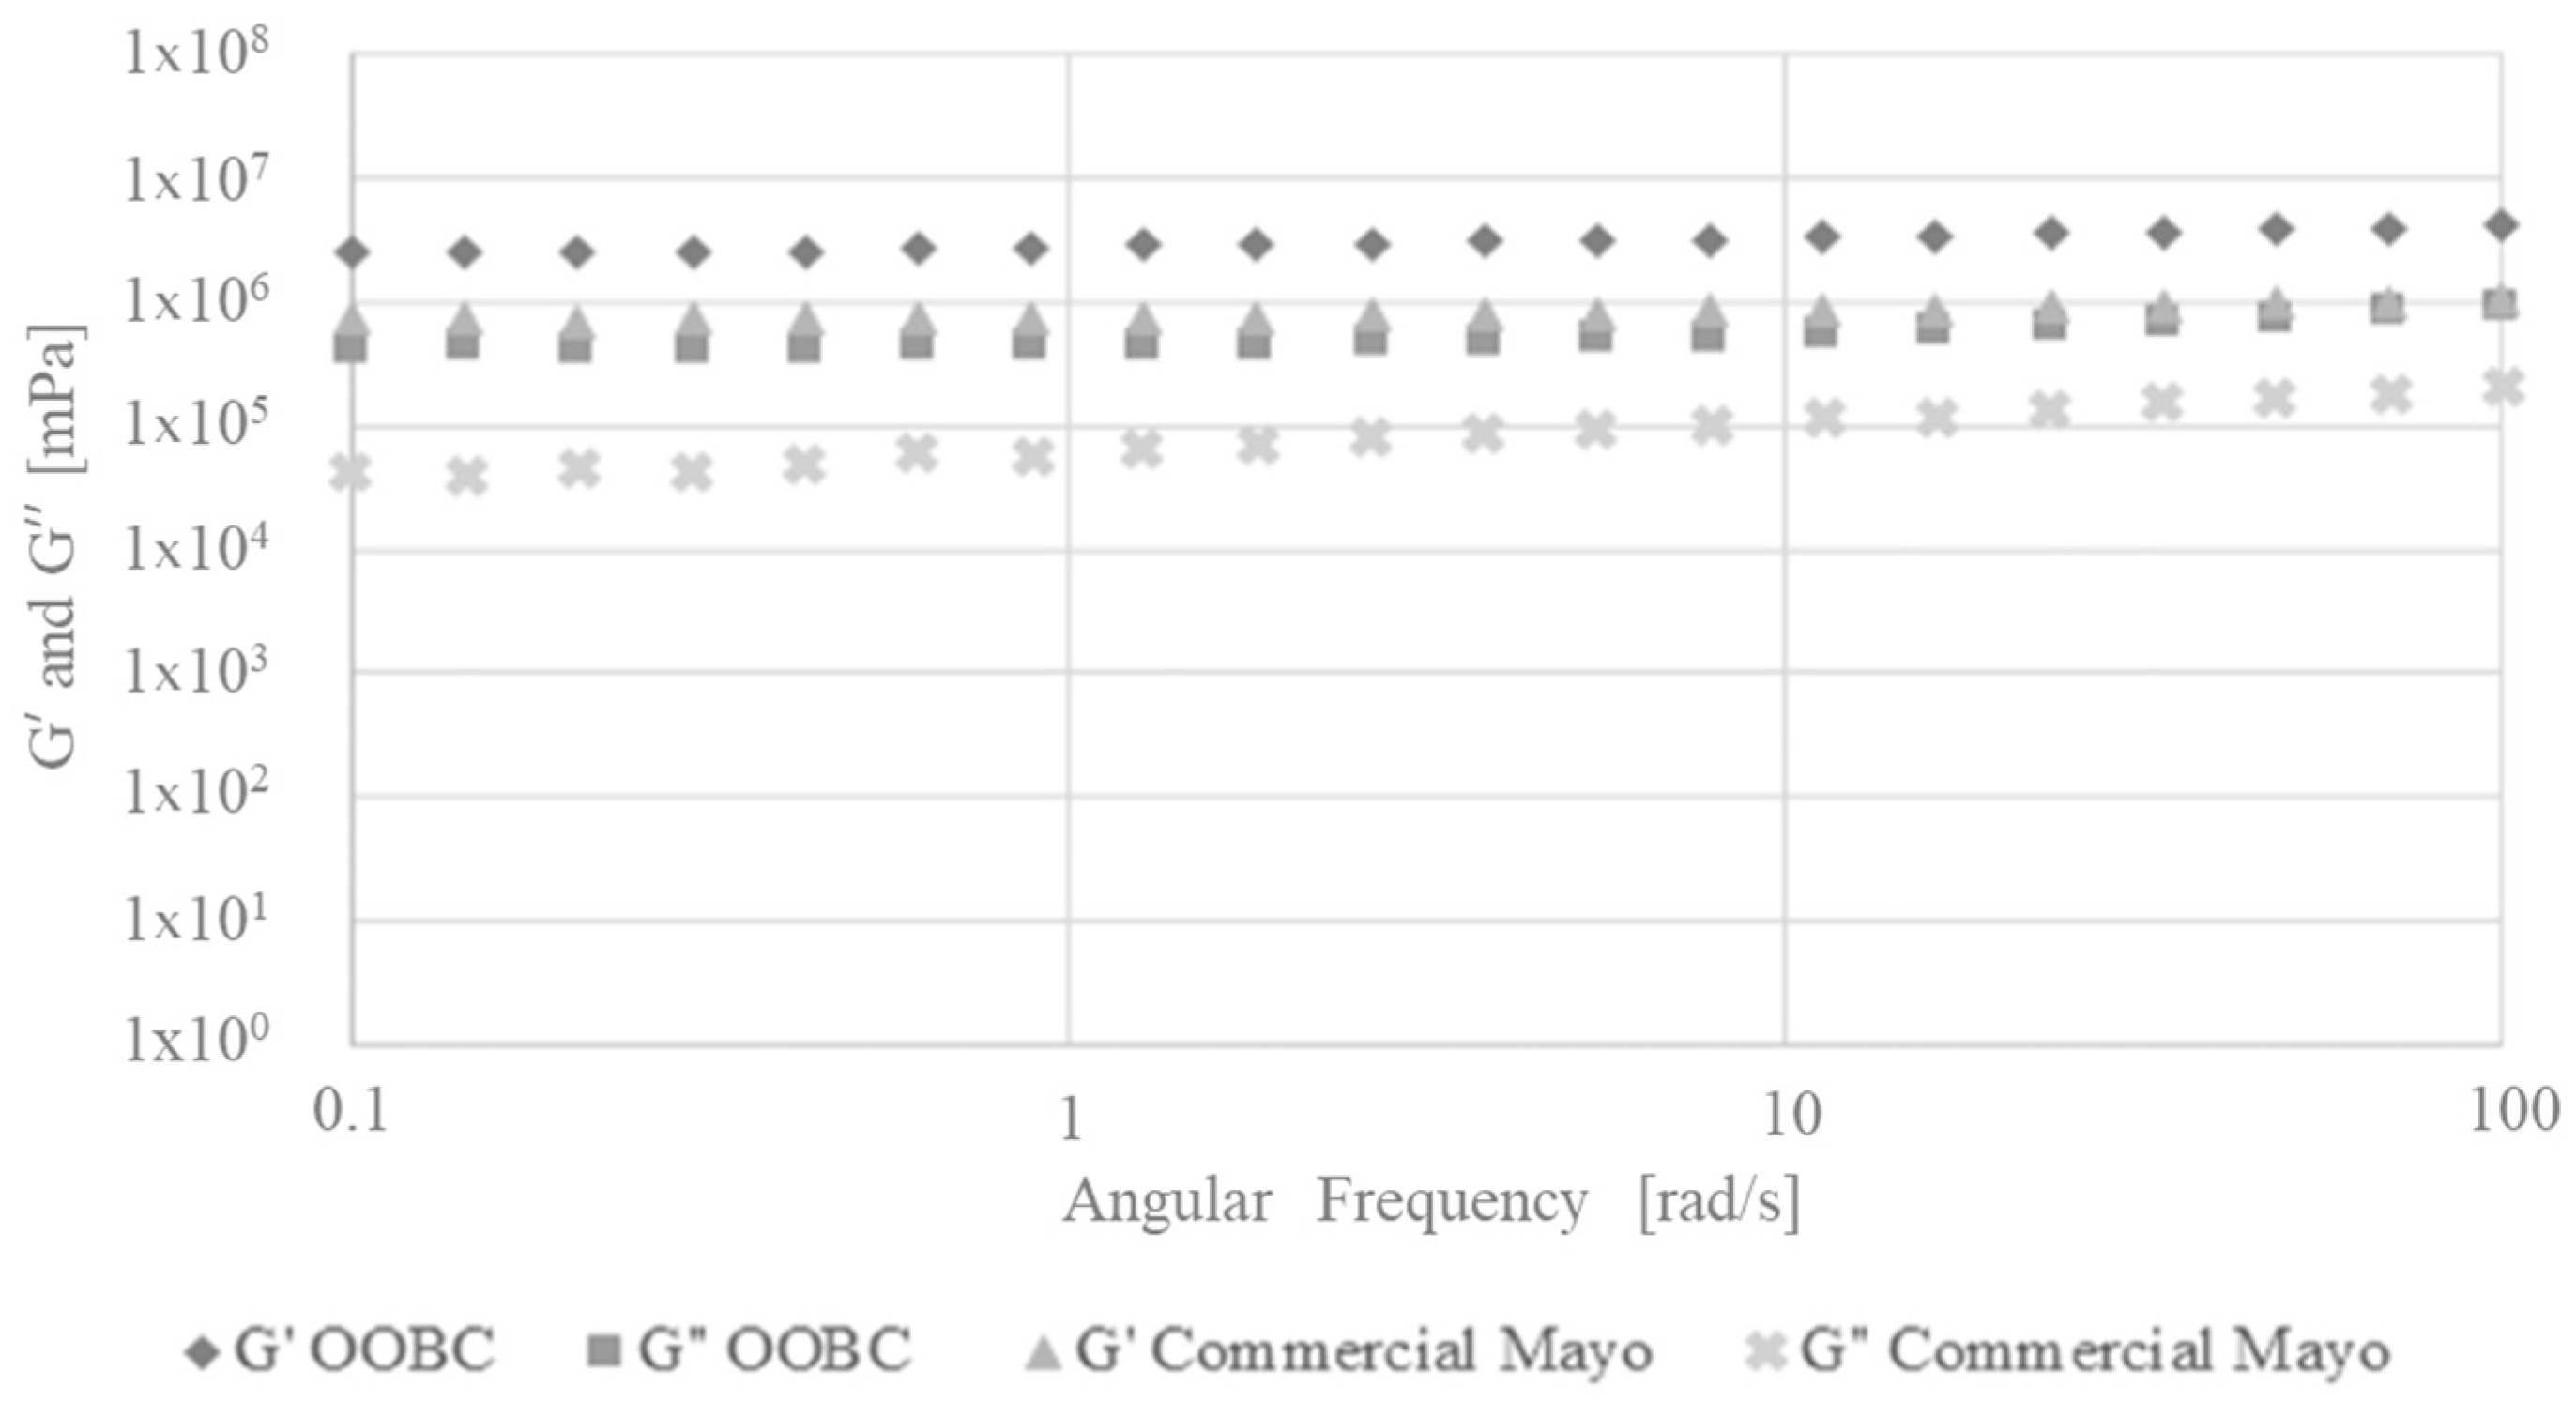
3.6.2. Amplitude and Frequency Sweep

Figure 11 shows G′ and G″, respectively, of OBs and commercial mayonnaise.
Figure 11 demonstrates that G′OB is three-fold higher than G′mayo and that G″OB is 10-fold higher than G″mayo, and these results support that the OB viscosity is higher than for mayonnaise, as we concluded earlier. Moreover, both cases show that G′ is an order of magnitude higher than G″, and this proves that the samples have an elastic behaviour predominant in the frequency range investigated.

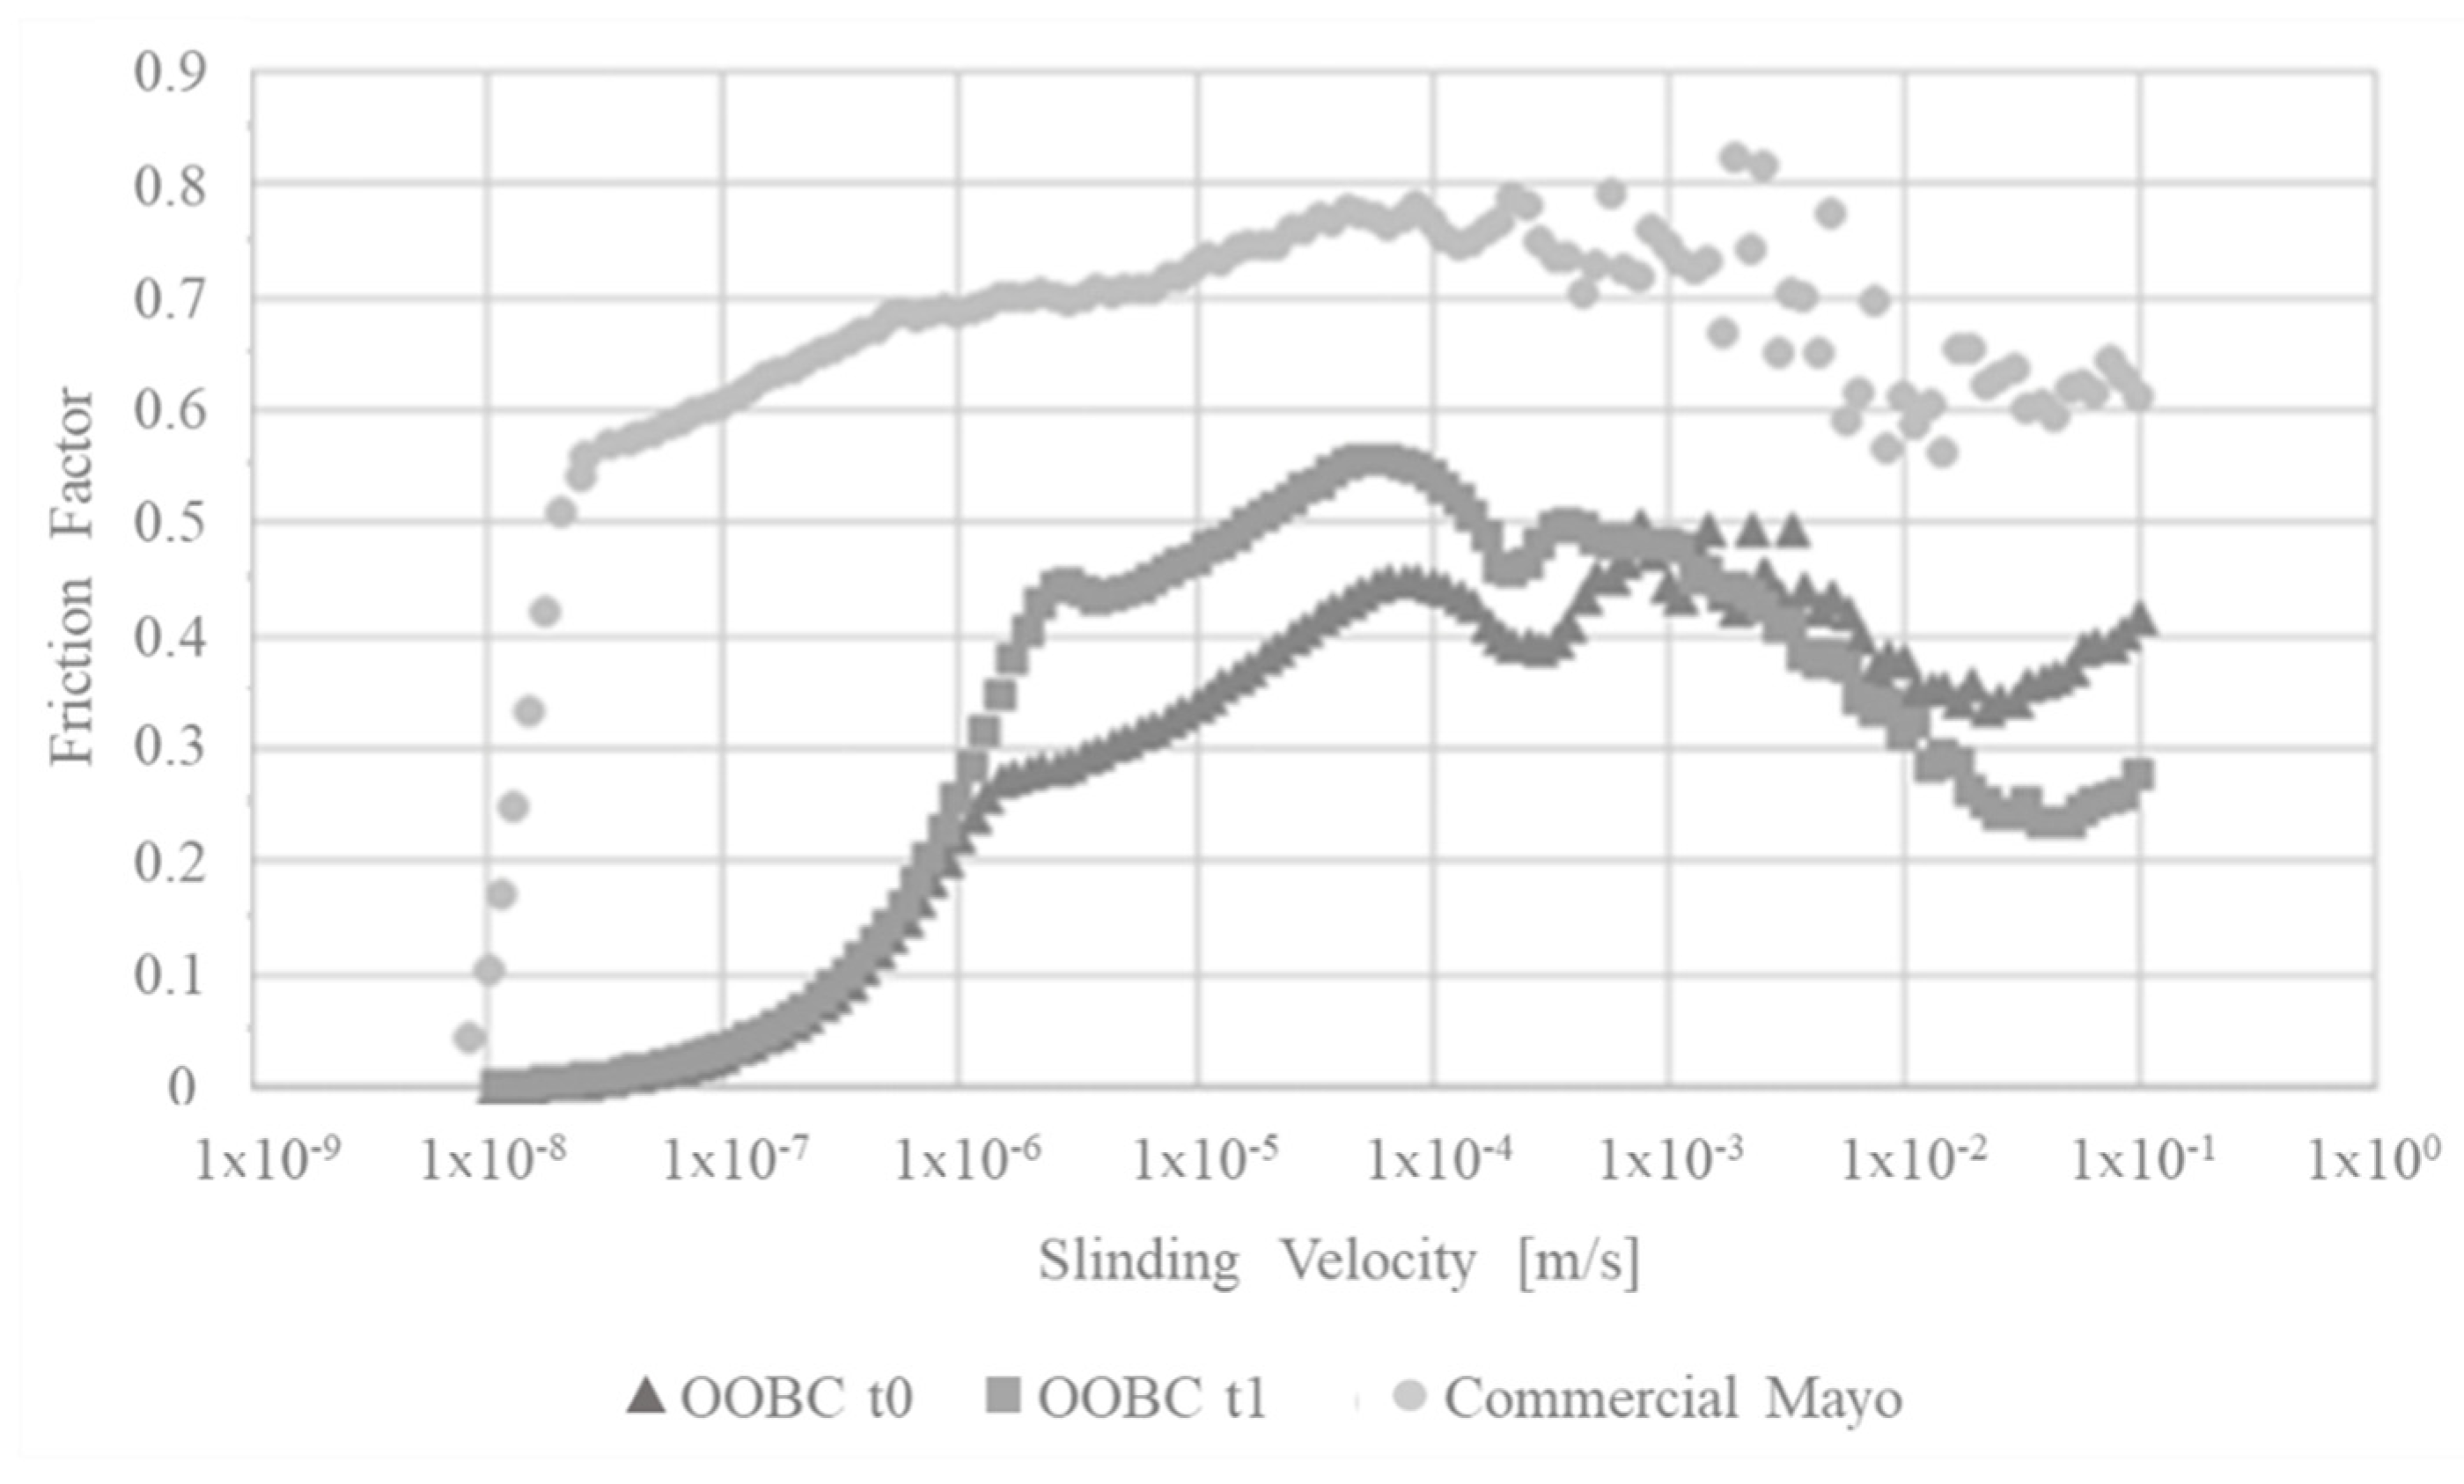
3.7. Tribological Measurements—Stribeck Curve

Figure 12 shows the Stribeck curves, which are the friction factor trends that serve as functions for the sliding velocity of the OOBC at different times and for the commercial mayonnaise.
Table 5 reports the static and dynamic friction factor.
The static and dynamic friction factors of commercial mayonnaise are about three-fold higher than OOBC at t0 and about 1.7-fold higher than OOBC at t1. These results suggest that the OOBC are easier to swallow than mayonnaise.

4. Conclusions

All things considered, we presented here a protocol for extracting the OBs, for the first time, from an intermediate product of olive oil. The OBs of olive drupes were extracted from olive paste. The new extraction protocol enables us to recover a moist cream from olive paste with OBs that provide a high physical and thermal stability. The protocol is based on the use of a buffer solution, which is formulated with food grade compounds. The entire extraction process lasts about 2 h, which together with the high extraction efficiency, makes the process suitable for extensive use, even on a larger scale. For the first time, as proven by the microscopic inspections, OBs were found in the olive paste. The microscope images revealed that the OBs structures did not burst under thermal treatments; this result is remarkable in the field of sterilization processes. In other words, in food emulsion, the OBs replacing the emulsifiers should not burst during heating; otherwise, emulsion stability would be compromised. Moreover, we determined the OB sizes and their distributions at 25, 50, 100, 150 and 200 °C. We evaluated that the OB particle size distributions were in the range from 0.7 to 1.7 µm. Basically, we determined from the box plots the Q1, Q2, Q3, the minimum and maximum values and that 90% of the OBs were below 1.5 and above 0.8 µm. These extremely small dimensions are certainly promising for the stability of an OB-based emulsion [8,23]. Concerning the circularity values, they suggested that the OB shape was rather similar to a sphere (i.e., circularity is 1 for a perfect circle) at 25 °C with a minimum value of 0.653 at 100 °C. The Shapiro–Wilk normality tests (p < 0.05) allowed us to determine that the size distributions at the set temperatures were not normal. The non-parametric Kruskal–Wallis tests (p < 0.05) identified differences among the diameters groups, which were recorded at each temperature. The multiple comparison procedure with the Dunn test was applied, and we determined that the differences among groups were generated by temperatures of 150 and 200 °C. We might conclude that these extremely high temperatures affected OB diameters.
The stability of the OOBC was evaluated both immediately after extraction and after heating using a microwave oven for about 20 s, reaching a temperature of 70 °C. In both cases, the separation of the liquid phase (oil + water) did not exceed 6% of the total volume of the cream. The total content of polyphenols and flavonoids measured in the cream was comparable to that which was reported in the scientific literature [37,38] relating to extra virgin olive oil, while the measured antioxidant power was significantly higher, suggesting a longer shelf life of the emulsions formulated with OOBC. Finally, the rheological and tribological tests show that the OOBC exhibits a viscosity quite similar to that of a commercial mayonnaise and can be swallowed in the same way as food. These noteworthy results suggest that the OOBC containing the OBs might be used as a natural emulsifier with a promising intrinsic property.

Author Contributions

Conceptualization, M.G. and R.N.; Data curation, M.G., S.I., C.O., I.G., M.D.D., V.S., S.V., S.G., P.F. and R.N.; Formal analysis, S.I., C.O., I.G., M.D.D., V.S., S.V., S.G. and P.F.; Investigation, M.G., S.I., C.O., I.G., M.D.D., V.S., S.V., S.G., P.F. and R.N.; Methodology, M.G., S.I., C.O., I.G., S.G., P.F. and R.N.; Project administration, M.G. and R.N.; Resources, R.N.; Supervision, M.G. and R.N.; Validation, M.G., I.G. and R.N.; Visualization, M.G. and R.N.; Writing—original draft, M.G., S.I. and C.O.; Writing—review & editing, M.G., S.I. and R.N. All authors have read and agreed to the published version of the manuscript.

Funding

This research received no external funding.

Institutional Review Board Statement

Not Applicable.

Informed Consent Statement

Not Applicable.

Data Availability Statement

Not Applicable.

Conflicts of Interest

The authors declare no conflict of interest.

References

  1. Chen, J.C.F.; Tsai, C.C.Y.; Tzen, J.T.C. Cloning and Secondary Structure Analysis of Caleosin, a Unique Calcium-Binding Protein in Oil Bodies of Plant Seeds. Plant Cell Physiol. 1999, 40, 1079–1086. [Google Scholar] [CrossRef] [PubMed] [Green Version]
  2. Lin, L.J.; Tai, S.S.K.; Peng, C.C.; Tzen, J.T.C. Correction. Plant Physiol. 2002, 129, 1930. [Google Scholar] [CrossRef] [Green Version]
  3. Næsted, H.; Frandsen, G.I.; Jauh, G.Y.; Hernandez-Pinzon, I.; Nielsen, H.B.; Murphy, D.J.; Rogers, J.C.; Mundy, J. Caleosins: Ca2+-binding proteins associated with lipid bodies. Plant Molecoular Biol. 2000, 44, 463–476. [Google Scholar] [CrossRef] [PubMed]
  4. Tzen, J.; Cao, Y.; Laurent, P.; Ratnayake, C.; Huang, A. Lipids, Proteins, and Structure of Seed Oil Bodies from Diverse Species. Plant Physiol. 1993, 101, 267–276. [Google Scholar] [CrossRef] [PubMed] [Green Version]
  5. Tzen, J.; Huang, A. Surface structure and properties of plant seed oil bodies. J. Cell Biol. 1992, 117, 327–335. [Google Scholar] [CrossRef] [Green Version]
  6. Fisk, I.D.; White, D.A.; Carvalho, A.; Gray, D.A. Tocopherol-An intrinsic component of sunflower seed oil bodies. JAOCS J. Am. Oil Chem. Soc. 2006, 83, 341–344. [Google Scholar] [CrossRef]
  7. Tzen, J.T.C.; Lie, G.C.; Huang, A.H.C. Characterization of the charged components and their topology on the surface of plant seed oil bodies. J. Biol. Chem. 1992, 267, 15626–15634. [Google Scholar] [CrossRef]
  8. McClements, D.J. Food Emulsions: Principles, Practices, and Techniques, 2nd ed.; CRC Press: Boca Raton, FL, USA, 2004. [Google Scholar]
  9. Israelachvili, J. Intermolecular and Surface Forces; Academic Press: Cambridge, MA, USA, 2011. [Google Scholar]
  10. Demetriades, K.; Coupland, J.N.; Mcclements, D.J. Physical properties of whey protein stabilized emulsions as related to pH and NACl. J. Food Sci. 1997, 62, 342–347. [Google Scholar] [CrossRef]
  11. Demetriades, K.; McClements, D.J. Influence of pH and Heating on Physicochemical Properties of Whey Protein-Stabilized Emulsions Containing a Nonionic Surfactant. J. Agric. Food Chem. 1998, 46, 3936–3942. [Google Scholar] [CrossRef]
  12. Hunt, J.A.; Dalgleish, D.G. Effect of pH on the stability and surface composition of emulsions made with whey protein isolate. J. Agric. Food Chem. 1994, 42, 2131–2135. [Google Scholar] [CrossRef]
  13. Kulmyrzaev, A.; Sivestre, M.P.C.; McClements, D.J. Rheology and stability of whey protein stabilized emulsions with high CaCl2 concentrations. Food Res. Int. 2000, 33, 21–25. [Google Scholar] [CrossRef]
  14. Georgalaki, M.D.; Bachmann, A.; Sotiroudis, T.G.; Xenakis, A.; Porzel, A.; Feussner, I. Characterization of a 13-lipoxygenase from virgin olive oil and oil bodies of olive endosperms. Lipid-Fett 1998, 100, 554–560. [Google Scholar] [CrossRef]
  15. Gómez-Escalonilla, M.; Vidal-Hernámdez, J. Variedades del Olivar; Hojas Divulgadoras; Ministerio de Agricultura: Madrid, Spain, 2011; p. 32.
  16. Available online: https://ec.europa.eu/info/food-farming-fisheries/farming/facts-and-figures/markets/prices/price-monitoring-sector/olive-oil_it (accessed on 7 June 2022).
  17. Conde, C.; Delrot, S.; Gerós, H. Physiological, biochemical and molecular changes occurring during olive development and ripening. J. Plant Physiol. 2008, 165, 1545–1562. [Google Scholar] [CrossRef] [PubMed]
  18. Rodríguez, G.; Lama, A.; Rodríguez, R.; Jiménez, A.; Guillén, R.; Fernández-Bolaños, J. Olive stone an attractive source of bioactive and valuable compounds. Bioresour. Technol. 2008, 99, 5261–5269. [Google Scholar] [CrossRef] [PubMed]
  19. Zamora, R.; Alaiz, M.; Hidalgo, F.J. Influence of Cultivar and Fruit Ripening on Olive (Olea europaea) Fruit Protein Content, Composition, and Antioxidant Activity. J. Agric. Food Chem. 2001, 49, 4267–4270. [Google Scholar] [CrossRef]
  20. Nergiz, C.; Ergönül, P.G. Organic acid content and composition of the olive fruits during ripening and its relationship with oil and sugar. Sci. Hortic. 2009, 122, 216–220. [Google Scholar] [CrossRef]
  21. Pokorný, J. Olive Oil. In Chemistry and Technology; Boskou, D., Ed.; AOCS Press: Champaign, IL, USA, 1997; Volume 41, pp. 119–120. [Google Scholar] [CrossRef]
  22. Ghanbari, R.; Anwar, F.; Alkharfy, K.M.; Gilani, A.-H.; Saari, N. Valuable Nutrients and Functional Bioactives in Different Parts of Olive (Olea europaea L.)—A Review. Int. J. Mol. Sci. 2012, 13, 3291–3340. [Google Scholar] [CrossRef]
  23. Nikiforidis, C.V.; Matsakidou, A.; Kiosseoglou, V. Composition, properties and potential food applications of natural emulsions and cream materials based on oil bodies. RSC Adv. 2014, 4, 25067–25078. [Google Scholar] [CrossRef] [Green Version]
  24. Beindorff, C.M.; Ghislain, C.Y.; Sergey, L.; Melnikov, M.; Winter, I. Satiety Enhancing Food Products. WO2007115899, 18 October 2007. [Google Scholar]
  25. White, D.A.; Fisk, I.D.; Mitchell, J.R.; Wolf, B.; Hill, S.E.; Gray, D.A. Sunflower-seed oil body emulsions: Rheology and stability assessment of a natural emulsion. Food Hydrocoll. 2008, 22, 1224–1232. [Google Scholar] [CrossRef]
  26. Bradford, M. A Rapid and Sensitive Method for the Quantitation of Microgram Quantities of Protein Utilizing the Principle of Protein-Dye Binding. Anal. Biochem. 1976, 72, 248–254. [Google Scholar] [CrossRef]
  27. Kim, J.S.; Kang, O.J.; Gweon, O.C. Comparison of phenolic acids and flavonoids in black garlic at different thermal processing steps. J. Funct. Foods 2013, 5, 80–86. [Google Scholar] [CrossRef]
  28. Woisky, R.G.; Salatino, A. Analysis of propolis: Some parameters and procedures for chemical quality control. J. Apic. Res. 1998, 37, 99–105. [Google Scholar] [CrossRef]
  29. Benzie, I.F.F.; Strain, J.J. The ferric reducing ability of plasma (FRAP) as a measure of ‘antioxidant power’: The FRAP assay. Anal. Biochem. 1996, 239, 70–76. [Google Scholar] [CrossRef] [PubMed] [Green Version]
  30. Otsu, N. A Threshold Selection Method from Gray-Level Histograms. IEEE Trans. Syst. Man. Cybern. 1979, 9, 62–66. [Google Scholar] [CrossRef] [Green Version]
  31. Prakash, S.; Tan, D.D.Y.; Chen, J. Applications of tribology in studying food oral processing and texture perception. Food Res. Int. 2013, 54, 1627–1635. [Google Scholar] [CrossRef]
  32. Laguna, L.; Farrell, G.; Bryant, M.; Morina, A.; Sarkar, A. Relating rheology and tribology of commercial dairy colloids to sensory perception. Food Funct. 2017, 8, 563–573. [Google Scholar] [CrossRef]
  33. Pondicherry, K.S.; Rummel, F.; Laeuger, J. Extended stribeck curves for food sample. Biosurface Biotribol. 2018, 4, 34–37. [Google Scholar] [CrossRef]
  34. Sethupathy, P.; Moses, J.A.; Anandharamakrishnan, C. Food Oral Processing and Tribology: Instrumental Approaches and Emerging Applications. Food Rev. Int. 2021, 37, 538–571. [Google Scholar] [CrossRef]
  35. Hidalgo, F.J.; Alaiz, M.; Zamora, R. Determination of Peptides and Proteins in Fats and Oils. Anal. Chem. 2001, 73, 698–702. [Google Scholar] [CrossRef]
  36. Esteve, C.; D’Amato, A.; Marina, M.L.; García, M.C.; Righetti, P.G. Analytical Approaches for the Characterization and Identification of Olive (Olea europaea) Oil Proteins. J. Agric. Food Chem. 2013, 61, 10384–10391. [Google Scholar] [CrossRef]
  37. Ninfali, P.; Aluigi, G.; Bacchiocca, M.; Magnani, M. Antioxidant capacity of extra-virgin olive oils. J. Am. Oil Chem. Soc. 2001, 78, 243–247. [Google Scholar] [CrossRef]
  38. Sánchez, C.S.; González, A.M.T.; García-Parrilla, M.C.; Granados, J.J.Q.; de la Serrana, H.L.G.; Martínez, M.C.L. Different radical scavenging tests in virgin olive oil and their relation to the total phenol content. Anal. Chim. Acta 2007, 593, 103–107. [Google Scholar] [CrossRef] [PubMed]
Figure 1. Flow chart for OOBC extraction with Method 1. C, centrifugation; F, freezing; R, recovery of OOBC.
Applsci 12 06019 g001
Figure 2. The OOBC extracted, which appears as an upper layer with a creamy texture.
Applsci 12 06019 g002
Figure 3. Flow chart for oil bodies cream extraction with Method 2.
Applsci 12 06019 g003
Figure 4. Image of an optical microscope of the oil bodies taken at room temperature and in the bright field.
Applsci 12 06019 g004
Figure 5. (ad) Images of optical microscope after heating at 50, 100, 150 and 200 °C, respectively.
Applsci 12 06019 g005
Figure 6. Images of optical microscope with typical measurements of sizes.
Applsci 12 06019 g006
Figure 7. Box plots of the particle size distributions after each thermal stage, where Q1 is the 25th percentile; Q2 is the median; Q3 is the 75th percentile; the minimum is the lowest range value; the maximum is the highest range value; the cross is the mean.
Applsci 12 06019 g007
Figure 8. Histogram of the D10, D50 and D90 parameters evaluated for each thermal stage.
Applsci 12 06019 g008
Figure 9. Oil bodies and mayo viscosity behaviour expressed as (a) flow curve and (b) yield stress curve.
Applsci 12 06019 g009
Figure 10. Oil bodies viscosity behaviour under temperature variation between 10 and 80 °C.
Applsci 12 06019 g010
Figure 11. Oil bodies and commercial mayo moduli comparison.
Applsci 12 06019 g011
Figure 12. Oil bodies and commercial mayo Stribeck curves comparison.
Applsci 12 06019 g012
Table 1. OOBC percentage composition.
OOBC Proximate Composition, %
Water40.00
Lipid26.76
Protein5.99
Other27.25
Table 2. Polyphenols, flavonoids and FRAP in OOBC.
OOBC
TP, TF and Antioxidant Power
Total polyphenols1.11 mgGAE/gdry
Total flavonoids0.50 mgQE/gdry
FRAP0.08 millimoliFe/gdry
20.04 mgTroloxE/gdry
Table 3. Mean and standard deviation of particles diameter and circularities after each thermal stage.
25 °C50 °C100 °C150 °C200 °C
Mean diameters, µm ± STD1.183 ± 0.2771.158 ± 0.2801.123 ± 0.2701.078 ± 0.2711.150 ± 0.278
Mean circularities ± STD0.921 ± 0.1030.712 ± 0.1790.653 ± 0.2020.686 ± 0.1880.713 ± 0.179
Table 4. Stability index of the OOBC untreated and MW treated up to 70 °C after 6 centrifugation steps.
Centrifugation Step NumberT (min)Separation Grade %
OOBC-U
Separation Grade %
OOBC-H
151.10
2101.10
3152.23.8
4203.44.6
5254.55.8
6304.56.9
Table 5. Sample and commercial mayonnaise friction factors.
µ Static<µ Dynamic>
OOBC t00.27120.3196
OOBC t10.44110.4412
Commercial mayo0.77530.7005
Publisher’s Note: MDPI stays neutral with regard to jurisdictional claims in published maps and institutional affiliations.

