Article

Research on Intelligent Detection Algorithm of the Single Anchored Mooring Area for Maritime Autonomous Surface Ships

1
Navigation College, Dalian Maritime University, Dalian 116026, China
2
Maritime College, Guangdong Ocean University, Zhanjiang 524000, China
*
Authors to whom correspondence should be addressed.
Appl. Sci. 2022, 12(12), 6009; https://doi.org/10.3390/app12126009
Submission received: 23 May 2022 / Revised: 8 June 2022 / Accepted: 10 June 2022 / Published: 13 June 2022
(This article belongs to the Section Marine Science and Engineering)

Abstract

:
Mooring area detection represents one of the key technological problems that must be solved in the development of Maritime Autonomous Surface Ships (MASS). In view of the lack of research on the current detection methods for ship mooring area, a new intelligent detection algorithm of the single anchored mooring area for MASS was proposed in this study, aiming at improving the detection ability and accuracy of the MASS mooring area. Firstly, the laws of short period swinging motion, long period circumferential motion and reciprocating motion in the radial direction of an anchoring ship were summarized. Secondly, an anchorage circle radius model and safety distance model between the anchor positions were established and various constrains were considered including ship type, ship particulars, draft, safety impact caused by other ships passing through the anchoring ship. Thirdly, the Monte-Carlo stochastic simulation method was used to measure the mooring area, which can detect the anchor position intelligently. Finally, a case study on MATLAB demonstrated that the proposed intelligent detection algorithm for MASS is effective under various marine scenarios. The results enrich the theory of MASS mooring area detection; therefore, the algorithm has great potential to be equipped on MASS in the future.

1. Introduction

1.1. Background

Mooring area detection is one of the key technological problems in MASS that must be solved at each development stage, and concerns the development of the MASS mooring area detection system, anchorage safety, utilization rate of anchorage space and other related engineering problems [1,2]. The International Maritime Organization (IMO) established the importance of MASS and classified relevant laws and regulations. Besides, the IMO published the initial definition of MASS and four stages of development at its 99th Maritime Safety Conference [3,4,5]. Meanwhile, major developed countries and regions such as the United States and the European Union have launched specific development goals and plans for the development of MASS. Lloyd’s Register of Shipping, Bureau Veritas and other classification societies all pay more attention to the development of MASS [6,7]. In terms of digital technology, China proposed building a comprehensive digital information infrastructure that integrates “Space-Earth Integration” and “Cloud-Network Fusion”, which will promote the rapid development of MASS and smart ports. In 2022, Ministry of Communication of China proposed the planning objective of “Enhance the Ship-shore Coordination in the Whole Process of Ship Navigation, Support the Intelligent Auxiliary Navigation in All-weather and Complex Environments [8] and Promote the Application of Individual Smart Ship Technologies Such as Green Smart Ships and Autonomous Navigation, Improve the Shore-based Collaborative System for Ship Intelligent Navigation” [9,10]. “Standard for Intelligent Ships” (China Classification Society, Version II) indicates that intelligent ships are those ships which automatically perceive and obtain information and data on the ship itself, marine environment, logistics and port by making use of sensors, communication, the Internet of Things, the Internet and other technical means, and achieve intelligent operation in terms of ship navigation, management, maintenance and cargo transportation based on computer technology, automatic control technology and big data processing and analyzing technology, so that ships can become safer, more environmentally friendly, economical and efficient. Additionally, the functions of intelligent ship normally consist of seven levels [11,12]. Additionally, the “Standard for Intelligent Ships” puts forward the requirements for anchoring autonomous decision making, which should enable the evaluation and implementation of anchorage plans based on real-time detection, signals and data receiving, as well as the limitation of the ship anchoring and maneuvering capability.
It could be states that the development of intelligent ship technology is flourishing, and it has become the carrier and a breakthrough of the digital technology and economy of the shipping industry. Definitions of intelligent vessels and MASS are products that Chinese and foreign experts as well as researchers formulated at the stage of the development of vessel intelligence. Additionally, its essence is to adopt different technical routes, thus achieving autonomous navigation and management. The mooring area detection is one of the key technologies that must be possessed by ships for autonomous and intelligent navigation. It is necessary for ships to detect the mooring area at the departure port, the destination port and the vicinity of the route, thus meeting the needs of emergencies, goods loading and unloading, boarding and disembarking, and waiting for berthing. In navigation practice, due to the lack of methods of scientific mooring area detection, the ships usually choose a larger anchorage circle radius to ensure their anchoring safety, which objectively results in a waste of anchorage space resource. Additionally, some space in the anchorage could be considered as mooring area. However, due to the lack of detection capacity, those anchorage space resources are wasted. Therefore, determining a suitable dropping anchor position and maintaining the mooring safety in operations are major challenges that intelligent and MASS systems need to undertake at different development stages. Intelligent mooring area detection is a strategy and technology that relies on various vessel sensors, fuses multi-source data, adopts relevant detection technologies to detect positions qualified for anchor operations, and conducts safety monitoring of the mooring position. Moreover, as for the development of intelligent vessels, mooring area detection is one of the key technologies related to their mooring safety and the utilization rate of anchorages space. More importantly, the mechanism of mooring area detection must be revealed, thus filling in the lacuna in mooring area detection, and promoting the development of related theories of intelligent vessels.
The Monte-Carlo stochastic simulation originated in 1946 and was named after physicists Von Neumann and Uiam, using random sampling to simulate neutron chain reactions on computers [13]. The simulation was conducted using simple and repeated sampling, meaning it was less affected by the limitation of conditions. It enjoys characteristics of the simple method and easy programming, and provides a relatively accurate answer. The Monte-Carlo stochastic simulation is widely used in research on Structural Safety [14], risk assessing workers’ unsafe behavior [15], working space analyses of Robotic Arms [16], efficient long-term extreme analysis [17], helicopter maritime search and rescue response plans [18] and the dynamic process simulation of ship pilotage risk [19]. The above engineering problems share the same scientific principle with the mooring area detection problem, and act as a significant reference.

1.2. Literature Review

Anchoring operation is one of the key operations of ships, which is affected by wind, wave and current, ship maneuverability [20,21,22], the accurate positioning of ships [23,24], congestion of anchorage [25], water depth, bottom material grip force [26], anchoring chain length, anchorage circle radius [27], safety distance between the anchoring ships [28] and the algorithm of the anchorage area detection. At present, the research on anchorage area detection focuses mainly on the following two aspects.

1.2.1. Safety Distance between Anchoring Ships

In the literature, [29] analyzes the differences of relevant specifications of the anchorage circle radius under different situations, and an optimal selection of the anchorage circle radius in the regression equation model and algorithm according to different wind conditions was proposed. In [30], the position of the anchor chain hole was taken as the dropping anchor position, converted from the position of GPS antenna to the anchor chain hole with the mathematical model. In [31], the conceptual difference between the ship position and anchor position was pointed out. In [32], the difference and relation between anchor position and dropping anchor position was analyzed, and an estimation method was put forward. In [29,33,34], a regression analysis and data mining were applied to calculate the anchorage circle radius and the distance between anchoring ships, which were intelligent to a certain degree. However, as it was a comprehensive analysis of various situations, it could not reflect the maximum safety radius. Some Japanese researchers considered the maneuvering difficulty of a ship passing through anchoring ships and introduced the distance model between two adjacent anchoring ships [29]. The length of the anchoring chain was mainly determined by the external force of wind, wave and current, water depth and the grip force coefficient of the bottom material [35]. A safety evaluation anchorage model of the Tianjin port was introduced by Wu et al., based on the safety distance model of two anchoring ship, and the process of dragging anchor, drift direction and the speed of dragging anchor were studied [25]. Li put forward a relative safety distance model from the anchoring ship to waterways, including locations such as areas with an intensive traffic flow [28]. In [36], a calculation method was proposed for the anchoring safety distance based on ship drift motion and ship collision risk. A fixed-point anchoring scheme was then proposed, comprehensively considering the basic turning radius of a single anchoring ship and the distance between anchoring ships with maneuvering difficulty [37]. The safety distance between anchoring ships is also influenced by the captain’s risk appetite and pressure mode [27].
In conclusion, the current anchorage circle radius mainly considers factors such as chain length, catenary and the projected length of the anchor chain, horizontal chain and ship length into consideration, which revealed a shortcoming, namely, the insufficient consideration of factors such as ships carrying hazardous goods, ship parameter, the distance from anchor chain hole to the bow and stern centerline, trim angle and water depth. Hence, the existing anchorage circle radius model and radius value cannot fully reflect the engineering practice background. The safety distance between anchoring ships should be set based on the safety radius of two ships, and the navigation impact of passing ships in the anchorage area should also be taken into consideration. Therefore, it is necessary to fully consider factors including ships carrying hazardous goods, ship parameters, ship loading conditions, anchorage depth as well as the risk of ships sailing in the anchorage area. Additionally, the practical background of anchoring engineering will be fully reflected by the distance model.

1.2.2. Method of Mooring Area Detection

Some valuable work was carried out on MASS mooring area detection. The essence of mooring area detection is to detect a circular anchor area, which can be obtained by the method of Euclidean space distance, image identification [38,39] and so on. In [40], the adaptive genetic algorithm was applied to optimize the automatic detection results of mooring area based on the gray system and an artificial neural network, and the final detection results of mooring area were output while the artificial intelligence system completed the regional detection of the mooring area. However, the anchorage circle radius and safety distance model were inaccurate. In [35], the disc packing algorithm was applied to optimize anchorage space utilization and specify the anchor position. In [41], the calculation model of the anchorage space capacity of standard ships was established based on the Monte-Carlo algorithm. In [26], the Multi-Objective Anchorage Planner (MOAP) algorithm was studied based on safety and efficiency, and verified with historical data and the Monte-Carlo algorithm. The MOAP algorithm could provide safer anchorage planning while maintaining the same optimization level. The Monte-Carlo algorithm can provide a fast simulation method. In [42], the reliability calculation of anchorage capacity and the redundancy optimization model was proposed, which would effectively solve the problem of optimizing anchorage space utilization under the influence of anchorage capacity uncertainty.
In conclusion, the current research of anchorage detection mainly focuses on the length of the anchoring chain, anchorage radius, safety spacing of anchoring ships, anchorage planning, utilization rate of anchorage space and so on. The factors mentioned above could play a certain supporting role in the detection of mooring area. Only a few of studies have applied the Adaptive Genetic Algorithm [20] to optimize the automatic detection results of the mooring area in the gray system and artificial neural network system and the artificial intelligence system to detect the mooring area, and to output the final detection results of mooring area. However, the anchorage radius and anchor spacing model used in this method might be inaccurate.

1.3. Motivation

Despite the number of research works devoted to the length of the anchoring chain, anchorage circle radius, safety distance between anchoring ships, anchorage planning, utilization of anchorage, and so on which could play a supporting role in the detection research of mooring area, there are some research gaps in the existing studies. The extensive literature search shows that there are few studies on the mooring area detection. The existing anchorage circle radius model is relatively primitive, because it only takes the length of the anchoring chain and water depth into consideration and lacks consideration of the ship type, loading condition and the safety of the anchoring ships and the ships passing through the anchorage. It is necessary to conduct further research on the anchorage circle radius and the safety distance model between the anchor positions. More importantly, there are few intelligent detection methods for the mooring area. Meanwhile, the existing research cannot meet the needs of the development of ship industry, and the navigation practice needs the support of scientific detection method of mooring area.
In order to improve the detection capacity and accuracy of the mooring area, the following aspects were investigated in this study:
  • The anchorage circle radius model was improved by considering parameters such as ship type, ship width, ship length, distance from anchor chain hole to bow and stern line, trim angle and water depth and so on. The improved model reflects engineering practice more accurately, ensuring the authenticity of the results.
  • The safety distance model between the anchor positions was also improved. The improved model not only considered the parameters of the anchorage circle radius model, but also took into account the safety impact caused by ships passing through the anchorage. The improved model presents a better reflection of the engineering practice, making the distance safer and more reasonable.
  • An intelligent detection algorithm combining the anchorage area detection model and the Monte-Carlo stochastic simulation method was established, and a large amount of random numbers were used to perform the detection operation and simulation, so as to quickly obtain the distribution of the anchor position of ships waiting to anchor. Under the support of the anchor position conversion model, and the dropping anchor position conversion model, the draping anchor position or the ship position of the dropping anchor were transferred from the anchor position.

1.4. Contributions

In contrast to the aforementioned work, the contributions of this study mainly concern two aspects.
  • The anchorage circle radius model and safety distance model between the anchor position were improved, which can help to fully reflect the engineering practice in a more safe and reasonable way.
  • An intelligent model combining the MASS mooring area detection model and the Monte-Carlo stochastic simulation method was established, which can quickly detect the anchor position that matches with MASS, thereby improving on the previous research on mooring area detection.

2. Mooring Area Detection of Single Anchored MASS

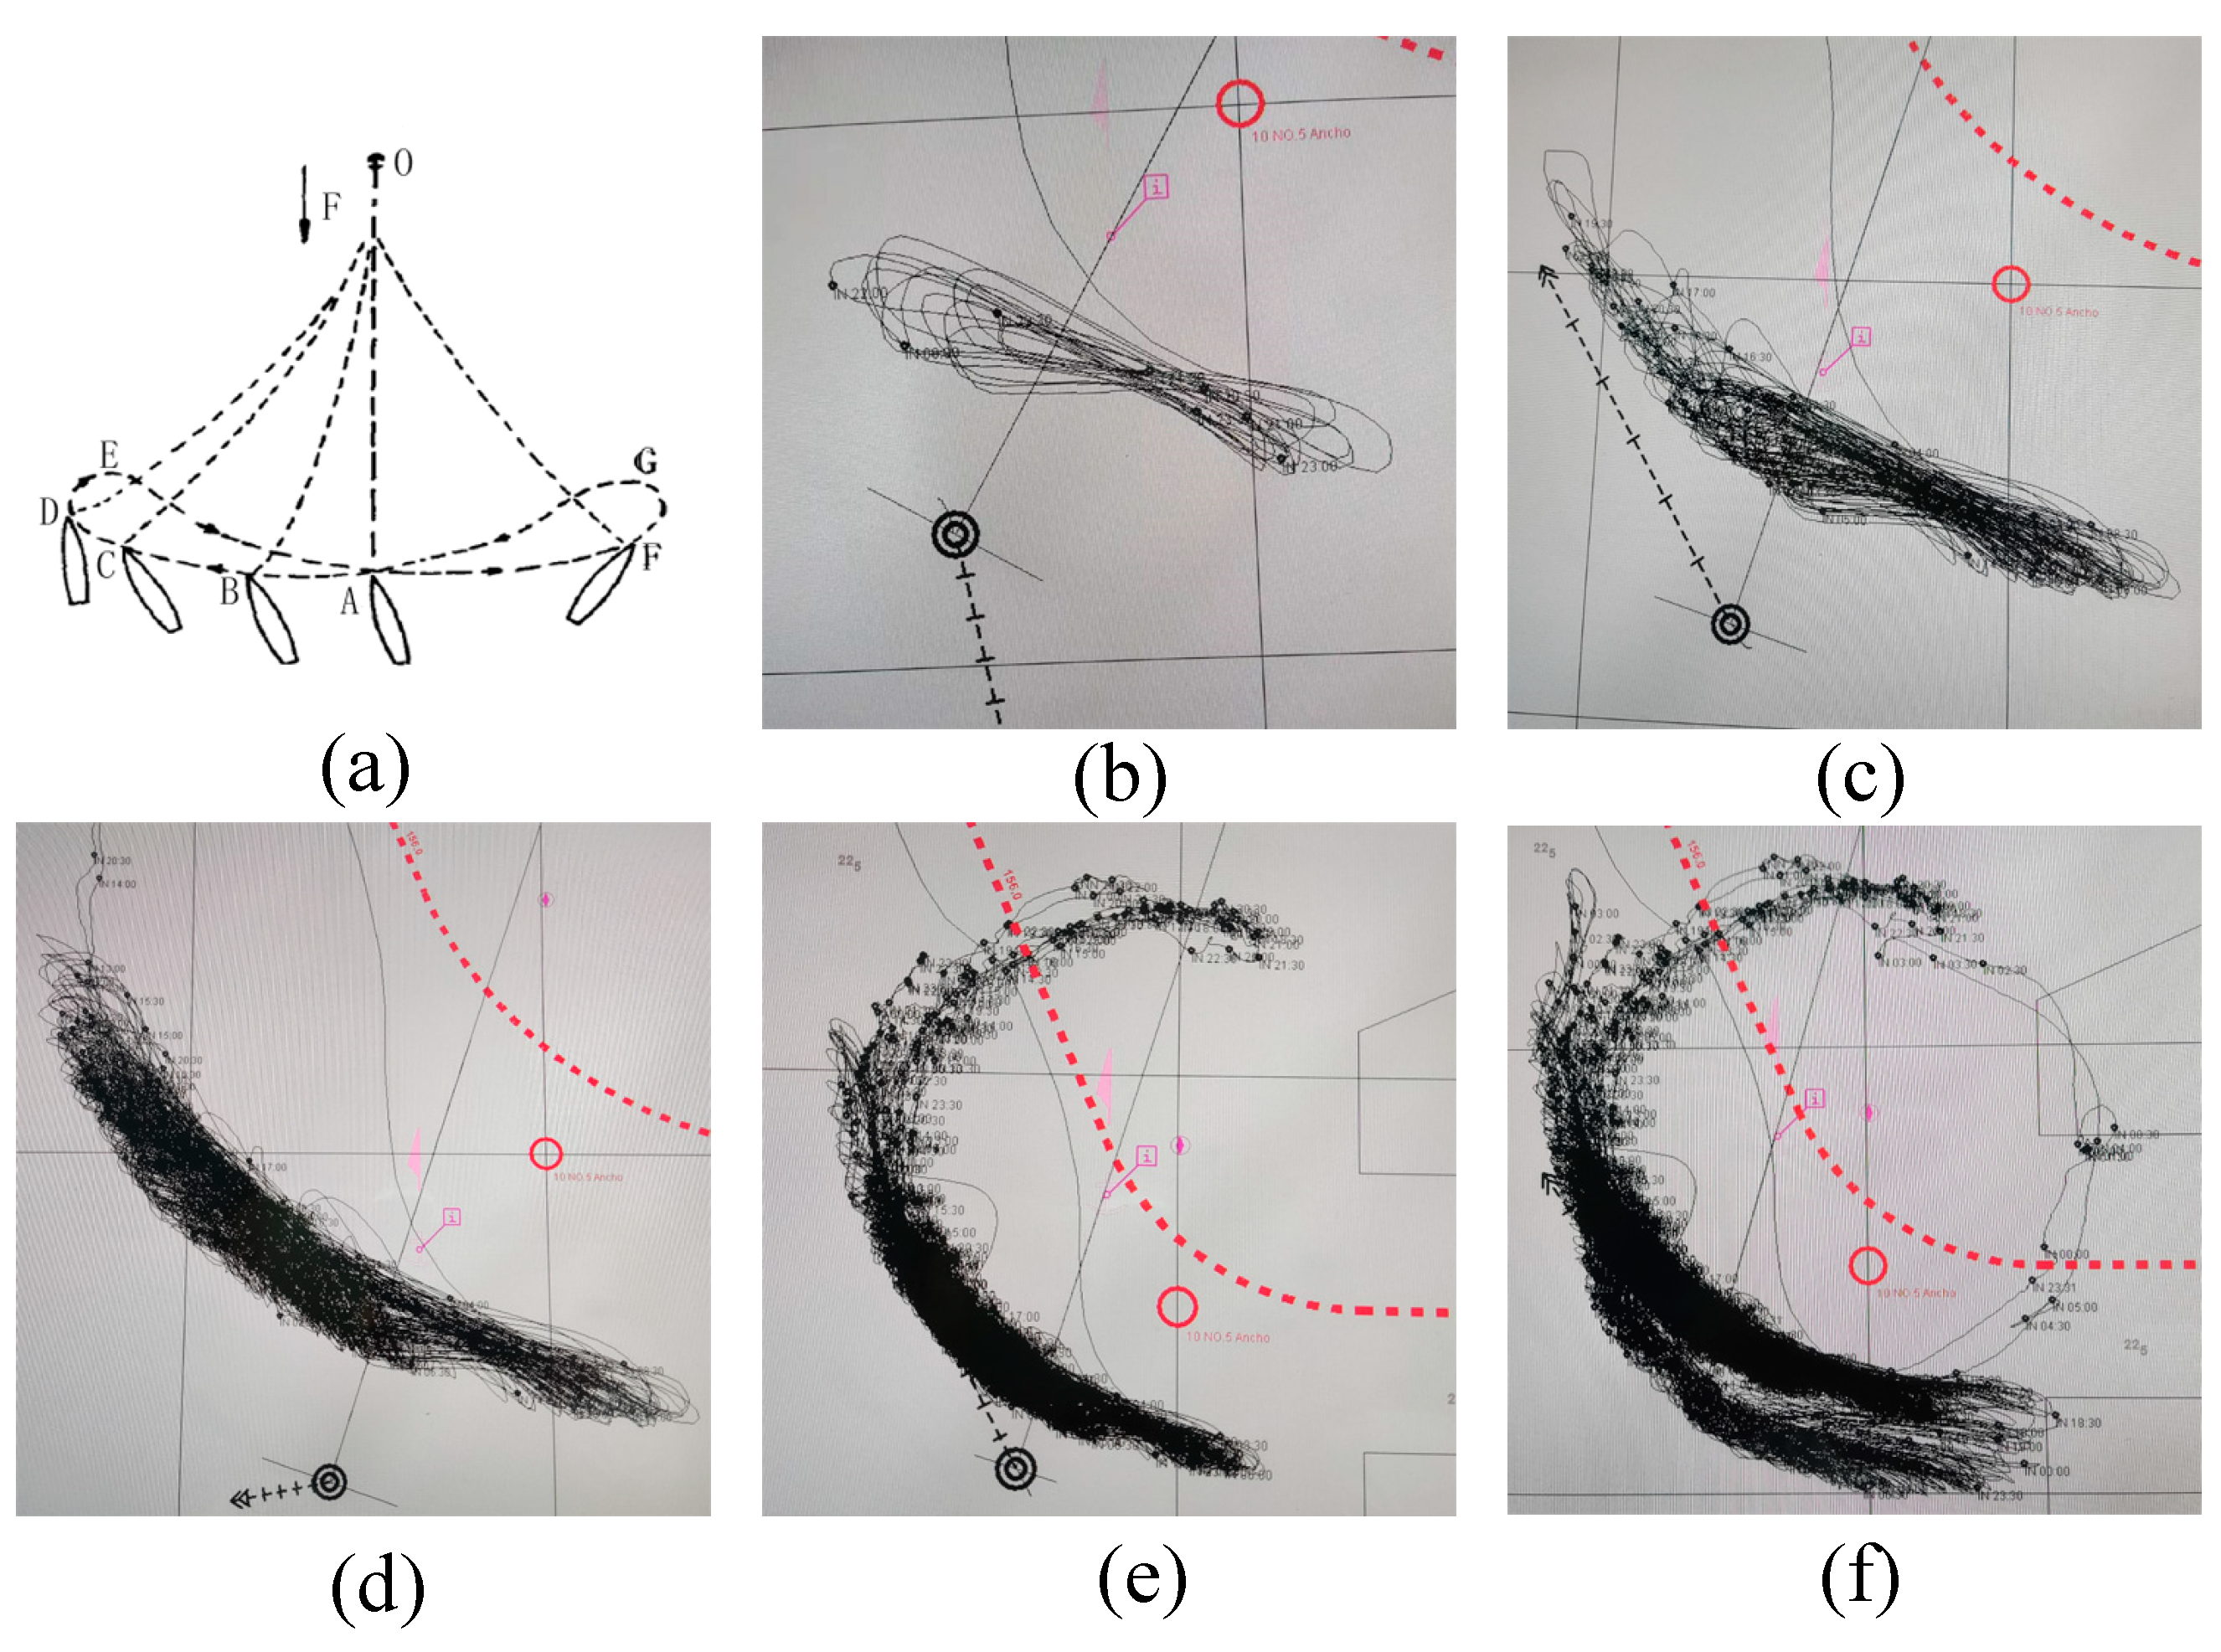
2.1. Motion Law of Single Anchoring Ship

The single anchoring method is one of the commonly used anchoring methods for ships. There are two modes in operation: the forward anchoring method and backward anchoring method. In most cases, the backward anchoring method against the wind flow direction of the ship is adopted, because the ship speed is opposite to the wind flow direction, which is convenient to control the residual speed of the ship and find the anchor position. Then, it is convenient for the anchor to break through the seabed and grip it firmly. When it comes to the forward anchoring method, the ship speed is in the same direction as the wind flow direction. After anchoring, the ship is forced to turn to the opposite direction of the wind flow, which requires a large turning space. Additionally, it is difficult to control the ship position because of the large inertia. Figure 1 shows the process of the backward anchoring method. After reaching the predetermined anchor position, the ship drops the anchor at the point A 1 . At this time, the position information displayed by the ship position sensor is A 1 . The ship retreats slowly under the influence of wind, wave and current and its own maneuverability. The anchor gradually grips the bottom material and finally stabilizes at the point A 2 with the position displayed by the ship position sensor as the point A 3 .
Once anchored, the single anchoring ship moves in a complex way under the comprehensive influence of wind, wave, rotary flow and reciprocating flow. Figure 2a shows the motion state of an anchoring ship under the influence of external forces, where point 0 is the anchor position and points A–G are the motion track of the bow. Figure 2b–f shows the hourly ship track of a real-scale ship in 12 h, 24 h, 5 day, 10 day and 15 day periods, respectively. In conclusion, when the external forces are relatively stable, the anchoring ship presents the characteristics of a short periodic yawing at anchor. When the external forces are unstable, the anchoring ship moves in an approximate circular motion in the long-period state. Its swing amplitude and circular radius are closely related to the external forces.
On the vertical plane, the single anchoring ship produces a radial reciprocating motion under the influence of different external forces of wind, wave and current. The length of the anchor chain of the ship at point A in Figure 3 is S ; the catenary S S is in a certain radian, and the horizontal chain S L lies flat on the seabed. The resultant force of the gripping force P of the anchor and the friction force of the horizontal chain is greater than or equal to the external force F . If F becomes larger, the ship moves from point A to point B and becomes stable at point B. If P is equal to F , at this time, the catenary length becomes longer while the horizontal chain becomes shorter. If F continues to grow and exceeds P , there is a risk of anchor dragging. If F becomes smaller, the anchoring ship will move from point B back to point A. Therefore, the above factors need to be taken into full consideration for the perspective of anchoring safety. In particular, the appropriate anchorage circle, anchor position and anchorage circle radius should be selected in the dense waters of ships.

2.2. Method of Traditional Ship Anchorage Area Detection

In traditional methods, usually, the radar or electronic chart equipment is applied to select the anchor position, and a circle is selected with a certain radius without anchoring ship and water surface obstacles in areas with appropriate water depth and seabed sediment. The circle detected by this method meets the requirements, namely, the appropriate anchorage circle. The radius is the safety anchorage circle radius, and the center of the circle is the anchor position.
Figure 4 provides the diagram of ship anchor position selection, in which the blue dot represents the obstacle. In Figure 4a,b, the anchorage circle 1 has no interference from other obstacles within the anchorage circle radius, and the point O can be used as the dropping anchor position of the anchoring ship; the anchorage circle 2 is impacted by obstacles within the anchorage circle radius, which is not suitable for the anchorage circle of anchoring ship. In Figure 4b, there is an influence of wind flow, and the center point O of anchorage circle 1 can be used as a suitable dropping anchor position. However, due to the influence of wind flow in the process of anchoring, there will be a process of moving to the direction of force, which leads to a new anchor position O . There are two obstacles in the new anchorage circle, which present potential risk in anchoring. Therefore, the influence of wind flow should be fully considered when selecting the anchor position. In navigation practice, there are few scientific intelligent detection methods of anchorage area; therefore, ships usually choose a larger anchorage circle radius to ensure the anchoring safety, which objectively causes the waste of the anchorage area resource. In addition, some spaces in the anchorage area could be regarded as the anchorage area if the detection capacity is qualified for it.

3. Methodology

3.1. Anchorage Circle Radius Model

The anchorage circle radius is not only related to the size of the safety mooring area of ships, but also influences the utilization rate of the anchorage area to a great extent. The anchorage circle radius is related to the length of the anchoring ship outgoing chain, the ship parameters, the loading conditions, the draft and the safety of ships passing through the anchorage area. The extended chain length S of the anchoring ship includes the following three parts: the length k of the anchor chain on the deck, the suspended length S S and the length S L of the chain cable lying on the seabed. Referring to Figure 1, the anchorage circle radius of the ship can be gained, which can be expressed as Equation (1).
{ R = L 1 + L 2 + L 4 L 5 + ε L 4 = L S × cos α L 5 = L S A × cos α
where R indicates the radius of the anchorage circle of the ship; L 1 indicates the length of the chain cable lied on seabed; L 2 indicates the horizontal projected length of the catenary of the anchor chain; L 4 indicates the horizontal projected length of the bow and stern of the ship; L 5 indicates the horizontal projected length from the anchor chain hole to the front end of the deck; ε indicates the positioning error of the position sensor of the ship; α indicates the ship trim angle, which can be obtained from the state sensor of the ship; L S indicates the length between the bow and stern of the ship; L S A indicates the length from the anchor chain hole to the bow of the ship.
Referring to Figure 3 with a consideration of the motion limit of the anchoring ship, the horizontal projection of the anchor chain is simplified and can be expressed as Equation (2).
{ L = L 1 + L 2 = ( S k ) 2 D 2 D = D W + D A d F
where, D indicates the water depth from the anchor chain hole to the seabed; D W indicates the charted water depth, D A indicates the ship shape depth at the anchor chain hole; d F indicates the draft of the bow of the ship.
Therefore, the anchoring radius model under general conditions can be derived, which can be expressed as Equation (3):
R = ( S k ) 2 ( D W + D A d F ) 2 + ( L s L S A ) × cos α + ε
Considering the safety factors of other ships passing through the anchorage area, the anchorage circle radius needs to be reserved for 2–3 times the ship width [43] so as to ensure the anchoring safety. In addition, considering the characteristics of ships carrying hazardous goods, the anchorage circle radius should increase the safety margin by a certain amount compared with general freight anchoring ships. Therefore, the general anchorage circle radius model can be further expressed as Equation (4).
R = σ [ ( S k ) 2 ( D W + D A d F ) 2 + ( L s L S A ) × cos α + ε + τ B ]
where, σ indicates the ship type, σ [ 1 , 1.2 ] ; the σ of general cargo takes the lower limit, and the σ of ships carrying oil, liquefied gas and chemical products takes the upper limit according to the risk; τ indicates the ship width coefficient, τ [ 2 , 3 ] ; B represents the width of the ship [44].
The chain length greatly influences the anchorage circle radius. Researchers from various countries have proposed a variety of chain length [23,26], as shown in Table 1.
According to the data analysis in Table 1, the outgoing chain length model of Chinese anchoring ships is the most conservative and safe option compared with other models. Therefore, this study adopted the Chinese anchoring outgoing chain length model and further improved the anchorage circle radius model, which can be expressed as Equation (5):
R = { σ [ ( 3 H + 90 k ) 2 ( D W + D A d F ) 2 + ( L S L S A ) × cos α + ε + τ B ] , Wind 7 σ [ ( 4 H + 145 k ) 2 ( D W + D A d F ) 2 + ( L S L S A ) × cos α + ε + τ B ] , Wind > 7

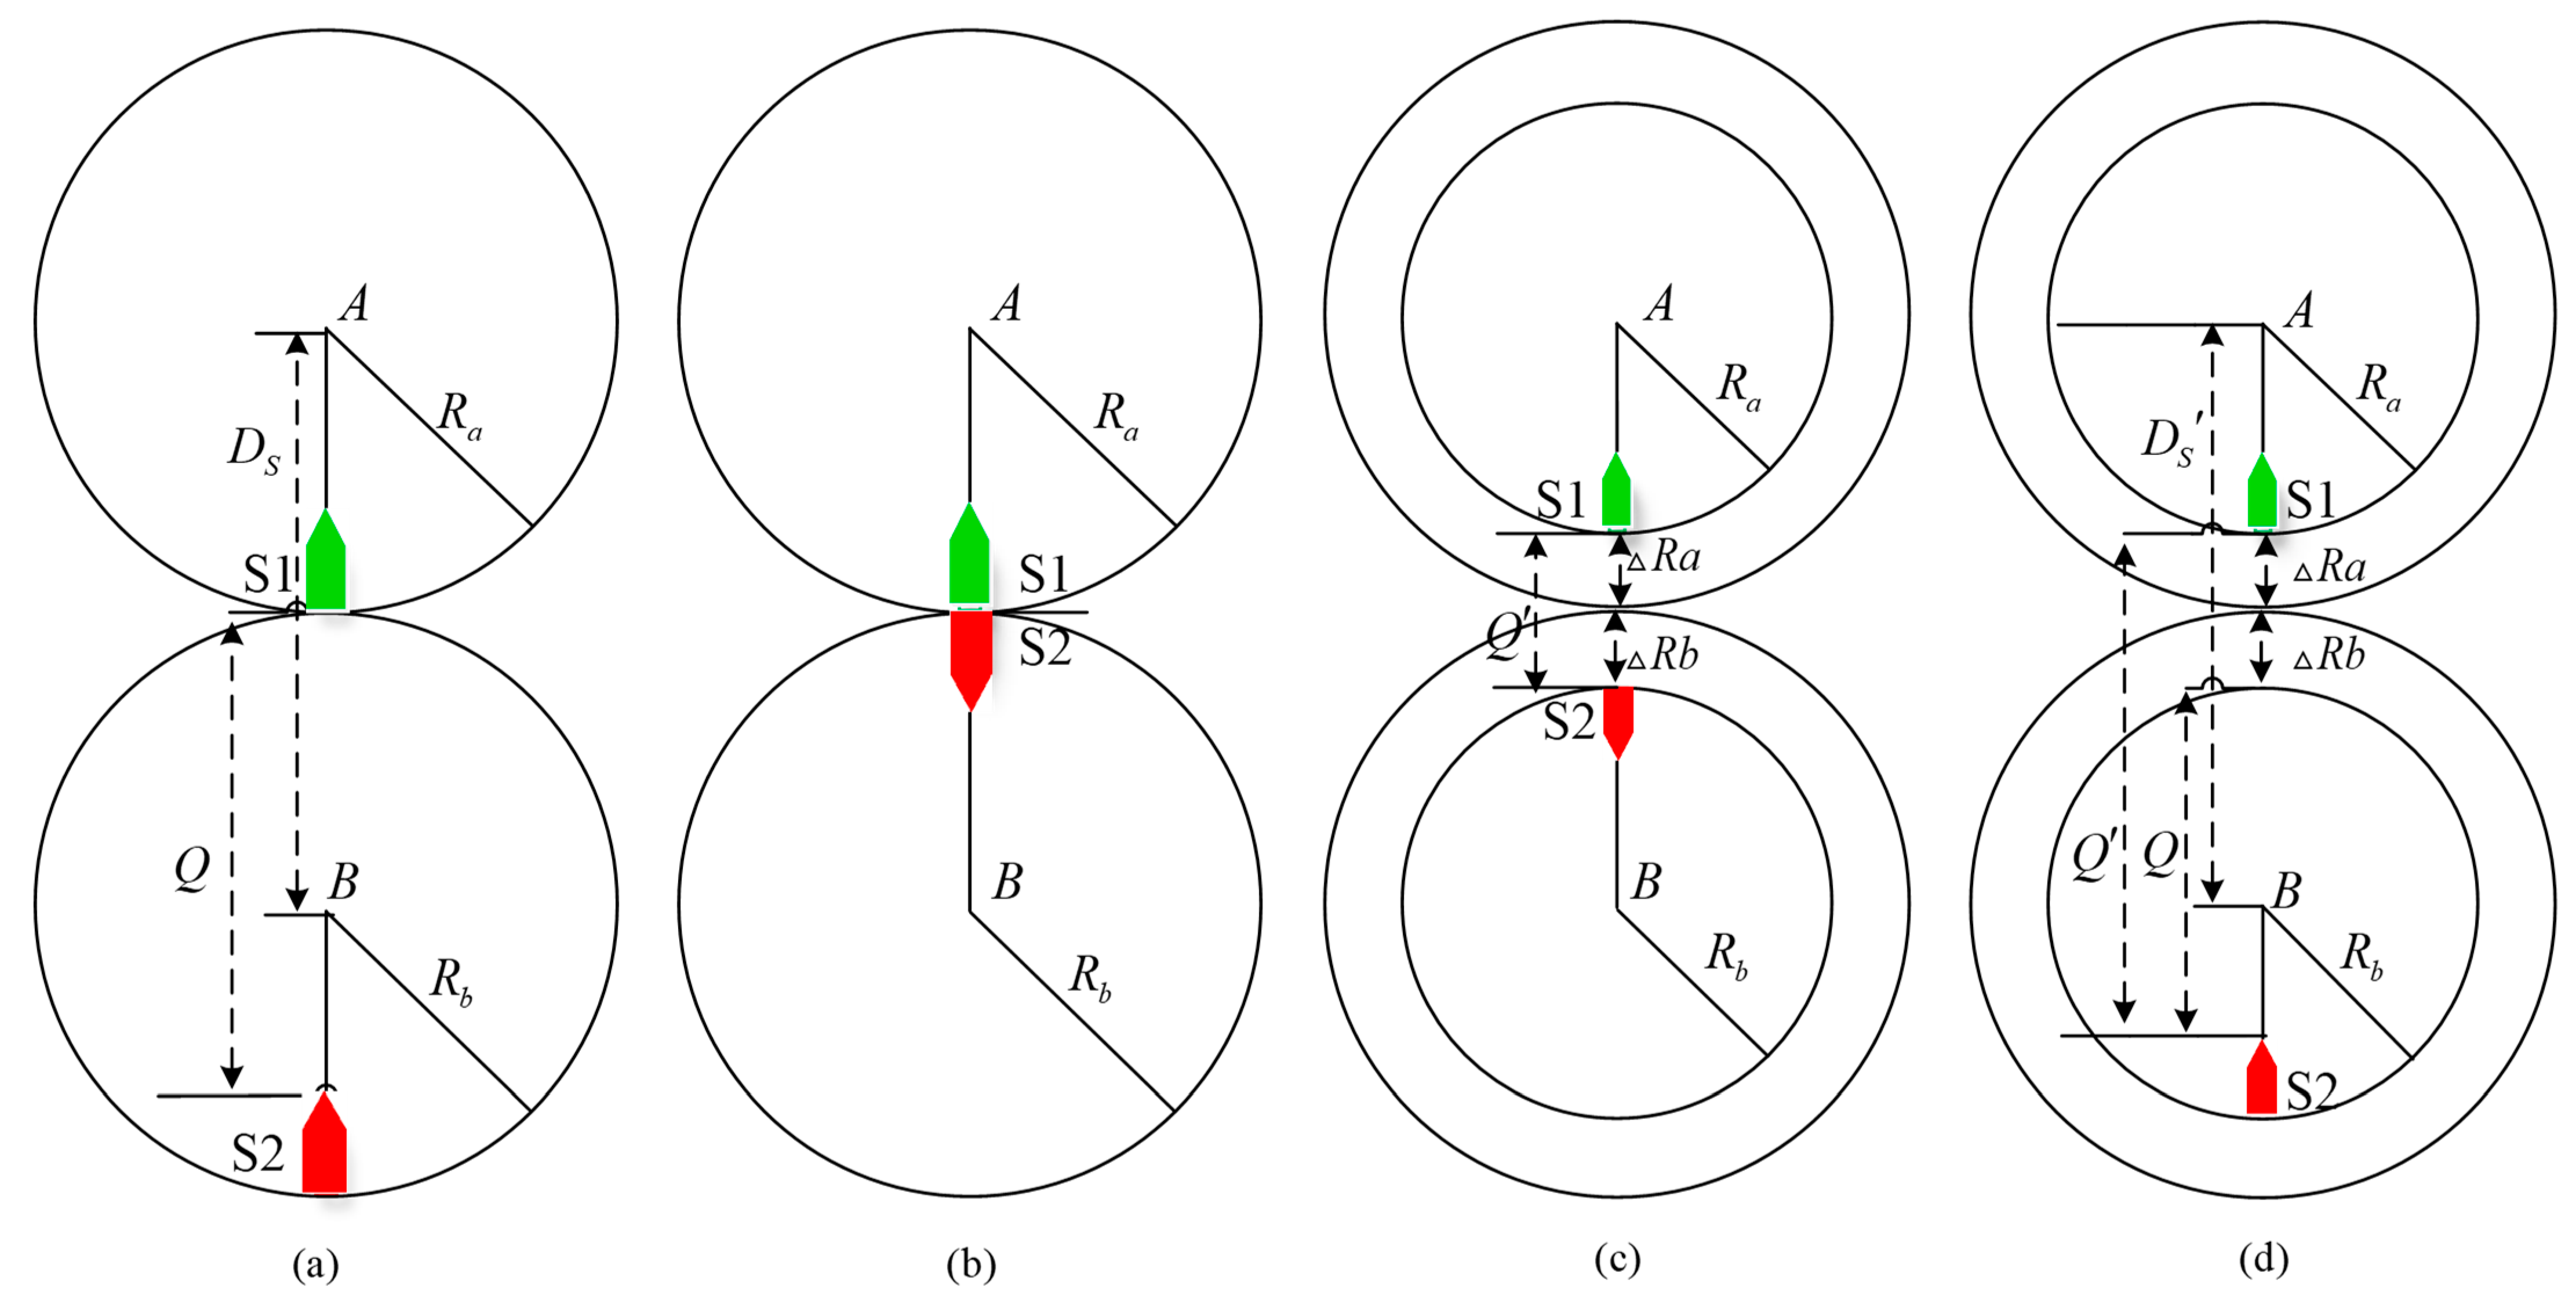
3.2. Safety Distance Model

The establishment of the anchoring radius model was based on the full consideration of the circular motion characteristics of the anchoring ship. However, due to the interaction between anchoring ships, the safety distance between two anchoring ships was taken into consideration so as to avoid the safety interference between multiple ships. Figure 5 simulates the motion trajectories of two anchoring ships. Figure 5a shows the motion dynamics of the two anchoring ships in synchronous motion, and the distance between them satisfies Equation (6) in this state.
{ Q = 2 R b L S 2 D S R a + R b
where, Q is the distance between the two anchoring ships; D S is the distance between the anchoring ships; R b is the anchorage circle radius of ship B; and L S 2 represents the length of ship B.
Figure 5b shows the extreme motion dynamics of two anchoring ships which were not in the synchronous motion. At this time, the two anchoring ships are in opposite directions and their sterns are opposite, which is the most dangerous state. Once a ship’s anchor drags out of control, there is a danger of collision. Therefore, the two anchoring ships will set a certain safety margin while determining the anchorage circle radius, which can be expressed as Equation (7), as shown in Figure 5c,d.
{ R A S = R a + R a R B S = R b + R b Q = 2 R b + R a + R b L S 2 D S = R A S + R B S
where, R A S is the safety anchorage circle radius of ship A; R a is the anchorage circle radius of ship A.
In navigation practice, it is difficult for ship B to gain the anchoring radius R a of ship A, because the anchoring ship A reciprocates irregularly in the radial direction within the anchorage circle. Additionally, the reasonable distance can only be determined according to the data from ship B. The distance Q shown in Equation (7) is normally used to determine the radius of the anchor position. Considering motion features of the anchoring ship, the distance Q is a variable. The anchorage circle radius based on distance Q may result in a small value, thus leading to a situation similar to the presence of obstacles in the anchorage circle in Figure 4. In order to avoid it, a larger anchorage circle radius would be chosen, which objectively wastes the anchorage space. Moreover, it is safe and reliable to use the safety distance D S and Q in mooring area detection if there is an accurate anchor position.
In addition, considering ships passing through the anchorage, Equation (6) adds a parameter τ as a safety margin in the anchorage circle radius model of Equation (5). Therefore, the safety distance model of two anchoring ships can be further derived, as shown in Equation (8).
{ R A S = σ a ( R a + τ a B a ) R B S = σ b ( R b + τ b B b ) D S = R A S + R B S
where, σ a and σ b are ship type coefficients of ship A and ship B, respectively.

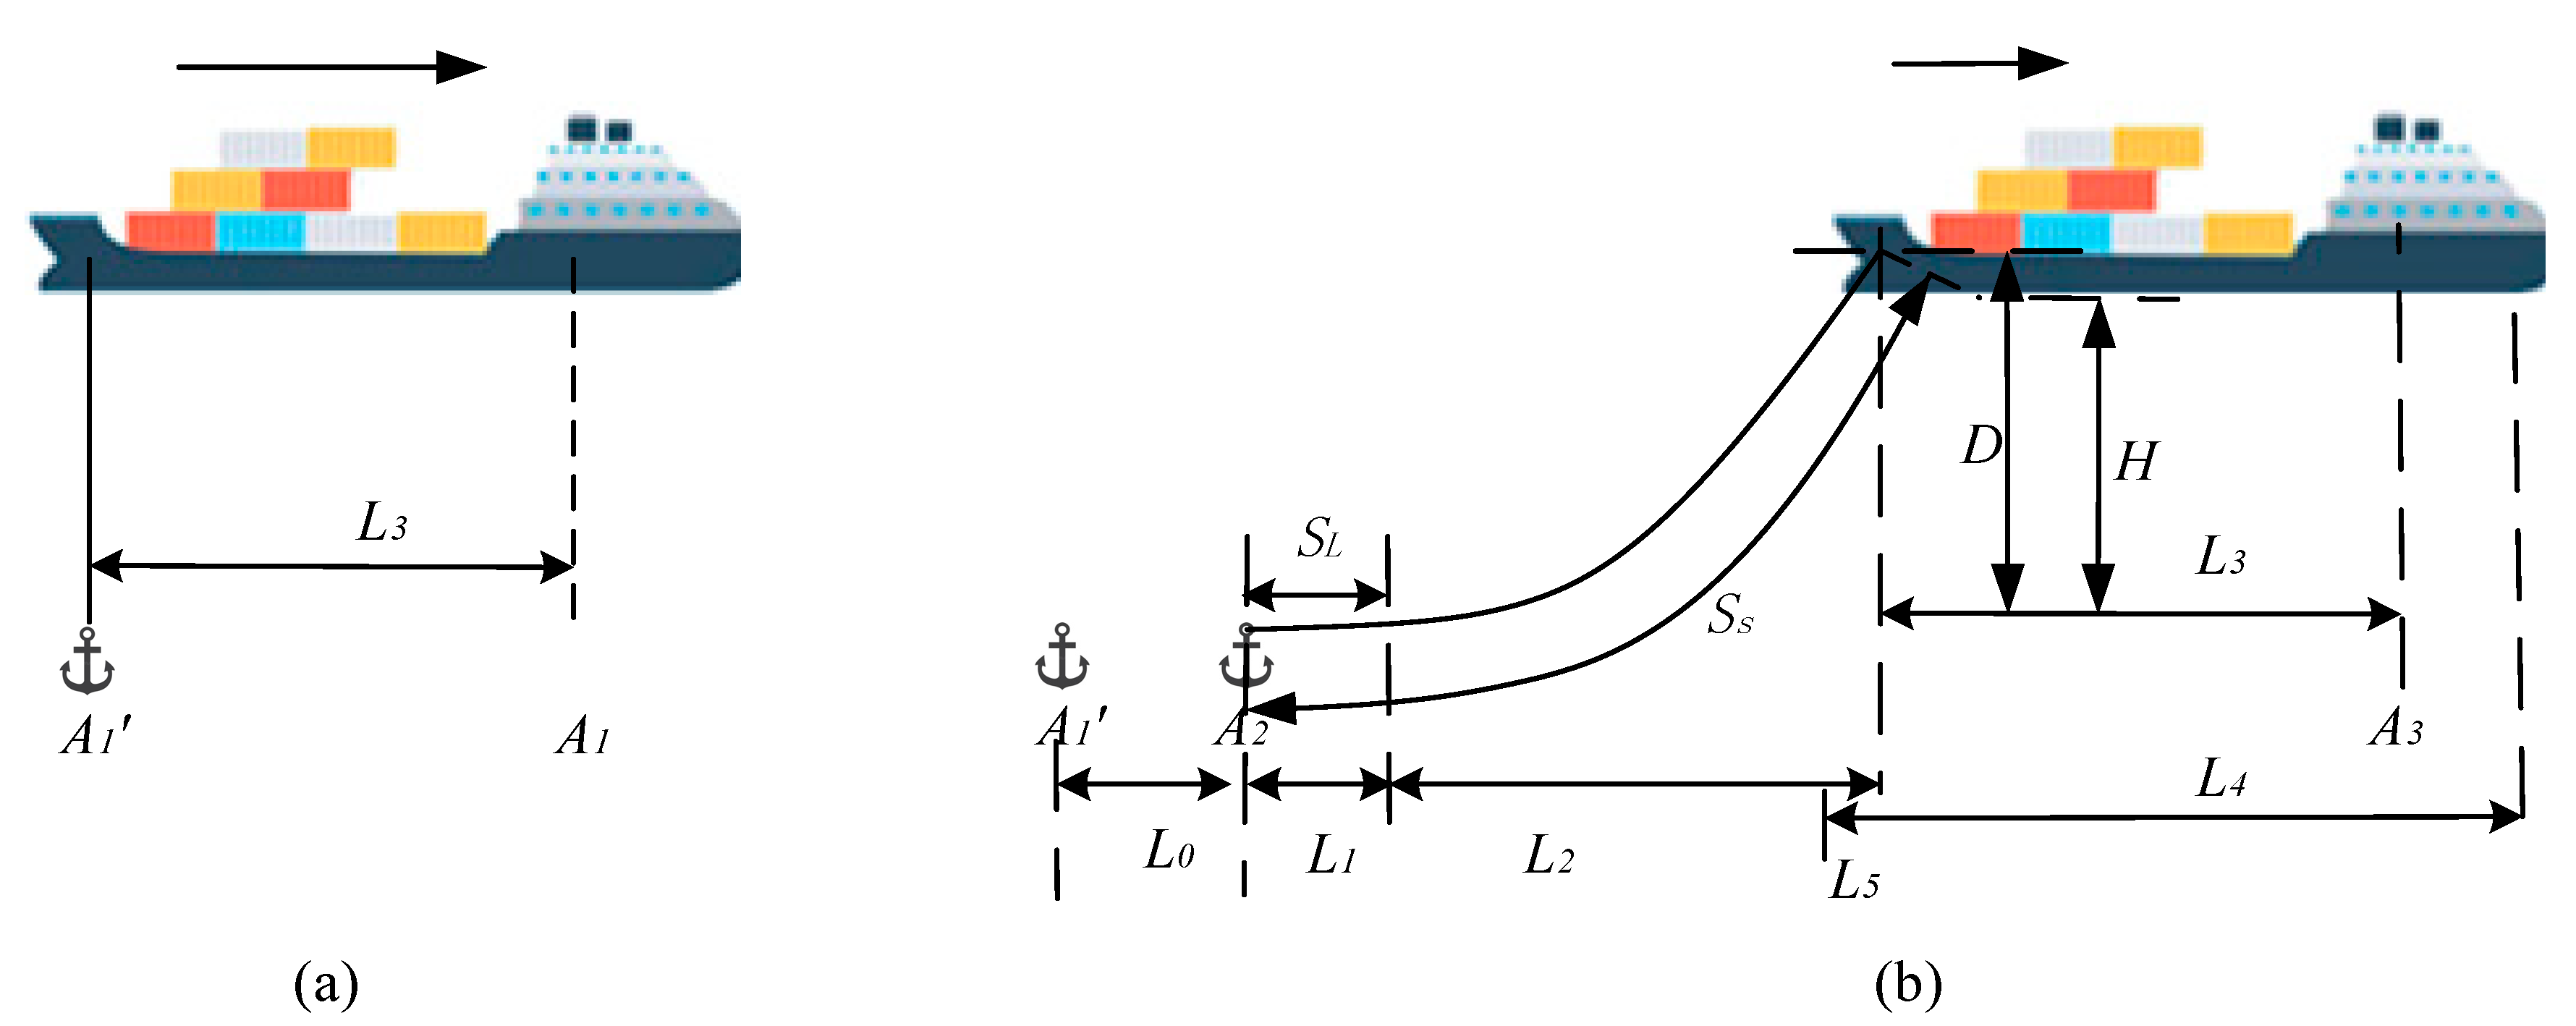
3.3. Conversion Model of Position of Anchor-Dropping

The anchor-dropping position is the location where the anchor was dropped when the ship is in the operation of anchoring. As shown in Figure 6a, the position of dropping anchor position is A 1 , and the point recorded is actually A 1 , due to the position sensor antennas usually being installed far from the anchoring equipment. In Figure 6, a and b represent the distance from the GPS/ GNSS/ BDS sensors to the bow and stern ends of the ship, respectively; c and d represent the distance from the GPS/ GNSS/ BDS sensors to both sides, respectively. The values of a, b, c and d are obtained from the ship’s drawings or from GPS/ GNSS/ BDS sensor parameters. Additionally, the distance between the anchor chain hole and the bow is e, and the distance between the anchor chain hole and the windlass is k.
In Figure 6a, a coordinate system with the same ship position as the origin is established. The X-axis represents the fore-aft axis and the Y-axis represents the athwartship axis. θ represents the angle between the line connecting the anchor chain hole and the ship position and Y-axis. θ represents the angle between the line connecting the anchor position with the ship position and Y-axis. The coordinates of the position of anchor-dropping A 1 ( φ 1 , λ 1 ) can be calculated with Equation (9) and the ship position coordinates A 1 ( φ 1 , λ 1 ) were recorded at the time of anchoring.
{ φ 1 φ 1 + Z 1852 × cos θ λ 1 λ 1 + Z 1852 × sin θ
where, Z is the distance between the anchor-dropping position of the ship and the position actually recorded by the ship during anchor dropping, and θ is the included angle between the connecting line from the anchor chain hole and the ship position in the coordinate system and the abscissa.

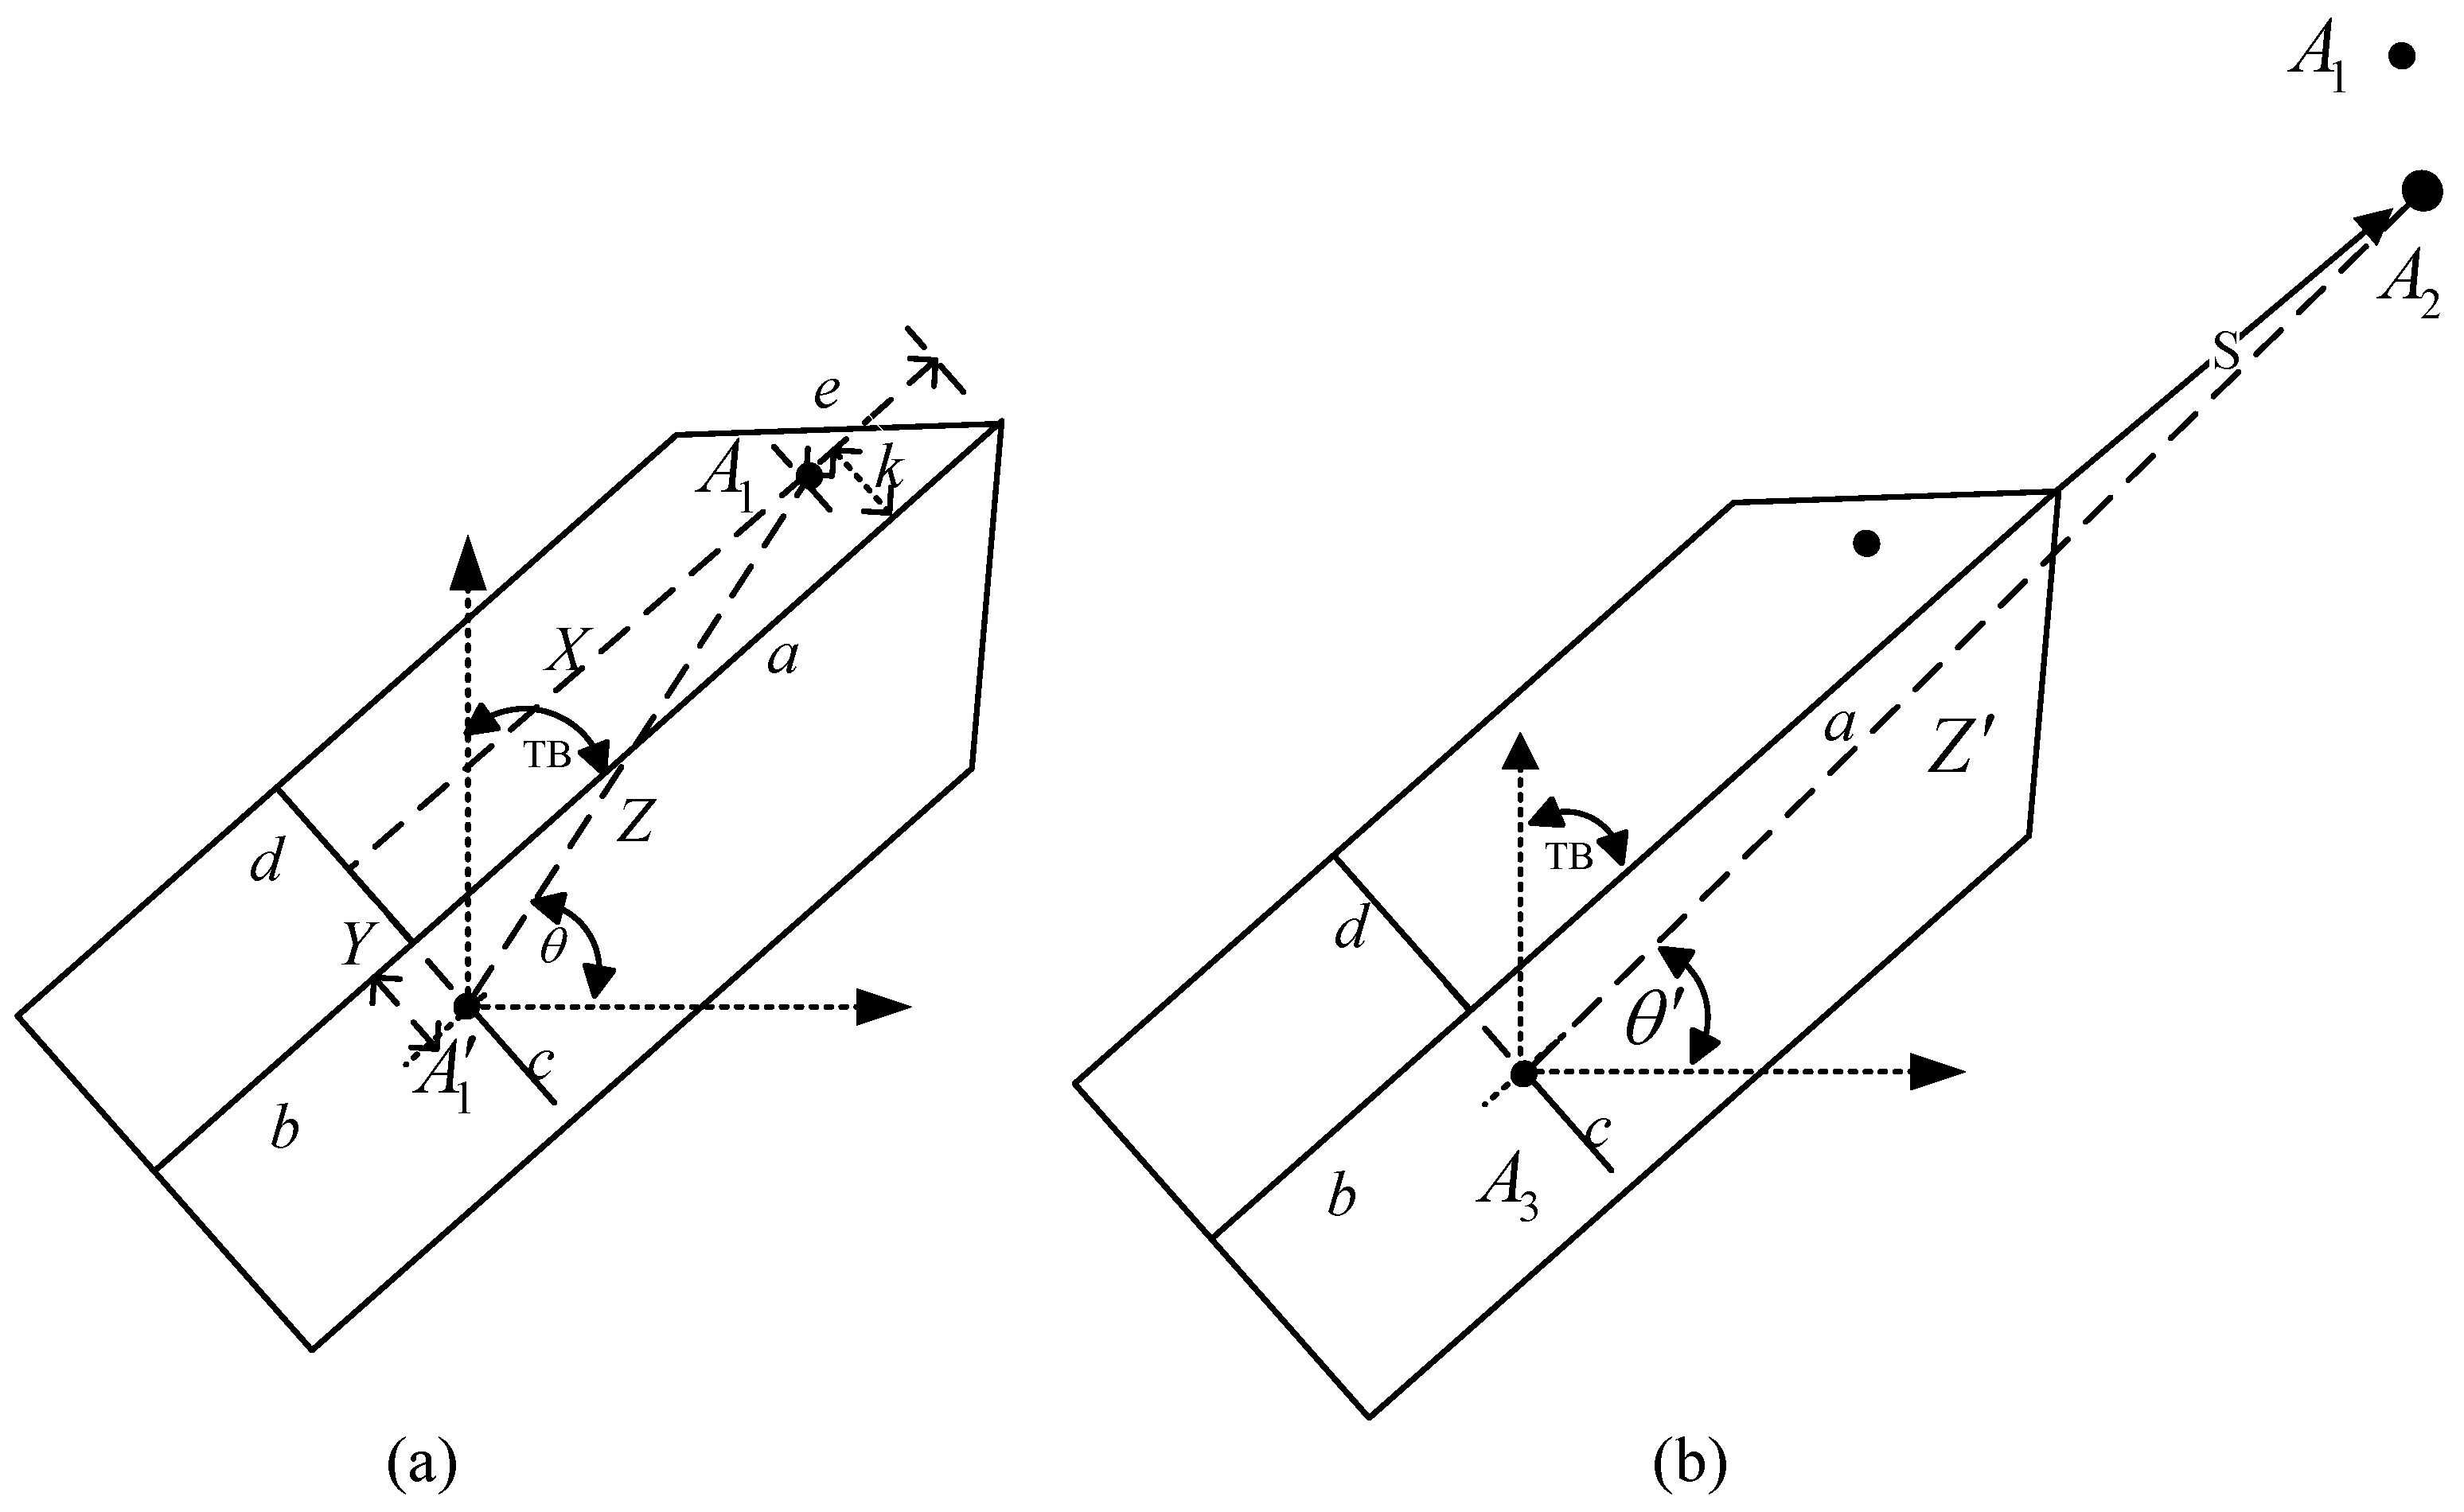
3.4. Conversion Model of Anchor Position

The anchor position refers to a position where the ship is relatively stable by grasping the bottom material while anchoring A 2 is shown in Figure 1 and Figure 6. In the horizontal direction of sea bottom, there is a certain displacement L0 of the anchor from the dropping anchor position A 1 that is instructed to let go of the anchor to the anchor position A 2 , as shown in Figure 1. Reasons for the formation of L0 are relatively complex and hard to calculate, which are related to the ship’s maneuverability, type, tonnage, speed, loading situation, anchor type and other factors, as well as external wind and waves, water depth and bottom material.
  • There is a certain time interval from the issued order of anchoring to the actual settlement of the anchor. Since the ship moves with a certain speed, a certain displacement of the anchor in the horizontal plane of the ship’s movement is detectable. The operation of anchoring by the windlass takes longer than gravity anchoring, and will generate more horizontal displacement.
  • There is a certain horizontal displacement during the process of the anchor falling to the bottom, inserting into the bottom material and stabilizing to the anchor position.
  • The anchor and anchor chain are affected by wind and waves during the anchoring operation, resulting in a certain displacement of the anchor in the horizontal direction.
  • During the reversing process of the ship, a large horizontal force upon the ship is generated, and the anchor is dragged, thus presenting a certain horizontal displacement.
Therefore, the vector model of the anchoring motion is summarized in Equation (10).
L 0 = V t + L A + L W + L P
In Equation (10), L 0 is the anchoring motion vector; V represents the ship vector speed; t the ship anchoring time, that is, the time from the moment when the order is issued to the time when the anchor claw penetrates into the bottom material; L A is the anchor dragging motion vector; L W is the horizontal motion vector generated by the wind, waves and currents; and L P represents the anchor dragging vector due to the reverse horizontal force. The anchoring motion vector model involves many factors and it is difficult to quantify them. Then, in order to find the anchor position, as shown in Figure 6b, the position sensor coordinates of A 3 ( φ 3 , λ 3 ) , namely, the ship position after anchoring, can be calculated by Equation (11).
{ φ 3 φ 3 + Z 1852 × cos θ λ 3 λ 3 + Z 1852 × sin θ
where, Z is the distance between the anchor position of the ship and the position actually recorded by the ship during anchor dropping, and θ is the included angle between the connecting line from the anchor position to the ship position in the coordinate system and the abscissa.

3.5. Monte-Carlo Mooring Area Detection Model

There are four main elements in solving the mooring area detection:
  • Establish a mooring area detection model. By establishing the plane rectangular coordinate system of the anchorage area, two-dimensional coordinates are set for ships or objects in the anchorage that hinder the anchoring operation. Then, the Euclidean metric method is adopted to construct the anchoring area detection model of the anchoring ship, so as to select the anchor position that meets the safety distance between two anchoring ships, as in Equation (12).
    { d n = ( x a x n ) 2 + ( y a y n ) 2 M i n ( d n ) D S
    where, ( x n , y n ) is the position of the existing ship or other objects in the plane rectangular coordinate system of the anchorage area. ( x a , y a ) is the anchor position, which satisfies the safety distance of anchoring ships.
  • The random function of the Monte-Carlo method is taken to generate random two-dimensional coordinates ( x 1 , y 1 ) , ( x 2 , y 2 ) ( x n , y n ) in varying amounts within the anchorage, so as to simulate the ship position of the existing anchoring ship, namely, to simulate the interference term of the target anchoring ship during the detection of the anchorage area. The distance of these coordinates meets the safety distance D S requirements for anchoring ships. Then, with the conversion model of the anchor position, the above ship positions are converted into the anchor position ( x 1 , y 1 ) , ( x 2 , y 2 ) ( x n , y n ) of the existing anchoring ship.
  • The random function of the Monte-Carlo method is taken to generate random two-dimensional coordinates ( x 1 , y 1 ) , ( x 2 , y 2 ) ( x n , y n ) in varying numbers within the anchorage, so as to simulate the two-dimensional coordinates of the ship positions of the target ship.
  • Based on Equation (12), the two-dimensional coordinates of the anchor positions of the target ships are calculated that meet the requirements of D S .

4. Case Study

4.1. Set Up

In this experiment, a mooring area of 2 nautical miles × 2 nautical miles was defined on the MATLAB, and the water depth value was 20–40 m. For the convenience of the mooring area detection research, the following assumptions were made:
  • The influence of wind, current and anchoring ship on the anchoring was not taken into consideration, that is, the anchoring dropping point coincided with the anchor position, L0 = 0;
  • The anchor position was directly in front of the ship, that is, on the ship’s course line;
  • The trim angle of the ship was assumed to be α = 0.5°;
  • The value range of coefficient τ was [2,3]. In this study, the cargo ships passing through the anchorages were general cargo ships, so the value of τ was 2;
  • In this experiment, the selected ship type was a general cargo ship, σ = 1;
  • The positioning error of GPS/GNSS/BDS was not taken into account.
In this study, three general cargo ships were selected, and the specific ship sizes are shown in Table 2. Where L S is the designed length of the ship (m); B is the moulded breadth of the ship (m); D A is the moulded depth of the ship at the chain hole (m); L S A is the distance from the chain hole to the bow (m); k is the distance from the chain hole to the centerline of the fore-aft axis (m); d F is the bow draught of the ship (m); and CB is the block coefficient of the ship.
The anchorage circle radius models were modified in various studies, summarized as shown in Table 3. Note that R represents the radius (m) of a single anchored mooring ship.
According to the experimental data in Table 2 and the improved safety distance model of anchoring ships, the simulation of the anchorage area detection was carried out using MATLAB. The existing ships and the ships to be anchored in the anchorage area belong to the above three types. The distance of existing ships in the anchorage meets the safety distance requirements for anchoring ships. Additionally, the experimental data contain 10 sets of data in two categories. The first category comprised the detection data of five groups of anchorage areas with a wind power of less than or equal to 7, and the anchorage water depths were 20 m, 25 m, 30 m, 35 m and 40 m, respectively. Then, the second category of data comprised the detection data of five groups of mooring areas with a wind force of greater than 7, and the anchorage water depths were 20 m, 25 m, 30 m, 35 m and 40 m, respectively. Table 4 and Table 5 include the extracted data of the first group in the first category and the data of the first group in the second category, respectively.

4.2. Procedure

To investigate the effectiveness of the Monte-Carlo mooring area detection model, a simulation was carried out. The specific steps are as follows, and a diagram of model solution logic is shown in Figure 7.
Step 1: An anchorage matrix was established with a size of 2 nautical miles × 2 nautical miles with an evenly distributed water depth, and water depth was 20–40 m.
Step 2: Using MATLAB, the Monte-Carlo random algorithm was taken to generate two-dimensional coordinates in varying numbers ( x 1 , y 1 ) , ( x 2 , y 2 ) ( x n , y n ) , so as to simulate the position of the existing anchoring ship, that is, to simulate the interference item of the target ship during the mooring area detection.
Step 3: With the conversion model of the anchor position, the ship positions in step 2 were converted to the anchor position of the existing anchoring ship ( x 1 , y 1 ) , ( x 2 , y 2 ) ( x n , y n ) .
Step 4: Based on MATLAB, the static parameters of the existing anchoring ship and the improved anchorage circle radius model, the anchorage circle radius of the existing anchoring ship was simulated.
Step 5: Based on MATLAB, static parameters of the ship to be anchored and the improved anchorage circle radius model, the anchorage circle radius of the ship to be anchored was simulated.
Step 6: Based on the data gathered from steps 3 and 4 and the safety distance model of the ship’s anchorage position, the value of the safety distance for the ship to be anchored was calculated.
Step 7: Under MATLAB, the Monte-Carlo random algorithm was used to randomly generate 5000 two-dimensional coordinates ( x 1 , y 1 ) , ( x 2 , y 2 ) ( x n , y n ) , so as to simulate the two-dimensional coordinates of the anchor position of the target anchoring ships.
Step 8: With the mooring area detection model of the anchoring ships, successive operations upon the data from steps 3 and 7 were performed, and two-dimensional coordinates of the anchor position ( X 1 , Y 1 ) , ( X 2 , Y 2 ) ( X n , Y n ) of the ship to be anchored were obtained, which satisfied the safety distance value in step 6.
Step 9: The dropping anchor position conversion model was taken in converting the coordinates of the dropping anchor position ( X 1 , Y 1 ) , ( X 2 , Y 2 ) ( X n , Y n ) of the ship to be anchored.
Step 10: The drawing command was invoked to generate the simulation graphics of the work space of the mooring area.

5. Results

5.1. Anchorage Circle Radius

The anchorage circle radius is related to anchorage safety and utilization. According to the data in Table 2, the anchorage circle radius model in Table 3 was calculated, and the results are shown in Figure 8.
  • The anchorage circle radius value was relatively small. Compared with models A/C/D/E, the value of model F, which involves no consideration of the safety impact of passing ships, was significantly smaller when the wind force was less than or equal to 7. Compared with models B/C/D/E, model G, in which the safety impact of passing ships was taken into consideration, showed a middle value. The values of H and B, which both had a wind force of greater than 7, were also relatively small. Model I, which was set with the consideration of the safety impact of passing ships, had a wind force of greater than 7 and a safety distance of twice the ship’s width, suggested a greater value than model B with the difference of 5–15%.
  • Additional factors were considered. Models F~G considered factors such as water depth, wind power, ship type, ship loading condition, and ship parameters comprehensively. Therefore, the models mentioned above reflected the engineering practice background well with more accuracy.
  • Models G and I fully considered the influence of the safety of ships passing through the anchorage with the safety distance set to improve the anchoring safety.
  • Models F~G featured safety and high anchorage utilization. The Chinese standard of the length of the outgoing chain is suitable for various extreme environments, and its standard length is the longest. Models F~G adopted the above Chinese standard, but resulted in a relatively small anchorage circle radius, which improved the utilization rate of the anchorage under the premise of ensuring safety.
  • In model B, a small slope coefficient was selected for the water depth variable and a large constant was obtained for the intercept. Model C selects a larger slope parameter for the water depth variable. Model B pays more attention to the influence of wind on the anchorage radius. However, model C better considered the influence of the bottom sediment griping force on the anchoring radius. From the perspective of anchoring safety, Model B is more conservative.
In conclusion, the improved anchorage circle radius model in this study altered the rough phenomenon of the previous model. One the one hand, it fully considered the ship type, the distance from the anchor chain hole to the bow, the trim angle, the loading condition and other factors, but also considered the wind, special types of ships with hazardous items such as oil tankers and the influence of ships sailing in and out of the anchorage upon the safety distance of anchoring ships. On the other hand, the radii of the improved model in the four situations were all in keeping with the acceptable range, and are smaller than the previous model values in the table in most scenarios. Moreover, the model was in line with an engineering practice background. The application of the improved model for mooring area detection will improve scientific detection, the safety of anchoring ships and the utilization of anchorage.

5.2. Anchor Position Detection

The data of Table 4 and Table 5 were input into the MATLAB simulation platform, and the two-dimensional coordinates of anchor position distribution that conforms to the safety distance of the target ship were detected by the mooring area detection model and the Monte-Carlo stochastic simulation method. Then, using the Plot function, the coordinates of the anchor position distribution of the target ship were drawn into a two-dimensional image. Additionally, 10 groups of data in this experiment generated 60 two-dimensional images of anchor position detection. Moreover, Figure 9, Figure 10, Figure 11 and Figure 12 provide eight anchor position detection images that were randomly extracted. Further, the black dots in Figure 9, Figure 10, Figure 11 and Figure 12 simulate existing ships or obstacles. Meanwhile, the color red represents the available anchor positions distribution that meets the detection algorithm of mooring area detection. The color blue represents the available anchor positions distribution for ships with an additional 50 m of safety distance. Pink represents the available anchor positions distribution for ships with an additional 100 m of safety distance. Yellow represents the available anchor positions distribution for ships with an additional 100 m safety distance. In Figure 12, due to the existing ships or the congestion of obstacles in the anchorage area, it is impossible to detect the anchorage position required by the larger ship size, so the corresponding colored location distribution of the anchorage area cannot be plotted.
The conclusions of this study are as follows:
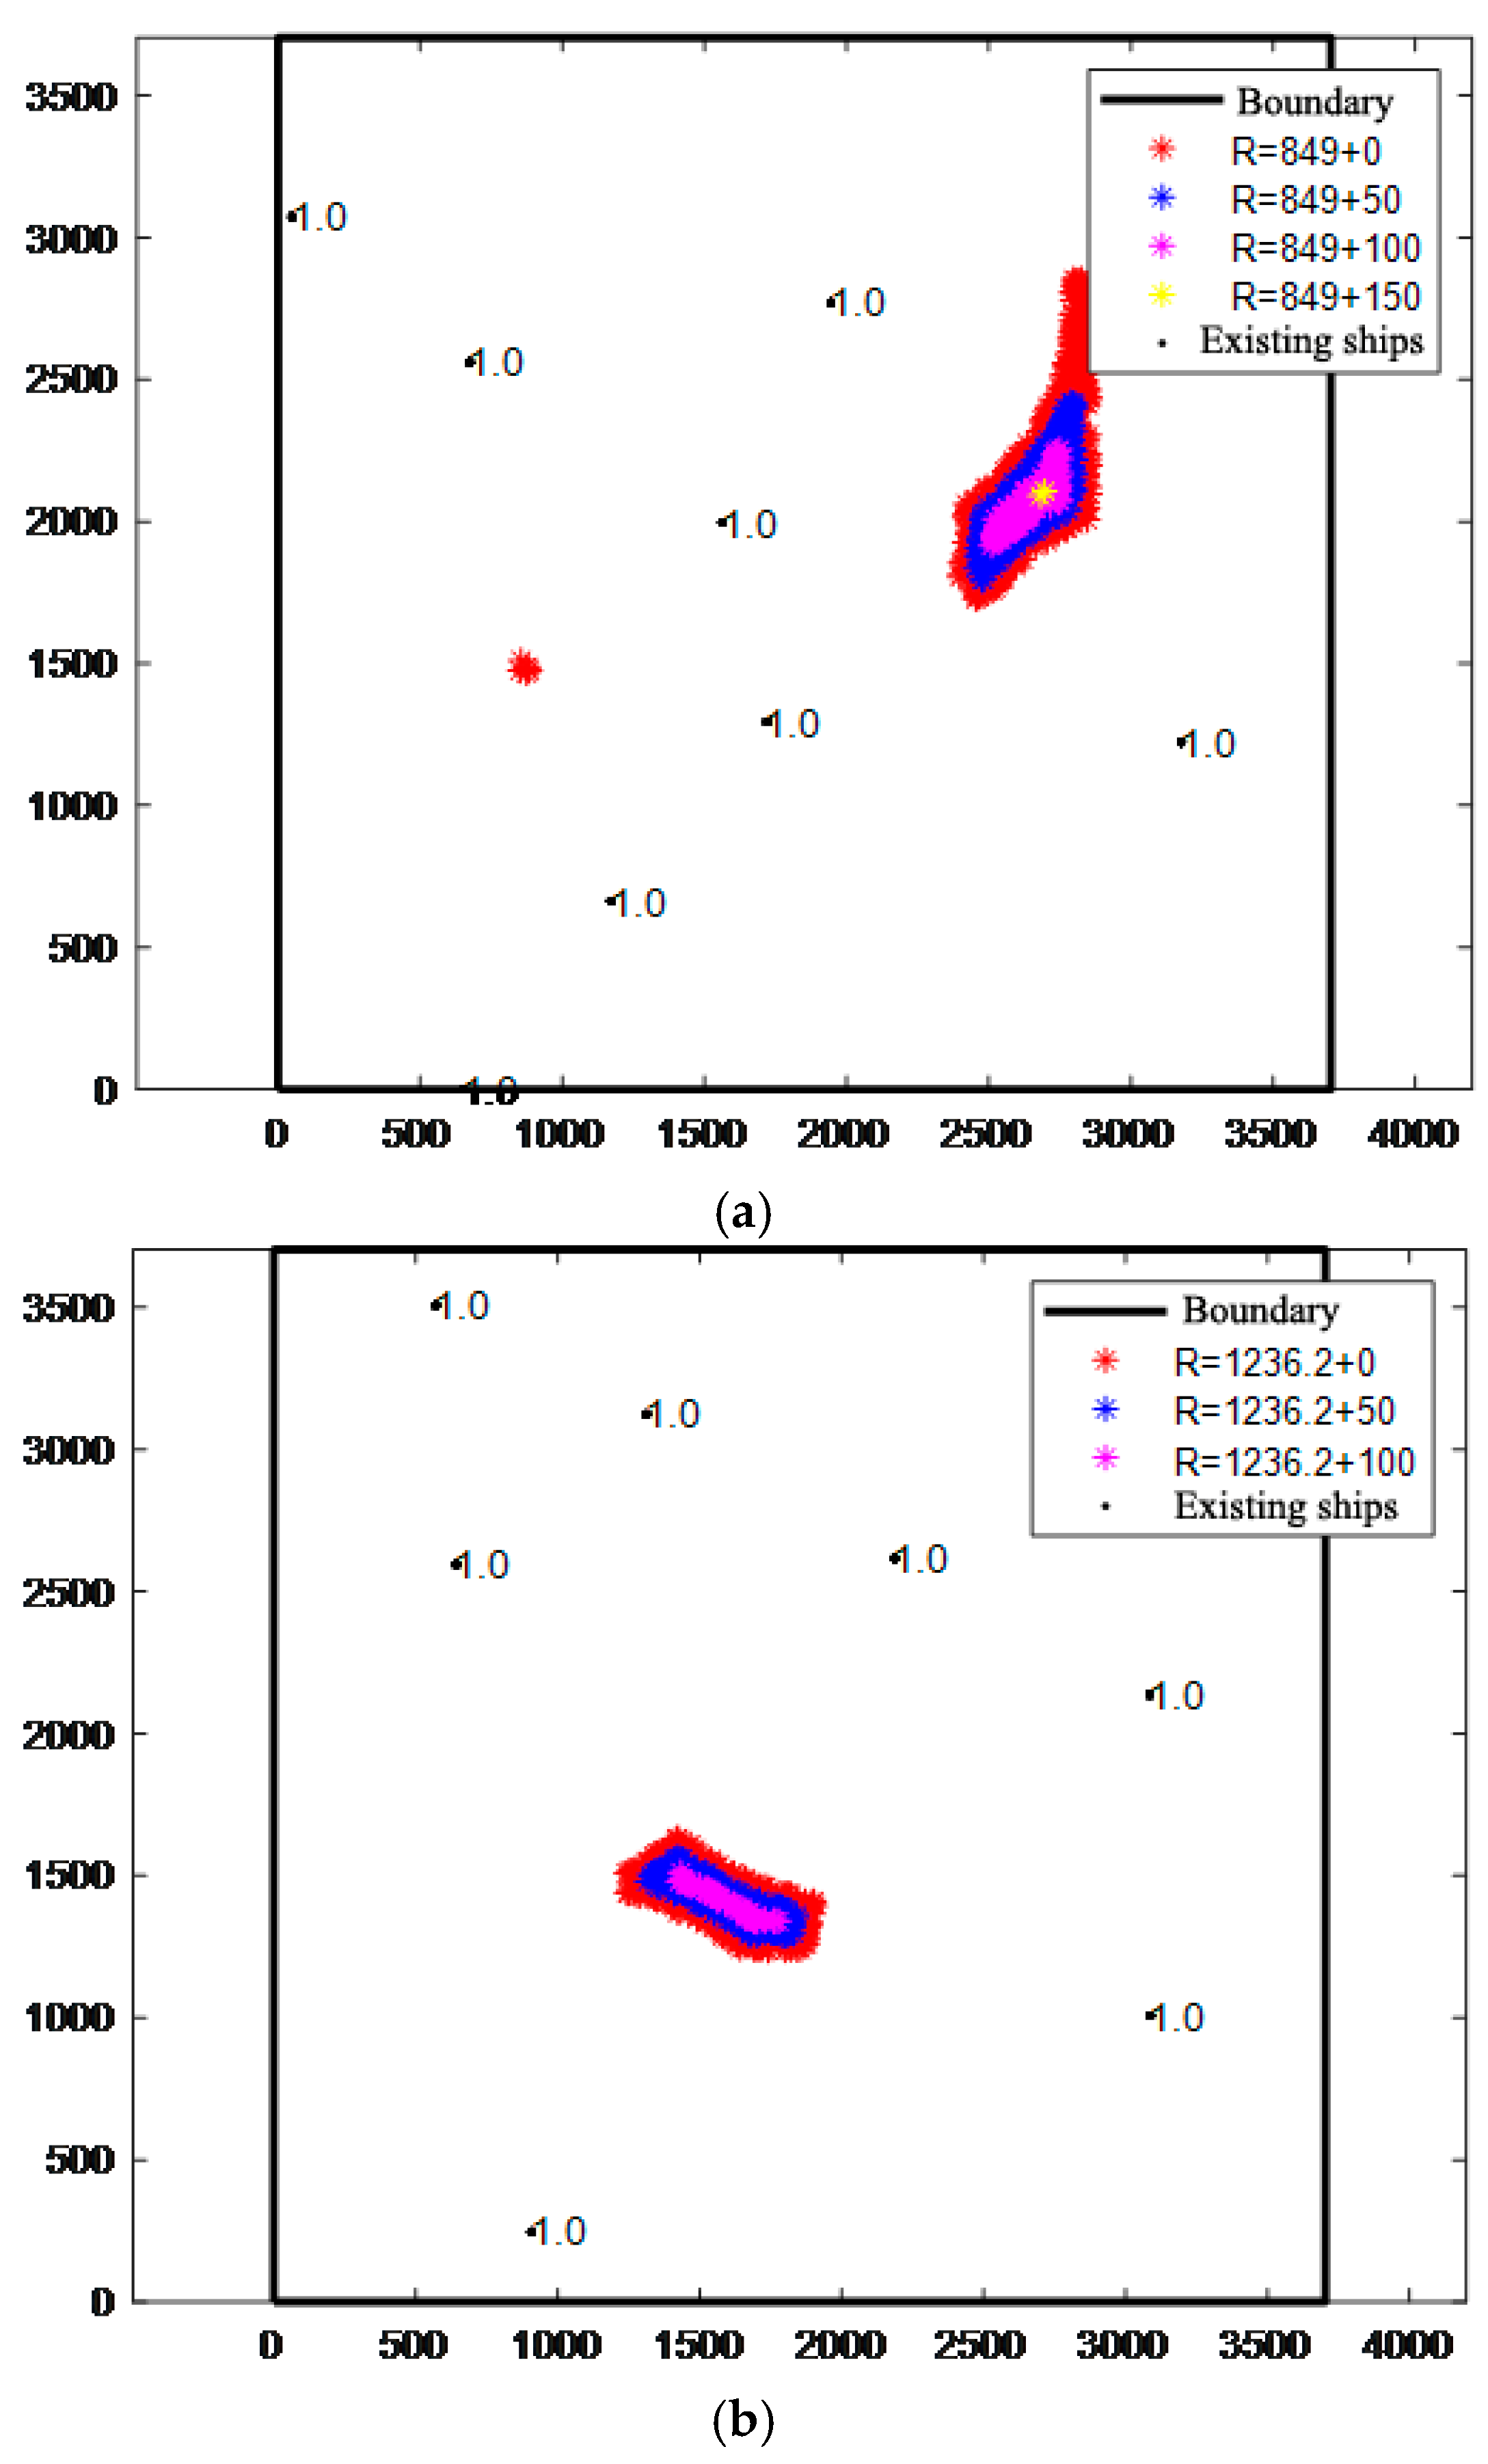
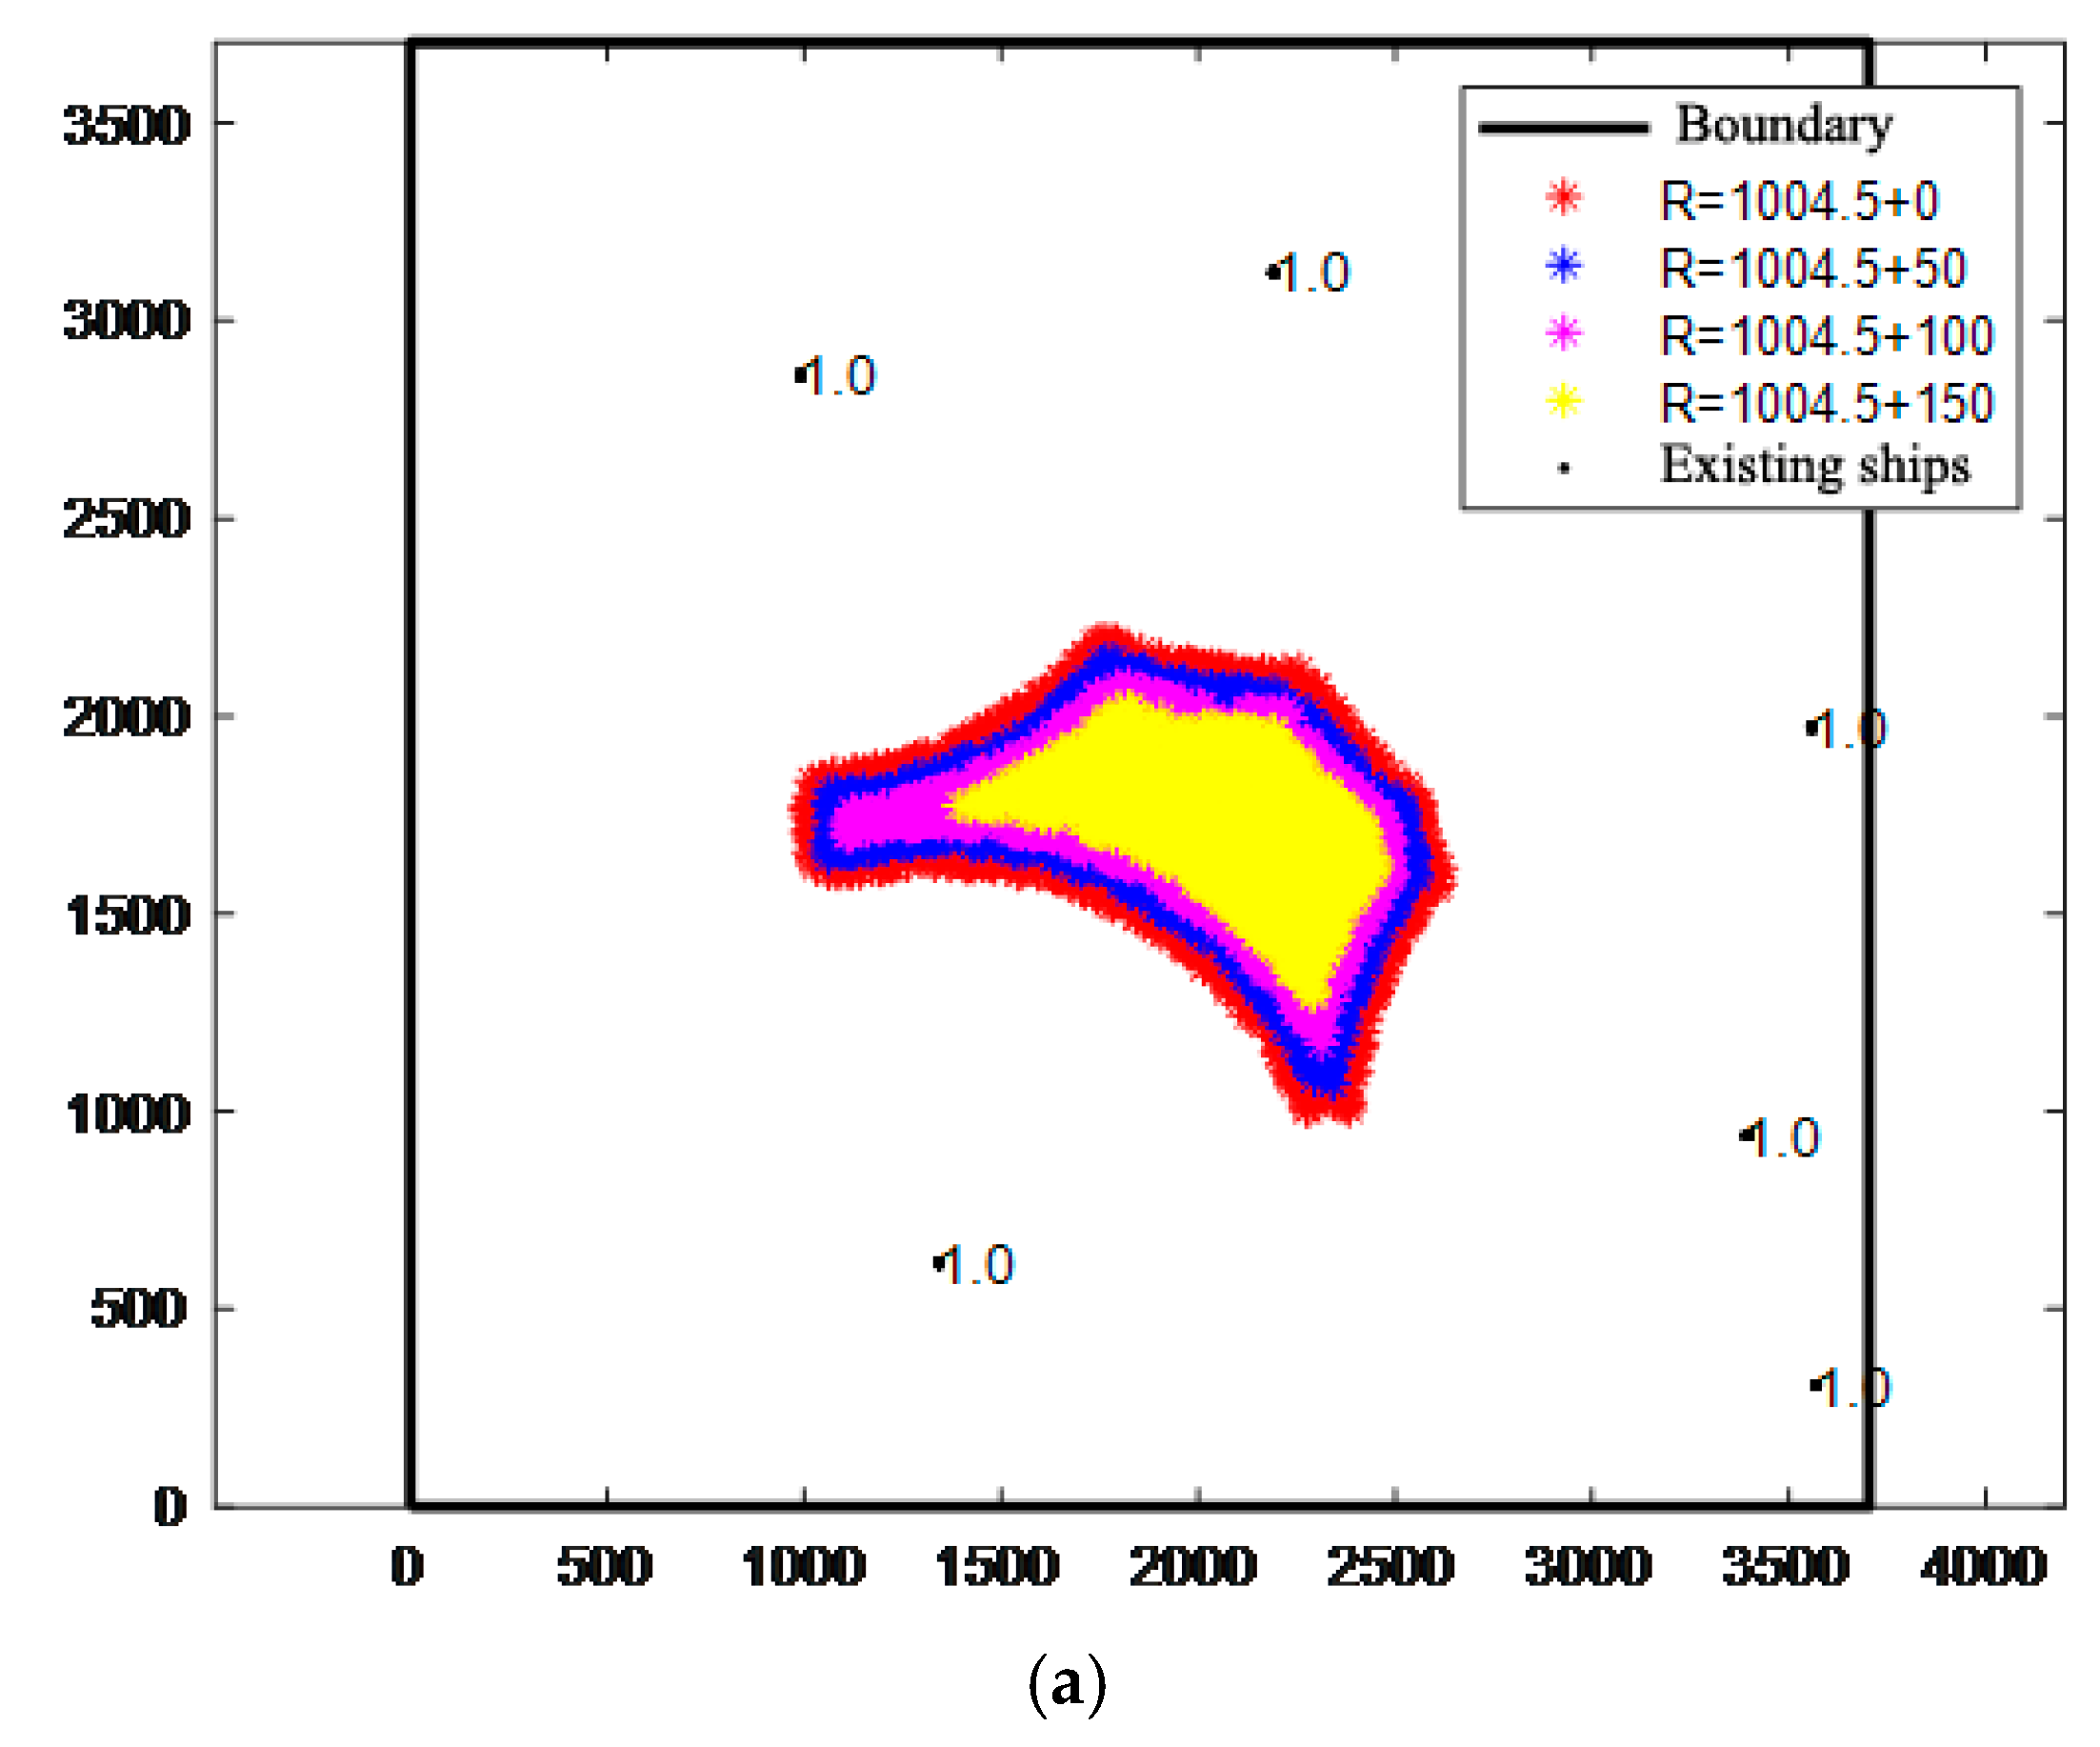
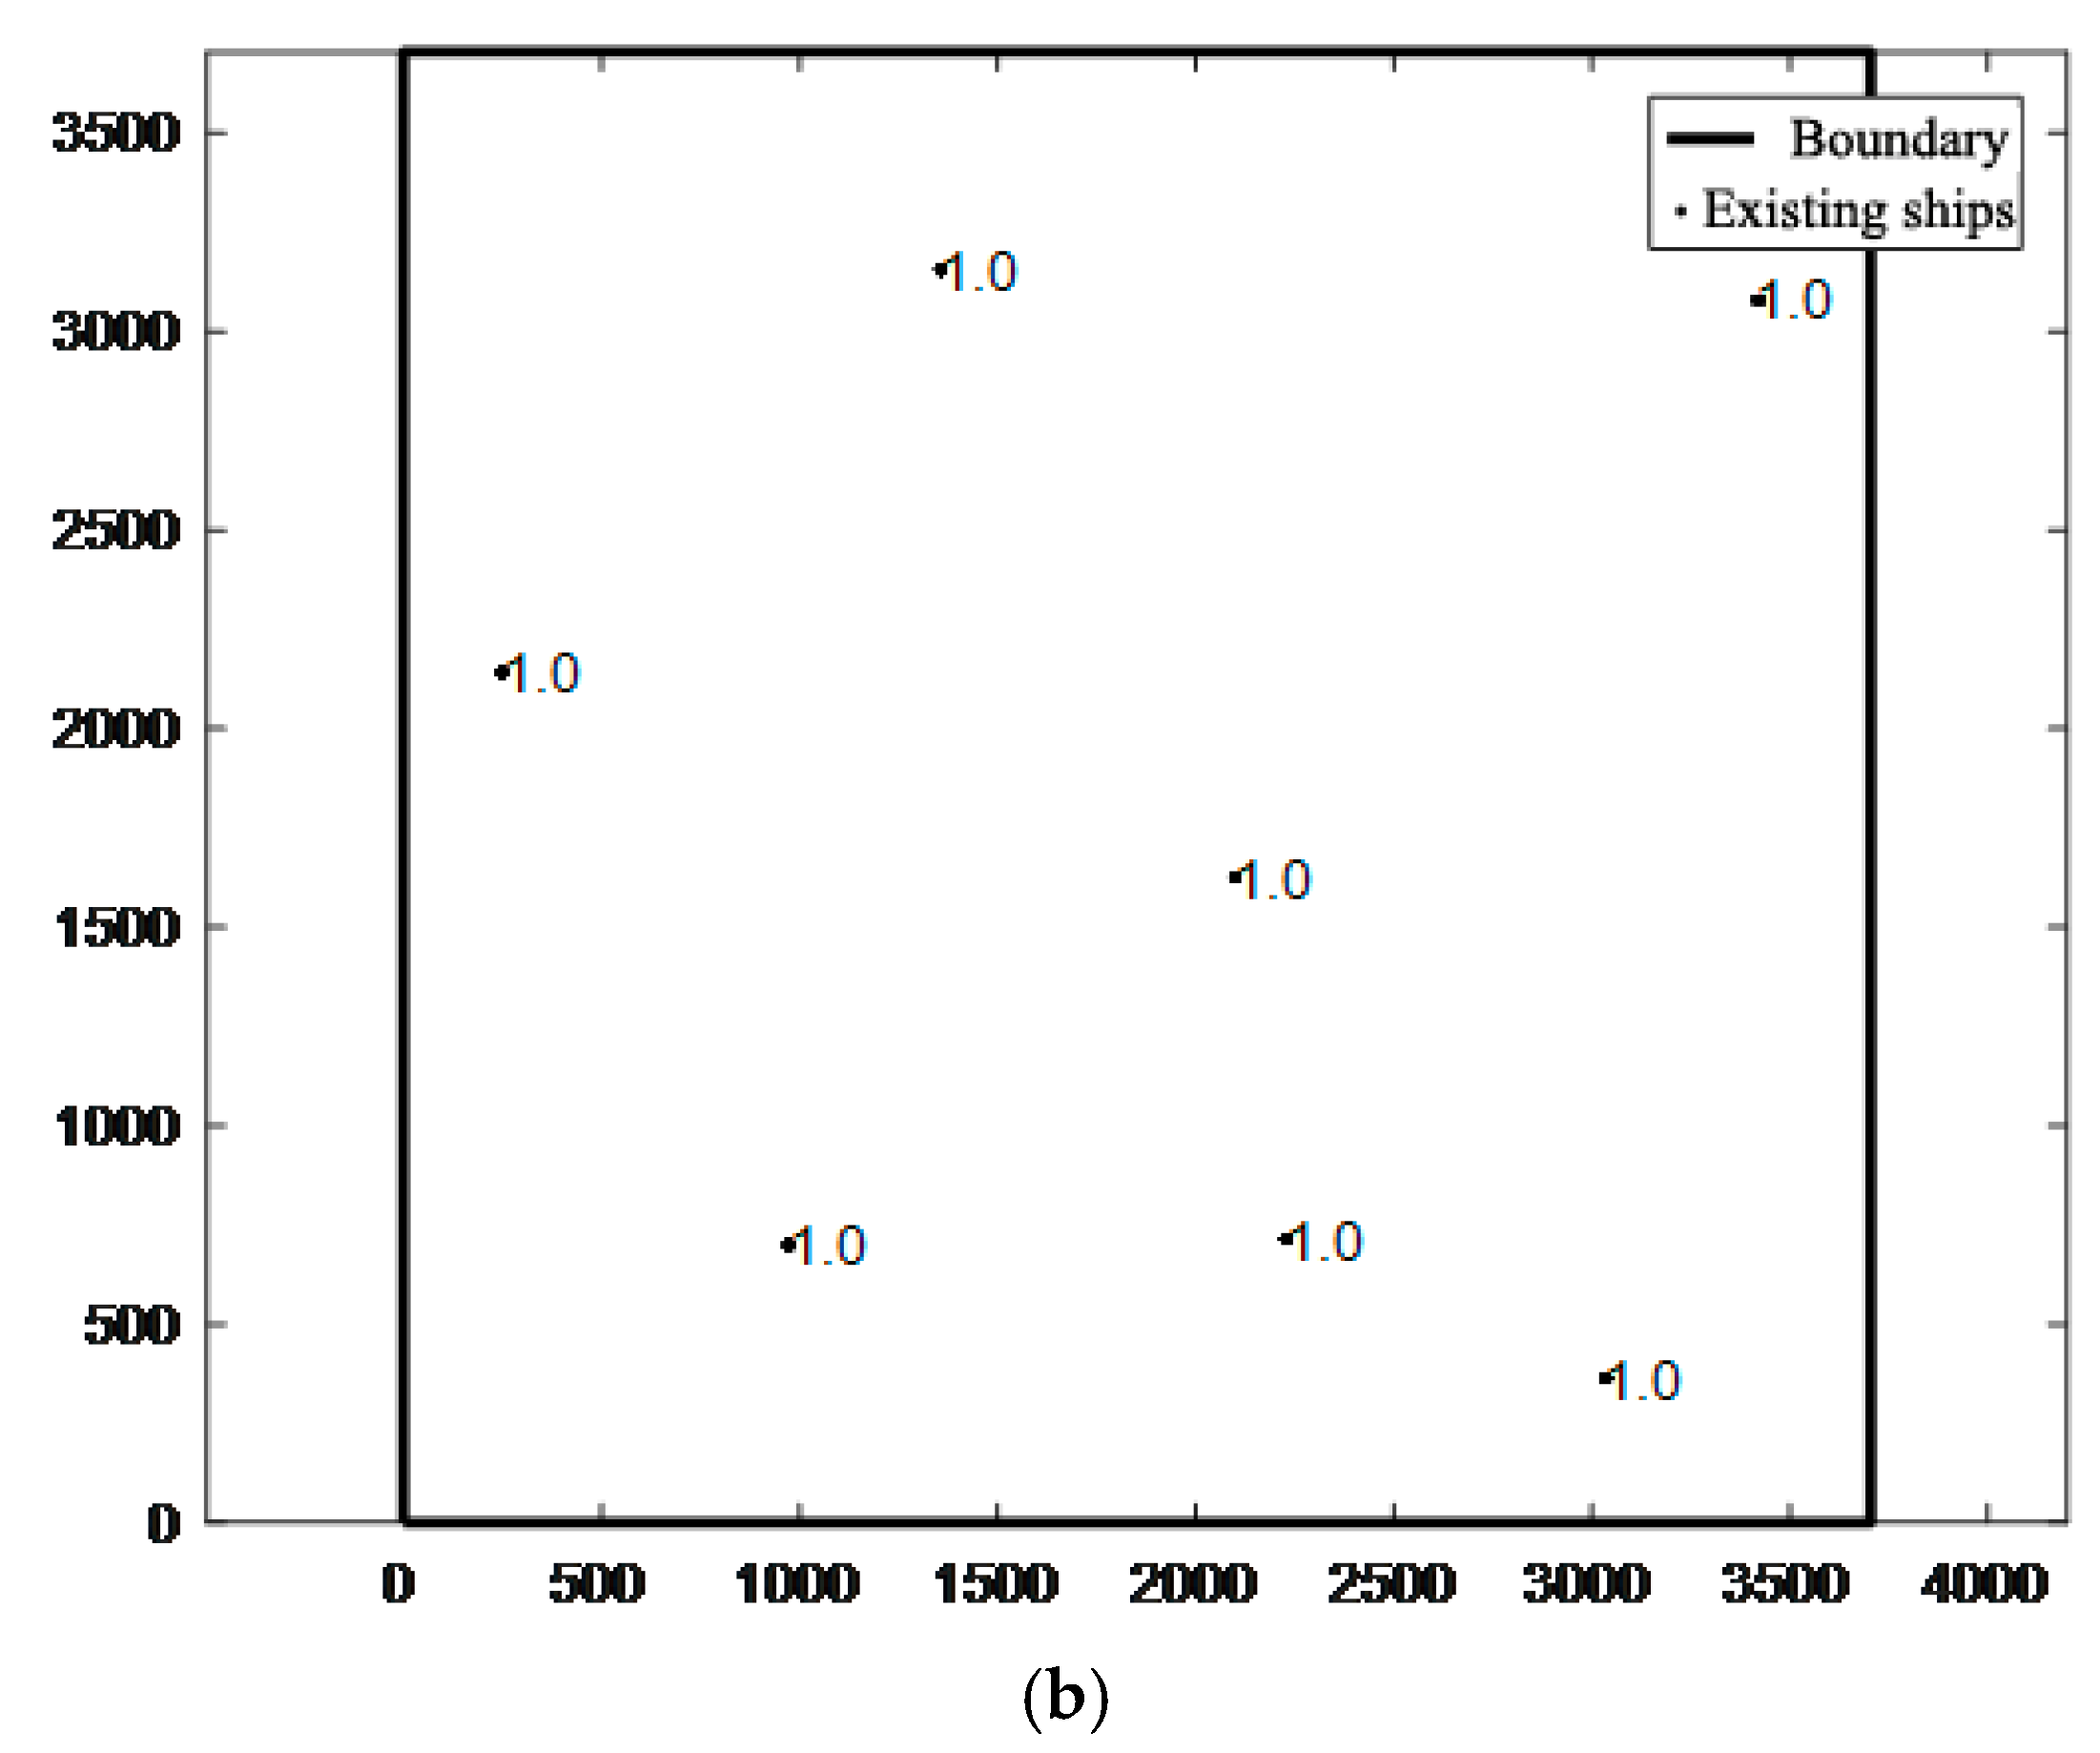
  • The intelligent MASS mooring area detection algorithm based on the improved anchorage area radius model and the Monte-Carlo stochastic simulation method sampled a total of 5000 times and required 1.1 s to output the detection results. The experimental results showed that the detection algorithm can accurately and efficiently detect the distribution of anchor positions within the anchorage boundary.
  • The intelligent MASS mooring area detection algorithm fully considered the influence of the ship type on the anchoring distance, and provided a reasonable mooring area detection scheme for ships with hazardous items such as oil and liquefied gas.
  • The intelligent MASS mooring area detection algorithm fully considers the safety needs of ships passing through the anchorage with a certain safety distance.
  • The intelligent MASS mooring area detection algorithm fully considers the influence of the anchorage boundary. The tail of the target ship can effectively avoid the anchorage boundary and prevent the anchoring ship from floating out of the anchorage boundary.
  • The intelligent MASS mooring area detection algorithm can flexibly increase the safety distance as the circumstances may require. In this experiment, the distance of 50 m was adopted as the super parameter distance so as to flexibly adjust the safety distance of anchoring ships, as shown in Figure 9, Figure 10, Figure 11 and Figure 12.

6. Conclusions

The main contribution of this study is its design of an intelligent MASS mooring area detection algorithm based on the improved anchorage area radius model and the Monte-Carlo stochastic simulation method. The algorithm was verified through simulation experiments with 50 group datasets. Numerical simulation experiment results demonstrated that the detection algorithm provides features with rapidity and accuracy. The anchorage circle radius model accounted for a variety of limiting factors in the real marine environment, including ship parameters, the loading conditions, the draft and the safety of ships passing through the anchorage. A comparison was also made between the presented models.
The detection system can be used by various ships in a certain mooring area, by equipping an internet-based application computer program on the MASS to share individual information for each ship, and generate optimal mooring locations in the future. The system can be also directed by the port authority to manage the anchoring operation of a ship.
However, only 192 m, 225 m and 333 m bulk carriers were selected as case studies in this study, while research on ships of less than 200 m in length is lacking. In the future, studies on different ship types including catamarans, fast vessels, and various ship lengths should be conducted. Simultaneously, some issues should be carefully addressed when the system is implemented in MASS, especially for the understanding of the appropriate anchorage water depth for different types of ships and more complex application scenarios.

7. Patents

A patent named “An intelligent detection and control algorithm of the mooring area for single anchoring ship” is in the process of application and has been published.

Author Contributions

Conceptualization, L.C. and Z.L.; Data curation, X.W., L.G. and S.X.; Funding acquisition, X.W. and W.Z.; Methodology, L.C., W.Z. and Z.L.; Project administration, X.W.; Validation, Z.L.; Visualization, L.C. and S.X.; Writing—original draft, L.C.; Writing—review & editing, X.W., W.Z. and S.X. All authors have read and agreed to the published version of the manuscript.

Funding

This work was funded by the National Natural Science Foundation of China (Grant No. 52101399, 5217110461), Zhanjiang Science and Technology Bureau (Grant No. 2020B01324) and the Fundamental Research Funds for the Central Universities (grand No. 3132022129).

Institutional Review Board Statement

Not applicable.

Informed Consent Statement

Not applicable.

Data Availability Statement

Not applicable.

Conflicts of Interest

The authors declare no conflict of interest.

References

  1. Ge, H.; Wang, Z.; Liang, B.; Zhang, Z.; Yan, Z.; Li, Z. A Systematic Study on Berthing Capacity Assessment of Sanya Yazhou Fishing Port by Typhoon Prediction Model. J. Mar. Sci. Eng. 2021, 9, 1380. [Google Scholar] [CrossRef]
  2. Li, M.; Mou, J.; Chen, L.; He, Y.; Huang, Y. A rule-aware time-varying conflict risk measure for MASS considering maritime practice. Reliab. Eng. Syst. Saf. 2021, 215, 107816. [Google Scholar] [CrossRef]
  3. Wu, J.; Yu, Y.; Cheng, S.; Li, Z.; Yu, J. Probabilistic multilevel robustness assessment framework for a TLP under mooring failure considering uncertainties. Reliab. Eng. Syst. Saf. 2022, 223, 108458. [Google Scholar] [CrossRef]
  4. Yan, X. Research Status and Development Trend of Intelligent Ships. Commun. Shipp. 2016, 3, 25–28. [Google Scholar]
  5. Hwang, T.; Youn, I.-H. Navigation Scenario Permutation Model for Training of Maritime Autonomous Surface Ship Remote Operators. Appl. Sci. 2022, 12, 1651. [Google Scholar] [CrossRef]
  6. Chang, C.-H.; Kontovas, C.; Yu, Q.; Yang, Z. Risk assessment of the operations of maritime autonomous surface ships. Reliab. Eng. Syst. Saf. 2021, 207, 107324. [Google Scholar] [CrossRef]
  7. Zhong, S.; Wen, Y.; Huang, Y.; Cheng, X.; Huang, L. Ontological Ship Behavior Modeling Based on COLREGs for Knowledge Reasoning. J. Mar. Sci. Eng. 2022, 10, 203. [Google Scholar] [CrossRef]
  8. Bibuli, M.; Odetti, A.; Zereik, E. Adaptive steering control for an azimuth thrusters-based autonomous vessel. J. Mar. Eng. Technol. 2020, 19, 76–91. [Google Scholar] [CrossRef]
  9. Mo, T. “14th Five-Year” Development Plan for China’s Digital Transportation; Ministry of Transport of the People’s Republic of China: Beijing, China, 2022.
  10. Mo, T. China’s “14th Five-Year” Modern Comprehensive Transportation System Development Plan; Ministry of Transport of the People’s Republic of China: Beijing, China, 2022.
  11. Wang, Y.; Chen, P.; Wu, B.; Wan, C.; Yang, Z. A trustable architecture over blockchain to facilitate maritime administration for MASS systems. Reliab. Eng. Syst. Saf. 2022, 219, 108246. [Google Scholar] [CrossRef]
  12. CCS. Rules for Intelligent Ship; China Classification Society: Beijing, China, 2020. [Google Scholar]
  13. Su, W. China Classification Society Published Rules for Intelligent Ship. Ship Eng. 2020, 42, 13–14. [Google Scholar]
  14. Fan, A.; Yan, X.; Bucknall, R.; Yin, Q.; Ji, S.; Liu, Y.; Song, R.; Chen, X. A novel ship energy efficiency model considering random environmental parameters. J. Mar. Eng. Technol. 2020, 19, 215–228. [Google Scholar] [CrossRef]
  15. Bredow, R.; Kamiński, M. Structural Safety of the Steel Hall under Dynamic Excitation Using the Relative Probabilistic Entropy Concept. Materials 2022, 15, 3587. [Google Scholar] [CrossRef] [PubMed]
  16. Tong, R.; Li, H.; Zhang, B.; Yang, X.; Ma, X. Modeling of unsafe behavior risk assessment: A case study of Chinese furniture manufacturers. Saf. Sci. 2021, 136, 105157. [Google Scholar] [CrossRef]
  17. He, J.; Luo, J.; Huan, P.; Deng, J. Workspace Analysis of 7-DOF Humanoid Robotic Arm Based on Monte Carlo Method. Modul. Mach. Tool Autom. Manuf. Tech. 2015, 3, 48–51. [Google Scholar]
  18. Leong, D.; Low, Y.M.; Kim, Y. Control variates for efficient long-term extreme analysis of mooring lines. Eng. Struct. 2020, 221, 111063. [Google Scholar] [CrossRef]
  19. Liu, H.; Chen, Z.; Tian, Y.; Wang, B.; Yang, H.; Wu, G. Evaluation method for helicopter maritime search and rescue response plan with uncertainty. Chin. J. Aeronaut. 2021, 34, 493–507. [Google Scholar] [CrossRef]
  20. Hu, S.P.; Huang, C.H.; Guo, Y.L.; Li, B. Dynamic process simulation of ship pilotage risk at harbour based on transition probability model. In Proceedings of the 2017 4th International Conference on Transportation Information and Safety (ICTIS), Banff, AB, Canada, 8–10 August 2017. [Google Scholar] [CrossRef]
  21. Li, R.; Huang, J.; Pan, X.; Hu, Q.; Huang, Z. Path following of underactuated surface ships based on model predictive control with neural network. Int. J. Adv. Robot. Syst. 2020, 17, 1729881420945956. [Google Scholar] [CrossRef]
  22. Li, R.; Jia, B.; Fan, S.; Pan, X. A novel active disturbance rejection control with hyperbolic tangent function for path following of underactuated marine surface ships. Meas. Control. 2020, 53, 1579–1588. [Google Scholar] [CrossRef]
  23. Yin, J.; Wang, N. Predictive Trajectory Tracking Control of Autonomous Underwater Vehicles Based on Variable Fuzzy Predictor. Int. J. Fuzzy Syst. 2021, 23, 1809–1822. [Google Scholar] [CrossRef]
  24. Zalewski, P. Integrity Concept for Maritime Autonomous Surface Ships’ Position Sensors. Sensors 2020, 20, 2075. [Google Scholar] [CrossRef] [Green Version]
  25. Forrester, G.E. The influence of boat moorings on anchoring and potential anchor damage to coral reefs. Ocean. Coast. Manag. 2020, 198, 105354. [Google Scholar] [CrossRef]
  26. Wu, J.; Wu, B.; Liu, D.; Zhang, B.; Luo, H. Safety Evaluation System for Anchored Vessels in Tianjin Anchorage Under Strong Wind. J. Dalian Marit. Univ. 2013, 39, 49–52. [Google Scholar]
  27. Oz, D.; Aksakalli, V.; Alkaya, A.F.; Aydogdu, V. An anchorage planning strategy with safety and utilization considerations. Comput. Oper. Res. 2015, 62, 12–22. [Google Scholar] [CrossRef]
  28. Park, J.; Kim, S. A Improvement Plans for Anchorage at Masan Port. J. Korean Soc. Mar. Environ. Saf. 2018, 24, 637–645. [Google Scholar] [CrossRef]
  29. Li, X. Research on the Relative Safe Distance for Roadstead. China Harb. Eng. 2015, 35, 16–18+24. [Google Scholar]
  30. Chen, C.; Dai, R.; Li, Q.; Wu, Z. Anchoring Radius Based on Regression Analysis. Port Waterw. Eng. 2015, 10, 9–12+26. [Google Scholar]
  31. Lalla-Ruiz, E.; Shi, X.; Voß, S. The waterway ship scheduling problem. Transp. Res. Part D Transp. Environ. 2018, 60, 191–209. [Google Scholar] [CrossRef]
  32. Yan, S.-W.; Huo, Z.-L.; Sun, L.-Q.; Liu, R. Risk assessment on a pipeline passing through a ship mooring area. China Ocean. Eng. 2014, 28, 207–214. [Google Scholar] [CrossRef]
  33. Pan, G. Maneuvering and anchor position Analysis of Large Ship Anchoring in Beilun Port. Mar. Technol. 2013, 2, 15–18. [Google Scholar]
  34. Song, Y. AIS Data Based on the Large Ship Anchorage Circle Radius and the Distance of Research; Dalian Maritime University: Dalian, China, 2010. [Google Scholar]
  35. Tang, H.; Yin, Y. A Method of Anchor Radius Pattern Recognition Based on Data Mining. Ship Ocean. Eng. 2017, 46, 206–209. [Google Scholar]
  36. Huang, S.Y.; Hsu, W.J.; He, Y. Assessing capacity and improving utilization of anchorages. Transp. Res. Part E Logist. Transp. Rev. 2011, 47, 216–227. [Google Scholar] [CrossRef]
  37. Wen, Y.; Lei, D.; Wang, L.; Xiao, C.; Zhou, C. Quantitative Model for Determining the Safety Distance of Anchoring LNG Carriers. J. Saf. Environ. 2015, 15, 134–139. [Google Scholar]
  38. Li, Y.; Zhang, W.; Cao, H.; Ning, Z. Fixed-Point Mooring Scheme of Yeyashan Anchorage in Ningbo Zhoushan Core Port Area. Mar. Technol. 2017, 4, 1–4. [Google Scholar]
  39. Chen, S.; Zhang, J.; Zhan, R. R2FA-Det: Delving into High-Quality Rotatable Boxes for Ship Detection in SAR Images. Remote Sens. 2020, 12, 2031. [Google Scholar] [CrossRef]
  40. Liu, T.; Pang, B.; Ai, S.; Sun, X. Study on Visual Detection Algorithm of Sea Surface Targets Based on Improved YOLOv3. Sensors 2020, 20, 7263. [Google Scholar] [CrossRef]
  41. Li, X.; Zhang, S.; Wang, Y. Application of Artificial Intelligence System in Detection of Marine Anchorage area. Ship Sci. Technol. 2019, 41, 64–66. [Google Scholar]
  42. Deng, B. Research on Capacity of Anchorage Based on Monte Carlo Algorithm; Dalian Maritime University: Dalian, China, 2012. [Google Scholar]
  43. Xue, T. Reliability Computation Method and Redundancy Optimization of Port Anchorage Capacity; Dalian University of Technology: Dalian, China, 2018. [Google Scholar]
  44. Mo, T. Design Code of General Layout for Sea Ports; China Communication Press Co., Ltd.: Beijing, China, 2014. [Google Scholar]
Figure 1. Process of ship backward anchoring. (a) The predetermined anchor position. (b) The ship position after anchoring operation.
Applsci 12 06009 g001
Figure 2. Diagram of plane motion of the anchoring ship. (a) Motion diagram of single anchored ship. (b) Ship motion trajectory of single anchored ship within 12 h. (c) Ship motion trajectory of single anchored ship within 24 h. (d) Ship motion trajectory of single anchored ship within 5 days. (e) Ship motion trajectory of single anchored ship within 10 days. (f) Ship motion trajectory of single anchored ship within 15 days.
Applsci 12 06009 g002
Figure 3. Diagram of vertical movement of anchoring ship.
Applsci 12 06009 g003
Figure 4. Diagram of selected anchor position of ship. (a) The diagram of ship anchor position selection under no influence of wind and current. (b) The diagram of ship anchor position selection under influence of wind and current.
Applsci 12 06009 g004
Figure 5. Schematic diagram of the safety distance model of anchoring ships. (a) The two anchoring ships with synchronous motion. (b) The two anchoring ships without synchronous motion. (c) The safety margin of the two anchoring ships with synchronous motion. (d) The safety margin of the two anchoring ships without synchronous motion.
Applsci 12 06009 g005
Figure 6. Schematic diagram of the position deviation of ship position sensors. (a) The position deviation of ship position sensors when anchoring. (b) The position deviation of ship position sensors after anchoring.
Applsci 12 06009 g006
Figure 7. Diagram of simulation.
Applsci 12 06009 g007
Figure 8. Schematic diagram of comparative analysis of the anchorage circle radius. (a) Schematic diagram of the anchorage circle radius of a 192 m general cargo ship. (b) Schematic diagram of the anchorage circle radius of a 225 m general cargo ship. (c) Schematic diagram of the anchorage circle radius of a 333 m general cargo ship.
Applsci 12 06009 g008aApplsci 12 06009 g008b
Figure 9. Schematic diagram of mooring area detection with wind force ≤7 and water depth of 20 m. (a) Represents 192 m and 192 m ship type mooring area detection. (b) Represents 333 m and 333 m ship type mooring area detection.
Applsci 12 06009 g009aApplsci 12 06009 g009b
Figure 10. Schematic diagram of mooring area detection with wind force >7 and water depth of 20 m. (a) Represents 192 m and 192 m ship type mooring area detection. (b) Represents 333 m and 333 m ship type mooring area detection.
Applsci 12 06009 g010
Figure 11. Schematic diagram of mooring area detection with wind force ≤7 and water depth of 40 m. (a) Represents 192 m and 192 m ship type mooring area detection. (b) Represents 333 m and 333 m ship type mooring area detection.
Applsci 12 06009 g011
Figure 12. Schematic diagram of mooring area detection with wind force >7 and water depth of 40 m. (a) Represents 192-m and 192 m ship type mooring area detection. (b) Represents 333 m and 333 m ship type mooring area detection.
Applsci 12 06009 g012aApplsci 12 06009 g012b
Table 1. Length of outgoing chain proposed by different countries.
StandardsConditionsAnchoring
Conditions
The Length of Outgoing Chain
Chinese (General ship) Wind Force ≤ 7 (Beaufort)3H + 90
Wind Force > 7 (Beaufort)4H + 145
Japanese, BritishOffshore/Onshore Waiting or Loading and Unloading CargoesGood Anchor Gripping Conditions6H
Bad Anchor Gripping Conditions6H + 30
Anchoring in StormsWind Speed 20 m/s3H + 90
Wind Speed 30 m/s4H + 145
Dindar Oz R = ( 25 H ) 2 H 2
Table 2. Ship type parameters selected for the simulation experiment (unit: m).
LsBDALSAkdFCB
Ship No. 119222.618886.50.809
Ship No. 2225322510127.50.823
Ship No. 333360301217100.834
Table 3. Relevant models of anchorage circle radius.
ModelsStandardsR
AChinese L s + 3 H + 90
B L s + 4 H + 145
CJapanese and British L s + 6 H
D L s + 6 H + 30
A L s + 3 H + 90
B L s + 4 H + 145
E Dindar Oz L s + ) 25 H ) 2 H 2
FImproved Model in this study σ [ ( 3 H + 90 k ) 2 ( D W + D A d F ) 2 + ( L S L S A × cos α + ε ]
G σ [ ( 3 H + 90 k ) 2 ( D W + D A d F ) 2 + ( L S L S A × cos α + ε + τ B ]
H σ [ ( 4 H + 145 k ) 2 ( D W + D A d F ) 2 + ( L S L S A × cos α + ε ]
I σ [ ( 4 H + 145 k ) 2 ( D W + D A d F ) 2 + ( L S L S A × cos α + ε + τ B ]
Table 4. Data of ships in safety distance with wind ≤7 (water depth 20 m) (unit: m).
No.The Length of Ship No.1The Length of Outgoing ChainSafety RadiusThe Length of Ship No.2The Length of Outgoing ChainSafety RadiusSafety Distance
1192150367.7192150367.7735.3
2333150561.5192150367.7929.2
3192150367.7225150410.8778.4
4225150410.8225150410.8821.5
5333150561.5225150410.8972.3
6333150561.5333150561.51123.1
Table 5. Data of ships in safety distance with wind >7 (water depth 20 m) (unit: m).
No.The Length of Ship No.1The Length of Outgoing ChainSafety RadiusThe Length of Ship No.2The Length of Outgoing ChainSafety RadiusSafety Distance
(m)
1192150443.9192150443.9887.8
2333150639.0192150443.91082.9
3192150443.9225150487.7931.6
4225150487.7225150487.7975.3
5333150639.0225150487.71126.7
6333150639.0333150639.01278.0
Publisher’s Note: MDPI stays neutral with regard to jurisdictional claims in published maps and institutional affiliations.

