Article

A GIS-Based Approach for Primary Substations Siting and Timing Based on Voronoi Diagram and Particle Swarm Optimization Method

1
Department of Energy, Politecnico di Milano, Via La Masa, 34, 20156 Milano, Italy
2
Department of Electrical Network Planning, Unareti S.p.A., Via Lamarmora, 230, 25124 Brescia, Italy
3
Department of Astronautics, Electrical and Energy Engineering, Sapienza University of Rome, Via delle Sette Sale, 12b, 00184 Rome, Italy
*
Author to whom correspondence should be addressed.
Appl. Sci. 2022, 12(12), 6008; https://doi.org/10.3390/app12126008
Submission received: 31 May 2022 / Revised: 10 June 2022 / Accepted: 11 June 2022 / Published: 13 June 2022

Abstract

:

Featured Application

The paper proposes a methodology for the siting and timing of primary substations and its application to the case study of Milan, Italy.

Abstract

The paper aims to provide primary substations’ optimal siting and timing to expand existing distribution networks. The proposed methodology relies on three main features: a geographic information system for capturing, elaborating, and displaying spatial input data; a particle swarm optimization algorithm to locate and timing the new primary substations; a Voronoi diagram-based approach to find the primary substation service areas and loading. The optimization criteria follow the approach of serving every customer from the nearest primary substation to ensure that the distribution delivery distance is as short as possible, reducing feeders’ cost, electric losses, and service interruption exposure. The algorithm also considers the primary substation transformers’ capacity limit. Thanks to Unareti, the distribution system operator of Milan and Brescia, the methodology was tested by carrying out several simulations, progressively increasing the number of new primary substations. The results obtained confirm the proposed approach’s effectiveness and show that the methodology is a valuable tool to guide Unareti, and distribution system operators in general, in expanding distribution networks to face the challenges of the energy transition.

1. Introduction

Primary Substations (PSs) siting, sizing, and timing are strategic decisions in planning distribution networks (DNs). Although PSs represent a minority of the entire DN cost, PSs outline DNs’ global shape. PSs are the meeting place between transmission and distribution, and their locations define the endpoints of the transmission system and the starting points of the distribution level. Therefore, selecting a poor site from the feeder standpoint can significantly increase the cost of the whole DN, removing, for instance, the benefits of using advanced feeder routing planning procedures [1].
Expansion planning of PSs is even more crucial nowadays to prepare DNs to face the challenges of the energy transition, both in terms of the end user’s consumption electrification [2] and the deployment and integration of distributed generators [3,4]. The DN of Milan and Rozzano is not immune to these challenges. The DN is currently managed by the Distribution System Operator (DSO) Unareti, which needs to install new PSs to improve reliability and resilience and face the energy transition [5].
Several papers in the literature deal with DN expansion planning [6]. Some of them make use of Geographic Information Systems (GIS) [7] and evolutionary algorithms, such as Genetic Algorithm (GA) [8], Particle Swarm Optimization (PSO) [9], and Tabu Search (TS) [10]. For instance, paper [11] identifies the potential location for substation development by conducting spatial data analysis using GIS software. The method minimizes labor and logistic costs while at the same time providing better database storage compared to conventional methods. In [12], the authors propose GIS application to distribution substation planning for the metropolitan electricity authority distribution systems. The main objective is to serve future load growth and increase the reliability of the distribution systems. GIS is used in the planning process because it contains comprehensive topological information on electrical equipment from transmission substations, distribution substations, power transformers, and distribution transformers to revenue meters at customer sites. It also gives the number of customers in each feeder and power demand in small areas.
Paper [13] successfully defines the location of substations’ optimal use of ArcGIS aid applications and tools inside it. With this application, the authors may determine the location that allows building the substation to meet the East Java region’s electricity needs. Based on data from the state electricity company, the method can optimize the electricity distribution network using the Voronoi diagram and the Delaunay triangulation. Paper [14] presents an improved method based on the weighted Voronoi diagram and transportation model for substation planning, which can optimize the location, capacity, and power supply range for each substation with minimum investment, evaluating the cost of the lines, substations’ cost, and annual operating expenses. Many experiments show that the improved method can get more reasonable and optimized planning results within a shorter time than other algorithms in the literature. Authors in [15] present a novel and applied approach based on clustering to determine optimal locations and sizing of sub-transmission substations with their associated service areas. This optimization aims to minimize fixed and operation costs while respecting all technical constraints. The proposed model includes a method for adding planning constraints in a K-means-based algorithm that converts the K-means-based algorithm into a tool with the most accuracy. The algorithm is then tested on a real urban network to verify the effectiveness and feasibility of the proposed model.
Paper [16] presents an enhanced evolutionary algorithm to solve large distribution networks’ static distribution substation planning problem. It is based on a deterministic heuristic algorithm to find the approximate substation service areas for each substation and an expert selection strategy that increases the convergence chance to a globally optimal solution. The effects of unreliability within network feeders and substations are investigated on the obtained layouts. The developed method is applied to four benchmark test systems and an actual large-scale distribution system with about 140,000 customers. Paper [17] proposes an innovative approach based on analyzing a raster map in GIS to perform substation expansion planning for a very large-scale real network. This approach provides an irregular planning mini region to decompose the planning area into irregular mini regions to tackle large-scale real network expansion planning. Meanwhile, the article develops a suitable model regarding the concept of a system of systems to bring about collaborative interactions between mini regions and preserve the integrity of the distribution network. Simulation is performed for a very large-scale sub-transmission system of Mashhad, consisting of 1,359,410 consumers spread in an area of 11,450 km2, to demonstrate the efficiency of the proposed methodology. In [18], a multistage multiobjective substation siting and sizing optimization model is established, considering various constraints such as load flow constraints, maximum capacity constraints, and power supply radius constraints. The paper focused on an improved multiobjective genetic algorithm, introduced a two-stage operator to repair infeasible solutions, and designed a tournament selection operator based on crowding distance and roulette to prevent early evolution. Lastly, the authors in [19] present an improved methodology to solve the substation siting and sizing problem based on geographic information and supervised learning. The proposed approach can optimize the locations, capacities, and power supply ranges of substations with minimum investment. The capital cost of land adds complexity and difficulty to the substation placement problem, especially for highly developed urban areas. The state-of-the-art parallel computing techniques have been employed so that co-optimization for substations of multiple voltage levels can be directly conducted in a computational efficient way. Case studies are presented to demonstrate the effectiveness of the proposed approach.
Although several authors have proposed viable methods, GIS features and applications on real urban DNs require deeper investigation. Thus, this paper aims to provide an effective tool for PS optimal siting and timing to expand existing distribution networks. The proposed approach uses a geographic information system for capturing, elaborating, and displaying spatial input data and a PSO algorithm to locate and timing the new primary substations in combination with a Voronoi diagram-based approach to find the primary substation service areas and loading. GIS data are used to identify potential PS locations considering the multitude of constraints that characterize urban areas. PSO and Voronoi diagram algorithms are the optimization framework that guarantees to serve every customer from the nearest PS to ensure that the distribution delivery distance is as short as possible, reducing feeder cost, electric losses costs, and service interruption exposure. Thanks to Unareti, the approach has been tested on the distribution network of Milan and Rozzano, progressively increasing the number of new primary substations from 1 to 12, looking for a sensitivity analysis.
The rest of the paper is organized as follows: In Section 2, the technical background and the problem formulation are reported. The basic concept of PS siting is recapped, and the main features of the proposed approach are presented. Section 3 introduces the proposed GIS-based approach, detailing input data preparation, PS optimal siting, and timing method. Simulation results are reported in Section 4, while conclusions and future works are given in Section 5.

2. PSs Siting and Timing: Technical Background and Problem Formulation

The PS level must cover the entire utility service territory. The power delivered to each customer must come through some PSs. Thus, the utility service territory is divided into several PS service areas, as shown in Figure 1, where a river crosses the service territory.
Each PS service area consists of the part of the service territory the PS serves. Its area is covered by the Medium Voltage (MV) feeder system emanating from its buses. Usually, the service area for a PS substation is: contiguous, not broken into two or more separate parts; exclusive, PS areas do not overlap; roughly circular; centered upon the PS.
Generally speaking, there is an optimum PS location from an economic perspective, and an optimum location regarding electrical performance, reliability, and service. The optimal location for a PS from the cost standpoint is rarely the lowest cost site, i.e., resulting in an overall compromise between all the costs involved in the PS deployment: land cost, site preparation cost, cost of getting transmission in and feeders out, and proximity to the loads it is intended to serve. Moreover, operational issues must be taken into account, i.e., along with any particular PS site, there is an optimal service area, which is the area, and load, around that site that is best served by it rather than by any other PS substation.
Generally, every customer in a utility system should be served from the nearest PS. Serving each customer from the nearest PS ensures that the distribution delivery distance is as short as possible, reducing feeder costs, electric loss costs, and service interruption exposure. Therefore, valuable guidelines for optimizing the site, size, and service area are to serve every customer from the nearest PS, locating PSs close to as many customers as possible.
Following the aforementioned technical background, the proposed methodology for siting and timing PSs looks for the optimal service areas while locating the PSs as close as possible to the loads. The approach is mainly based on the three following features:
  • A GIS for capturing, elaborating, and displaying spatial input data.
  • A PSO algorithm to optimally locate the new PSs.
  • A Voronoi diagram-based approach assesses the PSO solutions quality and finds the PS service areas.
In the following, a brief introduction to the mentioned features is reported.

2.1. Geographic Information System (GIS)

GISs are used for working with maps and geographic information. They are used to create and manage maps, compile geographic data, analyze mapped information, and share and discover geographic information, and data are positively managed in a database. GIS software provides an infrastructure for making maps and geographic information available throughout an organization, across a community, or on the Web. Usually, several extensions can also be added separately to increase the functionality of GIS software. Several extensions provide added functionality, including 3D Analyst, Spatial Analyst, Network Analyst, Survey Analyst, Tracking Analyst, and Geostatistical Analyst. GISs have emerged as an essential tool for urban and resource planning and management in the last decades. Their capacity to store, retrieve, analyze, model, and map large areas with huge volumes of spatial data has led to an extraordinary proliferation of applications. Geographic information systems are now used for land use planning [20], utility management, ecosystem modeling, landscape assessment and planning, transportation and infrastructure planning [21], market analysis, visual impact analysis [22], facilities management, tax assessment, real estate analysis, and many other applications. For example, electric utilities can use GIS software to manage assets and outages, serve customers, facilitate field operations, and create situational awareness. They can benefit from location-based planning for accounting, network operations, and countless more departments where the power of location can advance the network.

2.2. Particle Swarm Optimization (PSO)

PSO, part of the swarm intelligence family, was developed by Eberhart and Kennedy in 1995 [23]. Initially, it was structured to determine mass behavior; however, programmers noted its potential for solving many optimization problems. PSO allows solving a problem through the concept of particles represented by insects, birds, and other organisms. Particles usually travel in big groups to search for food. Similarly, PSO emulates this behavior as it initializes a population with several particles that move in the space of solutions. Movement velocity, or the capability to jump from one solution to another to get the optimal (or close to it) value, depends on how the PSO has been programmed. There are two determining factors to the orientation of each particle. The first is own experience, denominated as the local best p i b e s t , which is the best-encountered solution by the particle i. The second is the global experience, denominated as global best g b e s t , which is the best solution obtained so far by any particle in the population. PSO was first designed for continuous problems, but the authors also developed a binary to solve noncontinuous optimization problems, such as PSs location or distribution feeder reconfiguration.
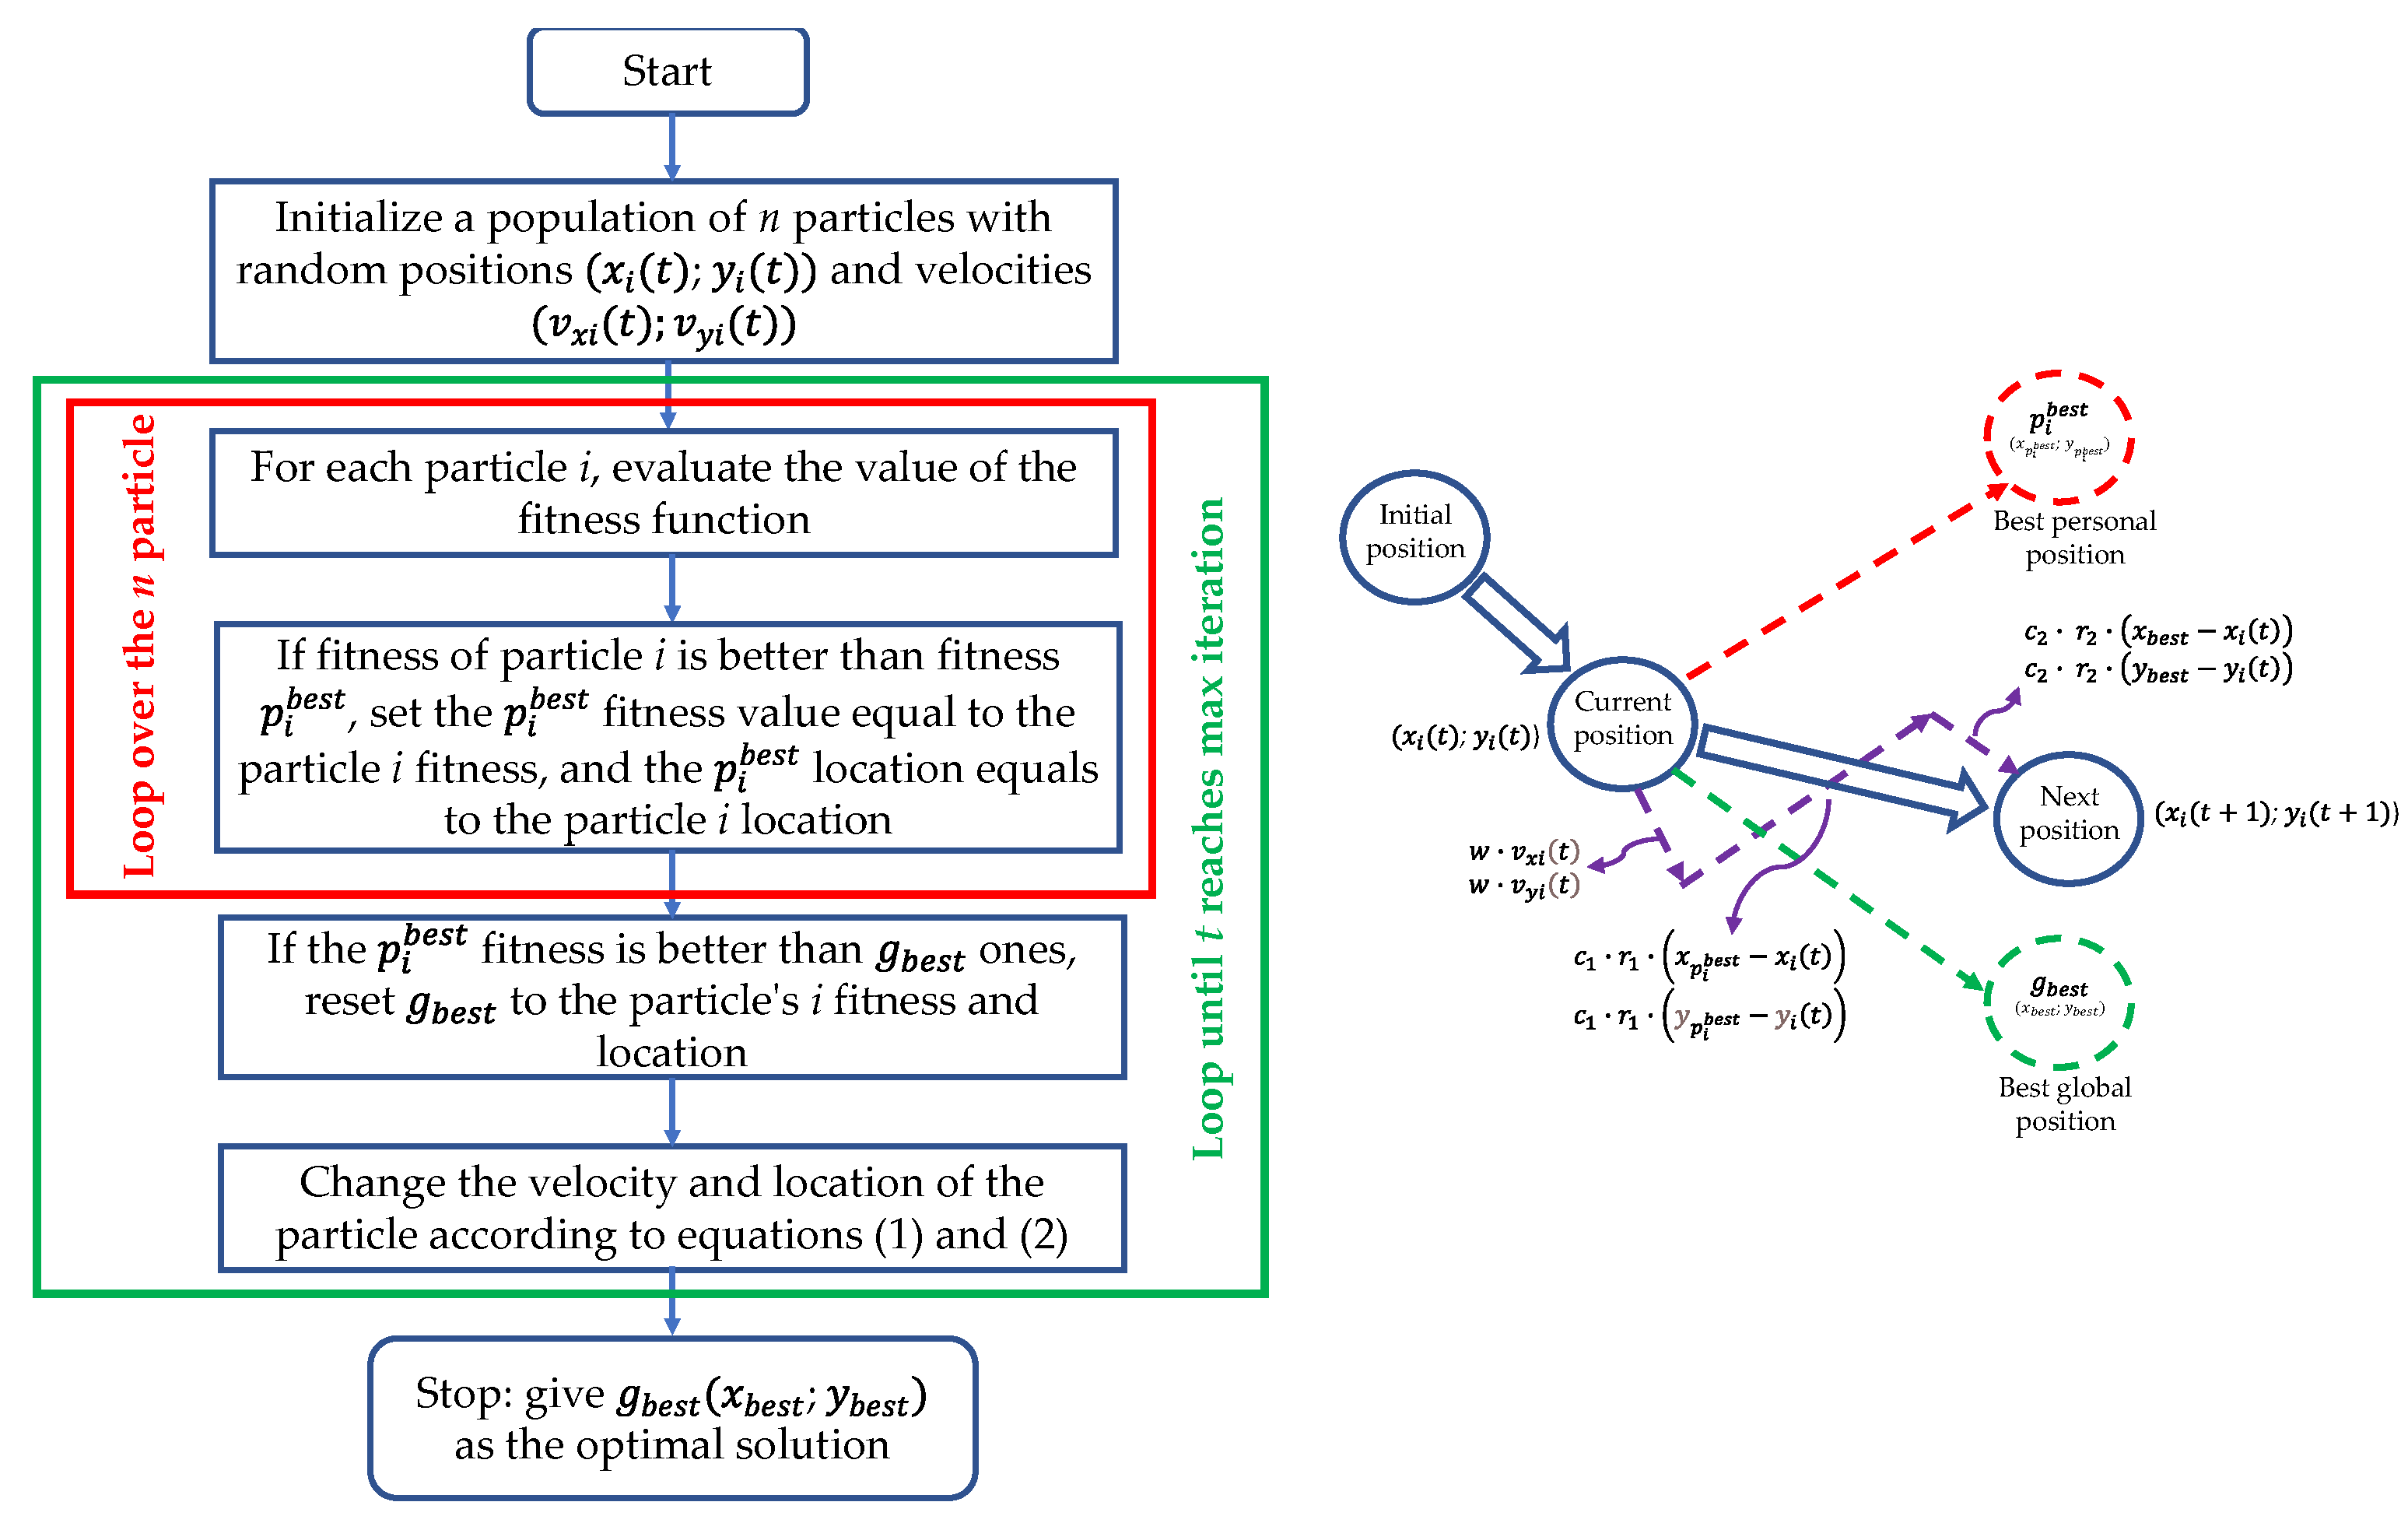
PSO works as follows; see Figure 2:
1.
Initialize a population of n particles with random positions ( x i t ;   y i t ) and velocities v x i t ; v y i t , where t denotes the considered iteration. It is worth noticing that the positions and velocities can be defined based on the dimensions of the problem space;
2.
For each particle i, evaluate the value of the fitness function;
3.
Compare particle’s fitness with particle’s i personal best p i b e s t ( x p i b e s t ;   y p i b e s t ) . If the particle’s i fitness value is better than p i b e s t fitness, then set the p i b e s t fitness value equal to the particle’s i fitness, and the p i b e s t location equals the particle’s i location;
4.
Compare the fitness of p i b e s t   with the population’s overall previous fitness g b e s t ( x b e s t ;   y b e s t ) . If the p i b e s t value is better than g b e s t ones, reset g b e s t to the particle’s i fitness and location;
5.
Change the velocity and location of the particle according to Equations (1) and (2), respectively:
v x i t + 1 = w · v x i t + c 1 · r 1 · x p i b e s t x i t + c 2 ·   r 2 · x b e s t x i t   v y i t + 1 = w · v y i t + c 1 · r 1 · y p i b e s t y i t + c 2 ·   r 2 · y b e s t y i t
x i t + 1 = x i t + v x i t + 1   y i t + 1 = y i t + v y i t + 1  
where r 1 and r 2 are random numbers between 0 and 1, which weight the velocity for the acceleration toward p i b e s t and g b e s t locations; constants w ,   c 1 , and c 2 are parameters of the PSO algorithm; p i b e s t is the position that gives the best fitness value ever explored by particle i and g b e s t is the one explored by all the particles in the swarm. The parameter w is the inertia weight, a constant value between 0 and 1, and determines how much the particle should keep on with its previous velocity, i.e., the speed and direction of the search. The parameters c 1 and c 2 are called the cognitive and the social coefficients, respectively. They control how much weight should be given between refining the particle’s search result and recognizing the swarm’s search result. These parameters can be considered as the trade-off between exploration and exploitation. It is worth noticing that, p i b e s t and ( x i t ; y i t ) are two-position vectors, and their difference is a vector subtraction. Adding this subtraction to the original velocity v x i t ; v y i t is to bring the particle back to the position p i b e s t ; similarly, for the difference g b e s t and ( x i t ; y i t ) .
6.
Loop to step 2 until a criterion is met, usually meeting the target value of the fitness function or the maximum number of iterations.

2.3. Perpendicular Bisector Rule and the Voronoi Diagram

Given n sites in a two-dimension space s 1 , s 2 ,…, s n the easiest graphical way of dividing the space in a tiling of regular polygons is applying the so-called perpendicular bisector. As shown in Figure 3, the application of this rule consists of the two following steps: (i) draw a straight line (dashed red lines in Figure 3) between a site (the red square in Figure 3) and each of its neighbors (the blue squares in Figure 3); (ii) perpendicularly bisect each of those lines, i.e., divide it in two with a line that intersects it at a ninety-degree angle (green lines in Figure 3). The second step determines a set of geometrical lines equidistant among the sites and their neighbors. Then, the set of all such lines around a site encloses the area closer to it than any other site.
The Voronoi diagram represents a computerized perpendicular bisector method [24,25]. In mathematics, a Voronoi diagram is a way of dividing space into several regions. A set of points called sites is specified beforehand, and for each site, there will be a corresponding region consisting of all points closer to that site than any other. The regions are called Voronoi cells. Thus, given n sites s 1 , s 2 ,…, s n in a distance space P , d , partition P into regions S 1 , S 2 ,…, S n , such that:
S i = p   P   |   d p , s i < d p , s j , i j  
The Euclidean metric can be used as a distance parameter so that the distance d A , B between two points, A and B, is given by the following Equation (4):
d A , B = d a 1 , a 2 , b 1 , b 2 = a 1 b 1 2 + a 2 b 2 2
In two dimensions, the Voronoi diagram partitions the plane into cells, edges, and vertices:
  • Voronoi edges: where the closest neighbor of a point changes. Every point on a Voronoi edge is equidistant from at least two sites.
  • Voronoi cells: all points closer to a given site than any other site.
  • Voronoi vertex: the intersection of at least three edges. It is equidistant from at least three sites.
Figure 4 shows the Voronoi diagram, in two-dimension space, for fifteen sites. The sites are depicted using red squares, while the Voronoi edges are the green lines.
The Voronoi diagram could be used to create the PS service areas. The sites aforementioned are the PSs feeding the DN, and, as a result, Voronoi cells are the service areas of each PS. To respect the rule of supplying the loads with the closest PS, any secondary substation (SS) and the related customers should be supplied from the PS of the cell it belongs to.
Although, defining service areas considering only the geometrical distance is as easy as incorrect. Electrical information must be taken into account as well. In this sense, it could be more reasonable to use a weighted Voronoi diagram [26,27]. In mathematics, a weighted Voronoi diagram is a Voronoi map where cells are defined using a metric that considers the standard distances, e.g., Euclidean metric, modified by weights assigned to the site points. Therefore, given n sites s 1 , s 2 ,…, s n and given an associated weight w i   for each site s i , the weighted distance from a point p to a site s i is defined as in (5):
d w p , s i = p s i w i  
Referring to this metric, we could select, for each PS, weight proportional to its capacity and the power density of its service area. Thus, installing a PS with large weight and power, located in an area with less power density, is closer to many SSs.

3. Proposed GIS-Based Approach

This section presents the proposed GIS-based approach for the siting and timing of new PSs from a DN expansion planning perspective. First, the information used and the pre-processing of the input data are reported. Secondly, a detailed description of the optimal PS siting is presented regarding the PSO algorithm and the weighted Voronoi diagram approach. Finally, the method for timing the settlement of PSs is explained.

3.1. GIS-Based Input Data Preparation

The procedure’s first step consists of setting up the GIS-based input data using QGIS software [28]. QGIS is a free and open-source cross-platform desktop GIS application that supports viewing, editing, and analysis of geospatial data. QGIS allows users to analyze and edit spatial information and compose and export graphical maps. QGIS supports both vector layers and raster. On the one hand, vector data is stored as either point, line, or polygon features. On the other hand, multiple raster image formats are supported, and the software can georeference the images. QGIS integrates with other open-source GIS packages, including PostGIS, GRASS GIS, and MapServer. In addition, plugins written in Python or C++ extend QGIS’s capabilities. Figure 5 shows the flowchart of the input data preparation procedure.
The proposed approach relies on dividing the municipality of Milan and Rozzano into polygons of the same dimension. As shown in Figure 6, using the QGIS tool called “create grid”, a layer of 896 squares, dimensioning 500 m × 500 m each, has been created and overlapped on the Google satellite image map. The grid has been later cut on the Milan and Rozzano municipality borders. Moreover, using the QGIS tool called “centroids”, a point layer containing the centroids of the squares has been created.
The squares and centroids layers are at the basis of the proposed approach. All the GIS information needed for the PSs planning, in the form of either punctual or polygonal layers, is first linked to the related squares and finally to its centroid. In the following, a detailed description of the input data is reported.

3.1.1. Power System Data

The power system data considered are related to PS and SSs. Figure 7 shows the location of the substations: red circles are the PSs owned by Unareti; yellow circles are the PSs owned by a competitor DSO; in purple are, instead, MV substations supplied by a PS, thanks to dedicated power cables. The last type of substation has to be intended as an extension of the supplying PS in another closer location. The developing plan of Unareti [29] indicates the need for building new PSs to face the coming increase in load demand. Moreover, the developing plan already reports the expected number and location of several coming PSs. Therefore, in the optimization approach, the PSs owned by Unareti are taken as-is, MV substations are potentially convertible into PSs, and the PSs of the competitor DSOs are neglected.
Regarding SSs, thanks to the information available in the Unareti database, the grid has been overlapped with a point layer containing the location and the yearly load profile of the current SSs. The resulting map, shown in the left image of Figure 8, pictures the distribution of the SSs in the urban area. To assign a power value to each of the squares, the QGIS function “joint attributes by location” has been used, intersecting the point layer of the SSs with the polygon layer of the grid. Considering the right picture in Figure 8, the yearly load profile of every single cluster results in summing up the load profiles of the points, the SSs, that fall in their area. It is assumed that, in the following years, the load related to the current SSs will be in the same location.
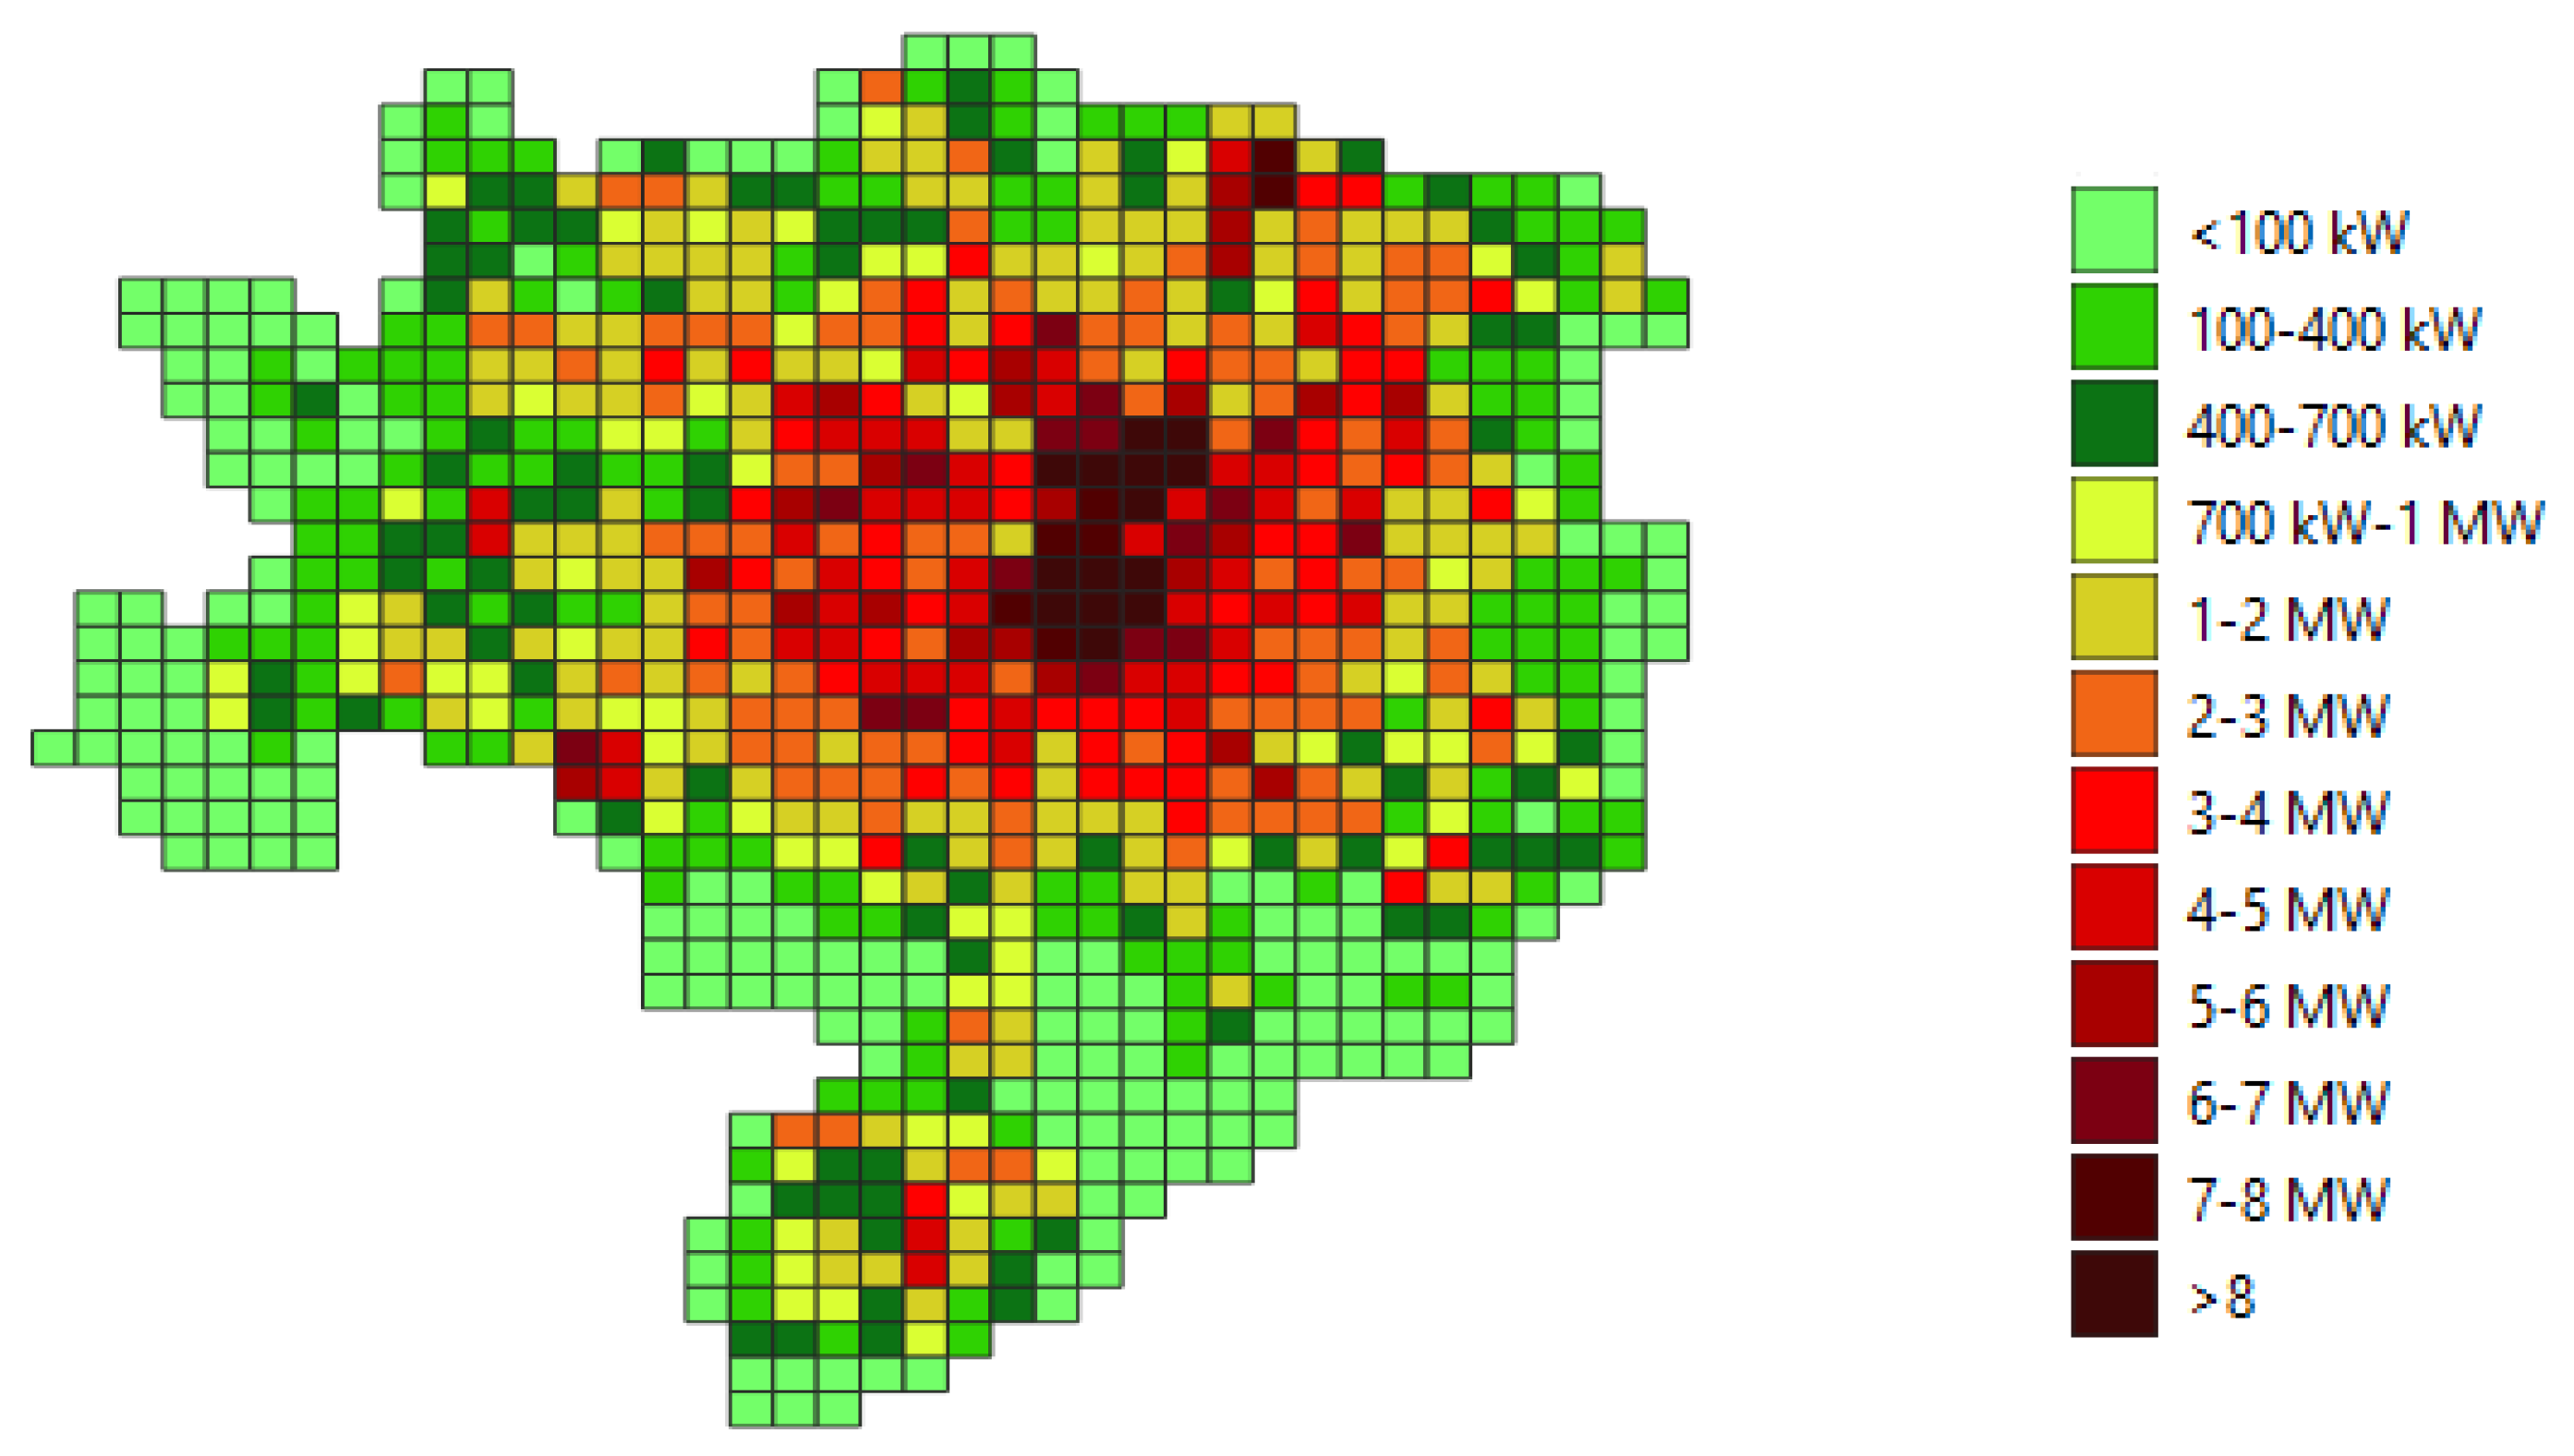
Moreover, based on the analysis and assumption reported in the Unareti developing plan [29], the squares power demand has been updated to take into account the forecasted evolution of demand and generation in the next ten years, such as new residential areas, final consumption electrification, electric vehicles, and distributed generators deployment. It is worth noticing that recent projects for significant urban development could change the location of the new PSs, especially in the areas of Porta Romana and Milano Innovation District. The estimates of energy needs were ongoing at the time of modeling development and simulations, and, therefore, its impact is not included in the simulations input. Finally, the squares are colored based on their yearly peak power, resulting in the load map shown in Figure 9. The classification is made using a dedicated feature of QGIS, in the range of 100 kW–8 MW. The picture shows a higher load density in the city center than in the suburban areas.

3.1.2. Green Areas and Disused or Abandoned Buildings

The second ingredient to consider in the PSs expansion planning is the availability of land space, which is a challenging aspect, especially in urban areas such as Milano and Rozzano. In the proposed approach, we consider candidate locations the green areas, such as city parks and agricultural fields, and disused or abandoned buildings. The related layers have been downloaded from the Lombardy region [30] and Milano geoportals [31]. Figure 10 shows in green the polygon layer of available areas and, using yellow points, the layer of disused or abandoned buildings. As shown in Figure 11, the green area polygons are labeled to one of the squares and the disused or abandoned buildings. Finally, the dimension of the largest green area is attributed to each square, considering the space available to build a PS. It is worth noting that the squares containing existing MV substations and the expected PSs reported in the Unareti developing plan are considered candidate locations.

3.1.3. Population Data and PSs Dimension

The last information taken into account is related to population density. As shown in the left picture of Figure 12, the population is deduced by the census tracts downloaded from the Milano dataset website [32]. We consider the following classification: low-density area: population less than 6000 people; medium-density area: population greater than 6000 and less than 15,000; high-density area: population greater than 15,000. It is worth noticing that the thresholds are chosen by calculating the difference between the census tracts’ maximum and minimum population and dividing it by three. Based on the classification in the righthand picture of Figure 12, the squares are colored in green, low-density; yellow, medium-density; and red, high-density.
In the proposed approach, the population defines the type of PS, either indoor or outdoor. Considering the dimension of the current Unareti PSs, we set up the following criteria:
  • Outdoor PS: allowed only in low-density areas; needs an available area greater than 6200 m2 (corresponding to 2.5% of the size of each square).
  • Indoor PS: mandatory in medium and high-density areas; requires at least 2500 m2 of available area (corresponding to 1% of the size of each square).
Finally, mixing all the information, we ended up with the map shown in Figure 13. The green squares are a candidate to accommodate a PS, while the red squares are not. Moreover, the map highlights in blue the squares that contain an MV substation without enough space for a conversion in a PS. The orange squares contain either an MV substation with enough space to be converted into a PS or the location of expected coming PSs, as indicated in the Unareti developing plan.
As a final statement, it is worth noticing that the approach is highly flexible regarding a possible change in the input data: additional scenarios can be easily considered by adjusting the grid maps shown in Figure 9 and Figure 13 with the potential new information available.

3.2. PSs Optimal Siting

This section presents the optimization method for the siting of new PSs. As mentioned in Section 2, the proposed methodology relies on a combined PSO and Voronoi diagram approach. Therefore, in the following, the application of PSO combined with the Voronoi diagram is detailed.

3.2.1. Multi-Site PSO Algorithm for PSs Location

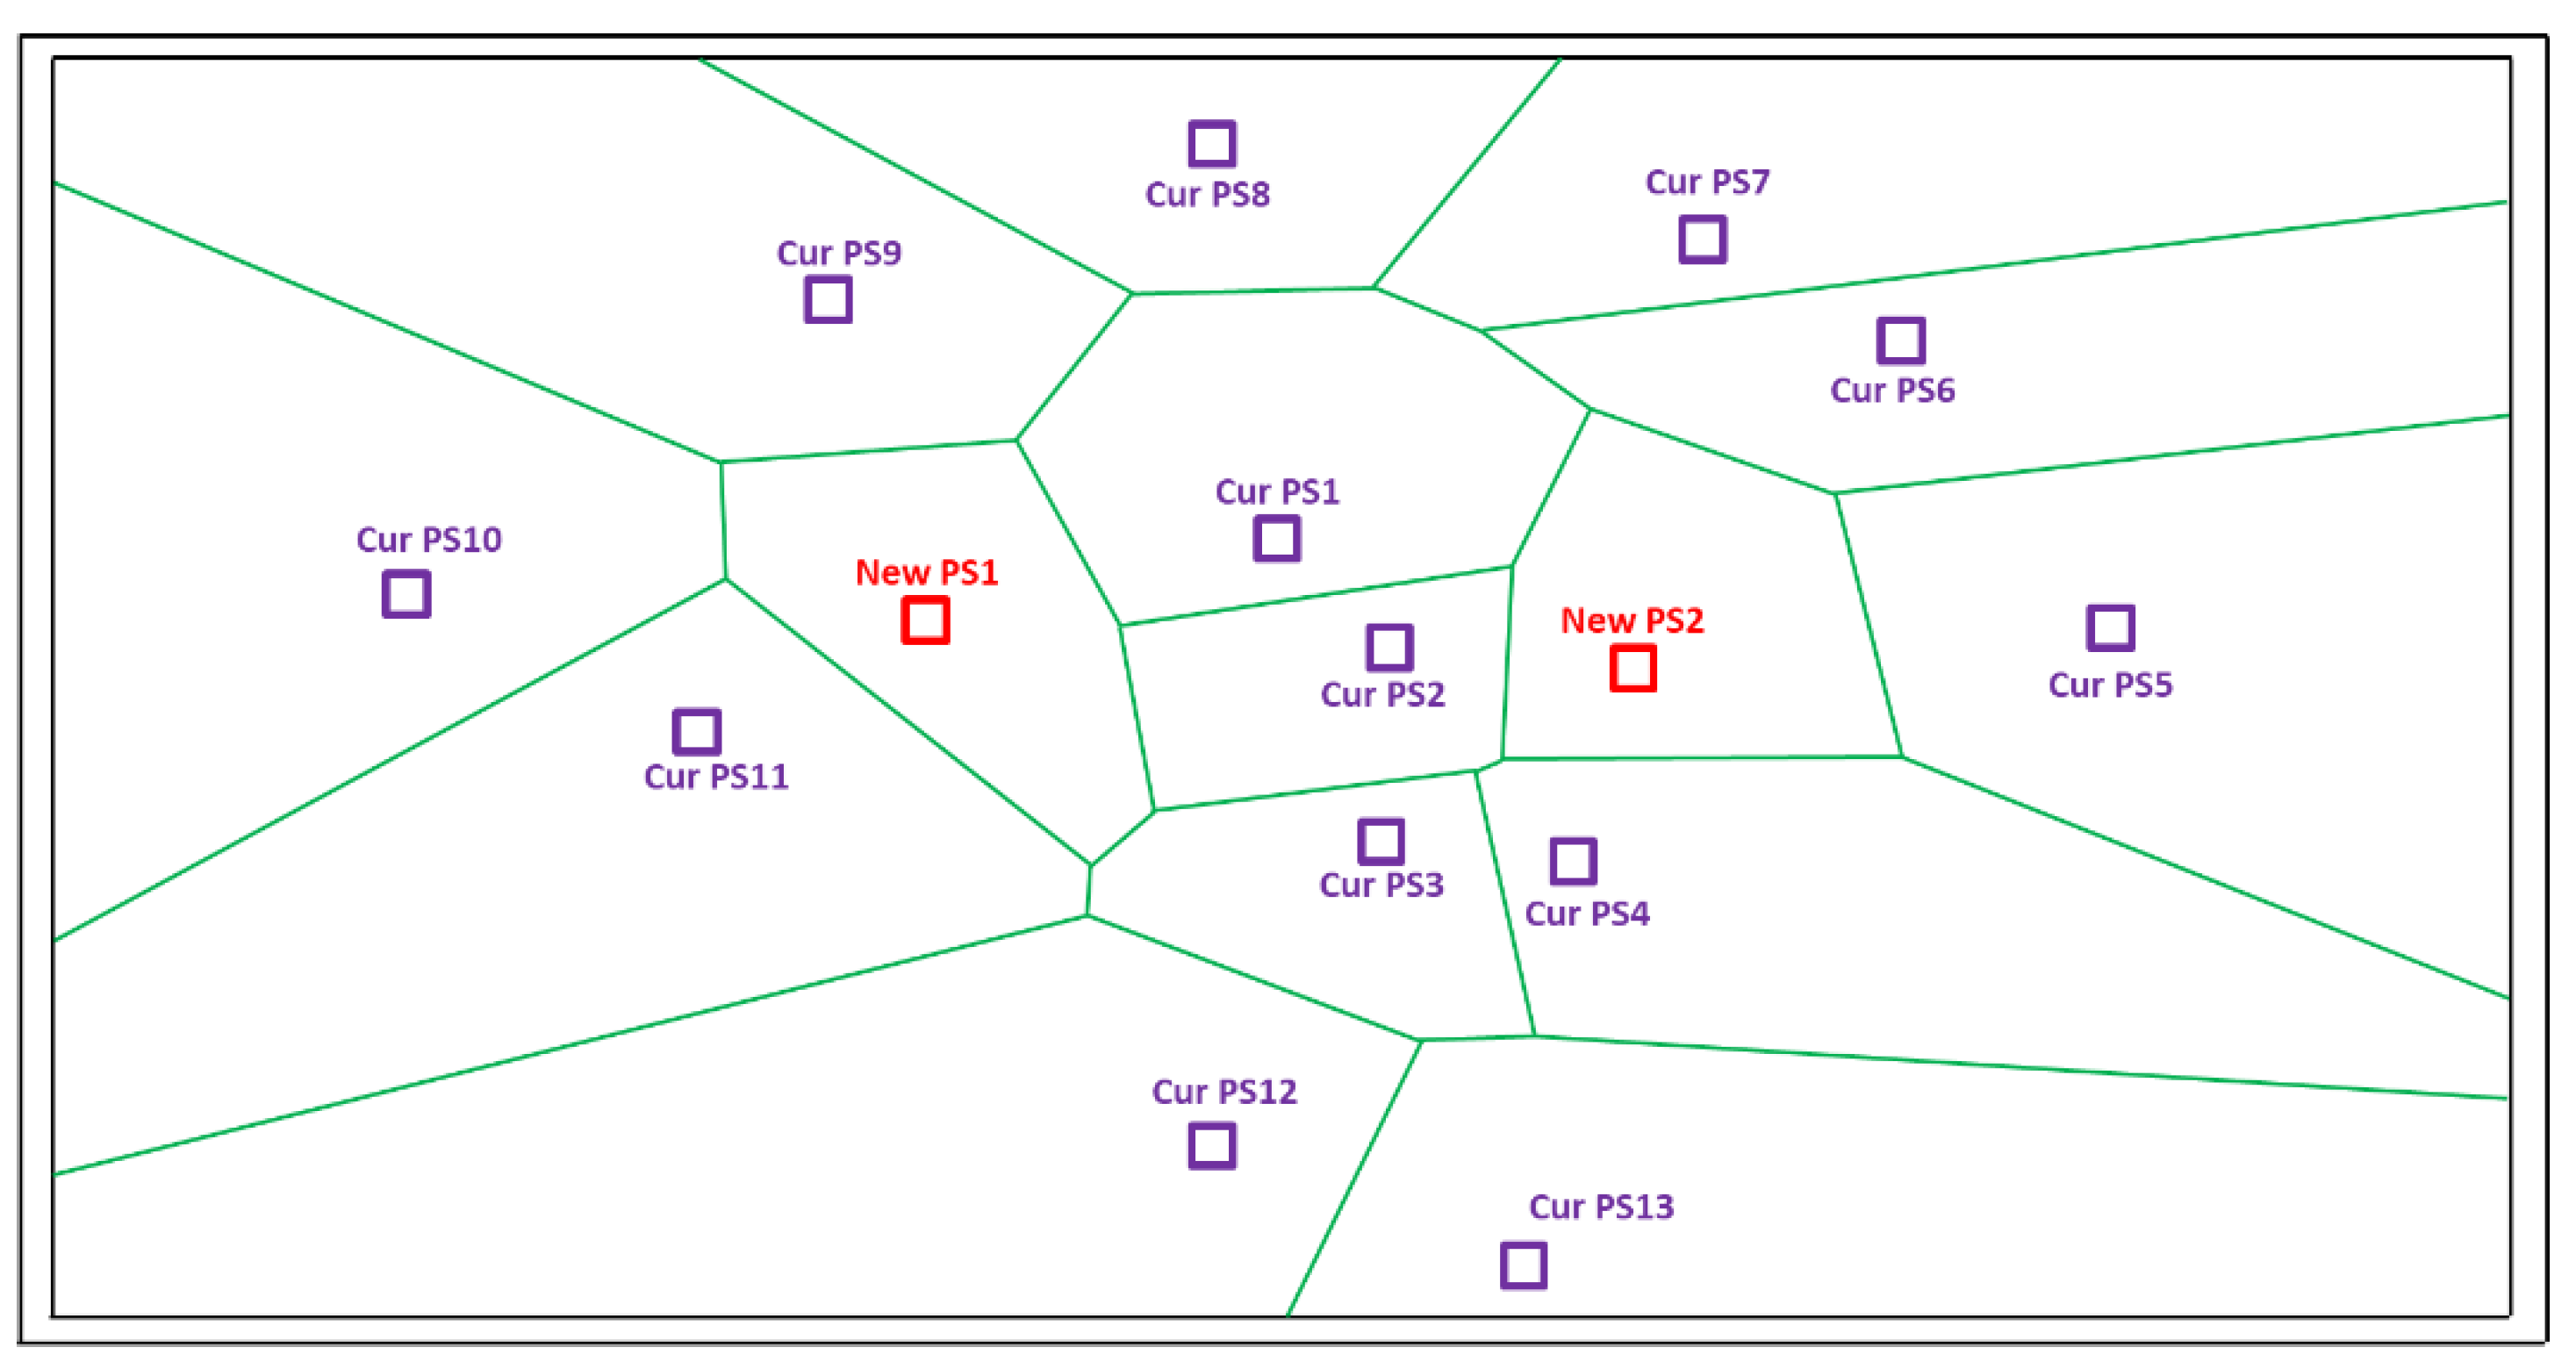
The PSO described in Section 2 considers a single site. However, in the case of PSs siting, we have to deal with multiple sites corresponding to multiple new PSs. Figure 14 shows an example of installing two new PSs, New PS1 and New PS2, in addition to thirteen existing PSs: Cur PS1–Cur PS13.
As depicted in Table 1, the PSO only modifies the location of the two new PSs, i.e., x i N e w   P S 1 t ;   y i N e w   P S 1 t and x i N e w   P S 2 t ;   y i N e w   P S 2 t , while the location of the current PSs are taken as they are, e.g., x C u r   P S 1 t ;   y C u r   P S 1 t .
Moreover, as shown in Table 2, each particle i has its velocity, and particle’s personal best, while a global best characterizes each PSs site. Referring to Figure 14, Table 2 shows the parameter used by the PSO. For simplicity, only generic values of the particle’s coordinates are reported, while the other cells have been intentionally left empty.

3.2.2. Weighted Voronoi Diagram Approach for PSs Location

As for the PSO, even the weighted Voronoi diagram approach presented in Section 2 has been shaped for the PS siting problem. Instead of providing a weight to each PS, a weight is given to each centroid of the squares proportional to the power demand reported in Figure 9. Therefore, turning over the idea behind Equation (5), given p centroids p 1 , p 2 ,…, p n and a weight w p i   for each centroid p i , the weighted distance from a centroid p to a PS P S i is defined as in (6):
d w p i , P S i = p i P S i   w p i  
The more the weight   w p i , i.e., the power demand, the more the centroid p i appear to be far away from the PS P S i . For the sake of clarity, Figure 15 shows several centroids and PSs. On the one hand, assuming the Euclidean distance as a metric, to minimize the distance between the new PS and the centroids 1 and 2, the location of the PS must be the one depicted in the left picture, characterized, for instance, by d p 1 , P S = d p 2 , P S = 100   m .
On the other hand, if the weighted distance in Equation (6) is considered, assuming w p 1 = 100   kW and w p 2 = 200   kW , the location of the new PS must be the one depicted in the right picture, much closer to the centroid 2. In this latter case, assuming d p 1 , P S = 200   m and d p 2 , P S = 100   m , the weighted distance results in being d w p 1 , P S = 100 × 200 = 300   kW · m and d w p 2 , P S = 200 × 100 = 300   kW · m , perfectly balanced with the advantage of having the PS closer to the square with higher demand.

3.2.3. Overview of the PSs Siting Optimization Approach

Figure 16 shows the flowchart of the optimization approach. The first step of the procedure requires loading the input data: the number of new PSs to be installed, the candidate squares for PSs settlement, and the power demand of the squares. Later on, PSO parameters and the starting solution are selected: w = 1 , c 1 = c 2 = 2 , number of paricles equal to 100, 150 iterations. At the end of each iteration, the weight w is damped by a w d a m p = 0.95 , to reduce the acceleration through the iteration process. Moreover, on the one hand, we load the extreme coordinates of the grid, i.e., X m i n = 1,504,229 − X m a x = 1,519,789; Y m i n = 5,027,479 − Y m a x = 5,041,474, and using a random function, we selected the initial position of the new PSs within this range. On the other hand, we initialize to zero all the particles’ velocities. Additionally, a limit on X and Y velocities is also imposed equal to 10% of ( X m a x X m i n )   and   ( Y m a x Y m i n ) . Lastly, the initial PSs location is checked, and the PSs felt out of the candidate squares are moved to the closest available square.
The next step of the methodology is to run the PSO algorithm. The fitness function of each particle is evaluated first. Referring to Figure 17, each square is labeled with the nearest PSs using Equation (6). For instance, square 1 falls in the service area of the PS called New PS1, being d w p 1 , N e w   P S 1 = p 1 N e w   P S 1   w p 1 the smaller distance to all the PSs. Evaluating d w p i , P S i for each square, the fitness function is computed as in Equation (7):
Fitness = i = 1 n °   s q u a r e s d w p i , P S i j = 1 n °   P S s P P S j  
where P P S j is the power demand of the PS P S j , the sum of the power demand of the squares belonging to the P S j   service area. Therefore, the fitness is the weighted mean of the distances between each square and the related PSs biased by the squares’ power demand.
The weighted Voronoi approach is also used to compute the PS loadings. The particles with a power demand greater than 75% of the PS transformers’ nominal power are excluded from the personal and global best computation. This constraint allowed us to save a reasonable power margin for the feeder’s backup purposes. Regarding the new PSs, the Unareti standard is to install three transformers with a nominal power of 63 MW each. Thus, the new PS power limit is P P S _ m a x = 0.75 × 3 × 63 = 142   MW . Finally, the position of the new PSs is compared with the location of the PSs included in the Unareti developing plan and the existing MV substations. If a PS suggested from the PSO is nearer than 750 away, its position is updated to take the advantages of using already investigated lands (authorizations, etc.) or using existing space. The output of the optimization process gives the best locations of the new PSs, their service areas, and the power demand.

3.3. PSs Optimal Timing

A side result of the PS siting is information on the best timing for the new PSs settlement. The temporal order of installation is derived by progressively adding the new PSs and checking the fitness function’s evolution. Assuming the fitness value before installing new PSs to be 2000, and assuming locating four new PSs, the proposed method installs, one by one, the PSs and evaluates the fitness variation. For instance, as shown in Table 3, PS4 minimizes fitness more. Thus, it should be the first one installed. In the second iteration the methodology considers PS4 in place and, installing one by one the remaining PSs, it identifies the second-best PS, i.e., PS3. The procedure ends when all the PSs have been investigated. Finally, the list of priorities is PS4-PS3-PS1-PS2.

4. Simulation Results

This section reports the simulation findings of the proposed PSs siting and timing approach. For simplicity, only a few selected results are detailed, giving a comprehensive comparison of all the simulations carried out. We increased the number of new PSs from 1 to 12. As a background, Figure 18 shows the current PS service areas. The Voronoi diagram takes the PSs owned by Unareti, the red points, and the PSs owned by a competitor DSO, the yellow points. The current average distance between the squares and the related PSs is 1.82 km, while the weighted distance is 1.48 km.

4.1. Siting and Timing of Three New PSs

Figure 19 shows the optimal siting and timing considering three new PSs. The first PS is settled in Rozzano municipality, located in the extreme lower part of the map. It is worth noticing that the position of the PSs is close to the squares having the highest power demand, a direct consequence of the fitness function explained in Equation (7). Instead, the second and the third PSs surround the city center, where power density is high, filling the gaps between the existing PSs.
The restricted number of PSs concerning the Milan and Rozzano area does not allow installing any PSs on the left-hand side of the map, whose squares remain far from the related PSs. The PS service areas are better highlighted in Figure 20. The new PS called “1” split the service area of the existing PS called “SU” almost by half, giving undoubted advantages in reducing the distance between squares and the related PSs. The cells’ colors show that the algorithm does not fail in finding a feasible solution, which guarantees a power demand of the PSs lower than 75% of the transformers’ nominal power. Nevertheless, five PSs out of fourteen have a loading greater than 50%, reporting potential criticalities in dealing with additional future power demand increases. It is worth noticing that the PS “OV” service area still has a significant extension.
Regarding fitness, the average distance between the squares and the related PSs is 2.11 km, while the average weighted distance is 1.35 km. On the one hand, since the algorithm locates the new PSs closer to the power demand, with three new PSs instead of the seven PSs owned by a competitor DSO, a significant reduction of about 9% of the weighted distance can be obtained (current value is 1.48 km). On the other hand, the reduced number of PSs brings an average distance higher than the current one, i.e., 1.82 km. It is worth noticing that the average distance is not the fitness function of the proposed methodology. Its reduction, if it happens, is just a consequence of the average weighted distance optimization.
Table 4 shows the main outputs of the methodology and reports the siting, timing of the new PSs, the best average distance, and the best average weighted distance compared to the current condition. The last column details the fitness variation while installing, in the order suggested by the algorithm, the three new PSs. It is nice to see that, with only two new PSs, the best average weighted distance dropped below the current value, which indicates the poor location of the current seven PSs owned by a competitor DSO. However, the loading indicated in Figure 20 suggests the need to install several more PSs.
Regarding the optimization process, Figure 21 reports the best fitness through the 150 iterations and the global best fitness. Comparing the two trends, it can be noticed that the random starting solution expresses the global best fitness for the first four iterations when the value of global best fitness first drops. It is worth noting that the final fitness value is found after 85 iterations.
Finally, the position of the new PSs is compared with the areas already investigated by Unareti for the location of the PSs included in the developing plan and the existing MV substations. The new PSs called “3” is not far from the MV substations “SV”. Thus the methodology proposes to revamp it to take advantage of using the existing space.

4.2. Siting and Timing of Eighth PSs

Figure 22 shows the optimal siting and timing considering eighth new PSs. This number coincides with the expected number of PSs to be installed by Unareti in the coming five years. As in the previous case, the first PS is settled in Rozzano municipality, in the exact prior position. Even the second and the third PSs are in the same position as when considering just three PSs, which indicates those spots of primary importance for DN development. Two of the remaining new PSs are located in the city center, i.e., numbers 5 and 6, while the last three are more in the neighborhood.
The PSs service areas are highlighted in Figure 23. The increased number of new PS allowed reducing the PS service areas dimension, giving undoubted advantages in reducing the distance between squares and the related PSs. Again, the cells’ colors show that the algorithm does not fail to find a feasible solution, which guarantees a power demand of the PSs lower than 75% of the transformers’ nominal power. Nevertheless, several PSs have a loading greater than 50%, even with reduced values lower than the three new PSs.
Regarding fitness, the average distance between the squares and the related PSs is 1.70 km, while the average weighted distance is 1.08 km. Since the algorithm locates the new PSs closer to the power demand, concerning the seven PSs owned by a competitor DSO, a significant reduction of 27% of the weighted distance can be obtained. Moreover, a slight reduction in the average distance is also recorded, from the current one, i.e., 1.82 km, to 1.70. As already mentioned, the average distance is not the fitness function of the proposed methodology, so its reduction is just a consequence of the average weighted distance optimization.
Table 5 shows the main outputs of the methodology and reports the siting, timing of the new PSs, the best average distance, and the best average weighted distance compared to the current condition. The last column details the fitness variation while installing, one at the time, the eight new PSs.
Figure 24 reports the best fitness through the 150 iterations and the global best fitness regarding the optimization process. Similarly to the previous case, comparing the two trends, it can be noticed that the starting solution expresses the global best fitness for the first four iterations when the global best fitness first drops. It is also worth noting that the final fitness value is found after 100 iterations instead of 85.
Finally, the position of the new PS is compared with the areas already investigated by Unareti for the location of the PSs included in the developing plan and the existing MV substations. The new PS called “3” is not far away from the MV substation “SV”, while the new PS called “6” is not far away from the MV substation “CR”. Thus the methodology proposes to revamp them to take advantage of using the existing space.

4.3. Siting and Timing of Eleven PSs

The last case presented considers the installation of eleven new PSs. Figure 25 shows the optimal siting and timing of the PSs. It is worth noticing that the additional PSs are all located closer to the city center, where the load density is high. It has to be considered that siting a PS in the center is not always easy or possible. Therefore, it is reasonable to think that the number of new PSs that could realistically be settled cannot be much more than eleven.
The PSs service areas are highlighted in Figure 26. The increased number of new PSs allowed reducing the PS service areas dimension again, giving undoubted advantages in reducing the distance between squares and the related PSs. Even in this case, the cells’ colors show that the algorithm does not fail to find a feasible solution, which guarantees a power demand of the PSs lower than 75% of the transformers’ nominal power. Nevertheless, one PS has a loading greater than 50%, but just a little to have enough capacity to face additional future load increases.
Regarding fitness, the average distance between the squares and the related PSs is 1.73 km, slightly higher than the case of eight PSs, while the average weighted distance is 0.98 km. Regarding the current situation, the reduction of the weighted distance resulted in about 35%.
As usual, Table 6 shows the main outputs of the methodology and reports the siting, timing of the new PSs, the best average distance, and the best average weighted distance compared to the current condition. The last column details the fitness variation while installing, one at the time, the eleven new PSs.
Figure 27 reports the best fitness through the 150 iterations and the global best fitness regarding the optimization process. Different from the previous cases, comparing the two trends, it can be noticed that the starting solution expresses the global best fitness for the first 50 iterations. This is because the algorithm needs more iterations when the number of PSs increases. It is worth noting that the final fitness value is found after 120 iterations.
Finally, the position of the new PSs is compared with the areas already investigated by Unareti for the location of the PSs included in the developing plan and the existing MV substations. The new PS called “3” is not far away from the MV substation “SV”; the new PS called “6” from the MV substation “CR”; the new PS called “9” from the MV substation “PO”; the new PS called “10” from the MV substation “MU”. Thus, the methodology proposes to revamp them to take advantage of using the existing space.

4.4. Comprehensive Analysis of the Simulations

This section reports a comprehensive analysis of the simulations carried out. As already mentioned, we varied the number of new PSs from 1 to 12. Figure 28 shows, in a single chart, the best fitness evolution through the 150 iterations. The trend confirms the effectiveness of the proposed approach. On the one hand, the left picture suggests that the more the number of PSs, the more the iterations needed to find a stable final solution. On the other hand, the right picture shows that the more the number of PSs, the lower the fitness’s final value.
Finally, Figure 29 reports the evolution of the fitness’s final value concerning the different number of PSs. The Y-axis reports the fitness, i.e., the average weighted distance, while the X-axis is the number of new PSs installed. Moreover, the regression curve is shown in dashed red together with the curve equation and the value of R2.
As justified by the correlation coefficient, the two trends are pretty similar. Thus, the regression curve was used to estimate the fitness value of an increased number of new PSs. As shown in Figure 30, the main advantages of the mean weighted distance are obtained by installing the first PSs: the first twelve PSs guarantee a reduction of about 42%, while, for instance, the following twelve guarantee a reduction of only 8%. The chart in Figure 30 can also be used by Unareti to estimate the optimal number of PSs that optimize capital and operational costs.

5. Conclusions and Future Works

The paper proposes an optimal siting and timing methodology for primary substations to expand existing distribution networks. The proposed approach relies on three main features: a GIS for capturing, elaborating, and displaying spatial input data; a PSO algorithm to locate and timing the new primary substations; a Voronoi diagram-based approach to find the primary substation service areas and loading. Thanks to Unareti, the method has been tested on Milano and Rozzano by carrying out several simulations, progressively increasing the number of new primary substations. The results confirm the proposed approach’s effectiveness, giving valuable suggestions on the optimal siting, timing, and the number of new PSs. As expected, the more the number of PSs, the lower the fitness value, but it is worth noting that the first PSs installed guarantee a substantial reduction which progressively decreases with the following PSs settled. As already mentioned, it is worth noticing that recent projects for significant urban development could change the location of the new PSs, especially in the areas of Porta Romana and Milano Innovation District. The estimates of energy needs have been ongoing at the time of modeling development and simulations, and, therefore, its impact is not included in the simulation results. However, the model is highly flexible so that the input can be easily adjusted to run additional simulations. Several are the potential improvements to the proposed approach. Firstly, the objective function could be sophisticated by including CAPEX and OPEX costs or considering others objectives, such as reliability. Secondly, additional constraints related to the MV and LV networks could be added. Lastly, the input data could be better investigated and improved, including uncertainties related to the load demand and the regulatory framework.

Author Contributions

Conceptualization, A.B. (Alessandro Bosisio), M.M. and A.M.; Data curation, G.I.; Funding acquisition, A.B. (Alberto Berizzi); Investigation, A.B. (Alessandro Bosisio); Methodology, A.B. (Alessandro Bosisio) and M.M.; Project administration, A.B. (Alberto Berizzi) and A.M.; Supervision, A.B. (Alessandro Bosisio), A.B. (Alberto Berizzi); Validation, A.B. (Alessandro Bosisio), A.B. (Alberto Berizzi), M.M. and A.M.; Writing—review & editing, A.B. (Alessandro Bosisio), A.B. (Alberto Berizzi), M.M. and G.I. All authors have read and agreed to the published version of the manuscript.

Funding

This research received no external funding.

Institutional Review Board Statement

Not applicable.

Informed Consent Statement

Not applicable.

Data Availability Statement

Not applicable.

Acknowledgments

The authors gratefully acknowledge the contributions of Nicola Orlandi.

Conflicts of Interest

The authors declare no conflict of interest.

References

  1. Bosisio, A.; Amaldi, E.; Berizzi, A.; Bovo, C.; Fratti, S. A MILP approach to plan an electric urban distribution network with an H-shaped layout. In Proceedings of the 2015 IEEE Eindhoven PowerTech, Eindhoven, The Netherlands, 29 June–2 July 2015. [Google Scholar] [CrossRef]
  2. Vigano, G.; Clerici, D.; Michelangeli, C.; Moneta, D.; Bosisio, A.; Morotti, A.; Greco, B.; Caterina, P. Energy transition through PVs, EVs, and HPs: A case study to assess the impact on the Brescia distribution network. In Proceedings of the 2021 AEIT International Annual Conference (AEIT), Milan, Italy, 4–8 October 2021; pp. 1–6. [Google Scholar] [CrossRef]
  3. Picioroaga, I.; Eremia, M.; Ilea, V.; Bovo, C. Resilient operation of distributed resources and electrical networks in a smart city context. UPB Sci. Bull. Ser. C Electr. Eng. Comput. Sci. 2020, 82, 267–278. [Google Scholar]
  4. Iannarelli, G.; Bosisio, A.; Greco, B.; Moscatiello, C.; Boccaletti, C. Flexible resources dispatching to assist DR management in urban distribution network scenarios including PV generation: An Italian case study. In Proceedings of the 2020 IEEE International Conference on Environment and Electrical Engineering and 2020 IEEE Industrial and Commercial Power Systems Europe, EEEIC/I and CPS Europe 2020, Madrid, Spain, 9–12 June 2020. [Google Scholar]
  5. Bosisio, A.; Moncecchi, M.; Morotti, A.; Merlo, M. Machine Learning and GIS Approach for Electrical Load Assessment to Increase Distribution Networks Resilience. Energies 2021, 14, 4133. [Google Scholar] [CrossRef]
  6. Tanwar, S.S.; Khatod, D. A review on distribution network expansion planning. In Proceedings of the 2015 Annual IEEE India Conference (INDICON), New Delhi, India, 17–20 December 2015. [Google Scholar] [CrossRef]
  7. Sekhar, A.N.; Rajan, K.S.; Jain, A. Spatial informatics and Geographical Information Systems: Tools to transform Electric Power and Energy Systems. In Proceedings of the TENCON 2008-2008 IEEE Region 10 Conference, Hyderabad, India, 19–21 November 2008. [Google Scholar] [CrossRef]
  8. Camargo, V.; Lavorato, M.; Romero, R. Specialized genetic algorithm to solve the electrical distribution system expansion planning. In Proceedings of the 2013 IEEE Power & Energy Society General Meeting, Vancouver, BC, Canada, 21–25 July 2013. [Google Scholar] [CrossRef]
  9. Aghaei, J.; Muttaqi, K.; Azizivahed, A.; Gitizadeh, M. Distribution expansion planning considering reliability and security of energy using modified PSO (Particle Swarm Optimization) algorithm. Energy 2014, 65, 398–411. [Google Scholar] [CrossRef] [Green Version]
  10. Koutsoukis, N.C.; Georgilakis, P.S.; Hatziargyriou, N.D. A Tabu search method for distribution network planning considering distributed generation and uncertainties. In Proceedings of the 2014 International Conference on Probabilistic Methods Applied to Power Systems (PMAPS), Durham, UK, 7–10 July 2014; pp. 1–6. [Google Scholar] [CrossRef]
  11. Baharuddin, I.N.Z.; Roslan, R.; Omar, R.C.; Zulkarnain, M.S.; Wahab, W.A.; Solemon, B. Enhancement of application model for substation site selection. Int. J. Eng. Adv. Technol. 2019, 9, 3626–3630. [Google Scholar] [CrossRef]
  12. Phayomhom, A.; Rugthaicharoencheep, N.; Chaitusaney, S. GIS application to distribution substation planning in MEA’s power system. In Proceedings of the 2015 12th International Conference on Electrical Engineering/Electronics, Computer, Telecommunications and Information Technology (ECTI-CON), Hua Hin, Thailand, 24–27 June 2015. [Google Scholar] [CrossRef]
  13. Ghusti, P.; Sarno, R.; Ginardi, R.H. Substation placement optimization method using Delaunay Triangulation Algorithm and Voronoi Diagram in East Java case study. In Proceedings of the 2016 International Conference on Information & Communication Technology and Systems (ICTS), Surabaya, Indonesia, 12 October 2016; pp. 208–213. [Google Scholar] [CrossRef]
  14. Wang, S.; Lu, Z.; Ge, S.; Wang, C. An Improved Substation Locating and Sizing Method Based on the Weighted Voronoi Diagram and the Transportation Model. J. Appl. Math. 2014, 2014, 1–9. [Google Scholar] [CrossRef]
  15. Vahedi, S.; Banejad, M.; Assili, M. Optimal location, sizing and allocation of subtransmission substations using K-means algorithm. In Proceedings of the 2015 IEEE Power & Energy Society General Meeting, Denver, CO, USA, 26–30 July 2015. [Google Scholar] [CrossRef]
  16. Mazhari, S.M.; Monsef, H.; Romero, R. A Hybrid Heuristic and Evolutionary Algorithm for Distribution Substation Planning. IEEE Syst. J. 2013, 9, 1396–1408. [Google Scholar] [CrossRef] [Green Version]
  17. Vahedi, S.; Banejad, M.; Assili, M. GIS-Based Substation Expansion Planning. IEEE Syst. J. 2020, 15, 959–970. [Google Scholar] [CrossRef]
  18. Yu, L.; Shi, D.; Guo, X.; Xu, G.; Jiang, Z.; Jian, G.; Lei, J.; Jing, C. GIS-based optimal siting and sizing of substation using semi-supervised learning. In Proceedings of the 2017 IEEE Green Energy and Smart Systems Conference (IGESSC), Long Beach, CA, USA, 6–7 November 2017; pp. 1–6. [Google Scholar] [CrossRef]
  19. Jiao, R.; Yang, Z.; Shi, R.; Lin, B. A multistage multiobjective substation siting and sizing model based on operator-repair genetic algorithm. IEEJ Trans. Electr. Electron. Eng. 2014, 9, S28–S36. [Google Scholar] [CrossRef]
  20. Adamiak, M.; Jażdżewska, I.; Nalej, M. Analysis of Built-Up Areas of Small Polish Cities with the Use of Deep Learning and Geographically Weighted Regression. Geosciences 2021, 11, 223. [Google Scholar] [CrossRef]
  21. Pantiga-Facal, E.; Plasencia-Lozano, P. A GIS-Based Analysis of the Light Rail Transit Systems in Spain. Appl. Sci. 2022, 12, 1282. [Google Scholar] [CrossRef]
  22. Puangkaew, N.; Ongsomwang, S. Remote Sensing and Geospatial Models to Simulate Land Use and Land Cover and Estimate Water Supply and Demand for Water Balancing in Phuket Island, Thailand. Appl. Sci. 2021, 11, 10553. [Google Scholar] [CrossRef]
  23. Kennedy, J.; Eberhart, R. Particle swarm optimization. In Proceedings of the ICNN’95-International Conference on Neural Networks, Perth, WA, Australia, 27 November–01 December 1995; Volume 4, pp. 1942–1948. [Google Scholar]
  24. Pokojski, W.; Pokojska, P. Voronoi diagrams–inventor, method, applications. Pol. Cartogr. Rev. 2018, 50, 141–150. [Google Scholar] [CrossRef] [Green Version]
  25. Bosisio, A.; Berizzi, A.; Amaldi, E.; Bovo, C.; Morotti, A.; Greco, B.; Iannarelli, G. A GIS-based approach for high-level distribution networks expansion planning in normal and contingency operation considering reliability. Electr. Power Syst. Res. 2020, 190, 106684. [Google Scholar] [CrossRef]
  26. Aurenhammer, F.; Edelsbrunner, H. An optimal algorithm for constructing the weighted voronoi diagram in the plane. Pattern Recognit. 1984, 17, 251–257. [Google Scholar] [CrossRef]
  27. Wang, C.A.; Tsin, Y.H. Finding constrained and weighted Voronoi diagrams in the plane. Comput. Geom. 1998, 10, 89–104. [Google Scholar] [CrossRef] [Green Version]
  28. QGIS. QGIS Website. Available online: https://qgis.org/it/site/ (accessed on 17 July 2021).
  29. UNARETI, Piano di Sviluppo e Incremento Resilienza. 2021. Available online: https://www.unareti.it/unr/unareti/elettricita/cittadini/piano-di-sviluppo-e-incremento-resilienza/ (accessed on 27 January 2022).
  30. Home-Geoportale Della Lombardia. Available online: https://www.geoportale.regione.lombardia.it/ (accessed on 25 January 2022).
  31. Geoportale SIT|Comune di Milano. Available online: https://geoportale.comune.milano.it/sit/ (accessed on 27 January 2022).
  32. Portale Open Data|Comune di Milano. Available online: https://dati.comune.milano.it/ (accessed on 27 January 2022).
Figure 1. Example of several PS service areas. Red squares are PS service areas, while green lines are the service area boundaries.
Applsci 12 06008 g001
Figure 2. Flow-chart of the PSO algorithm and the principle of the PSO particle movement.
Applsci 12 06008 g002
Figure 3. Example of the perpendicular bisector rule.
Applsci 12 06008 g003
Figure 4. Example of a two-dimension space Voronoi diagram for fifteen sites denoted by red squares.
Applsci 12 06008 g004
Figure 5. Flowchart of the input data preparation procedure.
Applsci 12 06008 g005
Figure 6. Left picture: the considered 500 m × 500 m grid overlapped on the Google satellite image map; right picture: centroids of each square.
Applsci 12 06008 g006
Figure 7. Location of the PSs and MV substations feeding Milano and Rozzano. Red points are PSs owned by Unareti; Yellow points are PSs belonging to the competitor DSO; MV substations are in purple.
Applsci 12 06008 g007
Figure 8. Left picture: location of the SSs overlapped on the considered grid layer; right picture: zoom of the point layer containing the SSs and the polygon layer of the grid.
Applsci 12 06008 g008
Figure 9. Load map considering the yearly peak power.
Applsci 12 06008 g009
Figure 10. Location of green areas and disused or abandoned buildings (yellow points).
Applsci 12 06008 g010
Figure 11. Left picture: Google satellite image of several squares; right picture: the layer of green areas reported in green.
Applsci 12 06008 g011
Figure 12. Left picture: classification of census tracts based on the population density (from green, low density, to red, high density); right picture: representation of the squares based on the area classification: green for low-density, yellow for medium-density, red for high-density.
Applsci 12 06008 g012
Figure 13. Squares available for PSs settlement: green are the squares able to accommodate a PS; red are the squares unable to accommodate a PS; blue is the squares that contain an MV substation without enough space for conversion into a PS, while the orange squares contain either an MV substation with enough space to be converted into a PS or the location of expected coming PSs, as indicated in the Unareti developing plan.
Applsci 12 06008 g013
Figure 14. Example of siting two new PSs among several others already in place. New PSs are in red while existing ones are in purple.
Applsci 12 06008 g014
Figure 15. Example of weighted Voronoi diagram approach for PS location.
Applsci 12 06008 g015
Figure 16. Flowchart of the optimization approach.
Applsci 12 06008 g016
Figure 17. Example of computing the Fitness function.
Applsci 12 06008 g017
Figure 18. Current PS service areas.
Applsci 12 06008 g018
Figure 19. Output of the simulation results considering three new PSs. Blue points are the new PSs, while gray is the existing ones.
Applsci 12 06008 g019
Figure 20. PS service areas of three incremental PSs. The colors show the loading of the PS transformers.
Applsci 12 06008 g020
Figure 21. Best fitness through iterations and the global best fitness: three additional PSs.
Applsci 12 06008 g021
Figure 22. Output of the simulation results considering eight new PSs. Pink points are the new PSs, while gray are the existing ones.
Applsci 12 06008 g022
Figure 23. PSs service areas considering eight incremental PS. The colors report the power demand from the PS transformers’ nominal power.
Applsci 12 06008 g023
Figure 24. Best fitness through iterations and the global best fitness: eight additional PSs.
Applsci 12 06008 g024
Figure 25. Output of the simulation results considering eleven new PSs. Yellow points are the new PSs, while gray is the existing ones.
Applsci 12 06008 g025
Figure 26. PSs service areas considering eleven incremental PS. The colors report the power demand outside the PS transformers’ nominal power.
Applsci 12 06008 g026
Figure 27. Best fitness through iterations and the global best fitness: eleven new PSs.
Applsci 12 06008 g027
Figure 28. Left picture: the trend of the best fitness varying the number of PSs from 1 to 12; right picture: Trend of the global best fitness varying the number of PSs from 1 to 12.
Applsci 12 06008 g028
Figure 29. Trend of the best mean weighted distance in blue; regression curve in red.
Applsci 12 06008 g029
Figure 30. Trend of the fitness concerning the number of new PSs.
Applsci 12 06008 g030
Table 1. Matrix of new and current PSs location.
Particles i x i N e w   P S 1 t y i N e w   P S 1 t x i N e w   P S 2 t   y i N e w   P S 2 t   x C u r   P S 1 t   y C u r   P S 1 t   x C u r   P S 13 t   y C u r   P S 13 t  
11,511,3105,030,5331,504,7605,033,0381,512,5445,033,5151,505,5675,038,227
21,509,0445,033,2311,519,7525,038,845 Applsci 12 06008 i001
n1,514,1845,027,6231,512,0185,025,146
Table 2. Matrix of particle’s velocity, personal best, and global best.
Particles i x i N e w   P S 1 t v x i N e w   P S 1 t x p i b e s t N e w   P S 1 t y i N e w   P S 1 t   v y i N e w   P S 1 t   y p i b e s t N e w   P S 1 t   x i N e w   P S 2 t   v x i N e w   P S 2 t   x p i b e s t N e w   P S 2 t   y i N e w   P S 2 t   v y i N e w   P S 2 t   y p i b e s t N e w   P S 2 t  
11,511,310 5,030,533 1,504,760 5,033,038
21,509,044 5,033,231 1,519,752 5,038,845
n1,514,184 5,027,623 1,512,018 5,025,146
Best x b e s t N e w   P S 1 t Applsci 12 06008 i002 Applsci 12 06008 i002 y b e s t N e w   P S 1 t Applsci 12 06008 i002 Applsci 12 06008 i002 x b e s t N e w   P S 2 t Applsci 12 06008 i002 Applsci 12 06008 i002 y b e s t N e w   P S 2 t Applsci 12 06008 i002 Applsci 12 06008 i002
Table 3. Example of the PSs timing process.
1° Iteration2° Iteration3° Iteration4° Iteration
PS NameFitness
[km]
PS
Timing
Fitness
[km]
PS
Timing
Fitness
[km]
PS
Timing
Fitness
[km]
PS
Timing
PS11.6021.5831.503-3
PS21.8041.7041.6541.404
PS31.7531.562-2-2
PS41.501-1-1-1
Table 4. Timing, siting of the new three PSs, and best average weighted distance values.
PSs in
Construction Order
X
Coordinate
Y
Coordinate
Best Average Distance [km]Best Average Weighted Distance [km]Best Average Weighted Distance Variation [km]
AS-IS1.821.48 Applsci 12 06008 i001
11,513,0065,026,2232.111.351.54
21,513,9605,039,2461.44
31,512,5445,033,5051.35
Table 5. Timing, siting of the new eight PSs, and best average weighted distance values.
PSs in
Construction Order
X
Coordinate
Y
Coordinate
Best Average Distance [km]Best Average Weighted Distance [km]Best Average Weighted Distance Variation [km]
AS-IS1.821.48 Applsci 12 06008 i001
11,513,0075,026,2171.701.081.54
21,513,7545,039,1661.44
31,512,6195,033,3191.35
41,509,5075,032,7611.28
51,515,0135,034,5291.22
61,512,0115,037,2331.17
71,516,5435,040,5031.12
81,507,7165,035,4121.08
Table 6. Timing, siting of the new eleven PSs, and best average weighted distance values.
PSs in
Construction Order
X
Coordinate
Y
Coordinate
Best Average Distance [km]Best Average Weighted Distance [km]Best Average Weighted Distance Variation [km]
AS-IS1.821.48 Applsci 12 06008 i001
11,513,0105,026,2221.730.981.54
21,513,7525,039,1731.44
31,511,9505,032,4381.36
41,508,6345,033,4861.29
51,515,0445,034,7101.23
61,512,0065,037,2621.18
71,517,6985,037,6541.13
81,516,5435,040,5031.08
91,512,3005,034,664 1.05
101,517,8215,034,554 1.01
111,513,8525,033,367 0.98
Publisher’s Note: MDPI stays neutral with regard to jurisdictional claims in published maps and institutional affiliations.