Article

A New Method for Fatigue Evaluation of Titanium Alloy Welded Structures

1
College of Locomotive and Rolling Stock Engineering, Dalian Jiaotong University, Dalian 116028, China
2
National Engineering Technology and Research Center for System Integration of Railway Vehicles, CRRC Changchun Railway Vehicles Co., Ltd., Changchun 130062, China
*
Author to whom correspondence should be addressed.
Appl. Sci. 2022, 12(12), 5966; https://doi.org/10.3390/app12125966
Submission received: 29 May 2022 / Revised: 8 June 2022 / Accepted: 9 June 2022 / Published: 11 June 2022
(This article belongs to the Special Issue New Trends in Lifecycle Reliability Engineering)

Abstract

:
In this paper, a new fatigue life evaluation method, namely augmented-reverse notch equivalent stress method, is proposed for titanium alloy welded structures with stress singularities. First, a new three-parameter power function model is proposed in this paper, and the notch stress equivalent value method with correction factor is deduced. Combining the two, the theoretical framework of the augmented-reverse notch equivalent stress method is obtained. Within this framework, the fatigue test data of four titanium alloy welded joints with the same grade were used for analysis, and a new three-parameter power function model of titanium alloy welded structure was established. According to the calculation method of the notch equivalent stress correction factor, the correction factor suitable for the titanium alloy welded structure was obtained. Finally, the fatigue test data, different from the above titanium alloy welded structure, are used to verify the augmented-reverse notch equivalent stress method. The verification results show that the augmented-reverse notch equivalent stress method improves the effectiveness and accuracy of fatigue life evaluation and establishes a new life evaluation method for titanium alloy welded structures with stress singularities.

1. Introduction

Titanium alloy is favored by more and more people because of its high specific strength, low density, and many other excellent properties [1]. With the gradual maturity of titanium alloy welding technology, it is also widely used in the field of rail transit. The use of titanium alloy to make rail vehicle parts reduces the weight of the vehicle to a certain extent. It can achieve the purpose of saving energy, so this method has great potential [2,3,4]. However, when the titanium alloy welded structure is under load, stress concentration will occur at the structural abrupt change position of the weld, and fatigue cracks will be initiated, resulting in fatigue fracture [5,6,7,8,9]. One of the main reasons for fatigue failure of welded structures is the generation of stress concentration [10]. Therefore, it is very important to study the stress concentration phenomenon at the cross-section of the titanium alloy welded structure, and the important factors affecting the degree of stress concentration of titanium alloy welded structures are the type and size of the welded structure. Therefore, the selection of the type and size of the welded joints of the key stress parts needs to be carefully considered so that the titanium alloy welded joints can meet the static strength and fatigue strength requirements under the condition of a reasonable structure.
In recent years, many scholars have studied the fatigue phenomenon of metal welded structures with stress singularity. Heikki et al. [11] are based on the linear elastic fracture mechanics method, the average strain energy density method, and the microstructure sensitive strain method. The fatigue life prediction of welded joints with different geometric types and different plate thicknesses was carried out, respectively. The predicted results were compared with the test results, and it was found that the difference between the predicted life of the microstructure sensitive strain method and the test results was the smallest. Lillemäe et al. [12] conducted fatigue tests on 4 mm thick laser welded joints of different sizes. Based on the structural hot spot stress, they compared the test results of full-scale and small-scale specimens and found that the two slopes of the S-N curves of the samples were the same. Malitckii et al. [13] studied the crack propagation of stainless steel microstructure based on the digital image correlation method. Combined with the fatigue test data, it is demonstrated that the crack growth rate is correlated with the accumulated strain. Shiratsuchi et al. [14] conducted fatigue tests on different types of welded joints, found that the change of stress gradient at the weld toe was greatly affected by the radius of the weld toe, and proposed a fatigue life prediction method that is insensitive to the joint type. Yang et al. [15] measured the fatigue limit of titanium alloy welded joints of two materials, TC11 and TC17, by linear friction welding. It was found that with the increase in the amplitude and frequency of the applied vibration, the fatigue limit showed a trend of high first and then low, and the correction parameters for the determination of the fatigue limit were proposed. Dong et al. [16] applied the finite element method to calculate the nodal forces and bending moments and obtained the structural stress at the welding position based on the free-body section method. Fracture mechanics is used as the theoretical basis, and stress parameters related to fatigue life are incorporated. Not only the effect of load action mode and plate thickness on fatigue strength is considered, but also the effect of stress concentration on fatigue strength at the sudden change of position of the welded structure is studied. After synthesizing the above influencing factors, the calculation formula of equivalent structural stress ΔSs is derived. Ebrahimi et al. [17] analyzed the stress singularity inside the steel and the overall singular mode shape through the finite element analysis method. According to the analysis results, the stress field at the tip of the singular crack is further deduced. The proposed stress field model is validated by calculating the Von Mises stress of the model. Gao et al. [18] studied the notch stress existing in the direction of crack propagation at the weld position of steel welded structures. Based on the crack propagation principle, the singular stress function is determined. The calculation model of the equivalent value point xas is obtained through calculation and analysis, and the concept of singular strength as is proposed. A method for solving the fatigue life of welded structures with singular stress is found: the equivalent method of notch stress. In summary, it is found that there are relatively few studies on fatigue assessment of titanium alloy welded structures with singular stress, so it is of great significance to conduct in-depth research on them.
In order to study the fatigue behavior of titanium alloy welded structures with stress singularities in the field of rail transit, this paper proposes a new fatigue life prediction method that takes into account the influence factors of stress singularities, namely the augmented-reverse notch equivalent stress method. The method is based on the new three-parameter power function model and the notch stress equivalent value method with the introduction of a correction factor and is derived by combining the two. Next, combined with the fatigue test data of a limited number of titanium alloy welded structures, a new three-parameter power function model of the titanium alloy welded structure proposed in this paper is established. According to the calculation method of the notch equivalent stress correction factor proposed in this paper, the correction factor suitable for the titanium alloy welded structure is obtained. The fatigue life of the titanium alloy welded structure was predicted by combining the above two and compared with the test life. Finally, the proposed augmented-reverse notch equivalent stress method is verified using fatigue test data different from the above-mentioned titanium alloy welded structures.

2. The Principle of Notch Equivalent Stress and the Proposal of a New Method for Life Prediction

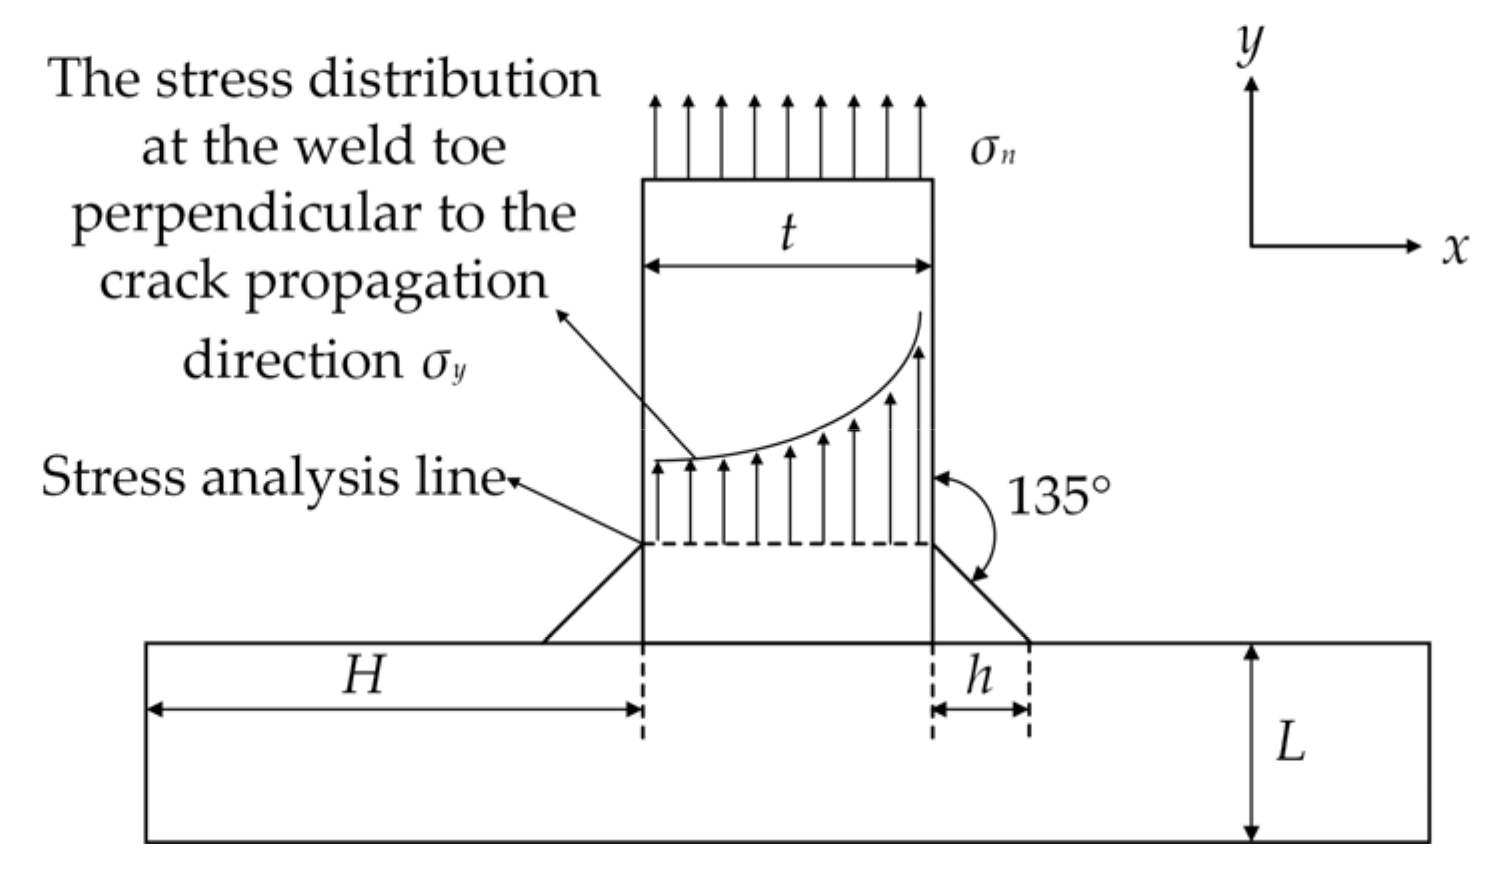
2.1. The Principle of Notch Equivalent Stress

According to different actual needs, different joint structures are required. Welded joints can be divided into Butt joint, Corner joint, Edge joint, Lap joint, and Tee joint. The transition forms of different joint welding positions have the most obvious impact on the stress concentration degree of the structure. When the welded structure bears the load, defects and cracks of different degrees will usually appear at the stress concentration position, so focus on the research, as shown in Figure 1.
According to the difference in the relative displacement between the upper and lower surfaces of the crack, the crack can be divided into three basic forms, which are mainly open cracks. In order to study the stress distribution near the open crack, Lazzarin and Tovo [20] obtained the stress distribution of the open crack at the weld toe perpendicular to the crack direction based on the linear elasticity theory, as shown in Equation (1).
σ y =   x λ 1 1 2 π K I ( 1 + λ 1 ) cos ( 1 λ 1 ) ϑ + χ 1 ( 1 λ 1 ) cos ( 1 + λ 1 ) ϑ / ( 1 + λ 1 ) + χ 1 ( 1 λ 1 )
where x is the distance from the weld; K I = σ n   ·   k 1   · t 1 λ 1 , k 1 = f (   h , t , L   ) , σ n is the loading stress level, and the magnitude is consistent with the nominal stress; t is the thickness of the loaded plate, L is the thickness of the non-loaded plate, and h is the size of the welding leg, as shown in Figure 2; ϑ is the angle from the corner bisector to the stress analysis line, λ 1 and χ 1 are the dimensionless parameters corresponding to different transition angles at the welding position, as shown in Table 1.
σ y = σ n 2 π   ·   1 x p   ·   C ( α , ϑ )   ·   f ( h , t , L ) 1 p   ·   t p
where C ( α , ϑ ) is only related to the shape and size of the structure, and C ( α , ϑ ) = ( 1 + λ 1 ) cos ( 1 λ 1 ) ϑ + χ 1 ( 1 λ 1 ) cos ( 1 + λ 1 ) ϑ ( 1 + λ 1 ) + χ 1 ( 1 λ 1 ) 1 p , p is only related to the angle of the structural welding transition position, and its magnitude is shown in Figure 3.
Paris and Sih [22] determined the exact solution of the stress distribution at the crack tip. When the transition angle of the welding position is close to 0, the corner is regarded as a crack. When the transition angle of the welding position is at other angles, according to the calculation formula of the stress distribution near the crack, the stress distribution near the weld can be obtained by analogy. Gao et al. [18], based on the exact solution of the stress distribution at the crack tip deduced by Paris and Sih [22], after generalization, taking the stress concentration factor into account, obtained a general form suitable for other angles, proposed the concept of “singular strength as”, and determined the notch equivalent stress function, as shown in Equation (3).
σ y = σ n   ·   ( a s + x ) 2 1 2 · p   ·   a s ( 1 p 1 )   ·   x q + x q p p q
where a s = C ( α , ϑ )   ·   f ( h , t , L ) 1 p   ·   t   ·   π 1 2 p , q = 3 p 0.5 .

2.2. Notch Stress Equivalent Value Method

Based on the theory of notch stress intensity factor, the notch stress equivalent value method defines “notch stress equivalent value point xas”. The singular stress at the weld toe is treated equivalently, and the linear regression is carried out using math CAD. The piecewise function Equation (4) of the notch stress equivalent value point xas is obtained.
x a s = A + B   ·   a s + C   ·   a s 2 + D   ·   a s 3 + E   ·   a s 4
where the units of xas and as are mm, and A, B, C, and D are the dimensionless parameters of the piecewise function, as shown in Table 2.
Literature [18] determined the singular strength as calculation Equation (5) when the transition angle of the welding position is 135°:
a s = g ( h , t , L ) = min t 6 ( H h ) 0.1 , 2 h + L 8
By Equations (4) and (5), the position of the notch stress equivalent value point xas and the magnitude of the singular strength as are obtained. Substituting into Equation (3), the notch equivalent stress at the weld toe can be calculated. Combined with the S-N fatigue life prediction model of the corresponding joint grade, the fatigue life prediction value can be obtained.

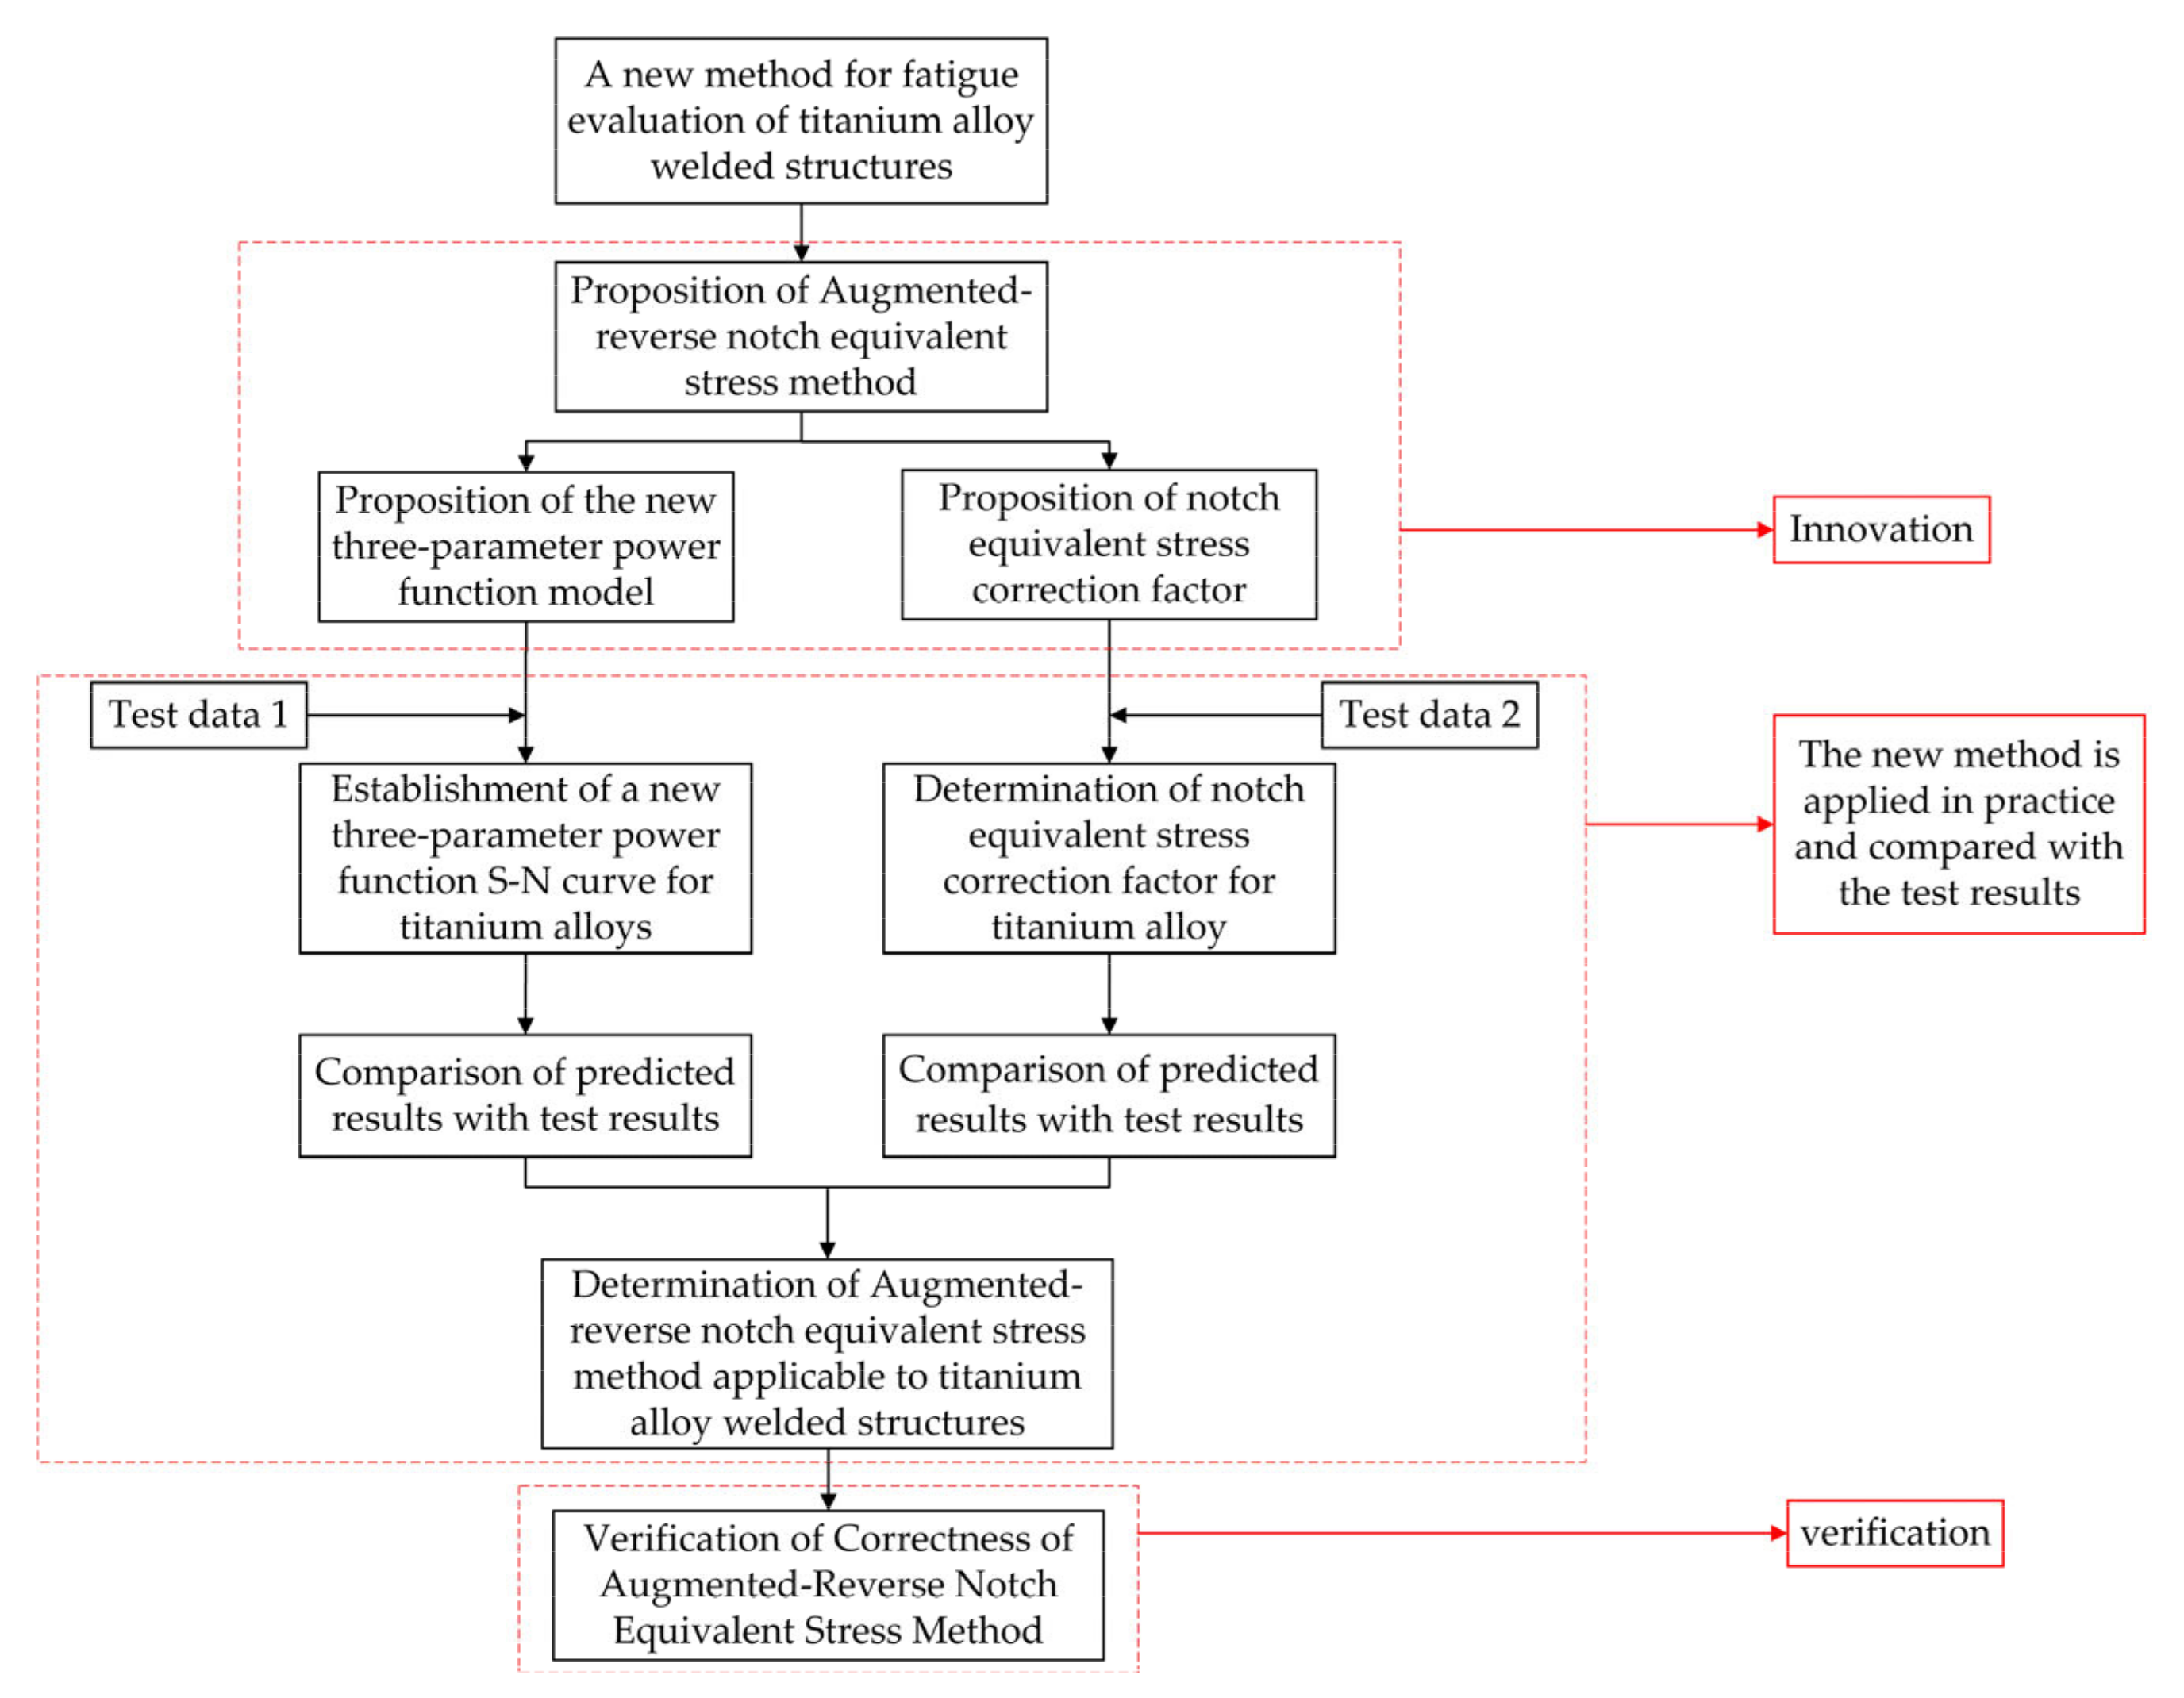
2.3. Proposition of Augmented-Reverse Notch Equivalent Stress Method

The augmented-reverse notch equivalent stress method includes a new three-parameter power function model and a notch stress equivalent value method with a correction factor. This method is a combination of the two. In the following, the proposed method of the new three-parameter power function model and the proposed method of the correction factor of the notch equivalent stress will be described.

2.3.1. The Method of Proposing the New Three-Parameter Power Function Model

The known expression of the existing three-parameter power function S-N curve is as follows:
S S f m N = C
where m and C are material parameters, Sf is the fatigue limit, S is the stress range, and N is the fatigue life.
When the traditional three-parameter power function S-N curve is used to evaluate the fatigue life of metal structures, although its accuracy is higher than that of the exponential, power function, Zheng formula, and other S-N curves, its fitting degree to the test data is not greatly improved. Therefore, on the basis of the existing three-parameter power function S-N curve, it is improved, and a new three-parameter power function S-N curve is proposed. The proposed process of the new three-parameter power function S-N curve is as follows:
(1)
The fatigue test is carried out on n welded joints loaded with the same stress level, and the n groups of test life under the stress level are obtained as (N11, …N1i, …, N1n);
(2)
Perform random sampling (m · k) times on the above n fatigue test data (m and k are both positive integers), and divide the sample data after sampling into m groups, with k in each group;
(3)
Calculate the corresponding mean value of each group of data. The calculation formula of the life mean value of group j is as follows (1 ≤ jm):
N j ¯ = i = 1 k N j i k
After m times of calculation, m mean values can be obtained: N 1 ¯ , …, N j ¯ , …, N m ¯ .
(4)
Count the m mean values obtained in step (3) and determine the distribution law. If it is a normal distribution, the fatigue life N under the stress level in the new three-parameter power function S-N curve is the normal distribution mean value. If it is a skewed distribution, the fatigue life N under the stress level in the new three-parameter power function S-N curve is the median value of the skewed distribution;
(5)
Repeat steps (1~4) to determine the fatigue life N ¯ under other stress levels in the new three-parameter power function S-N curve, then the new three-parameter power function S-N curve calculation model is as follows:
S S f m N ¯ = C

2.3.2. The Proposed Method of the Notch Equivalent Stress Correction Factor

(1)
Perform fatigue test on n groups of welded joints, and obtain n groups of test data as (S1, N1), …, (Si, Ni), …, (Sn, Nn);
(2)
According to the methods described in Section 2.1 and Section 2.2, calculate the notch equivalent stress at each stress amplitude Si at the weld position of the welded structure: (σy1, …, σyi, …, σyn);
(3)
Calculate the notch equivalent stress correction factor fas, the formula is as follows:
N = C σ a s m = C ( f a s   ·   σ y ) m
where σ a s is the corrected notch equivalent stress, σ y is the notch equivalent stress, and fas is a correction factor introduced to take into account the influence of material properties and welding performance on fatigue strength, m and C are material parameters.
Substitute the n fatigue lives in step (1) and the n notch equivalent stresses in step (2) into Equation (9) to obtain the n notch equivalent stress correction factors: fas1, …, fasi, …, fasn;
(4)
Take the mean value of the obtained n notch equivalent stress correction factors, as shown in Equation (10):
f a s ¯ = i = 1 i = n f a s i n
The calculation formula of the correction notch equivalent stress σ a s can be obtained as follows:
σ a s = f a s ¯   ·   σ n   ·   ( a s + x a s ) 2 1 2 · p   ·   a ( 1 p 1 )   ·   x a s q + x a s q p p q
After the correction notch equivalent stress σ a s is calculated, the fatigue life predicted by the augmented-reverse notch equivalent stress method can be obtained by substituting into Equation (8). The ideological roadmap of this research is shown in Figure 4.

3. Establishment of a New Three-Parameter Power Function S-N Curve for Titanium Alloy Welded Structures

3.1. Selection of Test Specimens and Determination of Fatigue Life

According to the classification criteria for steel welded joints in the BS7608 standard, the cross joints, T-joints, and lap joints shown in Figure 5 are classified into one joint class. That is, these types of steel welded joints use an S-N curve in the BS7608 standard to predict fatigue life. Using this analogy, it can be considered that an S-N curve can be used for fatigue life prediction of cross joints, T joints, and lap joints of titanium alloys.
Literature [25,26,27] used 45 titanium alloy welded joints to make fatigue test specimens and applied 15 different loads. In order to reduce the error, three fatigue specimens were used for the test under each load. In order to make the obtained S-N curve more convincing, the fatigue samples were divided into 15 groups, including 10 groups of cross joints, 4 groups of lap joints, and 1 group of T-joints. The geometrical dimensions of the four types of joints are shown in Figure 6.
In order to make the titanium alloy S-N curve fitted by the test data more representative of this grade, different loading frequencies (f) and stress ratios (R) are used for different joint types, and the specific loading methods are consistent with the literature [25,26,27], as shown in Table 3, and the loading position and loading direction are shown in Figure 6.
Through the fatigue test, the fatigue life of the sample under different stress ranges at the weld position is obtained, as shown in Table 4.

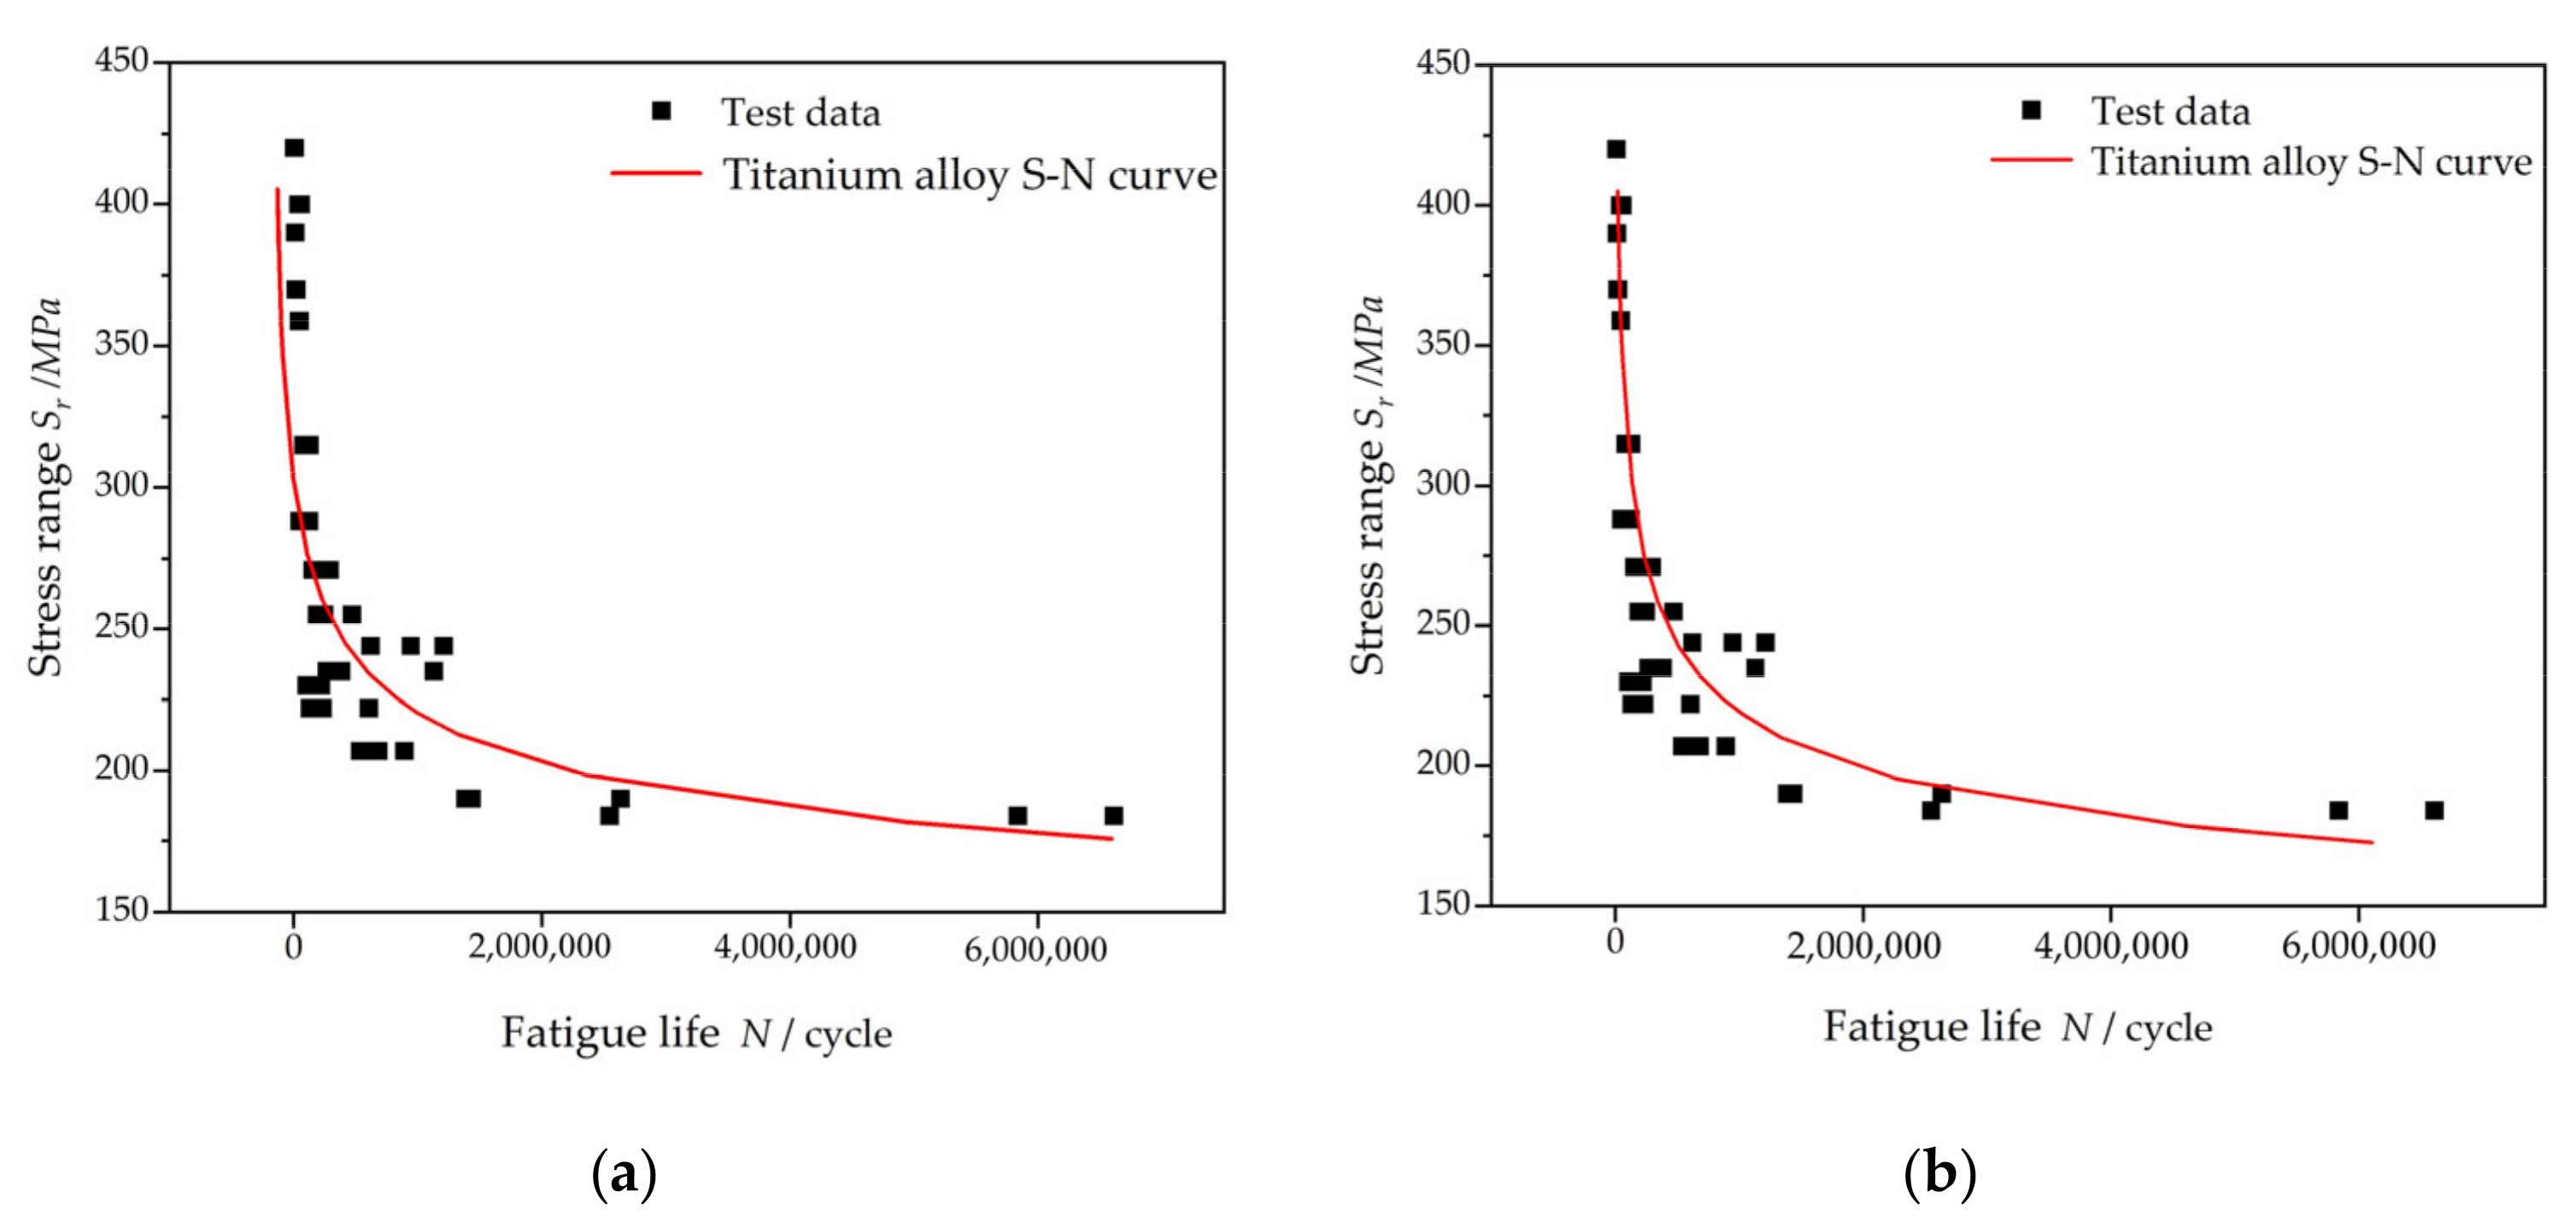
3.2. A New Three-Parameter Power Function S-N Curve

Two prediction models, the traditional three-parameter power function S-N curve and the new three-parameter power function S-N curve, are selected to quantitatively characterize the relationship between the stress range and fatigue life of the above titanium alloy welded structure, and the two fitting results are compared and analyzed.
The S-N curve models of the above two quantitative characterizations were obtained by fitting, and the fitted curves are shown in Figure 7. According to Figure 7a, it can be seen that the fatigue limit parameter is less than 200 MPa, and with the increase in the stress range, the change rate of the fatigue life also changes from fast to slow. According to Figure 7b, the S-N curve of titanium alloy welded structures fitted by the new three-parameter power function model is closer to the test data and can better characterize the distribution of test data. When the fatigue limit parameter is less than about 210 MPa, the change in fatigue life rate begins to appear at an inflection point. It should be noted that the above S-N curve is applicable to titanium alloy cross joint structure, T-joint structure, lap joint structure, and other similar structures and cannot be used to predict other titanium alloy structures or other material structures with large structural differences.

3.3. Comparison of Goodness of Fit between Traditional and New Three-Parameter Power Function Models

The test data of titanium alloy welded structures were fitted by two methods, the traditional three-parameter power function S-N curve and the new three-parameter power function S-N curve. It can be seen that the fatigue limit parameter obtained by the new three-parameter power function method is relatively large. Through calculation and analysis, the coefficient of determination R2 of the two methods to measure the goodness of the fitting curve can be obtained. Comparing the size of R2, the applicability of the two S-N curve-fitting models to the titanium alloy welded structures can be obtained. The coefficient of determination R2 of the two fitting models is shown in Table 5.
From Table 5, it can be seen that the new three-parameter power function model proposed in this study significantly improves the fitting degree of the experimental data of titanium alloys. It shows that the new three-parameter power function model improves the relatively low goodness of fit of the traditional three-parameter power function model and lays a foundation for the further combination with the correction notch equivalent stress method.

4. Proposition of Notch Equivalent Stress Correction Factor of Titanium Alloy Welded Structures
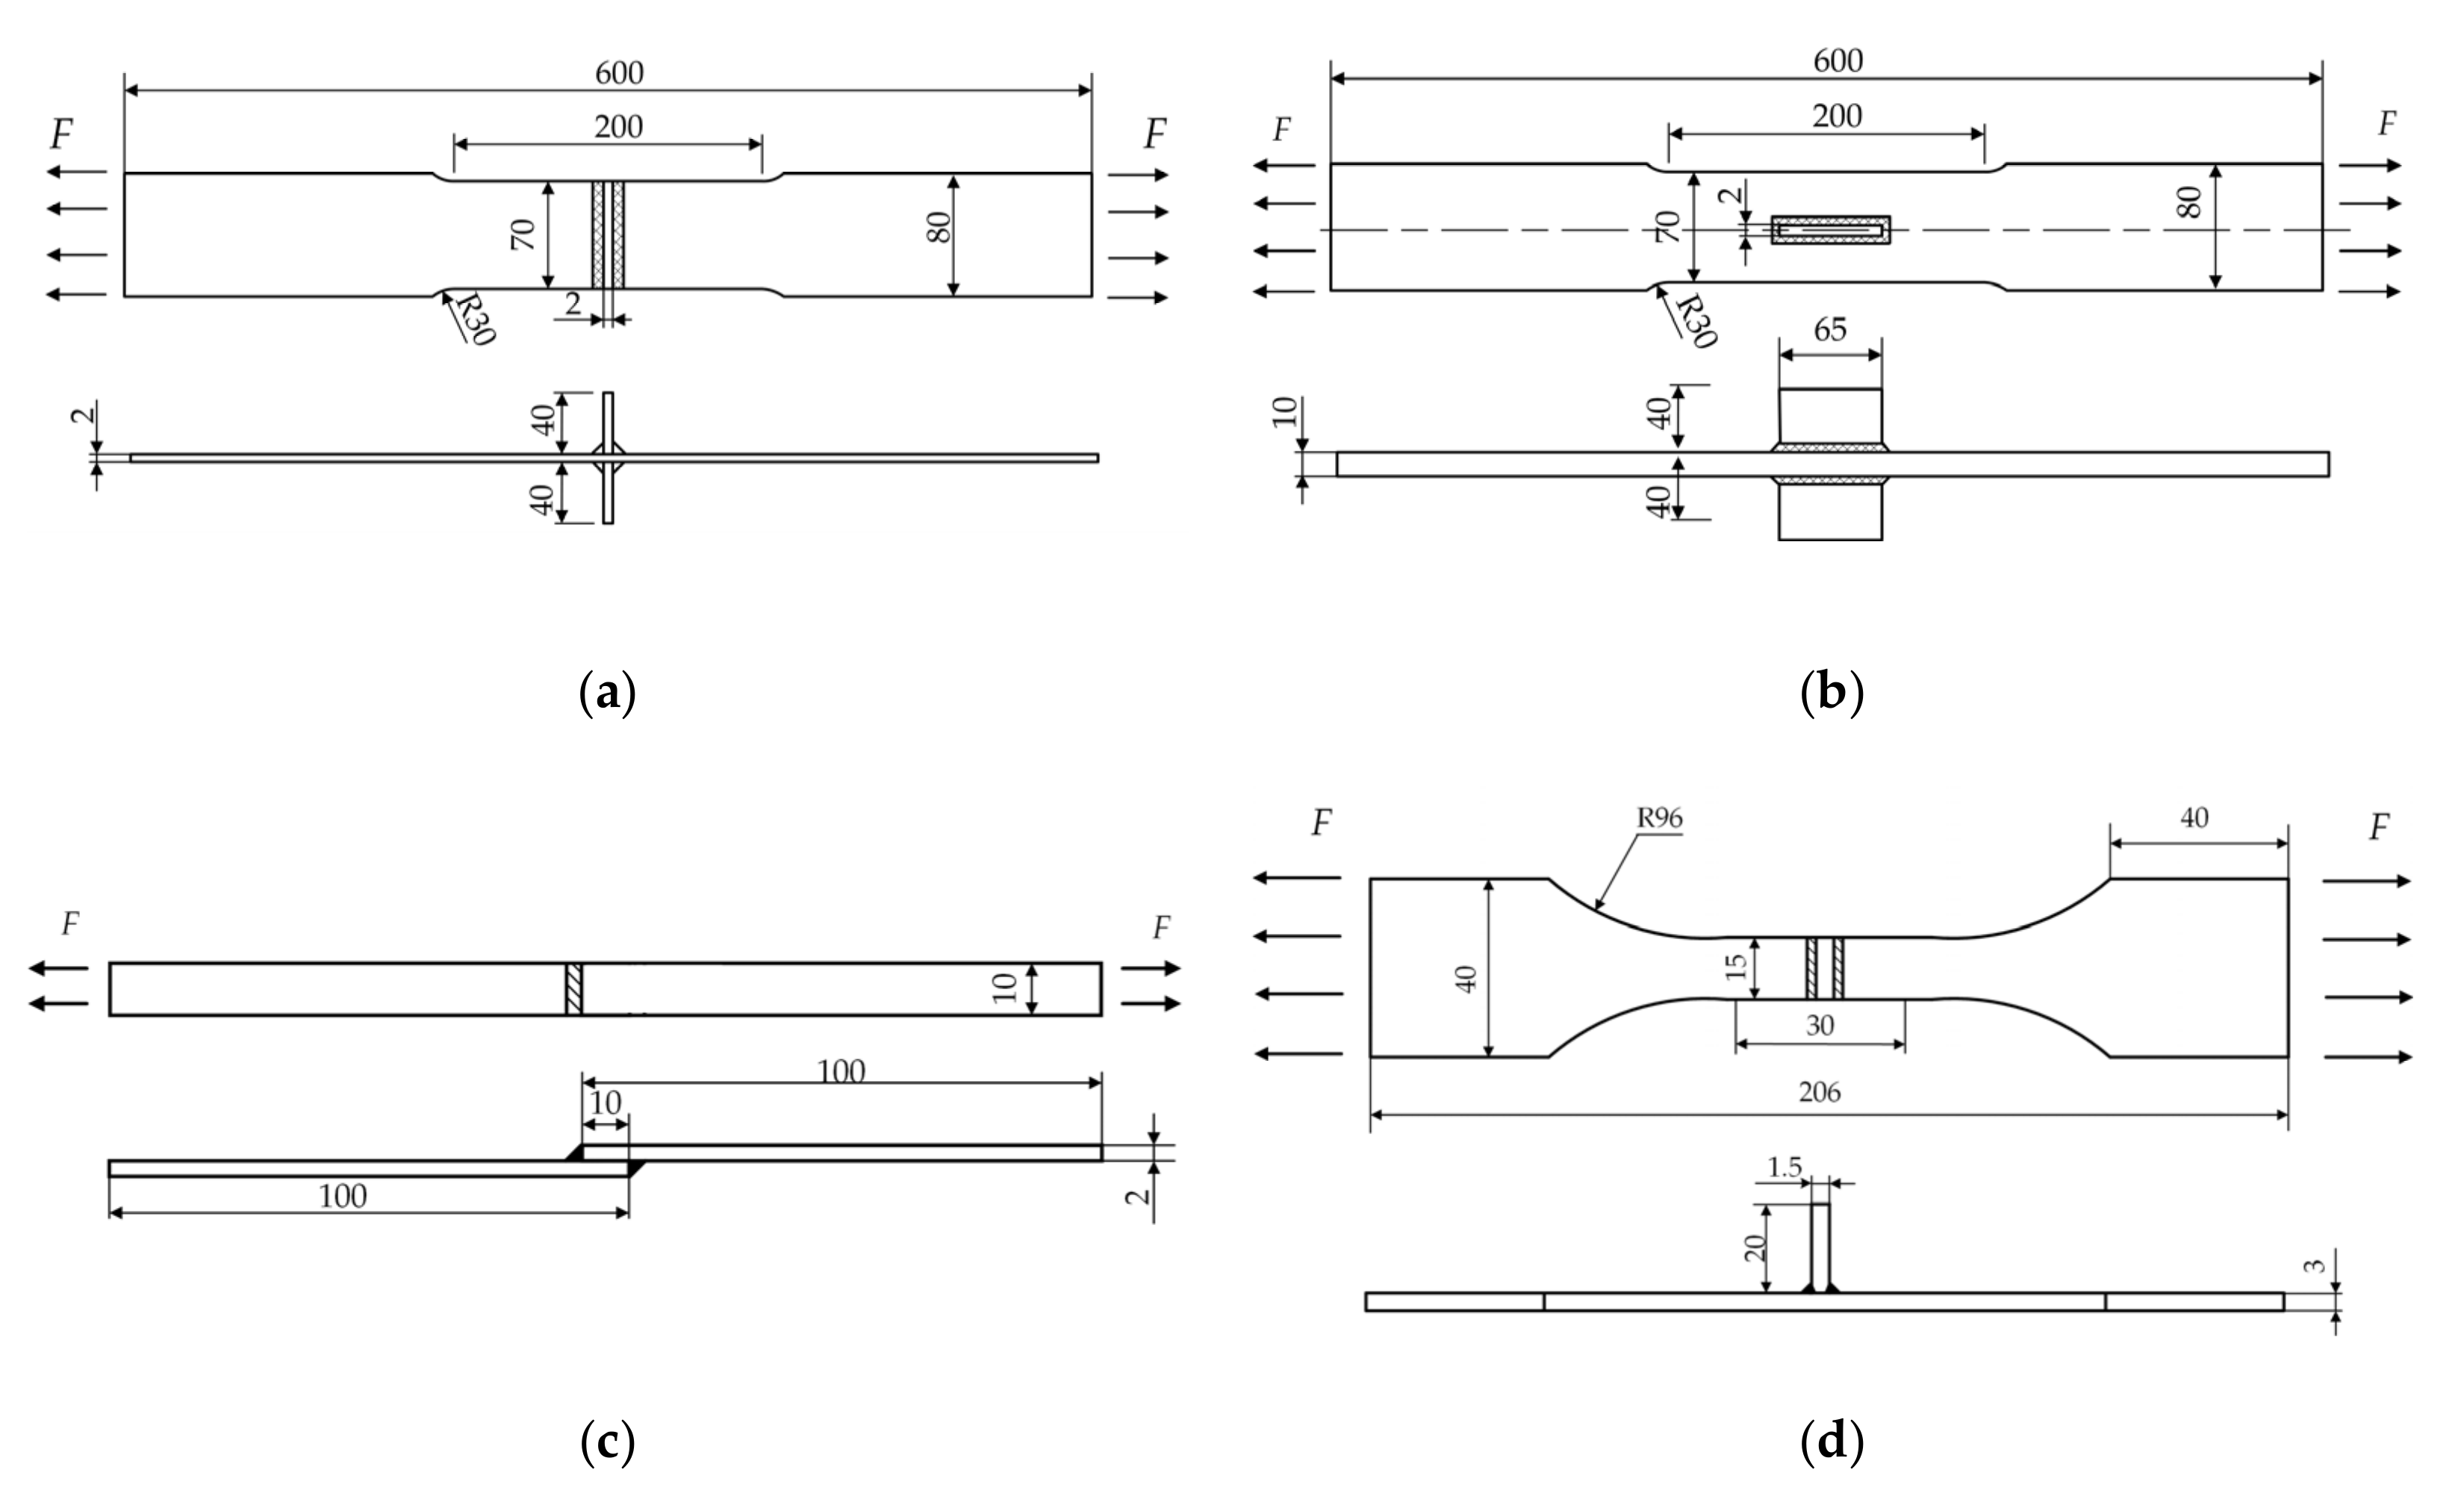
4.1. Fatigue Test

The titanium alloy welded joint suitable for the new three-parameter power function model shown in Figure 7b was selected, and the fatigue test was carried out in the literature [27]. Its material is JIS Grade 2 commercial titanium plate, and its geometry is shown in Figure 6b. The specific loading method is consistent with the literature [27], which is a pulsating cycle with a frequency of 5 Hz. The loading position and loading direction are shown in Figure 6b. The fatigue life obtained through 19 sets of fatigue tensile tests is shown in Table 6. It should be noted that the test data in Table 6 and those shown in Table 4 are from different fatigue tests.

4.2. Determination of Notch Equivalent Stress and Prediction of Fatigue Life

It can be seen from Figure 6b that the thickness t of the loaded plate of the titanium alloy welded joint is 10 mm, the height H of the non-loaded plate is 40 mm, the thickness L of the non-loaded plate is 2 mm, and the size h of the welding leg is 2 mm. Through the process described in Section 2.1 and Section 2.2 of this study, the notch equivalent stress at the weld position at each stress level can be calculated. Combined with the new three-parameter power function S-N curve model fitted in Figure 7b, the fatigue life predicted by the notch stress equivalent value method can be obtained. The calculated notch equivalent stress and predicted fatigue life are shown in Table 7. The average error between the test life in Table 6 and the predicted life in Table 7 is 9.01%.

4.3. Correction of the Calculation Formula of the Notch Equivalent Stress

In order to make the fatigue life predicted by the notch stress equivalent value method closer to the real situation, combined with the above fatigue test results, the correction notch equivalent stress σ a s is introduced, and its calculation formula is as follows:
σ a s = f a s   ·   σ y
In order to ensure the accuracy of the fitting curve, the new three-parameter S-N curve is combined with the notch equivalent stress. Through the method of proposing the correction factor described in Section 2.3.2 of this study, the notch equivalent stress of titanium alloy welded joints under different stress ranges and the test life determined by the new three-parameter power function model are substituted into Equation (9). A total of 19 groups of notch equivalent stress correction factors can be obtained, as shown in Table 8.
The average value f a s ¯ is calculated by Equation (10) to be 0.85105. Finally, the calculation formula for the correction notch equivalent stress for commonly used titanium alloy welded joints is obtained as Equation (13).
σ a s =   0 . 85105   ·   σ n   ·   ( a s + x a s ) 2 1 2 · p   ·   a ( 1 p 1 )   ·   x a s q + x a s q p p q

4.4. The Test Results Are Compared with the Two Prediction Results before and after the Notch Equivalent Stress Correction

The fatigue life of the fatigue specimens under each stress range in Table 6 was evaluated by the correction notch stress equivalent value method. They were then compared and analyzed with the fatigue life predicted before correction using the notch stress equivalent value method in Table 7 and the test life in Table 6, as shown in Figure 8.
As can be seen in Figure 8, the titanium alloy has excellent material properties and relatively good welding performance, and the establishment of the S-N curve refers to the British BS7608 standard. Therefore, under the same stress range, the fatigue life of titanium alloy welded joints predicted by the notch stress equivalent value method is smaller than the test life. The notch stress equivalent value method of correction is based on the test data. Therefore, the fatigue life of the titanium alloy welded structure predicted by the notch stress equivalent value method of correction is closer to the actual life, which improves the accuracy of life evaluation.

5. Verification of Augmented-Reverse Notch Equivalent Stress Method

Based on the new three-parameter power function model of titanium alloy welded structures, the notch stress equivalent value method is modified using the proposed correction factor calculation method. In order to verify the effectiveness and accuracy of this method, the fatigue test data of two welded joints of different sizes are used. The augmented reverse notch equivalent stress method is verified. It should be noted that this fatigue test is a new fatigue test different from the above test.
(1)
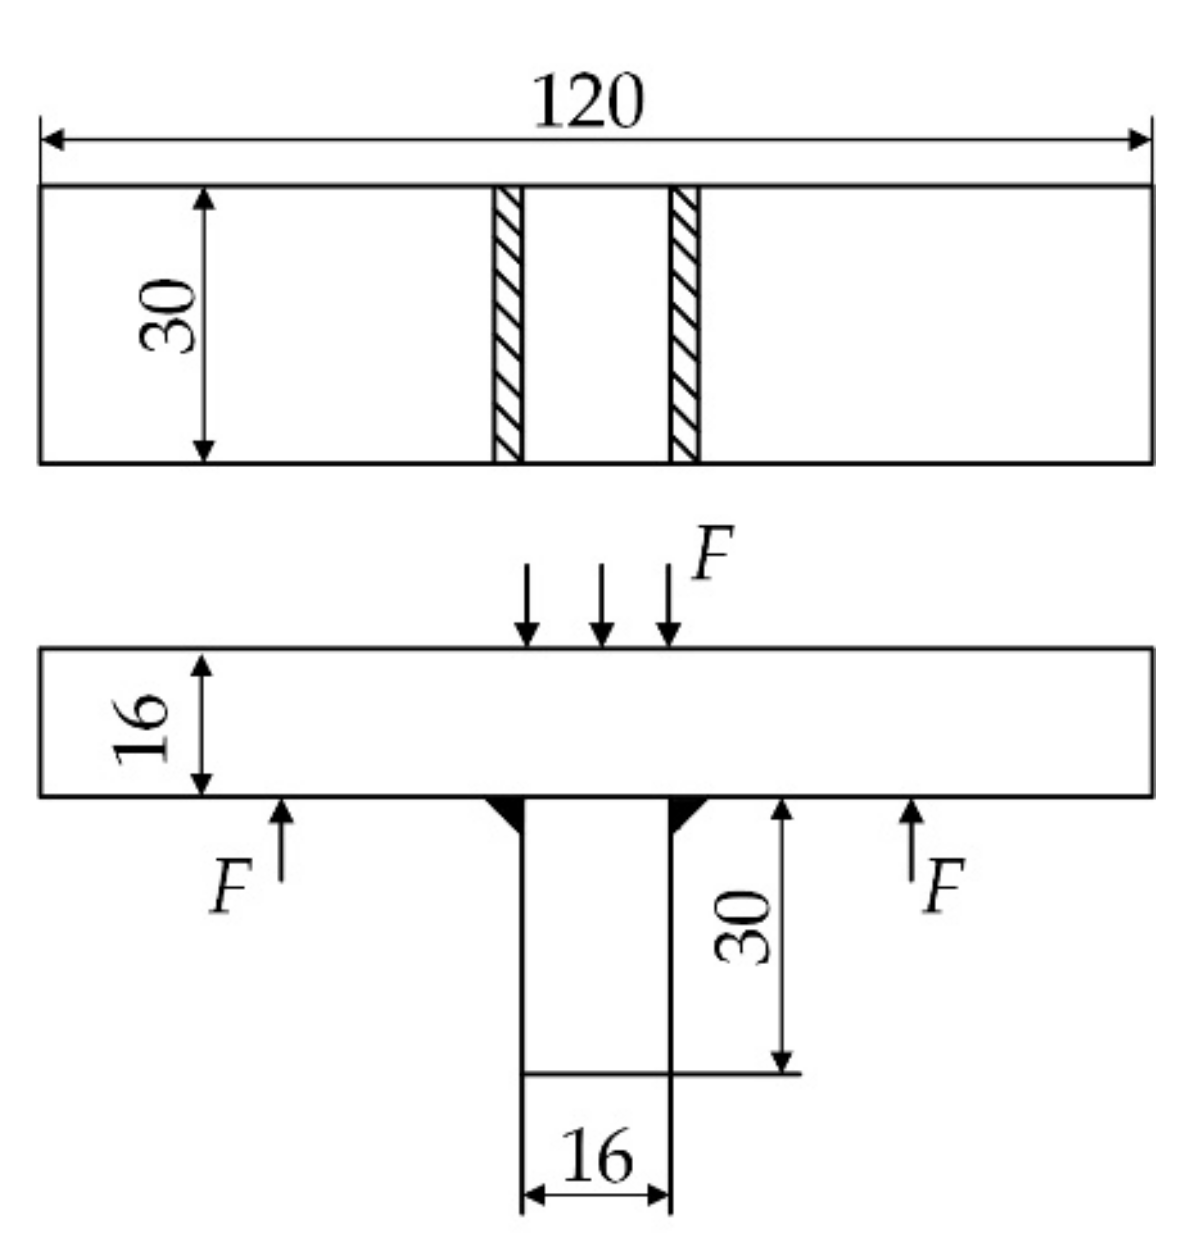
The existing T-joint is shown in Figure 9, and its material is TA5 titanium alloy. The same loading and restraint methods as those in literature [28] are adopted, and the loading position and loading direction are shown in Figure 9. Literature [28] analyzed the effect of MIG welding on the residual stress and fatigue performance of the T-joint at the weld toe. Combined with the analysis results obtained from the fatigue test, the correctness of the augmented-reverse notch equivalent stress method is verified.
It can be seen from Figure 9 that the height H of the non-loaded plate is 30 mm, the thickness L of the non-loaded plate is 16 mm, the size h of the welding leg is 6 mm, and the thickness t of the loaded plate is 16 mm. The fatigue life calculated by the augmented-reverse notch equivalent stress method and the test life under the same load and constraint conditions are shown in Figure 10, and the maximum error is only 9.51%.
(2)
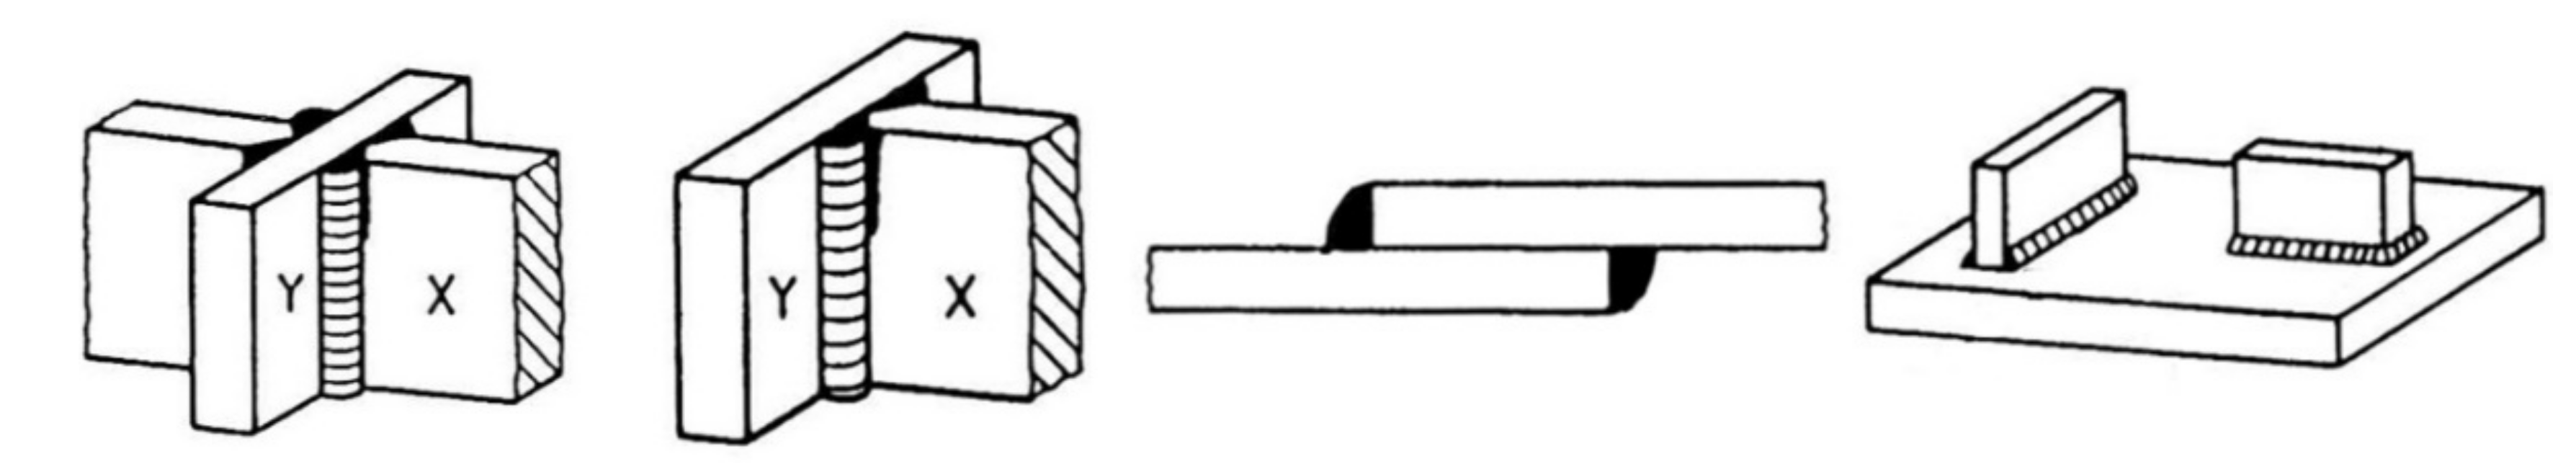
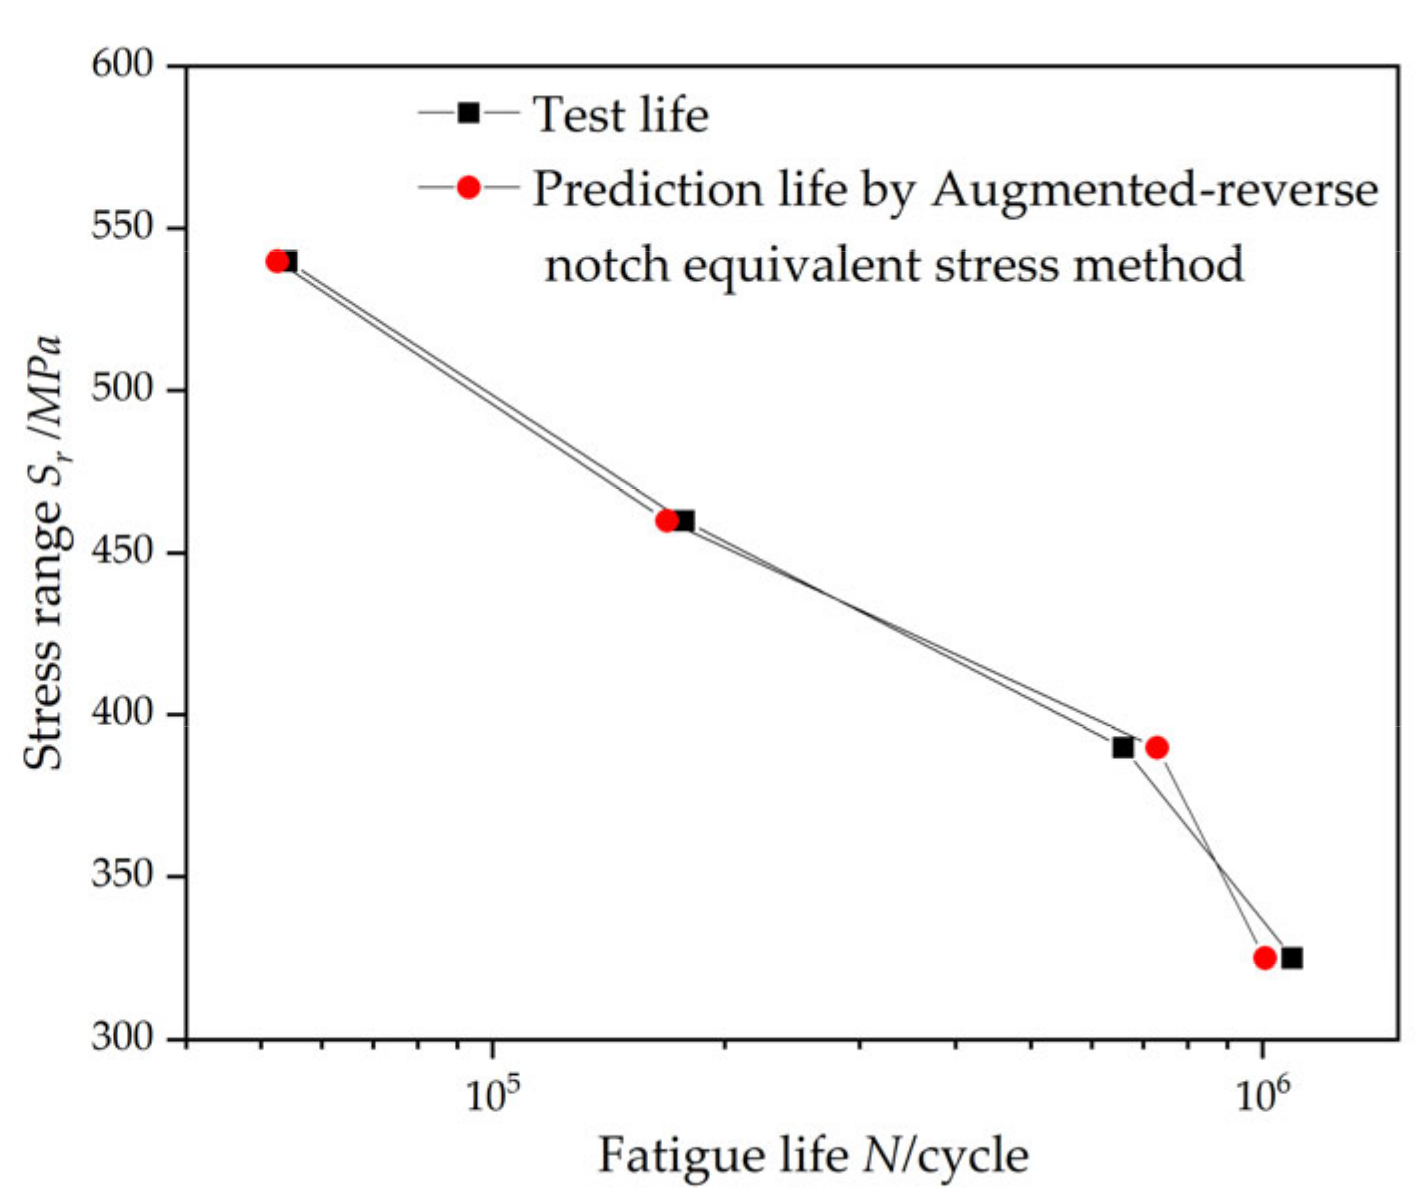
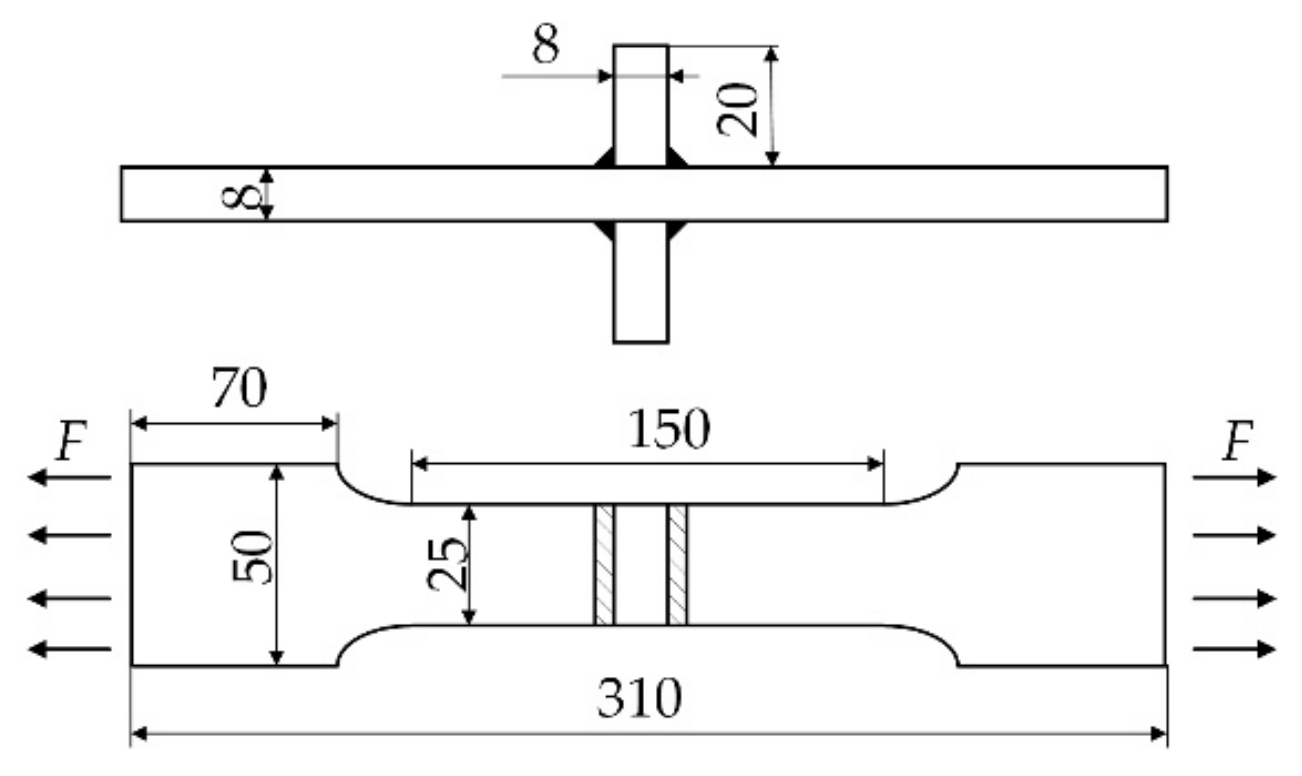
The existing cross joint is shown in Figure 11, and its material is TC4 titanium alloy, using the same loading and constraining methods as in the literature [29,30]. The loading position and loading direction are shown in Figure 11. Combined with the data obtained from the fatigue test, the correctness of the augmented-reverse notch equivalent stress method is verified.
It can be seen from Figure 11 that the height H of the non-loaded plate is 20 mm, the thickness L of the non-loaded plate is 8 mm, the size h of the welding leg is 4 mm, and the thickness t of the loaded plate is 8 mm. The fatigue life calculated by the augmented-reverse notch equivalent stress method and the test life under the same load and constraint conditions are shown in Figure 12, and the maximum error that can be obtained is only 10.91%.
It can be clearly seen from the above two verification examples that the fatigue life predicted by the augmented-reverse notch equivalent stress method is basically the same as the real test life, which strongly verifies the effectiveness and accuracy of the new method. However, due to the existence of uncontrollable factors such as internal micro-defects of the specimen, there may be a big difference between the test life and the fatigue life predicted by the augmented-reverse notch equivalent stress method.

6. Conclusions

(1)
At present, most of the existing fatigue studies of titanium alloys are based on the S-N curve, and there are very few studies on the fatigue properties of titanium alloy welded structures with stress singularities. This study proposes a new fatigue life prediction method that takes stress singularities into account, namely the augmented-reverse notch equivalent stress method. A new three-parameter power function model and a calculation method of the notch equivalent stress correction coefficient are proposed. The augmented-reverse notch equivalent stress method is obtained by combining the above two.
(2)
Through the research on the classification of joint grades in the BS7608 standard, the welded joint structure with the same joint grade is found, and the classification of titanium alloy welded joints is compared with this. Combined with the fatigue test data of titanium alloy welded joints, the fatigue life under each stress range was determined. A new three-parameter power function model of titanium alloy welded structure proposed in this study was established. According to the calculation method of the notch equivalent stress correction factor proposed in this study, the correction factor suitable for the titanium alloy welded structure is obtained. Two prediction models, the traditional three-parameter power function model and the new three-parameter power function model, were selected to quantitatively characterize the relationship between the stress range and fatigue life of titanium alloy welded structures, and the two fitting results were compared and analyzed.
(3)
The augmented-reverse notch equivalent stress method was verified using fatigue test data different from the above titanium alloy welded structures. The verification results show that the augmented-reverse notch equivalent stress method improves the effectiveness and accuracy of fatigue life evaluation and finds a new life evaluation method for titanium alloy welded structures with stress singularities.
In this study, a new method for fatigue life evaluation of titanium alloy welded structures with stress singularities, namely the augmented-reverse notch equivalent stress method, is proposed. The limitation of this paper is that the fatigue test data of titanium alloy welded structures are limited. If the fatigue test data are added, the results will be more accurate and convincing. The new method proposed in this paper is suitable for materials other than titanium alloys and can be used as a new direction for fatigue life prediction research of other materials.

Author Contributions

Writing—original draft preparation, software, and methodology, Z.Z.; validation, Y.W.; data curation, C.Y.; formal analysis, Q.D. All authors have read and agreed to the published version of the manuscript.

Funding

This research was funded by the National Railway Group Science and Technology Research and Development Plan Project (Project No. K2021J006) and the National High-speed Train Technology Innovation Center Research and Development Project (Project No. CXKY-02-01-03(2020)).

Institutional Review Board Statement

Not applicable.

Informed Consent Statement

Not applicable.

Data Availability Statement

The data that support the plots within this paper and other findings of this study are available from the corresponding author on request.

Conflicts of Interest

The authors declare no conflict of interest.

References

  1. Guo, L.; He, W.X.; Zhou, P.; Liu, B. Research status and development prospect of titanium and titanium alloy products in China. Hot Work. Technol. 2020, 22, 22–28. [Google Scholar]
  2. Zafar, T.; Zhang, Y.W.; Wang, Z.L. An efficient kriging based method for time-dependent reliability based robust design optimization via evolutionary algorithm. Comput. Methods Appl. Mech. Eng. 2020, 372, 113386. [Google Scholar] [CrossRef]
  3. Zhi, P.P.; Li, Y.H.; Chen, B.Z.; Shi, S. Bounds-based structure reliability analysis of bogie frame under variable load cases. Eng. Fail. Anal. 2020, 114, 104541. [Google Scholar] [CrossRef]
  4. Zhao, D.Y.; Yu, S.; Wang, Z.L.; Wu, J. A box moments approach for the time-variant hybrid reliability assessment. Struct. Multidiscip. Optim. 2021, 64, 4045–4063. [Google Scholar] [CrossRef]
  5. Zhi, P.P.; Li, Y.H.; Chen, B.Z.; Bai, X.N.; Sheng, Z.Q. Fuzzy design optimization-based fatigue reliability analysis of welding robots. IEEE Access 2020, 8, 64906–64917. [Google Scholar] [CrossRef]
  6. Jing, L.; Liu, K. Review on wheel-rail dynamic responses caused by wheel tread defects. J. Traffic Transp. Eng. 2021, 21, 285–315. [Google Scholar]
  7. Wang, P.; Pei, X.J.; Qian, H.L.; Dong, P.S. Unique fatigue design method of welded structures and application. J. Mech. Eng. 2021, 57, 349–360. [Google Scholar]
  8. Zhi, P.P.; Wang, Z.L.; Chen, B.Z.; Sheng, Z.Q. Time-variant reliability-based multi-objective fuzzy design optimization for anti-roll torsion bar of EMU. CMES-Comput. Modeling Eng. Sci. 2022, 131, 1001–1022. [Google Scholar] [CrossRef]
  9. Wang, A.B.; Gao, X.G.; Xiao, J.H. Study and optimization of mechanism of high frequency fatigue fracture of rail clip. J. China Railw. Soc. 2021, 43, 93–99. [Google Scholar]
  10. Xue, Q.W.; Wang, J. Fuzzy proportional boundary element method for solving uncertain force/thermal singularity problems. J. Basic Sci. Eng. 2021, 29, 889–900. [Google Scholar]
  11. Heikki, R.; Pasquale, G.; Jasmin, J.; Jani, R.; Pauli, L. Fatigue strength modelling of high-performing welded joints. Int. J. Fatigue 2020, 135, 105555. [Google Scholar]
  12. Lillemäe, I.; Liinalampi, S.; Remes, H.; Antti, I.; Ari, N. Fatigue strength of thin laser-hybrid welded full-scale deck structure. Int. J. Fatigue 2016, 95, 282–292. [Google Scholar] [CrossRef]
  13. Malitckii, E.; Remes, H.; Lehto, P.; Yagodzinskyy, Y.; Bossuyt, S.; Hänninen, H. Strain accumulation during microstructurally small fatigue crack propagation in bcc Fe-Cr ferritic stainless steel. Acta Mater. 2018, 144, 51–59. [Google Scholar] [CrossRef]
  14. Shiratsuchi, T.; Osawa, N. Investigation of thickness and bead profile effects on fatigue strength of welded joints based on relative stress gradient. Int. J. Fatigue 2020, 134, 105520. [Google Scholar] [CrossRef]
  15. Yang, J.; Li, J.L.; Xiong, J.T.; Liao, J.H.; Jin, F. Effect of welding parameters on microstructure characteristics and fatigue properties of dissimilar joints prepared by linear friction welding on TC11 and TC17 titanium alloys. Weld. World 2020, 64, 683–695. [Google Scholar] [CrossRef]
  16. Zhao, F.; Li, A.Q.; Li, W.R.; Li, W.R.; Shen, S.; Song, G.B.; Wang, C.J.; Wang, B. Wind-Induced fatigue analysis of high-rise steel structures using equivalent structural stress method. Appl. Sci. 2017, 7, 71–75. [Google Scholar]
  17. Ebrahimi, S.H. Residual stress effects on crack-tip stress singularity in XFEM fracture analysis. Eur. J. Mech.-A/Solids 2021, 86, 104191. [Google Scholar] [CrossRef]
  18. Gao, S.; Xu, L.; Wang, D.Z.; Nigel, B. Research of stress assessment for the 135-degree sheet corner based on singularity strength theory. J. Wuhan Univ. Technol. 2013, 35, 72–79. [Google Scholar]
  19. Cai, H.; Li, W.Z.; Wang, Z.F.; Yao, D.D.; Liu, C. Welding technology of titanium alloy high speed rail bogie frame. Electr. Weld. Mach. 2020, 50, 52–56. [Google Scholar]
  20. Lazzarin, P.; Tovo, R. Notch stress intensity factor approach to the stress analysis of welds. Fatigue Fract. Eng. Mater. Struct. 1998, 21, 1089–1103. [Google Scholar] [CrossRef]
  21. Williams, M.L. Stress singularities resulting from various boundary conditions in angular corners of plates in extension. J. Appl. Mech. 1952, 19, 526–528. [Google Scholar] [CrossRef]
  22. Sih, G.C.; Paris, P.C.; Erdogan, F. Crack-tip, stress-intensity factors for plane extension and plate bending problems. J. Appl. Mech. 1962, 29, 306–312. [Google Scholar] [CrossRef]
  23. Gao, S.; Xu, L.; Nigel, B.; Wang, D.Z. Fatigue characteristics assessment method based on singularity strength theory. Chin. J. Ship Res. 2014, 9, 60–68. [Google Scholar]
  24. BS7608-2014; Fatigue Design and Assessment of Steel Structures. British Standard Institute: London, UK, 2014.
  25. Hui, L.; Lu, J.C.; Zhou, S.; An, J.L.; Zhou, G.Y.; Liu, X.P. Effect of heat treatment on fatigue properties of TC4 titanium alloy by laser double beam welded joint. J. Jilin Univ. Eng. Technol. Ed. 2021, 10, 589. [Google Scholar] [CrossRef]
  26. Zhao, W.L.; Liu, X.G.; Xie, P.Y.; Guo, H.D. Study on shear fatigue performance of TC4 titanium alloy diffusion bonded joints. Aeroengine 2020, 46, 99–102. [Google Scholar]
  27. Iwata, T.; Matsuoka, K. Fatigue strength of CP grade 2 titanium fillet welded joint for ship structure. Weld. World 2004, 48, 40–47. [Google Scholar] [CrossRef]
  28. Li, R.W.; Sun, P.P.; Li, P.; Yang, Q.Y.; Zhang, Y.H.; Li, Y.Z. Influence of weld toe by TIG dressing on the fatigue behavior of T-joint of titanium alloy. Dev. Appl. Mater. 2017, 32, 41–46. [Google Scholar]
  29. Zhao, X.H.; Wang, D.P.; Wang, X.B.; Deng, C.Y.; Zu, Z.Q. Improvement of fatigue performance of TC4 Ti-alloy welded joints by loading ultrasonic peening. Trans. China Weld. Inst. 2010, 31, 57–60. [Google Scholar]
  30. Yang, Y.T.; Zhang, Y.Y.; Yu, W. Property of titanium alloy welded joints treated with ultrasonic peening. Dev. Appl. Mater. 2007, 28–32. [Google Scholar] [CrossRef]
Figure 1. Critical locations with stress singularities [19]. (a) Titanium alloy bogie frame structure. (b) Titanium alloy bogie side member structure.
Applsci 12 05966 g001
Figure 2. Structure edges analyzed.
Applsci 12 05966 g002
Figure 3. Corresponding p values of different transition angles at welding positions [18].
Applsci 12 05966 g003
Figure 4. Ideological roadmap of this study.
Applsci 12 05966 g004
Figure 5. Four joints of the same grade in BS7608 standard [24].
Applsci 12 05966 g005
Figure 6. Geometric dimensions of welded joints [25,26,27]. (a) Cross joint with transverse vertical plate. (b) Cross joint with longitudinal vertical plate. (c) Lap joint. (d) T-joint.
Applsci 12 05966 g006
Figure 7. S-N curve of titanium alloy welded structure fitted by two methods. (a) Traditional three-parameter power function model. (b) New three-parameter power function model.
Applsci 12 05966 g007
Figure 8. Comparison between test results and prediction results.
Applsci 12 05966 g008
Figure 9. T-joint for verification (1) [28].
Applsci 12 05966 g009
Figure 10. Comparison of test results and prediction results of verification (1).
Applsci 12 05966 g010
Figure 11. Cross joint for verification (2) [29].
Applsci 12 05966 g011
Figure 12. Comparison of test results and prediction results of verification (2).
Applsci 12 05966 g012
Table 1. Parameters of different transition angles at welding positions [21].
2 α / ( rad   ·   π 1 ) μ λ 1 χ 1
02.0000.5001.000
1/61.8330.5011.071
1/41.7500.5051.166
1/31.6670.5121.312
1/21.5000.5441.841
3/41.2500.6744.153
Table 2. Piecewise function parameters of notch stress equivalent value point [23].
as/mm
1~1010~100100~1000
A/mm−10.520670.808752.0598
B0.139150.05650.00928
C/mm−1−0.01092−8.41088 × 10−4−1.97016 × 10⁻⁵
D/mm−26.35004 × 10−47.23825 × 10−61.90644 × 10⁻⁸
E/mm−3−1.60256 × 10−5−2.48689 × 10⁻⁸−6.86043 × 10⁻¹²
Table 3. Loading method and material of each joint.
Type of Welded JointLoading Frequency (f)Stress Ratio (R)
Cross joint5 Hz0.00
Lap joint10 Hz0.10
T-joint10 Hz0.06
Table 4. Fatigue test results of titanium alloy welded structures.
Number of Test GroupsType of Welded JointLogarithmic Stress Range
Sr/MPa
Logarithmic Fatigue Life
lgN/Cycle
1Cross joint with transverse vertical plate2.26486.4058, 6.8202, 6.7662
22.27886.4206, 6.1412, 6.1562
32.31605.9492, 5.8316, 5.7289
42.34645.1135, 5.3650, 5.7816
52.36175.0233, 5.3374, 5.3045
6Cross joint with longitudinal vertical plate2.37115.4236, 6.0530, 5.5801
72.38746.0829, 5.7923, 5.9747
82.40655.3891, 5.6703, 5.2765
92.43305.4663, 5.1848, 5.2584
102.45944.6801, 4.8922, 5.0905
11Lap joint2.55494.6423, 4.6435, 4.6544
122.56824.1500, 4.1700, 4.3000
132.59114.0414, 4.1067, 4.1289
142.62323.6149, 3.9306, 3.8156
15T-joint2.60214.7361, 4.7534, 4.5563
Table 5. Coefficient of determination R2 of different S-N curve fitting models.
Fatigue Life Characterization Model of Titanium Alloy Welded StructuresCoefficient of Determination R2
Traditional three-parameter power function model0.8452
New three-parameter power function model0.9407
Table 6. Test fatigue life.
Group
Number
Stress Range
Sr/MPa
Test Fatigue Life
lgN/Cycle
Group NumberStress Range
Sr/MPa
Test Fatigue Life
lgN/Cycle
1149.506.624711207.005.8316
2151.056.663512209.105.7289
3160.006.606913217.005.7421
4176.006.084114218.505.2760
5183.005.951115223.005.3650
6190.006.141216230.005.3374
7190.805.754417231.005.3050
8195.505.654418234.155.4236
9200.705.698819241.505.1532
10204.005.9492
Table 7. Notch equivalent stress and predicted fatigue life corresponding to each stress range.
Group
Number
Stress Range Sr/MPaNotch Equivalent Stress σy/MPaPredicted Fatigue Life lgN/Cycle
1149.50202.076.1983
2151.05204.176.1652
3160.00216.275.9801
4176.00237.895.6736
5183.00247.365.5482
6190.00256.825.4275
7190.80257.905.4140
8195.50264.255.3357
9200.70271.285.2513
10204.00275.745.1989
11207.00279.805.1519
12209.10282.635.1195
13217.00293.315.0002
14218.50295.344.9781
15223.00301.424.9125
16230.00310.884.8131
17231.00312.244.7992
18234.15316.494.7556
19241.50326.434.6562
Table 8. Notch equivalent stress correction factors under each stress range.
Group NumberStress Range
Sr/MPa
Notch Equivalent Stress Correction Factor fasGroup NumberStress Range
Sr/MPa
Notch Equivalent Stress Correction Factor fas
1149.500.8758311207.000.80948
2151.050.8564512209.100.82735
3160.000.8228913217.000.79396
4176.000.8801614218.500.91152
5183.000.8822415223.000.86874
6190.000.8009516230.000.84955
7190.800.8995517231.000.85445
8195.500.9056418234.150.81243
9200.700.8700819241.500.85681
10204.000.79187
Publisher’s Note: MDPI stays neutral with regard to jurisdictional claims in published maps and institutional affiliations.

