Article

Prediction of Overall Survival in Cervical Cancer Patients Using PET/CT Radiomic Features

1
Department of Physics and Astronomy, University of Bologna, 40126 Bologna, Italy
2
Department of Experimental, Diagnostic and Specialty Medicine, University of Bologna, 40126 Bologna, Italy
3
Department of Medical Physics, IRCCS Azienda Ospedaliero-Universitaria di Bologna, 40126 Bologna, Italy
4
Nuclear Medicine, Department of Experimental, Diagnostic and Specialty Medicine, University of Bologna, 40126 Bologna, Italy
5
Nuclear Medicine, IRCCS, Azienda Ospedaliero-Universitaria di Bologna, 40138 Bologna, Italy
6
INFN Bologna, 40127 Bologna, Italy
*
Author to whom correspondence should be addressed.
These authors contributed equally to this work.
These authors contributed equally to this work and share seniorship.
Appl. Sci. 2022, 12(12), 5946; https://doi.org/10.3390/app12125946
Submission received: 27 April 2022 / Revised: 27 May 2022 / Accepted: 9 June 2022 / Published: 10 June 2022

Abstract

:
Background: Radiomics is a field of research medicine and data science in which quantitative imaging features are extracted from medical images and successively analyzed to develop models for providing diagnostic, prognostic, and predictive information. The purpose of this work was to develop a machine learning model to predict the survival probability of 85 cervical cancer patients using PET and CT radiomic features as predictors. Methods: Initially, the patients were divided into two mutually exclusive sets: a training set containing 80% of the data and a testing set containing the remaining 20%. The entire analysis was separately conducted for CT and PET features. Genetic algorithms and LASSO regression were used to perform feature selection on the initial PET and CT feature sets. Two different survival models were employed: the Cox proportional hazard model and random survival forest. The Cox model was built using the subset of features obtained with the feature selection process, while all the available features were used for the random survival forest model. The models were trained on the training set; cross-validation was used to fine-tune the models and to obtain a preliminary measurement of the performance. The models were then validated on the test set, using the concordance index as the metric. In addition, alternative versions of the models were developed using tumor recurrence as an adjunct feature to evaluate its impact on predictive performance. Finally, the selected CT and PET features were combined to build a further Cox model. Results: The genetic algorithm was superior to the LASSO regression for feature selection. The best performing model was the Cox model, which was built using the selected CT features; it achieved a concordance index score of 0.707. With the addition of tumor recurrence as a predictive feature, the Cox CT model reached a concordance index score of 0.776. PET features, however, proved to be inadequate for survival prediction. The CT model performed better than the model with combined PET and CT features. Conclusions: The results showed that radiomic features can be used to successfully predict survival probability in cervical cancer patients. In particular, CT radiomic features proved to be better predictors than PET radiomic features in this specific case.

1. Introduction

Radiomics refers to the analysis of quantitative features extracted from medical images, including computerized tomography (CT), positron emission tomography (PET), and magnetic resonance imaging (MRI). Radiomic features can be used to build models that provide valuable diagnostic, prognostic, and predictive information [1,2]. In the last few years, radiomic features were shown to be promising predictors in several cancer-related studies [3], providing quantitative measures of tumor characteristics that would otherwise be inaccessible. Kan et al. [4] showed that MRI radiomic features can be used to predict lymph node metastasis in early stage cervical cancer. A study by Mu et al. [5] on cervical cancer patients revealed that it is possible to build machine-learning models using PET radiomic features to classify early stage and advanced-stage tumors. Lucia et al. [6] showed that some of the radiomic features extracted from PET/CT and MRI were significant predictors of recurrence in patients with cervical cancer, with higher prognostic power than usual clinical variables. Other studies have also investigated the correlation between PET/CT radiomic features and cervical cancer histological types [7,8].
Cervical cancer (CC) is the fourth-most frequently diagnosed cancer and the fourth-most common cause of death from cancer in women, with an estimated 604,000 new cases and 342,000 deaths worldwide in 2020 [9].
Concurrent chemoradiation is the standard treatment option in locally advanced CC (LACC), allowing a local control of the disease in 70–80% of patients, with 66% and 58% reaching 5-year overall survival (OS) and disease-free survival (DFS) rates, respectively [10,11].
18F-FDG PET/CT has a well-established role in the management of patients with cervical cancer, especially in staging, treatment response, and recurrence [12,13]. However, the prognostic role of conducting quantitative image analysis on these images to determine the OS of LACC patients is still under investigation and requires additional studies [14].
The aim of this work was to use radiomic features extracted from PET/CT images to predict the risk of death in 85 cervical cancer patients. The patients were retrospectively selected for the study. The patients were followed for a time span ranging from a minimum of 6 to a maximum of 105 months. We developed and compared different feature selection methods to select the most informative variables for training a predictive model. Feature selection is a crucial step in radiomic analyses to address the common imbalances between the number of patients and the features in medical applications, known as ill-posed problems. We used the survival and associated survival times as labels for our survival models. The recurrence score is a clinical feature, i.e., a feature not quantified by radiomic analysis but included as an extra feature for our models and estimated at the time of collection of the PET/CT images. Two types of models were employed for prediction: the Cox proportional hazards model [15] and the random survival forest [16]. We selected these two types of models because they are standard tools used in survival analysis and allowed us to compare the behavior of linear and ensemble models, preserving easy explainability of the results. We aimed the models to predict the risk associated with the patients: a higher risk corresponded to a lower predicted survival time. We also developed alternative versions of the final models using tumor recurrence as an adjunct feature to evaluate its impact on predictive performance.

2. Materials and Methods

2.1. Patient and Treatment

All LACC patients underwent pelvic 3D conformal external beam radiotherapy with a prescribed dose to the pelvis of 46 Gy in 23 fractions and a brachytherapy boost, with the high dose-rate or pulsed dose-rate technique. The treatment volumes were delineated as follows: the clinical target volume (CTV) was defined as the gross tumor volume, uterus, parametria, upper third of the vagina, obturator, and presacral, iliac (common, internal, and external), and paraaortic lymph nodes (if PET-positive) with an expansion of 7 mm. CTV boost was defined as lymphadenopathies with high FDG uptake plus an expansion of 7 mm. The planning target volumes (PTV and PTVboost) were obtained by adding a 1 cm isotropic expansion from the CTV. Examples of semiautomated delineation of PTVboost contours based on the baseline PET/CT images are reported in Figure 1. Chemotherapy with cisplatin (40 mg/m2) was administered once per week during the period of external beam radiotherapy.

2.2. Data Acquisition

We collected pretherapy whole-body 18F-FDG PET/CT scans from 85 patients in this retrospective study at the IRCCS Azienda Ospedaliero-Universitaria di Bologna. The study was conducted according to the guidelines of the Declaration of Helsinki, all patients signed an informed consent, and the local ethical committee of Sant’Orsola-Malpighi Hospital of Bologna approved this study (CE 322/2019/Oss/AUOBo). A total of 3 MBq/kg of 18F-FDG was intravenously injected. The uptake time was 60 min in all of the patients. Images were acquired on a 3D tomograph (Discovery STE; General Electric) for 2 min per bed position. A low-dose CT scan (120 kV, 80 mA) was performed both for attenuation correction and to provide an anatomical map. PET images were reconstructed using an iterative 3D ordered subset expectation maximization method with two iterations and 20 subsets, followed by smoothing (with a 6 mm 3D Gaussian kernel) with CT-based attenuation, scatter, and random coincidence event correction.
The PET edge algorithm implemented in MIM Software (MIM Software Inc., Cleveland, OH, USA) was used for automatic lesion segmentation on PET images. The obtained automatic contours were manually validated by expert nuclear medicine physicians and adjusted to include the entire tumor areas, and rigidly transferred to the coregistered CT images.
The images and the structure sets in DICOM format were imported into 3D Slicer software [17] for the radiomic features extraction from both PET and CT scans; 3D Slicer software is based on the Pyradiomics Python library [18] and allows for the extraction of shape-based, first-order, and texture-based features.

2.3. Database Description and Pre-Processing

For each patient, a set of 105 CT and PET radiomic features was collected. Each patient was labelled with two outcomes: survival and survival time. For each patient, we also collected clinical information on recurrence to use as an extra feature in our survival models. In our analyses, we used survival and survival time as required outcomes for the survival models, while recurrence was used as clinical feature along with the radiomic features. Among the 85 patients, 24 died during the study period, and the others were censored. The dataset was split into two disjoint subsets: a training set (80%) and a test set (20%). We standardized the set of features according to the mean and standard deviation of the training set.

2.4. Feature Selection

Two different techniques were used and compared to select the best subset of radiomic features: LASSO regression [19] and genetic algorithm [20]. We chose the LASSO regression as it is a standard method for the feature selection procedure. The LASSO regression selects the features, minimizing the L1-loss function. Contrarily, the genetic algorithm allows a customization of the loss function, which can be tailored for the specific application.
We used a Cox proportional hazards model with a LASSO penalty, also known as an l1 penalty, to fit the training data. The number of features to preserve was parametrized by the penalization coefficient of the LASSO regression: a higher penalty leads to fewer features being preserved. We used 100 penalization values evenly spaced in [10−4, 1]. For each value, a Cox model was trained and evaluated using 5-fold cross-validation. We repeated the cross-validation procedure 5 times for each Cox model to give a more reliable estimation of the model performance. The parameter yielding the best cross-validation result was selected as the optimal one. Then, the best Cox model found was used for the estimation of β parameters: the LASSO model filters out all of the features associated to a corresponding zero value of β.
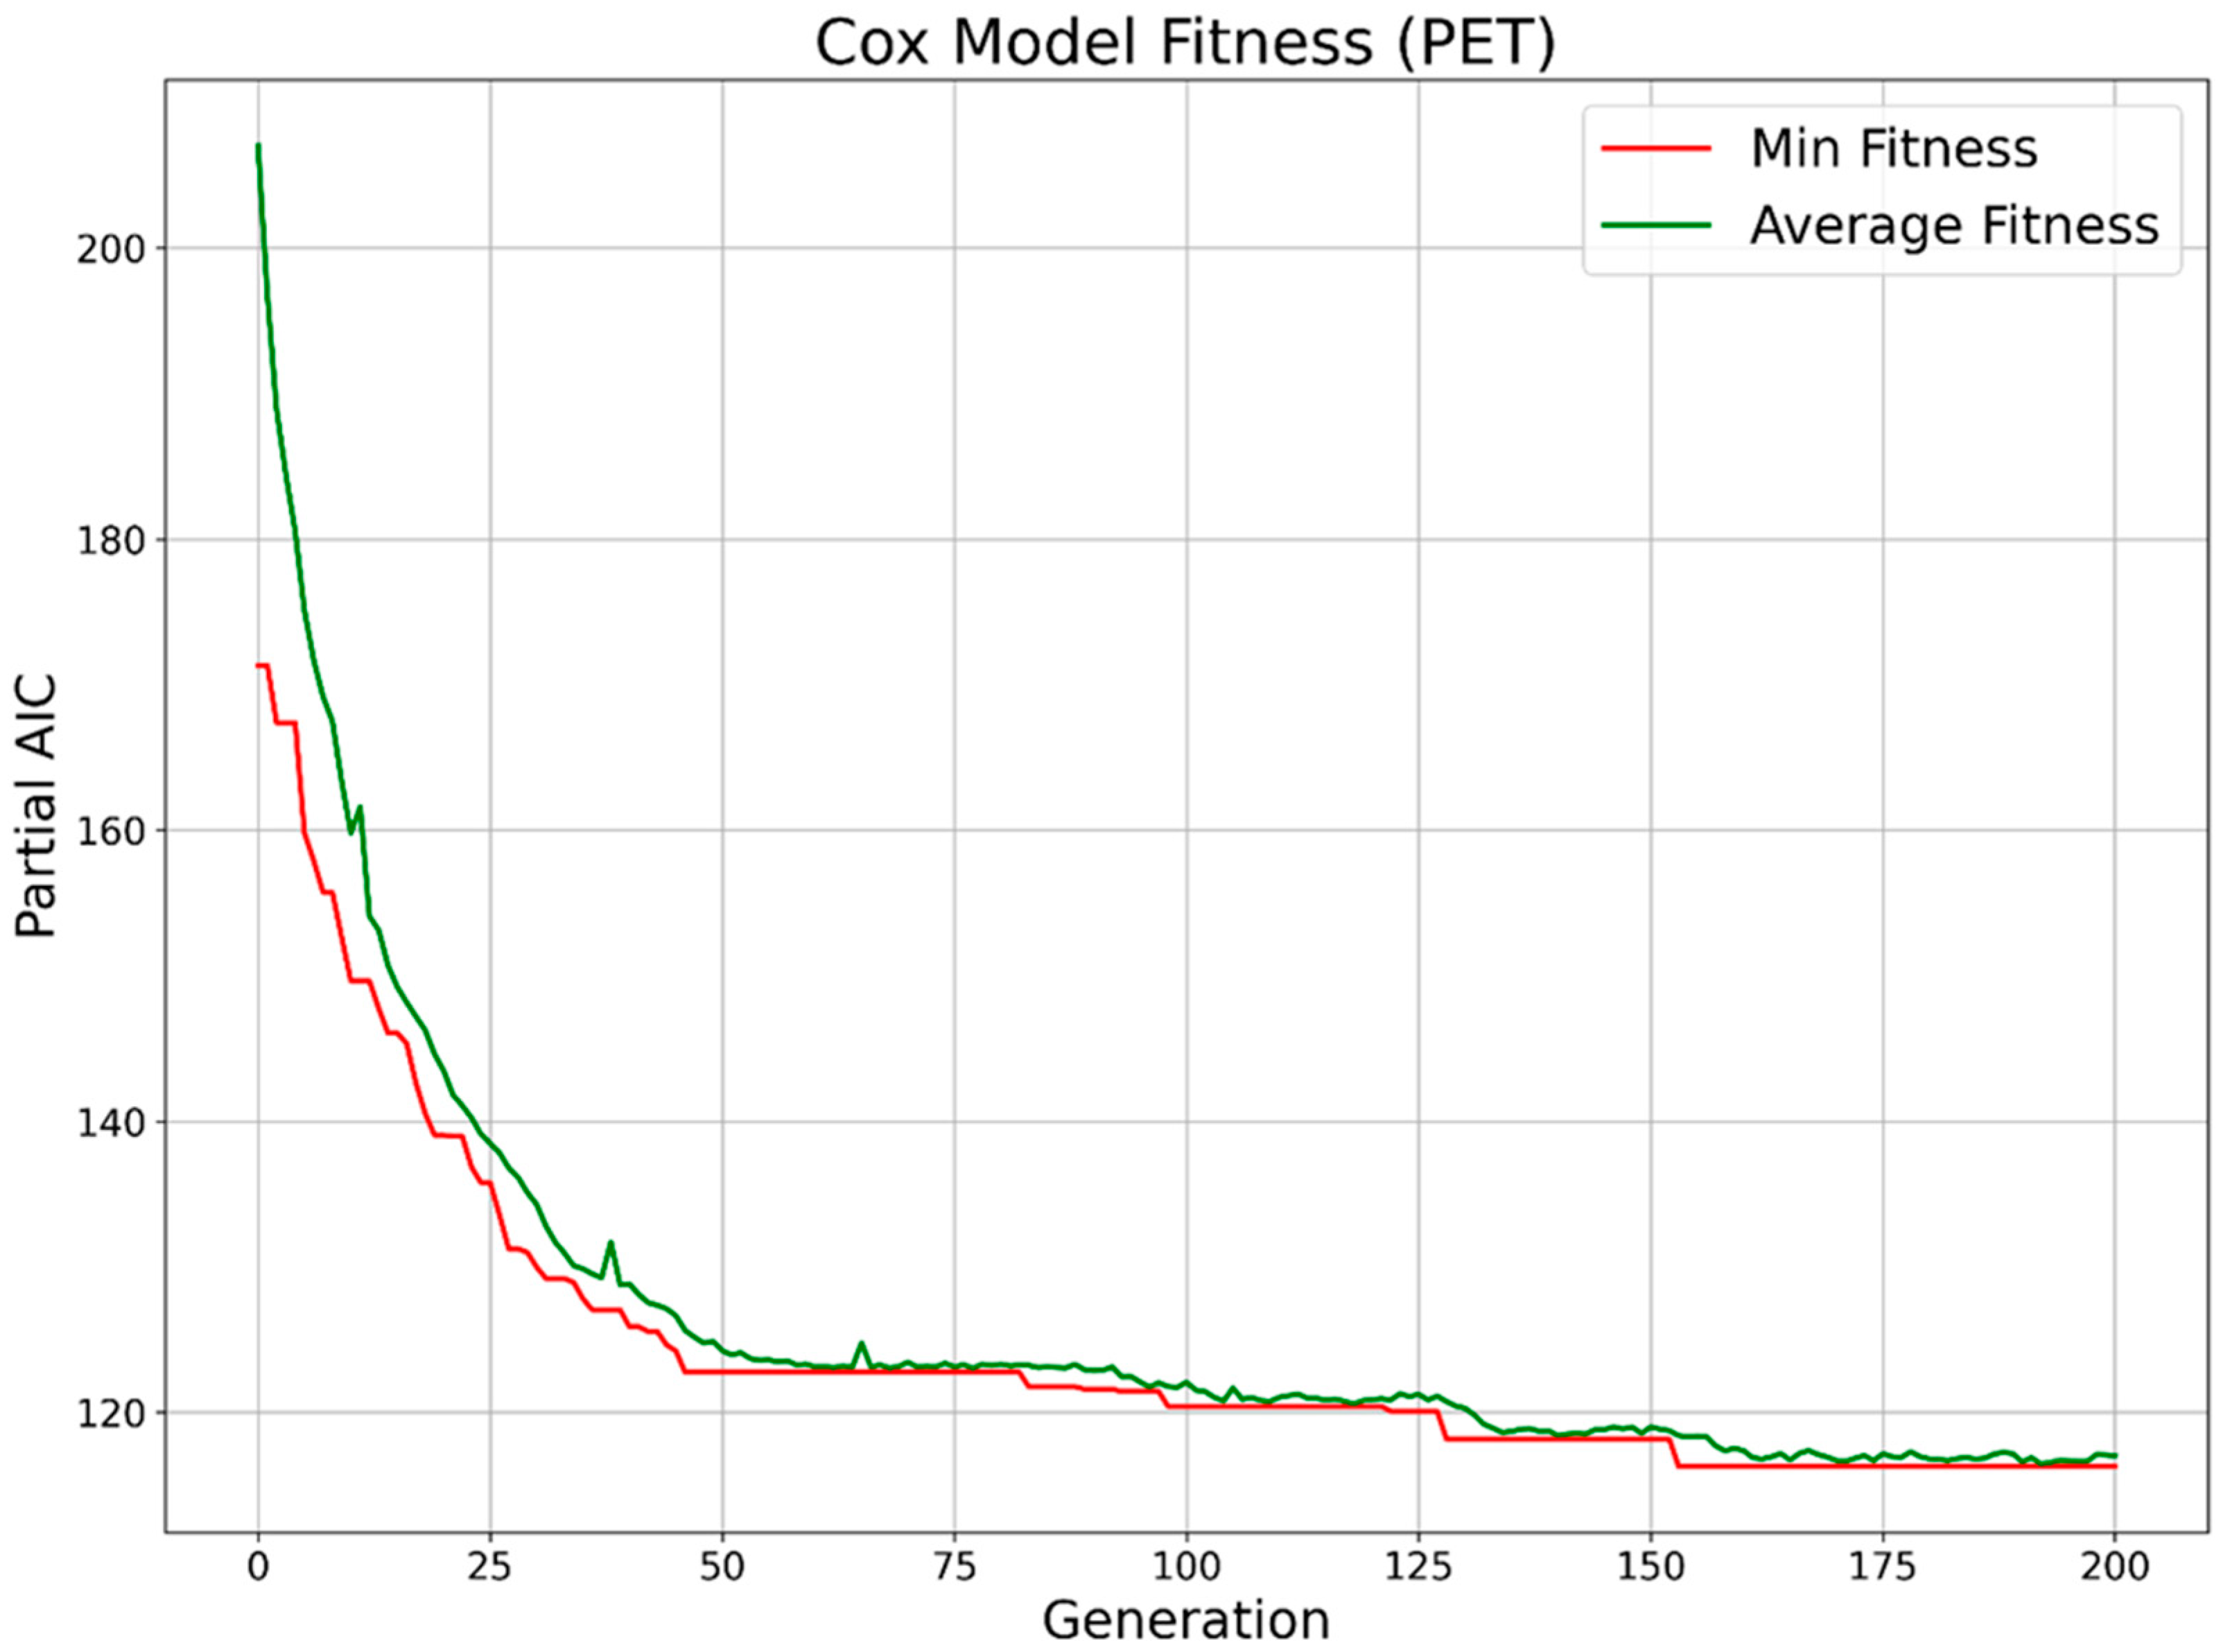
We developed a genetic algorithm (GA) for the feature selection procedure. Each genome identified a putative set of features, expressed as a binary pattern of the considered features. Features associated to no-null genes were preserved; null genes identified features that were excluded. Each genome was assessed using a Cox model. The resulting model was evaluated using a metric function, and the scores of the models were used as fitness values. The first model evaluation was performed using the Akaike information criterion (AIC) [21] as a metric (Figure 2). The AIC score penalizes models with a high number of features. We estimated the best model, and the corresponding subset of features, as the one with the lowest AIC score. Using the subset of features obtained by the first filtering, a second reduction was performed according to the maximization of the fitness function given by:
F i t n e s s = μ ( C V 5 ) σ ( C V 5 )
where µ(CV5) and σ(CV5) are the average and standard deviation scores obtained by the model in a 5-fold cross-validation repeated five times, respectively. We used the concordance index (CI) metric for the evaluation of the cross-validation. The concordance index [22] is defined as:
C I = n ° c o n c o r d a n t p a i r s n ° c o n c o r d a n t p a i r s + n ° d i s c o r d a n t p a i r s
Two patients were correctly ordered if the patient with the higher predicted risk experienced the death event (binary score) before the patient with the lower predicted risk. The concordant pairs were the pairs of patients correctly ordered by the model, while the discordant pairs were those that were incorrectly ordered. This fitness function aimed to maximize the overall score obtained in the repeated cross-validation, while achieving a similar score for all the cross-validation folds, by minimizing the standard deviation.
We performed a 5-fold cross-validation repeated five times for the evaluation of the Cox model, i.e., the identification of the best features subset, using the concordance index as an evaluation metric.
CT and PET features were independently selected and used to build independent models to evaluate their different predictive power. The two selected feature subsets were merged, further reduced by maximizing (1) with the GA and used to build a comprehensive Cox model to estimate the predictive capability of their combination. All the selected features were included in the final models, except for the ones with a p-value greater than 0.2, which were manually excluded.

2.5. Survival Prediction

We applied penalized Cox and random survival forest (RSF) models for the prediction of patients’ overall survival. The Cox and RSF models were applied on the CT and PET feature sets selected by the GA separately and on their union. The RSF is an ensemble model and, therefore, it should not require a prior feature selection step.
The main parameter required to tune the Cox model is the regression penalty. One hundred Cox models were trained with different l2 penalization values ranging from 10−3 to 1. The models were evaluated using a 5-fold cross-validation repeated five times. The parameters yielding the best cross-validation results were chosen as the optimal ones.
A grid-search strategy was employed to find the optimal parameters for the RSF model. The grid-search algorithm tests different parameter configurations and selects the one that maximizes the repeated 5-fold cross-validation. We used the concordance index as a metric for cross-validation evaluation. Each configuration considered the number of estimators in the forest, the minimum number of samples required to split a node, and the maximum number of features to consider when looking for the best split of the node.
The predictive capabilities of the best Cox models and RSF models were validated on the test set that was set aside at the beginning of the study, using the concordance index as the metric.

3. Results

The obtained cross-validation results with the different subsets of selected features are summarized in Table 1 and Table 2. The scores obtained with the entire set of features were used as a reference for the results comparison (ref. last row in Table 1 and Table 2). The cross-validation results show that the most promising subsets of features were the ones selected by the GA for both PET and CT features. For CT features, the GA selected seven textural features and two first-order features. For PET features, instead, the GA selected three shape-based features, two textural features, and four first-order features. The PET and CT features selected by the GA, with the corresponding Cox coefficients and statistics, are shown in Table 3 and Table 4, respectively. The combined set of selected features is shown in Table 5.
The results obtained by the best models on the test data are shown in Table 6. The addition of recurrence as an extra feature produced a general improvement in all model performances. The results obtained on the test data using recurrence as an extra feature are shown in Table 7.

4. Discussion

The developed Cox CT model applied on CT features obtained a CI of 0.707. With recurrence as an additional input variable, it obtained a CI of 0.776, outperforming all the other proposed models. The RSFs performed poorly (CI ≈ 0.5), and the addition of recurrence did not produce a significant improvement. The RSFs’ results proved the importance of the feature selection task in radiomic applications.
The developed Cox PET model without a recurrence feature obtained a nonsignificant (<0.5) CI score. The low efficiency of the Cox PET model was probably due to the limited PET scanner resolution. It was shown [23] that for small tumors (volume ≲ 10 cm3), textural PET radiomic features are highly correlated with the tumor volume, adding almost no further information, making the quantification of intratumoral heterogeneity inadequate [3]. The inclusion of recurrence to the Cox PET model produced a considerable improvement (CI = 0.62, i.e., +30%) in performance. The Cox models, contrary to the RSF models, were built using smaller subsets of features, so the addition of a strong predictor had a greater impact on the performance. Nevertheless, the performance of the Cox PET model was not as good as that of the Cox CT model. The CT model also performed better than the model with combined PET and CT features.
The inclusion of recurrence along with standard radiomic features produced a significant improvement in predictive performance. The radiomic features quantified the patient state at a particular time point, thus losing the information about patient history. The recurrence score allowed for the inclusion of this history information in survival evaluation. The recurrence clinical feature could not be directly evaluated by radiomic analysis; therefore, it may provide a significant boost to the survival models’ predictions.

5. Conclusions

The obtained results showed that the subset of the radiomic features analyzed in this study can be successfully used to predict overall survival in cervical cancer patients. In particular, the Cox model trained with the CT radiomic features selected by the GA achieved a significant result on test data, with a CI score of 0.707. Moreover, the addition of recurrence as an extra feature further improved the predictive power of the model (+7%). The difference between the performance of the CT and PET Cox models confirmed the low efficiency of PET features in catching small tumor structure details due to the low resolution of the data. This was also confirmed by the type of features selected by the GA for the two feature sets. For CT, seven of the nine selected features were textural features, while only two textural features were selected for PET.
The scores achieved by the RSF models highlight the importance of the feature selection task. These ensemble models, trained using all the available features, performed substantially worse than the Cox CT model.
The proposed GA was significantly better in feature selection than the widely used LASSO regression. The integration of GA with the Cox proportional hazard model allowed the selection of meaningful predictive features, addressing the problem of dimensionality reduction required by radiomic applications. Furthermore, the GA feature selection technique developed in this study can be adapted to different types of models and different metrics with minimum effort.
Further improvements can be achieved, including a feature importance criterion in the proposed pipeline, repeating the feature extraction procedure several times. The developed pipeline may also be employed to predict the probability of recurrence outcome, after the definition of an inclusion criterion for the subjects that experienced recurrence more than once. Finally, the model may be further improved by including other clinical variables and investigating their relationships with the radiomic features already found.
The results obtained by the proposed fully automated pipeline proved its suitability for usage in clinical practice, proving the effectiveness of radiomic analysis in CT/PET imaging. However, the results presented in this work must be validated by a multicenter study with a larger cohort of patients.

Author Contributions

Conceptualization, E.G., D.R. and G.C. (Gastone Castellani); data curation, S.S., S.F., C.N. and L.S.; formal analysis, G.C. (Gianluca Carlini), N.C., C.S., D.D. and A.M.; methodology, G.C. (Gianluca Carlini), N.C., E.G., C.S., D.D., A.M. and L.S.; project administration, L.S. and G.C. (Gastone Castellani); software, G.C. (Gianluca Carlini) and N.C.; supervision, L.S. and G.C. (Gastone Castellani); validation, S.S., S.F. and C.N.; writing—original draft, G.C. (Gianluca Carlini), N.C.; E.G., D.D. and A.M.; writing—review and editing, S.S., C.S., S.F., D.R., C.N., L.S. and G.C. (Gastone Castellani). All authors have read and agreed to the published version of the manuscript.

Funding

This research received no external funding.

Institutional Review Board Statement

The study was conducted according to the guidelines of the Declaration of Helsinki and was approved by the Institutional Review Board (or Ethics Committee) of IRCCS University Hospital di Bologna (protocol code n° CE 322/2019/Oss/AUOBo).

Informed Consent Statement

This study was an observational, retrospective, single-center study that was approved by our local institution review board. Informed consent was waived by the institutional review board owing to the retrospective nature of the study.

Data Availability Statement

The data collected in loco are available on request due to restrictions on privacy (European GDPR).

Acknowledgments

The study was partially supported by AIRC IG 20809 (2017) PI: Strigari L. and by AIRC IG 26216 (2021) PI: Castellani G.

Conflicts of Interest

The authors declare no conflict of interest.

References

  1. Kumar, V.; Gu, Y.; Basu, S.; Berglund, A.; Eschrich, S.A.; Schabath, M.B.; Forster, K.; Aerts, H.J.W.L.; Dekker, A.; Fenstermacher, D.; et al. Radiomics: The process and the challenges. Magn. Reson. Imaging 2012, 30, 1234–1248. [Google Scholar] [CrossRef] [PubMed]
  2. Lambin, P.; Leijenaar, R.T.H.; Deist, T.M.; Peerlings, J.; de Jong, E.E.C.; van Timmeren, J.; Sanduleanu, S.; Larue, R.T.H.M.; Even, A.J.G.; Jochems, A.; et al. Radiomics: The bridge between medical imaging and personalized medicine. Nat. Rev. Clin. Oncol. 2017, 14, 749–762. [Google Scholar] [CrossRef] [PubMed]
  3. Yip, S.S.F.; Aerts, H.J.W.L. Applications and limitations of radiomics. Phys. Med. Biol. 2016, 61, R150–R166. [Google Scholar] [CrossRef] [PubMed]
  4. Kan, Y.; Dong, D.; Zhang, Y.; Jiang, W.; Zhao, N.; Han, L.; Fang, M.; Zang, Y.; Hu, C.; Tian, J.; et al. Radiomic signature as a predictive factor for lymph node metastasis in early-stage cervical cancer. J. Magn. Reson. Imaging 2018, 49, 304–310. [Google Scholar] [CrossRef]
  5. Mu, W.; Chen, Z.; Liang, Y.; Shen, W.; Yang, F.; Dai, R.; Wu, N.; Tian, J. Staging of cervical cancer based on tumor heterogeneity characterized by texture features on18F-FDG PET images. Phys. Med. Biol. 2015, 60, 5123–5139. [Google Scholar] [CrossRef]
  6. Lucia, F.; Visvikis, D.; Desseroit, M.-C.; Miranda, O.; Malhaire, J.-P.; Robin, P.; Pradier, O.; Hatt, M.; Schick, U. Prediction of outcome using pretreatment 18F-FDG PET/CT and MRI radiomics in locally advanced cervical cancer treated with chemoradiotherapy. Eur. J. Pediatr. 2017, 45, 768. [Google Scholar] [CrossRef]
  7. Tsujikawa, T.; Rahman, T.; Yamamoto, M.; Yamada, S.; Tsuyoshi, H.; Kiyono, Y.; Kimura, H.; Yoshida, Y.; Okazawa, H. 18F-FDG PET radiomics approaches: Comparing and clustering features in cervical cancer. Ann. Nucl. Med. 2017, 31, 678–685. [Google Scholar] [CrossRef]
  8. Shen, W.-C.; Chen, S.-W.; Liang, J.-A.; Hsieh, T.-C.; Yen, K.-Y.; Kao, C.-H. 18Fluorodeoxyglucose Positron Emission Tomography for the Textural Features of Cervical Cancer Associated with Lymph Node Metastasis and Histological Type. Eur. J. Nucl. Med. Mol. Imaging 2017, 144, 646–1731. [Google Scholar] [CrossRef]
  9. Sung, H.; Ferlay, J.; Siegel, R.L.; Laversanne, M.; Soerjomataram, I.; Jemal, A.; Bray, F. Global Cancer Statistics 2020: GLOBOCAN Estimates of Incidence and Mortality Worldwide for 36 Cancers in 185 Countries. CA Cancer J. Clin. 2021, 71, 209–249. [Google Scholar] [CrossRef]
  10. Meta-Analysis Group, Medical Research Council Clinical Trials Unit. Reducing Uncertainties about the Effects of Chemoradiotherapy for Cervical Cancer: A Systematic Review and Meta-Analysis of Individual Patient Data From 18 Randomized Trials. J. Clin. Oncol. 2008, 26, 5802–5812. [Google Scholar] [CrossRef]
  11. Onal, C.; Reyhan, M.; Guler, O.C.; Yapar, A.F. Treatment outcomes of patients with cervical cancer with complete metabolic responses after definitive chemoradiotherapy. Eur. J. Pediatr. 2014, 41, 1336–1342. [Google Scholar] [CrossRef] [PubMed]
  12. Narayanan, P.; Sahdev, A. The role of18F-FDG PET CT in common gynaecological malignancies. Br. J. Radiol. 2017, 90, 20170283. [Google Scholar] [CrossRef] [PubMed]
  13. The Royal College of Radiologists; Royal College of Physicians and Surgeons of Glasgow; Royal College of Physicians of London; Royal College of Physicians of Edinburgh; British Nuclear Medicine Society; Administration of Radioactive Substances Advisory Committee. Evidence-based indications for the use of PET-CT in the United Kingdom 2016. Clin. Radiol. 2016, 71, e171–e188. [Google Scholar] [CrossRef] [PubMed]
  14. Ai, Y.; Zhu, H.; Xie, C.; Jin, X. Radiomics in cervical cancer: Current applications and future potential. Crit. Rev. Oncol./Hematol. 2020, 152, 102985. [Google Scholar] [CrossRef]
  15. Cox, D.R. Regression Models and Life-Tables. J. R. Stat. Soc. Ser. B Stat. Methodol. 1972, 34, 187–202. [Google Scholar] [CrossRef]
  16. Ishwaran, H.; Kogalur, U.B.; Blackstone, E.H.; Lauer, M. Random survival forests. Ann. Appl. Stat. 2008, 2, 841–860. [Google Scholar] [CrossRef]
  17. Kikinis, R.; Pieper, S.D.; Vosburgh, K.G. 3D Slicer: A Platform for Subject-Specific Image Analysis, Visualization, and Clinical Support. In Intraoperative Imaging and Image-Guided Therapy; Jolesz, F.A., Ed.; Springer: New York, NY, USA, 2014; pp. 277–289. [Google Scholar] [CrossRef]
  18. van Griethuysen, J.J.M.; Fedorov, A.; Parmar, C.; Hosny, A.; Aucoin, N.; Narayan, V.; Beets-Tan, R.G.H.; Fillion-Robin, J.-C.; Pieper, S.; Aerts, H.J.W.L. Computational Radiomics System to Decode the Radiographic Phenotype. Cancer Res. 2017, 77, e104–e107. [Google Scholar] [CrossRef]
  19. Tibshirani, R. Regression Shrinkage and Selection Via the Lasso. J. R. Stat. Soc. Ser. B 1996, 58, 267–288. [Google Scholar] [CrossRef]
  20. Whitley, D. A genetic algorithm tutorial. Stat. Comput. 1994, 4, 65–85. [Google Scholar] [CrossRef]
  21. Akaike, H. Information Theory and an Extension of the Maximum Likelihood Principle. In Selected Papers of Hirotugu Akaike; Parzen, E., Tanabe, K., Kitagawa, G., Eds.; Springer: New York, NY, USA, 1998; pp. 199–213. [Google Scholar] [CrossRef]
  22. Harrell, F.E.; Califf, R.M.; Pryor, D.B.; Lee, K.L.; Rosati, R.A. Evaluating the Yield of Medical Tests. JAMA 1982, 247, 2543. [Google Scholar] [CrossRef]
  23. Hatt, M.; Majdoub, M.; Vallières, M.; Tixier, F.; Le Rest, C.C.; Groheux, D.; Hindié, E.; Martineau, A.; Pradier, O.; Hustinx, R.; et al. 18F-FDG PET Uptake Characterization Through Texture Analysis: Investigating the Complementary Nature of Heterogeneity and Functional Tumor Volume in a Multi–Cancer Site Patient Cohort. J. Nucl. Med. 2014, 56, 38–44. [Google Scholar] [CrossRef] [PubMed]
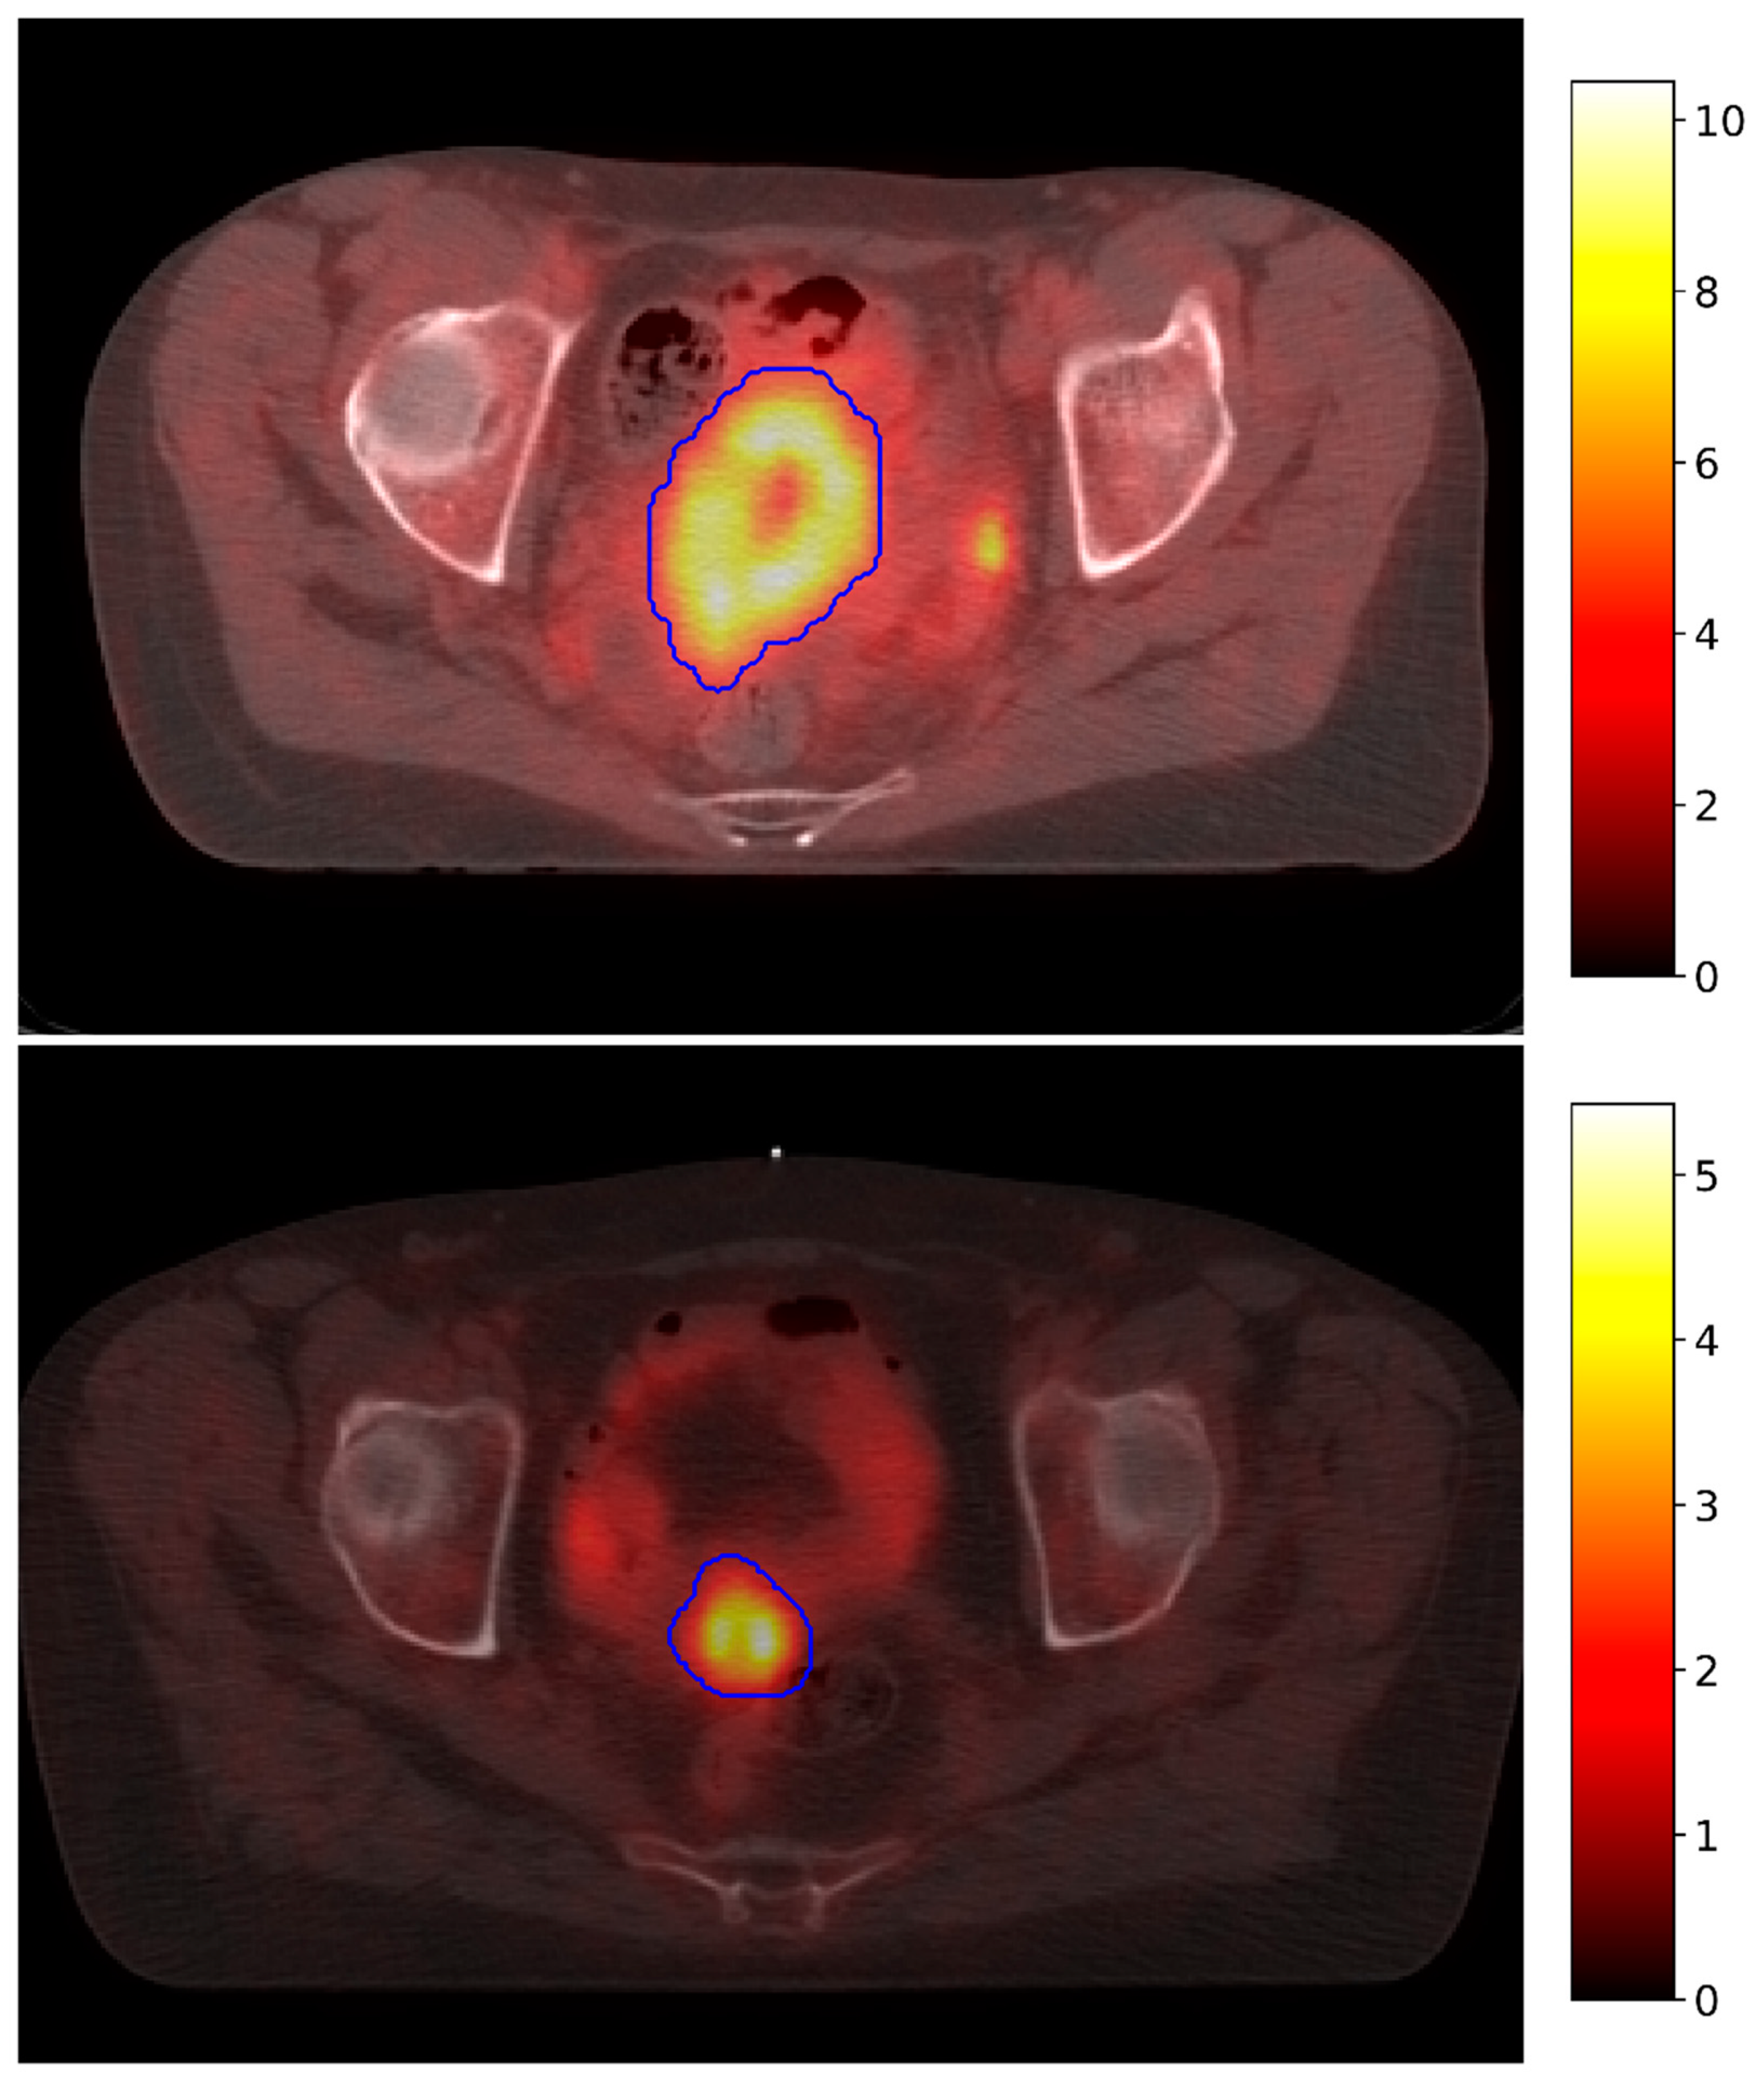
Figure 1. Fused PET/CT axial plane scans of two patients selected in the study. We highlight the tumor area (e.g., PTVboost) identified by expert radiologists with the blue contours.
Applsci 12 05946 g001
Figure 2. Trend of genetic algorithm fitness values for 200 iterations. The fitness of each genome is the partial AIC of a Cox model fitted with the features selected by that genome. The image shows the fitness minimization of the PET feature set. The minimum and average fitness values are shown in red and green, respectively.
Applsci 12 05946 g002
Table 1. Repeated 5-fold cross-validation score comparison for Cox models built on different subsets of the original CT features set. We identify as baseline the performance obtained with the entire set of available CT radiomic features.
Selection Method (CT Features)Cross-Validated CINumber of Features
Genetic Algorithm0.798 ± 0.1059
LASSO Regression0.696 ± 0.1408
Baseline0.435 ± 0.148105
Table 2. Repeated 5-fold cross-validation score comparison for Cox models built on different subsets of the original PET features set. We identify as baseline the performance obtained with the entire set of available PET radiomic features.
Selection Method (PET Features)Cross-Validated CINumber of Features
Genetic Algorithm0.801 ± 0.1279
LASSO Regression0.700 ± 0.1385
Baseline0.509 ± 0.198105
Table 3. Selected PET features and corresponding Cox coefficients, standard errors, 95% confidence intervals, and p-values.
Feature (PET)Coef.Std. Err.Coef. Lower 95%Coef. Upper 95%p-Value
Max2DDiamSlice0.8840.621−0.3332.1010.155
SurfaceVolumeRatio1.2700.4800.3292.2120.008
Max2DDiamRow1.0520.598−0.1192.2230.078
Correlation−2.4081.238−4.8350.0190.052
Energy1.0460.4740.1181.9740.027
Maximum1.5600.861−0.1283.2480.070
Minimum1.8150.8320.1853.4450.029
10Percentile−3.7311.360−6.397−1.0650.006
ZoneEntropy−3.3931.812−6.9450.1580.061
Table 4. Selected CT features and corresponding Cox coefficients, standard errors, 95% confidence intervals, and p-values.
Feature (CT)Coef.Std. Err.Coef. lower 95%Coef. Upper 95%p-Value
SmallDepHighGLEmph2.5790.7811.0484.109<0.005
LargeDepLowGLEmph−1.0690.546−2.1390.0010.050
JointAverage−4.2341.240−6.665−1.803<0.005
DifferenceEntropy−1.1240.527−2.157−0.0910.033
Imc2−1.2580.911−3.0440.5290.168
Imc1−2.6791.339−5.304−0.0540.045
Skewness−1.4580.603−2.640−0.2760.016
Energy1.0540.2950.4761.632<0.005
Contrast−2.0931.122−4.2920.1060.062
Table 5. Combined selected CT and PET features after further selection with the GA, with corresponding Cox coefficients, standard errors, 95% confidence intervals, and p-values.
FeatureCoef.Std. Err.Coef. Lower 95%Coef. Upper 95%p-Value
SmallDepHighGLEmph (CT)1.4250.5630.322.5290.011
JointAverage (CT)−2.2261.078−4.338−0.1130.039
Imc2 (CT)−2.5451.073−4.648−0.4420.018
Imc1 (CT)−4.4011.389−7.123−1.678<0.005
Skewness (CT)−1.1140.754−2.5920.3650.140
Energy (CT)0.6760.3390.0111.3410.046
Contrast (CT)−4.6551.329−7.260−2.049<0.005
Max2DDiamSlice (PET)1.6500.6800.3172.9830.015
SurfaceVolumeRatio (PET)2.1260.6790.7963.456<0.005
Maximum (PET)1.3360.699−0.0342.7050.056
10Percentile (PET)−1.3500.705−2.7320.0310.055
Table 6. Results obtained by the models trained with only radiomic features, i.e., without the recurrence feature, evaluated on the test sets. The metric used for evaluation was the concordance index.
Model (without Recurrence)No. Concordant PairsNo. Discordant PairsConcordance Index
Cox (CT)41170.707
Cox (PET)17410.293
Cox (PET + CT)32260.552
RSF (CT)16420.276
RSF (PET)30280.517
RSF (PET + CT)30280.517
Table 7. Results obtained by the models trained with radiomic + recurrence features, evaluated on the test sets. The metric used for evaluation was the concordance index.
Model (with Recurrence)No. Concordant PairsNo. Discordant PairsConcordance Index
Cox (CT)45130.776
Cox (PET)36220.621
Cox (PET + CT)45130.776
RSF (CT)26320.448
RSF (PET)30280.517
RSF (PET + CT)30280.517
Publisher’s Note: MDPI stays neutral with regard to jurisdictional claims in published maps and institutional affiliations.