Communication

Correlations between Anthropometric Measurements and Sports Discipline Aptitude

by
Magdalena Wiacek
1,
Ryszard Tomasiuk
1 and
Igor Z. Zubrzycki
1,2,*
1
Faculty of Medical and Health Sciences, Kazimierz Pulaski University of Technology and Humanities Radom, 26-600 Radom, Poland
2
Department of Biometry and Mathematics, Botswana University of Agriculture and Natural Resources, Sebele Content Farm, P/Bag BR 0027, Gaborone, Botswana
*
Author to whom correspondence should be addressed.
Appl. Sci. 2022, 12(12), 5932; https://doi.org/10.3390/app12125932
Submission received: 24 May 2022 / Revised: 30 May 2022 / Accepted: 6 June 2022 / Published: 10 June 2022

Abstract

:
Background: Sports specialization is required for the advancement of elite-level skills of a competitor. Therefore, this study attempted to assess the applicability of anthropometric measurements for a tailored selection of sports disciplines. Methods: The sports disciplines studied in this report were wrestling, triple jumping, badminton, and tennis. The data used in this study were obtained from a PubMed search. Literature-derived data were used as a template to build a random Gaussian population of N = 500 subjects used for ratio calculation using the error propagation approach. The obtained ratios encompassed height/sitting height, height/length, height/arm length, height/waist circumference, height/chest circumference, sitting height/leg length, sitting height/arm length, sitting height/waist circumference, sitting height/chest circumference, arm/leg length, and arm length/forearm length. Results: There is a clear relationship between a sports discipline and the distribution of the anthropometric ratio. The anthropometric measurements of wrestlers are the most outstanding among the disciplines studied. The use of machine learning algorithms, that is, the decision tree classifier, allows for building a model able to distinguish between the disciplines of sports studied. Conclusions: The presented approach allows for selection of a specific sports discipline for a young person. Moreover, an extension of the model built by other sports disciplines and anthropometric measurement may be a practical tool for selecting sports subjects.

1. Introduction

A recent report indicated that sports specialization among young competitors, that is, competitors who are between 11 and 13 years of age, is a common practice [1]. Therefore, any means of simplification of the accurate selection of the sports discipline for a competitor is of the utmost importance. The use of anthropological parameters that allow the assignment of a competitor to a specific sports discipline can be very helpful for discipline-specific achievements. Several studies reported that anthropometric parameters for different age groups and sports disciplines [2,3,4,5,6,7,8,9,10,11,12,13,14,15,16] could be split into two based on the reported parameters. These are [2] purely anatomical, anthropometric reports providing lengths and widths of limps and circumferences of the chest and waist and [4] fitness-related anthropometric reports that include bone mineral density (BMD) and free-fat mass (FFM). Although the use of anthropometric parameters to predict specific sports abilities should be a straightforward task, a review of the current literature paints a picture of a highly incoherent approach to reporting anthropometric parameters, making such a task very difficult. Thus, some reports use Latin [13], others English [17], to name limbs and measurement points. Additionally, some require data recompilation due to the use of different anthropometric reference points [13], and others, written by the same author, provide different values for analogous anthropometric parameters. Therefore, these inaccuracies render the reported results incomparable [17,18].
Furthermore, some studies suggest that total fat tissue is a factor of great importance when considering the aptitude for a specific sports discipline [19]. However, a recent review on body composition as a function of the training season [20] revealed that body composition is not related to sports discipline but is a function of diet and training. Moreover, it is a marker of the aptitude for a specific sports discipline. Therefore, it cannot be considered a crucial factor for assigning a competitor to a specific sports discipline. Thus, the incoherencies described above do not allow a straightforward elucidation of the reference stature defining an aptitude for a specific sports discipline.
The analysis presented in this report aimed to establish a minimal data set, allowing a competitor to be assigned to a specific sports discipline using a machine learning algorithm (ML). The model employs literature-derived anthropometric measurements of male wrestlers, triple jumpers, tennis players, and badminton players. In practice, the presented model should improve human-experience-driven subject assignments to a specific sports discipline.

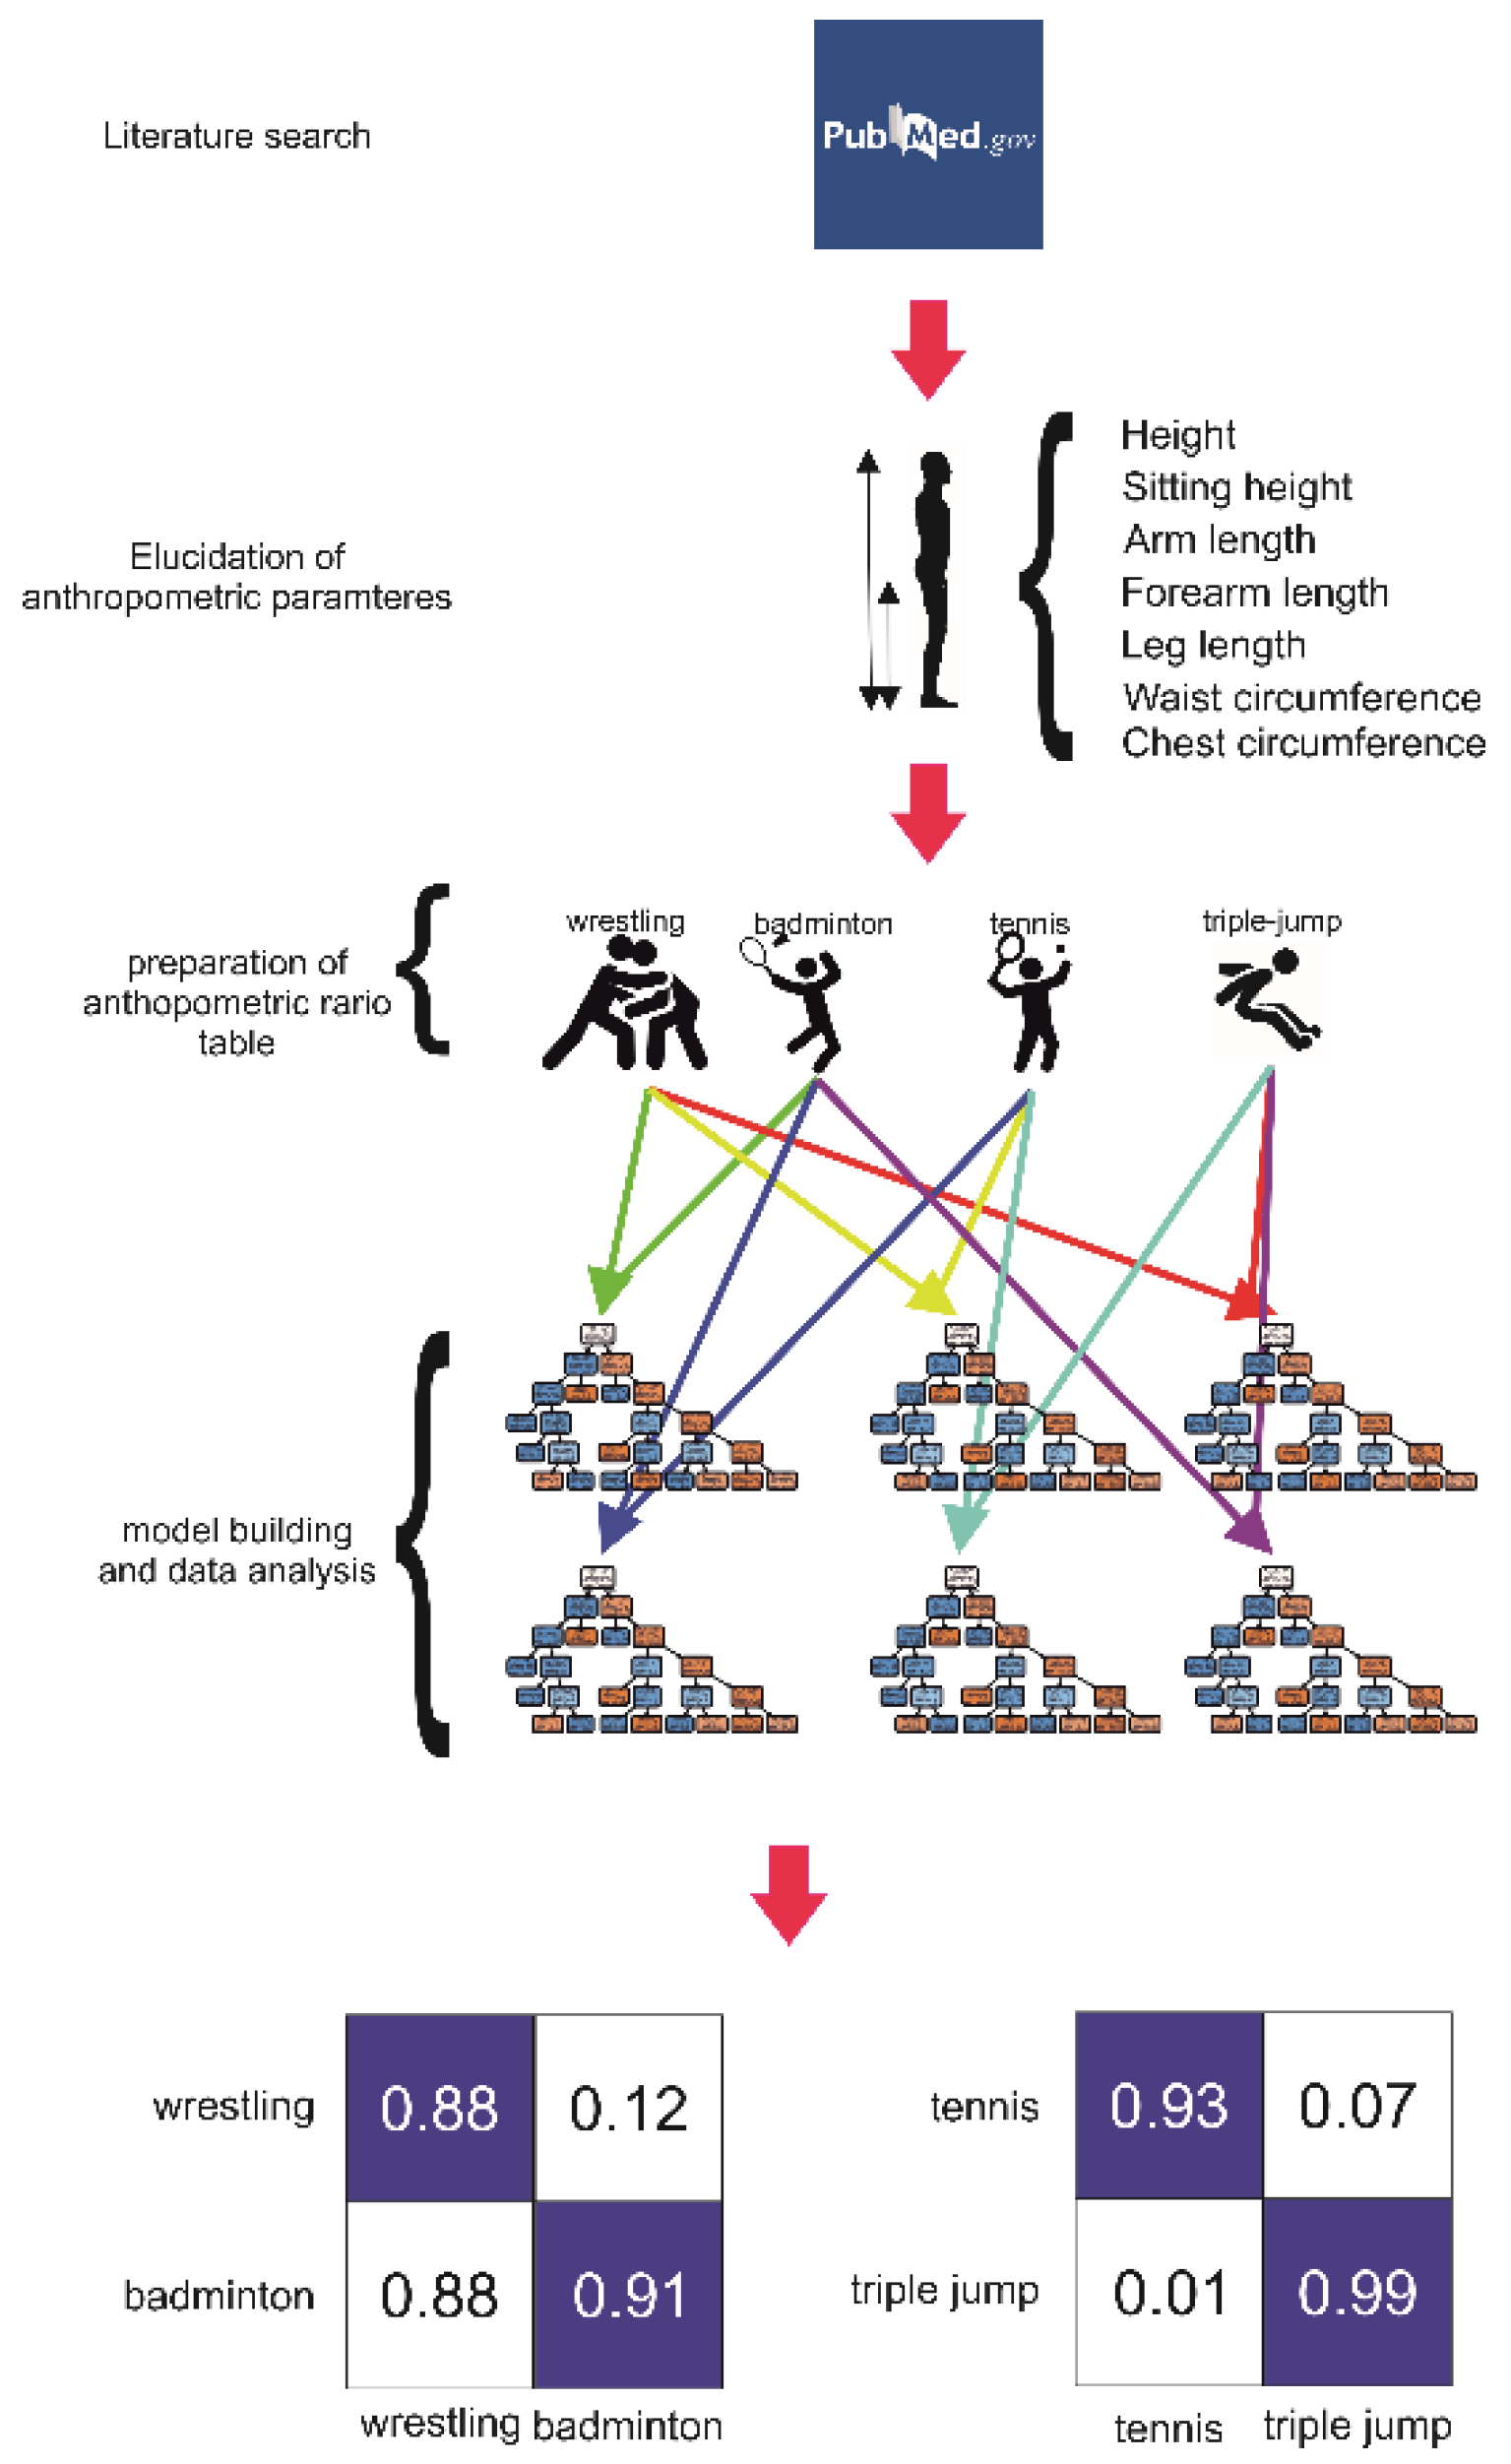
2. Materials and Methods
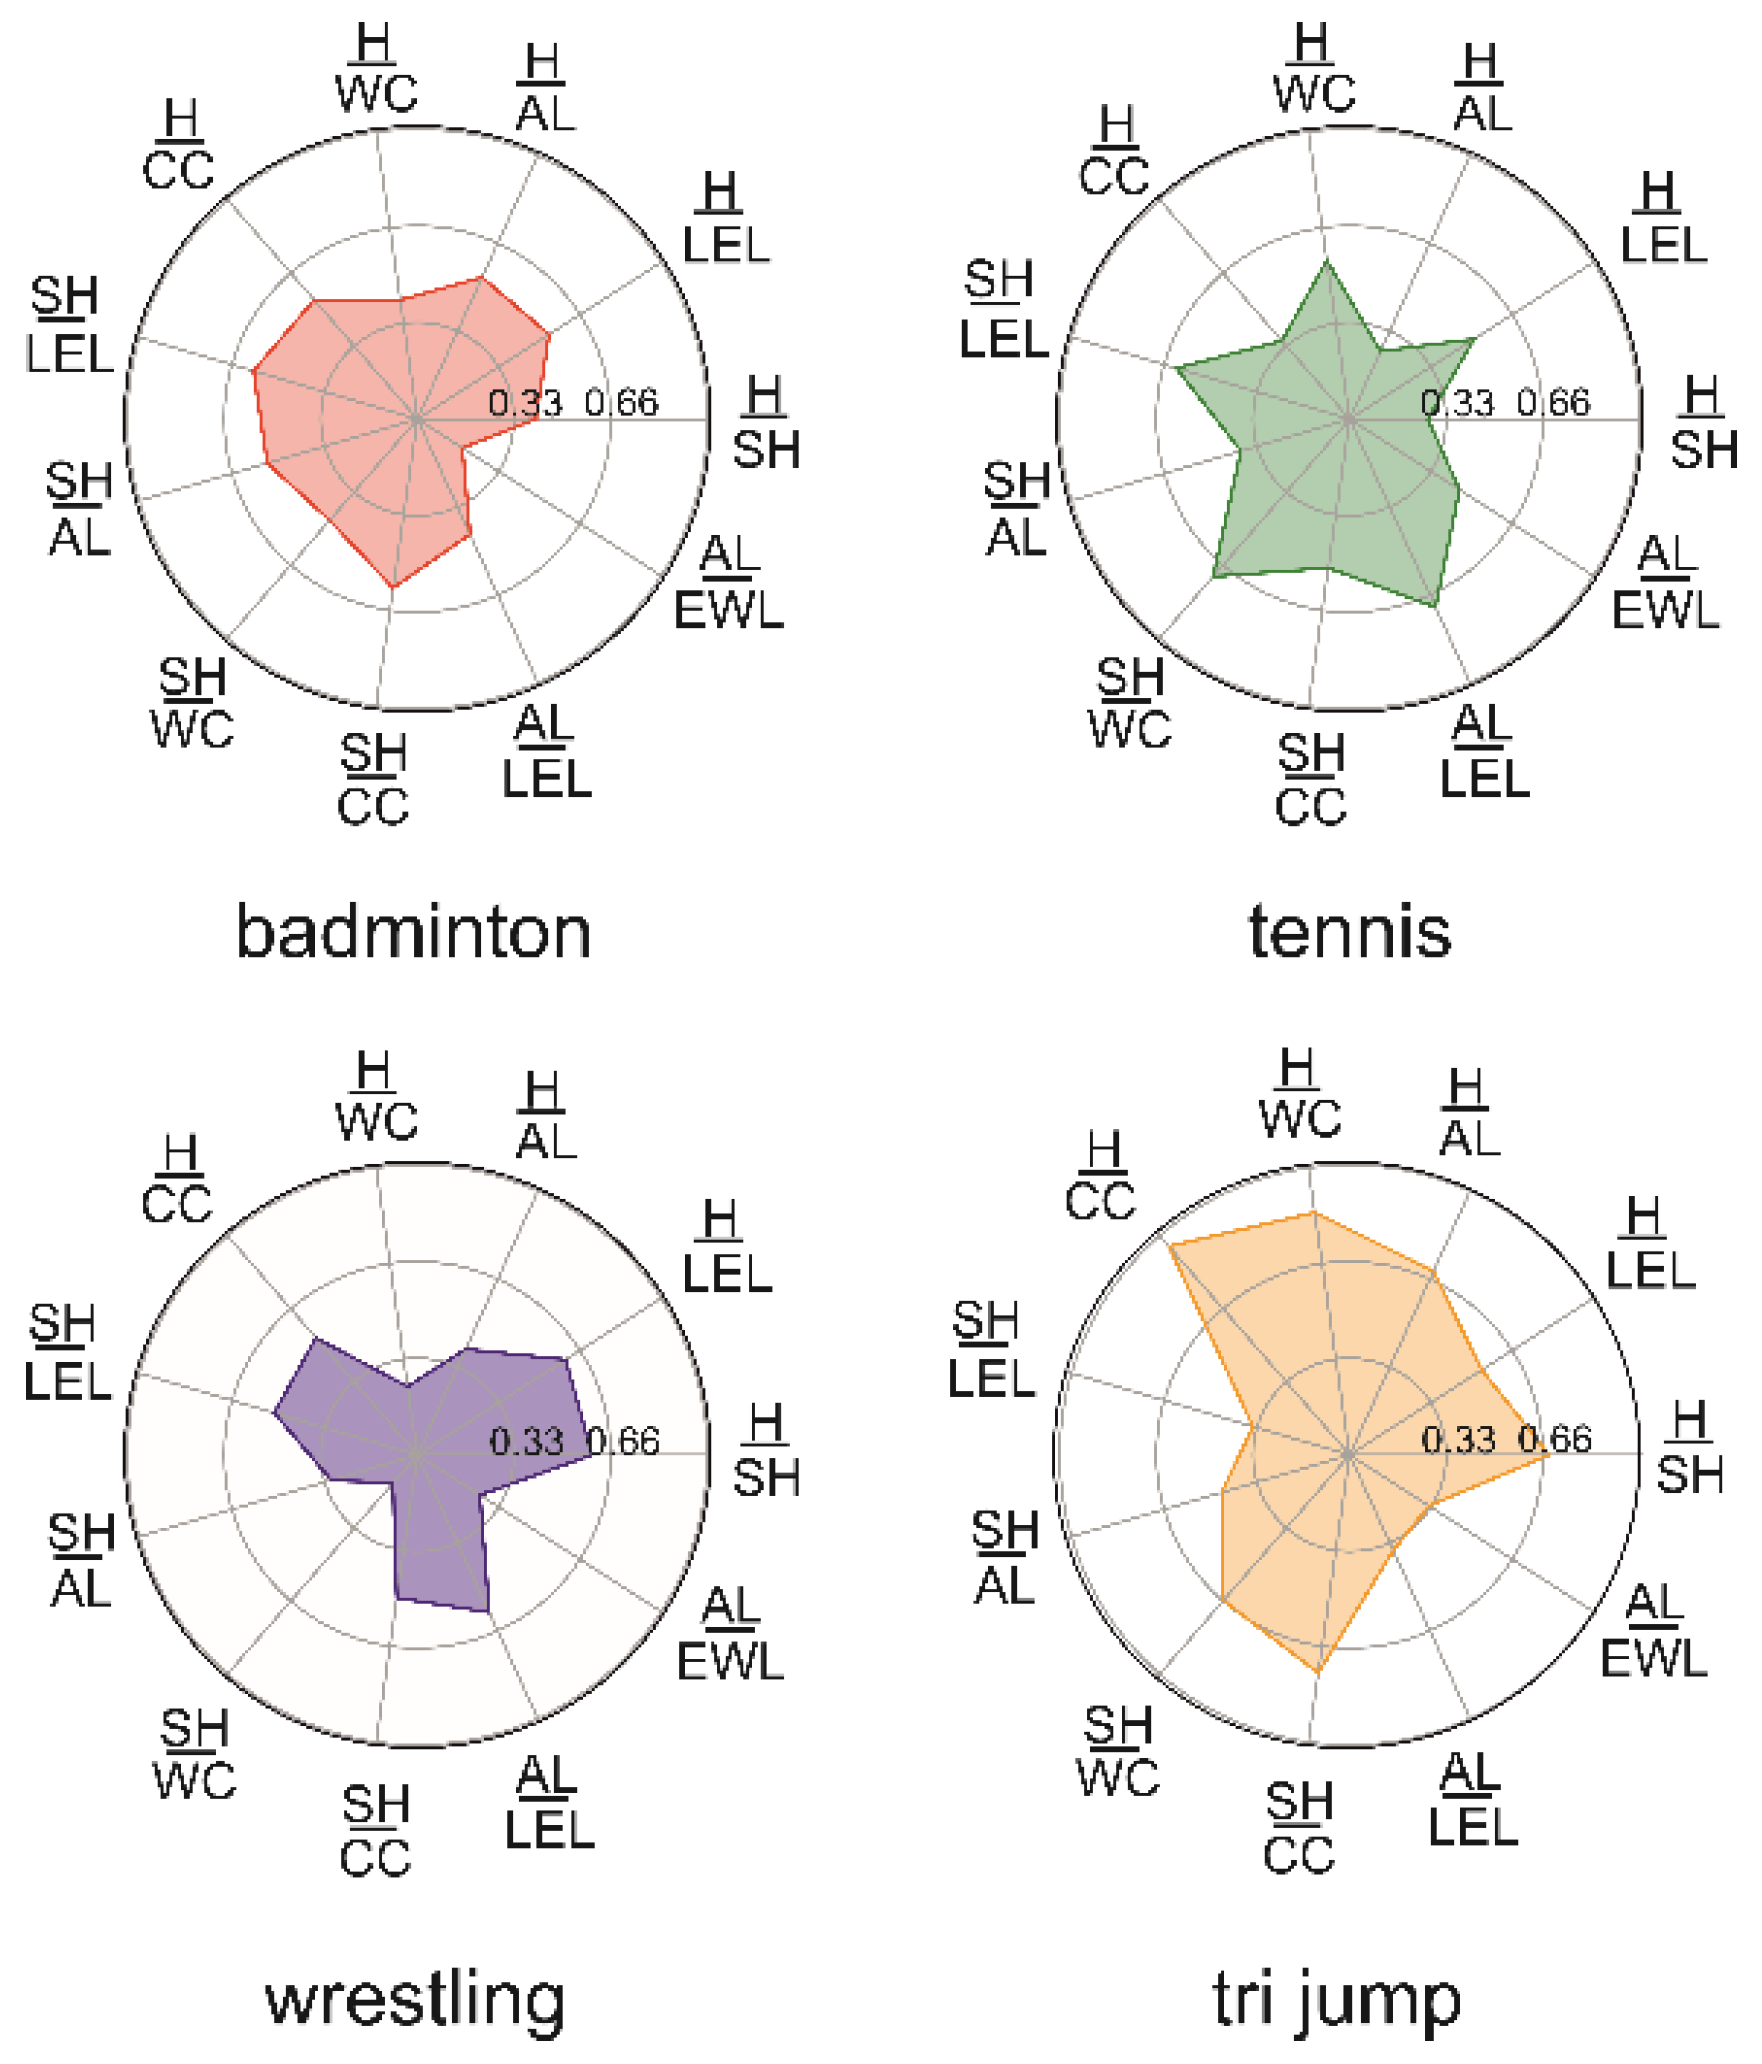
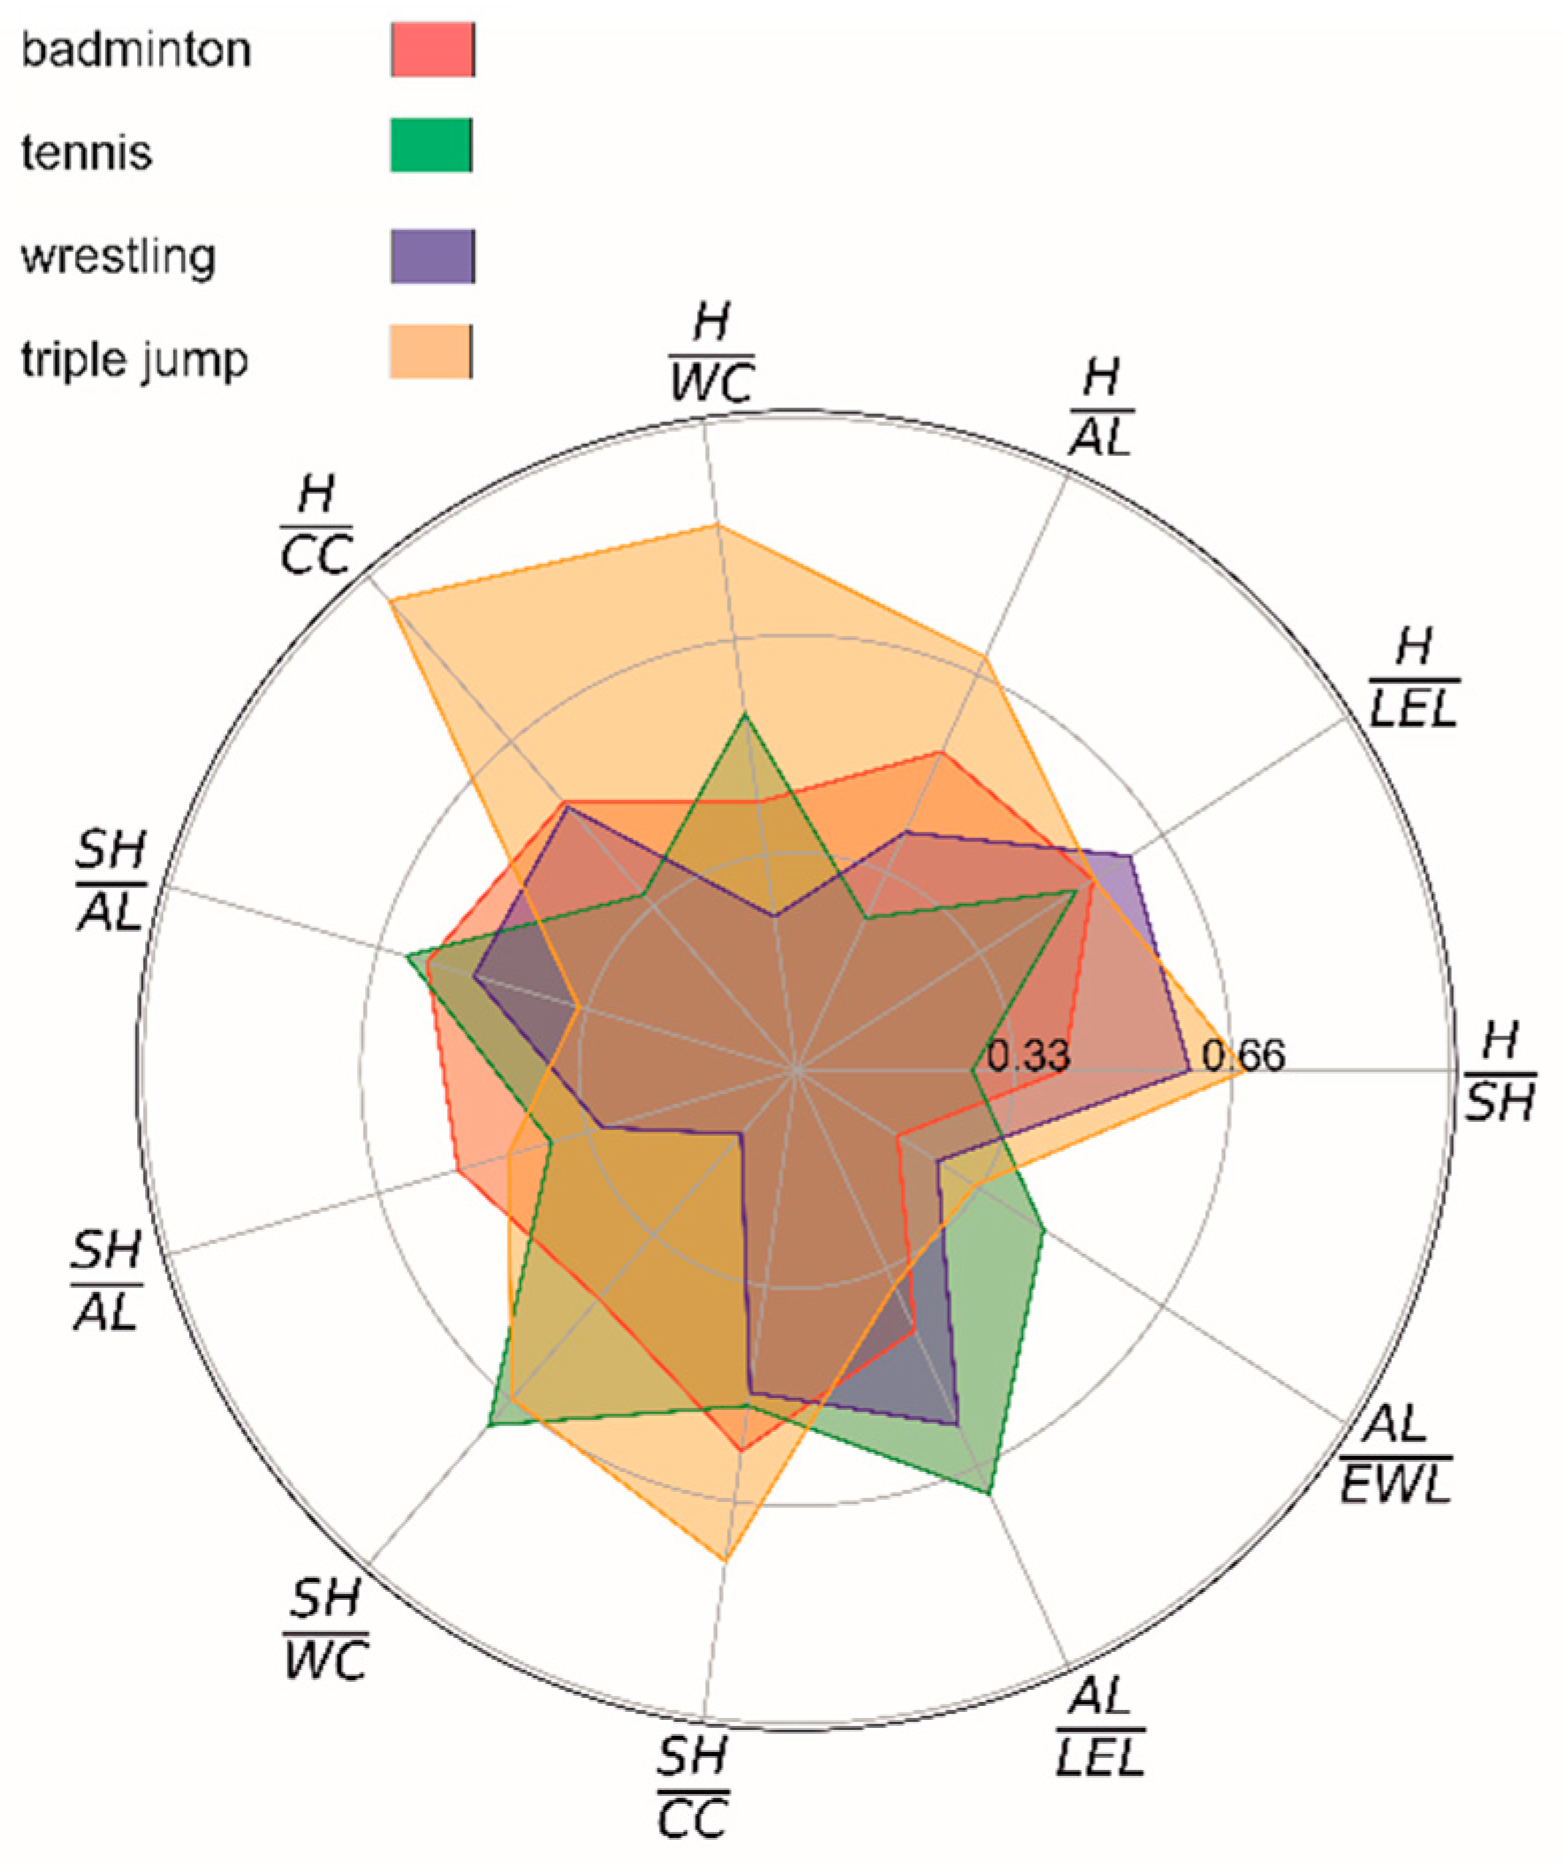
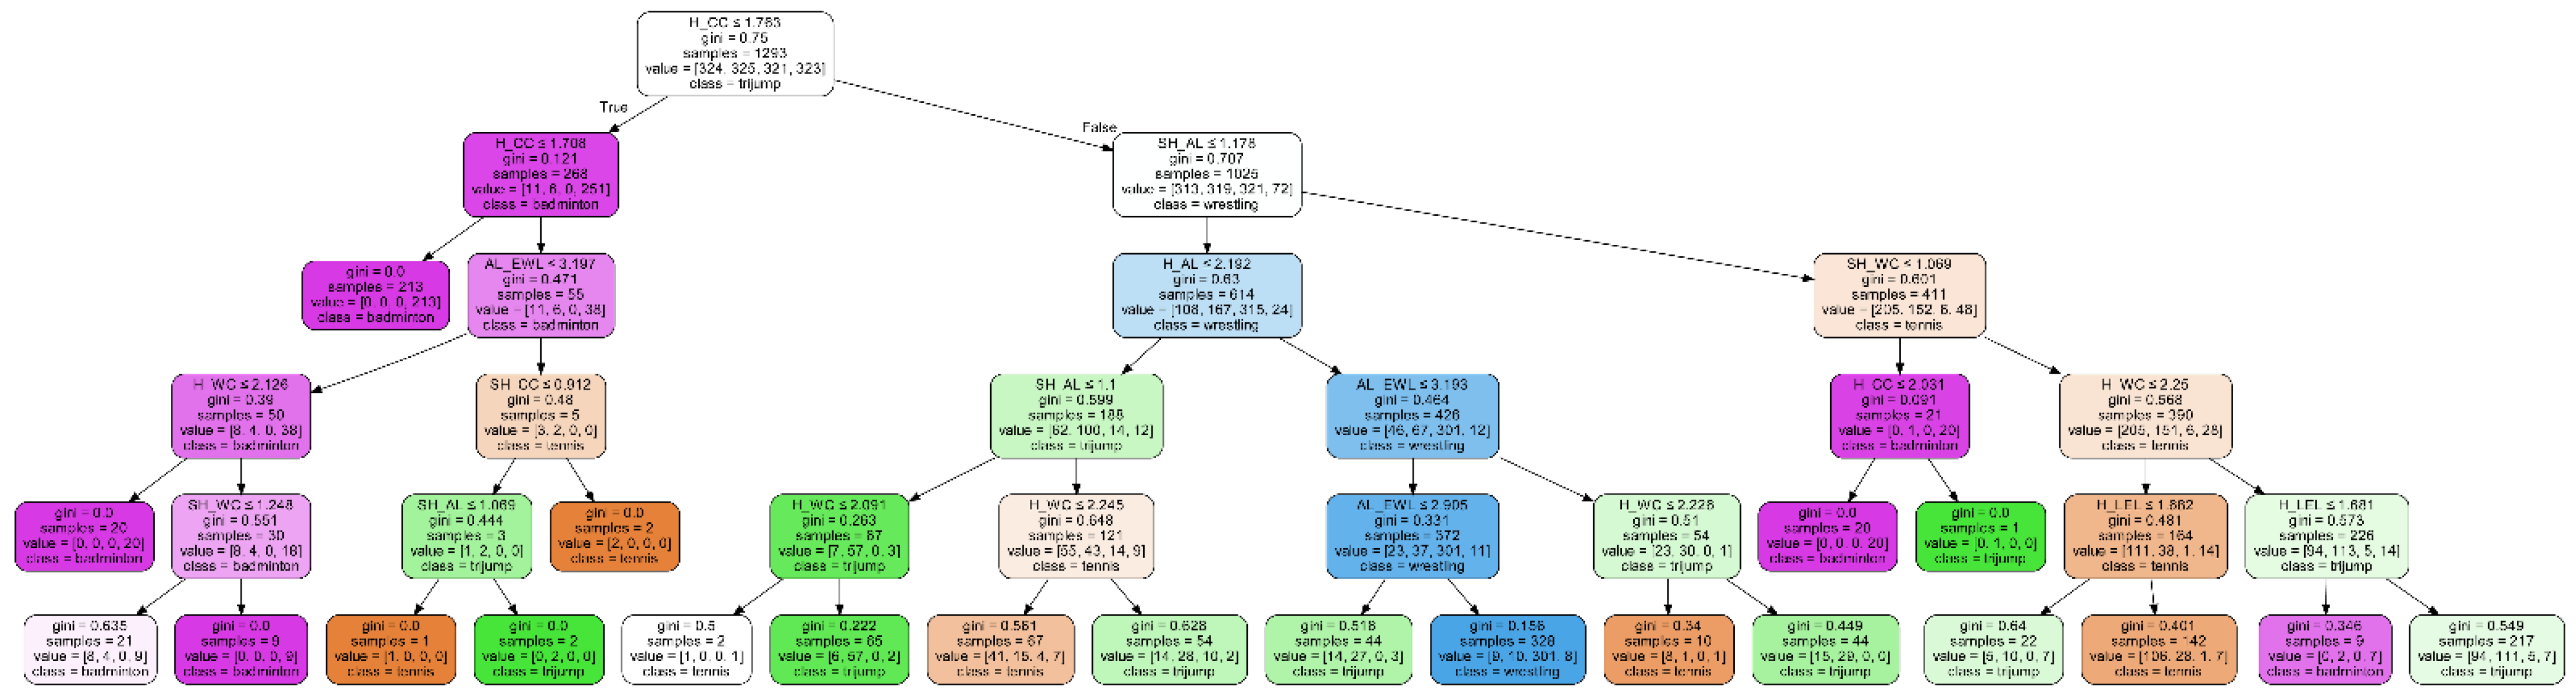
The data used in this study were obtained by reviewing the content of various PubMed-gathered publications on sport-related anthropometric measurements. Of many, only a few provided comparable means and standard deviations for stature, sitting height, leg length, arm length, forearm length, waist circumference, chest circumference, and neck circumference [6,13,21] measured at the same anatomical points.
The model-building procedure consisted of two steps. Step 1: Generation of a random, normally distributed reference sample of N = 500 subjects using the data reported in Table 1. Step 2: Outlier rejection was accomplished by removing values that fell beyond the 95% confidence interval (CI) for a given sample.
The parameters, such as the ratio of height/sitting height (H/SH), height/ length (H/LEL), height/arm length (H/AL), height/waist circumference (H/WC), height/chest circumference (H/CC), sitting height/leg length (SH/LEL), sitting height/arm length (SH/AL), sitting height/waist circumference (SH/WC), sitting height/chest circumference (SH/CC), arm/leg length (AL/LEL), and arm length/forearm length (AL/EWL), were computed and are gathered in Table 2.
A supervised machine learning algorithm, a decision tree classifier [21], verified using a classification tree [22], was used to elucidate the correlation between a sports discipline and specific anthropometric parameters. The parameters used for the DTs for each model were the following: in pairwise comparison, the studied sports disciplines, for example, wrestling and badminton, were hot-encoded as 0 and 1, the maximum search depth was equal to 5, and the loss function that compares the class distribution before and after the split was the Gini impurity [23] for the measurement of impurities [24,25]. A graphical representation of the study scheme is shown in Figure 1. All computations and graphs were completed using the Python programming language.

3. Results

Visual inspection of the relationship between specific sports disciplines and anthropometric parameters was performed using radar graphs, as shown in Figure 2.
The analysis of Figure 2 revealed relative differences between the coefficients studied and showed that the H/CC and SH/CC ratios were greater in TJ than in other sports disciplines. TJ was also defined by the longest leg lengths as a function of SH and H. Wrestlers were defined by a lower ratio of H/WC and SH/WC than that observed in badminton and tennis players and triple jump competitors.
The relative anthropometric differences between the sports disciplines studied are presented in Figure 3.
The framework of anthropometric parameters submitted to the DT for anthropometric differentiation between the sports disciplines studied allowed us to construct Table 3. The corresponding confusion matrices are shown in Figure 4. Table 3 reveals that the ‘anthropometric aptitude’ for wrestling could be predicted with precision between 99% and 95% compared to triple jump, badminton, and tennis. On the other hand, the lowest differentiation was observed with an accuracy of 76% between badminton and tennis players.
The differentiation obtained was reconfirmed using confusion matrices, as shown in Figure 4A–E. The analysis of Figure 4 allowed for differentiation between wrestling and badminton with a true negative (TN) of 91%. The lowest sensitivity of the mathematical model presented was observed between badminton and tennis players, with the TN being equal to 63%.
Analysis of the DF classification trees (Figure 5) exposed the essential characteristics for differentiation between sports disciplines. The primary differentiation factor was H/CC, followed by SH/AL and SH/WC.

4. Discussion

The assessment of anthropometric aptitude for a sports discipline is, among other factors, the cornerstone of sports success. Therefore, this report attempted to cross-correlate anthropometric characteristics with a specific sports discipline. To achieve the objective of this study, we built and tested a mathematical model that employed anthropometric ratios of adult sports competitors practicing wrestling, triple jump, badminton, and tennis. We also postulated that the derived model might be applicable to teenage competitors. This hypothesis is supported by the scientific literature that indicates that body part lengths do not change during the transition to adulthood [26,27,28].
A dearth of consistent studies on the relationship between anthropometric proportions and sports discipline makes it difficult to compare the observations derived in this study with others. Nevertheless, the results of this report showed that wrestling is defined by significantly different anthropometric coefficients than other sports disciplines studied. For example, the H/CC ratio is noticeably lower in wrestlers than in other sports disciplines. Wrestlers were also defined by a lower AL/LEL ratio than that observed in badminton, tennis, and triple jumpers. However, badminton and tennis players were defined by an analogous SH/AL ratio, confirming the previous observations [29,30].
In contrast to the previous report on comparing anthropometric parameters, this study used ratios and not absolute values such as, for example, height [31,32], which, in combination with the employed computation scheme, revealed significant differentiation power in pairwise comparison between studied sports disciplines.

5. Conclusions

The result presented showed that the DT model employing a set of anthropometric ratios could be used successfully to select a subject for a specific sports discipline. Moreover, we assume that if the model database includes anthropometric data from other sports disciplines, we should be able to predict an anthropometric aptitude for other sports disciplines, guaranteeing a significant probability of achieving a high level of sports performance.
The practical implication of the presented reports includes direct application in daily coaching practice. However, for such a purpose, an easily understandable reference table needs to be constructed.
The limitation of this study encompasses the limited number of sports disciplines studied and the forced use of the previously published data without the means of verifying them against the original study.

Author Contributions

Conceptualization, M.W., R.T., and I.Z.Z.; methodology, M.W.; software, I.Z.Z.; data curation, I.Z.Z.; writing—original draft preparation, M.W., R.T., and I.Z.Z.; writing—review and editing, supervision, M.W., R.T., and I.Z.Z. All authors have read and agreed to the published version of the manuscript.

Funding

This research received no external funding.

Informed Consent Statement

Patient consent was waived due to use of publicly available data.

Data Availability Statement

All the data are available upon request.

Conflicts of Interest

The authors declare no conflict of interest.

References

  1. Jayanthi, N.; Pinkham, C.; Dugas, L.; Patrick, B.; Labella, C. Sports specialization in young athletes: Evidence-based recommendations. Sports Health 2013, 5, 251–257. [Google Scholar] [CrossRef] [PubMed] [Green Version]
  2. Cangur, S.; Yaman, C.; Ercan, I.; Yaman, M.; Tok, S. The relationship of anthropometric measurements with psychological criteria in female athletes. Psychol. Health Med. 2017, 22, 325–331. [Google Scholar] [CrossRef]
  3. Faber, M.; Benade, A.J.; van Eck, M. Dietary intake, anthropometric measurements, and blood lipid values in weight training athletes (body builders). Int. J. Sports Med. 1986, 7, 342–346. [Google Scholar] [CrossRef] [PubMed]
  4. Faber, M.; Spinnler-Benade, A.J.; Daubitzer, A. Dietary intake, anthropometric measurements and plasma lipid levels in throwing field athletes. Int. J. Sports Med. 1990, 11, 140–145. [Google Scholar] [CrossRef] [PubMed]
  5. Hencken, C.; White, C. Anthropometric assessment of Premiership soccer players in relation to playing position. Eur. J. Sport Sci. 2006, 6, 205–211. [Google Scholar] [CrossRef]
  6. Kaplan, D.Ö.; Yıldıran, İ. Comparison of Somatotype Characteristics and Anthropometric Proportional Relations of Elite Wrestlers between Styles and Weights. J. Educ. Train. Stud. 2018, 6, 10. [Google Scholar] [CrossRef] [Green Version]
  7. Massarani, F.A.; Canella, D.S.; Brito, F.B.; Citelli, M.; Koury, J.C. Assessment of trends of nutritional status, central obesity, and growth profile using anthropometric measurements in adolescent athletes from a sport-oriented public school. J. Sports Med. Phys. Fit. 2019, 59, 1885–1891. [Google Scholar] [CrossRef]
  8. Montoye, H.J.; E Howard, G.; Wood, J.H. Observations of some hemochemical and anthropometric measurements in athletes. J. Sports Med. Phys. Fit. 1967, 7, 35–44. [Google Scholar]
  9. Neogi, A.; Tiwari, A.; Medabala, T.; Adhikari, S.; Dey, S.K. Somatotype, Body Composition and Anthropometric Profiles of Indian Male Greco-Roman Wrestlers. Int. J. Sport Stud. Health 2019, 2, e93102. [Google Scholar] [CrossRef]
  10. Noh, J.-W.; Kim, J.-H.; Kim, J. Somatotype analysis of freestyle wrestlers compared with nonathletes for health science research. Toxicol. Environ. Health Sci. 2014, 6, 244–250. [Google Scholar] [CrossRef]
  11. Pineau, J.C.; Bouslah, M. Prediction of body fat in male athletes from ultrasound and anthropometric measurements versus DXA. J. Sports Med. Phys. Fit. 2020, 60, 251–256. [Google Scholar] [CrossRef] [PubMed]
  12. Radu, L.-E.; Hazar, F.; Puni, A.-R. Anthropometric and Physical Fitness Characteristics of University Students. Proc. Soc. Behav. Sci. 2014, 149, 798–802. [Google Scholar] [CrossRef] [Green Version]
  13. Raschka, C.; Schmidt, K. Sports anthropological and somatotypical comparison between higher class male and female badminton and tennis players. Pap. Anthropol. 2013, 22, 153. [Google Scholar] [CrossRef] [Green Version]
  14. Santos, D.A.; Dawson, J.A.; Matias, C.N.; Rocha, P.M.; Minderico, C.S.; Allison, D.B.; Sardinha, L.B.; Silva, A.M. Reference values for body composition and anthropometric measurements in athletes. PLoS ONE 2014, 9, e97846. [Google Scholar] [CrossRef] [Green Version]
  15. Sterkowicz-Przybycien, K.L.; Sterkowicz, S.; Zarow, R.T. Somatotype, body composition and proportionality in polish top greco-roman wrestlers. J. Hum. Kinet. 2011, 28, 141–154. [Google Scholar] [CrossRef]
  16. Nudri, W.W.; Ismail, M.; Zawiak, H. Anthropometric measurements and body composition of selected national athletes. Malays. J. Nutr. 1996, 2, 138–147. [Google Scholar]
  17. Singh, K. Anthropometric Measurements, Body Composition and Somatotyping among University Level High and Low Performer Triple Jumpers. Int. J. Cur. Res. Rev. 2017, 9, 44–47. [Google Scholar]
  18. Singh, S.; Singh, K.; Singh, M. Anthropometric measurements, body composition and somatotyping of high jumpers. Braz. J. Biomotricity 2010, 4, 266–271. [Google Scholar]
  19. Smaruj, M.; Orkwiszewska, A.; Adam, M.; Jeżyk, D.; Kostrzewa, M.; Laskowski, R. Changes in Anthropometric Traits and Body Composition over a Four-Year Period in Elite Female Judoka Athletes. J. Hum. Kinet. 2019, 70, 145. [Google Scholar] [CrossRef] [Green Version]
  20. Heydenreich, J.; Kayser, B.; Schutz, Y.; Melzer, K. Total Energy Expenditure, Energy Intake, and Body Composition in Endurance Athletes across the Training Season: A Systematic Review. Sports Med. Open 2017, 3, 8. [Google Scholar] [CrossRef] [Green Version]
  21. Hastie, T.; Tibshirani, R.; Friedman, J.H. The Elements of Statistical Learning. In Data Mining, Inference, and Prediction, 2nd ed.; Springer: New York, NY, USA, 2009; 745p. [Google Scholar]
  22. Buntine, W. Learning Classification Trees. Stat. Comput. 1995, 2, 63–73. [Google Scholar] [CrossRef] [Green Version]
  23. Tan, P.-N.; Steinbach, M.; Karpatne, A.; Kumar, V. Introduction to Data Mining, 2nd ed.; Pearson: New York, NY, USA, 2019; 839p. [Google Scholar]
  24. Fürnkranz, J. Decision Tree. In Encyclopedia of Machine Learning; Sammut, C., Webb, G.I., Eds.; Springer: Boston, MA, USA, 2010; pp. 263–267. [Google Scholar]
  25. Daniya, T.; Geetha, M.; Kumar, K.S. Classification and Regression Trees with Gini Index. Adv. Math. Sci. J. 2020, 9, 1857–8438. [Google Scholar] [CrossRef]
  26. Di Credico, A.; Gaggi, G.; Ghinassi, B.; Mascherini, G.; Petri, C.; Di Giminiani, R.; Di Baldassarre, A.; Izzicupo, P. The Influence of Maturity Status on Anthropometric Profile and Body Composition of Youth Goalkeepers. Int. J. Environ. Res. Public Health 2020, 17, 8247. [Google Scholar] [CrossRef] [PubMed]
  27. Lesinski, M.; Schmelcher, A.; Herz, M.; Puta, C.; Gabriel, H.; Arampatzis, A.; Laube, G.; Büsch, D.; Granacher, U. Maturation-, age-, and sex-specific anthropometric and physical fitness percentiles of German elite young athletes. PLoS ONE 2020, 15, e0237423. [Google Scholar] [CrossRef]
  28. Veldre, G.; Jurimae, T. Anthropometric parameters and sexual maturation in 12- to 15-year-old Estonian boys. Anthr. Anz. 2004, 62, 203–215. [Google Scholar] [CrossRef]
  29. Bonato, M.; Maggioni, M.; Rossi, C.; Rampichini, S.; La Torre, A.; Merati, G. Relationship between anthropometric or functional characteristics and maximal serve velocity in professional tennis players. J. Sports Med. Phys. Fit. 2014, 55, 1157–1165. [Google Scholar]
  30. Elce, A.; Cardillo, G.; Ventriglia, M.; Giordano, C.; Amirante, F.; Mazza, G.; Sangiorgio, A.; Martiniello, L. Anthropometric characteristics of young Italian tennis players. J. Hum. Sport Exerc. 2017, 12, 651–658. [Google Scholar] [CrossRef] [Green Version]
  31. Miftari, F.; Jarani, J.; Stratoberdha, D.; Salihu, H. A Comparison of The Anthropometric Parameters between Basketball Players, Handball Players and Volleyball Players. Eur. J. Phys. Educ. Sport Sci. 2017, 3, 155–164. [Google Scholar] [CrossRef]
  32. Fatahi, A.; Ameli, M.; Sadeghi, H.; Mahmoodi, B. Relationship between anthropometric parameters with vertical jump in male elite volleyball players due to game’s position. J. Hum. Sport Exerc. 2012, 7, 714–726. [Google Scholar] [CrossRef] [Green Version]
Figure 1. Schematic diagram of experimental flow.
Applsci 12 05932 g001
Figure 2. Radar representation of a distribution of anthropometric parameters as a function of sports discipline.
Applsci 12 05932 g002
Figure 3. A comparison of anthropometric parameter distribution as a function of sports discipline.
Applsci 12 05932 g003
Figure 4. Confusion matrix for pair differentiation between sports using DTs. (A) badminton-wrestling, (B) wrestling-tennis, (C) wrestling-triple jump, (D) badminton-triple jump, (E) badminton-tennis, and (F) tennis-triple jump.
Applsci 12 05932 g004
Figure 5. Confusion matrix obtained using DT classification of four sport disciplines.
Applsci 12 05932 g005
Table 1. Literature derived the body part length and circumference ratio for wrestlers, triple jumpers, badminton players, and tennis players. Abbreviations: SH—sitting height, H—body stature (height), AL—arm length, LEL—leg length, EWL—forearm length, WC—waist circumference, CC—chest circumference, MNC—neck circumference. All original measurements are in centimeters.
CodeTriple Jump [21]Wrestling [6]Tennis [13]Badminton [13]
MeanSDMeanSDMeanSDMeanSD
H1802.71718.71854.81824.6
SH911.3924.2963.2962.5
WC781.68410.5804823.8
CC941.810510.7965.2964.3
LEL1021.510271044.21023.5
AL801.2754.4825.4804.4
EWL260.4261.8266274.1
Table 2. Ratio and standard deviation of specific anthropometric parameters defining badminton, tennis, triple jump, and wrestling competitors.
H/SHH/LELH/ALH/WCH/CCSH/LELSH/ALSH/WCSH/CCAL/LELAL/EWL
badminton1.90 ± 0.0581.79 ± 0.0642.29 ± 0.1262.24 ± 0.1041.90 ± 0.0820.943 ± 0.0351.20 ± 0.0641.18 ± 0.0561.00 ± 0.0460.78 ± 0.0443.01 ± 0.443
tennis1.93 ± 0.071.77 ± 0.0732.26 ± 0.142.32 ± 0.1161.94 ± 0.1020.92 ± 0.0411.17 ± 0.0731.20 ± 0.0631.00 ± 0.0570.79 ± 0.0523.26 ± 0.738
triple jump1.99 ± 0.0371.78 ± 0.0342.26 ± 0.042.30 ± 0.0521.93 ± 0.040.89 ± 0.0161.14 ± 0.021.16 ± 0.0250.97 ± 0.020.79 ± 0.0143.03 ± 0.053
wrestling1.86 ± 0.1171.69 ± 0.1282.28 ± 0.1572.07 ± 0.2441.65 ± 0.1630.90 ± 0.0641.23 ± 0.0781.12 ± 0.1320.89 ± 0.0860.74 ± 0.0592.86 ± 0.223
Table 3. The percentage of accuracy of differentiation between different sports disciplines using the DT approach.
WrestlingBadmintonTennis
badminton0.949
tennis0.9510.756
triple jump0.9920.9750.979
Publisher’s Note: MDPI stays neutral with regard to jurisdictional claims in published maps and institutional affiliations.

