Article

Factors Influencing YouTube as a Learning Tool and Its Influence on Academic Achievement in a Bilingual Environment Using Extended Information Adoption Model (IAM) with ML Prediction—Jordan Case Study

1
Computer Information Systems, Faculty of Information Technology and Systems, The University of Jordan, Aqaba 77110, Jordan
2
Information Technology, Faculty of Information Technology and Systems, The University of Jordan, Aqaba 77110, Jordan
3
Department of Management Information Systems, School of Business, The University of Jordan, Aqaba 77110, Jordan
4
Department of Business Management, School of Business, The University of Jordan, Aqaba 77110, Jordan
*
Author to whom correspondence should be addressed.
Appl. Sci. 2022, 12(12), 5856; https://doi.org/10.3390/app12125856
Submission received: 20 May 2022 / Revised: 2 June 2022 / Accepted: 3 June 2022 / Published: 9 June 2022
(This article belongs to the Special Issue ICT and Statistics in Education)

Abstract

:
YouTube usage as a learning tool is evident among students. Hence, the goal of this study is to examine the various factors that influence the use of YouTube as a learning tool, which influences academic achievement in a bilingual academic context. Using survey data from 704 YouTube users from Jordan’s bilingual academic institutes, the research model was empirically validated. Using Amos 20, structural equation modeling (SEM) was performed to assess the study hypotheses. SEM permits concurrent checking of the direct and indirect effects of all hypotheses. Confirmatory factor analysis (CFA) was used to validate the instrument items’ properties in addition to machine learning methods: ANN, SMO, the bagging reduced error pruning tree (RepTree), and random forest. The empirical results offer several key findings: academic achievement (AA) is influenced by the information adoption (IA) of YouTube as a learning tool. Information adoption (IA) is influenced by information usefulness (IU). Source credibility (SC) and information quality (IQ) both influence information usefulness (IU), while information language (IL) does not. Information quality (IQ) is influenced by intrinsic, contextual, and accessibility information quality. This study adds to the literature by empirically testing and theorizing the effects of YouTube as a learning tool on the academic achievement of Jordanian university students who are studying in bilingual surroundings.

1. Introduction

Many students as well as practitioners, researchers, and teachers resort to using YouTube as a learning tool, and many educational and training institutes offer their educational materials through YouTube. YouTube as a platform is available to everyone and anyone. Knowledge seekers may use such a platform to educate themselves as an alternative to face-to-face lectures for many reasons: availability, ease of use, etc., and, in fact, many will adopt such a source as an alternative. The question is what are the factors that influence such adoption of YouTube as a learning tool? This research adopted an expanded information adoption model (IAM) to study this case and used academic achievement as a motivation since [1] studied the factors influencing students’ web-based learning performance during the COVID-19 pandemic. That study stressed the influence of learning anxiety, attitude, and motivation on web-based learning, and found that motivation is the essential factor.
YouTube has many advantages: visual and auditory facilitation of knowledge transfer, it accommodates learning pace, and can be used as a complementary learning resource for educators. YouTube allows interactivity among users [2], enhances the understanding of course content, meets learners’ expectation, encourages self-directed learning, and provides a free source of learning, and users can create, share, comment, and develop their own YouTube content with lifelong learning [3].
The objective of this research is to study the influence of YouTube as a learning tool on academic achievement within the scope of the extended information adoption model that includes information usefulness (credibility, language), quality (intrinsic, contextual, accessibility), and adoption perspectives. Furthermore, the research was conducted in a bilingual academic environment.
The motivation of this research is the following: YouTube is used as a learning tool in many fields from accounting in [4] to anatomy, as in [5]. In fact, according to [6], a study conducted by [5] “examined the application of YouTube videos in an anatomy course and found that 98% of the students utilized YouTube as an online information resource and 92% agreed that the tutorial videos on YouTube were helpful”. As such, the previous study only reflects the importance of and motivation to conduct this research. The credibility of knowledge sought from YouTube is very important [7], in fact some students rely on YouTube as source of information [8,9,10], while others try to measure the cognition value of YouTube education videos [11].
The importance of this research stems from the above findings. Teachers, practitioners, and researchers can use the findings of this research as a support. Teachers can learn more about delivering knowledge by learning from popular YouTube teachers. Educational institutes may share knowledge from each other. Publishing houses may accommodate students’ needs by providing YouTube channels just as in e-textbooks [12]. Researchers and practitioners can even develop web services [13].
The current study makes a significant contribution by examining a proposed model that includes five independent factors, three intermediate factors, four moderating factors, and one dependent factor. As a result, the research attempted to take a comprehensive look at the influencing factors of YouTube. However, to the best of the researchers’ knowledge, no research was found to include all of these factors within one research scope of YouTube, nor has the proposed model been examined in the bilingual context.
The empirical results offer several key findings. Academic achievement (AA) is influenced by information adoption (IA) of YouTube as a learning tool. Information adoption (IA) is influenced by information usefulness (IU). Source credibility (SC) and information quality (IQ) both influence information usefulness (IU), while information language (IL) does not. Information quality (IQ) is influenced by the quality of intrinsic, contextual, and accessible information.
Section 1 of this research paper is a review of the literature that supports the model developed for this study. Following that, the theoretical framework of the model is explained, as well as the development of the hypotheses. After that, the survey design and methodology are explained. Then data analysis, including a descriptive analysis, SEM analysis validation, and prediction, is presented. Following that, there is a discussion of the theoretical and practical implications. Subsequently, the limitations and future research directions are discussed.

2. Literature Review

The study of information adoption is not new; many researchers have studied the idea using many models, frameworks, and theories. The authors of [14] studied the adoption of mobile learning in higher education using task-technology fit (TTF). The author of [15] studied users’ information adoption intention in online health communities using the elaboration likelihood model (ELM). The authors of [16] studied mobile messaging applications’ (MMAs) information adoption using the information adoption model (IAM). The authors of [17] used the IAM to discover the characteristics that influence health information on social media adoption. The authors of [18] studied the adoption of AI in the m-banking arena using task-technology fit (TTF) and stimulus–organism–response (SOR) theory. The authors of [19] studied the behavior of customers towards the usage of social media for purchasing decisions using the technology acceptance model (TAM). The research found that usefulness is the most influential factor. The authors of [20] studied the adoption of mobile payment technology using the TAM and prospect theory. The authors of [21] studied YouTube adoption and its influence on destination visits in India. The study was conducted using the IAM. The authors of [21] found “comprehensiveness, relevance, timeliness, source expertise and attitude as the most significant predictors of a traveler’s destination visit intention through YouTube channel adoption”. Furthermore, in [22] the researchers studied agricultural learning and development in new media’s usability and effectiveness. In [23] the researchers explored the use of social media sites for health professionals’ engagement and productivity in public sector hospitals. In [24] the researchers studied the continuous intention to use mobile on the adoption hotel reservation on travel websites.
As for using YouTube as a learning tool, learning, by definition, is “an activity that individuals engage in with the goal of improving their understanding of an issue and/or their ability to solve problems in life, work and/or study” [25].
The authors of [6] studied the use of YouTube as a learning tool or resource. The study used social cognitive theory (person, environment, and behavior) and included influencing factors such as prior experience, using YouTube as a learning resource, the sociability of YouTube, attitude, and the learning outcome expectation.
To analyze the gap in the field for this research, several published researches were reviewed and was found as follows: Some studies focused on the characteristics of educational content [26,27,28], while others [6] considered the social cognitive perspective; [2] considered the technology–user–environment perspective, and [3] considered the self-directed learning perspective. The author of [28] studied the attitudes, experiences, and perceptions of undergraduate students related to YouTube as an information source to support their studying. The author of [29] studied the impact of social media on adolescents’ abilities, attitudes, communication, education, interactions, personal conduct, social behavior, and skills in Sri Lanka. The source found that YouTube was the most preferred social media (99.23%) among adolescents, and that education was the second preference. The author of [4] studied the effectiveness of podcasting in higher education within financial accounting and found that student performance increased when using video. The authors of [30] studied the impact of social media on academic performance: the researchers found that social media, especially YouTube, is very popular among students as a learning tool. The authors of [31] studied YouTube stickiness within needs, personal, and environment perspective. The study used two theories: Uses and Gratifications Theory (UGT) and social cognitive theory (SCT). The study was conducted in Chinese within a bilingual environment. Hence, the next section presents the theoretical framework of this research and the hypotheses development.

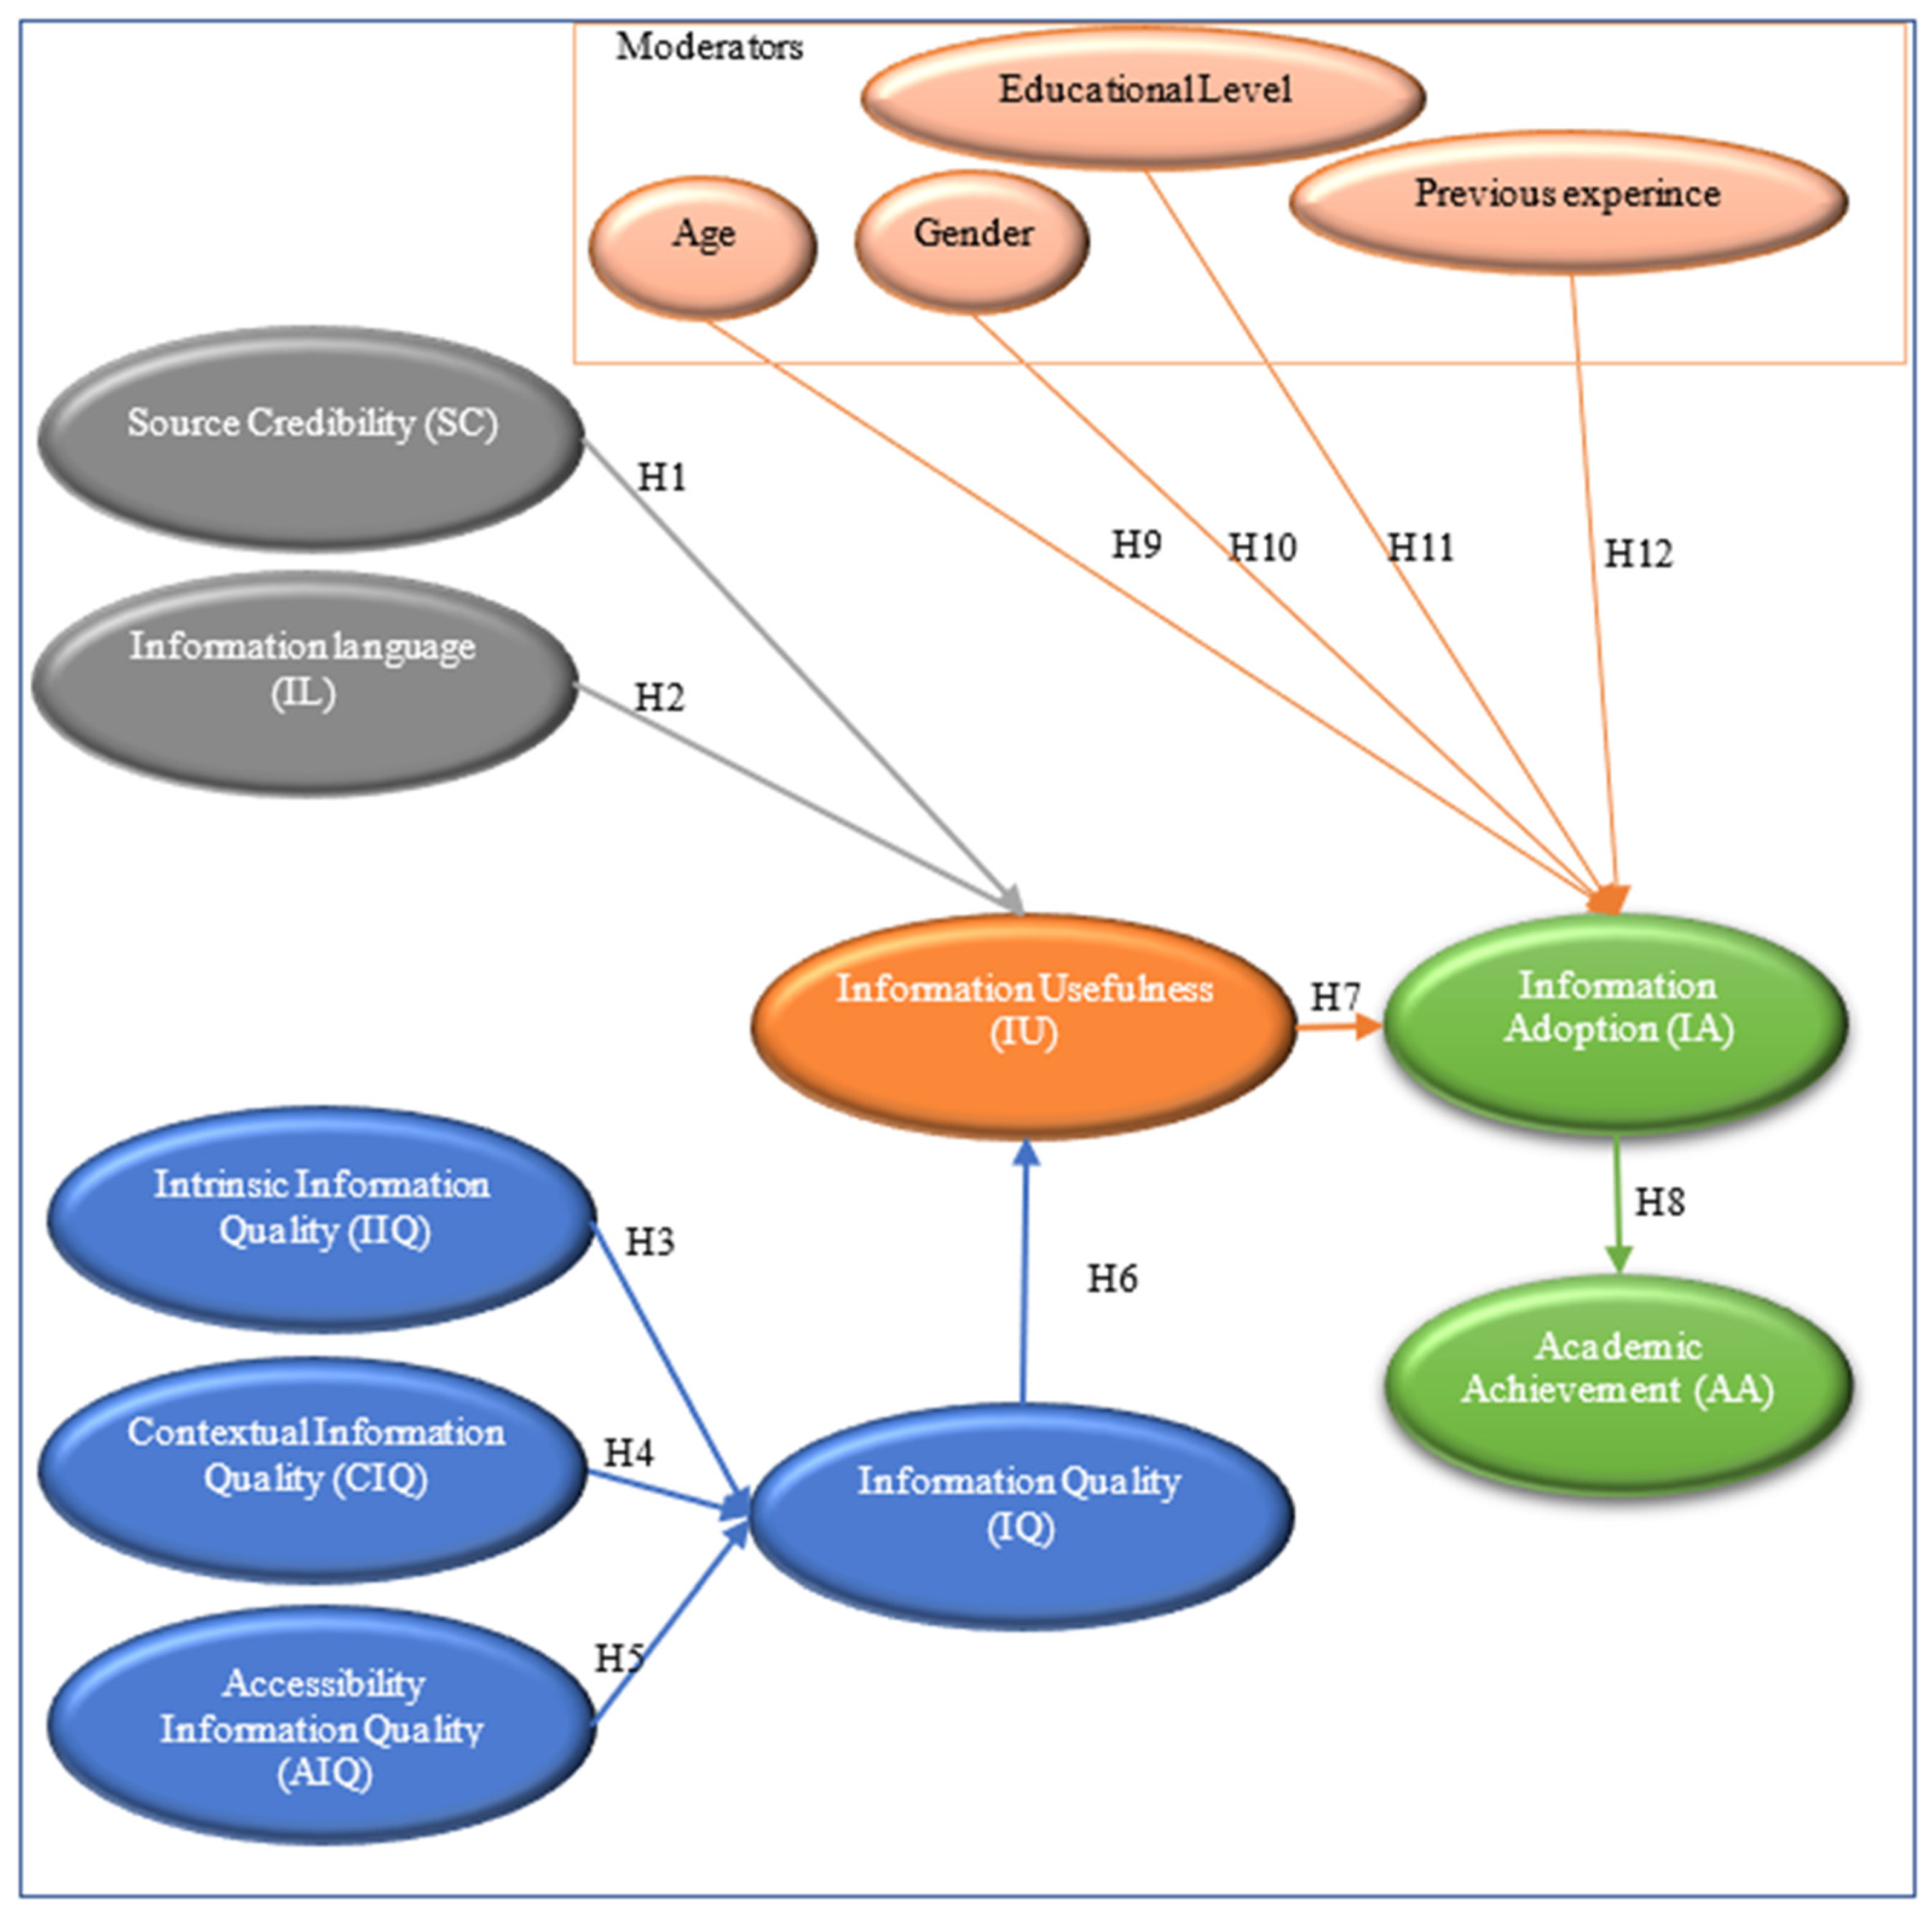
3. Theoretical Framework and Hypotheses Development

The proposed model in Figure 1 is based on the information adoption model (IAM). The IAM, as stated by [32], “can explain how individuals adopt information and thus change their intentions and behaviors within the computer-mediated communication platforms”. The IAM is based on both the TAM and the dual-process model of informational influence, i.e., the elaboration likelihood model (ELM). According to the same source, while quoting others, the TAM’s explanatory power is constrained and concentrates both information systems and the individual usage of a computer while neglecting the social processes.
The ELM, on the other hand, can be used to describe the attitude change from and articulate the process underlying the effectiveness of persuasive communication since the ELM is used to explain how the recipients are affected by message information [33]. Hence, Sussman and Siegal in 2003 developed the IAM, which was published in [34]. The original IAM is composed of two independent variables, argument quality and source credibility, one intermediate variable, information usefulness, and one dependent variable, information adoption, as can be seen in [34]. Argument quality is “the persuasiveness of arguments within an informational message”. [35] and has four dimensions: accuracy, comprehensiveness, relevance, and timeliness [35]. According to [35], source credibility is “the extent to which a message source is perceived to be believable, competent and trustworthy by the recipients”. “Argument quality and source credibility are the two most cited central and peripheral signals” [35].
The proposed model in Figure 1 is composed of independent, intermediate, dependent, and moderating variables. The independent variables are source credibility (SC), information language (IL), intrinsic information quality (IIQ), contextual information quality (CIQ), and accessibility information quality (AIQ). The intermediate variables are information usefulness (IU), information quality (IQ), and information adoption (IA). The dependent variable is academic achievement (AA). The moderating variables are age, gender, education level, and previous experience.
Furthermore, the original IAM model was expanded to include IL, IIQ, CIQ, AIQ, AA, and the moderating variables. The IL was adopted based on the work of [35,36,37,38,39]. The IQ was expanded with IIQ, CIQ, and AIQ based on the work of [34,35,40]. The variable AA was adopted based on the work of [8,9,10,34,35,41,42]. In addition, the model was expanded with moderating variables adopted from [6,43,44,45,46,47,48,49,50,51,52,53]. Furthermore, the model was analyzed, validated, and verified using structural equation modeling (SEM) and confirmatory factor analysis (CFA).

3.1. Hypotheses Development

Source credibility was investigated based on its influence on behavior, perception, and usefulness according to [35] referencing others, i.e., [34,54,55,56,57]. Founded on the previous, the following hypothesis is stated.
Hypothesis 1 (H1).
Source credibility (SC) will positively influence information usefulness (IU).
For information language (IL), the language here refers to the mother language of the receiving end whether the communicated information is written or spoken. There are many studies that have investigated such a factor [35,36,37,38,39]. Based on the previous, the following hypothesis is stated.
Hypothesis 2 (H2).
Information language (IL) will positively influence information usefulness (IU).
According to [40] “information quality refers to users’ subjective judgment of whether the information characteristics meet their own needs and intended use” [40]. “Information quality is an important variable for the success of an information system model and is defined as the fitness of information characteristics for information users” [40] based on [58].
Different studies have measured information quality with different key measures in [59]; the measures were “accessibility, comprehensibility, credibility, and usefulness”. In addition, [60] included accessible, contextual, expressive and intrinsic”, while [7] identified the key measures of information quality as “comprehensiveness, correctness, relativities, and timeliness”. Furthermore, [61] explained that “comprehensiveness and relevance are two key determinants of information quality”. According to [40], information quality is influenced by three factors: intrinsic, contextual, and accessibility information quality. Intrinsic information quality (IIQ) “refers to the quality dimensions originated from the data in its own independent of the user’s perspective and context”. Contextual information quality (CIQ) focuses on the aspect of information quality within the context of the task at hand. Accessibility information quality (AIQ) refers to the quality aspects concerned with accessing distributed information. [40]. Furthermore, according to [34,35,40], the quality influences the usefulness. Hence, the following four hypotheses are developed.
Hypothesis 3 (H3).
Intrinsic information quality (IIQ) will positively influence information quality (IQ).
Hypothesis 4 (H4).
Contextual information quality (CIQ) will positively influence information quality (IQ).
Hypothesis 5 (H5).
Accessibility information quality (AIQ) will positively influence information quality (IQ).
Hypothesis 6 (H6).
Information quality (IQ) will positively influence information usefulness (IU).
Using the elaboration likelihood model (ELM) in [62], discussed that information usefulness (IU) positively influences information adoption and stated that information usefulness (IU) in this research refers to the degree to which users believe that the information in YouTube can have a positive impact on their study/work. The influence of usefulness and adoption in the study that used the IAM is evident in [16]. Furthermore, other studies concluded the same, ref. [34,35] showed the relation between usefulness and adoption. Based on the previous, the following hypothesis is postulated.
Hypothesis 7 (H7).
Information usefulness (IU) will positively influence information adoption (IA).
“Academic performance is defined as students’ ability to carry out academic tasks, and it measures their achievement across different academic subjects using objective measures such as final course grades and grading point average” [8]. The adoption of ICT influencing academic achievement was researched by [8,10,34,35,41,42,63], and even in medicine as in [9]. Hence, the following hypothesis is suggested.
Hypothesis 8 (H8).
Information adoption (IA) will positively influence academic achievement (AA).

3.2. Hypotheses Related to Moderating Factors

This study includes four moderating factors in addition to the nine main factors. According to the model, the moderating factors are age, gender, education level, and previous experience. The expansion of the hypotheses on moderation factors is based on the work of [6,45,46,47,48,49,50,51,52,53].

3.2.1. Hypothesis Related to Age

There are two aspects to age as a moderating factor. One could argue that older people are less accepting of modern technology, whereas younger generations are. On the other hand, older generations may be more willing to accept YouTube because they value such sources more. Many studies, including [47,50,51,52,53], used age as a moderating factor. As a result, the following hypothesis is conceived based on the preceding.
Hypothesis 9 (H9).
Age has a significant moderating effect on information adoption (IA) towards YouTube.

3.2.2. Hypothesis Related to Gender

Another moderating factor that may influence information adoption (IA) suggested by UTAUT is gender. Gender was used as a moderator in many studies [43,44,47,48,49,50,53,64]. As a result, the following hypothesis is proposed.
Hypothesis 10 (H10).
Gender has a significant moderating effect on information adoption (IA) towards YouTube.

3.2.3. Hypothesis Related to Education Level

This study adopts [46,52,65] to suggest the education level of the student (BSc, Master’s, or Ph.D.). As a result, the following hypothesis is developed.
Hypothesis 11 (H11).
Education level has a significant moderating effect on information adoption (IA) towards YouTube.

3.2.4. Hypothesis Related to Previous Experience

Previous experience was used in the research [6] as part of the behavior demonstrated by the student towards using YouTube as a learning tool. Researchers categorized previous experience as weak, good, or excellent. Hence, the following hypothesis is developed based on [6].
Hypothesis 12 (H12).
Previous experience has a significant moderating effect on information adoption (IA) of YouTube as learning tool.

4. Research Methods

For this study to reach its goal of examining the overall effect on the AA of students employing YouTube as learning tool, it examines the effect of the independent variables source credibility (SC) and information language (IL) on the intermediate variable information usefulness (IU), the effect of the independent variables intrinsic information quality (IIQ), contextual information quality (CIQ), and accessibility information quality (AIQ) on information quality (IQ), and the effect of the intermediate variable information quality (IQ) on information usefulness (IU). In turn, we studied the effect of the intermediate variable information adoption (IA) on academic achievement (AA). Furthermore, the study investigated the moderating role of age, gender, education level, and previous experience on information adoption (IA).
As previous investigation on this topic was incomplete, the researchers, after an extensive research study stage, put forward the model introduced in Figure 1, along with the proposed hypotheses above. Furthermore, a questionnaire was utilized and tested, and then, from a sample of convenience, data were accumulated from 704 participants. To clarify and explain the survey design and methods of this research in detail, the following three sections are presented.

4.1. Research Context

Many people consider YouTube to be a source of knowledge. As a result, the key questions are what factors influence students’ information usefulness (IU) in using YouTube as a source of information, and how the entire operation affects academic achievement (AA) while using YouTube. This study was carried out as follows.

4.2. Measurement Items

The construct information quality (IQ) was measured by 3 items, clarity, high quality, and understandability, as recommended by [16,35]. The mediating variable information adoption (IA) was measured using the 5 items ease of understanding, effectiveness of explaining, motivation towards the topic, following their method, and contributed knowledge as recommended by [66]. The mediating variable information usefulness (IU) was measured using the 3 items volubility, informativeness, and helpfulness as recommended by [35]. The construct information language (IL) was measured, as suggested by [35], by 7 items: preferred reading language of newspapers, books, magazines, watching TV, and YouTube. The construct source credibility (SC) was measured by adopting 6 items from [35,66,67], believability, factuality, credibility, trustworthiness, comprehensibility, knowledgeability, and expertise. The construct intrinsic information quality (IIQ) was measured using 5 items suggested by [40,67], including believability, accuracy, and objectivity. The construct contextual information quality (CIQ) was measured using 16 items suggested by [40,68,69], including concise ability, verifiability, representational consistency, understandability, adequateness of information, reputation, and completeness of information. The construct accessibility information quality (AIQ) was measured using 11 items suggested by [40] including availability, relevance including clarity, applicability, strength, accessibility with readiness and ease, and response time. The construct academic achievement (AA) was evaluated by 7 items adopted from [69,70,71].

4.3. Participants and Procedure

A quantifiable method was employed with an investigative and explanatory design. A survey form was utilized to gather data. The purpose was to validate the conceptual model of the research and examine the research hypotheses. The target population of this study consisted of all students that follow the YouTube platform in Jordanian universities, which is a bilingual education environment. A web link to the survey was sent to potential respondents in the period between 15 and 30 March 2022. To make sure students would answer, we asked faculties and colleagues to distribute the survey through e-groups (Facebook, WhatsApp). The survey was prepared in both Arabic and English languages, and 704 social media users were sampled to collect the data, after removing contaminated survey. The content of the questionnaire (constructs and measures) was developed and adopted from prior pertinent studies [16,34,35,40,66,67,68,69,70,71] using a five-point Likert scale ranging from strongly disagree (1) to strongly agree (5). Table A1 in Appendix A, encapsulates the constructs and items used to measure the constructs and mediating factors. The questionnaire included 65 self-reported items related to nine constructs to prove twelve hypotheses.
To validate the construct, the questionnaire content was modified to accommodate Jordanian bilingual education culture, based on the results of a pilot study and feedback from six professional academician faculty members in this field. The survey instrument was reviewed by a panel of six academician faculty members in the areas of information technology, e-learning, and education to guarantee face validity. Subsequently, various items were amended, and the modified survey was used for pilot testing on college students in Jordan. Indeed, a pretest was conducted with twenty-five students to check the comprehensibility of the questions. Some amendments were made, resulting in a clear and comprehensible survey questionnaire.
As shown in Table 1, the demographic profile of the respondents for this research exhibited that they were typically females in gender, between 18 years old and less than 34 years old in age, the majority held bachelor’s and master’s degrees in education level, and had excellent previous experience in using YouTube.

5. Data Analysis and Results

In this section, the statistical results are presented. First, the descriptive analysis is presented to show the demography of the respondents. Second, the structural equation model (SEM) analysis will be presented to validate and verify the study hypothesis with the measurement model and structural model. Third, the effect of the moderating factors is analyzed, and fourth, machine learning techniques used to validate and predict the different factors are presented.

5.1. Descriptive Analysis

The mean and standard deviation were estimated to describe the responses and thus the attitude of the respondents toward each question asked in the survey. While the mean represents the data’s central tendency, the standard deviation measures their dispersion and provides an index of the data’s spread or variability [72,73]. In other words, a small standard deviation for a set of values indicates that these values are clustered closely around or close to the mean; a large standard deviation indicates the opposite. The level of each item was determined by the following (1)
Level = highest point in Likert scale lowest point in Likert scale the number of the levels used = 5 1 5 = 0.80
Hence, producing the following lookup Table 2 of values.
As presented in Table 3, the data analysis results show that all research variables were ranked from “moderate” to “very high”. The independent variables contextual information quality (CIQ) and accessibility information quality (AIQ) and the mediating variable information usefulness (IU) all ranked as “very high”, while five other variables ranked as “high”, namely: the independent variables source credibility (SC) and intrinsic information quality (IIQ), the mediating variables information quality (IQ) and information adoption (IA), and the dependent variable academic achievement (AA). On the other hand, the independent variable information language (IL) ranked as “moderate”. As such, this reflects the respondents’ feelings regarding the importance of some variables. Accessibility information quality (AIQ) ranked the highest with a mean (4.3102) that reflects that AIQ is more important than the other factors. AIQ was followed by CIQ and AIU.
Table 4 exhibits the mean, standard deviation, level, and scores the order for each item belonging to a construct. The highest item in the construct source credibility (SC) is SC3, which directly asks the credibility question. The highest item in the construct information language (IL) was LI3, which asks the respondents about their reading language. The highest item in the construct intrinsic information quality (IIQ) was IIQ5, which asks the responders about the impartially of the YouTube channels utilized by the responder. The highest item in the construct contextual information quality (CIQ) was CIQ5, which asks the responders about the clarity and easiness to understand the topic. The highest item in the construct accessibility information quality (AIQ) was AIQ1, which asks the responders about the availability 24/7 of the channel. The highest item in the construct information usefulness (IU) was IU1, which asks the responders about the evaluability of information provided by YouTube channels. The highest item in the construct information quality (IQ) was IQ1, which asks the responders about the high-quality information. The highest item in the construct Information adoption (IA) was IA1, which asks the responders about the easiness to understand the topic through YouTube. The highest item in the construct academic achievement (AA) was AA1, which asked the responders about how useful YouTube was to the student.

5.2. SEM Analysis

In this section, the SEM analysis was utilized to test the research hypotheses. The paper presents a measurement model using confirmatory factor analysis (CFA) first, the second to be used is the structural model, and the third are the moderation effects.

5.2.1. Measurement Model

CFA was used to evaluate the properties of the instrument items. In fact, the measurement model signifies how hypothetical constructs are measured in terms of the observed variables and personifies the validity and reliability of the observed variables’ responses for the latent variables as in [74,75,76,77]. Table 5 presents the factor loadings, Cronbach alpha, composite reliability, and average variance extracted (AVE) for the variables. All the indicators of the factor loadings exceeded 0.50, except for certain items, specifically: IL3 = 0.110, and IL6 = 0.044. The aforementioned items were eliminated, thus constituting evidence of convergent validity as in [74,78]. While the measurement reached convergent validity at the item level because all the factor loadings were above 0.50, all the composite reliability values exceeded 0.60, demonstrating a high level of internal consistency for the latent variables. Additionally, since each value of AVE exceeded 0.50, as in [74,79], the convergent validity was proved.
Additionally, as seen in Table 6, to provide discriminant validity [75], intercorrelations between constructs–pairs are less than the square root of the AVE estimates. Subsequently, the measurement results indicated that this study had adequate levels of convergent and discriminant validity. According to Table 6, the least correlated constructs are SC and IL with (0.714), while the most correlated were SC with AIQ, SC with IQ, and SC with IA (0.900, 0.923, 0.921), respectively. Other correlations were above 0.800 and below 0.900. Hence, there is a high correlation between the source credibility (SC) and information quality (IQ) and information adoption (IA). On the other hand, the least correlated according to this research finding is credibility with information language (IL).

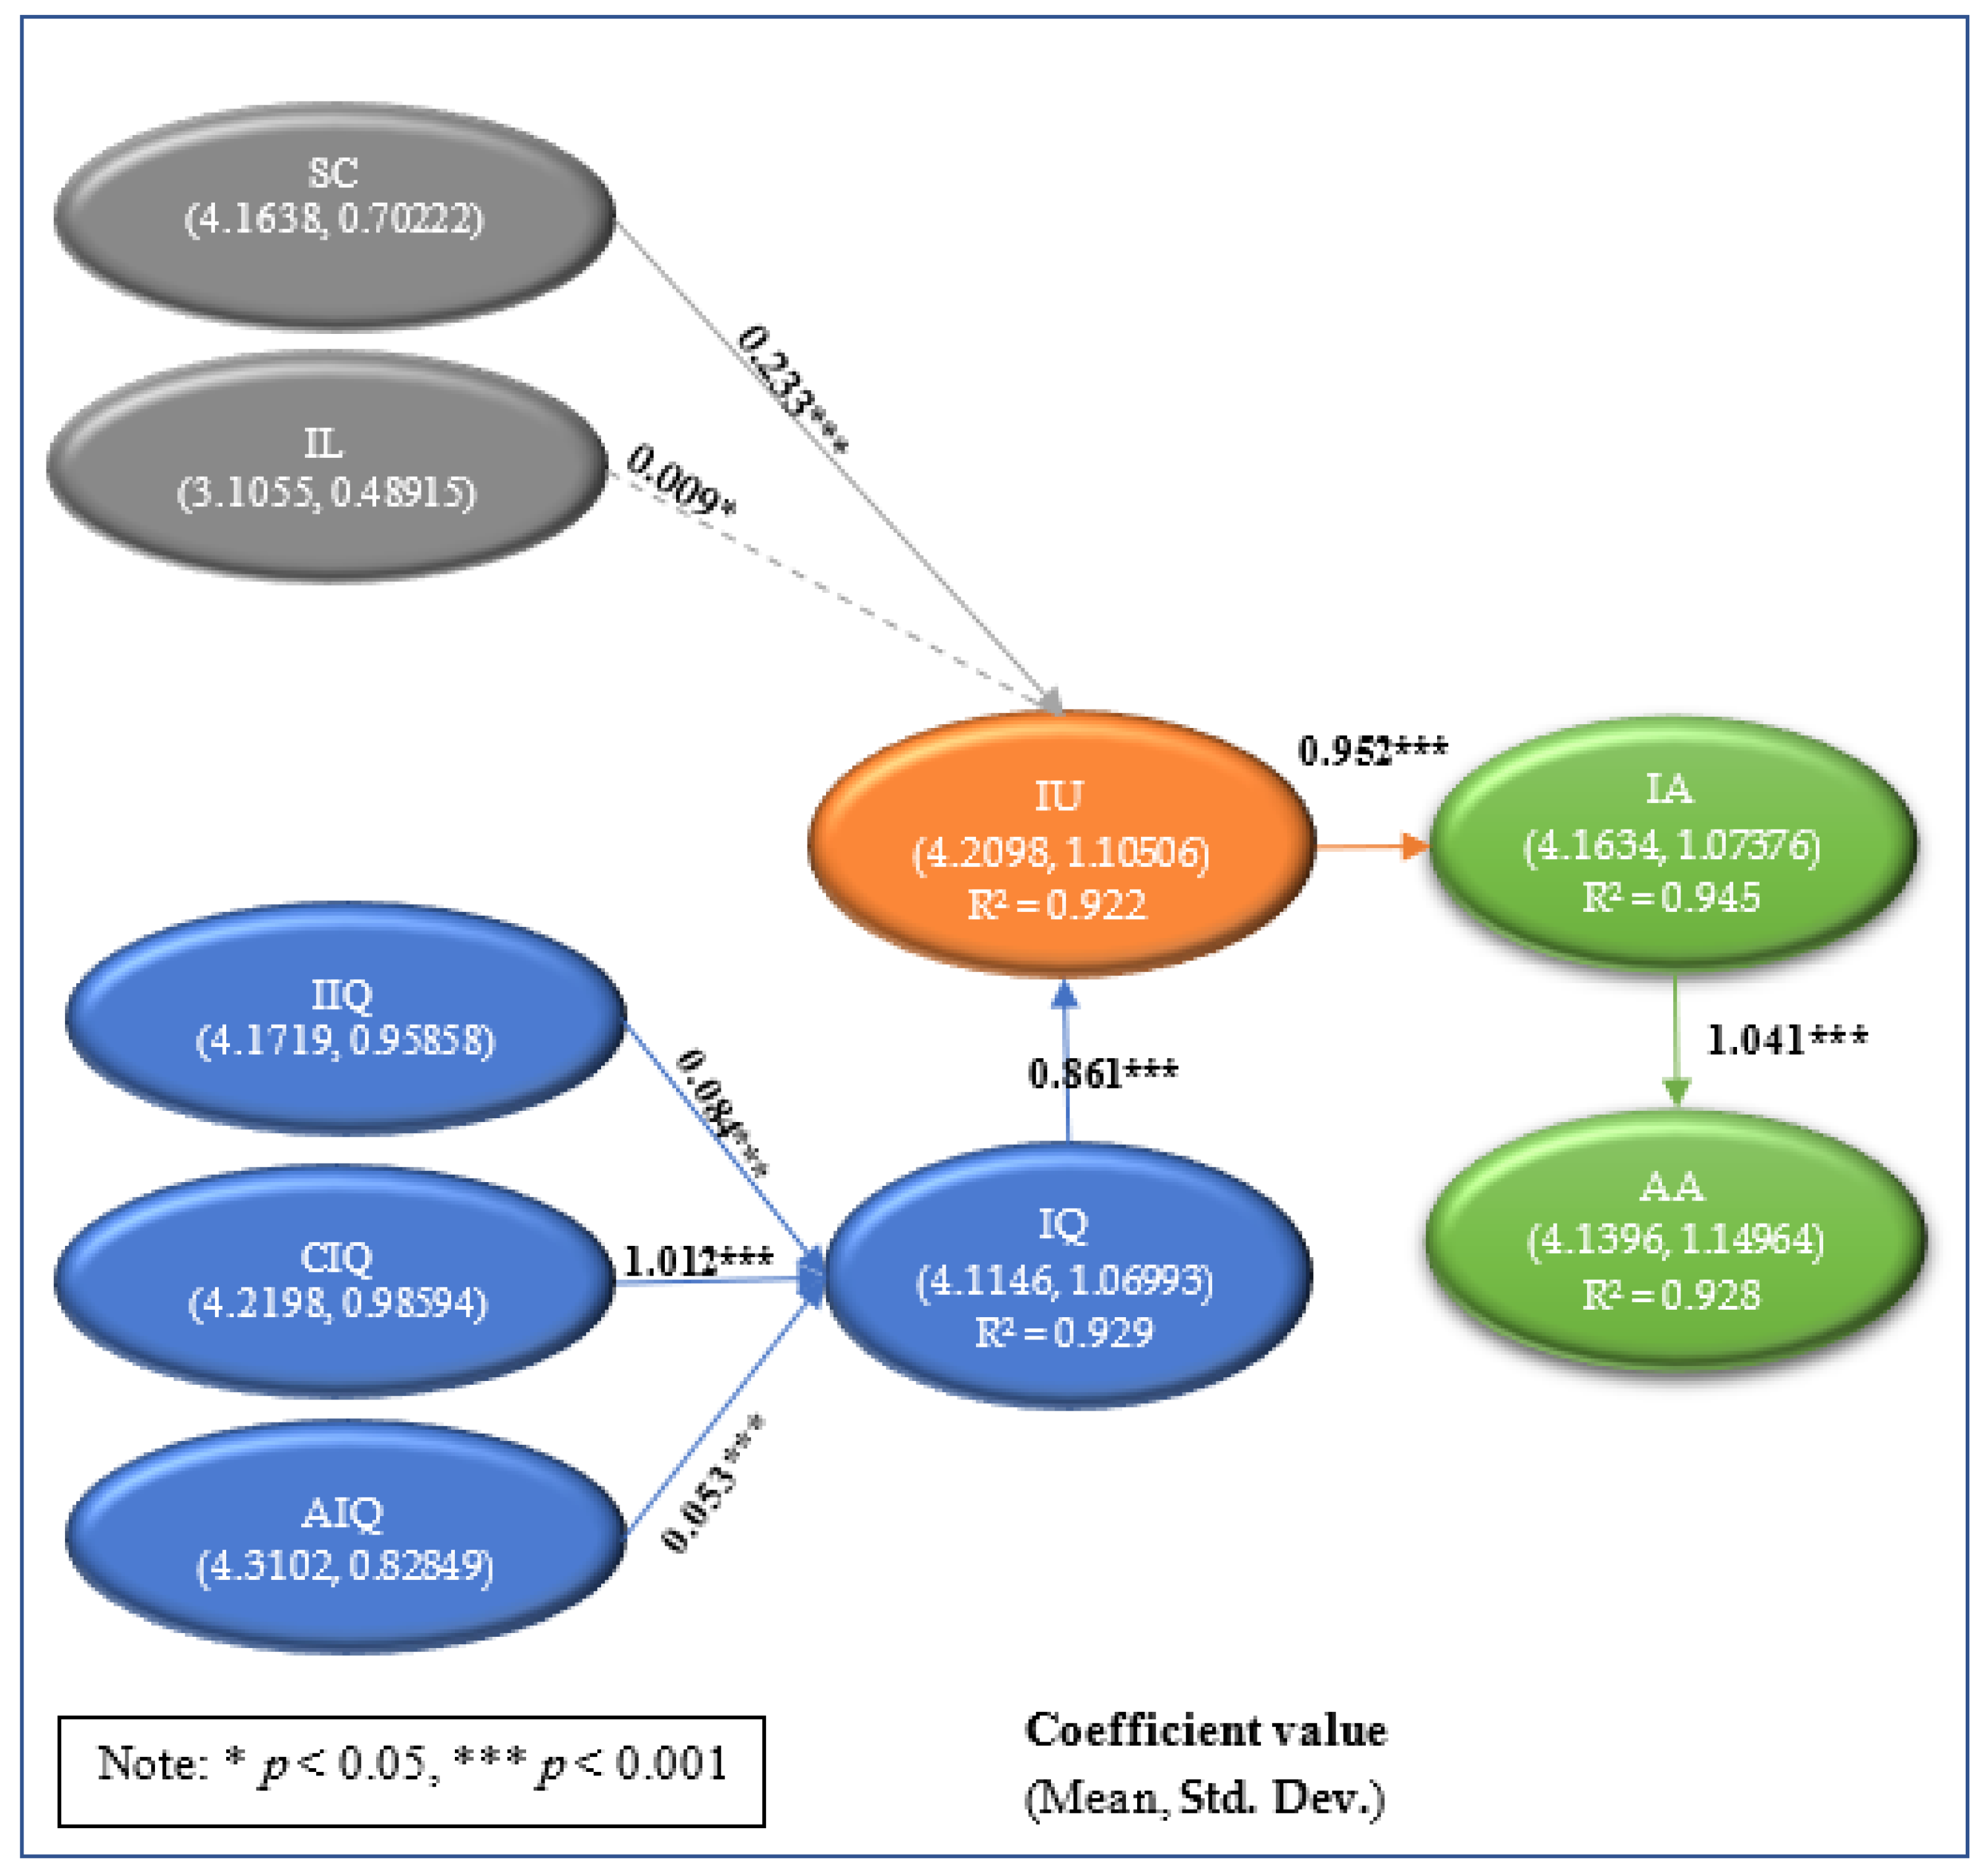
5.2.2. Structural Model

Structural equation modeling (SEM) using Amos 20 was performed to test the study hypotheses. SEM allows simultaneous testing of all hypotheses including direct effects. The results of the direct effects indicate that while source credibility (SC) impacted information usefulness (IU), information language (IL) did not. Consequently, while H1 was accepted, H2 was not supported. Moreover, intrinsic information quality (IIQ), contextual information quality (CIQ), and accessibility information quality (AIQ) impacted information quality (IQ); thus, H3, H4, and H5 were supported. The results found that information quality (IQ) impacted information usefulness (IU), and the latter had an effect on information adoption (IA), and, in turn, on academic achievement (AA); consequently H6, H7, and H8 were supported.
Moreover, the coefficient of determination (R2) for the research endogenous variables IQ, IU, IA, and AA were 0.929, 0.922, 0.945, and 0.928, respectively, which suggests that the research model does account for the variation. Table 7 below presents an abstract of the tested hypotheses.
To reflect the results shown in Table 3 and Table 7 onto the proposed model, Figure 2 was developed to show with a graph and numbers the results of this research. The figure shows the mean and standard deviation for each construct. Moreover, it reflects the value of coefficient of determination (R2) for each intermediate construct and the coefficient value for each relation.

5.3. Moderation Effects

Hypotheses H9, H10, H11, and H12 argued that there is a significant difference in the respondents’ information adoption (IA) due to age, gender, education level, and previous experience. An independent samples t-test was utilized in order to explore if there were any significant differences in the respondents’ information adoption (IA) that can be attributed to gender. Additionally, the ANOVA test was employed to examine if there were any significant differences in the respondents’ information adoption that could be attributed to age, education level, and previous experience. The results of the t-test, displayed in Table 8, indicate that there is a significant difference in the information adoption that can be attributed to gender, that goes for males more than females.
In addition, the outcomes of the ANOVA test, presented in Table 9, indicate that there is a significant difference in the respondents’ information adoption (IA) supportive of age, education level, and previous experience.
However, Table 10 provides the statistical significance of the differences between each pair of groups for age. As observed in Table 10, the five groupings (i.e., 18 to less than 34, 34 to less than 44, 44 to less than 54, 54 to less than 64, and 64 and over) were statistically different from one another.
Table 11 shows the statistical significance of the differences between each pair of groups for education level. The three groups (i.e., bachelor, master, and PhD) were statistically different from each other.
Table 12 presents the statistical significance of the differences between each pair of groups for previous experience. The three groups (i.e., low, good, and excellent) were statistically different from one another.
This section presented the moderation effects reflected in H9, H10, H11, and H12. The hypothesis H10 pertaining to gender was validated using a t-test. Additionally, ANOVA analysis and multiple comparison analysis validated the influence of age (H9), education level (H11), and previous experience (H12) on information adoption (IA).

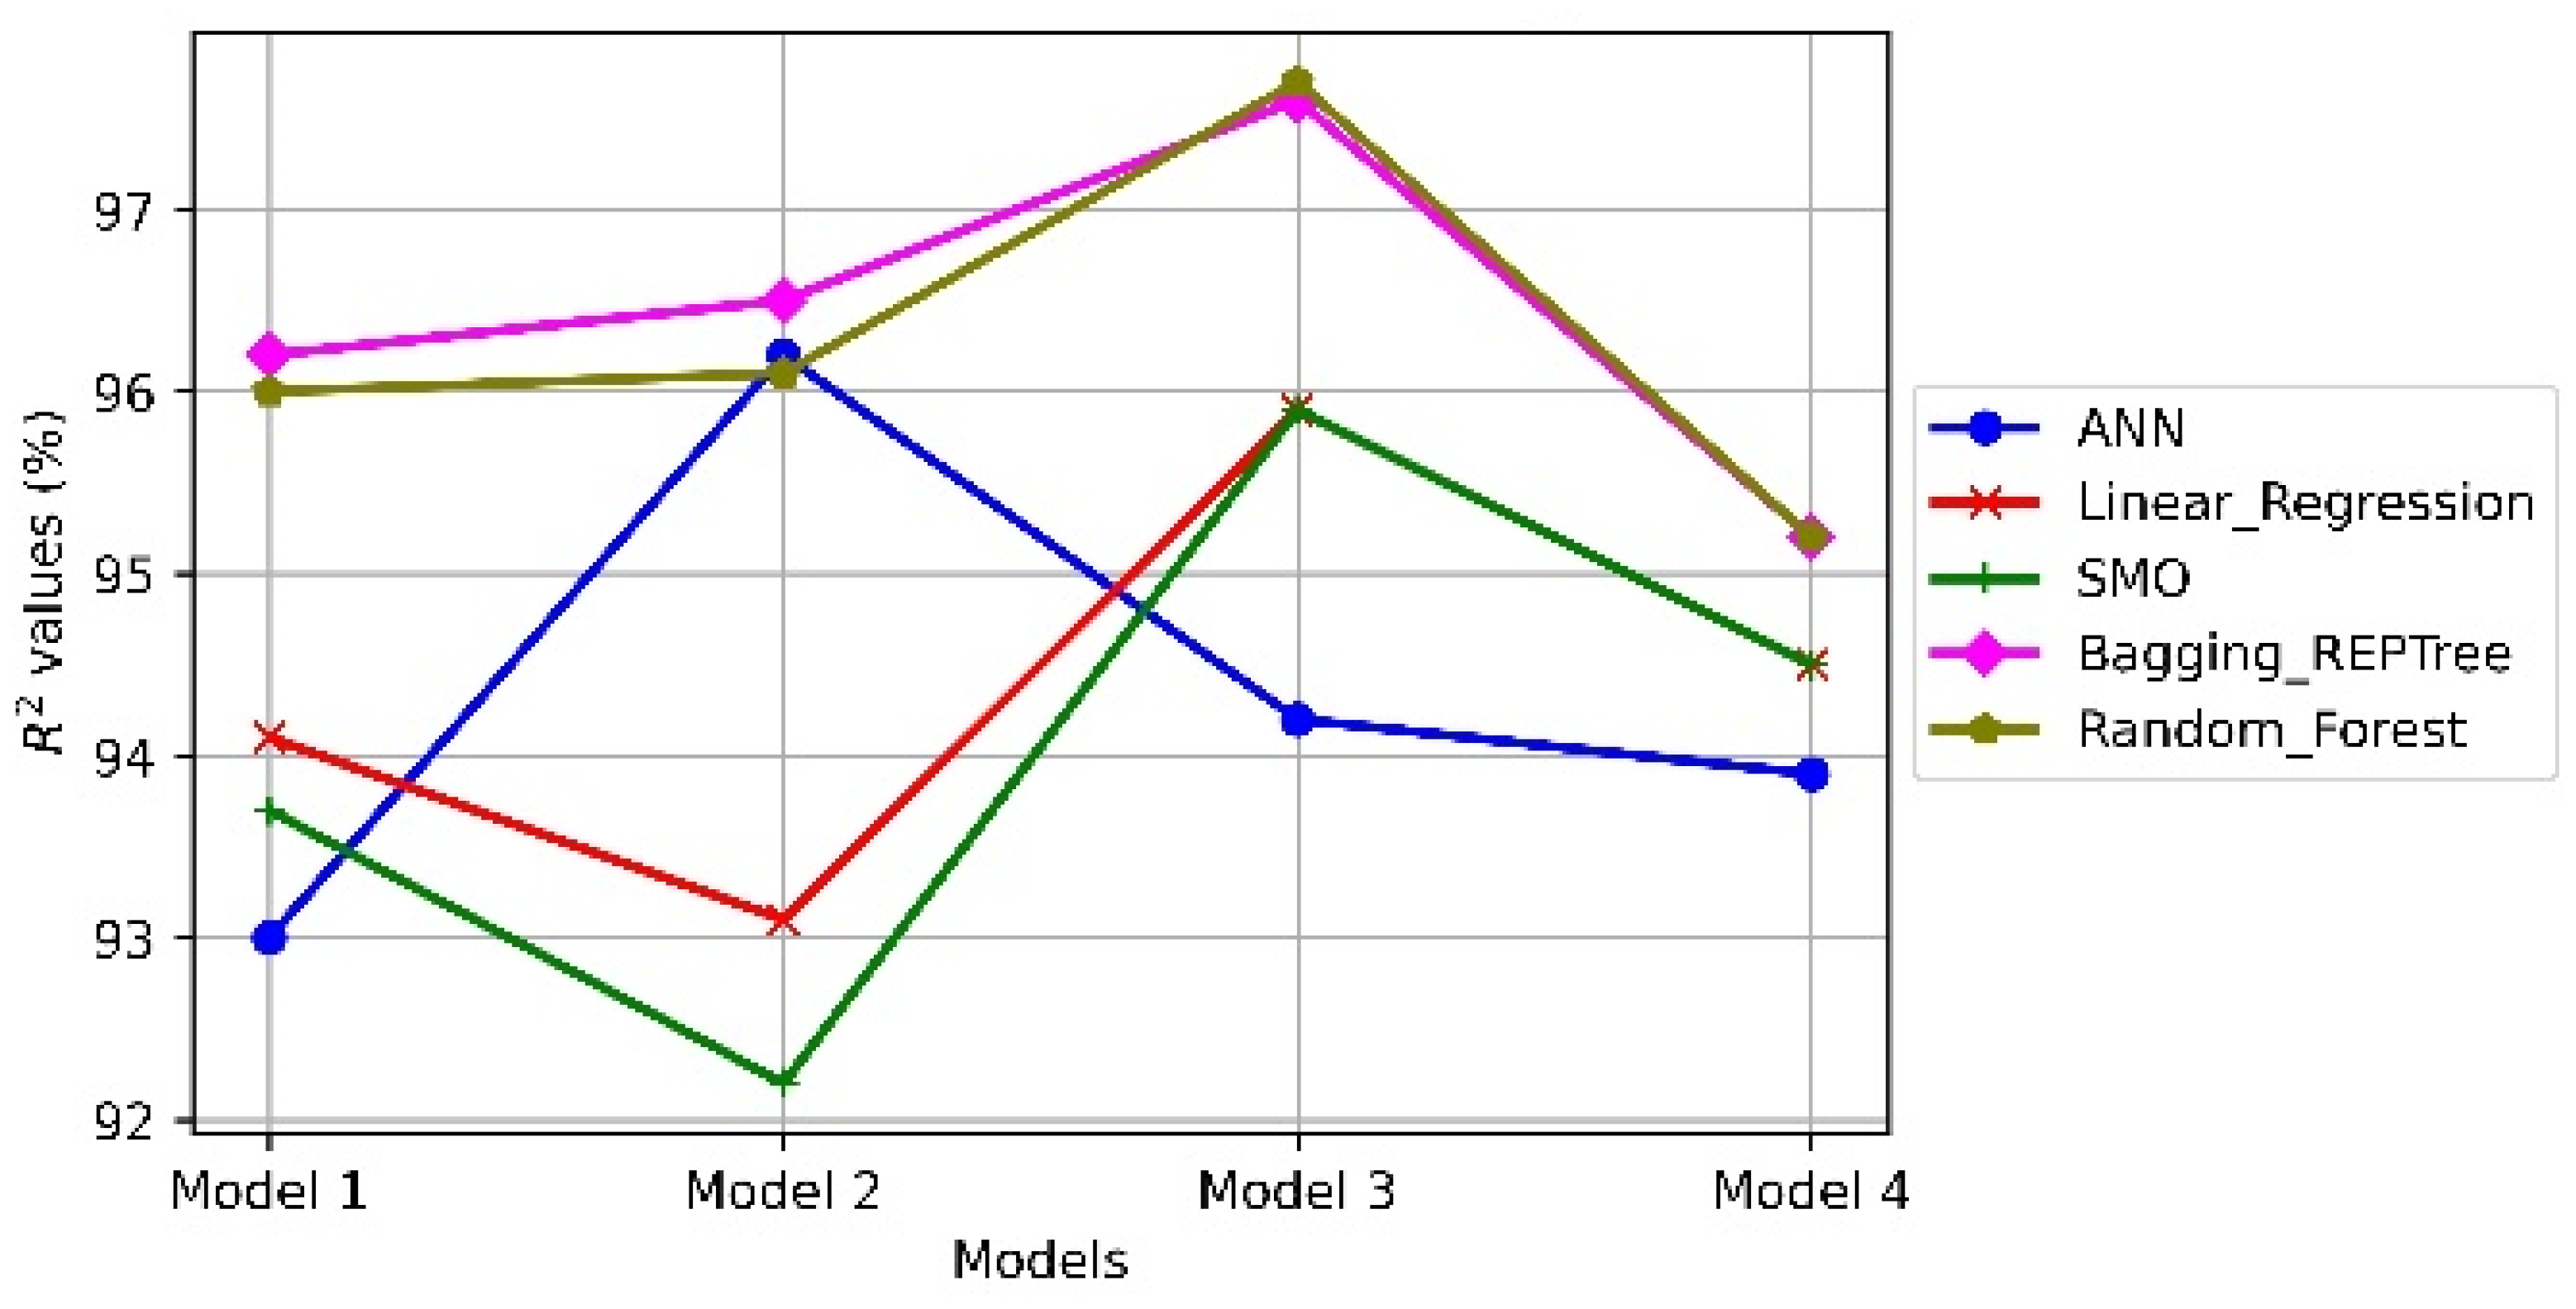
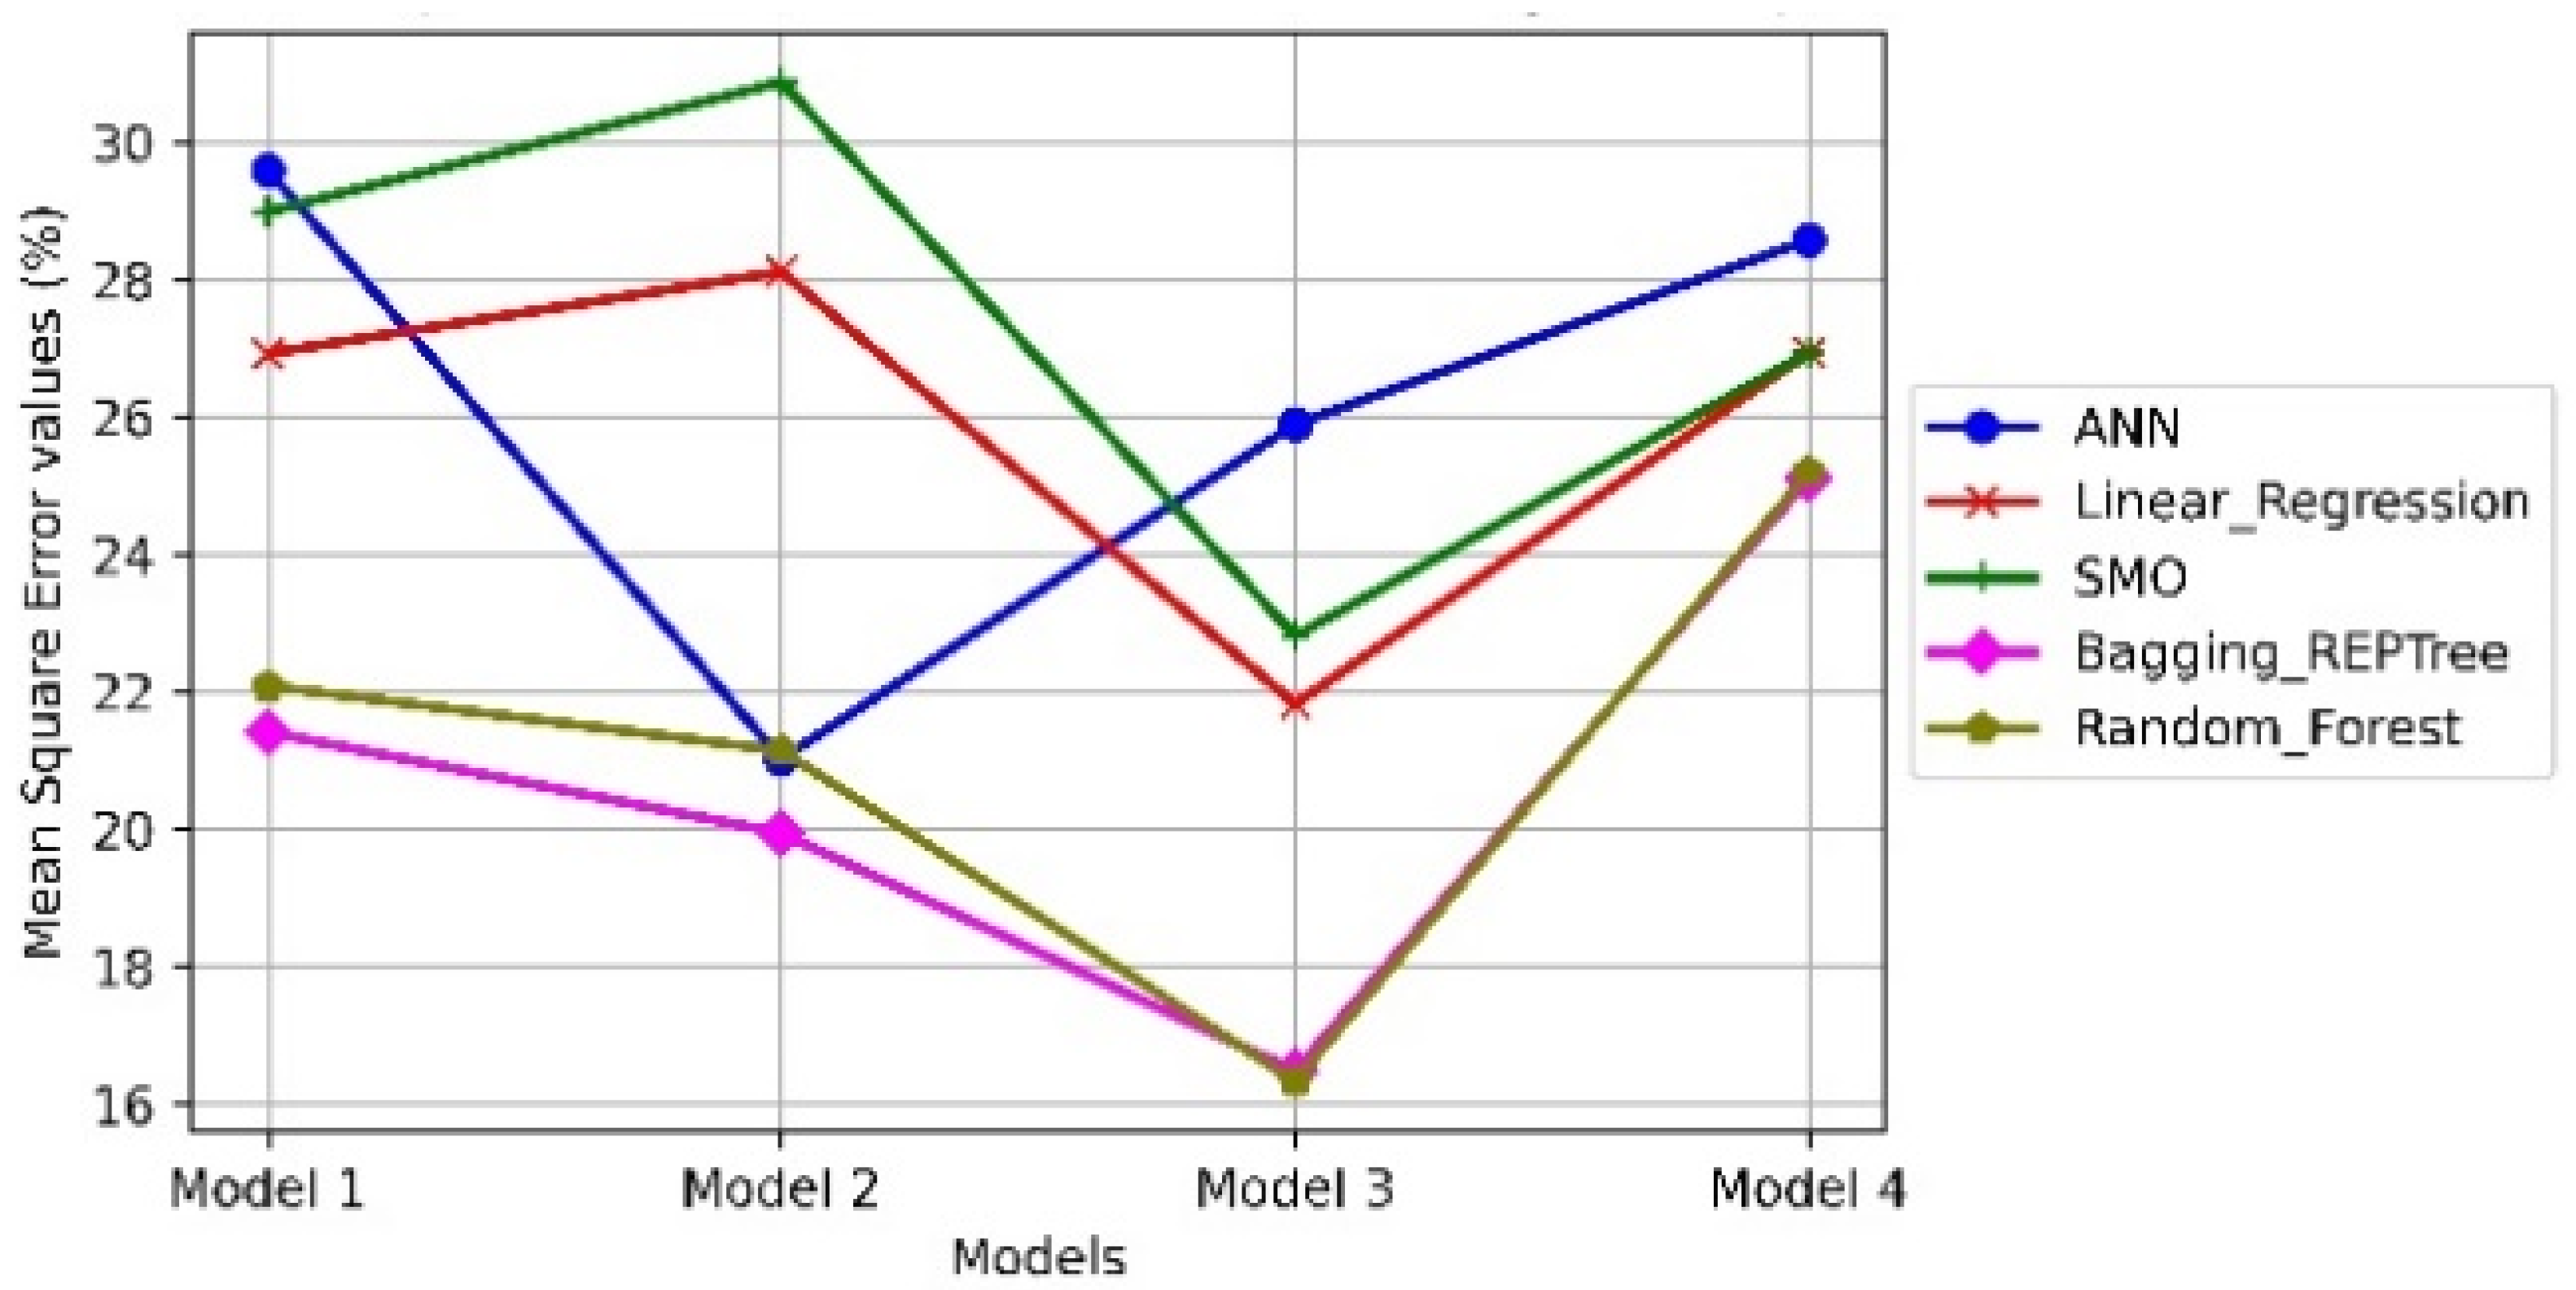
5.4. Machine Learning Techniques’ Validation and Predictions

The study evaluates five machine learning (ML) classification techniques, which take inherited information from a dataset’s input and convert it into a desired output pattern [81]. The five ML models utilized to create and assess models for the YouTube dataset application were ANN [82], linear regression [83], SMO [84], bagging using the REFTree model [85], and random forest [86]. The back-propagation approach is used by the ANN to estimate the error values between the prediction and actual output values. The error is then used to change the weights and bias settings of the ANN architecture, bringing the predicted and real values closer together. The linear regression model is a polynomial function with weighted coefficients for the predictor factors and an outcome that is target dependent. The training phase updates the coefficients of the linear function from the training dataset. The SMO updates the weighted vectors of the SVM model using the sequential minimal optimization algorithm. From a random sampling of the objects and characteristics in the training set, the bagging technique builds several REFTree models, with the average value of the trees providing the final predicted value. The random forest (RF) is a decision tree (DT) model with a random sampling of training data items and random attribute subsets for each subtree. The model’s final output is represented by the average value of the DT trees.

5.5. Validation and Predictions

This study aimed to investigate the various factors that have an impact on the adoption of YouTube as a learning tool, which affirmably influences AA in a bilingual academic environment. The factors most likely connect the quality of the YouTube resource and the perceived information in achieving high-quality scores in academic environments. Consequently, intelligent approaches have to be utilized to predict the perceiving information quality from a different perspective. This study conducted several experiments using supervised ML techniques to validate the information quality learned using YouTube as a learning tool. As shown in Figure 3, the proposed model comprises four dataset models that are considered as the input to ML techniques. These models are: (1) Model 1, which has three inputs that are SC, IL, and IQ as independent variables and IU as a dependent variable, (2) Model 2, which also contains three factors that are IIQ, CIQ, and AIQ to predict IQ as a dependent variable, and (3) Model 3 and Model 4, each of which has one input and dependent variable, IU to IA and IA to AA, respectively. The experimental results are shown in Figure 4 using R2 and Mean Square Error (MSE) as evaluation metrics. The R2 and MSE values are displayed on the y-axis, while the models are depicted on the x-axis. The R2 indicates how the independent values are anticipated to affect the dependent variable (target). The MSE measures the average difference between a model’s evaluated and actual output values.
When compared to other ML techniques, the random forest and bagging REPTree ML models, as shown in Figure 3, give remarkable results reaching up to approximately 98%. This suggests that the tree-based models are more correlated to the target labels. Despite the strong performance of tree-based models, the other ML approaches produce reasonable outcomes of approximately 92%. These findings provide evidence about the effectiveness of ML to predict the information quality (IQ) when depending on the YouTube learning tool. Furthermore, Figure 4 ensures the effectiveness of the tree-based models that accomplish low MSE values flanked by the target and the actual values of the model.

6. Discussion and Conclusions

As people shift towards using YouTube as a learning tool with academic achievement (AA) as an incentive, many practical and theoretical implications arise from such a change.
In general, according to Table 3 and reflected in Figure 2, the most influential factors in the proposed model were the independent variables contextual information quality (CIQ) and accessibility information quality (AIQ), and the mediating variable information usefulness (IU), while five other variables ranked as “high”, namely: the independent variables source credibility (SC) and intrinsic information quality (IIQ), the mediating variables information quality (IQ) and information adoption (IA), and the dependent variable academic achievement (AA). On the other hand, the independent variable information language (IL) ranked as “moderate”. In layman’s terms, the respondents ranked contextual and accessibility qualities and usefulness as more important than information language. In fact, when examining Table 4, some items in the IL variable ranked as low (IL4, Il5) pertaining to TV language, while IL3 and IL6 ranked high pertaining to magazines and YouTube language, which reflected that the respondents did not rank Arabic speaking TV shows, while they ranked as “high” Arabic speaking YouTube and magazines. Furthermore, IL1 and IL2, which pertain to Arabic newspapers and books, were ranked as moderate. All other constructs were ranked as “high” and “very high”.

6.1. Theoretical Contribution

The results of this research can be used by many: educational institutes, teachers, publishers, researchers, and students. YouTube is used as a learning tool by many prestigious educational institutes such as MIT and Berkley, which is a wake-up call for other educational institutes. As such, this makes YouTube an established venue. Competition among educational YouTubers is the way to perfection, which is reflected in the number of views. Publishers in the future may accompany each published book with a YouTube video, much like PowerPoint slides. Based on the findings of this research, students value the credibility of the source very much. Hence, the publisher’s YouTube channels will be more attractive to students than others. Content quality and accuracy are much needed aspects on YouTube, where source credibility is an essential factor. As the number of views on YouTube may work as a source of income, YouTubers may pay more attention to their delivery style.
Information language (IL) is an important factor. As a result, many may deliver knowledge to knowledge seekers via YouTube. Still, according to this research, such a hypothesis was not supported. In fact, the research indicated, in Table 6, that SC correlated the least with IL, and correlated the highest with AIQ, IQ, and IA. Hence, there is a high correlation between SC, IQ, and IA. On the other hand, the least correlated, according to this research finding, is the credibility with IL.
The H1 hypothesis, which reflects the impact of SC positively influencing IU is supported, hence agreeing with the findings of [35] as well as [34,54,55,57]. SC ranked as “high” in Table 3.
The H2 hypothesis, which reflects the impact of information language (IL) positively influencing information usefulness (IU) was not supported, hence disagreeing with the findings of [35,36,37,38,39]. IL ranked as “moderate” in Table 3.
The H3–H5 hypotheses, which reflect the impact of IIQ, CIQ, and AIQ positively influencing IQ, were supported, hence agreeing with the findings of [34,35,40]. AIQ and CIQ ranked as “very high”, while IIQ ranked as “high” according to Table 3.
The H6 hypothesis, which reflects the impact of information quality (IQ) positively influencing information usefulness (IU), was supported, hence agreeing with the findings of [34,35,40]. IQ ranked as “high” in Table 3
The H7 hypothesis, which reflects the impact of information usefulness positively influencing information adoption (IA), was supported, hence agreeing with the findings of [16,34,35]. IU ranked as “very high” in Table 3.
The H8 hypothesis, which reflects the impact of information adoption (IA) positively influencing academic achievement (AA), was supported, hence agreeing with the findings of [4,8,9,10,34,35,41,42]. IA and AA both ranked as “high” according to Table 3.
As for the moderating variables, age, gender, education level, and previous experience, these are shown in hypotheses H9–H12. There is a significant difference in the information adoption (IA) that can be credited to gender, that goes for males more than females. This research used a t-test in Table 8, and the results, shown in Table 8, agreed with the findings from [47,48,49,50,53,64]. There is a significant difference in the information adoption that can be attributed to age. This research used the ANOVA test, shown in Table 9, and multiple comparisons analysis, shown in Table 10; the results agreed with the findings from [47,50,51,52,63]. There is a significant difference in the information adoption that can be credited to age and education level. This research used multiple comparisons analysis, shown in Table 11, and the results agreed with the findings from [46,52,65]. There is a significant difference in the information adoption that can be credited to previous experience. This research used multiple comparisons analysis, shown in Table 12, and the results agreed with the findings from [6].
The model was validated using ML techniques by comparing MSE, and R2 from SEM results, with ML results. Hence, the model can predict the value with high accuracy, 98%, when using random forest and bagging REPTree. The other models’ accuracy reached 92%.

6.2. Practical Implications

Teachers are challenged as they are no longer the only source of delivering knowledge to students. There are hundreds, if not thousands, of sources on YouTube. Such a challenge is not only for teachers but also educational institutes as well as libraries. Hence, the educational institutes are challenged to produce YouTube channels that deliver educational materials. Many educational institutes have taken major steps towards such a goal, while other educational institutes are delaying the inevitable or burying their heads in the sand. The quality of the presentation, as shown previously, is very important.
Teachers are challenged in their delivery of knowledge methods. The number of views is a reflection of the teacher’s performance as is the like/dislike button; therefore, teachers must prepare and plan their lessons. Moreover, the credibility of the source is very important, as shown previously, which influences the information usefulness. Furthermore, the credentials of the presenter are very important.
The positive influence of Information usefulness (IU) on information adoption (IA) is very important, as shown previously; hence, the material delivered to students should reflect this.
Students are adopting information for the purpose of academic achievement, which is evident from previous research; hence, the goal of any YouTube film should be to be clear and to the point.
The student’s age, gender, education level, and previous experience must be considered when presenting education materials on YouTube. In live lectures, a teacher can assess the audience and calibrate their presentation to the age, gender, education level, and previous experience, while such an option is not available on YouTube; therefore, the teacher must accommodate a rainbow of options. As such, meticulous preparation and planning is needed so that students with less experience can be accommodated as can older generations and females.
The proposed model can be used by teachers, educational institutes, researchers, and practitioners to create YouTube content that meets the needs of students and increases the sharing intent.
As such, teachers should be equipped with better cameras, better sound systems, a smart pad/phone, internet service provider and electronic pen and board. Long gone are the days of a regular pen and board. All this equipment will entail financial burdens on the teacher/institute, further added to by the demands from the teacher/institute for smart gadgets and the IoT. In addition, there is a need for training to deal with such technologies. In fact, the classroom environment will need to change to accommodate such a demand for YouTube as a learning tool.

6.3. Limitations and Future Research

In this study the researchers faced two main limitations. First was the lack of access to YouTube statistics to compare with the research questionnaire responses. Such studies and statistics are not available through YouTube itself. Second, due to the COVID-19 pandemic, lockdowns, and social distancing, face to face interviews and direct watching of respondents was not possible.
Still, this research drew the attention of the researchers to several factors that are very interesting to pursue for future research. Shortness and ease of explanation are also two important factors that leaners look for in educational YouTube content with animation that draws learners to YouTube over another provider. As stated by an interviewee, it must be “short and sweet”. Hence, the question of the length of videos is that shorter YouTube videos are more attractive than longer ones. Moreover, the quality of the production of the YouTube film is important.
Does showing the teacher’s face affect the number of views? Seeing the presenter of the education material may affect the understanding of the lesson, and the teaching manner and use of animation, pen and paper, and board in the presentation are other factors that need to be investigated.
Do teachers’ accents affect the views of an educational YouTube? Accent when spoken in English or Arabic is another factor that influences the number of views. Some accents are more popular than others, for example, the Egyptian accent in Arabic is well understood due to TV shows and movies; hence, it is better understood than other Arabic accents. Furthermore, American and British accents are more popular than other English-speaking countries. A suggestion for future research is to investigate whether AI can be involved in changing the accents of the speaker to make the accent more understandable.
In addition, as future work, the ML methods can be developed further to predict the information adoption (IA) of YouTube as a learning tool and its influence on academic achievement (AA). Furthermore, this can be expanded to include the proposed model and other constructs.

6.4. Conclusions

In conclusion, this research was set up to investigate the various factors that influence the use of YouTube as a learning tool, which influences academic achievement in a bilingual academic context. A model was suggested, and hypotheses were developed. The hypotheses were tested using SEM, CFA, and ML methods. The results showed that academic achievement (AA) is influenced by information adoption (IA) of YouTube as a learning tool. Information adoption (IA) was influenced by information usefulness (IU). Source credibility (SC) and information quality (IQ) both influence information usefulness (IU), while information language (IL) does not. Information quality (IQ) is influenced by the intrinsic, contextual, and accessibility information quality. Two interesting findings that we can conclude with are: first, the respondents ranked contextual and accessibility qualities and usefulness as more important than information language. The second, there is a significant difference in the information adoption (IA) that can be credited to age, gender, education level, and previous experience. As such, all previously mentioned factors must be considered for a YouTube educational film.

Author Contributions

Conceptualization, E.A.-T. and A.A.; I.A.; methodology, E.A.-T. and I.A.; software, R.M.; validation, R.M., R.S.A., and E.A.-T.; formal analysis, R.M.; investigation, E.A.-T. and I.A.; resources, R.M.; data curation, S.K. and A.A.; writing—original draft preparation, E.A.-T.; writing—review and editing, S.K. and E.A.-T.; visualization, E.A.-T.; supervision, R.M.; project administration, I.A.; All authors have read and agreed to the published version of the manuscript.

Funding

This research received no external funding.

Institutional Review Board Statement

Not applicable.

Informed Consent Statement

Not applicable.

Data Availability Statement

Not applicable.

Conflicts of Interest

The authors declare no conflict of interest.

Appendix A

Table A1. Constructs and items.
Construct/Item Source
Gender
  • Male
  • Female
Age
  • 18 to less than 34
  • 34 to less than 44
  • 44 to less than 54
  • 54 to less than 64
  • More than 64
Educational Level
  • BSC
  • Master
  • PhD
Previous experience
  • Weak
  • Good
  • Excellent
Information Quality (IQ)
IQ1.
I think the YouTube channel I follow provide high quality information
IQ2.
I think the YouTube channel I follow provide clear information
IQ3.
I think the YouTube channel I follow provide understandable information
[16,40]
Information Adoption (IA)
IA1.
The YouTube channel I follow made it easy for me to understand the topic.
IA2.
The YouTube channel I follow have enhanced my effectiveness in understanding the topic.
IA3.
The YouTube channel I follow have motivated me to understand the topic.
IA4.
I will follow the method taught in the YouTube channel I follow to understand the topic.
IA5.
The YouTube channel I follow contributed to my knowledge about the topic
[16,34,35,66]
Information Usefulness (IU)
IU1
The topic-related information at the YouTube channel I follow is valuable.
IU2
The topic-related information at the YouTube channel I follow is informative.
IU3
The topic-related information at the YouTube channel I follow is helpful.
[34,35]
Information language (IL)
IL1
The newspapers that I read are always in Arabic.
IL2
Most of the books that I read are in Arabic.
IL3
The magazines that I read are always in Arabic.
IL4
Most of my favorite shows on TV are in Arabic.
IL5
I prefer to watch Arabic –language TV over any other language I may speak.
IL6
I prefer to watch Arabic –language YouTube over any other language I may speak.
IL7
I don’t mind watching YouTube with Arabic subtitle.
[35]
Source credibility (SC)
SC1
The information in the YouTube channel I follow is believable
SC2
The information in the YouTube channel I follow is factual
SC3
The information in the YouTube channel I follow is credible
SC4
The information in the YouTube channel I follow is trustworthy
SC5
The information in the YouTube channel I follow is Knowledgeable.
SC6
The information in the YouTube channel I follow is Expert.
[35,66]
Intrinsic Information
Quality (IIQ)
IIQ1.
The YouTube channel I follow produces correct information.
IIQ2.
There are few errors in the information I obtain from the YouTube channel I follow.
IIQ3.
ACCU3: The information provided by the YouTube channel I follow is accurate.
IIQ4.
The YouTube channel I follow is objective.
IIQ5.
The YouTube channel I follow provides impartial view of the topic.
[40,67,68]
Contextual Information
Quality (CIQ)
CIQ1.
The YouTube channel I follow is concise.
CIQ2.
The YouTube channel I follow allows me to verify their results.
CIQ3.
The YouTube channel I follow provides me with resources to verify their work.
CIQ4.
The YouTube channel I follow allows me to access their sources.
CIQ5.
The YouTube channel I follow is clear and easy to understand.
CIQ6.
The YouTube channel I follow is presented consistently.
CIQ7.
The YouTube channel I follow is formatted concisely.
CIQ8.
The YouTube channel I follow has clear meaning.
CIQ9.
The YouTube channel I follow is easy to comprehend.
CIQ10.
The YouTube channel I follow provides enough information.
CIQ11.
The YouTube channel I follow provides me with adequate amount of information.
CIQ12.
The YouTube channel I follow has good reputation among my peers.
CIQ13.
The YouTube channel I follow has good reputation among my teachers.
CIQ14.
The YouTube channel I follow provides me with a complete set of information.
CIQ15.
The YouTube channel I follow produces comprehensive information.
CIQ16.
The YouTube channel I follow provides me with all the information I need.
[40]
Accessibility information
quality (AIQ)
AIQ1.
The YouTube channel I follow is available 24/7.
AIQ2.
The information in the YouTube channel I follow is relevant.
AIQ3.
The information in the YouTube channel I follow is clear.
AIQ4.
The information in the YouTube channel I follow is applicable.
AIQ5.
The information in the YouTube channel I follow is strong.
AIQ6.
The YouTube channel I follow allows information to be readily accessible to me.
AIQ7.
The YouTube channel I follow makes information very accessible.
AIQ8.
The YouTube channel I follow makes information easy to access.
AIQ9.
It takes too long for the YouTube channel I follow to respond to my requests (RC).
AIQ10.
The YouTube channel I follow provides information in a timely fashion.
AIQ11.
The YouTube channel I follow returns answers to my requests quickly.
[40,69]
Academic achievement (AA)
AA1.
YouTube are useful to me as a student.
AA2.
YouTube have a positive impact on my Academic Achievement.
AA3.
YouTube help me to achieve my academic goals.
AA4.
The use of YouTube helps to improve my contact with my colleagues and teachers as well as my performances academic.
AA5.
Skills and knowledge obtained during studying YouTube are very important to my performance and academic achievement.
AA6.
I know the most important concepts and facts relating to YouTube communications have improved.
AA7.
The study of topics related to YouTube has a positive impact on my life in the future.
[69,70]
Adopted from
[71]

References

  1. Mahande, R.D.; Malago, J.D.; Abdal, N.M.; Yasdin, Y. Factors affecting students’ performance in web-based learning during the COVID-19 pandemic. Qual. Assur. Educ. 2022, 30, 150–165. Available online: https://ezlibrary.ju.edu.jo:2057/10.1108/QAE-08-2021-0130 (accessed on 17 April 2020).
  2. Ma, L.; Lee, C.S. Investigating the adoption of MOOCs: A technology-user-environment perspective. J. Comput. Assist. Learn. 2019, 35, 89–98. [Google Scholar] [CrossRef] [Green Version]
  3. Lee, C.S.; Osop, H.; Goh, D.H.; Kelni, G. Making sense of comments on YouTube educational videos: A self-directed learning perspective. Online Inf. Rev. 2017, 41, 611–625. [Google Scholar] [CrossRef]
  4. Rich, K.T. Exercise-Based Video Podcasts as a Learning Aid for Introductory Financial Accounting Students. In Book Advances in Accounting Education: Teaching and Curriculum Innovations (Advances in Accounting Education); Feldmann, D., Rupert, T.J., Eds.; Emerald Group Publishing Limited: Bingley, UK, 2012; Volume 13, pp. 185–211. [Google Scholar]
  5. Jaffar, A.A. YouTube: An emerging tool in anatomy education. Anat. Sci. Educ. 2012, 5, 158–164. [Google Scholar] [CrossRef]
  6. Zhou, Q.; Lee, C.S.; Sin, S.-C.J.; Lin, S.; Hu, H.; Fahmi, M. Understanding the use of YouTube as a learning resource: A social cognitive perspective. Aslib J. Inf. Manag. 2020, 72, 339–359. Available online: https://ezlibrary.ju.edu.jo:2057/10.1108/AJIM-10-2019-0290 (accessed on 17 April 2020). [CrossRef]
  7. Cheung, M.Y.; Luo, C.; Sia, C.L.; Chen, H. Credibility of electronic word-of-mouth: Informational and normative determinants of on-line consumer recommendations. Int. J. Electron. Commer. 2009, 13, 9–38. [Google Scholar] [CrossRef]
  8. Maqableh, M.; Jaradat, M.; Azzam, A. Exploring the determinants of students’ academic performance at university level: The mediating role of internet usage continuance intention. Educ. Inf. Technol. 2021, 26, 4003–4025. [Google Scholar] [CrossRef]
  9. Abi-Rafeh, J.; Azzi, A.J. Emerging role of online virtual teaching resources for medical student education in plastic surgery: COVID-19 pandemic and beyond. J. Plast. Reconstr. Aesthet. Surg. 2020, 73, 1575–1592. [Google Scholar] [CrossRef] [PubMed]
  10. Adnan, M. Online learning amid the COVID-19 pandemic: Students perspectives. J. Pedagog. Sociol. Psychol. 2020, 1, 45–51. [Google Scholar] [CrossRef]
  11. Shoufan, A. Estimating the cognitive value of YouTube’s educational videos: A learning analytics approach. Comput. Hum. Behav. 2019, 92, 450–458. [Google Scholar] [CrossRef]
  12. Masa’deh, R.; AlHadid, I.; Abu-Taieh, E.; Khwaldeh, S.; Alrowwad, A.; Alkhawaldeh, R.S. Factors Influencing Students’ Intention to Use E-Textbooks and Their Impact on Academic Achievement in Bilingual Environment: An Empirical Study Jordan. Information 2022, 13, 233. [Google Scholar] [CrossRef]
  13. Alhadid, I.; Khwaldeh, S.; Al Rawajbeh, M.; Abu-Taieh, E.; Masa’deh, R.; Aljarah, I. An Intelligent Web Service Composition and Resource-Optimization Method Using K-Means Clustering and Knapsack Algorithms. Mathematics 2021, 9, 2023. [Google Scholar] [CrossRef]
  14. Gan, C.; Li, H.; Liu, Y. Understanding mobile learning adoption in higher education: An empirical investigation in the context of the mobile library. Electron. Libr. 2017, 35, 846–860. Available online: https://ezlibrary.ju.edu.jo:2057/10.1108/EL-04-2016-0093 (accessed on 17 April 2020). [CrossRef]
  15. Zhou, T. Understanding online health community users’ information adoption intention: An elaboration likelihood model perspective. Online Inf. Rev. 2022, 46, 134–146. Available online: https://ezlibrary.ju.edu.jo:2057/10.1108/OIR-09-2020-0412 (accessed on 17 April 2020). [CrossRef]
  16. Elwalda, A.; Erkan, İ.; Rahman, M.; Zeren, D. Understanding mobile users’ information adoption behavior: An extension of the information adoption model. J. Enterp. Inf. Manag. 2021. ahead-of-print. Available online: https://ezlibrary.ju.edu.jo:2057/10.1108/JEIM-04-2020-0129 (accessed on 17 April 2020). [CrossRef]
  17. Wang, Z.; Sun, Z. Can the adoption of health information on social media be predicted by information characteristics? Aslib J. Inf. Manag. 2021, 73, 80–100. Available online: https://ezlibrary.ju.edu.jo:2057/10.1108/AJIM-12-2019-0369 (accessed on 19 April 2020). [CrossRef]
  18. Lee, J.-C.; Chen, X. Exploring users’ adoption intentions in the evolution of artificial intelligence mobile banking applications: The intelligent and anthropomorphic perspectives. Int. J. Bank Mark. 2022. ahead-of-print. Available online: https://ezlibrary.ju.edu.jo:2057/10.1108/IJBM-08-2021-0394 (accessed on 17 April 2020). [CrossRef]
  19. Sangwan, S.; Sharma, S.K.; Sharma, J. Disclosing customers’ intentions to use social media for purchase-related decisions. Asia-Pac. J. Bus. Adm. 2022, 14, 145–160. Available online: https://ezlibrary.ju.edu.jo:2057/10.1108/APJBA-02-2021-0061 (accessed on 17 April 2020). [CrossRef]
  20. Wong, D.; Liu, H.; Meng-Lewis, Y.; Sun, Y.; Zhang, Y. Gamified money: Exploring the effectiveness of gamification in mobile payment adoption among the silver generation in China. Inf. Technol. People 2022, 35, 281–315. Available online: https://ezlibrary.ju.edu.jo:2057/10.1108/ITP-09-2019-0456 (accessed on 17 April 2020). [CrossRef]
  21. Arora, N.; Lata, S. YouTube channels influence on destination visit intentions: An empirical analysis on the base of information adoption model. J. Indian Bus. Res. 2020, 12, 23–42. Available online: https://ezlibrary.ju.edu.jo:2057/10.1108/JIBR-09-2019-0269 (accessed on 17 April 2020). [CrossRef]
  22. Das, P.; Pradip, D. Usability and effectiveness of new media in agricultural learning and development: A case study on the southern states of India. J. Soc. Mark. 2021, 11, 357–377. [Google Scholar] [CrossRef]
  23. Naeem, M.; Ozuem, W. Exploring the use of social media sites for health professionals’ engagement and productivity in public sector hospitals. Empl. Relat. 2021, 43, 1029–1051. [Google Scholar] [CrossRef]
  24. Khwaldeh, S.; Alkhawaldeh, R.S.; Masa’deh, R.E.; AlHadid, I.; Alrowwad, A.A. The impact of mobile hotel reservation system on continuous intention to use in Jordan. Tour. Hosp. Res. 2020, 20, 358–371. [Google Scholar] [CrossRef]
  25. Wang, Y.; Gray, P.H.; Meister, D.B. Task-driven learning: The antecedents and outcomes of internal and external knowledge sourcing. Inf. Manag. 2014, 51, 939–951. [Google Scholar] [CrossRef]
  26. Leventhal, R.C.; Swanson, A. Technological applications to the marketing classroom. J. Res. Interact. Mark. 2016, 10, 102–111. Available online: https://ezlibrary.ju.edu.jo:2057/10.1108/JRIM-01-2015-0015 (accessed on 17 April 2020). [CrossRef]
  27. Albahiri, M.H.; Alhaj, A.A.M. Role of visual element in spoken English discourse: Implications for YouTube technology in EFL classrooms. Electron. Libr. 2020, 38, 531–544. Available online: https://ezlibrary.ju.edu.jo:2057/10.1108/EL-07-2019-0172 (accessed on 17 April 2020). [CrossRef]
  28. Almobarraz, A. Utilization of YouTube as an information resource to support university courses. Electron. Libr. 2018, 36, 71–81. [Google Scholar] [CrossRef]
  29. Wickramanayake, L. Social media use by adolescent students of Sri Lanka: Impact on learning and behavior. Glob. Knowl. Mem. Commun. 2022, 71, 70–85. Available online: https://ezlibrary.ju.edu.jo:2057/10.1108/GKMC-08-2020-0123 (accessed on 17 April 2020). [CrossRef]
  30. Palla, I.A.; Sheikh, A. Impact of social media on the academic performance of college students in Kashmir. Inf. Discov. Deliv. 2021, 49, 298–307. Available online: https://ezlibrary.ju.edu.jo:2057/10.1108/IDD-06-2020-0061 (accessed on 17 April 2020). [CrossRef]
  31. Chiang, H.S.; Hsiao, K.L. YouTube stickiness: The needs, personal, and environmental perspective. Internet Res. 2015, 25, 85–106. Available online: https://ezlibrary.ju.edu.jo:2057/10.1108/IntR-11-2013-0236 (accessed on 17 April 2020). [CrossRef]
  32. Wang, Y. Information Adoption Model, a Review of the Literature. J. Econ. Bus. Manag. 2016, 4, 618–622. [Google Scholar] [CrossRef]
  33. Kitchen, J.P.; Kerr, G.; Schultz, E.D.; McColl, R.; Pals, H. The elaboration likelihood model: Review, critique and research agenda. Eur. J. Mark. 2014, 48, 2033–2050. Available online: https://ezlibrary.ju.edu.jo:2057/10.1108/EJM-12-2011-0776 (accessed on 17 April 2020). [CrossRef]
  34. Sussman, S.W.; Siegal, W.S. Informational influence in organizations: An integrated approach to knowledge adoption. Inf. Syst. Res. 2003, 14, 47–65. [Google Scholar] [CrossRef] [Green Version]
  35. Jamil, R.A.; Qayyum, A. Word of mouse vs. word of influencer? An experimental investigation into the consumers’ preferred source of online information. Manag. Res. Rev. 2022, 45, 173–197. [Google Scholar] [CrossRef]
  36. Luna, D.; Peracchio, L.A. What’s in a bilingual’s mind? How bilingual consumers process information. ACR N. Am. Adv. 1999, 26, 306–311. [Google Scholar]
  37. Koslow, S.; Shamdasani, P.N.; Touchstone, E.E. Exploring language effects in ethnic advertising: A sociolinguistic perspective. J. Consum. Res. 1994, 20, 575–585. [Google Scholar] [CrossRef]
  38. Schmitt, B.H.; Pan, Y.; Tavassoli, N.T. Language and consumer memory: The impact of linguistic differences between English and English. J. Consum. Res. 1994, 21, 419–431. [Google Scholar] [CrossRef]
  39. Khan, H.; Lee, R. Does packaging influence taste and quality perceptions across varying consumer demographics? Food Qual. Prefer. 2020, 84, 103932. [Google Scholar] [CrossRef]
  40. Alkhattabi, M.; Neagu, D.; Cullen, A. Information quality framework for e-learning systems. Knowl. Manag. E-Learn. 2010, 2, 340. [Google Scholar]
  41. Basri, S.; Alandejani, J.; Almadani, F. ICT Adoption Impact on Students’ Academic Performance: Evidence from Saudi Universities. Educ. Res. Int. 2018, 2018, 1240197. [Google Scholar] [CrossRef]
  42. Alamri, M.M.; Almaiah, M.A.; Al-Rahmi, W.M. Social media applications affecting students’ academic performance: A model developed for sustainability in higher education. Sustainability 2020, 12, 6471. [Google Scholar] [CrossRef]
  43. Windasari, N.; Albashrawi, M. Behavioral routes to loyalty across gender on m-banking usage. Rev. Int. Bus. Strategy 2021, 31, 339–354. [Google Scholar] [CrossRef]
  44. Peng, L.; Liao, Q.; Wang, X.; He, X. Factors affecting female user information adoption: An empirical investigation on fashion shopping guide websites. Electron. Commer. Res. 2016, 16, 145–169. [Google Scholar] [CrossRef]
  45. Venkatesh, V.; Thong, J.; Xu, X. Consumer acceptance and use of information technology: Extending the unified theory of acceptance and use of technology. MIS Q. 2012, 36, 157–178. [Google Scholar] [CrossRef] [Green Version]
  46. Jbeen, A.; Ur Rehman, S.; Mahmood, K. Awareness, use and attitudes of students towards e-books: Differences based on gender, discipline and degree level. Glob. Knowl. Mem. Commun. 2021. ahead-of-print. [Google Scholar] [CrossRef]
  47. Urumsah, D. Factors Influencing Consumers to Use e-services in Indonesian Airline Companies. In E-Services Adoption: Processes by Firms in Developing Nations (Advances in Business Marketing and Purchasing 2015, Vol. 23B); Emerald Group Publishing Limited: Bingley, UK, 2015; pp. 5–254. [Google Scholar] [CrossRef]
  48. Glavee-Geo, R.; Shaikh, A.; Karjaluoto, H. Mobile banking services adoption in Pakistan: Are there gender differences? Int. J. Bank Mark. 2017, 35, 1090–1114. [Google Scholar] [CrossRef] [Green Version]
  49. Smeda, A.; Shiratuddin, M.F.; Wong, K.W. Measuring the moderating influence of gender on the acceptance of e-book amongst mathematics and statistics students at universities in Libya. Knowl. Manag. E-Learn. 2017, 9, 177–199. [Google Scholar] [CrossRef]
  50. Merhi, M.; Hone, K.; Tarhini, A.; Ameen, N. An empirical examination of the moderating role of age and gender in consumer mobile banking use: A cross-national, quantitative study. J. Enterp. Inf. Manag. 2021, 34, 1144–1168. Available online: https://ezlibrary.ju.edu.jo:2057/10.1108/JEIM-03-2020-0092 (accessed on 17 April 2020). [CrossRef]
  51. Soja, E.; Soja, P. Fostering ICT use by older workers: Lessons from perceptions of barriers to enterprise system adoption. J. Enterp. Inf. Manag. 2020, 33, 407–434. Available online: https://ezlibrary.ju.edu.jo:2057/10.1108/JEIM-12-2018-0282 (accessed on 17 April 2020). [CrossRef]
  52. Kagzi, M.; Guha, M. Does board demographic diversity influence firm performance? Evidence from Indian-knowledge intensive firms. Benchmarking Int. J. 2018, 25, 1028–1058. Available online: https://ezlibrary.ju.edu.jo:2057/10.1108/BIJ-07-2017-0203 (accessed on 17 April 2020). [CrossRef]
  53. Chawla, D.; Joshi, H. The moderating role of gender and age in the adoption of mobile wallet. Foresight 2020, 22, 483–504. Available online: https://ezlibrary.ju.edu.jo:2057/10.1108/FS-11-2019-0094 (accessed on 17 April 2020). [CrossRef]
  54. Tseng, S.Y.; Wang, C.N. Perceived risk influence on dual-route information adoption processes on travel websites. J. Bus. Res. 2016, 69, 2289–2296. [Google Scholar] [CrossRef]
  55. Zhu, D.H.; Chang, Y.P.; Luo, J.J. Understanding the influence of C2C communication on purchase decision in online communities from a perspective of information adoption model. Telemat. Inform. 2016, 33, 8–16. [Google Scholar] [CrossRef]
  56. Ismagilova, E.; Slade, E.; Rana, N.P.; Dwivedi, Y.K. The effect of characteristics of source credibility on consumer behavior: A Meta-analysis. J. Retail. Consum. Serv. 2020, 53, 101736. [Google Scholar] [CrossRef] [Green Version]
  57. Cheung, C.M.; Lee, M.K.; Rabjohn, N. The impact of electronic word-of-mouth: The adoption of online opinions in online customer communities. Internet Res. 2008, 18, 229–247. [Google Scholar] [CrossRef]
  58. Wang, R.Y.; Strong, D.M. Beyond accuracy: What data quality means to data consumers. J. Manag. Inf. Syst. 1996, 12, 5–33. [Google Scholar] [CrossRef]
  59. Wang, R.Y.; Storey, V.C.; Firth, C.P. A framework for analysis of data quality research. IEEE Trans. Knowl. 1995, 7, 623–640. [Google Scholar] [CrossRef] [Green Version]
  60. Wang, R.Y.; Lee, Y.W.; Pipino, L.L.; Strong, D.M. Manage your information as product: The keystone to quality information. Sloan Manag. Rev 1998, 39, 95. [Google Scholar]
  61. Dancer, H.; Filieri, R.; Grundy, D. eWOM in online customer support communities: Key variables in information quality and source credibility. J. Direct Data Digital Mark. Pract. 2014, 15, 290–305. [Google Scholar] [CrossRef]
  62. Zha, X.; Li, L.; Yan, Y.; Wang, Q.; Wang, G. Exploring digital library usage for getting information from the ELM perspective: The moderating effect of information need. Aslib J. Inf. Manag. 2016, 68, 286–305. Available online: https://ezlibrary.ju.edu.jo:2057/10.1108/AJIM-12-2015-0200 (accessed on 17 April 2020). [CrossRef]
  63. Kassarnig, V.; Mones, E.; Bjerre-Nielsen ASapiezynski, P.; Lassen, D.; Lehmann, S. Academic performance and behavioral patterns. EPJ Data Sci. 2018, 7, 10. [Google Scholar] [CrossRef]
  64. Srirahayu, D.P.; Nurpratama, M.R.; Handriana, T.; Hartini, S. Effect of gender, social influence, and emotional factors in usage of e-Books by Generation Z in Indonesia. Digit. Libr. Perspect. 2021. ahead-of-print. Available online: https://ezlibrary.ju.edu.jo:2057/10.1108/DLP-12-2020-0129 (accessed on 17 April 2020). [CrossRef]
  65. Zhong, S.; Shen, X.; Shen, W.; Xin, C. Assessing the impact of ICT adoption on residents’ self-rated health: Evidence from China. Kybernetes 2022. ahead-of-print. Available online: https://ezlibrary.ju.edu.jo:2057/10.1108/K-12-2021-1243 (accessed on 17 April 2020). [CrossRef]
  66. Jiang, G.; Liu, F.; Liu, W.; Liu, S.; Chen, Y.; Xu, D. Effects of information quality on information adoption on social media review platforms: Moderating role of perceived risk. Data Sci. Manag. 2021, 1, 13–22. [Google Scholar] [CrossRef]
  67. Forsgren, N.; Durcikova, A.; Clay, P.F.; Wang, X. The Integrated User Satisfaction Model: Assessing Information Quality and System Quality as Second-order Constructs in System Administration. Commun. Assoc. Inf. Syst. 2016, 38, 39. Available online: http://aisel.aisnet.org/cais/vol38/iss1/39 (accessed on 17 April 2020). [CrossRef]
  68. Arazy, O.; Kopak, R. On the Measurability of Information Quality. J. Am. Soc. Inf. Sci. Technol. 2011, 62, 89–99. [Google Scholar] [CrossRef]
  69. Laumer, S.; Maier, C.; Weitzel, T. Information quality, user satisfaction, and the manifestation of workarounds: A qualitative and quantitative study of enterprise content management system users. Eur. J. Inf. Syst. 2017, 26, 333–360. [Google Scholar] [CrossRef]
  70. Pirmohamed, S.; Debowska, A.; Boduszek, D. Gender differences in the correlates of academic achievement among university students. J. Appl. Res. High. Educ. 2017, 9, 313–324. [Google Scholar] [CrossRef]
  71. Maqableh, M.; Rajab, L.; Quteshat, W.; Masa’deh, R.; Khatib, T.; Karajeh, H. The Impact of Social Media Networks Websites Usage on Students’ Academic Performance. Commun. Netw. 2015, 7, 159–171. [Google Scholar] [CrossRef] [Green Version]
  72. Pallant, J. SPSS Survival Manual: A Step Guide to Data Analysis Using SPSS for Windows Version 12; Open University Press: Chicago, IL, USA, 2005. [Google Scholar]
  73. Sekaran, U.; Bougie, R. Research Methods for Business: A Skill-Building Approach, 6th ed.; Wiley: New York, NY, USA, 2013. [Google Scholar]
  74. Bagozzi, R.; Yi, Y. On the Evaluation of Structural Evaluation Models. J. Acad. Mark. Sci. 1988, 16, 74–94. [Google Scholar] [CrossRef]
  75. Hair, J.; Black, W.; Babin, B.; Anderson, R.; Tatham, R. Multivariate Data Analysis, 6th ed.; Prentice-Hall: Hoboken, NJ, USA, 2006. [Google Scholar]
  76. Newkirk, H.; Lederer, A. The Effectiveness of Strategic Information Systems Planning under Environmental Uncertainty. Inf. Manag. 2006, 43, 481–501. [Google Scholar] [CrossRef]
  77. Kline, R. Principles and Practice of Structural Equation Modeling; The Guilford Press: New York, NY, USA, 2010. [Google Scholar]
  78. Creswell, J. Research Design: Qualitative, Quantitative, and Mixed Methods Approaches, 3rd ed.; Sage Publications: Thousand Oaks, CA, USA, 2009. [Google Scholar]
  79. Hair, J.; Black, W.; Babin, B.; Anderson, R.; Tatham, R. Multivariate Data Analysis, 7th ed.; Prentice-Hall: Hoboken, NJ, USA, 2010. [Google Scholar]
  80. Fronell, C.; Larcker, D. Evaluating Structural Equation Models with Unobservable Variables and Measurement Error. J. Mark. Res. 1981, 18, 39–50. [Google Scholar] [CrossRef]
  81. Witten, I.H.; Frank, E.; Hall, M.A.; Pal, C.J. Data Mining, Fourth Edition: Practical Machine Learning Tools and Techniques, 4th ed.; Morgan Kaufmann Publishers Inc.: San Francisco, CA, USA, 2016. [Google Scholar]
  82. Da Silva, I.N.; Spatti, D.H.; Flauzino, R.A.; Liboni, L.H.B.; dos Reis Alves, S.F. Artificial neural network architectures and training processes. In Artificial Neural Networks; Springer: Berlin/Heidelberg, Germany, 2017; pp. 21–28. [Google Scholar]
  83. Yao, W.; Li, L. A new regression model: Modal linear regression. Scand. J. Stat. 2014, 41, 656–671. [Google Scholar] [CrossRef] [Green Version]
  84. Platt, J. Sequential Minimal Optimization: A Fast Algorithm for Training Support Vector Machines; Technical Report MSR-TR-98-14; Microsoft: Redmond, WA, USA, 1998. [Google Scholar]
  85. Breiman, L. Bagging predictors. Mach. Learn. 1996, 24, 123–140. [Google Scholar] [CrossRef] [Green Version]
  86. Tasin, T.; Habib, M.A. Computer-Aided Cataract Detection Using Random Forest Classifier. In Proceedings of the International Conference on Big Data, IoT, and Machine Learning; Springer: Singapore, 2022; pp. 27–38. [Google Scholar]
Figure 1. Proposed model based on expanded IAM.
Applsci 12 05856 g001
Figure 2. Proposed model with results’ coefficient value, mean, and Std. Dev. reflected.
Applsci 12 05856 g002
Figure 3. The R2 results of using ML techniques on YouTube dataset.
Applsci 12 05856 g003
Figure 4. The MSE results of using ML techniques on YouTube dataset.
Applsci 12 05856 g004
Table 1. Description of the respondents’ demographic profiles.
CategoryCategoryFrequencyPercentage %
GenderMale29341.6
Female41158.4
Total704100
Age (Year)18 to less than 3449670.5
34 to less than 4417524.9
44 to less than 54202.8
54 to less than 64101.4
64 and over30.4
Total704100
Education levelBachelor35049.7
Master33948.2
PhD 152.1
Total704100
Previous experienceLow18626.4
Good23733.7
Excellent28139.9
Total704100
Table 2. Level lookup table of value and ranges.
RangeLevel
1–1.80very low
1.81–2.60low
2.61–3.40moderate
3.41–4.20high
4.21–5very high
Table 3. Overall mean and standard deviation of the study’s variables.
Type of VariableVariablesMeanSDLevelOrder
Independent VariablesSource Credibility (SC)4.16380.70222High4
Information Language (IL)3.10550.48915Moderate5
Intrinsic Information Quality (IIQ)4.17190.95858High3
Contextual Information Quality (CIQ)4.21980.98594Very high2
Accessibility Information Quality (AIQ)4.31020.82849Very high1
Mediating VariablesInformation Quality (IQ)4.11461.06993High3
Information Usefulness (IU)4.20981.10506Very high1
Information Adoption (IA)4.16341.07376High2
Dependent VariableAcademic Achievement (AA)4.13961.14964High-
Table 4. Mean and standard deviation of the study’s variables.
Source Credibility (SC)MeanSDLevelOrder
SC1:3.850.535High5
SC2:4.150.780High4
SC3:4.400.868Very high1
SC4:4.150.840High4
SC5:4.210.805Very high3
SC6:4.230.813Very high2
Information Language (IL)MeanSDLevelOrder
IL1:3.080.491Moderate 5
IL2:3.150.620Moderate4
IL3:3.711.035High1
IL4:2.420.741Low 7
IL5:2.490.860Low 6
IL6:3.700.627High 2
IL7:3.190.586Moderate3
Intrinsic Information Quality (IIQ)MeanSDLevelOrder
IIQ1:4.271.172Very high2
IIQ2:4.140.830High4
IIQ3:3.971.098High5
IIQ4:4.200.823High 3
IIQ5:4.281.192Very high1
Contextual Information Quality (CIQ)MeanSDLevelOrder
CIQ1:4.350.590Very high2
CIQ2:4.291.189Very high4
CIQ3:4.261.187Very high5
CIQ4:4.001.101High10
CIQ5:4.490.825Very high1
CIQ6:4.291.156Very high4
CIQ7:4.180.787High8
CIQ8:4.311.176Very high3
CIQ9:4.220.770Very high7
CIQ10:4.311.172Very high3
CIQ11:4.001.065High10
CIQ12:3.981.069High11
CIQ13:4.281.194Very high5
CIQ14:4.251.188Very high6
CIQ15:4.051.123High 9
CIQ16:4.261.177Very high5
Accessibility Information Quality (AIQ)MeanSDLevelOrder
AIQ1:4.710.499Very high1
AIQ2:4.690.530Very high2
AIQ3:4.321.172Very high6
AIQ4:4.221.162Very high7
AIQ5:4.050.717High 9
AIQ6:4.091.103High 8
AIQ7:4.480.816Very high3
AIQ8:4.031.078High 10
AIQ9:4.430.908Very high5
AIQ10:3.961.073High 11
AIQ11:4.440.888Very high4
Information Usefulness (IU)MeanSDLevelOrder
IU1:4.331.168Very high1
IU2:4.001.073High3
IU3:4.301.158Very high2
Information Quality (IQ)MeanSDLevelOrder
IQ1:4.301.159Very high1
IQ2:4.041.079High2
IQ3:4.011.067High3
Information Adoption (IA)MeanSDLevelOrder
IA1:4.301.143Very high1
IA2:4.091.087High5
IA3:4.111.099High4
IA4:4.221.154Very high2
IA5:4.101.104High 3
Academic Achievement (AA)MeanSDLevelOrder
AA1:4.341.175Very high1
AA2:3.981.089High6
AA3:4.311.188Very high2
AA4:4.211.192Very high4
AA5:4.031.112High 5
AA6:4.221.171Very high3
AA7:3.871.439High 7
Table 5. Properties of the final measurement model.
Constructs and IndicatorsFactor LoadingsStd. ErrorSquare Multiple CorrelationError VarianceCronbach AlphaComposite Reliability *AVE **
Source Credibility (SC) 0.9520.970.98
SC10.722***0.5210.137
SC20.8550.0740.9110.054
SC30.8420.0830.7080.219
SC40.9300.0800.8650.094
SC50.9080.0770.8240.114
SC60.8450.0770.8930.071
Information Language (IL) 0.8950.950.96
IL10.577***0.3330.160
IL20.6680.1010.4460.213
IL40.9200.1370.8460.084
IL50.8740.1650.9500.037
IL70.7080.0980.5010.171
Intrinsic Information Quality (IIQ) 0.9580.950.96
IIQ10.878***0.9560.061
IIQ20.7780.0180.6060.271
IIQ30.8380.0140.8790.145
IIQ40.8560.0150.7330.180
IIQ50.8480.0150.8990.144
Contextual Information Quality (CIQ) 0.9890.650.99
CIQ10.508***0.2480.263
CIQ20.8750.2610.9500.070
CIQ30.8710.2600.9420.081
CIQ40.8140.2320.8350.200
CIQ50.8700.1800.9400.040
CIQ60.8780.2540.9570.057
CIQ70.8290.1560.6870.193
CIQ80.8820.2590.9630.050
CIQ90.8530.1550.7280.161
CIQ100.8840.2590.9670.045
CIQ110.9180.2250.8430.178
CIQ120.8220.2260.8490.172
CIQ130.8770.2620.9550.065
CIQ140.8770.2610.9540.065
CIQ150.8220.2380.8500.189
CIQ160.8760.2590.9520.066
Accessibility Information Quality (AIQ) 0.9730.940.98
AIQ10.846***0.7160.071
AIQ20.8160.0370.6660.094
AIQ30.8770.0680.9550.062
AIQ40.8530.0700.9080.124
AIQ50.7190.0530.5170.248
AIQ60.8310.0680.8670.162
AIQ70.8530.0490.9090.060
AIQ80.8280.0670.8620.161
AIQ90.8780.0600.7710.188
AIQ100.8320.0660.8680.151
AIQ110.8090.0560.8270.136
Information Usefulness (IU) 0.9740.960.90
IU10.887***0.9740.036
IU20.9220.0150.8490.173
IU30.8850.0090.9700.041
Information Quality (IQ) 0.9690.960.89
IQ10.924***0.8540.195
IQ20.8770.0170.9550.052
IQ30.8800.0170.9600.046
Information Adoption (IA) 0.9790.970.98
IA10.920***0.8460.201
IA20.8760.0180.9520.057
IA30.8810.0180.9630.045
IA40.8990.0240.8080.255
IA50.8800.0180.9600.049
Academic Achievement (AA) 0.9850.960.97
AA10.878***0.9570.060
AA20.8430.0140.8890.132
AA30.8770.0120.9540.065
AA40.8470.0150.8970.146
AA50.9300.0150.8660.166
AA60.8440.0150.8900.150
AA70.8620.0160.9250.154
* Utilizing Fronell and Larcker’s [80] formula of CR and ** AVE, *** null value.
Table 6. Correlations of constructs.
ConstructsSCILIIQCIQAIQIUIQIAAA
SC0.98
IL0.7140.97
IIQ0.8360.8150.97
CIQ0.8880.8210.8880.99
AIQ0.9000.8200.8870.8830.98
IU0.8710.8990.8770.8780.8760.95
IQ0.9230.8430.8540.8360.8470.8430.94
IA0.9210.8190.8530.8340.8460.8500.8850.98
AA0.8810.8790.8780.8710.8790.8730.8570.8590.98
Note: Diagonal elements are square roots of the average variance extracted for each of the ten constructs. Off diagonal elements are the correlations between constructs.
Table 7. Summary of the results for the research theoretical model.
Research Proposed PathsCoefficient Valuet-Valuep-ValueEmpirical Evidence
H1: SC → IU0.23316.3440.000Supported
H2: IL → IU0.0090.5070.612Not supported
H3: IIQ → IQ0.0847.7200.000Supported
H4: CIQ → IQ1.01295.7410.000Supported
H5: AIQ → IQ0.0534.2150.000Supported
H6: IQ → IU0.86189.5130.000Supported
H7: IU → IA0.952109.9070.000Supported
H8: IA → AA1.04195.1160.000Supported
Table 8. The t-test of the respondents’ information adoption (IA) attributed to gender.
VariableMaleFemaleTdfSig.
NMeanStd. Dev.NMeanStd. Dev.
Information adoption2934.84980.392194113.67401.1360119.423537.4580.000
Table 9. ANOVA analysis of respondents’ information adoption (IA) attributed to age, education level, and previous experience.
Variable Sum of SquaresDfMean SquareFSig.
Information adoption attributed to age.Between Groups 524.3714131.093320.2160.000
Within Groups286.1636990.409
Total810.534703
Information adoption attributed to education levelBetween Groups 262.8772131.438168.2410.000
Within Groups547.6587010.781
Total810.534703
Information adoption attributed to previous experienceBetween Groups 416.7882208.394371.0110.000
Within Groups393.7467010.562
Total810.534703
Table 10. Multiple comparisons analysis of the information adoption (IA) attributed to age.
(I) Age(J) AgeMean Difference (I-J)Std. ErrorSig.95% Confidence Interval
Lower BoundUpper Bound
18 to less than 3434 to less than 442.00912 *0.056260.0001.85532.1630
44 to less than 540.315400.145930.196−0.08370.7145
54 to less than 640.235400.204360.779−0.32350.7943
64 and over0.075400.370521.000−0.93791.0888
34 to less than 4418 to less than 34−2.00912 *0.056260.000−2.1630−1.8553
44 to less than 54−1.69371 *0.151030.000−2.1068−1.2807
54 to less than 64−1.77371 *0.208030.000−2.3427−1.2048
64 and over−1.93371 *0.372560.000−2.9526−0.9148
44 to less than 5418 to less than 34−0.315400.145930.196−0.71450.0837
34 to less than 441.69371 *0.151030.0001.28072.1068
54 to less than 64−0.080000.247810.998−0.75770.5977
64 and over−0.240000.396150.974−1.32340.8434
54 to less than 6418 to less than 34−0.235400.204360.779−0.79430.3235
34 to less than 441.77371 *0.208030.0001.20482.3427
44 to less than 540.080000.247810.998−0.59770.7577
64 and over−0.160000.421190.996−1.31190.9919
64 and over18 to less than 34−0.075400.370521.000−1.08880.9379
34 to less than 441.93371 *0.372560.0000.91482.9526
44 to less than 540.240000.396150.974−0.84341.3234
54 to less than 640.160000.421190.996−0.99191.3119
* The mean difference is significant at the 0.05 level.
Table 11. Multiple comparisons analysis of the information adoption (IA) attributed to education.
(I) Education Level(J) Education LevelMean Difference (I-J)Std. ErrorSig.95% Confidence Interval
Lower BoundUpper Bound
BachelorMaster1.23413 *0.067360.0001.07591.3923
PhD0.406290.233060.190−0.14110.9537
MasterBachelor−1.23413 *0.067360.000−1.3923−1.0759
PhD−0.827850.233210.001−1.3756−0.2801
PhDBachelor−0.406290.233060.190−0.95370.1411
Master0.82785 *0.233210.0010.28011.3756
* The mean difference is significant at the 0.05 level.
Table 12. Multiple comparisons analysis of the information adoption attributed to previous experience.
(I) Previous
Experience
(J) Previous
Experience
Mean Difference (I-J)Std. ErrorSig.95% Confidence Interval
Lower BoundUpper Bound
LowGood1.18695 *0.073420.0001.01451.3594
Excellent−0.59948 *0.070840.000−0.7659−0.4331
GoodLow−1.18695 *0.073420.000−1.3594−1.0145
Excellent−1.78642 *0.066100.000−1.9417−1.6312
ExcellentLow0.59948 *0.070840.0000.43310.7659
Good1.78642 *0.066100.0001.63121.9417
* The mean difference is significant at the 0.05 level.
Publisher’s Note: MDPI stays neutral with regard to jurisdictional claims in published maps and institutional affiliations.

