Article

The Properties of Materials and Structures of Fluted PVC Panels for the Transmission of Airborne Sound

1
Division of Ecotechnics, Faculty of Organization and Management, Lodz University of Technology, Żeromskiego 116, 90-924 Lodz, Poland
2
Institute of Vehicles and Construction Engineering, Warsaw University of Technology, Pl. Politechniki 1, 00-661 Warsaw, Poland
3
Institute of Power Engineering, Mory Street 8, 01-330 Warsaw, Poland
*
Author to whom correspondence should be addressed.
Appl. Sci. 2022, 12(11), 5732; https://doi.org/10.3390/app12115732
Submission received: 24 March 2022 / Revised: 27 May 2022 / Accepted: 31 May 2022 / Published: 5 June 2022

Abstract

:
The primary goal of this research was to study transmission loss and absorption of fluted PVC panels using experimental and theoretical methods. During these studies, the link between panel size, thickness, transmission loss, and absorption was considered. We measured the transmission loss and absorption in reverberation rooms according to ISO standards. Hansen’s theoretical model was also used to predict the transmission loss. Agreement between TL prediction according to Hansen’s model and measured results for some of the studied panels were observed. However, the analytical prediction, according to Hansen’s model, for heavy fluted PVC panels must be used with caution. The absorption properties of the studied fluted PVC panels are also connected with their resonance, and, in addition, the resonance frequency is associated with the space between the ribs and wave propagation in the panel’s plane.

1. Introduction

One of the major blocks of the European Green Deal is the Circular Economy Action Plan (CEAP). The plan targets product design, circular economy processes, and sustainable consumption. This causes the industry to play a leading role in ecological transition by reducing its carbon and material footprint. Further actions include implementing circularity across the economy [1] and also by the management of waste, especially plastics or polymer materials [2]. Because of this, the industry uses waste polymer materials more and more for automotive, aeronautics, and space applications considering their mechanical properties and low weight [3]. Polyvinyl Chloride (PVC) is one of the most popular polymers in the industry, possessing a versatile nature, and it broadly applies to technical solutions including in building, transport, packaging, electrical/electronic, and healthcare applications as well as everyday items. Although recent works have shown that PVC production harms the natural environment and human health [4,5], it is universally used and will continue to be used.
A critical problem during the design, construction, and exploitation of vehicles, buildings, or machinery is not only the energy efficiency but also good fire or sound insulation. Determination of the sound absorption (absorption coefficient-α) and sound transmission loss (TL, insulation parameter) of materials have become a necessity because of the technical progress and thus increased number of noise sources. Currently, noise pollution is one of the world’s leading environmental problems, and approximately 40% of European Union (UE) residents are exposed to noise [6]. The latest research demonstrated that long-term exposure to noise in urban areas has a negative impact on health, causing 12,000 premature deaths and contributing to 48,000 new cases of ischaemic heart disease every year across Europe [7]. Different actions are taken to ensure the reduction of noise pollution, for example, by correcting the noise wave propagation to exposed people using panels, barriers, and screens to block the direct path of sound.
Some of the earliest works focus on PVCs acoustic insulations in different forms: foam, fibre, composites, or a mix with additives. Cheng et al. indicated that the addition of flame retardants polymer composite to PVC does not influence the acoustic insulation [8]. Yang et al. studied the honeycomb weave fabric/PVC composite material, showing that repetitions of weave have a great influence on the acoustic insulation [9]. Liu et al. noticed that adding fillers to PVC deteriorates mechanical properties and has little effect on acoustics [10]. Huang et al. showed that PVC fibre panels could reduce the noise of air conditioning more effectively as compared to an alone absorption material [11]. Xue et al. found that a sound insulation cover made from PVC/PET fibre can effectively reduce the noise of the compressor [12]. Pulgern et al. studied WPVC (Wood/Polyvinyl Chloride) composite panels, showing that those panels reduce sound pressure levels by approximately 15–19 dB [13]. The other works focus on sound absorption and sound insulation of the PVC in different building applications, such as floor coverings [14], blocks mixed with fine PVC [15], PVC foam materials [16], or PVC windows [17]. This resulted in several papers about PVC’s capacity for acoustic barriers for machinery or transport systems. Fang et al. found that PVC panels caused noise reduction in refrigerators [18]. Agyeman-Prempeh [19] studied the reduction of noise levels of coconut fibre combined with polyvinyl chloride as sound-insulating panels. The noise insulation system for high-rise buildings using PVC foam on wood, concrete, and glass was studied [20]. The results showed that concrete mixed with PVC foam has the highest noise insulation effectiveness.
Roschke and Esche examined another acoustics parameter of materials-insertion loss (IL) and studied various polymer barriers [21]. Macbain et al. [22] studied barriers from various recycled plastic and found their performance to be better at lower frequencies (100 to 250 Hz). The combination of tyre rubber, PVC grains, and nylon fibres with polyurethane as a binder resulted in a good absorption coefficient [23].
Another way to improve the performance of the noise barrier was to change its shape using additional elements on the top of the barrier, made from different materials, such as T-shaped and Y-shaped caps [24,25], cylindrical caps [26,27], multiple-edge caps [28], and tilted caps [29]. These design variants changed the effective acoustic length of the barrier or modified the diffraction points of the screen. Additionally, the application of scattering acoustic barriers in cities was studied. It aimed to reduce the transmitted transport noise that affected buildings [30].
Corrugated or fluted panels have experienced an increasing number of applications as construction elements for roofs, claddings, and walls of modern industrial buildings and acoustic road panels. The range of profile shapes may be large and intended for different situations. As corrugated and fluted panels are so widely used for industrial applications, their acoustic parameters are of considerable interest. Engineers need this information to estimate the expected community noise levels at the building or construction design stage.
Corrugated or fluted panels are referred to as orthotropic because they are stiffer along one direction than the other. Heckl [31,32] analyzed sound transmission through orthotropic panels. He derived some approximate solutions for the transmission coefficient for panels of the infinite extent, with the effects of panel damping neglected. The earliest works focus on the calculation of moments of area of the profiled metal sheet [33], on the sound absorption and TL of single metal skin cladding with varying profiling and thickness [34], on the dependences of the profile to critical frequency [35], or the application of finite element and boundary element analysis to predict the TL of a corrugated and fluted steel sheet [36].
Because of the development of the plastics processing industry, those materials are used even more frequently. Manufacturing specifics and material additives cause the acoustical parameters for different plastics to remain in the cognitive phase. Therefore, the major goal of this paper focuses on an experimental study of the absorption coefficient and transmission loss of fluted PVC panels, considering the panel size and thickness. Such panels are commonly used in construction engineering, so their acoustical parameters with no absorption material are also important. Through the development of the plastics processing industry and the possibility of the creation of the new shapes of panels, this industry now creates new materials for wide applications. So, the acoustical parameters of such materials are important in technical use. In our studies, the Z-type and Ω-type corrugated panels, with special strength and patented joining between single modules, were studied as potential acoustical materials. Transmission loss and absorption coefficient were measured using ISO methods. The experimental results of transmission loss (TL) are compared with Hansen’s theoretical model to calculate the TL widely used in the fluted/corrugated/ribbed panels for checking this model for the tested panels. The quick conversion of the loss coefficient through the use of a simple theoretical model could replace experimental studies and also computer simulations. Discovering the acoustic parameters of single fluted PVC panels will allow for finding an idea or method for improving their sound insulation capacity.

2. Materials and Methods

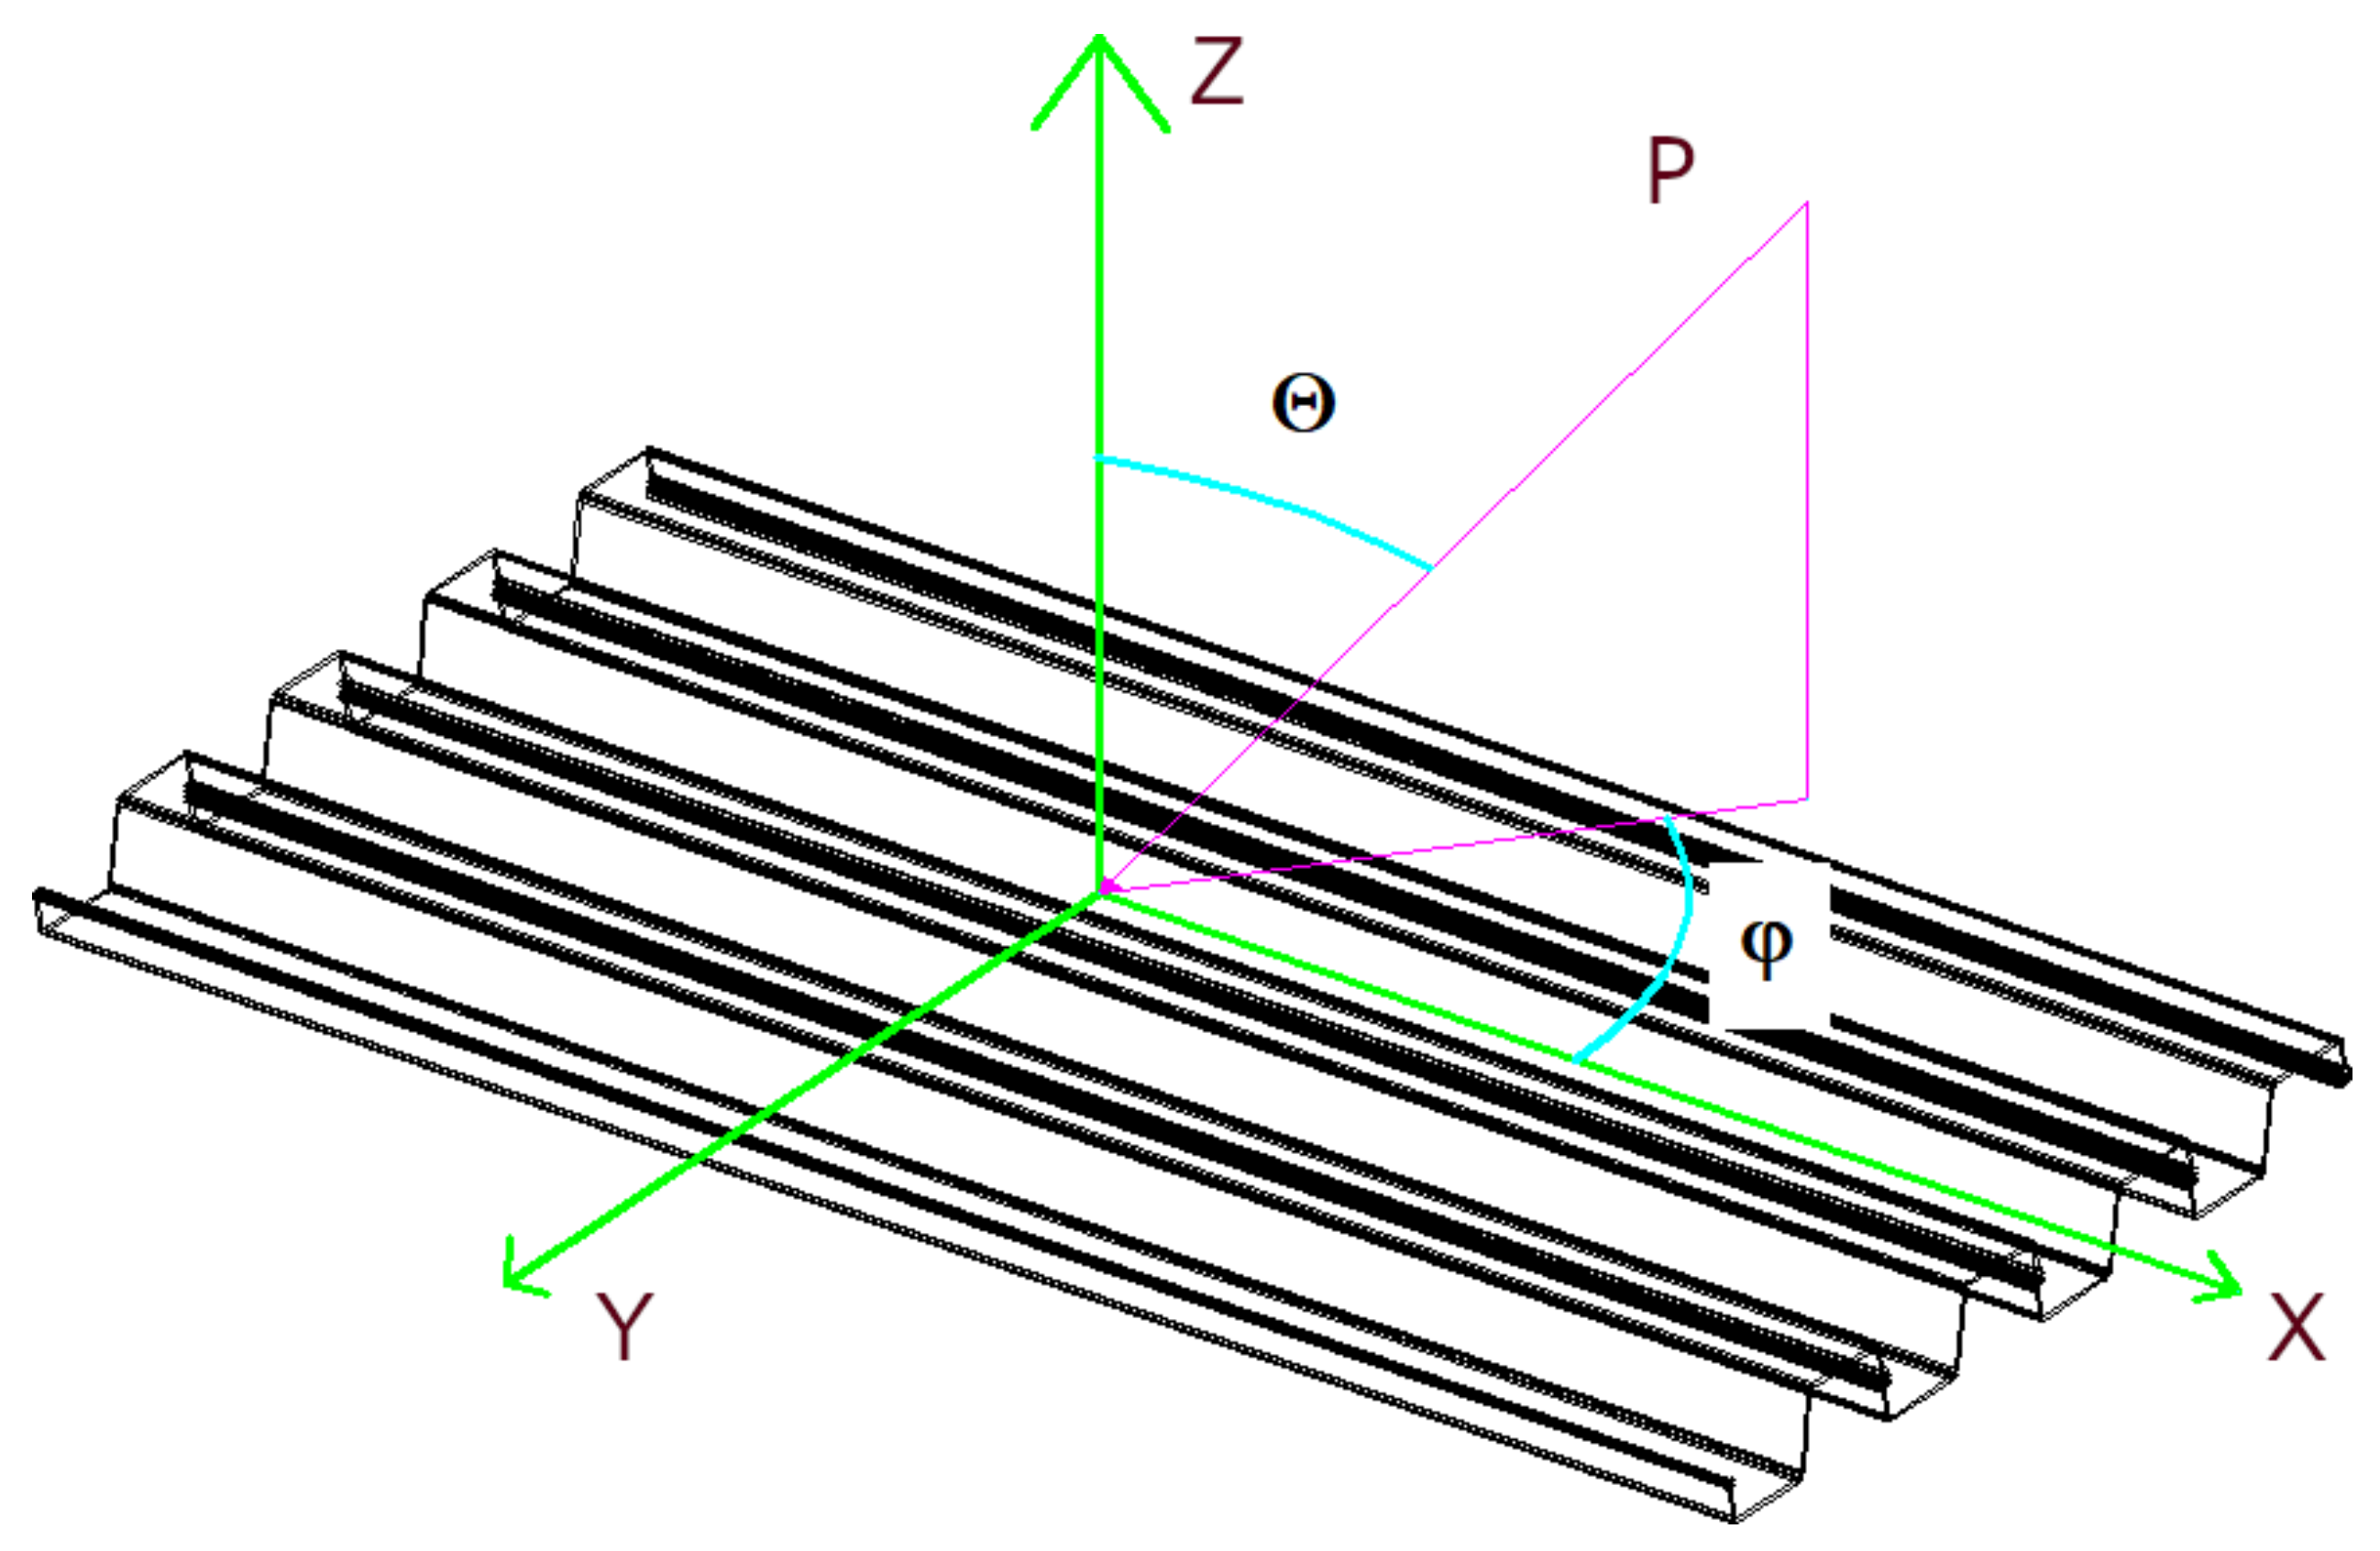
2.1. Analytical Model for Infinite and Finite Homogeneous Orthotropic Panel
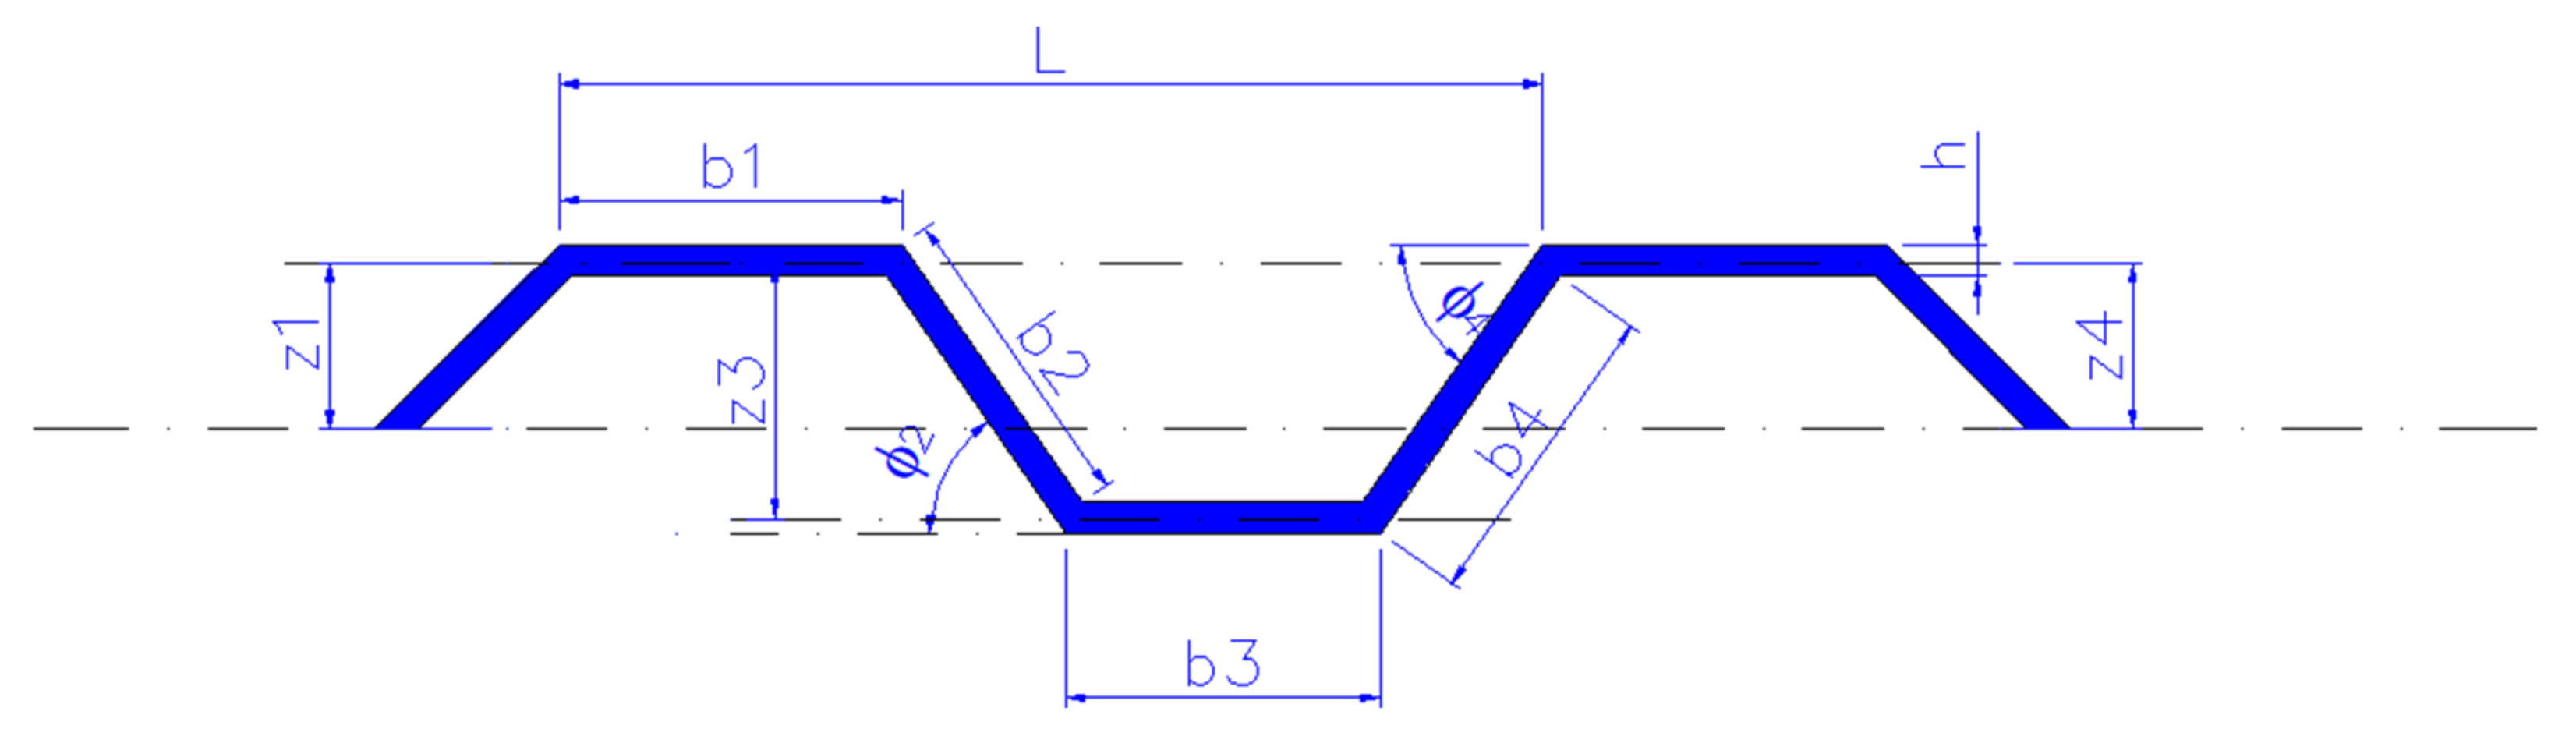
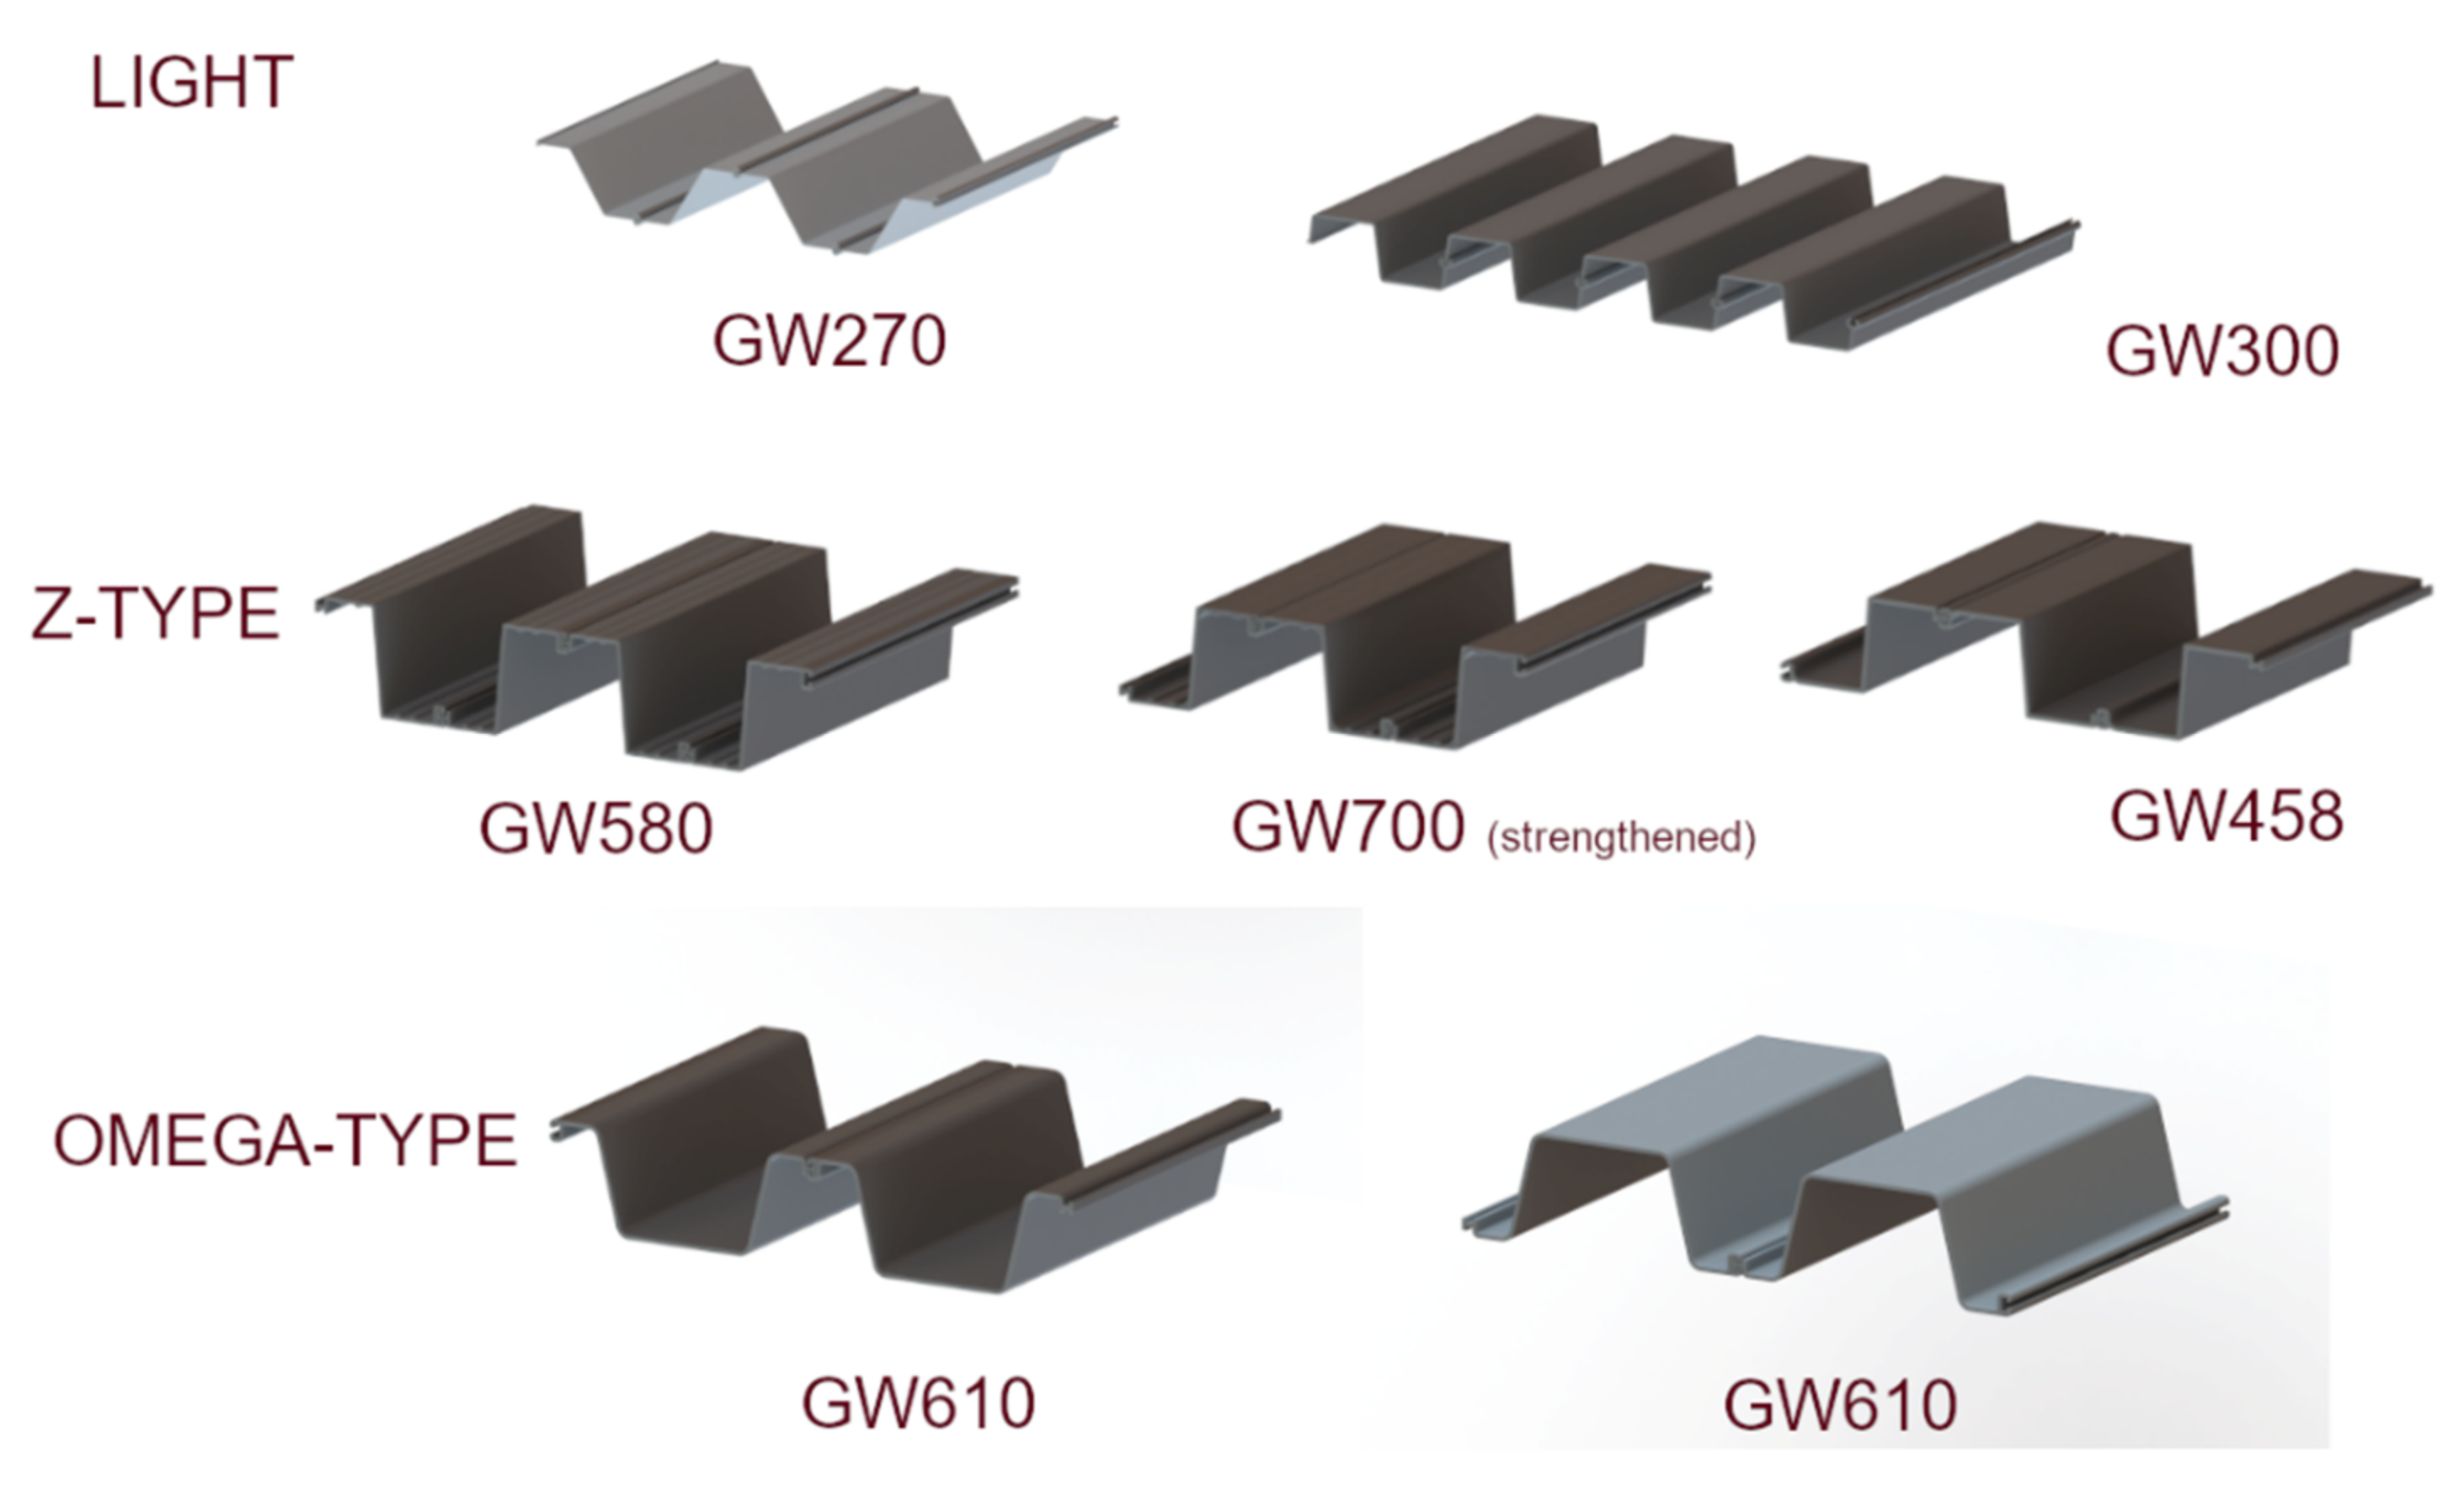
According to Hansen [37], for thin, homogeneous, orthotropic panels, the wave impedance Zorth can be expressed by:
Z o r t h = j ω m 1 f f c 1 c o s 2 φ + f f c 2 s i n 2 φ 2 s i n 4 θ 1 + j η
where:
f = ω 2 π
f c 1 = c 2 2 π m B x
f c 2 = c 2 2 π m B y
The panel loss factor is η, the frequency of the panel is ω, the mass per unit area of the panel is m, the speed of sound in air is −c, and the angles θ and φ are defined in Figure 1.
The fc1 and fc2 are known as the critical frequencies, at which the speed of bending wave propagation is equal to the speed of acoustic wave propagation in the surrounding medium. The corrugated panel commonly found in construction engineering is stiffer along the direction of the ribs than across the ribs. Orthotropic panels are characterised by a range of bending wave speeds caused by the two different values of the cross-sectional second moment of area per unit width. Therefore, for the thin corrugated trapezoidal panel, the bending stiffness about the X and Y axis, Bx and By, in Equations (3) and (4) is given by:
B x = E h 1 ν 2 L n b n z n 2 + h 2 + b n 2 24 + h 2 b n 2 24 c o s 2 θ
B y = E h 3 1 ν 2 L n b n
where L and bn are defined in Figure 2, ν is Poisson’s ratio, and zn is the distance from the neutral axis of the panel cross-section to the centre of the panel segment n, where the neutral axis is defined such that:
n b n z n = 0
The transmission coefficient for a wave incident at an angle (θ, φ) to the panel is given in terms of the panel impedance by:
τ θ φ = 1 + Z o r t h c o s θ 2 ρ 0 c 2
The transmission coefficient for normal incidence, τN, is found by substitution θ = 0 in Equation (5). The diffuse field transmission coefficient, τd, is found by determining a weighted average for τ (θ, φ) over all angles of incidences using the following relationship:
τ d = 1 π 0 2 π d φ 0 π 2 τ θ , φ c o s θ s i n θ d θ
The cosθ term accounts for the projection of the cross-section area of the panel wave that is incident upon a unit area of the wall at an angle, θ, to the wall-normal. The sinθ term is a metrical coefficient, which arises from the use of spherical coordinates. For the orthotropic panel, Equation (3) becomes:
τ d = 2 π 0 π / 2 d φ 0 1 τ θ , φ d s i n 2 θ
Substituting Equation (5) into (7) gives the diffuse field transmission coefficient for an infinite panel, as given by Heckl [32]:
τ d = 2 π 0 π / 2 0 1 d s i n 2 θ d φ 1 + Z 2 ϱ 0 c c o s θ 2
This equation can be approximate for various ranges of frequency. For frequencies containing the lowest panel resonance frequency and for f < fc1/2, Equation (1) may be approximated by assuming the panel behaves as a limp mass and wave impedance Zorth can be written:
Z o r t h j ω m
Thanks to this, Equation (11) becomes:
τ d = α 2 l o g e 1 + α 2 ,     w h e r e   α = π f m / ρ c
For frequencies between fc1 and fc2, provided that η = 0, Heckl also gives an approximation to Equation (11):
τ d = f c 1 2 π α f l o g e 4 f f c 1
Additionally, also for f > fc2, the diffuse field transmission coefficient can be calculated from the equation:
τ d = π 2 α f c 1 f c 2 f
The transmission loss of panel, TL, is defined in terms of the transmission coefficient-τd:
T L = 10 l o g 10 τ d
Transmission loss is commonly observed by testing in a reverberation room. The transmission loss is usually measured by placing the panel in a window between two adjacent reverberant rooms. Noise is introduced into one of the rooms (the source room), and part of the sound energy is transmitted through the test panel into the second room (receiver room). So, during measurements, panels are not of an infinite extent.
It is possible to perform numerical integration of Equation (11) for various ranges of frequency, and transmission loss can then be calculated by substituting τd in Equation (16). Panels are not of infinite extent, and results obtained by these equations do not agree well with results measured in the laboratory. Davy [38] showed that this limiting angle depends on the size of the panel and that good comparisons between prediction and measurement transmission loss can be obtained if the upper limit of integration of Equation (11) is changed so that the integration does not include angles of θ between some limiting angle and 90°. This allows the use of some approximations [33], such as in our studies. For a corrugated panel, as an orthotropic panel, with critical frequencies fc1 and fc2, the prediction scheme as a function of frequency could be taken into account, which should give reasonably good agreement with the experiment, according to Hansen’s studies. At frequency f = fc1/2, it may be assumed that the panel behaves as a limp mass and transmission loss TL can be calculated as:
T L = 20 l o g 10 f c 1 m 54   d B
For fc1 < f < fc2/2, the following approximation can be used:
T L = 20 l o g 10 f + 10 l o g 10 m 10 l o g 10 f c 1 20 l o g 10 l o g e 4 f f c 1 13.2   d B
For f = 2fc2, transmission loss TL is calculated from:
T L = 10 l o g 10 m + 10 l o g 10 f c 2 5 l o g 10 f c 1 17   d B
Above 2fc2, the TL is given by:
T L = 20 l o g 10 f + 10 l o g 10 m 5 l o g 10 f c 1 5 l o g 10 f c 2 23   d B
The transmission loss between 0.5fc1 and ƒc1 and between 0.5fc2 and 2ƒc2 is approximated by connecting points corresponding to the frequency with a straight line [33].
Another way to determine the acoustical parameters of panels is a computer simulation. Acoustic computer simulation is widely used in building acoustics. They can predict the acoustic performance of buildings or construction materials before they are built, which is helpful in modifying the acoustic design if necessary. The finite element method (FEM) can be applied to large and complex structures with various boundary conditions. It is the most popular method among numerical techniques for panels. FEM is proposed by various researchers for the structural analysis of corrugated plates of uniform thickness and equivalent rigidities [39,40,41,42]. These techniques apply if the dimensions of the whole corrugated panel are much larger than the period of the corrugations. Additionally, when there is no access to transmission loss test measurements, numerical simulations of plates or panels can be an important alternative. Modelling transmission loss was performed using deterministic methods such as Finite Element (FEM) or Boundary Element (BEM) for low and middle frequencies. However, the size of the discretised models can be huge for sufficiently high frequencies. Several works regarding the modelling of transmission loss of the simple plate were conducted. For example, the transmission loss of a thin plate in a duct by a coupled Rayleigh–Ritz–BEM approach was computed by Piscoya et al. [43,44]. The discretised model and size of the elements ensure accuracy of the results only up to 500 Hz. Another problem was the damping of the plate. Poor or no convergence was obtained at the resonant frequencies of the plate during the calculation if no damping in the plate is considered. In another work, the coupled FEM–BEM approach to calculate the transmission loss of corrugated plates was conducted, and the difference between the numerical and theoretical models was between 2–4 dB. The results show that only the first eigenfrequencies of the plate are calculated with reasonable accuracy, and the values of the transmission loss tend to be overestimated [45,46]. The FEM and coupled FEM–BEM simulations of the more complex rib-stiffened panel structures were also investigated [47], giving the predicted TL compared with corresponding measurements of the sample panel with the good agreement above 400 Hz. Some researchers focused on the simulation of the acoustic field theory in composite materials or plastic materials [48,49,50,51]. For example, the sound transmission loss across composite material, especially orthotropic laminate, was examined using the transmission matrix simulation method and experimental measurements. In the low to mid-frequency region, the error was less than 5 dB. Systematic errors were seen in the low-frequency range due to the finite size of the experimental panel, and at frequencies above 1500 Hz [51].
The research conducted in this paper focused mainly on experimental methods to obtain the transmission loss and absorption coefficient compared with Hansen’s theoretical model. Computational approaches to determine the vibration acoustic characteristics of studied panels and standard wave approach to estimate their sound TL could be considered after obtaining the construction drawings of the panels to build the simulation models. Because the owner of the panels has a patent for their joining geometry between the panel, talks on this topic are currently underway.

2.2. Studied Panels

Six commercially fluted panels were tested by mounting the panels in an aperture between two reverberant test chambers. Sections of the tested panels are shown in Figure 3, and the panel properties are included in Table 1.
Studied commercial fluted plastic panels are manufactured in moulding, otherwise known as co-extrusion of polyvinyl chloride with additive substances refining its parameters (toughness modifiers, UV, thermal stabilizers, etc.). The sheet is manufactured using the extrusion moulding method as monolithic profiles or co-extrusion method, where the core is made from a recycled construction type PVC with an outer layer of the default PVC material. Interlocking connections at the edges allow for production panels of various widths.

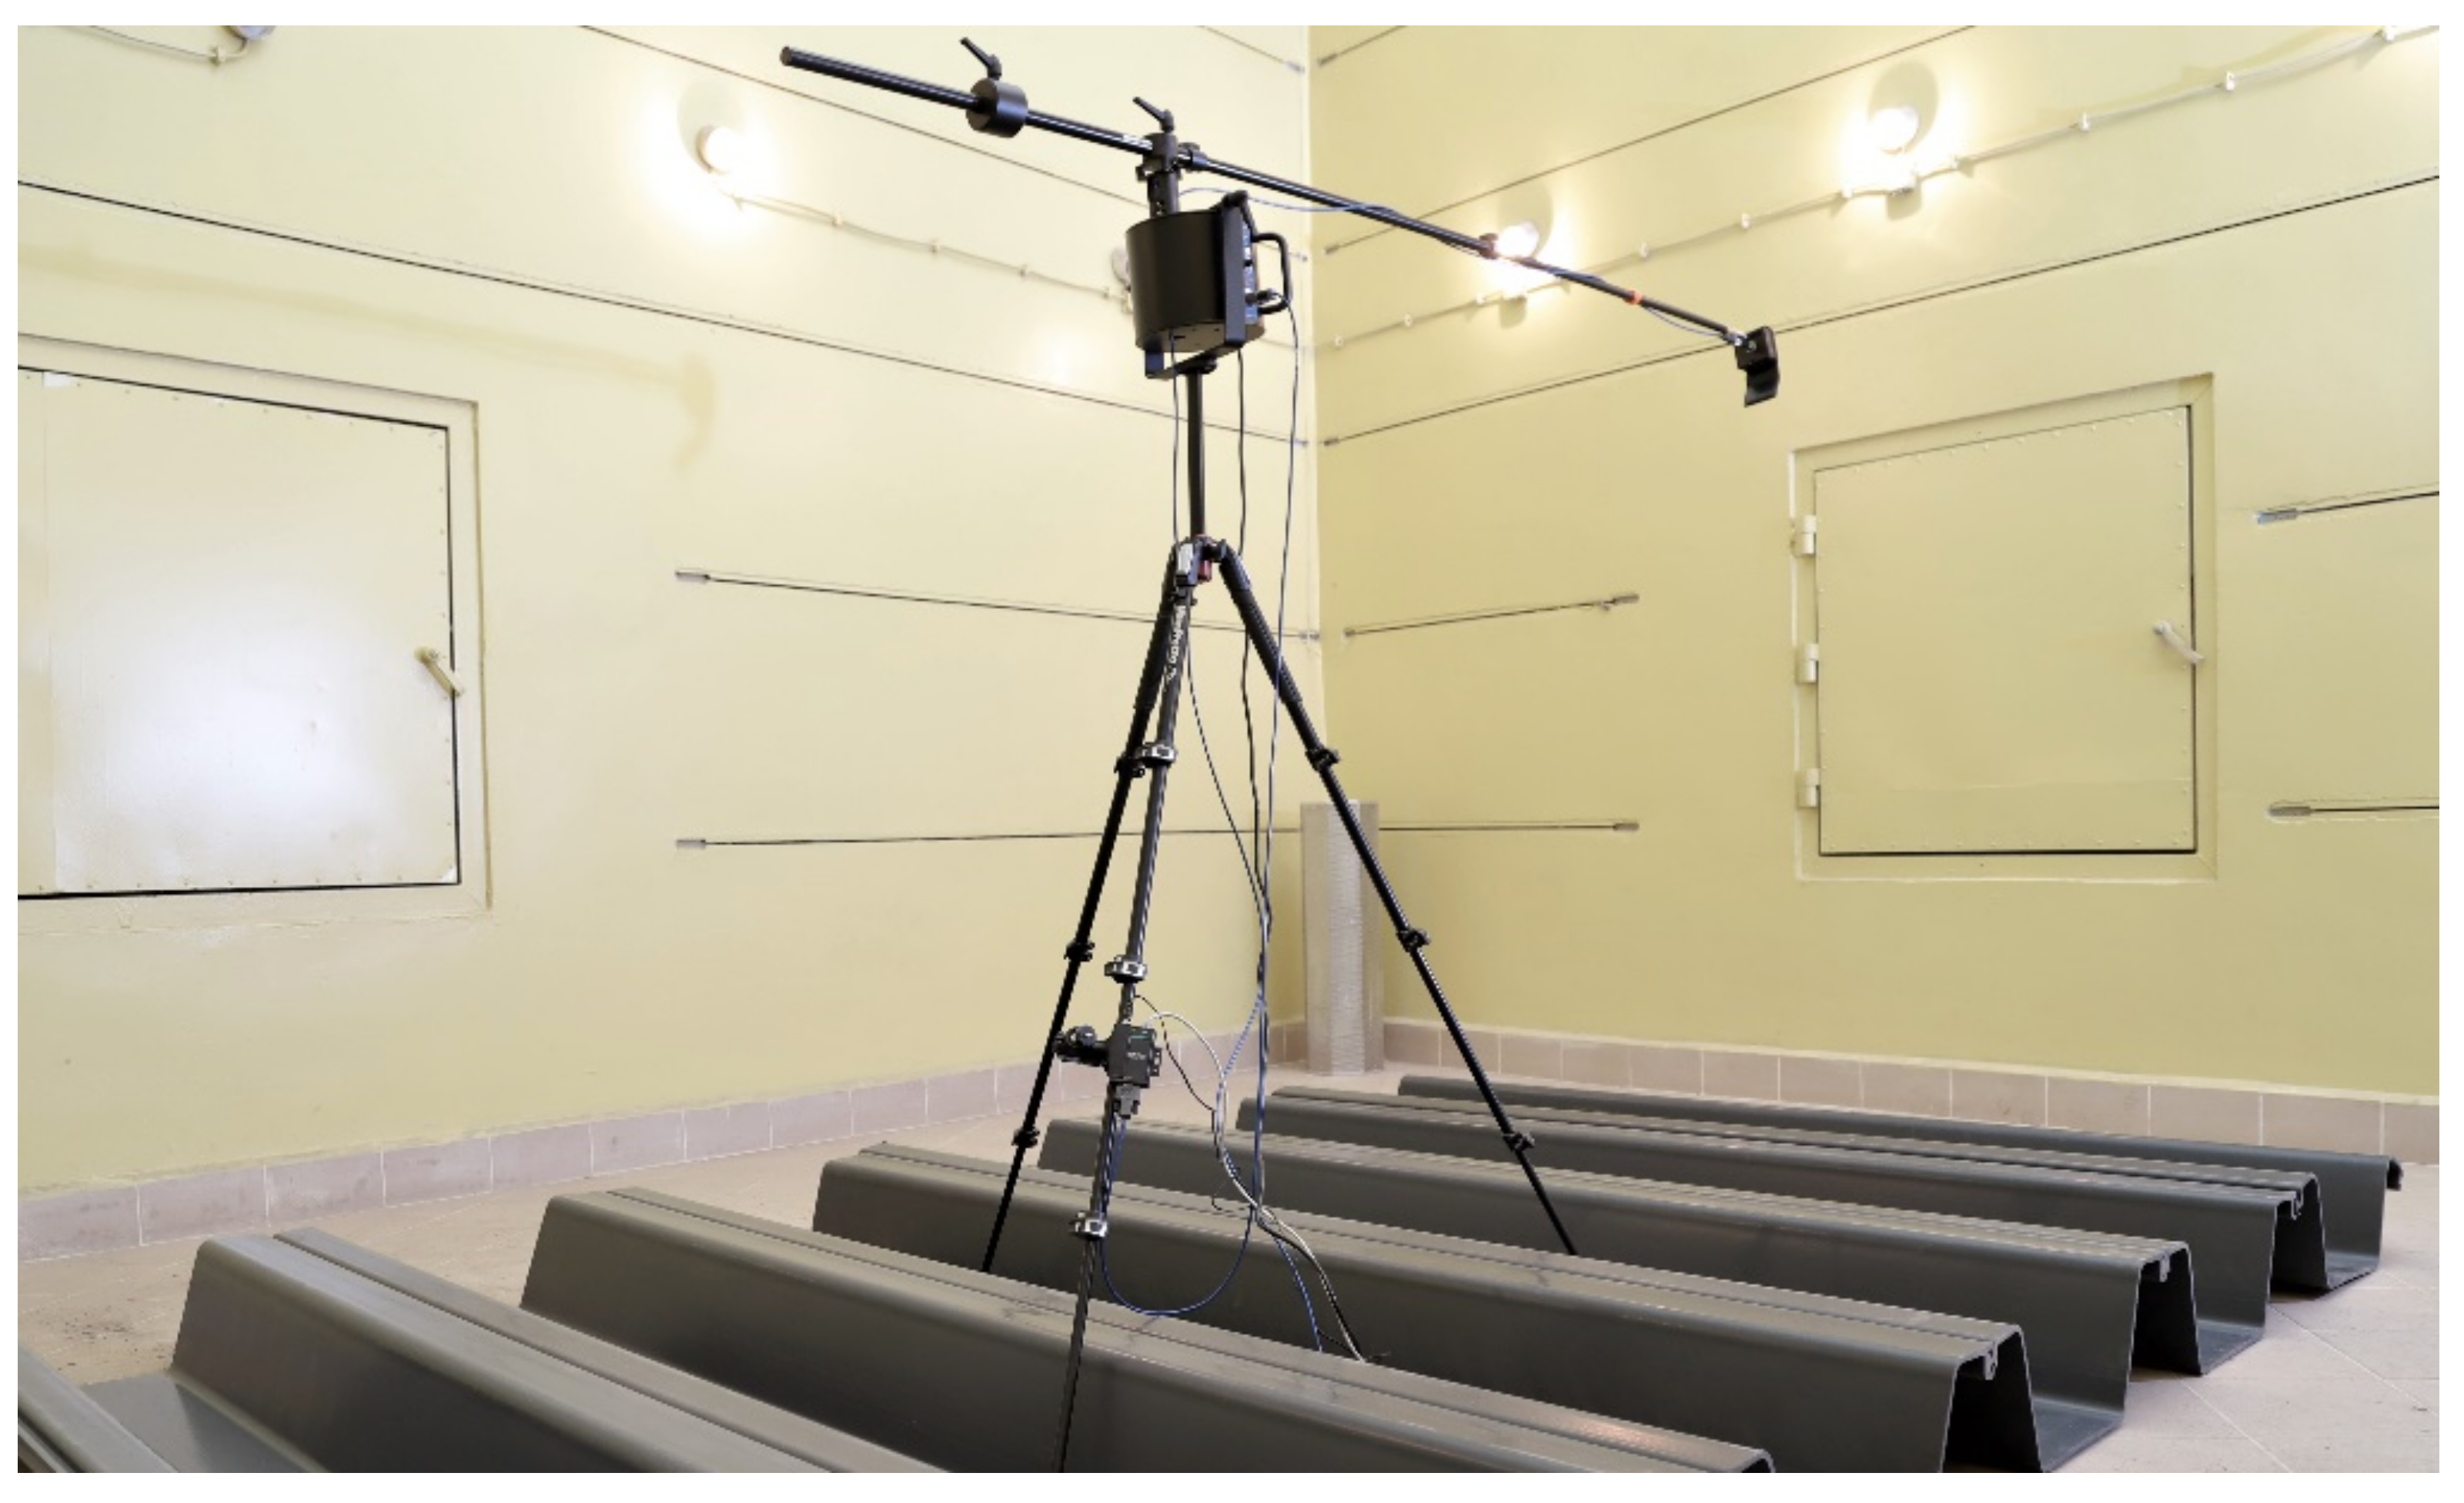
2.3. Transmission Loss Measurements

The studies were conducted in the reverberation rooms of the Institute of Power Engineering, OTC–Thermal Technology Branch „ITC” in Lodz (Warsaw, Poland). Panels were tested by mounting an aperture between two reverberant test chambers. The measurement was performed by the current ISO standard: 10140-2:2021 Acoustics—Laboratory Measurement of Sound Insulation of Building Elements—Part 2: Measurement of Airborne Sound Insulation and 10140-4:2021 Acoustics—Laboratory measurement of sound insulation of building elements—art 4: Measurement procedures and requirements. Both the source and receiving rooms were constructed to give a reverberant sound field with volumes of V = 237 m3 and an area of 231.5 m2 for each.
The tested PVC panels (size 1.0 m × 1.0 m) in a frame were fixed to an aperture opening between the two reverberation rooms. Panels had to be cut down to fit the aperture opening dimension. Edges of each specimen were sealed tightly using soundproof silicone sealant.
White noise was produced using an all-in-one DO 203 omnidirectional noise source, including a dodecahedron loudspeaker with a power amplifier and a noise generator. Measured parameters were sound pressure level in both rooms and reverberation time (T60) in the receiver room. T60 is defined as the time required for the sound source to reduce to a level of 60 dB when it is turned off in a closed room. Reverberation times were measured in the frequency range of 50 Hz to 10,000 Hz. Sound pressure levels in the rooms were sampled using two sets of l/2-inch microphones, each coupled with a pre-amplifier and fed to a SVAN 958 analyzer for l/3 octave band spectrum analysis. The background level was measured and calibrated using the Bruel & Kjaer 4231 calibrator before and after the measurement procedure. The environmental conditions were also monitored by recording the temperature, relative humidity, and atmospheric pressure.
Transmission loss was obtained using the equation for the transmission of sound between two reverberant spaces:
T L = L s ¯ L r ¯ + 10 l o g S A   d B
where:
L s ¯ —spatial average sound pressure level in the source room, dB
L r ¯ —spatial average sound pressure level in the receiver room, dB
T L —reverberant field transmission loss, dB
S —the area of the transmitting surface, m2
A —room constant in the receiver room, using the Sabine equation: A = 0.16 × (V/T60), m2

2.4. Sound Absorption Measurements

The second phase of the test considered the examination of the absorption coefficient of studied PVC panels. For every test, around 10 m2 of the panel were placed on the floor of the reverberation chamber according to standard ISO 354:2005-Acoustics—Measurement of sound absorption in a reverberation room. Interlocking connections allowed us to build off the PVC sheet of approximately 5 m in width. Before testing, panels were inserted into the reverberation room for 24 h to acclimatize to the atmospheric conditions in the chamber, see Figure 4. Measurements were conducted using a rotating microphone boom Nor265 with an integration time of 30 s for each microphone position. The 1/3 octave bands were measured using Nor140. The microphone was calibrated before the acoustic test.
The reverberation time of the room was measured in two conditions:
  • when the reverberation room was empty;
  • when the studied panels were inside.
Once the material is placed in the reverberation room, a lower reverberation time can be observed. The difference in reverberation times is a measure of the amount of absorption caused by the studied panels.

3. Results and Discussion

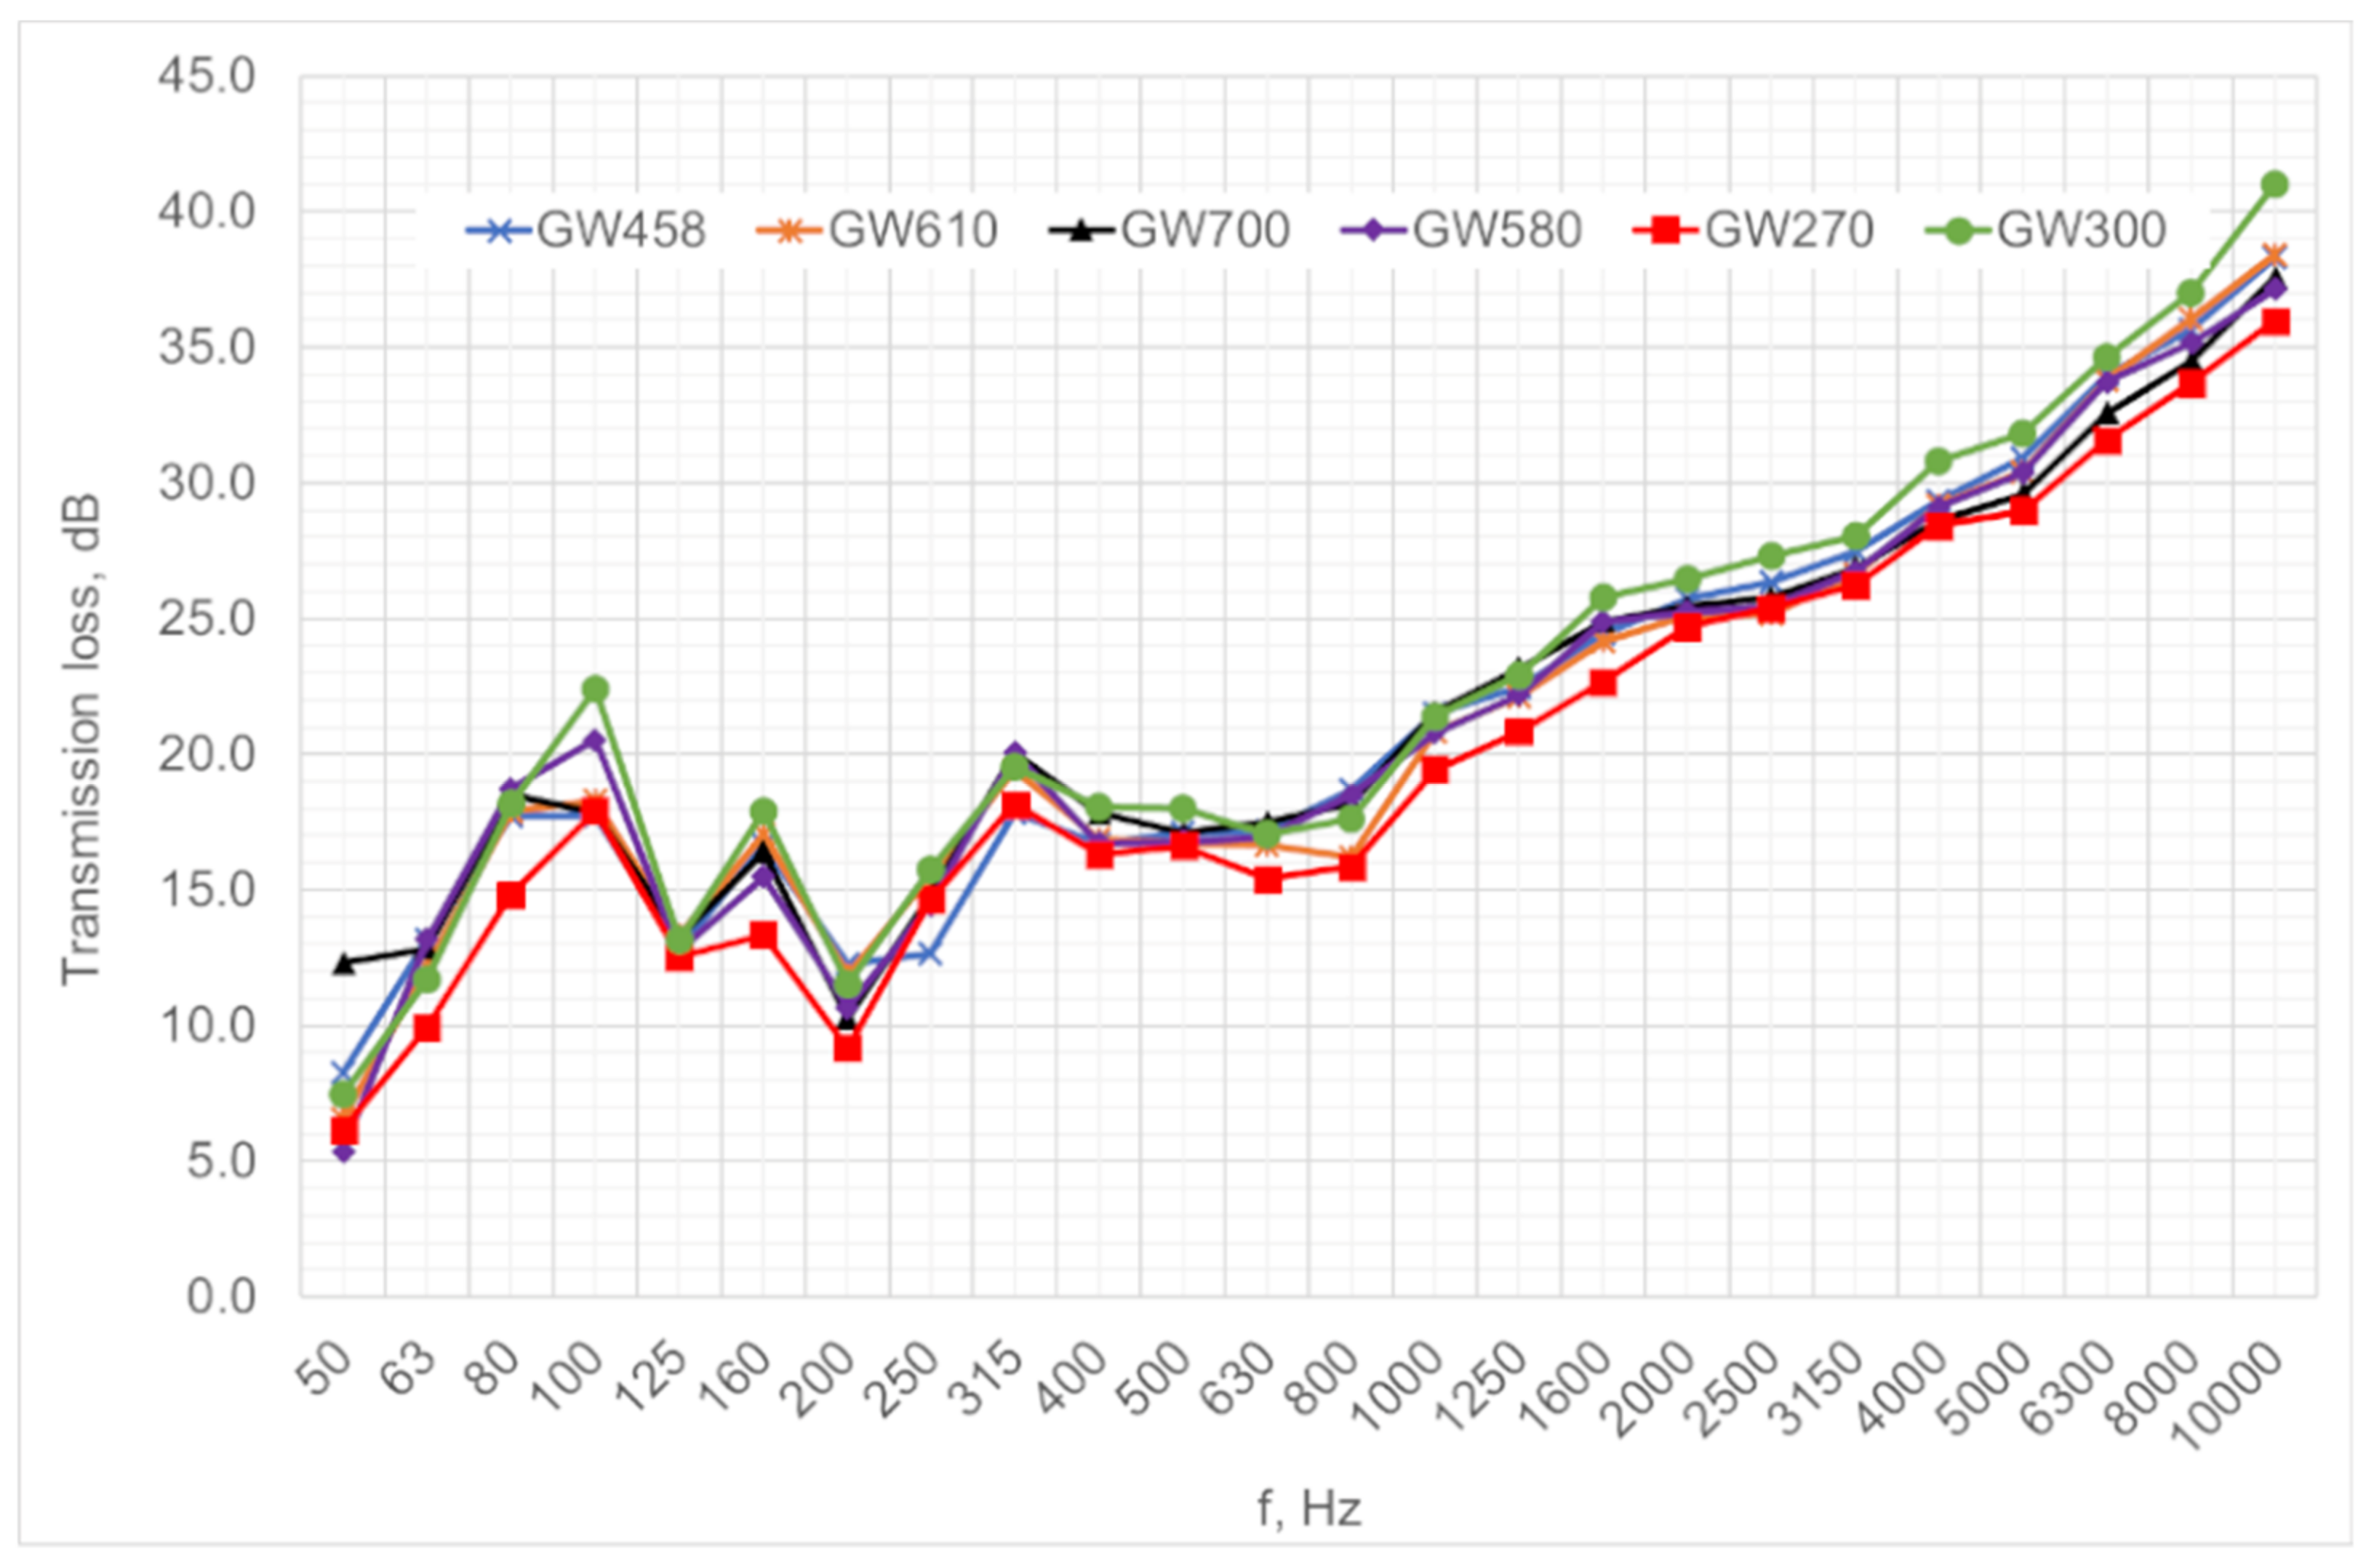
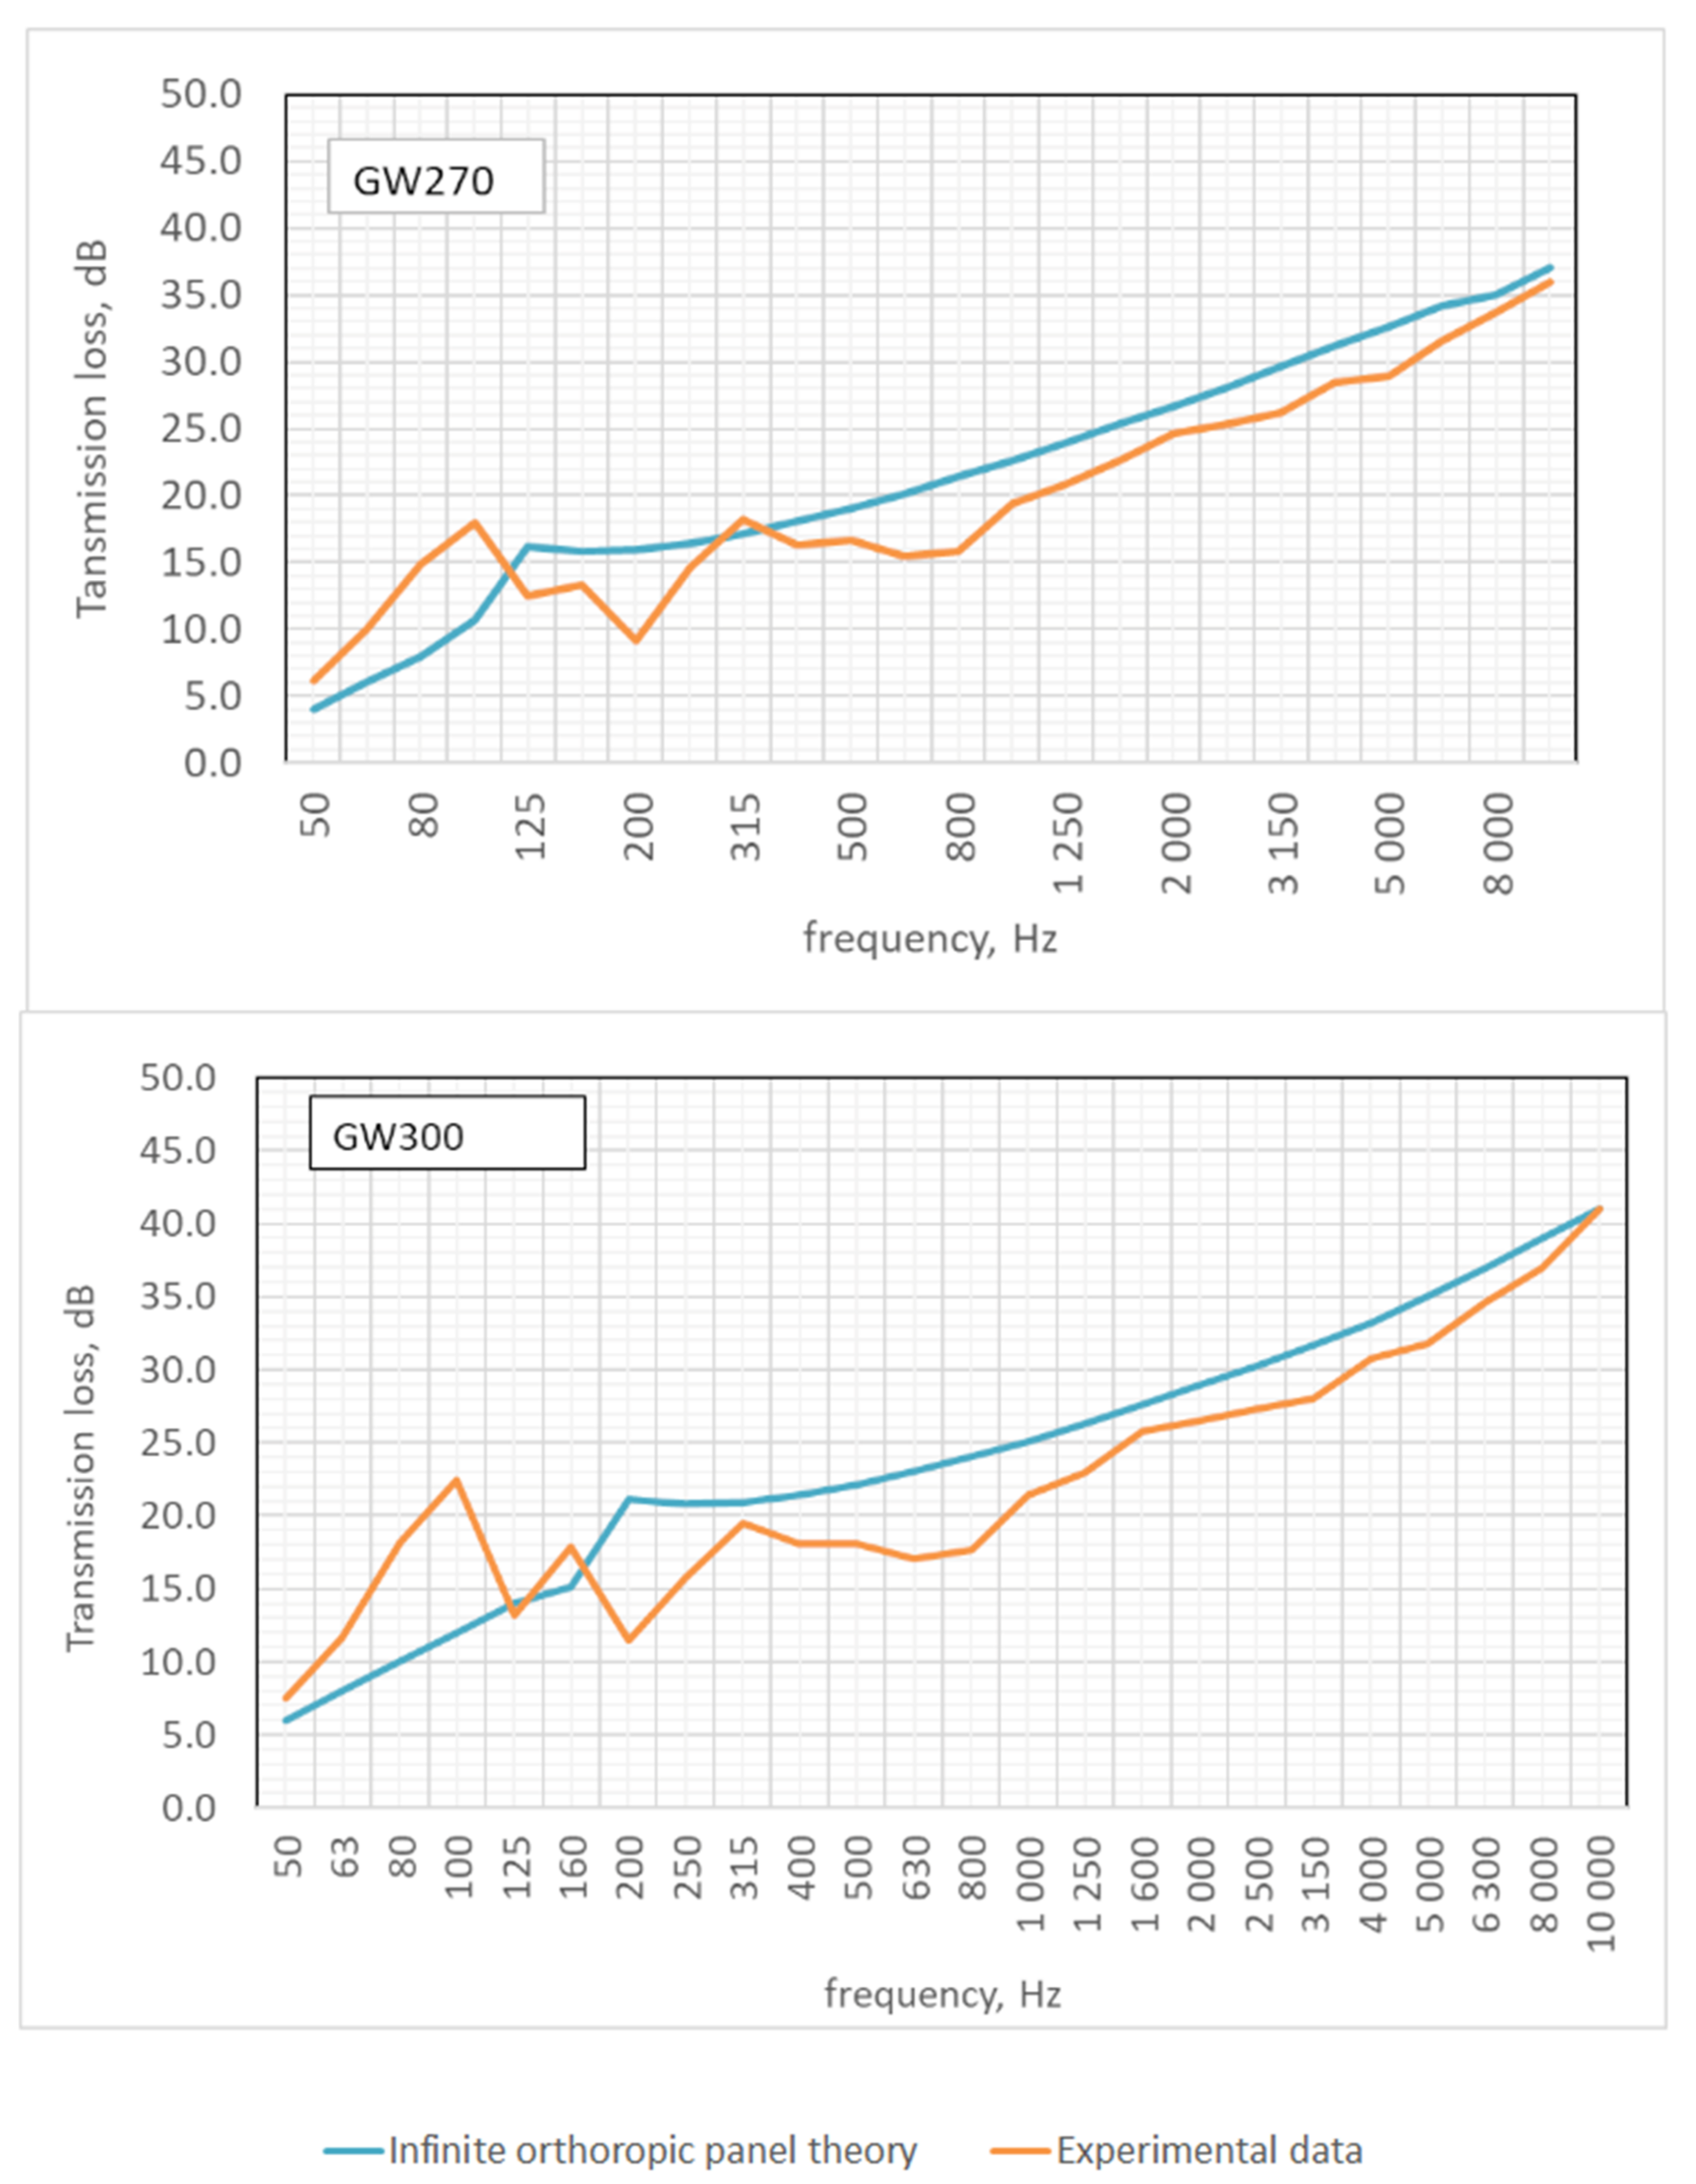
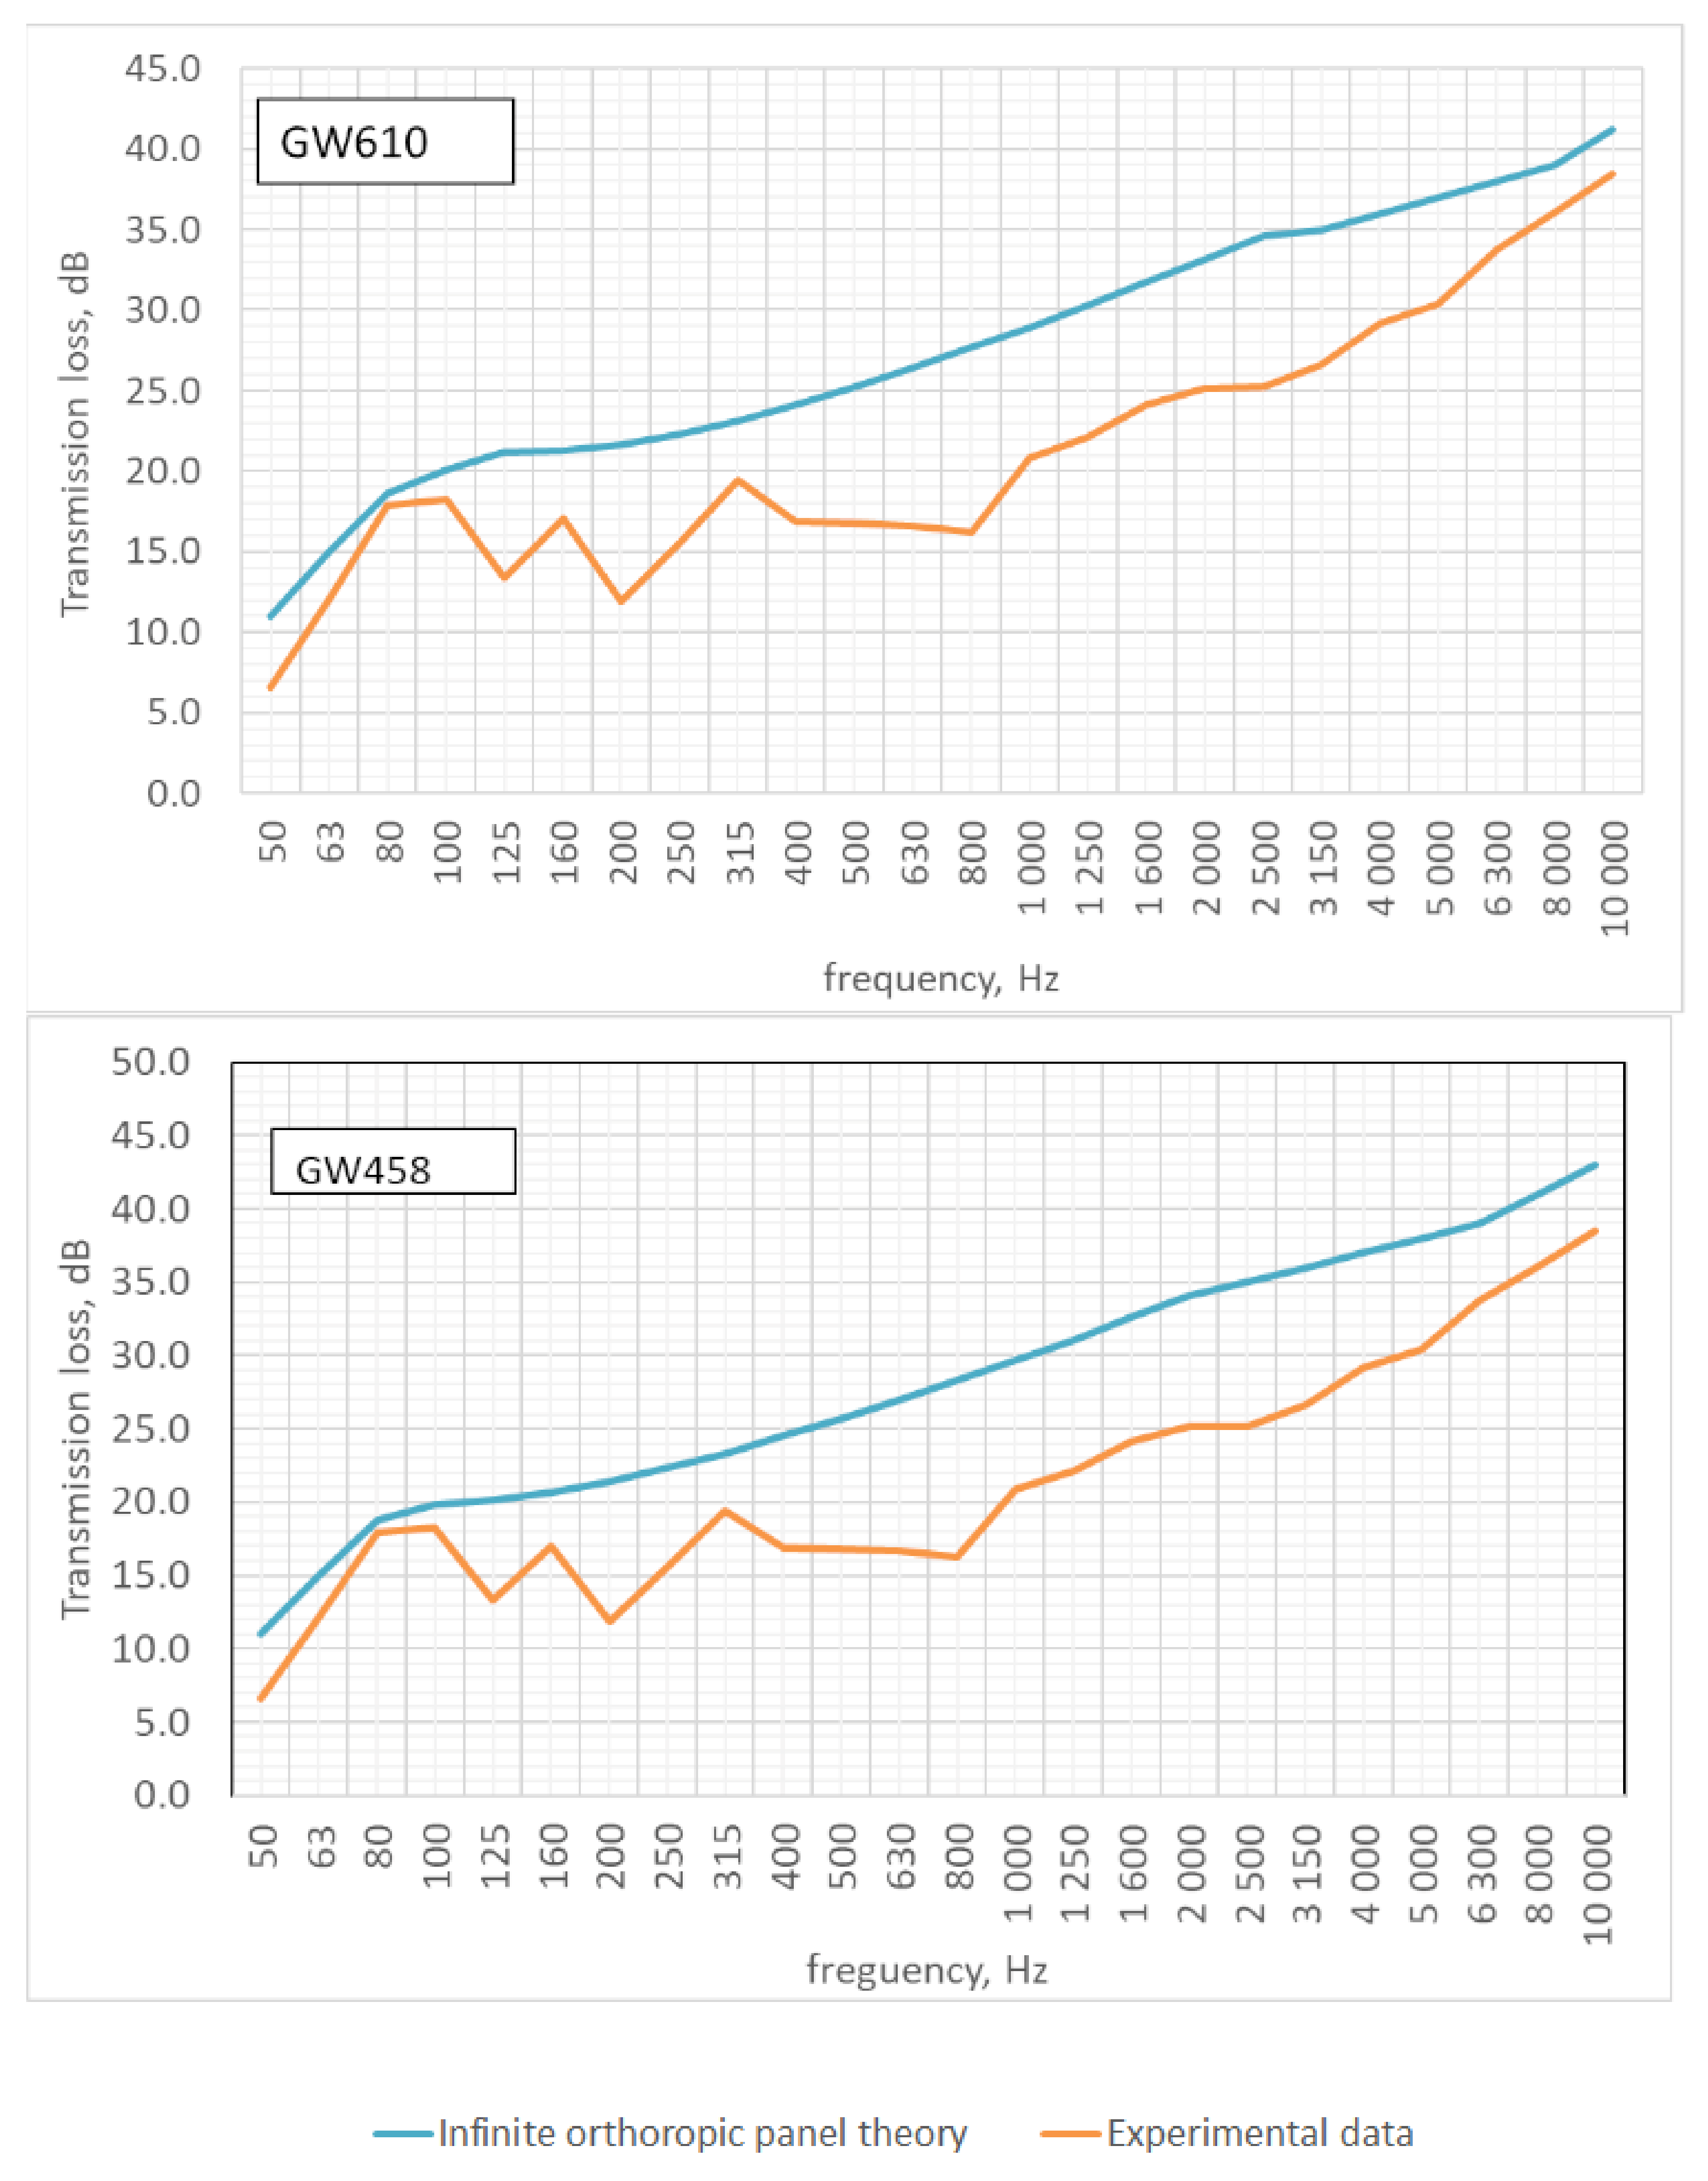
3.1. Transmission Loss

Figure 5 show the measured TL values for the studied fluted PVC panels. For studied panels, the transmission loss is influenced by four factors: size, stiffness, mass, and damping. In Figure 5, similar TL spectrums are observed. In the low and medium frequencies, the three visible peaks are observed: around 100 Hz, 160 Hz, and 315 Hz, and dip at 125 Hz and 200 Hz. These dips can be interpreted as a specific vibrational mode of the panel or the lowest acoustic coincidence of the panels. At low frequencies, the transmission depends heavily on stiffness, as can be observed for GW700 panels under 63 Hz. With greater bending stiffness and a shorter span, the transmission loss is the highest. However, the measured transmission loss of all fluted panels indicates no distinct lower critical frequency shift with the change of panel shape. The low-frequency response of panels of different depths is similar.
However, at the frequency of the incident, the wave increases and the panels will resonate at a series of frequencies, such as resonance or eigenfrequencies. This is because the panels have a finite boundary and edge fixing. The resonance frequencies comprise a fundamental frequency and integer multiples of this called harmonics. At the fundamental resonance, f1,1, the sound transmission through the panel is enhanced, and the transmission loss drops significantly. Damping, as an isolation material, provides the only means to control resonance. Presently, damped materials (such as rubber, fibrous substances, plastic sheets, mastic solutions, and adhesive films) specifically planned to minimize resonance problems are widely used. Highly damped materials also excel at controlling or preventing rebound, thus making damped isolation mounts ideal for controlling shock problems. The fundamental resonance frequencies, f1,1, of a supported rectangular orthotropic panel of width a and length b were calculated according to:
f i , n = π 2 m 1 / 2 B x i 4 a 4 + B y n 4 b 4 + B x y i 2 n 2 a 2 b 2
B x y = 1 2 B x ν + B y ν + G h 3 / 3
where G = E/[2(1 + ν)] is material modulus rigidity, E is Young’s modulus, ν is Poisson’s ratio, a and b are panel dimensions, and h is the panel thickness (Table 1).
Above 800 Hz, the sound transmission depends on the mass inertia of panels and is independent of its stiffness. In this frequency region, part of the acoustic energy is transmitted through the panel, and the rest is reflected. A direct relationship exists between panels’ weight and the resulting transmission loss, except for the GW300 panel. Generally, an increase in transmission loss is expected with increasing mass because the heavier the panel, the less it vibrates in response to the sound waves, and hence the less sound energy it radiates on the other side. The mass law predicts that the transmission loss will increase by approximately 6 dB for each: doubling of the surface mass or doubling of the frequency. The mass can be increased using thicker material or denser material. Theoretically, all noise control problems could be solved by increasing the partition mass. However, practical considerations limit the usefulness of this option.
In our case, the way of joining the panels and their corrugated construction causes the sound insulation to not be improved only by an increase in mass. One of the most critical factors affecting the sound insulation across building elements is sound transmission through narrow or joining gaps that occur in the joining of construction elements (panels, windows, doors, floor panels, etc.). The sound leakage through such gaps deteriorates the sound insulation performance of the elements. The effect of sound transmission through the gaps or apertures was investigated theoretically [52,53,54,55].
Leaks introduced through the slits can significantly reduce the sound insulation properties of the panel or enclosures. In our studies, a decreased TL spectrum in the frequencies was observed for GW300. This result reveals that the drop in the TL values might be caused by setting an air space along the gap which exists between the panels and depends on the size of the gaps.
However, increasing panel mass lowers resonance frequencies and raises the critical frequencies. For the studied panels, as an orthotropic panel, two critical frequencies were calculated, according to Hansen, and shown in Table 2.
For these types of panels, the critical frequency depends on the direction of the incident acoustic wave. The range of critical frequencies is bounded at the lower end by the critical frequency corresponding to a wave travelling in the panel’s most stiff direction and at the upper end by the critical frequency corresponding to a wave propagating in the least stiff direction.
Calculated panel properties allowed for a comparison of the theoretical values and measurement result, as shown in Figure 6, Figure 7 and Figure 8, and values are given in Table 3, Table 4, Table 5 and Table 6. The results show that Hansen’s scheme provides a reasonable TL prediction in agreement with measured results for studied GW270 and GW300, which could be connected with the good results of Hansen’s theoretical model for thin panels. For the rest of the panels, the predictions differ from the measurement overestimating at higher frequencies. There are also differences between theory and experiment at low frequencies. The first resonance frequency of the studied panels varies from 80 Hz to 230 Hz. As this theory only applies to frequencies well above the first resonance frequency of the panel, some discrepancies are expected. However, this approach that was developed by Hansen cannot account for localised vibration effects, as can be seen in Figure 5, Figure 6, Figure 7 and Figure 8. The following behaviour, such as the resonance of corrugated or fluted panels, is to be especially noted. A stiff construction moves the first resonance to higher frequencies but the frequency of coincidence moves to lower frequencies. Thus, the extent of the mass law region depends on the stiffness of the panel.
According to Bies and Hansen [33], there are two important points worth noting when using prediction schemes for orthotropic panels. For small panels, the transmission loss of 0.7ƒc1 is underestimated, the error becoming larger as the frequency becomes lower or the panel becomes smaller. For common fluted or corrugated panels, there is nearly always a frequency between 2000 and 4000 Hz where there is a dip of up to 5 dB in the experimental transmission loss spectrum, which is not predicted by theory. This corresponds either to an air resonance between the corrugations or a mechanical resonance of the flat panel between the ribs.
The orthotropic plate theory predicts a shift of critical frequency (especially fc2), which would make the TL below the critical frequency higher. This was not observed in the experimental data.
The existence of a critical frequency range has an impact on the transmission loss of orthotropic panels. In this case, the coincidence region may extend over two decades for common fluted panels. Therefore, these types of panels should be avoided where noise control is crucial. However, it may be expected that the damping of these panels can improve by adding damping material (wool or others).

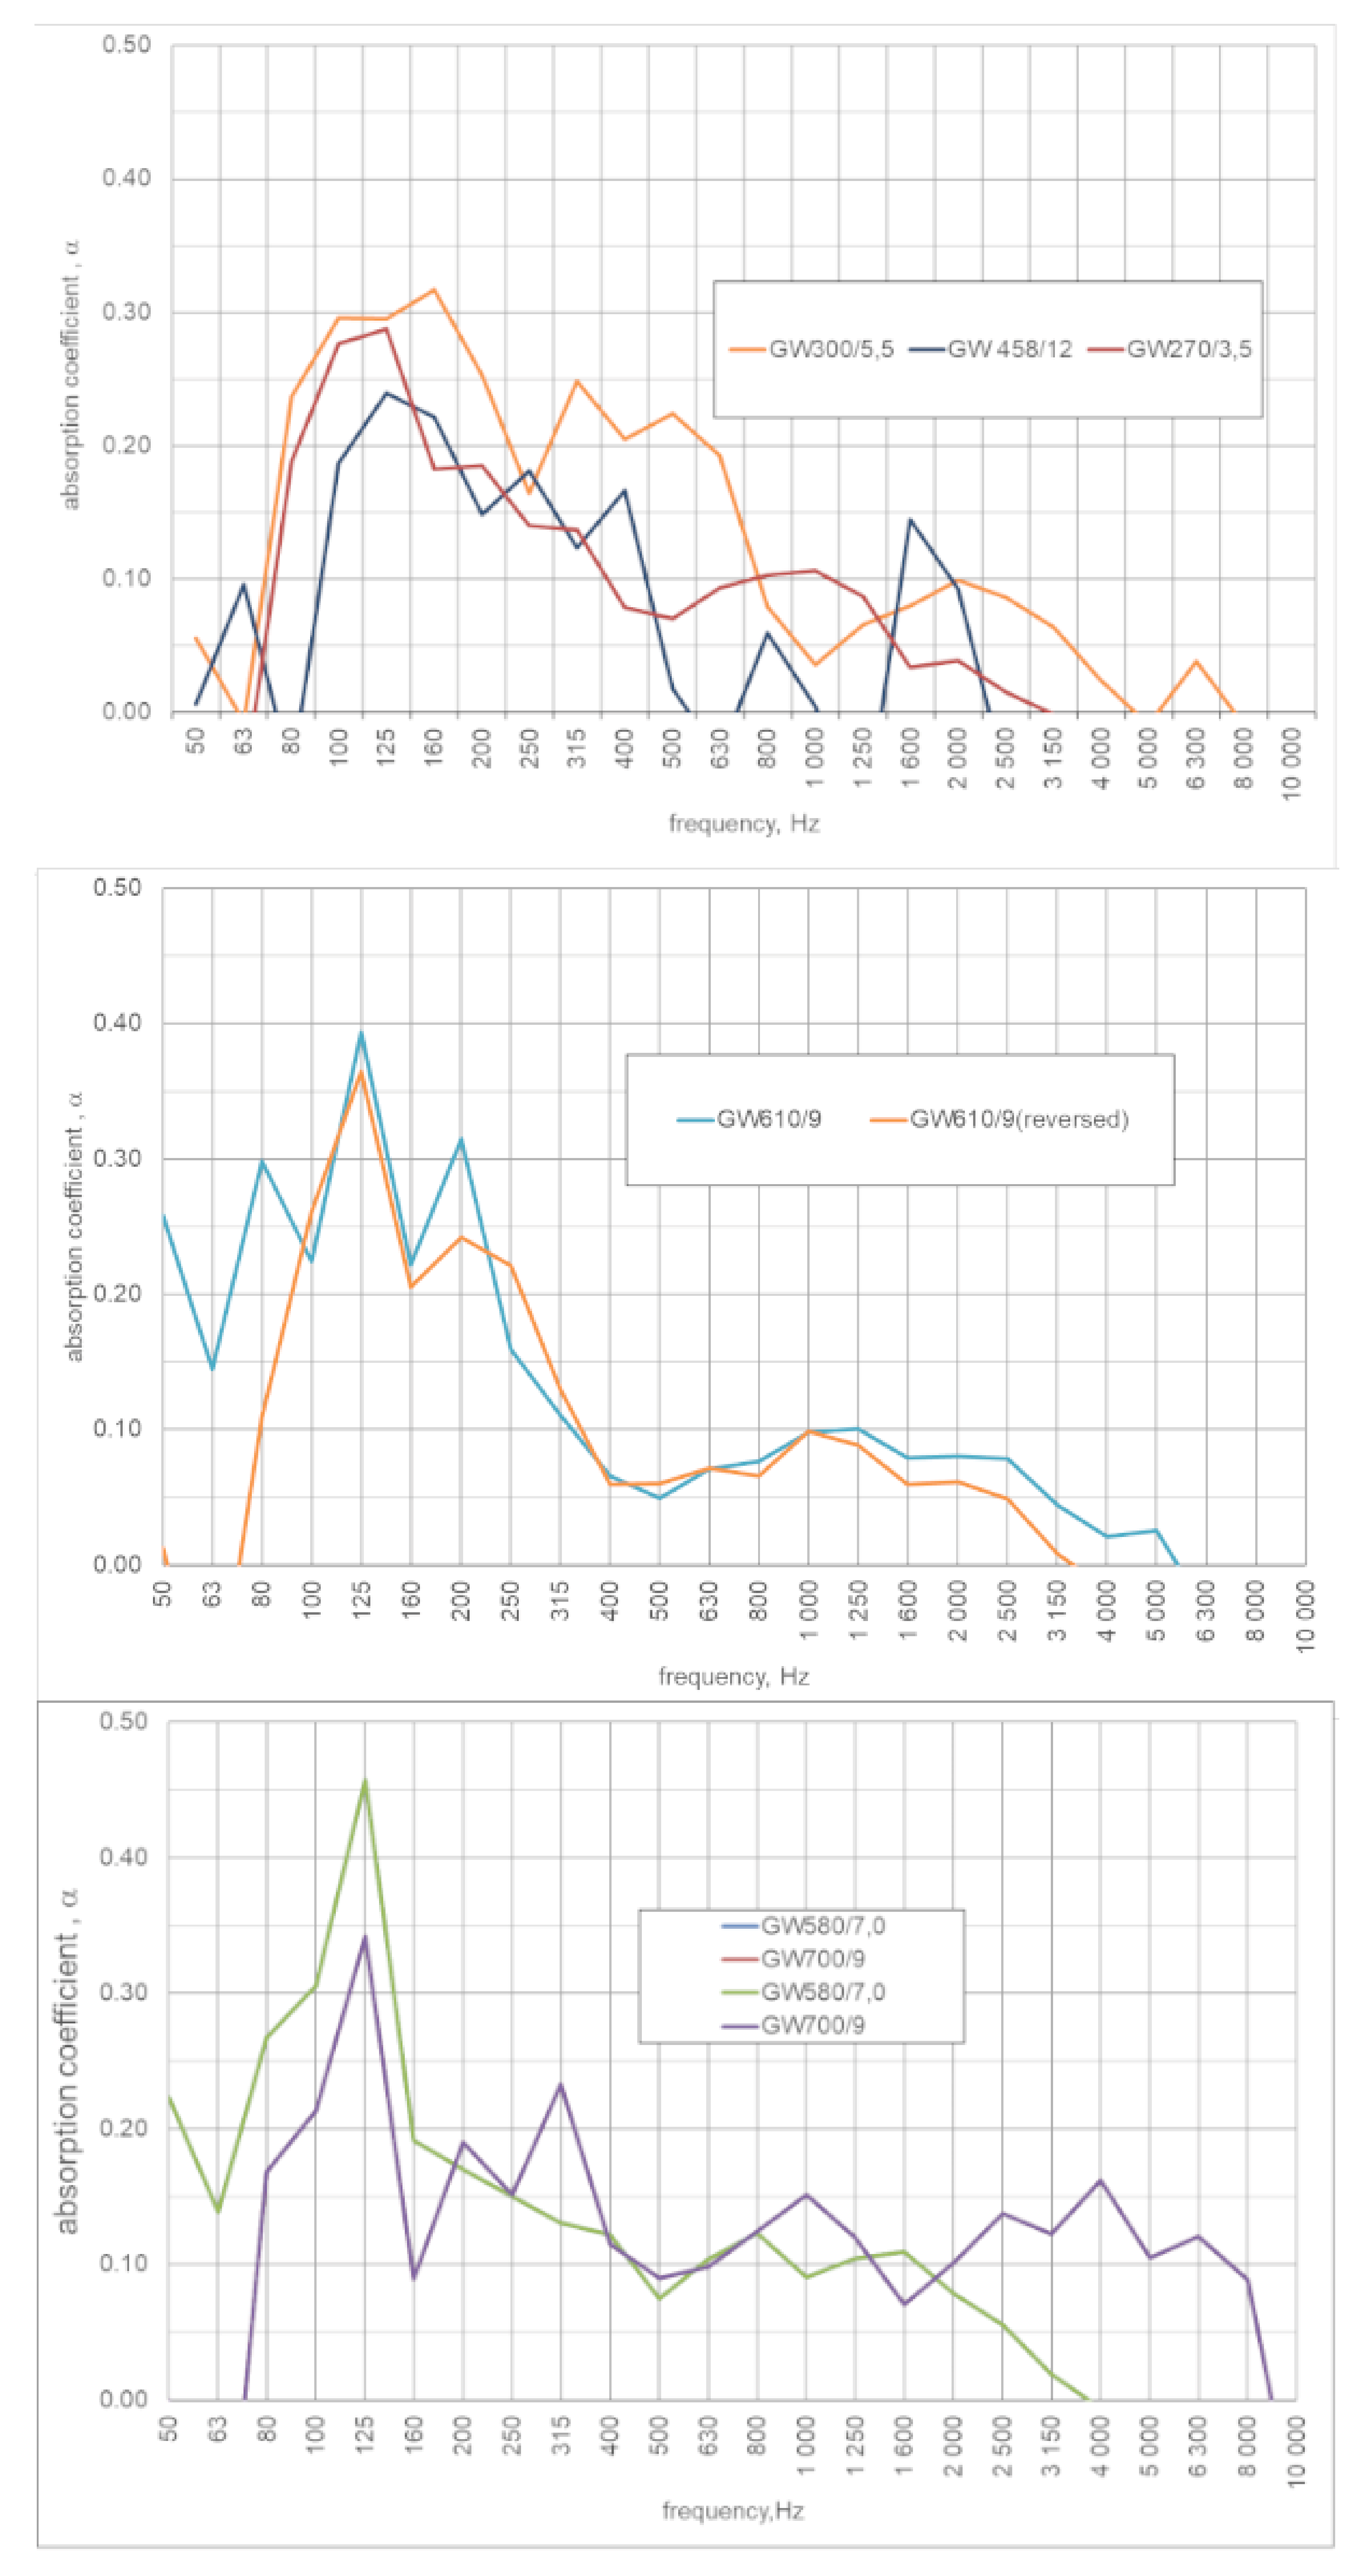
3.2. Absorption Coefficient

The results of the absorption coefficients are presented in Figure 9 in 1/3-octave bands and are collected in Table 6. The results are the arithmetic average of the three measurements and calculations.
The studied panels have enough acoustic absorption property in selected frequencies. If the material sound absorption coefficient is above 0.4, it is considered to have good noise absorbing properties. For the studied panel, some dependencies between the absorption coefficient and their construction were found. It can be assumed that the shape of the panel matters here. A similar spectrum for GW700, GW610, and GW580 was observed, with α ≈ 0.4/0.45 at 125 Hz. For the GW610 panel, the second peak was observed at 200 Hz (α ≈ 0.3), similar to GW710 (α ≈ 0.25 at 315 Hz). An increase in the absorption coefficient was observed between 2000–8000 Hz for the GW710 panel. Panels GW270, GW300, and GW448 have poor absorption below this range (α ≈ 0.3). However, an advantage here is an increased absorption between 100–400 Hz. A higher absorption coefficient was observed in the frequency range, with a decrease in transmission loss. The absorption properties of the studied fluted PVC panels are strictly connected with their resonance. In studied cases, this dip could correspond to the resonance frequency associated with the space between the ribs and wave propagation in the panel’s plane. This frequency is independent of panel size, and although it can be calculated reasonably accurately, the magnitude of the corresponding dip cannot be calculated at this research stage.

4. Conclusions

The results presented in this article demonstrated the transmission loss and absorption co-efficient of fluted PVC panels. The single fluted PVC panels were studied in reverberation rooms. It was found theoretically and experimentally that the type of panel influenced the transmission loss and absorption coefficient. In all cases, there are some discrepancies in TL between the orthotropic plate theory (Hansen model) and experimental data of fluted panels at low frequencies. The first eigenfrequencies of the panels were calculated according to the Hansen model. Resonant characteristics were noticed in the absorption and transmission loss results. The experimental transmission loss of the corrugated plate increases and demonstrates some oscillations. For studied panels, the approach developed by Hansen cannot account for localised vibration effects. The spectrum observed in the experimental data cannot be exactly explained using theory. The analytical prediction results represent a smooth curve and must be used with caution for studying fluted PVC panels.

Author Contributions

Conceptualisation, J.M.K., P.K. and M.G.; Data curation, J.G.; Formal analysis, J.M.K. and W.Z.; Investigation, J.M.K., W.Z., P.K. and G.B.; Methodology, J.M.K., M.G. and P.G.; Resources, J.G.; Software, K.W.; Visualisation, J.M.K.; Writing—Original draft, J.M.K.; Writing—Review and editing, J.M.K., P.K. and A.M. All authors have read and agreed to the published version of the manuscript.

Funding

This research received no external funding.

Institutional Review Board Statement

Not applicable.

Informed Consent Statement

Not applicable.

Data Availability Statement

Not applicable.

Conflicts of Interest

The authors declare no conflict of interest.

References

  1. European Comission. A New Industrial Strategy for Europe; European Comission: Brussels, Belgium, 2020. [Google Scholar]
  2. Geyer, R.; Jambeck, J.R.; Law, K.L. Production, Use, and Fate of All Plastics Ever Made. Sci. Adv. 2017, 3, e1700782. [Google Scholar] [CrossRef] [Green Version]
  3. Kirchherr, J.; Reike, D.; Hekkert, M. Conceptualizing the Circular Economy: An Analysis of 114 Definitions. Resour. Conserv. Recycl. 2017, 127, 221–232. [Google Scholar] [CrossRef]
  4. Al-Malack, M.H. Migration of Lead from Unplasticized Polyvinyl Chloride Pipes. J. Hazard. Mater. 2001, 82, 263–274. [Google Scholar] [CrossRef]
  5. Health Care without Harm. The Polyvinyl Chloride Debate: Why PVC Remains a Problematic Material; Health Care without Harm: Washington, DC, USA, 2021. [Google Scholar]
  6. World Health Organization. Environmental Noise Guidelines for the European Region; WHO: Geneva, Switzerland, 2018. [Google Scholar]
  7. European Commission. Noise Impacts on Health; European Comission: Brussels, Belgium, 2015. [Google Scholar]
  8. Cheng, L.; Yao, Y.; Tang, X. On the Flame-Retardant Properties of Soft PVC-Base Composite Insulation. J. Zhejiang Technol. Univ. 2011, 28, 160–165. [Google Scholar]
  9. Yang, T.; Fu, Y. Sound Insulation of Honeycomb Weave Fabric Reinforced Polyvinylchloride Composite. J. Text. Res. 2011, 32, 65–70. [Google Scholar]
  10. Liu, H. Study on Performance Impact of Filler to PVC Flexible Insulation Composite Material; Zhejiang University of Technology: Hangzhou, China, 2012. [Google Scholar]
  11. Huang, L.; Tan, L.; Xia, B. Noise Test and Control for Commercial Air Conditioner’s Compressors. Noise Vib. Control 2015, 1, 191–194. [Google Scholar]
  12. Xue, H.; Lai, X.; Zhang, S. Research on Deadening Felt of Inverter Compressor. Electr. Appl. 2014, 8, 76–78. [Google Scholar]
  13. Pulngern, T.; Eakintumas, W.; Rosarpitak, V.; Sombatsompop, N. Compressive Load, Thermal and Acoustic Properties of Wood/Polyvinyl Chloride Composite Log-Wall Panels. J. Reinf. Plast. Compos. 2017, 36, 1183–1193. [Google Scholar] [CrossRef]
  14. Mun, D.-H.; Song, G.-G.; Lee, C.-S.; Park, H.-G. Reduction of Floor Impact Noise and Impact Force for PVC Floor Covering and Floor Mat. Trans. Korean Soc. Noise Vib. Eng. 2014, 27, 501–508. [Google Scholar] [CrossRef]
  15. Hussein, H.H.; Eedan, O.A.; Ahmed, M.K. Mechanical, Thermal and Acoustical Properties of Concrete with Fine Polyvinyl Chloride (PVC). Iraqi J. Civ. Eng. 2016, 12, 81–91. [Google Scholar]
  16. Xu, X.; Quan, J. Brief Analysis on Application of PVC Foam Materials in Building Material Industry. In Materials Science Forum; Trans Tech Publications Ltd.: Bäch, Switzerland, 2019; Volume 944, pp. 729–735. [Google Scholar] [CrossRef]
  17. Konstantinov, A.; Verkhovsky, A.; Lyabakova, E. Sound Insulation of PVC Windows at Negative Outdoor Temperatures. In IOP Conference Series: Materials Science and Engineering; IOP Publishing: Bristol, UK, 2020; Volume 896. [Google Scholar]
  18. Fang, Z.; Jiang, M.; Zhang, Y. Experimental Research on PVC Sound Insulation Improving the Front Noise of Refrigerator. Home Appl. Technol. 2014, 2–4. [Google Scholar]
  19. Agyeman-Prempeh, N.O.W.O. Noise Abatement in Machine Shops Through the Use of Recycled Coconut Fibre and Polyvinyl Chloride Sheets As Noise Absorbing Materials. Master’s Thesis, University of Ghana, Accra, Ghan, 2017. [Google Scholar]
  20. Kuan, L.J. Analysis of Noise Barrier for Apartment. Bachelor’s Thesis, Tunku Abdul Rahman University College, Lumpur, Malaysia, 2017. [Google Scholar]
  21. Roschke, P.N.; Esch, S.T. Construction of Full-Scale Noise Barrier with Recycled Plastic. Transp. Res. Rec. 1999, 1656, 94–101. [Google Scholar] [CrossRef]
  22. Saageghvaziri, M.; Macbain, K. Sound Barrier Applications of Recycled Plastics. Transp. Res. Rec. 1998, 1626, 85–92. [Google Scholar] [CrossRef]
  23. Benkreira, H.; Khan, A.; Horoshenkov, K.V. Sustainable Acoustic and Thermal Insulation Materials from Elastomeric Waste Residues. Chem. Eng. Sci. 2011, 66, 4157–4171. [Google Scholar] [CrossRef]
  24. May, D.N.; Osman, N.M. Highway Noise Barriers: New Shapes. J. Sound Vib. 1980, 71, 73–101. [Google Scholar] [CrossRef]
  25. Murata, K.; Nagakura, K.; Tanaka, S.I. Noise Reduction Effect of Noise Barrier for Shinkansen Based on Y-Shaped Structure. Q. Rep. RTRI 2006, 47, 162–168. [Google Scholar] [CrossRef]
  26. Galińska, B.; Kopania, J. Hałas Drogowy a Skuteczność Ekranów z Oktagonalnymi Reduktorami Dźwięku. Autobusy Tech. Eksploat. Syst. Transp. 2016, 6, 168–171. [Google Scholar]
  27. Fujiwara, K.; Hothersall, D.C.; Kim, C. Noise Barriers with Reactive Surfaces. Appl. Acoust. 1996, 53, 255–272. [Google Scholar] [CrossRef]
  28. Watts, G.R. Acoustic Performance of Parallel Traffic Noise Barriers. Appl. Acoust. 1996, 47, 95–119. [Google Scholar] [CrossRef]
  29. Jolibois, A.; Defrance, J.; Jean, P.; Duhamel, D.; Sparrow, V.W. In Situ Measurement of the Acoustic Performance of a Full Scale Tramway Low Height Noise Barrier Prototype. Appl. Acoust. 2015, 94, 57–68. [Google Scholar] [CrossRef] [Green Version]
  30. Castiñeira-Ibañez, S.; Rubio, C.; Sánchez-Pérez, J.V. Environmental Noise Control during Its Transmission Phase to Protect Buildings. Design Model for Acoustic Barriers Based on Arrays of Isolated Scatterers. Build. Environ. 2015, 93, 179–185. [Google Scholar] [CrossRef]
  31. Heckl, M. Untersuchungen an Orthotropen Platten. Acoustics 1960, 10, 109–115. [Google Scholar]
  32. Cremer, L.; Heckl, M. Structure-Borne Sound; Springer: Berlin/Heidelberg, Germany, 1988; ISBN 978-3-662-10123-0. [Google Scholar]
  33. Bies, D.A.; Hansen, C.H. Engineering Noise Control; Unwin Hyman Ltd.: London, UK, 1988. [Google Scholar]
  34. Alexander, N.J.H. Measurement of Sound Absorption and Transmission of Corrugated Steel Plates. Proc. Inst. Acoust. 1988, 10, 39–50. [Google Scholar]
  35. Rowell, M.A.; Oldham, D.J. The Directivity of Orthotropic Factory Cladding Panels. Proc. Inst. Acoust. 1988, 10, 39–51. [Google Scholar]
  36. Cordonnier-Cloarec, P. Contribution to the Study of Sound Transmission and Radiation of Corrugated Steel Structures. J. Sound Vib. 1992, 157, 515–530. [Google Scholar] [CrossRef]
  37. Hansen, C.H. Sound Transmission Loss of Corrugated Panels. Noise Control Eng. J. 1993, 40, 187–197. [Google Scholar] [CrossRef]
  38. Davy, J.L. Predicting the Sound Transmission Loss of Cavity Walls. In Proceedings of the Interior Noise Climates: National Conference of the Australian Acoustical Society, Perth, Australia, 19–20 April 1990. [Google Scholar]
  39. Mohammadi, H.; Ziaei-Rad, S.; Dayyani, I. An Equivalent Model for Trapezoidal Corrugated Cores Based on Homogenization Method. Compos. Struct. 2015, 131, 160–170. [Google Scholar] [CrossRef]
  40. Bartolozzi, G.; Pierini, M.; Orrenius, U.; Baldanzini, N. An Equivalent Material Formulation for Sinusoidal Corrugated Cores of Structural Sandwich Panels. Compos. Struct. 2013, 100, 173–185. [Google Scholar] [CrossRef]
  41. Mang Herbert, A.; Vallabhan, C.G.; Smith Jimmy, H. Finite Element Analysis of Doubly Corrugated Shells. J. Struct. Div. 1976, 102, 2033–2051. [Google Scholar] [CrossRef]
  42. Aoki, Y.; Maysenhölder, W. Experimental and Numerical Assessment of the Equivalent-Orthotropic-Thin-Plate Model for Bending of Corrugated Panels. Int. J. Solids Struct. 2017, 108, 11–23. [Google Scholar] [CrossRef]
  43. Piscoya, R.; Ochmann, M. Calculation of the Transmission Loss of Thin Plates in a Kundt’s Tube. In Proceedings of the Euronoise 2012, Prague, Czech Republic, 10–13 June 2012; p. 6. [Google Scholar]
  44. Piscoya, R.; Burgschweiger, R.; Ochmann, M. Numerical Simulation of the Transmission Loss of Plates. J. Acoust. Soc. Am. 2012, 131, 3271. [Google Scholar] [CrossRef]
  45. Piscoya, R.; Ochmann, M. Transmission Loss of Corrugated Plates. In Proceedings of the Forum Acusticum 2011, Aalborg, Denmark, 27 June–1 July 2011; p. 5. [Google Scholar]
  46. Nabeel Alshabatat Design of Corrugated Plates for Optimal Fundamental Frequency. Adv. Acoust. Vib. 2016, 2016, 4290247. [CrossRef] [Green Version]
  47. Zhang, Y.; Thompson, D.; Squicciarini, G.; Ryue, J.; Xiao, X.; Wen, Z. Sound Transmission Loss Properties of Truss Core Extruded Panels. Appl. Acoust. 2018, 131, 134–153. [Google Scholar] [CrossRef] [Green Version]
  48. Lee, C.-M.; Xu, Y. A Modified Transfer Matrix Method for Prediction of Transmission Loss of Multilayer Acoustic Materials. J. Sound Vib. 2009, 326, 290–301. [Google Scholar] [CrossRef]
  49. Lee, C.-M.; Wang, Y.S. A Prediction Method of the Acoustical Properties of Multilayered Noise Control Materials in Standing Wave-Duct Systems. J. Sound Vib. 2006, 298, 350–365. [Google Scholar] [CrossRef]
  50. Santoni, A.; Davy, J.L.; Fausti, P.; Bonfiglio, P. A review of the Different Approaches to Predict the Sound Transmission Loss Building Partions. Build. Acoust. 2020, 27, 253–279. [Google Scholar] [CrossRef]
  51. Lin, H.-J.; Wang, C.-N.; Kuo, Y.-M. Sound Transmission Loss across Specially Orthotropic Laminates. Appl. Acoust. 2007, 68, 1177–1191. [Google Scholar] [CrossRef]
  52. Mechel, F.P. The Acoustic Sealing of Holes and Slits in Walls. J. Sound Vib. 1986, 111, 297–336. [Google Scholar] [CrossRef]
  53. Oldham, D.J.; Zhao, X. Measurement of the Sound Transmission Loss of Circular and Slit-Shaped Apertures in Rigid Walls of Finite Thickness by Intensimetry. J. Sound Vib. 1993, 161, 119–135. [Google Scholar] [CrossRef]
  54. Nieradka, P.; Dobrucki, A. Insertion Loss of Enclosures with Lined Slits. In Proceedings of the Euronoise 2018, Crete, Greece, 27–31 May 2018. [Google Scholar]
  55. Asakura, T.; Sakamoto, S. Improvement of Sound Insulation of Doors or Windows by Absorption Treatment inside the Peripheral Gaps. Acoust. Sci. Tech. 2013, 34, 241–252. [Google Scholar] [CrossRef] [Green Version]
Figure 1. Panel coordinate system indicates incident wave.
Applsci 12 05732 g001
Figure 2. Corrugated plate profile.
Applsci 12 05732 g002
Figure 3. Panel profiles were studied in this work.
Applsci 12 05732 g003
Figure 4. Reverberation room with the studied panel.
Applsci 12 05732 g004
Figure 5. Measured transmission loss (TL) of studied PVC panels.
Applsci 12 05732 g005
Figure 6. Measured (experimental) and predicted (theory) transmission loss (TL) for GW270 and GW300 PVC panels.
Applsci 12 05732 g006
Figure 7. Measured (experimental) and predicted (theory) transmission loss (TL) for GW580 and GW700 PVC panels.
Applsci 12 05732 g007
Figure 8. Measured (experimental) and predicted (theory) transmission loss (TL) for GW610 and GW458 PVC panels.
Applsci 12 05732 g008
Figure 9. The measured absorption coefficient of studied PVC panels.
Applsci 12 05732 g009
Table 1. The parameters of studied fluted PVC panels.
PanelPanel Thickness mmCommercial MarkYoung’s Modulus GPaPoisson’s RatioCross-Sectional Panel Height mm
h EνZ
GW2703.5light2.40.40.150
GW3005.5light2.40.40.115
GW5807.0Z-type2.40.40.240
GW7009.0Z-type
Strengthened *
2.40.40.250
GW6109.0Ω-type2.40.40.230
GW44812.0Z type2.40.40.254
* undisclosed trade information.
Table 2. Calculated properties of fluted (orthotropic) PVC panels.
Panel TypeSurface Weight kg/m2Bending Stiffness kg × m2/s2Effective Bending Stiffness kg × m2/s2Critical Frequencies HzFirst Resonance Frequency Hz
mBxByBefffc1fc2f1,1
GW2707.244,59913.7780.523813,594136
GW30014.335,28265.81523.8377872886
GW58023.6224,863142.45659.61927621168
GW70029.4255,173282.98496.12016036161
GW61022.6219,878266.87658.51905450170
GW44830.7529,198692.219,139.61433943227
Table 3. Measured and predicted transmission loss for GW270 and GW300 PVC panels.
Frequency HzGW270GW300
CalculatedExperimentalCalculatedExperimental
dBdBdBdB
504.06.26.07.5
636.09.98.011.7
808.014.810.018.2
10010.717.912.022.4
12516.112.514.013.2
16015.813.415.217.9
20016.09.221.111.5
25016.414.620.815.7
31517.118.220.919.5
40018.016.321.418.1
50019.016.622.118.0
63020.115.423.017.1
80021.415.924.017.6
100022.619.425.121.4
125023.920.926.322.9
160025.322.727.625.8
200026.724.728.926.5
250028.125.430.227.3
315029.626.231.728.0
400031.228.433.230.8
500032.729.035.031.8
630034.231.637.034.6
800035.033.739.037.0
10,00037.036.041.041.0
Table 4. Measured and predicted transmission loss for GW580 and GW700 PVC panels.
Frequency HzGW580GW700
CalculatedExperimentalCalculatedExperimental
dBdBdBdB
5011.05.411.05.4
6315.013.215.013.2
8019.118.720.018.7
10020.420.521.420.5
12520.012.721.212.7
16020.215.521.315.5
20020.610.721.710.7
25021.314.422.314.4
31522.220.023.120.0
40023.216.724.216.7
50024.316.825.216.8
63025.516.926.416.9
80026.818.527.718.5
100028.020.828.920.8
125029.422.230.222.2
160030.924.931.824.9
200032.325.233.125.2
250033.725.434.625.4
315035.226.736.026.7
400037.029.138.029.1
500039.030.440.030.4
630041.033.742.033.7
800043.035.144.035.1
10,00045.037.146.037.1
Table 5. Measured and predicted transmission loss for GW580 and GW700 PVC panels.
Frequency HzGW610GW458
CalculatedExperimentalCalculatedExperimental
dBdBdBdB
5011.06.611.06.6
6315.012.115.012.1
8018.617.918.817.9
10020.118.319.918.3
12521.213.320.113.3
16021.317.020.717.0
20021.711.921.411.9
25022.315.522.315.5
31523.119.423.319.4
40024.216.924.516.9
50025.216.725.716.7
63026.416.627.016.6
80027.716.228.316.2
100028.920.829.720.8
125030.222.131.022.1
160031.824.232.624.2
200033.125.134.125.1
250034.625.235.025.2
315035.026.636.026.6
400036.029.237.029.2
500037.030.438.030.4
630038.033.839.033.8
800039.036.041.036.0
10,00041.238.443.038.4
Table 6. The measured absorption coefficient of studied PVC panels.
Frequency HzGW300GW270GW580GW700GW610GW610 (Reversed)GW458
500.056−0.0520.2240.0000.2580.0130.007
63−0.007−0.0560.139−0.2010.145−0.1270.096
800.2370.1880.2670.1680.2980.109−0.047
1000.2960.2770.3050.2130.2240.2610.187
1250.2950.2870.4570.3420.3930.3640.240
1600.3170.1820.1910.0890.2220.2060.221
2000.2530.1850.1710.1900.3150.2420.148
2500.1640.1400.1500.1520.1590.2210.181
3150.2480.1370.1310.2330.1110.1300.124
4000.2050.0790.1220.1150.0660.0590.167
5000.2240.0700.0750.0900.0490.0600.018
6300.1920.0940.1040.0980.0710.072−0.033
8000.0790.1030.1230.1250.0770.0660.060
10000.0360.1060.0900.1520.0980.0980.004
12500.0660.0870.1050.1200.1000.088−0.093
16000.0800.0340.1090.0700.0790.0590.145
20000.0990.0390.0780.1010.0810.0610.093
25000.0860.0150.0550.1370.0780.049−0.048
31500.064−0.0010.0190.1220.0440.008−0.086
40000.024−0.038−0.0060.1620.021−0.017−0.280
5000−0.009−0.080−0.0790.1050.025−0.058−0.388
63000.038−0.141−0.1030.121−0.034−0.105−0.827
8000−0.009−0.161−0.1180.089−0.066−0.096−1.308
10,000−0.097−0.242−0.218−0.094−0.133−0.166−1.106
Publisher’s Note: MDPI stays neutral with regard to jurisdictional claims in published maps and institutional affiliations.

