Article

A New Approach to Predict Dynamic Loads Considering Highway Alignment Using Data Mining Techniques

1
College of Civil Engineering, Fuzhou University, Fuzhou 350108, China
2
Department of Civil Engineering, Ryerson University, Toronto, ON M5B 2K3, Canada
3
Department of Civil and Environmental Engineering, The Hong Kong University of Science & Technology, Clear Water Bay, Kowloon, Hong Kong, China
*
Author to whom correspondence should be addressed.
Appl. Sci. 2022, 12(11), 5719; https://doi.org/10.3390/app12115719
Submission received: 4 May 2022 / Revised: 28 May 2022 / Accepted: 28 May 2022 / Published: 4 June 2022
(This article belongs to the Section Civil Engineering)

Abstract

:
Premature damage to heavy-duty pavement has been found to be significantly caused by the vehicle–highway alignment interaction, especially in mountainous regions. This phenomenon was further verified by field pavement damage investigations and field tests. In order to elucidate the potential mechanism of this interaction, it is important to address the vehicle dynamic loads generated by the interaction between vehicle and pavement. Based on this, the paper realizes a new method of vehicle dynamic load prediction using data mining techniques, namely artificial neural network (ANN) and support vector machine (SVM)). The data, including dynamic loads and highway geometric characteristics, were collected by a wheel force transducer (WFT) and global positioning system (GPS), respectively. The coefficient of determination (R2) and root mean square error (RMSE) were used to evaluate the performance of the prediction models. The results showed that the proposed dynamic load prediction model established by ANN was better than that by SVM. Moreover, the model implied that dynamic loads were highly correlated with curvature and longitudinal grade, and furthermore, curvature was found to have a larger effect. The proposed dynamic load prediction technique provides a feasible and rapid approach to identify pavement damage under complex vehicle–highway alignment interactions.

1. Introduction

With the significant growth of traffic volume worldwide, pavement service life has tremendously decreased, especially on some roads predominant with heavy trucks. Premature damage to highway pavements (e.g., rigid, semi-rigid, and flexible) has proven to be strongly related to excessive vehicle dynamic loads [1,2,3]. In addition, this kind of damage has also been widely observed in some specific pavements with extremely complex alignments [4,5,6]. These results indicate that pavement service performance is strongly correlated with dynamic loads and highway alignments.
Recently, some efforts have been dedicated to studying the separate impacts of highway alignment characteristics (e.g., grade and curvature) on dynamic loads [7,8,9]. However, due to the complexity of dynamic loads (e.g., microscopic and macroscopic factors), the interaction between vehicle dynamic loads and highway alignments has not been fully addressed. Moreover, previous studies on dynamic loads have mainly focused on microscopic factors, such as roughness [10,11,12,13], and little attention has been paid to dynamic loads under macroscopic aspects, such as horizontal and vertical alignments. This ambiguity of such interactions will probably skew pavement design decisions, thereby significantly underestimating pavement service life.
Therefore, the development of a reliable method to accurately predict dynamic loads under vehicle–alignment interactions becomes necessary. In this paper, data mining techniques are used to predict dynamic loads under vehicle–highway alignment interactions. The main contributions and findings of this research work are as follows:
(a)
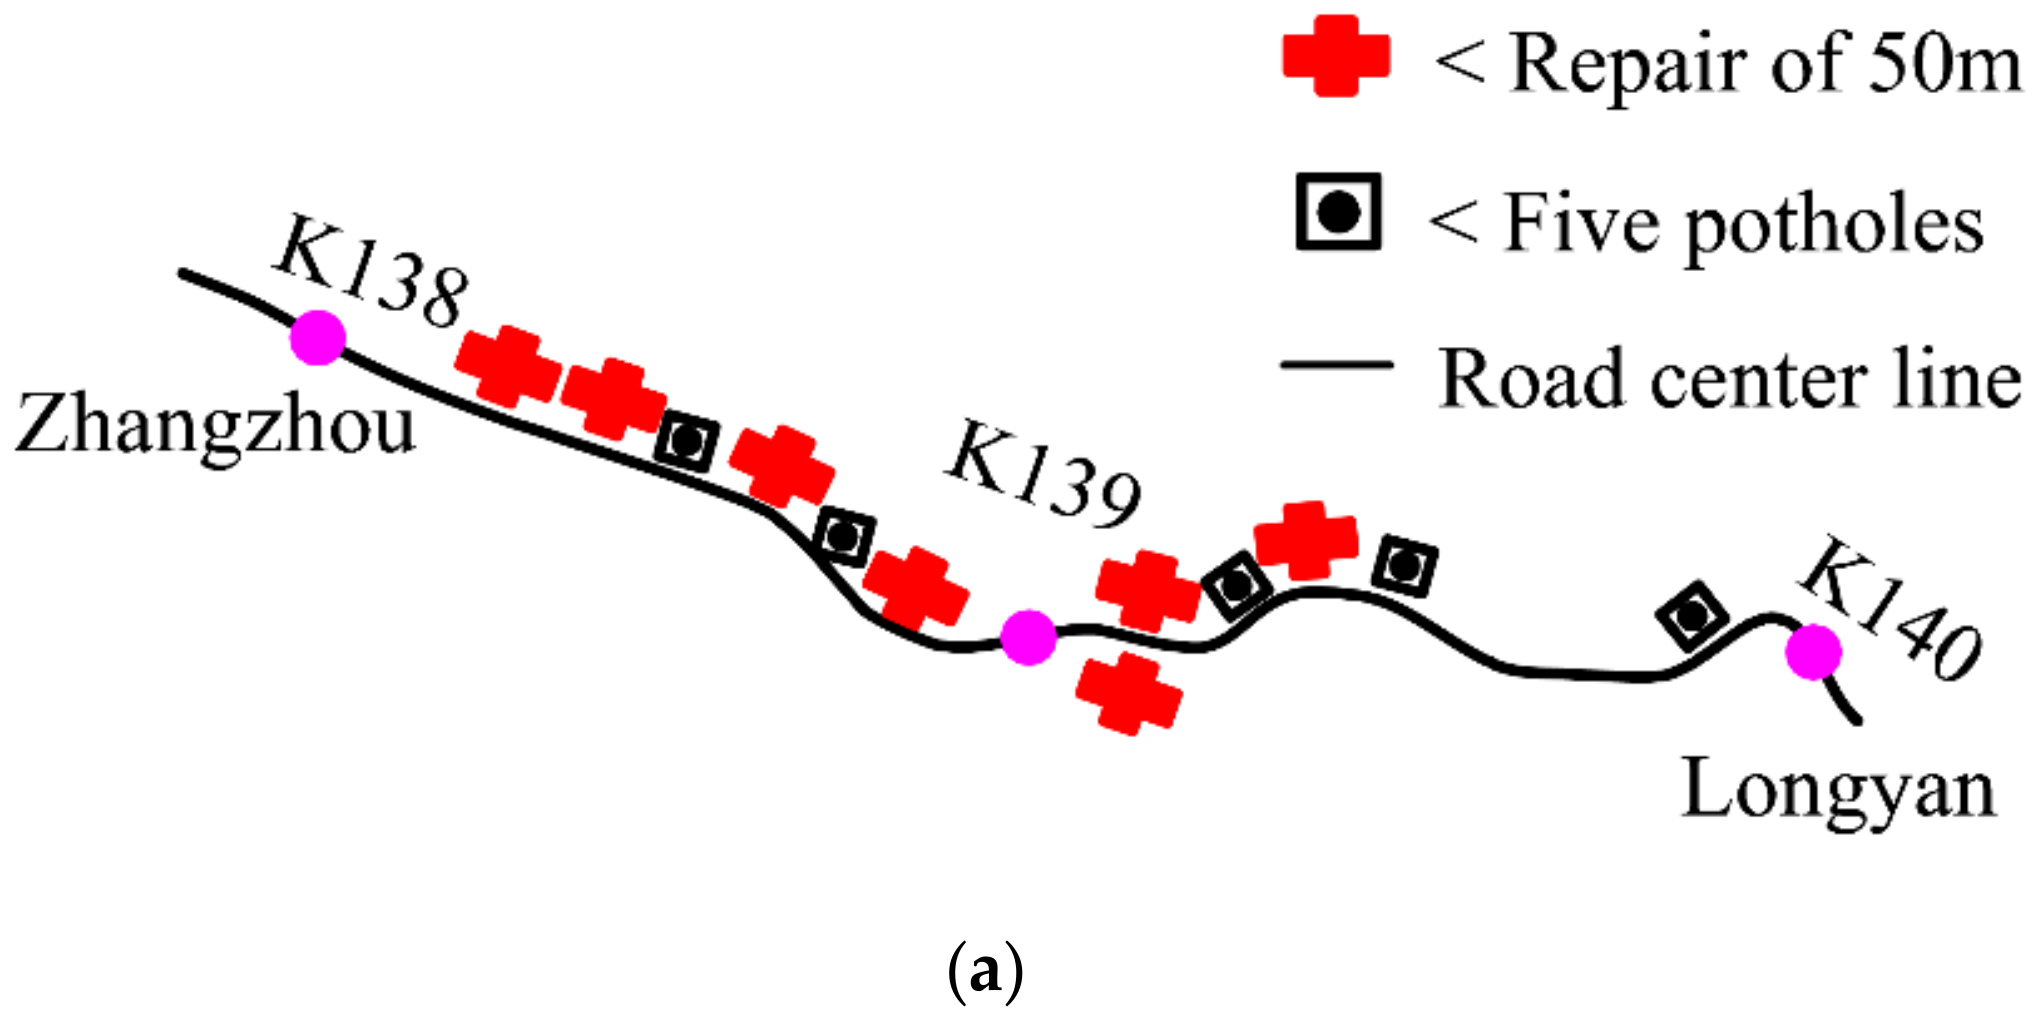
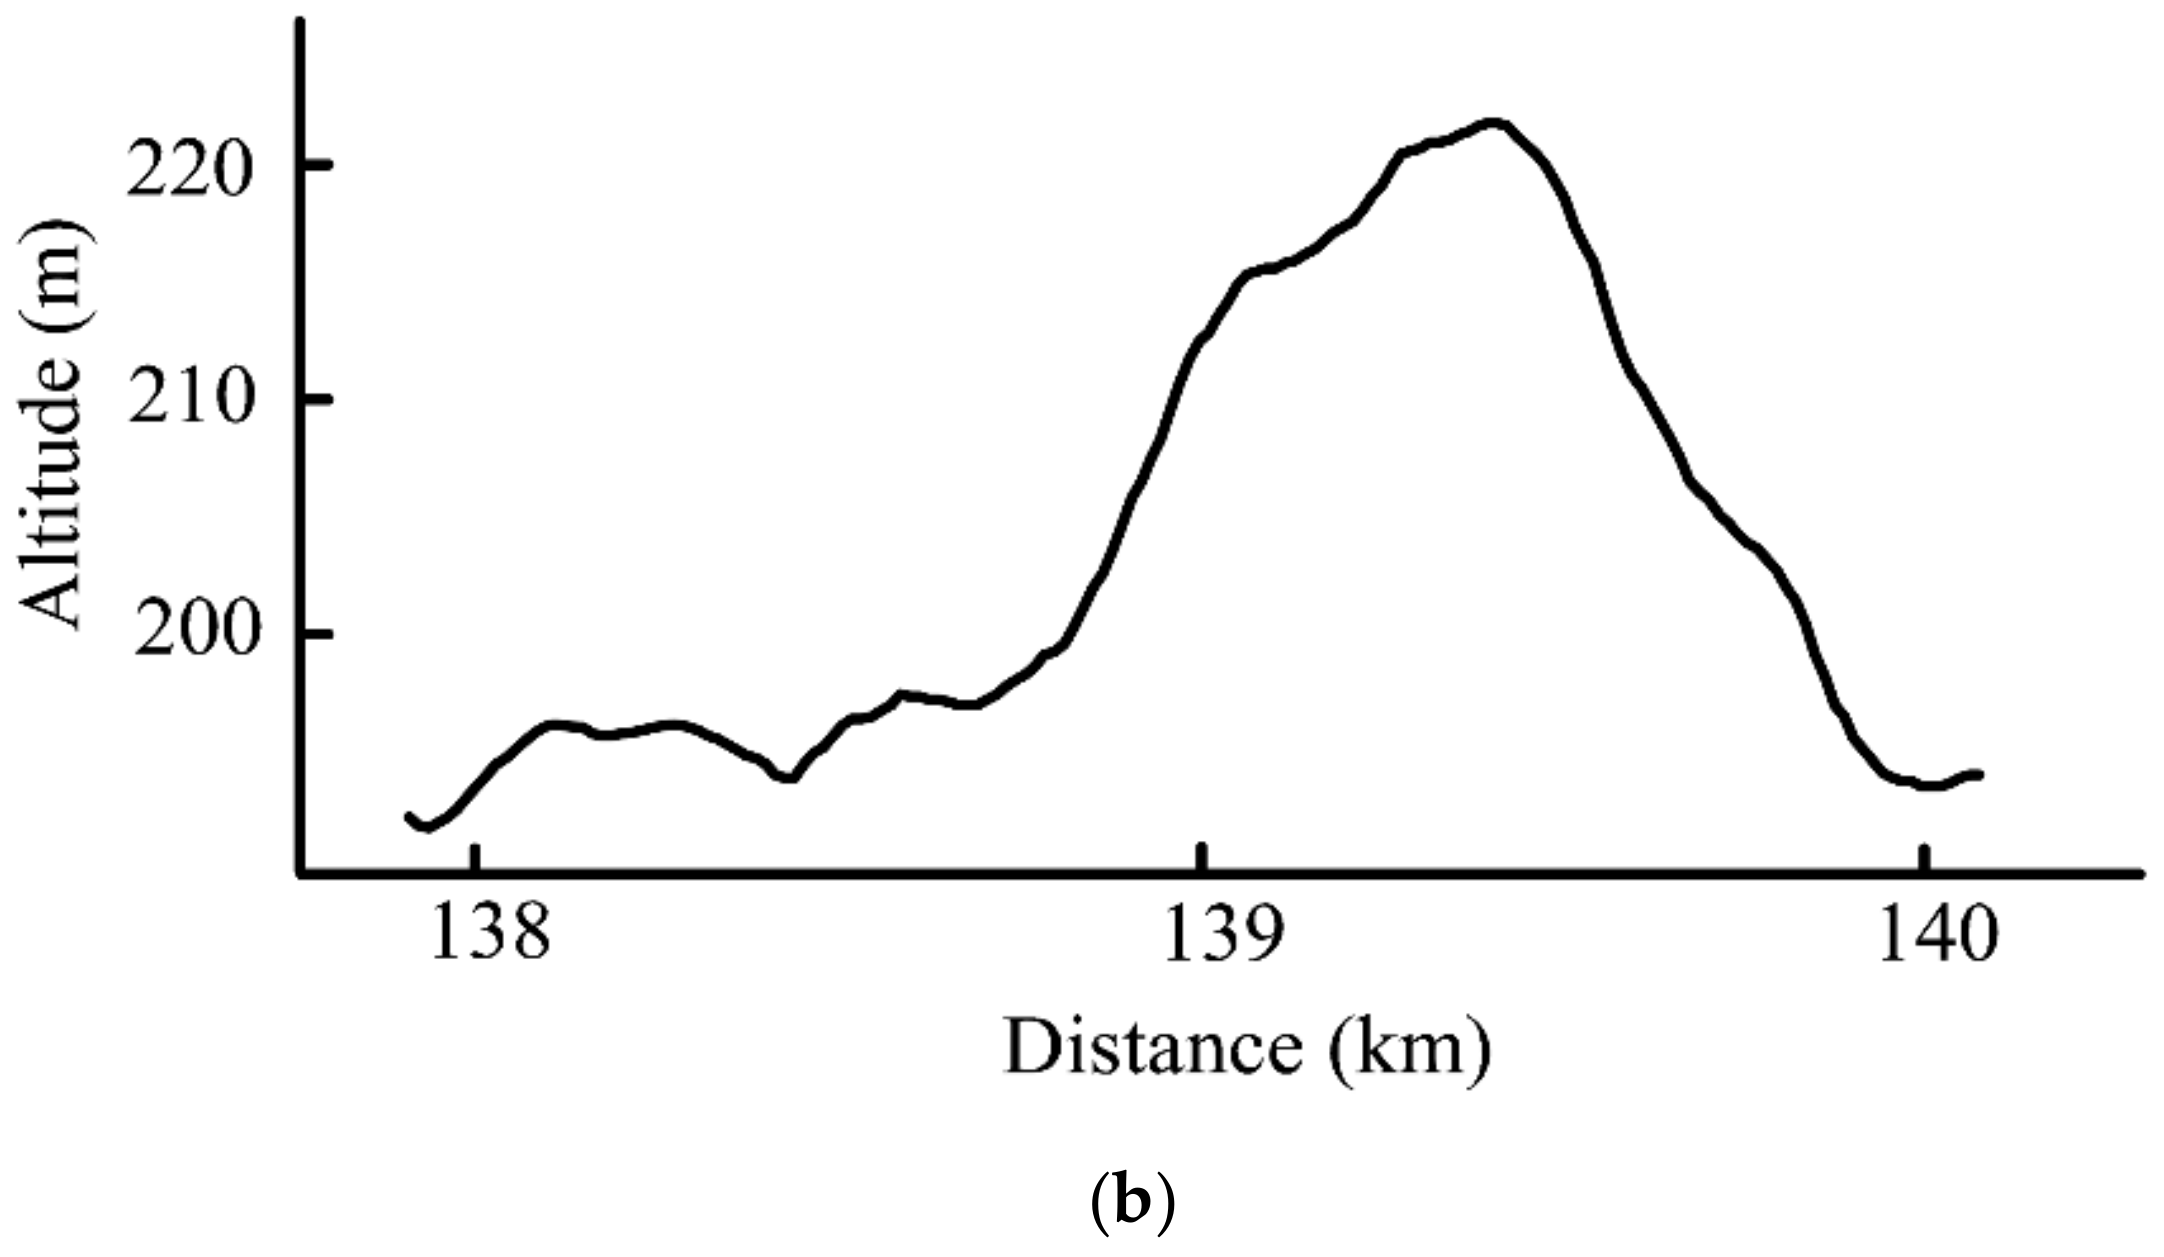
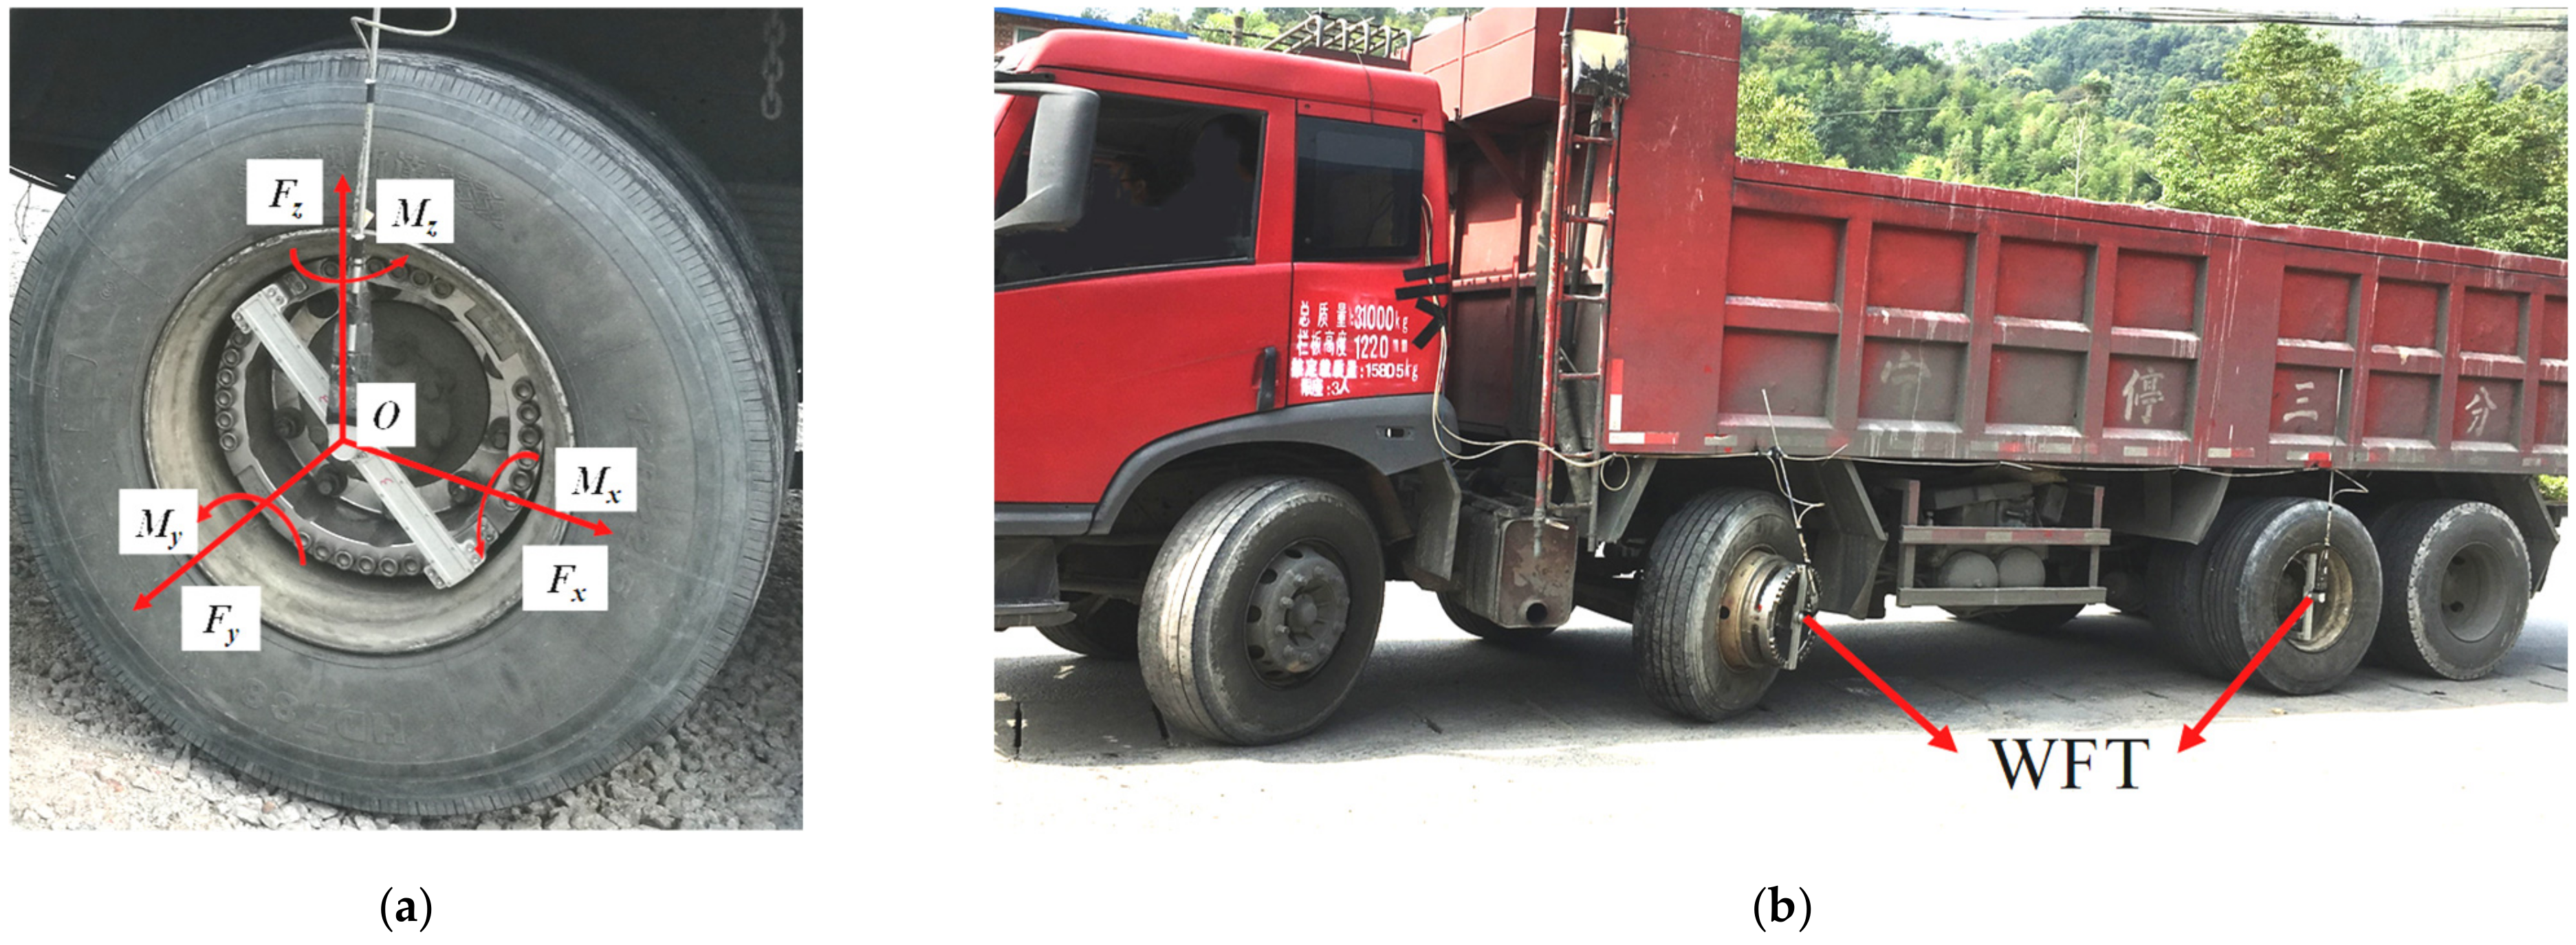
A six-component wheel force transducer (WFT) was used to acquire dynamic load data under various combinations of highway alignment and vehicle loads. Based on the data, the basic characteristics of dynamic loads were determined.
(b)
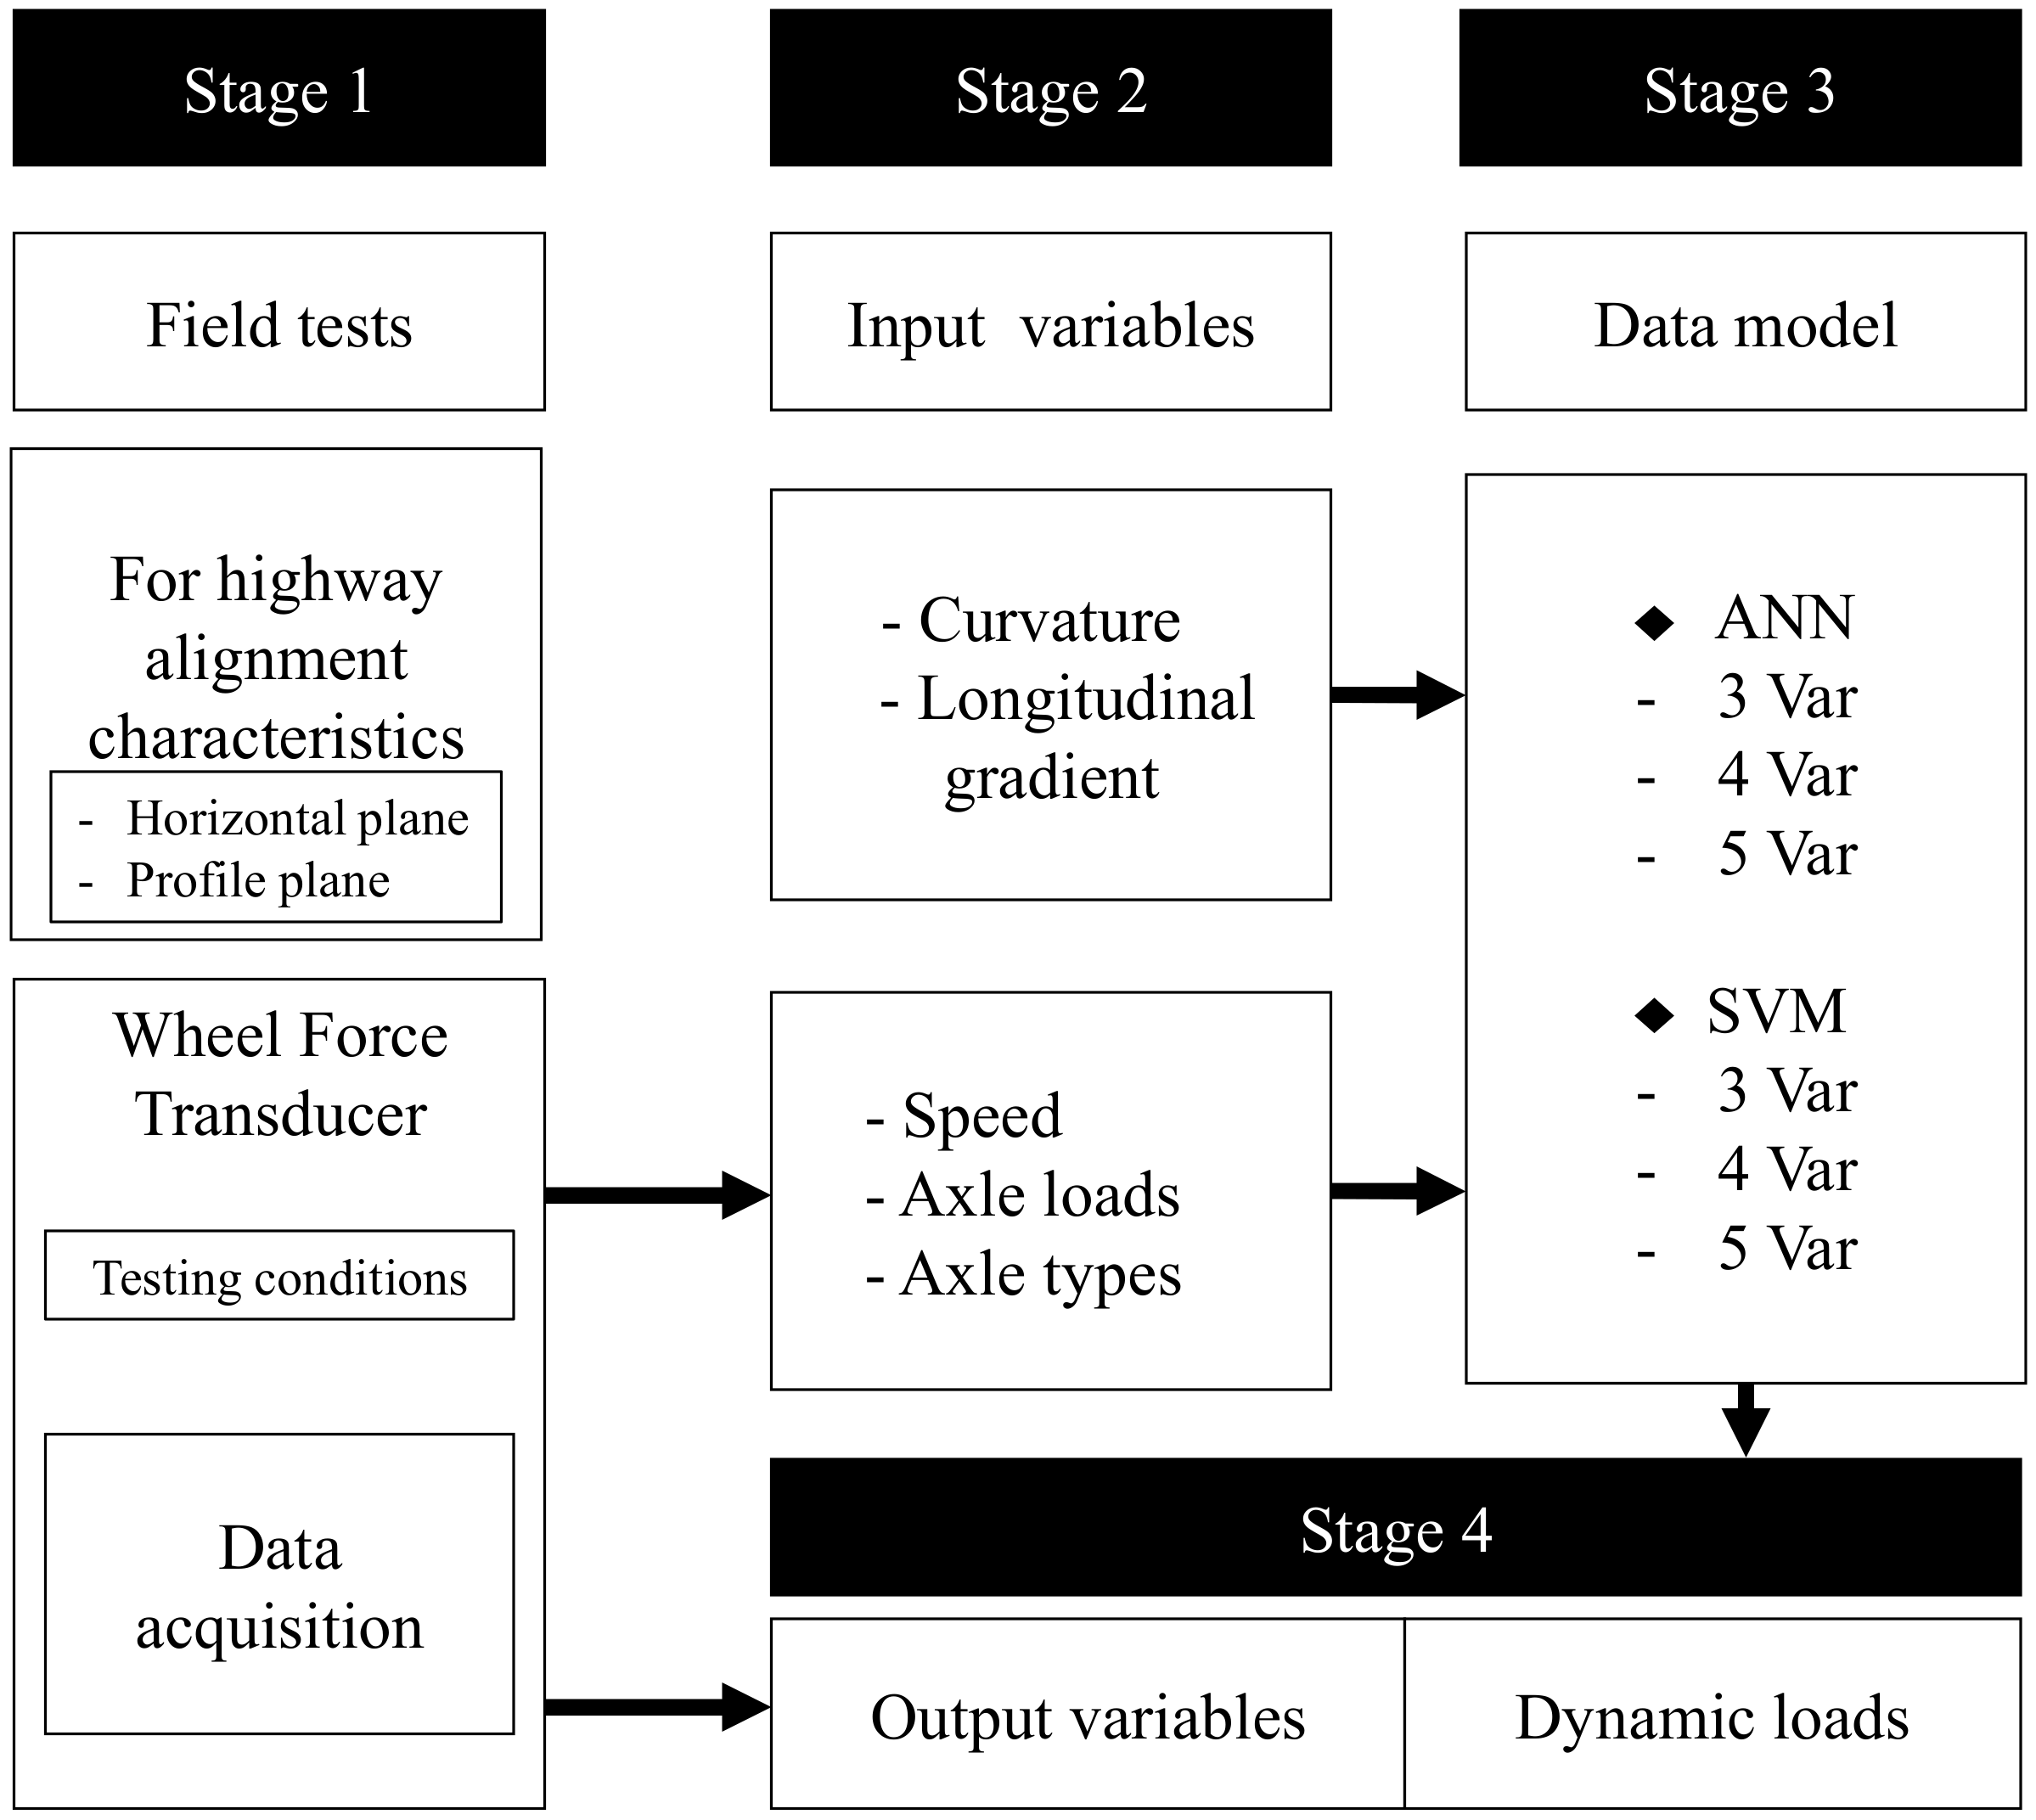
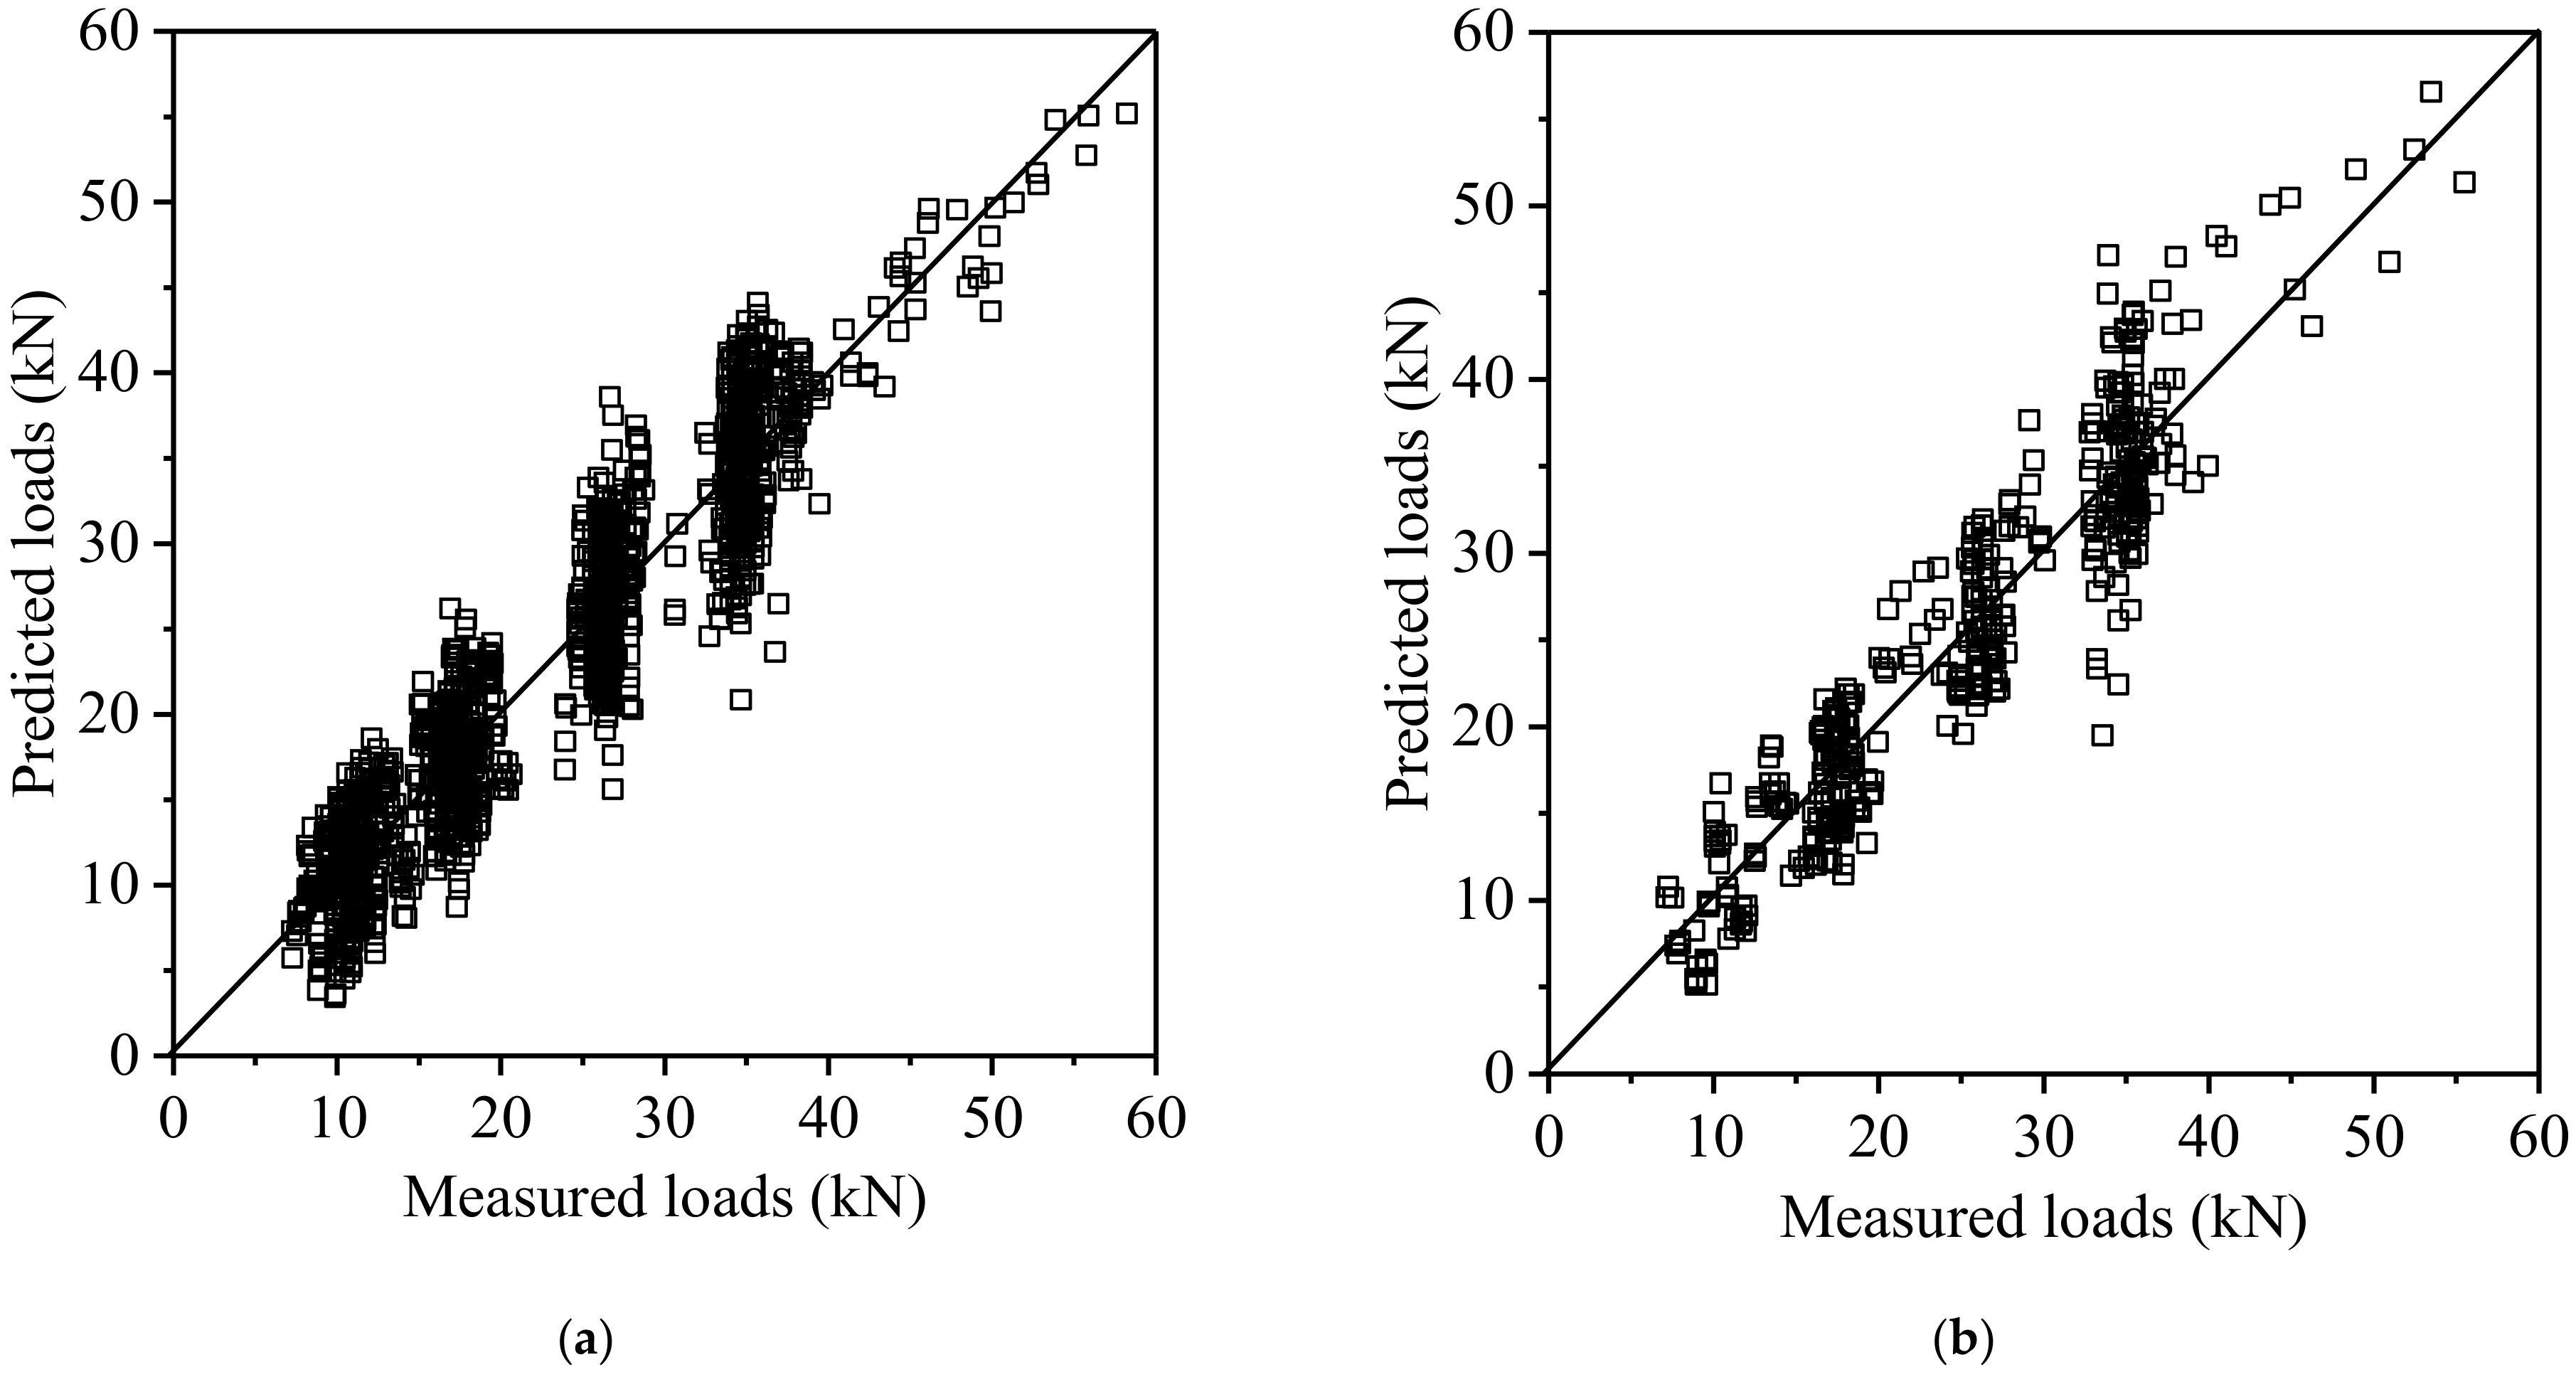
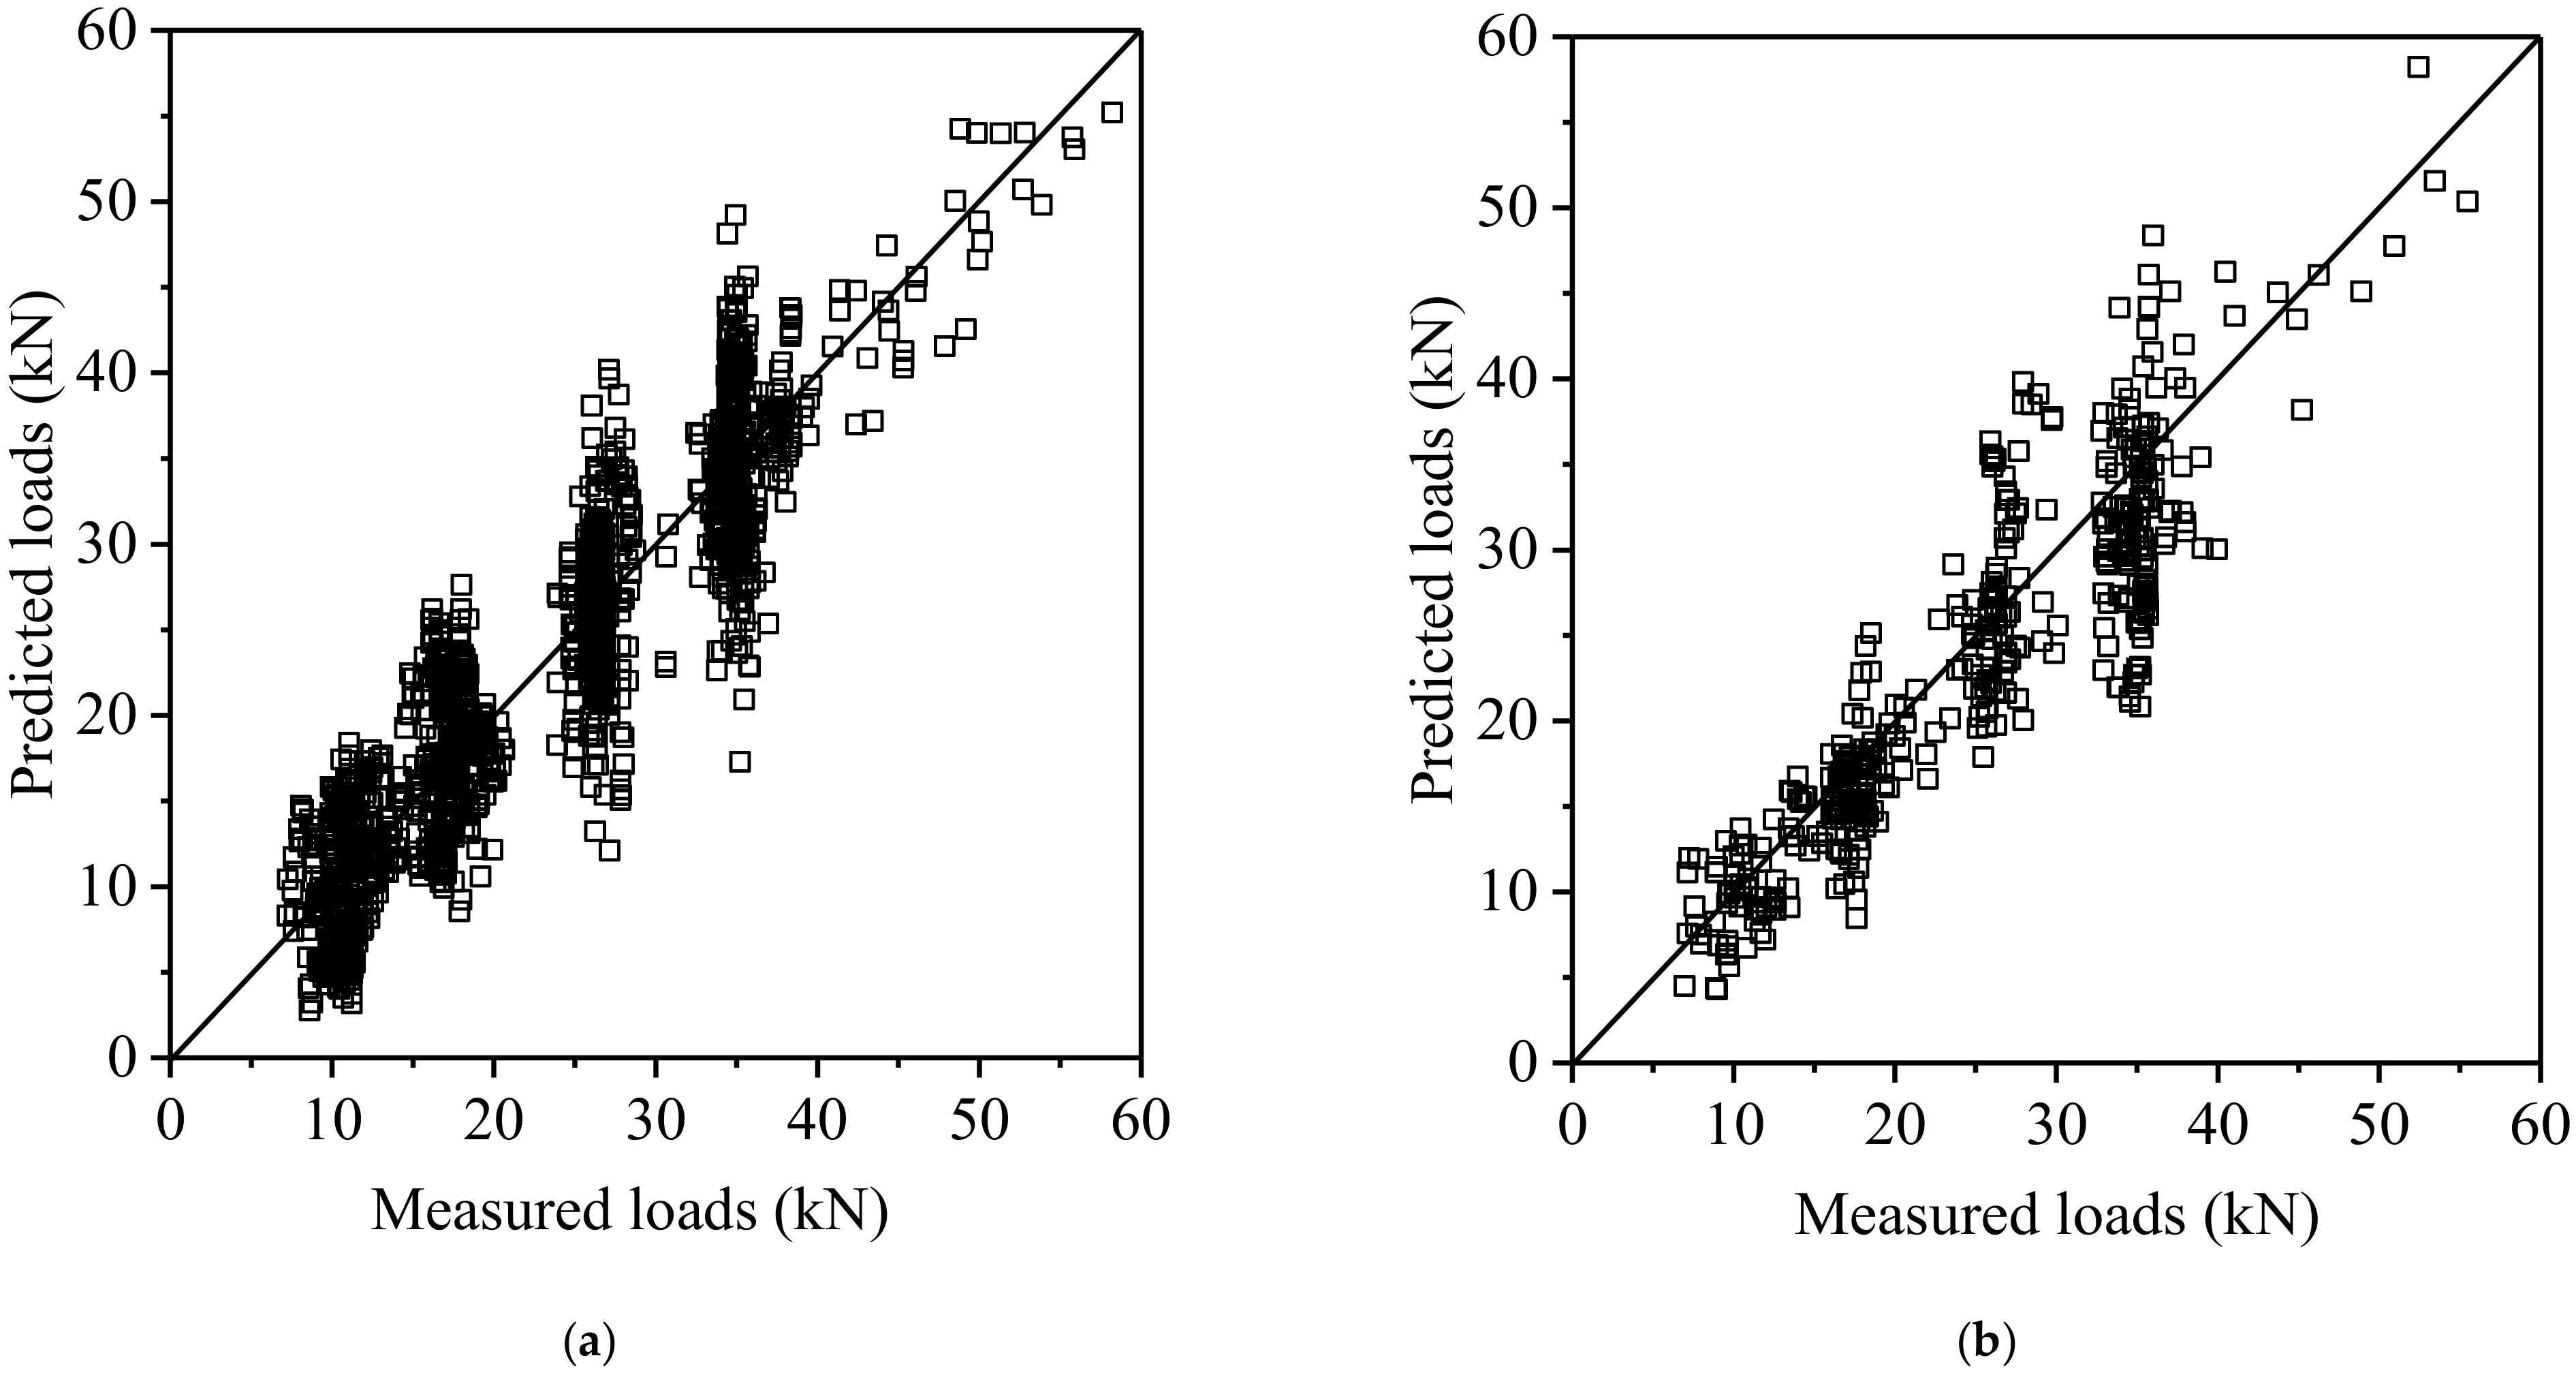
Two models were developed using data mining (DM) techniques: artificial neural network (ANN) and support vector machine (SVM). The models included five parameters (curvature, longitudinal grade, speed, loads, and axle types) that were used to predict dynamic loads. In order to determine the least-significant input variables, the performance of the models with three, four, and five parameters were separately evaluated. The results showed that at least four parameters were needed to obtain a satisfactory prediction model.
(c)
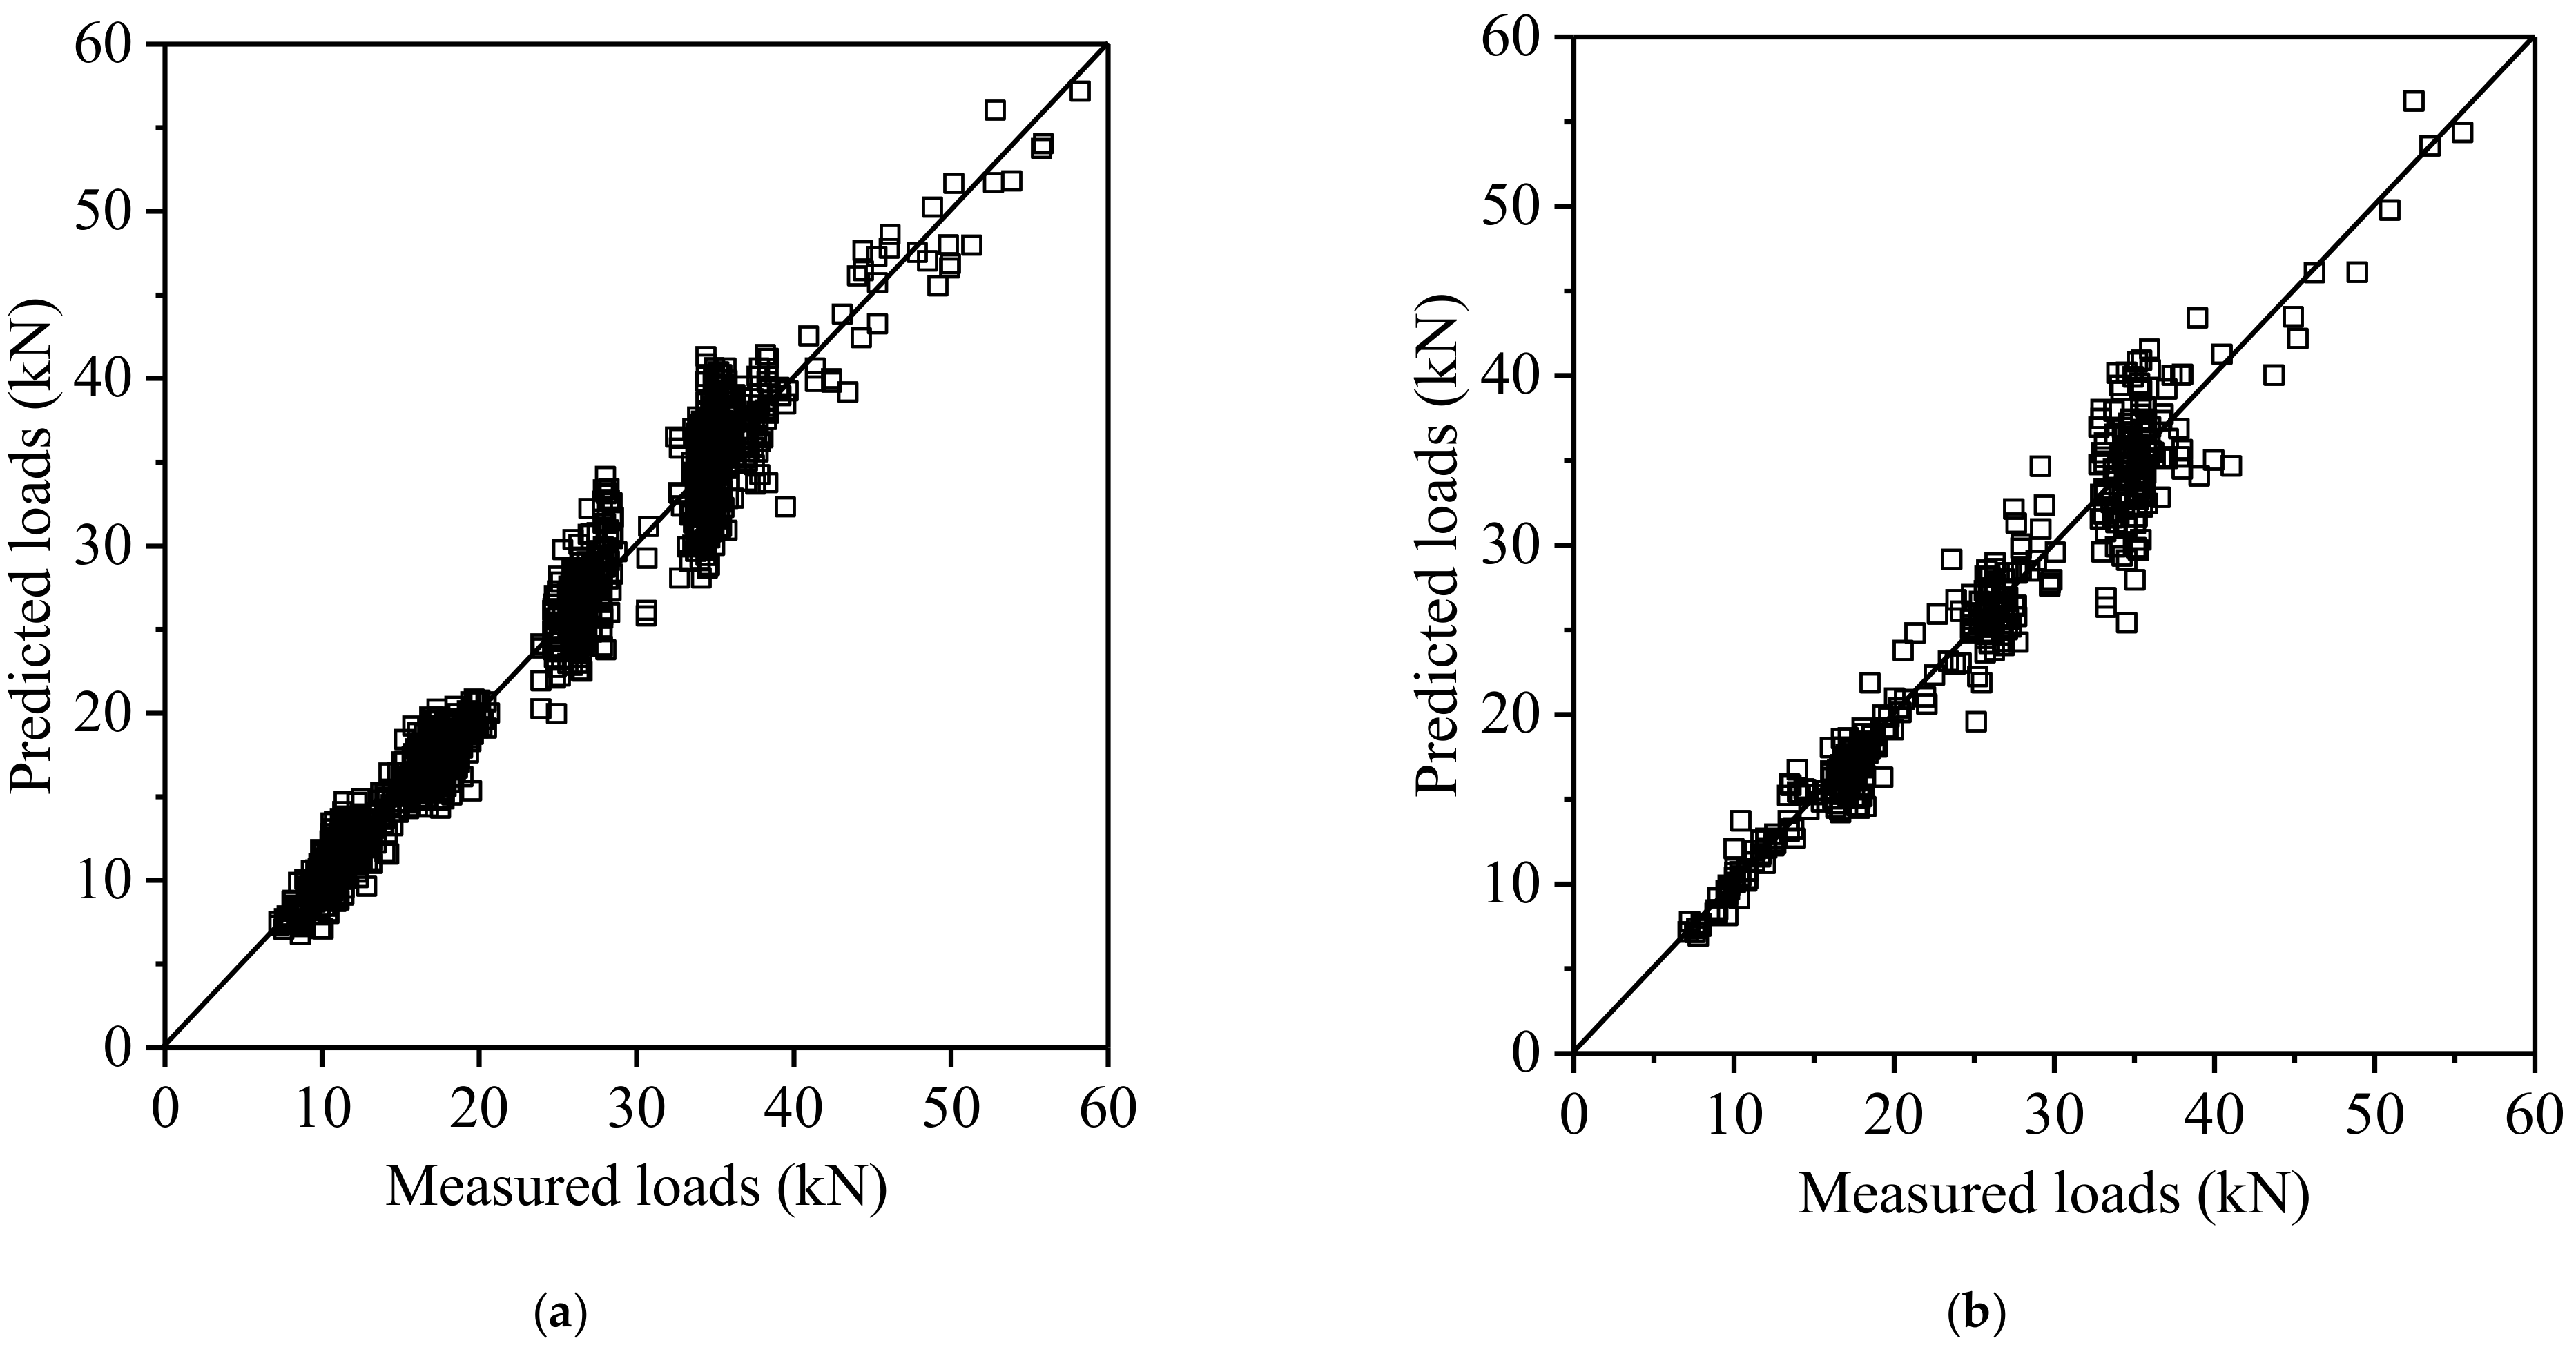
The performances of the ANN and SVM models were compared. The results revealed that the ANN model showed a better capability to predict dynamic loads.
(d)
The interaction between vehicle and highway alignment was determined using the ANN technique. The curvature effects on dynamic loads were greater than those of the longitudinal grade.
The remainder of this paper is organized as follows. Section 2 presents the literature review, and Section 3 presents the research motivation, followed by an illustration of the definition of geometric variables in Section 4 and the detailed methodology in Section 5. The results and discussion are presented in Section 6, followed by concluding remarks.
In this paper, the objective is to establish a comprehensive, rapid, and reliable approach to identifying pavement distress under vehicle–alignment interactions using vehicle dynamic loads.

2. Literature Review

Vehicle dynamic loads have always been a crucial research subject in the analysis of pavement damage. Vehicle loads applied to the pavement can be categorized into two types [14]: static loads caused by vehicle self-weight and dynamic loads resulting from fluctuation of the load, which are caused by vehicle speed and the excitation of road roughness. In general, existing research has mainly focused on dynamic loads [15,16,17].
There have been some studies to improve pavement design theory from the aspect of the mechanism and characteristics of vehicle dynamic loads [18,19,20], theoretical model analysis [21,22,23], and simulation [24]. However, dynamic loads are largely related to factors such as vehicle acceleration and deceleration and subjective driving behavior caused by changes in alignments [25]. Dynamic loads cannot be reflected by a simple theoretical model [26]. Therefore, there is an urgent need to carry out field vehicle load tests to understand the relationship between dynamic loads and highway alignment.
With the high volume of data produced and the complex nature of vehicle–highway alignment interactions, determining the underlying mechanism becomes a great challenge. Recently, knowledge discovery techniques in the data modeling process, known as data mining (DM), have been used to reveal the underlying relationship between variables without prior knowledge of the measured data [27,28]. Thus, DM techniques are used in this paper to predict dynamic loads under vehicle–highway alignment interaction.
In road engineering, the ANN and SVM techniques have been extensively utilized and proven to be successful [29]. The ANN technique was used to predict the aging of asphalt pavements [30], natural gas energy consumption in the production of hot-mix asphalts [31], sensitivity of crack propagation [32], back calculation of pavement modulus [33], and estimation construction quality [34]. Alatoom et al., 2022 [35] used an artificial neural network (ANN) based on smartphone measurement to develop a pavement roughness model. The effects of pavement service life, traffic loads, and traffic volume on the IRI value were studied. The results of the ANN model development showed that the artificial neural network shows promise in predicting future IRI, and the average error was less than 10%. The comparison between the regression model and the ANN model showed that the ANN model was more accurate than the regression model in predicting IRI. Sirhan et al., 2022 [36] developed and trained a deep artificial neural network (DNN) model to predict the pavement condition index (PCI) value and compared the performance of a DNN model with traditional prediction methods (such as linear and nonlinear regression). The root mean square error (RSME) of the tested DNN model was significantly better than the best-fitting linear and nonlinear regression models.
The SVM technique was used to predict the dynamic modulus [37] and Poisson’s ratio of asphalt pavement [33] and to evaluate the performance of a stabilized aggregate base affected by dry–wet cycles [38]. The results showed that the predicted performance of the models developed based on the ANN and SVM techniques was excellent.

3. Research Motivation

The field investigation of this study included data collection on two road sections with frequent damage over their lengths, especially in the area combining horizontal curves and downgrades. One section was the G319 National Road (a mountainous area with sharp curves and steep slopes). The other section was 205 Provincial Highway, which generally has a flat slope terrain and large numbers of heavy trucks. Since 2000, the two sections have been overlaid with concrete slabs twice (15 cm cement stabilized macadam plus 26 cm slabs each time), and the slabs were still prematurely broken. In 2016, the asphalt pavement of 319 National Highway was overlaid with a thickness of 18 cm. However, serious potholes and deformation damage occurred on the asphalt pavement after six months.
The statistics of the field investigation of the G319 section are shown in Figure 1. There are 10 bends from K138 to K140, of which the minimum radius is 49 m, and the maximum longitudinal grade is 6.47%. It was found that pavement damage mostly occurred at the locations where horizontal curves overlap with downgrades. The observations indicated that the location and the form of the premature damage to the road surface in G319 were closely related to the highway alignment. The pavement premature failure was caused by the excessive stress concentration on the pavement, which is mainly related to excessive vehicle dynamic loads. Motivated by the pavement conditions of the two sections, the authors conducted the present study to comprehensively analyze the relationship between pavement damage and both highway alignment and dynamic loads.

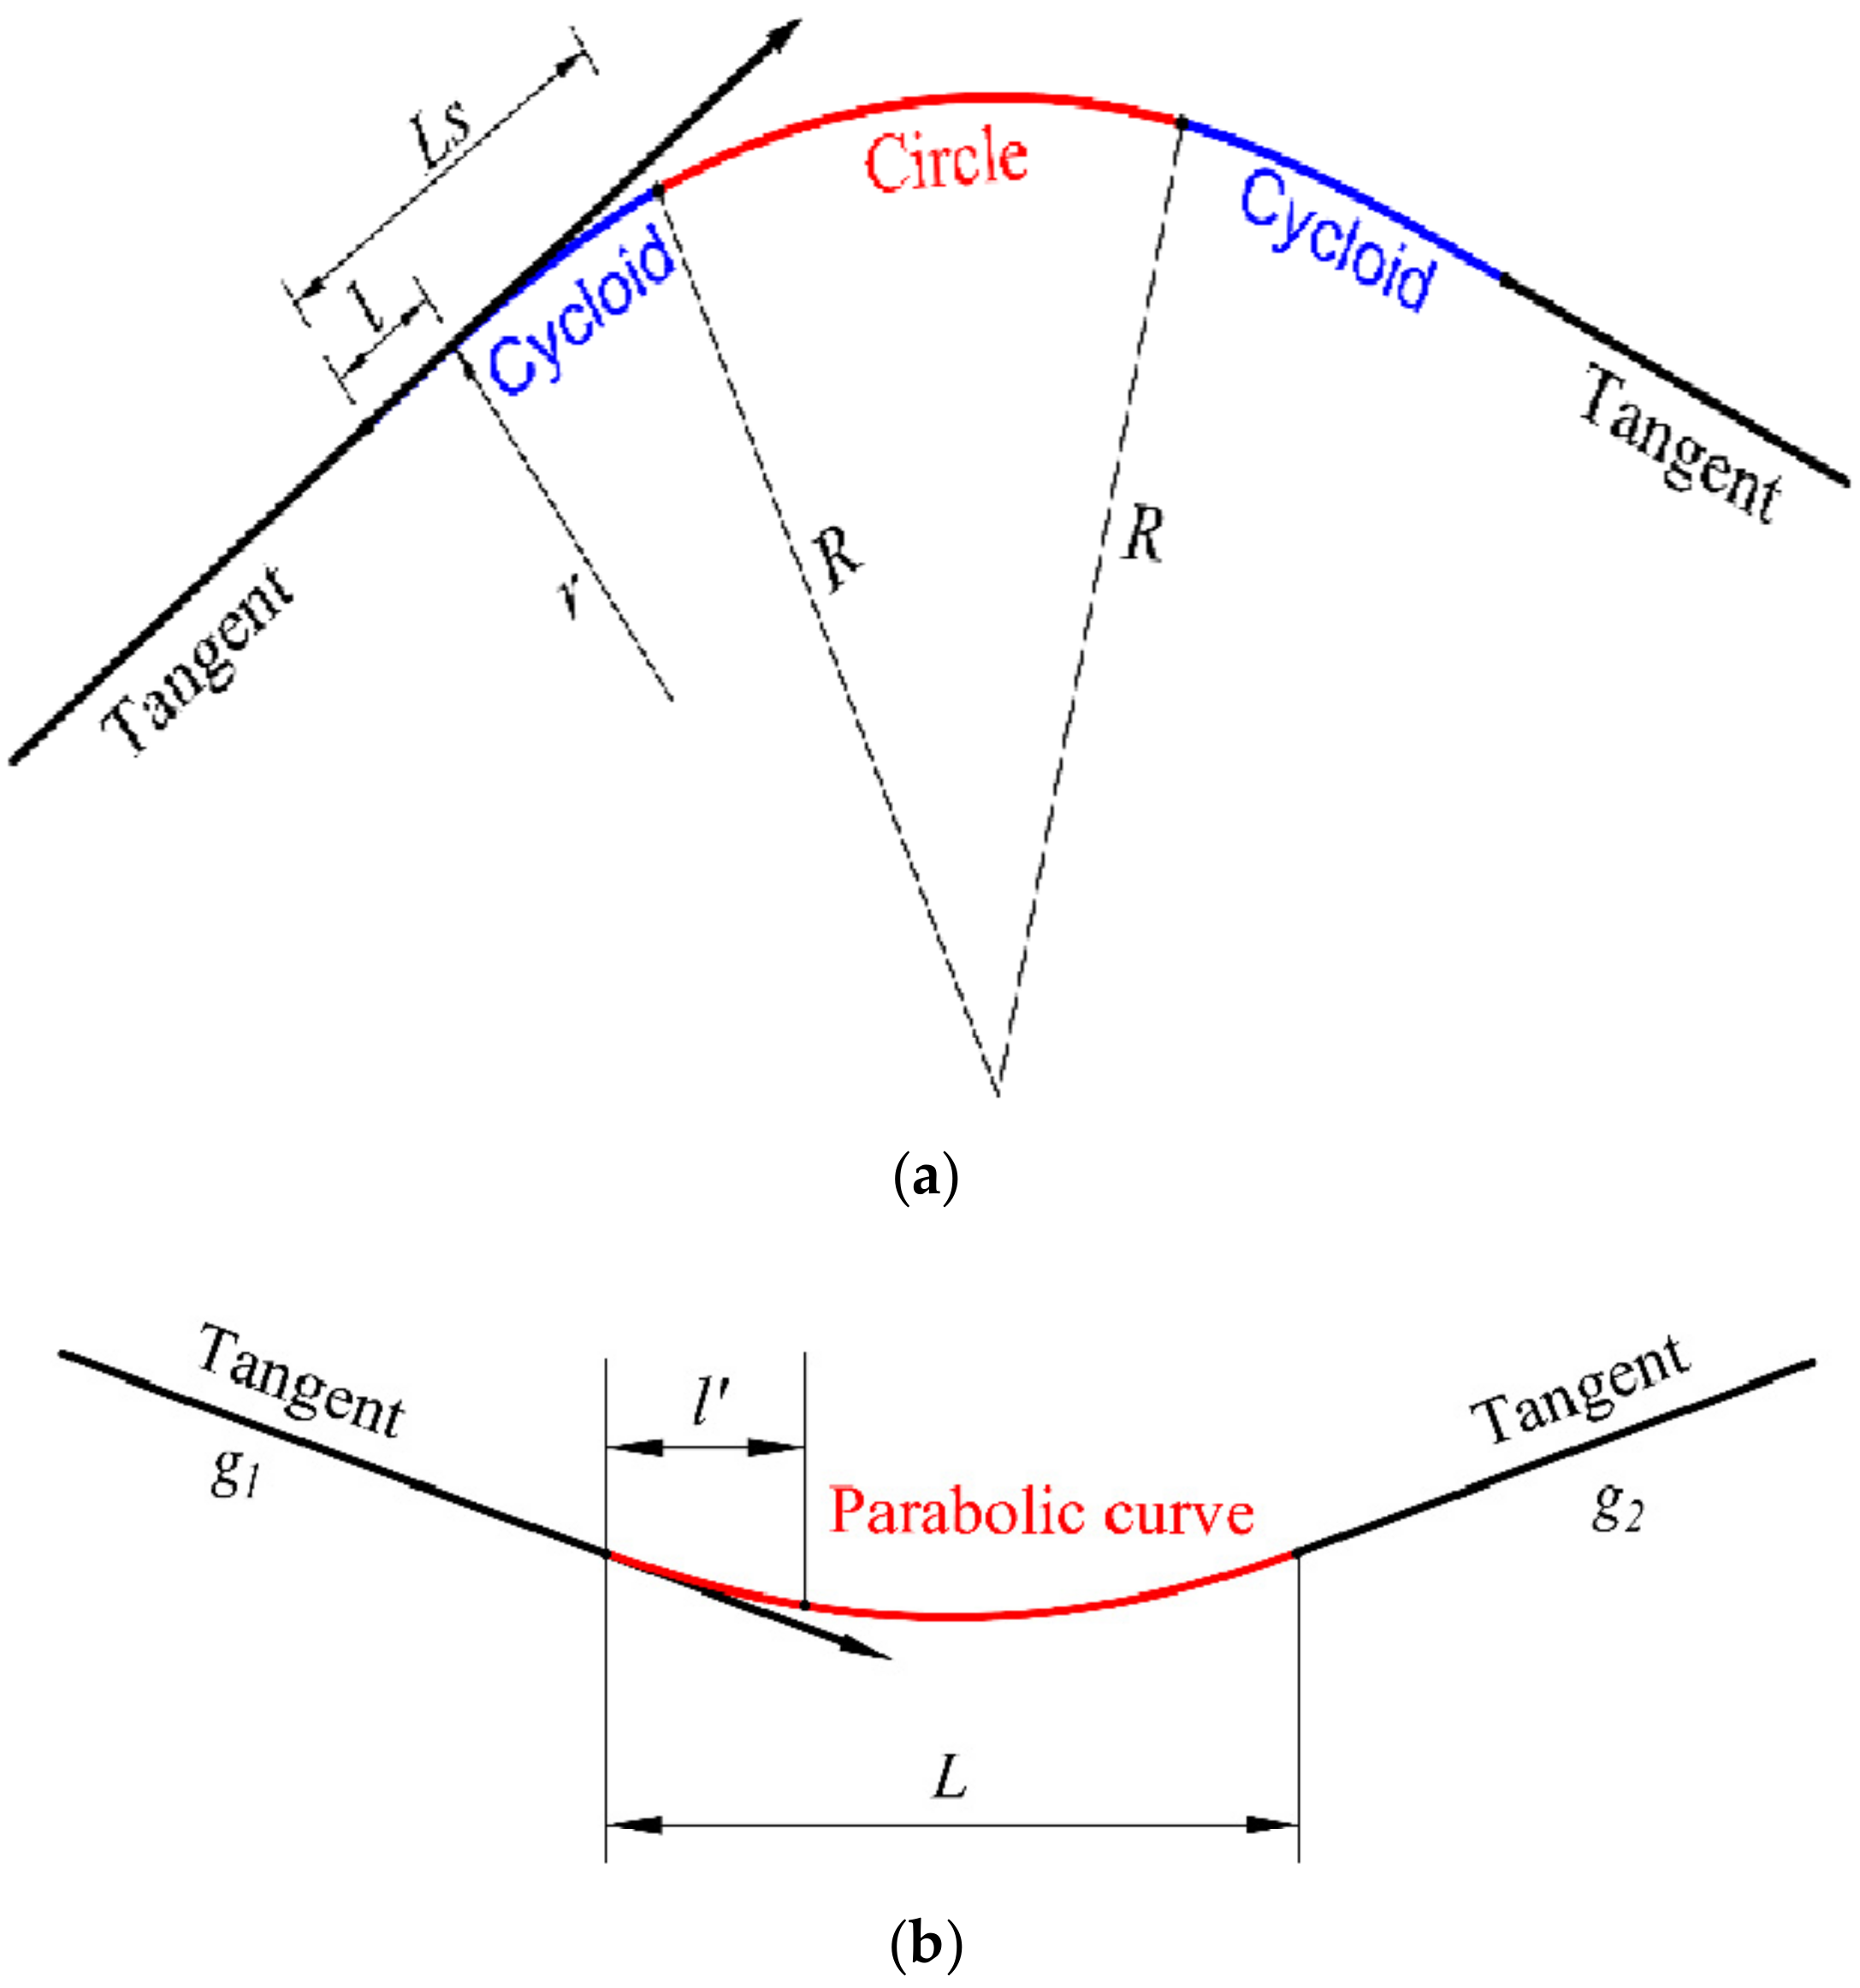
4. Definition of Geometric Variables

In the horizontal alignment, highway characteristics were evaluated using the curvature k = 1/r [39,40]. The geometric characteristics of the horizontal alignment are shown in Figure 2a. The curvature k is calculated as follows. The relationship between the radius of curvature, curve length, and cyclotron parameters is given by
r l = A 2          
where r is the radius of curvature of a point on the gyrotron, l is the curve length from a point on the gyro to the origin, and A is the cyclotron parameter, which is calculated as
A = R L s 0.5
where R is the radius of the circular curve connected to the cycloid, and Ls is the length of the cyclotron transition curve.
Substituting for A from Equation (2) into Equation (1), then
k l = 1 r = l R L s        
The highway vertical alignment represents the fluctuation of the road profile, including vertical curves and grades. The geometry of the vertical alignment is shown in Figure 2b. The grade g represents the ratio of the height difference between two points on the same section of the alignment to the corresponding horizontal distance. The longitudinal grade g(l’) of a point on the vertical curve is calculated as follows:
g l = l L ω + g 1        
where ω is the difference between the latter (g2) and front (g1) longitudinal grades, (ω = g2 − g1). l’ is the horizontal distance between a specific and the beginning points on the parabolic curve, and L is the interval of variable longitudinal grade points. Since vertical grades are very long in most parts of the sections compared with the length of the vertical curves, only the longitudinal grade was considered in this study.

5. Methodology

The methodology implemented in this study to determine the relationship between highway alignment and vehicle dynamic loads is depicted graphically in Figure 3. The methodology included four stages: Stage 1 (field tests), Stage 2 (input variables), Stage 3 (proposed models), and Stage 4 (output variables of dynamic loads).

5.1. Field Tests

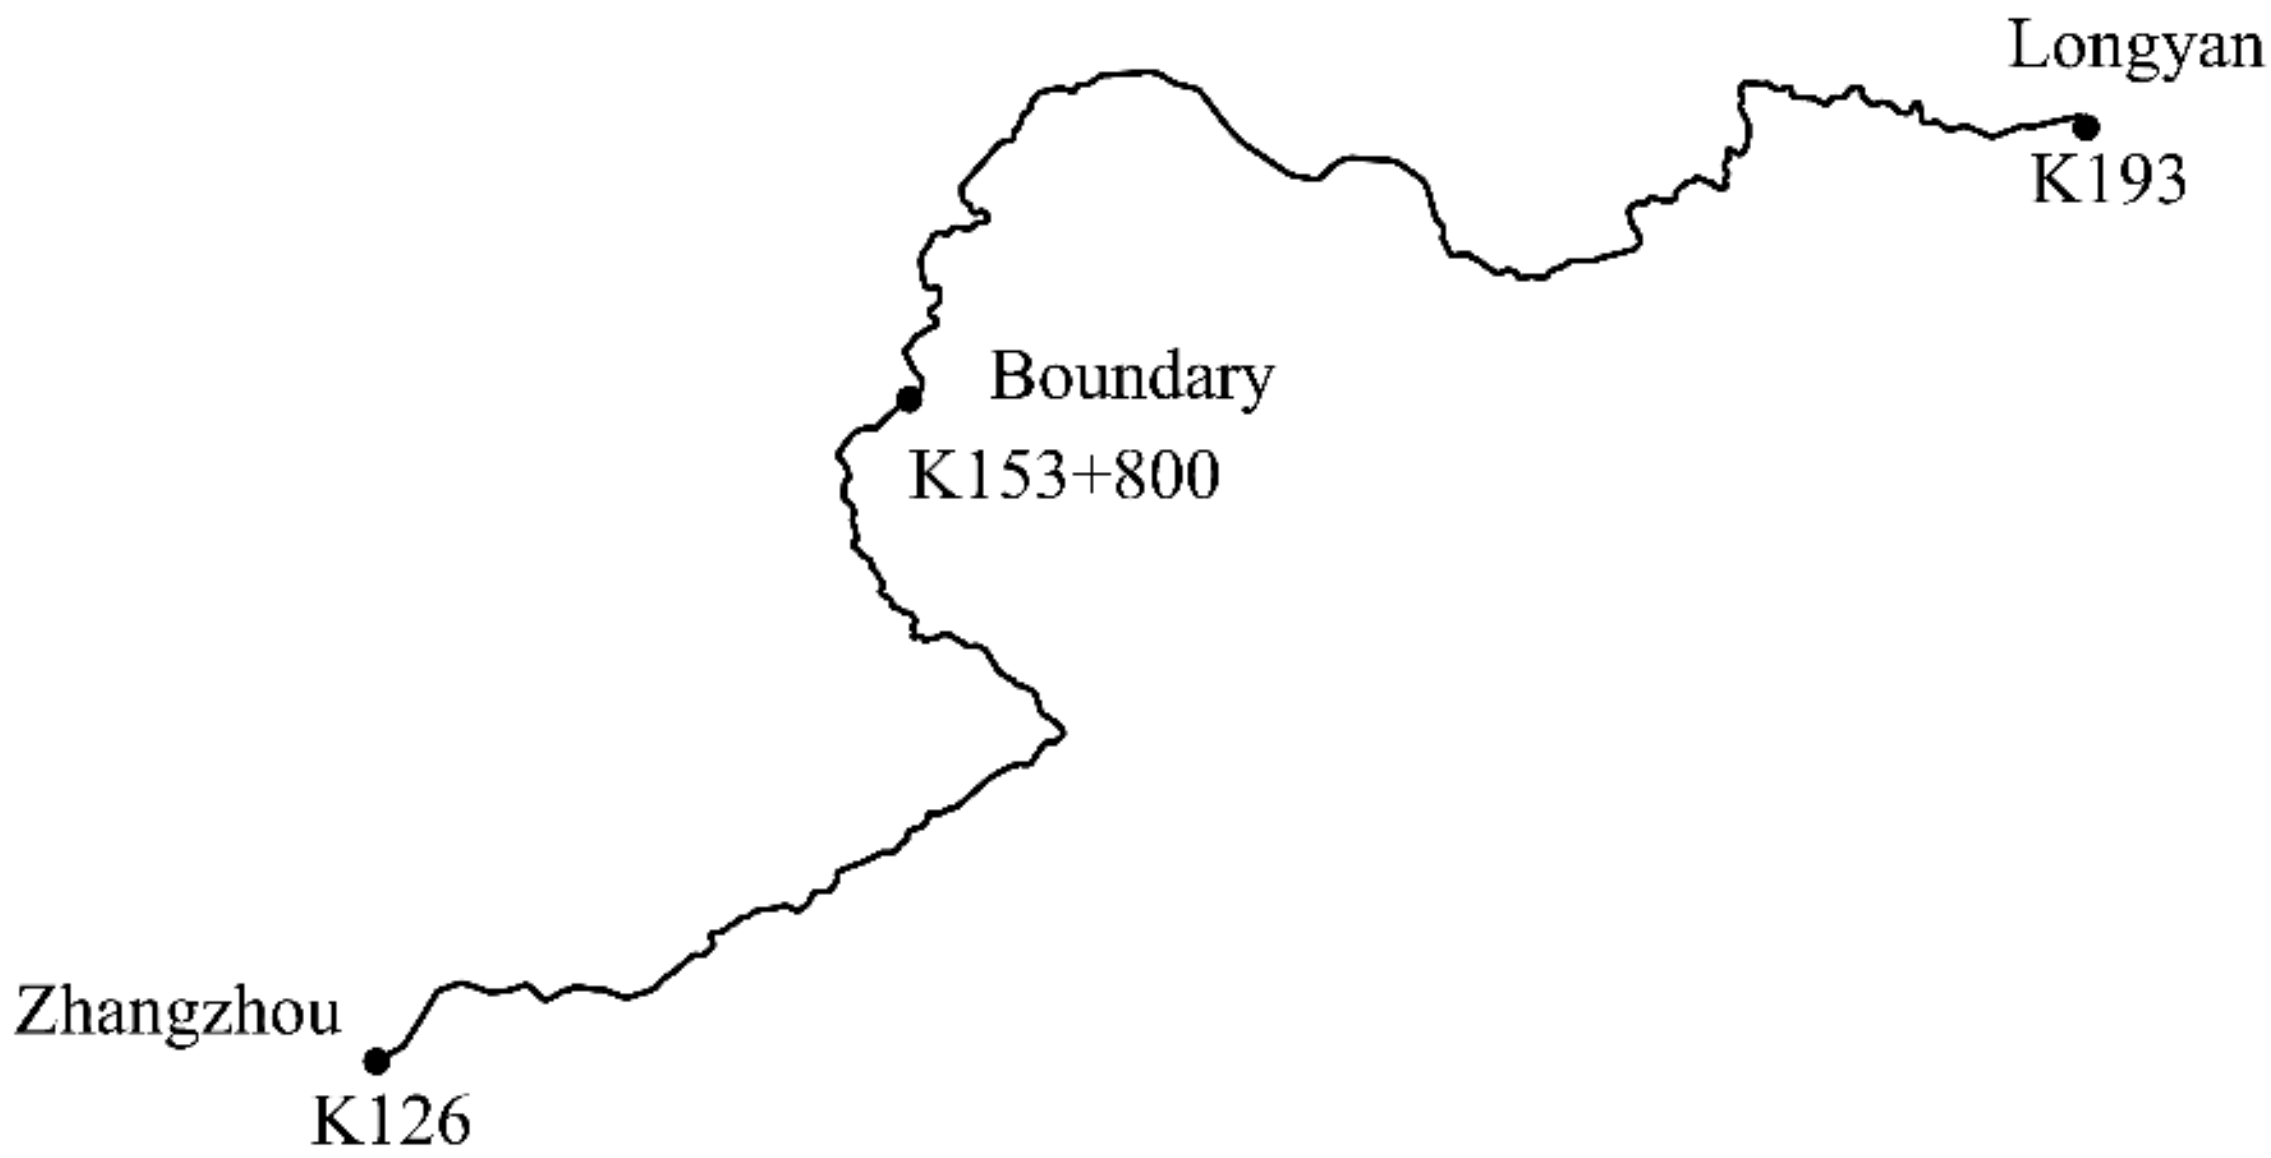
5.1.1. Highway Alignment

The test section ranges from K126 to K193 with a total length of 67 km, located in the Zhangzhou–Longyan section of G319 National Highway, China. The highway horizontal alignment is shown in Figure 4. There are 297 curves and 264 straight lines, and the curves account for 47.8% of the total length. The statistical results of the curvature k are shown in Table 1. As noted, a curve radius of less than 200 m accounts for 70.8% of the total length of the curves and 33.9% of the total length, with a minimum radius of 23 m. The statistics of the longitudinal grade in Table 2 show that the longitudinal grade with more than 1% accounts for 56.9% of the total length.
The preceding results indicate that under the mountainous terrain constraints, the small radius curve represents a major proportion of alignment design. This implies that the mountainous highway alignment is extremely complex and poor. Under such alignment conditions, acceleration and deceleration occur, resulting in complex loads on the pavement surface.

5.1.2. Trucks and Wheel Force Transducer

A wheel force transducer and global positioning system (GPS) were used to collect the vehicle dynamic loads and highway alignment data, respectively. The WFT is the most complete multiforce sensor to measure three-directional force and moment components under the Cartesian coordinate system in an all-around manner. The WFT, first developed by the GM General Corporation in 1969, measures two orthogonal forces on the tire plane. In 1975, a new WFT that measures three-dimensional force and tire moment was developed [19]. Since in pavement design, only the vertical load is considered, only this load is extracted as the research object in this study.
The WFT developed by the Michigan Science Corporation was applied to measure the wheel force and moment of a four-axle truck [41]. There is no need to perform any signal data conversion, which significantly improved the accuracy and reliability of vehicle load data [42]. The installation of the WFT and the testing truck is shown in Figure 5.
Before carrying out the vehicle load tests, the vehicle six-component testing system was adjusted. In order to eliminate the vehicle dynamic load caused by the engine vibration and the steering motion, the testing vehicle was first driven at a higher speed on a straight road with an empty gear. Once the data of the vertical, longitudinal, and lateral wheel forces tended to be stable, the sensor debugging calibration was completed, and the following tests of the vehicle dynamic loads were carried out. The statistical analysis of the vehicle dynamic loads obtained using the field tests is shown in Table 3. The database of vehicle dynamic loads was established using the test results and was then evaluated using data mining techniques as described next.

5.2. Data Mining Techniques

5.2.1. Input Variables

Two types of inputs were used in this study: highway geometry and vehicle characteristics. To be specific, the former includes the curvature k and the longitudinal grade g. The latter consists of vehicle speed, loads, and axle types.

5.2.2. ANN Model

R studio [43], which provides powerful data mining algorithms, was implemented to perform the DM of the dynamic load data. In the process of the calculation of dynamic loads, the two vehicle axle types were represented by Numbers 1 and 2, respectively. The other parameters such as speed, curvature, longitudinal grade, and axle load were input by normalized data. The data were trained through the neural network package and support vector machine package of the software to establish a nonlinear fitting model. Based on this, the input parameters were realized to predict the dynamic loads.
The ANN and SVM techniques are briefly described next [44,45]. For the ANN technique, in the process of training, the minimum square error was taken as the learning objective. The gradient descent method was used as the optimization method, and the threshold was set as the stopping criterion. The linear and logistic functions are the two major activation functions. In this study, the logistic function 1/(1 +   e x ) was adopted.
The structure of the ANN model is shown in Figure 6. The initial principle is that when the network is propagating forward, the samples are transferred from the input layer to the output layer after the calculation through the hidden layer. If the result is different from the expected result, it will enter the reverse propagation stage. The weight value adjustment process is stopped until the error of network output is reduced to the acceptable level or the number of preset learning times is reached. The three-layer network is commonly used, in which the input vector is X = (x1, x2, …., xi…., xn) T, the hidden layer vector is Y = (y1, y2 …., yj …., ym) T, and the output vector of the output layer is O = (o1, o2, …., ok…., ol) T. The expected output vector is d = (d1, d2, …., dk…., dl) T. The weight matrix between the input layer and the hidden layer is V = (v1, v2, …., vj…., vm) T. The weight matrix between the hidden layer and the output layer is represented by W, i.e., W = (w1, w2, …., wk …., wi) T.
For the output layer,
o k = f n e t k , k = 1 ,   2 ,   ,   l
n e t k = j = 0 m w j k y j , k = 1 ,   2 ,   ,   l
For the hidden layer,
y j = f n e t j , j = 1 ,   2 ,   ,   m
i = 0 n v i j x i , j = 1 ,   2 ,   ,   m
In the learning process, when the results of output neurons are not equal to the expected results, there are errors as follows:
E = 1 2 k = 1 l { d k f [ j = 0 m w j k f ( i = 0 n v i j x i ) ] } 2
From Equations (5)–(9), it can be concluded that the network error is a function of the weights of each layer, so the error can be reduced to an acceptable range by adjusting the weights. The weight adjustment is proportional to the longitudinal grade of error, and the weight adjustment used in this study is as follows:
Δ w j k = η d k o k o k 1 o k y j
Δ v i j = η k = 1 l d k o k o k 1 o k w j k y j 1 y j x i
where η represents the learning rate.
A stable set of weights of ANN is realized by forward calculation and backward propagation error, and then using multiple iterations and weight correction to increase the reliability of the results.

5.2.3. SVM Model

The SVM technique is a nonlinear classification method that maps input data into multidimensional feature space and divides different data samples by a hyperplane. Nonlinear mapping is mainly related to the type of kernel function. In this paper, the kernel function type is chosen as the Gauss kernel function, because of its excellent performance with fewer hyperparameters and simpler numerical calculation [46]. The Gauss kernel function is given by
k x , x = e γ x x 2
where x is a point in space, x’ is the center of kernel function, and γ is the width of the kernel.
There were 2020 sets of data available, which were randomly divided into the training dataset and the testing dataset (comprising 80% and 20% of the whole dataset, respectively). The training dataset was used to develop the prediction model, and the testing dataset was used to evaluate the accuracy of the developed models. The performance of the prediction models was evaluated by two parameters: coefficient of determination (R2) and root mean square error (RMSE) [44], which are given by
R 2 = 1 i n y i y 2 i n y i y ¯ 2
R M S E = 1 n i n y i y 2
where n is the number of the measured data, y i is the expected output data, y is the predicting output data, and y ¯ is the mean of the measured data.

6. Results and Discussion

The relationship between vehicle dynamic loads and alignment was established by using a wheel six-component force test system and a global positioning system. The results are shown in Figure 7. It showed that the vehicle loads of the top 100 mainly appeared at positions of the curve turning at the bottom of the longitudinal grade. In fact, the effect of the small radius and large longitudinal grade alignment on the motion behavior of heavy trucks was significant, which produced the storage-release behavior of large energies and generated large wheel dynamic loads.
Large areas of pavement deterioration were prone to occur in the upgrade and downgrade sections combined with continuous reverse turning, as shown in Figure 1. As shown in Figure 7, it implied that the position of pavement deterioration was strongly related to the large fluctuation of vehicle dynamic loads. Research on vehicle dynamics has shown that there are seven motion modes: acceleration, braking and deceleration, vertical jump resonance, body pitching, lateral motion, yaw motion, and roll motion [47]. Different motion modes have their corresponding characteristics of dynamic loads and then have a complex mechanism of action on the pavement. Thus, the key problem is to develop models to accurately predict vehicle dynamic loads.
Two kinds of data mining techniques were determined before, and five parameters were used as input variables to train data and develop models to predict dynamic loads. The developed model is marked with M#, which represents the number of the input parameters. The performance of different models based on ANN and SVM techniques was evaluated by the coefficient of determination (R2) and root mean square error (RMSE). In general, a larger number of input parameters means a higher quality of the DM model, but its complexity greatly increases. Therefore, it is necessary to find the DM model with the least input variables under acceptable quality. This problem may be critical when input parameters require complex and time-consuming testing.
Theoretical research shows that when the vehicle has a large range of speed, loads, and different axle types, the location of the peak dynamic load on the road surface has spatial repeatability [48]. The vehicle speed, loads, and axle types have an important effect on dynamic loads, and they were chosen as necessary factors [47]. In order to determine the importance of highway alignment geometry on the vehicle dynamic loads, analyses with various parameters including five, four, and three were conducted. The number of developed model parameters included five, four, and three, respectively. The M5 model considered curvature, longitudinal grade, speed, loads, and axle types. There were two types of the M4 model: one was the M4k model, which included curvature, speed, loads, and axle types, and the other, the M4g model, included longitudinal grade, speed, loads, and axle types. Moreover, the M3 model did not include alignment geometry, consisting of speed, loads, and axle types.
The performance of the ANN and SVM models of M5, M4, and M3 using the training and testing datasets are shown in Figure 8, Figure 9, Figure 10 and Figure 11, respectively. In addition, Table 4 shows the performance indicators of the proposed ANN and SVM models and the corresponding cross-validation results of the simplified M3, M4, and M5 models.
As shown in Table 4, regardless of the number of parameters used, the ANN technique showed a better performance than that of the SVM, with a lower RMES and higher R2. Therefore, the following analysis results were all based on the ANN technique. The M5 models showed the best prediction performance as the lowest values of RMES and the highest values of R2 between the M5, M4, and M3 models. As noted, the performance of the M5-ANN model, the M4-ANN model, and the M3-ANN model using the training dataset is better than that of the testing dataset, as shown in Figure 8, Figure 9, Figure 10 and Figure 11. The R2 of the M4-ANN model is lower than that of the M5-ANN model, which indicates that the alignment geometry has a significant influence on vehicle dynamic loads. Although the R2 of the M4k-ANN model is lower than that of the M5-ANN model, the prediction performance of the M4k-ANN model is still acceptable.
The values of RMES of the M4k model were lower than the M4g model; in contrast, the values of R2 of the M4k model were higher than the M4g model. This indicated that the influence of curvature on vehicle dynamic loads was more significant than the longitudinal grade. From the perspective of vehicle dynamics [25], the vehicle running on the horizontal curve will not only generate acceleration, deceleration, and pitching motions, but also roll motion, which will lead to an increase in the vehicle dynamic loads. Due to the large proportion of small radius horizontal curves on the mountain highway, the amplitude of vehicle motions induced by the alignment is more significant, thereby producing a larger load on the pavement. When the vehicle runs on the vertical curve, only acceleration, deceleration, and pitching motions are generated, and there is no roll motion. Therefore, the influence of curvature on vehicle dynamic load is greater than that of the longitudinal grade.
Moreover, the performance indicators shown in Table 4 and Figure 11 confirmed the low capacity of the M3-ANN model to predict the vehicle dynamic loads. Although the DM model used in this specific work could be simplified using fewer variables, the accuracy of the models decreased, and the prediction performance of models with less than four parameters was unacceptable.

7. Concluding Remarks

The results obtained in this paper highlight the importance of highway alignment in vehicle dynamic load evaluation. In fact, the vehicle–highway alignment interaction influences vehicle dynamic loads and should be considered in pavement design and maintenance. Based on this study, the following comments are offered:
  • A novel approach was presented to evaluate the effect of the vehicle–highway alignment interaction on vehicle dynamic loads using a WFT. The interaction was verified using field investigation of pavement damages, alignment characteristics, and a dynamic load test.
  • The wheel six-component force measurement system proposed in this paper and the use of data mining techniques were critical to understanding the relationship between the vehicle–highway alignment and vehicle dynamic loads.
  • The proposed dynamic load prediction models implemented two data mining techniques (ANN and SVM). The ANN-based models with different parameters (five, four, and three) were established to evaluate the relative importance of geometric variables. The results showed that model prediction performance decreased as the number of parameters decreased. The ANN-based model shows a better performance in predicting vehicle dynamic loads than the SVM-based model.
  • This research presented in this paper is an initial study aimed at establishing a comprehensive, rapid, and reliable approach to identify pavement distress under vehicle–alignment interactions. Future research will focus on: (a) verifying model robustness, where solid work will be conducted under large-scale scenarios (road sections and vehicle types); and (b) developing an integrated software platform that will assist engineers in making more appropriate highway alignment design and maintenance decisions based on the dynamic loads.

Author Contributions

Conceptualization, M.L.; Data curation, M.L.; Formal analysis, M.L.; Investigation, M.L.; Methodology, M.L.; Project administration, C.H.; Resources, C.H.; Software, M.L.; Supervision, M.L. and C.H.; Validation, S.M.E. and Z.J.; Visualization, S.M.E. and Z.J.; Writing—original draft, M.L.; Writing—review & editing, S.M.E. and Z.J. All authors have read and agreed to the published version of the manuscript.

Funding

This research work was supported by the National Natural Science Foundation of China (Grant Number: 51978172).

Institutional Review Board Statement

Not applicable.

Informed Consent Statement

Not applicable.

Data Availability Statement

Data sharing is not applicable to this article.

Acknowledgments

The authors also thank the teammates who contributed to this project in various ways.

Conflicts of Interest

The authors declare no potential conflict of interest.

References

  1. Lu, Y.; Yang, S.; Li, S.; Chen, L. Numerical and experimental investigation on stochastic dynamic load of a heavy duty vehicle. Appl. Math. Model. 2010, 34, 2698–2710. [Google Scholar] [CrossRef]
  2. Ma, S.J.; Huang, X.M. Response of Perpetual Pavement under Different Axle Heavy Truck. Adv. Mater. Res. 2013, 838, 1173–1181. [Google Scholar] [CrossRef]
  3. Beskou, N.D.; Muho, E.V.; Jiang, Q. Dynamic analysis of an elastic plate on a cross-anisotropic elastic half-space under a rectangular moving load. Acta Mech. 2020, 231, 4735–4759. [Google Scholar] [CrossRef]
  4. Judycki, J. Determination of equivalent axle load factors on the basis of fatigue criteria for flexible and semi-rigid pavements. Road Mater. Pavement Des. 2010, 11, 187–202. [Google Scholar] [CrossRef]
  5. Li, L.; Huang, X.; Han, D.; Dong, M.; Zhu, D. Investigation of rutting behavior of asphalt pavement in long and steep section of mountainous highway with overloading. Constr. Build. Mater. 2015, 93, 635–643. [Google Scholar] [CrossRef]
  6. Wang, G.; Morian, D.; Frith, D. Combined Effect of Three-Dimensional Contact Load and Thermal Gradients on the Cracking Performance of Heavy-Duty Asphalt Pavements. Transp. Res. Rec. J. Transp. Res. Board 2013, 2368, 66–78. [Google Scholar] [CrossRef]
  7. Zheng, M.; Han, L.; Wang, C.; Xu, Z.; Li, H.; Ma, Q. Simulation of Permanent Deformation in High-Modulus Asphalt Pavement with Sloped and Horizontally Curved Alignment. Appl. Sci. 2017, 7, 331. [Google Scholar] [CrossRef]
  8. Segel, L.; Lu, X.P. Vehicular resistance to motion as influenced by road roughness and highway alignment. Aust. Road Res. 2013, 12, 211–222. [Google Scholar]
  9. Kakara, S.; Chowdary, V. Effect of Pavement Roughness and Transverse Slope on the Magnitude of Wheel Loads. Arab. J. Sci. Eng. 2020, 45, 4405–4418. [Google Scholar] [CrossRef]
  10. Barbosa, R.S. Vehicle Dynamic Safety in Measured Rough Pavement. J. Transp. Eng. 2011, 137, 305–310. [Google Scholar] [CrossRef] [Green Version]
  11. Degrande, M.A.; Lombaert, G. The effect of road unevenness on the dynamic vehicle response and ground-borne vibrations due to road traffic. Soil Dyn. Earthq. Eng. 2011, 31, 1357–1377. [Google Scholar]
  12. Khavassefat, P.; Jelagin, D.; Birgisson, B. Dynamic response of flexible pavements at vehicle–road interaction. Road Mater. Pavement Des. 2015, 16, 256–276. [Google Scholar] [CrossRef]
  13. Mucka, P. Road waviness and the dynamic tyre force. Int. J. Veh. Des. 2004, 36, 216. [Google Scholar] [CrossRef]
  14. Cebon, D. Vehicle-Generated Road Damage: A Review. Veh. Syst. Dyn. 1989, 18, 107–150. [Google Scholar] [CrossRef]
  15. Bilodeau, J.P.; Gagnon, L.; Doré, G. Assessment of the relationship between the international roughness index and dynamic loading of heavy vehicles. Int. J. Pavement Eng. 2015, 18, 693–701. [Google Scholar] [CrossRef]
  16. Zhu, J.; Zhang, W. Probabilistic fatigue damage assessment of coastal slender bridges under coupled dynamic loads. Eng. Struct. 2018, 166, 274–285. [Google Scholar] [CrossRef]
  17. Liu, Y.; Fang, H.; Zheng, J.-J.; Wang, Y.-N. Dynamic behaviour of pavement on a two-parameter viscoelastic foundation subjected to loads moving with variable speeds. Int. J. Pavement Eng. 2021, 1–19. [Google Scholar] [CrossRef]
  18. Beer, M.D. Measurement of tyre/pavement interface stresses under moving wheel loads. Int. J. Heavy Veh. Syst. 1996, 3, 97–115. [Google Scholar]
  19. Cebon, D. Interaction between Heavy Vehicles and Roads; SAE Technical Papers; SAE International: Warrendale, PA, USA, 1993. [Google Scholar] [CrossRef]
  20. Collop, A.C.; Potter, T.E.; Cebon, D.; Cole, D.J. Investigation of spatial repeatability using a tire force measuring mat. Comp. Biochem. Physiol. Part A Mol. Integr. Physiol. 1994, 131, 467–474. [Google Scholar]
  21. Li, S.; Yang, S.; Chen, L.-Q.; Lu, Y. Effects of parameters on dynamic responses for a heavy vehicle-pavement-foundation coupled system. Int. J. Heavy Veh. Syst. 2012, 19, 207. [Google Scholar] [CrossRef]
  22. Yang, S.; Li, S.; Lu, Y. Investigation on dynamical interaction between a heavy vehicle and road pavement. Veh. Syst. Dyn. 2010, 48, 923–944. [Google Scholar] [CrossRef]
  23. Park, D.-W.; Papagiannakis, A.T.; Kim, I.T. Analysis of dynamic vehicle loads using vehicle pavement interaction model. KSCE J. Civ. Eng. 2014, 18, 2085–2092. [Google Scholar] [CrossRef]
  24. Ren, W.Q.; Zhang, Y.Q.; Jin, G.D. A new application of multi-body system dynamics in vehicle-road interaction simulation. Wuhan Univ. J. Nat. Sci. 2003, 8, 379–382. [Google Scholar]
  25. Gillespie, T.D. Fundamentals of Vehicle Dynamics; General Motors Inst., SAE International: Washington, DC, USA, 2000. [Google Scholar]
  26. Shi, X.M.; Cai, C.S. Simulation of Dynamic Effects of Vehicles on Pavement Using a 3D Interaction Model. J. Transp. Eng. 2009, 135, 736–744. [Google Scholar] [CrossRef]
  27. Nguyen, T.-T. Mining incrementally closed item sets with constructive pattern set. Expert Syst. Appl. 2018, 100, 41–67. [Google Scholar] [CrossRef]
  28. Abdolrasol, M.G.M.; Hussain, S.M.S.; Ustun, T.S.; Sarker, M.R.; Hannan, M.A.; Mohamed, R.; Ali, J.A.; Mekhilef, S.; Milad, A. Artificial Neural Networks Based Optimization Techniques: A Review. Electronics 2021, 10, 2689. [Google Scholar] [CrossRef]
  29. Banharnsakun, A. Hybrid ABC-ANN for pavement surface distress detection and classification. Int. J. Mach. Learn. Cybern. 2017, 8, 699–710. [Google Scholar] [CrossRef]
  30. Zhang, H.; Fu, X.; Jiang, H.; Liu, X.; Lv, L. The relationships between asphalt ageing in lab and field based on the neural network. Road Mater. Pavement Des. 2015, 16, 493–504. [Google Scholar] [CrossRef]
  31. Androjić, I.; Dolaček-Alduk, Z. Artificial neural network model for forecasting energy consumption in hot mix asphalt (HMA) production. Constr. Build. Mater. 2018, 170, 424–432. [Google Scholar] [CrossRef]
  32. Gajewski, J.; Sadowski, T. Sensitivity analysis of crack propagation in pavement bituminous layered structures using a hybrid system integrating Artificial Neural Networks and Finite Element Method. Comput. Mater. Sci. 2014, 82, 114–117. [Google Scholar] [CrossRef]
  33. Saltan, M.; Terzi, S.; Küçüksille, E.U. Backcalculation of pavement layer moduli and Poisson’s ratio using data mining. Expert Syst. Appl. 2011, 38, 2600–2608. [Google Scholar] [CrossRef]
  34. Commuri, S.; Mai, A.T.; Zaman, M. Neural Network–Based Intelligent Compaction Analyzer for Estimating Compaction Quality of Hot Asphalt Mixes. J. Constr. Eng. Manag. 2011, 137, 634–644. [Google Scholar] [CrossRef] [Green Version]
  35. Alatoom, Y.; Al-Suleiman, T. Development of pavement roughness models using Artificial Neural Network (ANN). Int. J. Pavement Eng. 2022, 1–16. [Google Scholar] [CrossRef]
  36. Sirhan, M.; Bekhor, S.; Sidess, A. Implementation of Deep Neural Networks for Pavement Condition Index Prediction. J. Transp. Eng. Part B Pavements 2022, 148, 04021070. [Google Scholar] [CrossRef]
  37. Gopalakrishnan, K.; Kim, S. Support Vector Machines Approach to HMA Stiffness Prediction. J. Eng. Mech. 2011, 137, 138–146. [Google Scholar] [CrossRef]
  38. Maalouf, M.; Khoury, N.; Laguros, J.G.; Kumin, H. Support vector regression to predict the performance of stabilized aggregate bases subject to wet-dry cycles. Int. J. Numer. Anal. Methods Géoméch. 2012, 36, 675–696. [Google Scholar] [CrossRef]
  39. Zhang, H.; Yang, S.; Ma, Z. Model of the wheel motion state under path constraints based on the Darboux frame in 3D space. Eng. Comput. 2018, 35, 2883–2903. [Google Scholar] [CrossRef]
  40. Zhang, H.; Yang, S. Smooth path and velocity planning under 3D path constraints for car-like vehicles. Robot. Auton. Syst. 2018, 107, 87–99. [Google Scholar] [CrossRef]
  41. Michigan Science Corporation. Heavy Duty Wheel Force Transducer System. Available online: http://www.msc-cn.com/download/wheel-force-transducers-wft-brochure/?wpdmdl=2631 (accessed on 1 November 2019).
  42. Feng, L.; Lin, G.; Zhang, W.; Pang, H.; Wang, T. Design and optimization of a self-decoupled six-axis wheel force transducer for a heavy truck. Proc. Inst. Mech. Eng. Part D J. Automob. Eng. 2015, 229, 1585–1610. [Google Scholar] [CrossRef]
  43. Xue, W. R Language Data Mining; People’s University of China Press: Beijing, China, 2016. [Google Scholar]
  44. Asadi, S.; Hassan, M.; Nadiri, A.; Dylla, H. Artificial intelligence modeling to evaluate field performance of photocatalytic asphalt pavement for ambient air purification. Environ. Sci. Pollut. Res. 2014, 21, 8847–8857. [Google Scholar] [CrossRef]
  45. Zeng, W.; Miwa, T.; Morikawa, T. Application of the support vector machine and heuristic k-shortest path algorithm to determine the most eco-friendly path with a travel time constraint. Transp. Res. Part D Transp. Environ. 2017, 57, 458–473. [Google Scholar] [CrossRef]
  46. Chen, Y.; Pedrycz, W.; Watada, J. A fuzzy regression based support vector machine (svm) approach to fuzzy classification. Icic Express Lett. 2010, 4, 2355–2362. [Google Scholar]
  47. Gillespie, T.D. Effects of Heavy-Vehicle Characteristics on Pavement Response and Performance; Nchrp Report; American Association of State Highway and Transportation Officials: Washington, DC, USA, 1993. [Google Scholar]
  48. Lu, S. An overview of a unified theory of dynamics of vehicle–pavement interaction under moving and stochastic load. J. Mod. Transp. 2013, 21, 135–162. [Google Scholar]
Figure 1. Relationship between road surface distresses and alignment distribution in G319: (a) distribution of distresses; (b) longitudinal profile.
Applsci 12 05719 g001aApplsci 12 05719 g001b
Figure 2. Geometry of horizontal and vertical alignments of the highway: (a) horizontal alignment; (b) vertical alignment.
Applsci 12 05719 g002
Figure 3. Research methodology.
Applsci 12 05719 g003
Figure 4. Highway horizontal alignment (G319 National Highway).
Applsci 12 05719 g004
Figure 5. Field test of vehicle dynamic load: (a) wheel force transducer; (b) WFT installed on the testing truck.
Applsci 12 05719 g005
Figure 6. Neural network model used in this study.
Applsci 12 05719 g006
Figure 7. Relationship between vehicle dynamic load and alignment geometry in G319 section: (a) horizontal alignment; (b) vertical alignment.
Applsci 12 05719 g007
Figure 8. Performance of the ANN model with five input variables (M5) using the training and testing datasets: (a) training; (b) testing.
Applsci 12 05719 g008
Figure 9. Performance of the ANN model with four input variables (M4k) using the training and testing datasets: (a) training; (b) testing.
Applsci 12 05719 g009
Figure 10. Performance of the ANN model with four input variables (M4g) using the training and testing datasets: (a) training; (b) testing.
Applsci 12 05719 g010
Figure 11. Performance of the ANN model with three input variables (M3) using the training and testing datasets: (a) training; (b) testing.
Applsci 12 05719 g011
Table 1. Statistics of horizontal curvature k (G319 National Highway).
Interval Partition Curvature k (m)Proportion of Total Curve Length (%)
<1/20029.2
1/200~1/1704.9
1/170~1/1406.2
1/140~1/11012.5
1/110~1/8024.5
1/80~1/5017.2
1/50~1/205.6
Table 2. Statistics of longitudinal grade g (G319 National Highway).
Interval Partition Longitudinal Grade g (%)Proportion of the Total Length (%)
0~143.1
1~28.4
2~39.5
3~410.8
4~510.6
5~69.0
6~76.6
7~81.9
Table 3. Statistics results of wheel dynamic loads (unit: kN).
Axle TypesLoads MinimumMaximumMeanStandard DeviationRoot Mean Square
Steering axleEmpty14.5630.9817.491.2217.45
Full21.2445.1226.041.7725.98
Driving axleEmpty7.1621.9510.931.4510.83
Full27.7358.2436.432.5736.33
Table 4. Cross-validation results in the training process.
MetricM5M4M3
M4kM4g
ANNSVMANNSVMANNSVMANNSVM
RMES1.6481.8512.4692.7183.4463.6324.1124.367
R20.9720.9640.9400.9240.8920.8790.8470.832
Publisher’s Note: MDPI stays neutral with regard to jurisdictional claims in published maps and institutional affiliations.

