Article

Qualitative and Quantitative Analysis of the Causes of Occupational Accidents Related to the Use of Construction Scaffoldings

1
Department of Materials Engineering and Construction Processes, Faculty of Civil Engineering, Wroclaw University of Science and Technology, 50-370 Wrocław, Poland
2
Department of Architectural Engineering, College of Engineering, University of Sharjah, Sharjah P.O. Box 27272, United Arab Emirates
*
Author to whom correspondence should be addressed.
Appl. Sci. 2022, 12(11), 5514; https://doi.org/10.3390/app12115514
Submission received: 1 May 2022 / Revised: 18 May 2022 / Accepted: 26 May 2022 / Published: 29 May 2022

Abstract

:
This article proposes a methodology for classifying occupational accidents involving scaffolding based on the knowledge of the causes that led to their occurrence. Each occupational accident is caused by several causes belonging to three generic groups (technical, organizational, human) occurring in a different configuration. The aim of this research was to determine the qualitative and quantitative structure of the causes of accidents caused by falling from scaffolding. Significant causes were selected from the set of all the causes identified in the analyzed set of accidents. For this purpose, Pareto–Lorenz analysis and the ABC classification were used. Then, a set of significant causes containing technical, organizational and human causes was created, which was the basis for determining the subsets of accidents caused by similar causes. The hierarchical cluster analysis method, the agglomeration clustering technique and the binding of objects using the Ward method were proposed to determine the number of characteristic clusters. Three subsets of accidents with a similar set of causes were obtained. Information on the quality and number of causes in individual subsets was used to estimate the probability of an accident caused by a given set of causes and to assess occupational risk in construction. Calculations were performed using Statistica software.

1. Introduction

A large and uncontrolled number of occupational safety hazards that occur during construction works lead to accidents at work or other dangerous situations. The construction industry is one of the most dangerous branches of the economy in the world [1]. This is due to the influence of many factors (related to the conditions of construction works, the type of performed works, the type of used equipment, etc.) on occupational safety [2,3]. In analyses of the state of occupational safety, the accident factor should be understood as all types of tangible and intangible activities that directly or indirectly affect the accidentality phenomenon [2]. In order to reduce the number of accidents, it is necessary to properly diagnose this phenomenon, and in particular to identify the main factors contributing to the occurrence of accidents.

1.1. Identification and Analysis of Accident Factors

The identification and analysis of accident factors are important areas of scientific research, because they are the basis for the proper design and planning of preventive measures [2,4,5,6]. In studies of accident factors, questionnaire research and documentation analysis are used first. Choudhry and Fang [7] presented the results of a survey concerning the identification of accident factors, which was conducted among construction workers. The identified factors were assigned to groups related to: management, safety procedures, the psychological features of employees, economy and work efficiency, self-assessment, the experience and perception of risk of employees, the work environment and training and education in the field of occupational safety. In [2], accident factors, which were identified on the basis of a research questionnaire, were divided into three groups depending on the degree of their connection with the accident. Group I included factors directly related to the construction site, group II involved factors generated in an organization such as a construction company and group III included factors generated in the surroundings of a construction company. Among the publications concerning this subject, the work of Stępień [8] deserves special attention. The author, on the basis of an extensive analysis of the subject literature, established a detailed classification of accident factors and divided them into four groups related to: working conditions, employees, management and organization of work, and the work environment.
Each accident at work is caused by the simultaneous action of several factors that are the direct causes of the accident [9,10]. The sources of these factors are directly related to, among others, the construction site [11], the organization of work processes [12], the organization of the construction enterprise and its size [3,13]. On the basis of the authors’ previous research [3], it was observed that the surroundings of the construction site may also affect the level of occupational safety. This is confirmed by, among others, the studies of [14,15], in which particular attention was paid to the impact of the social environment on the culture of occupational safety in the construction industry.
In Poland, a popular method of classifying the causes of occupational accidents is the TOL method, which was initiated by Hansen [16,17]. This method assumes that every accident is the result of three types of causes, namely:
  • Technical (T), related to, among others, defects and damage to tools and devices used during works;
  • Organizational (O), related to, among others, the improper organization of the work process and workstations;
  • Human (L), related to the incorrect behavior of employees, their psychophysical state, etc.
As the research conducted to date shows, a significant proportion of accidents in the construction industry are related to working at height, including working on building scaffoldings [9,18]. Working on these workstations is burdened with a high occupational risk, and the possible consequences of an accident are usually very serious. This is confirmed, among others, by studies conducted by Taiwanese scientists [19,20], according to which accidents involving construction scaffolding account for approximately 30% of all fatal accidents in the construction industry.
An unfavorable situation related to working at height results from a large amount of negligence concerning employers and employees performing such works. According to the inspection of 4779 Polish construction sites, which was carried out by the National Labour Inspectorate in 2018 [21,22], violations of regulations related to safe work at height were found in 62% of the cases. In 47% of the inspected construction sites, irregularities directly related to the use of building scaffoldings were found.

1.2. Causes of Accidents

In order to reduce the number of accidents on building scaffoldings, it is necessary to properly identify the accidentality phenomenon on these types of structures (and in particular the main causes that initiate accidents at work), and also to develop effective tools for risk control and the prevention of accidents at work. Liy et al. [23] indicated that the main cause of falls from roofs and scaffoldings is the lack of protective barriers. Whitaker et al. [24] determined that the main and most frequent causes of accidents were: arbitrary modification of the scaffolding structure, the use of defective elements, the lack of barriers and construction errors. In turn, Suraji et al. [25] showed that the most common causes of accidents were: violations of applicable regulations, ignorance of health and safety rules, insufficient individual and collective protective equipment of employees and workplaces and an improperly conducted construction process. The above results were also confirmed by Chi and Han [26]. In turn, Halperin and McCann [20] showed a strong correlation between the number of defects in the scaffolding structure and the level of the risk of falling, as well as between the applied safety practices on scaffoldings and the competences of people running on-the-job training. According to Evanoff et al. [27], the safety of work on scaffoldings can be improved by using appropriate training methods. Moreover, Wong et al. [28] analyzed falls from a height in Hong Kong. They divided the factors influencing accidents into four categories, namely: poor planning, violations of regulations, hidden dangers caused by others and the incapability of staff. In addition, the authors identified irregularities in the management of the construction site, which included: the lack of risk control, the use of dangerous methods and procedures and the inadequate training and supervision of works. The research presented in the above articles is of a statistical nature. Based on the analysis of a specific set of accidents, the percentage share of various causes leading to accidents was determined. A methodical approach to the analysis of the causes of accidents in the construction industry was presented by Gibb et al. In [29,30], the authors classified the root causes of an accident at a construction site as: failure to identify a hazardous condition that existed before or after the commencement of operations; the decision to continue work after an employee identifies an existing unsafe condition; and the decision to act in a dangerous manner irrespective of initial conditions. Błazik-Borowa et al. [31,32] indicated that the occurrence of an accident is largely influenced by conditions that are present throughout the scaffolding’s “life cycle”, including the stage of preparation of documentation related to the scaffolding, the selection of assembly elements, the assembly and operation phase and the scaffolding’s disassembly. According to the literature, the problem of occupational accidents on building scaffoldings occurs in many countries. This problem is perceived and analyzed with regard to various aspects.
The aim of the research presented in this article was to obtain information concerning the qualitative and quantitative structure of the causes that result in the greatest number of occupational accidents involving building scaffoldings. For this purpose, an original methodology for classifying accidents in terms of their causes was developed based on Pareto–Lorenz analysis and cluster analysis. Therefore, information about 213 occupational accidents related to the use of scaffolding was obtained. Based on a thorough analysis of this information, the sets of causes that led to the accidents were developed and classified as technical (T), organizational (O) and human (L) causes. From the set of all the identified causes, the most important causes, which had the greatest impact on the occurrence of an accident, were selected. The obtained set of causes was the basis for determining the subsets of accidents caused by a similar set of causes. The calculations were performed using Statistica software.

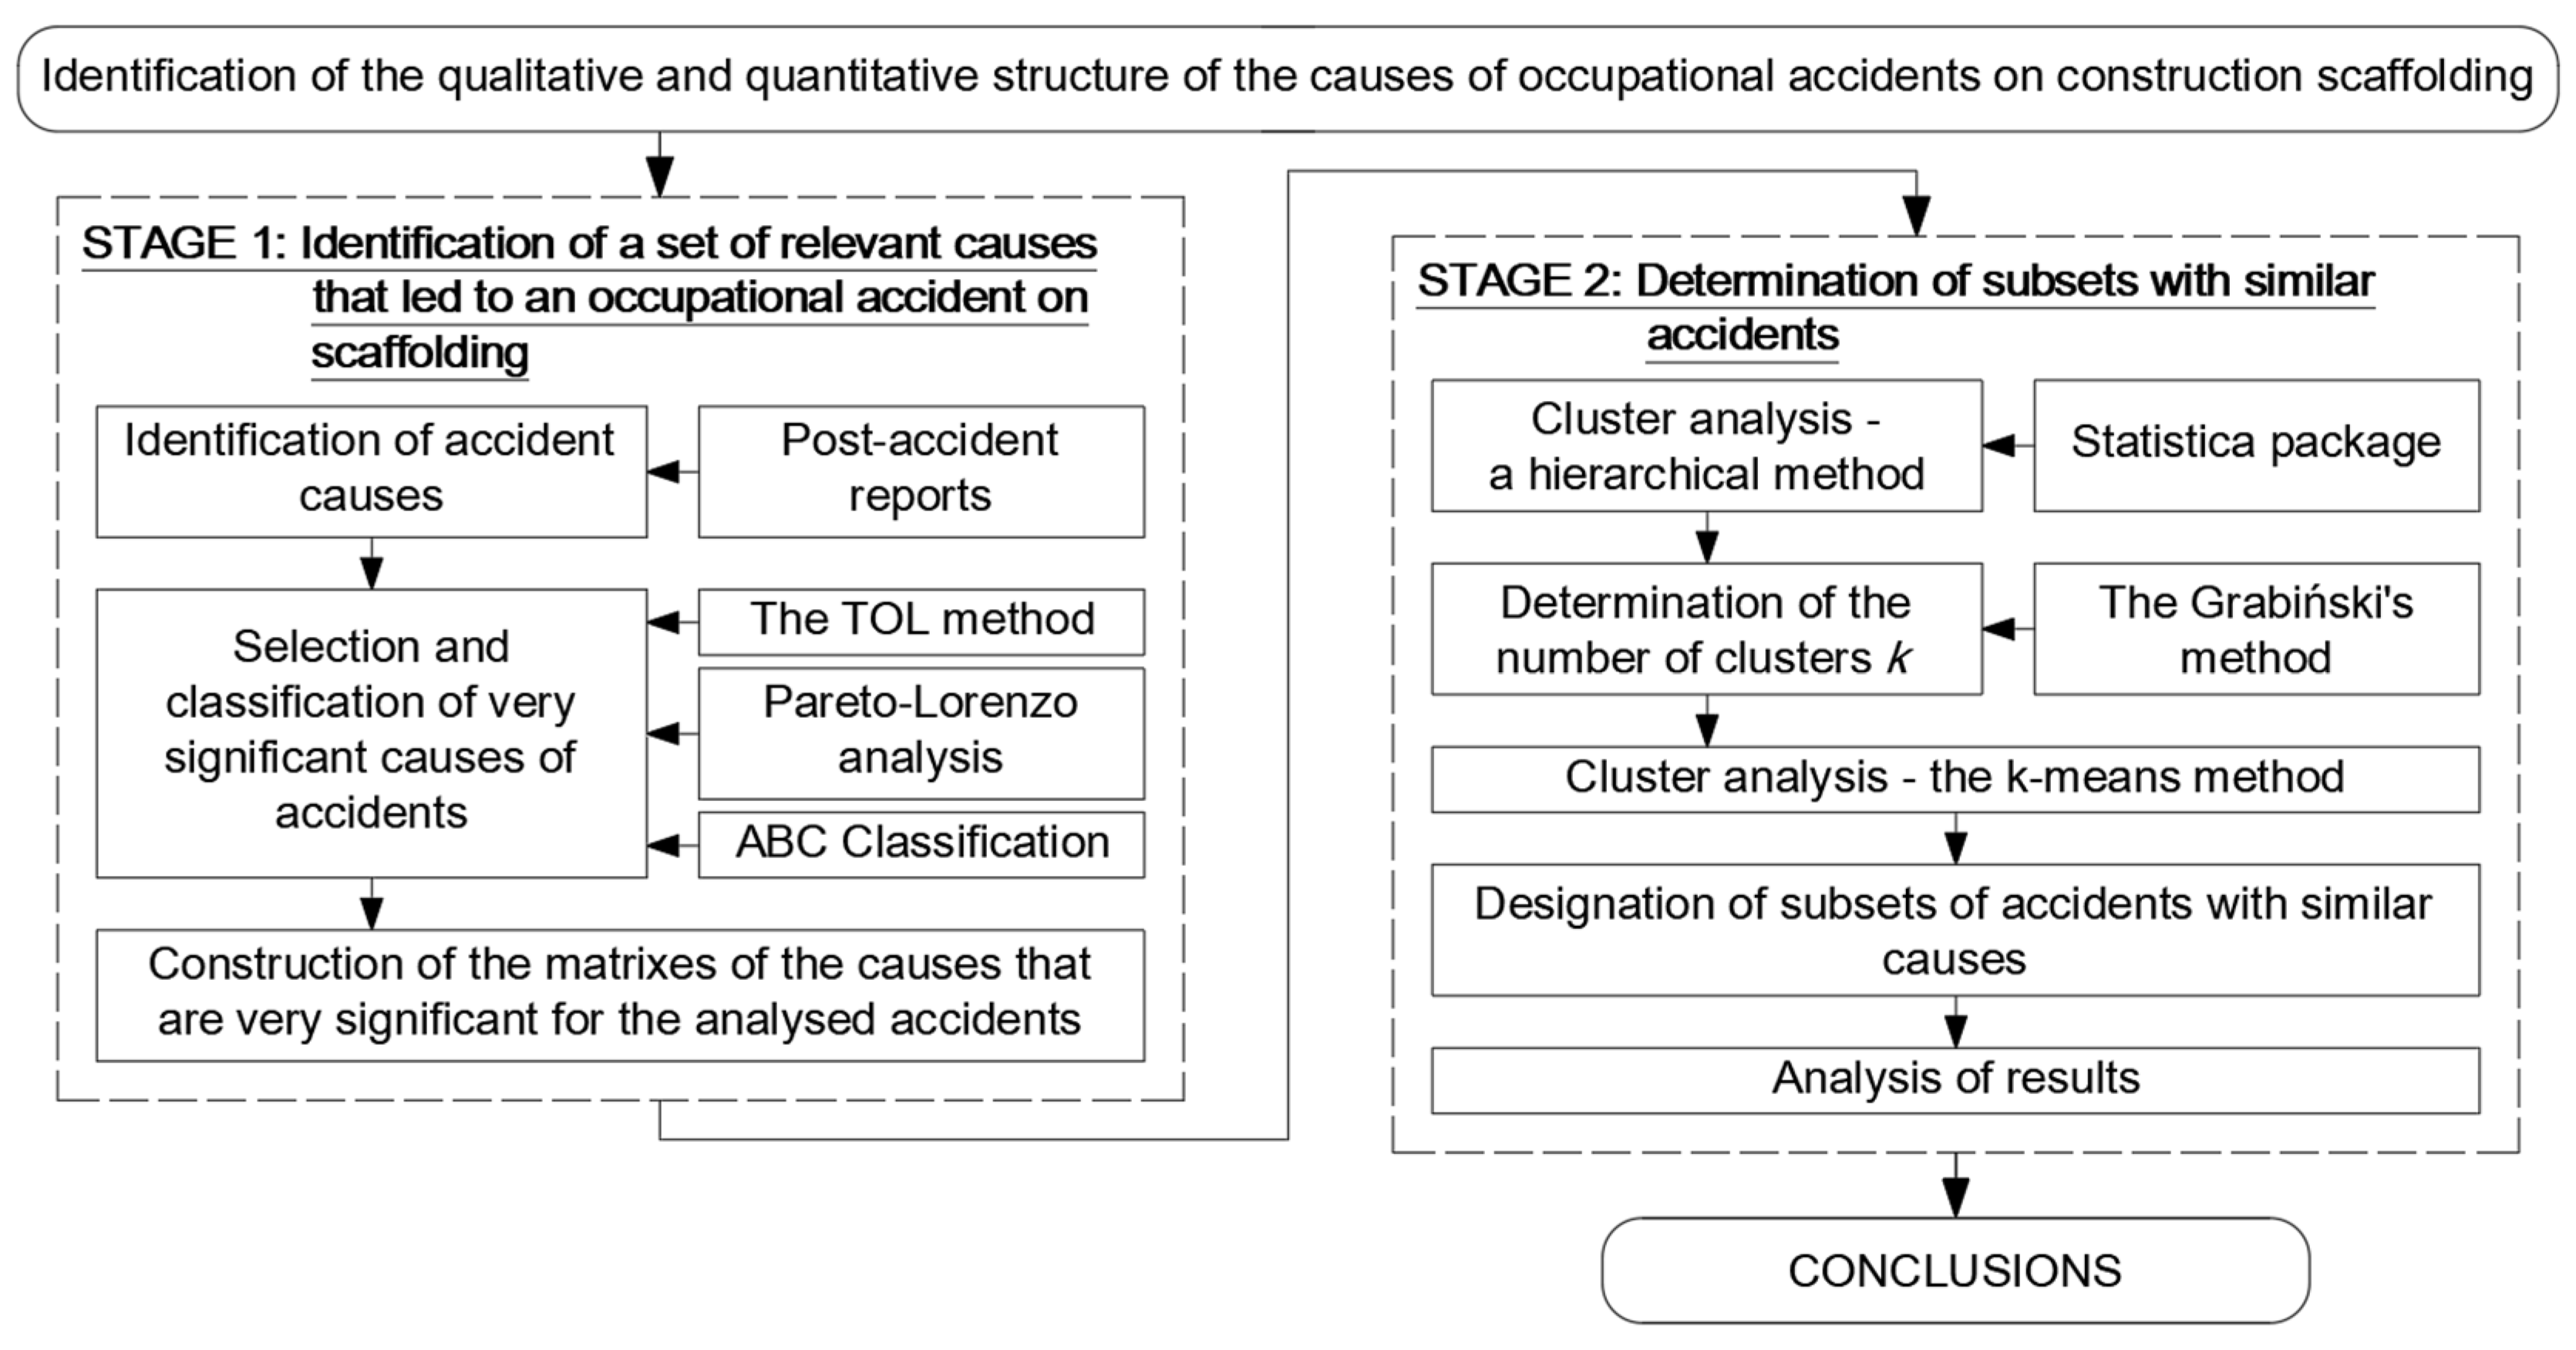
2. Research Methodology

The research and analyses were carried out in accordance with the methodology presented in Figure 1. In the methodology proposed by the authors, two research tasks can be distinguished:
  • The identification of a set of significant causes that lead to accidents on building scaffoldings;
  • The development of subsets of similar accidents, and the identification of their causes.

2.1. The Identification of a Set of Significant Causes That Lead to Accidents on Building Scaffoldings

Every occupational accident has several different causes. Information on the causes of accidents can be obtained, among others, from post-accident protocols. A method of classifying the causes of occupational accidents [16], which is used in Poland, assumes that each accident is the result of a combination of three types of causes: technical (T), organizational (O) and human (L). In each of these groups, very significant, significant and insignificant causes can be distinguished. In order to identify the significance of the causes, the authors of [10] proposed the use of Pareto–Lorenz analysis and the ABC classification [33,34].
To classify the causes according to the degree of their influence on the accident, ABC analysis, which is known in economics and easy to implement, was used. According to the ABC method, it is necessary to divide the identified causes into three subsets. Therefore, it was assumed that:
  • The set of very significant causes, which is marked as A, includes 80% of all the causes that can be attributed to a specific group of causes;
  • The set of significant causes, which is marked as B, includes the causes that constitute 15% of all the causes that can be attributed to a specific group of causes;
  • The set of insignificant causes, which is marked as C, includes 5% of all the causes identified in the set.
Due to the very large number of possible combinations of all the identified causes of accidents, the very significant causes (constituting about 80% of all the identified causes of accidents) were separated from the set of all the causes, and further analysis was carried out for them.
The occurrence of a cause in the accident can be described in the form of the binary variable 0–1. The value of 1 means that a given cause occurred, while the value of 0 means that the given cause did not occur. The set of all the analyzed accidents is characterized by a matrix of causes, which is given by the following formula:
A V = [ T 1 , 1 T n , 1 O n , 1 L n , 1 L N , 1 T 1 , 2 T n , 2 O n , 2 L n , 2 L N , 2 T 1 , V T n , v O n , v L n , v L N , v T 1 , V T n , V O n , V L n , V L N , V ]
where:
  • A V —a set of analyzed accidents;
  • T n , v —the n-th technical cause of accident v , ( n = 1 ,   2 ,   3 ,   ,   N ), ( v = 1 ,   2 ,   3 ,   ,   V );
  • O n , v —the n-th organizational cause of accident v ;
  • L n , v —the n-th human cause of accident v .

2.2. The Development of the Subsets of Similar Accidents, and the Identification of Their Causes

The obtained set of all the causes was the basis for determining the subsets of accidents that are caused by similar causes. To determine these subsets, the use of cluster analysis was proposed [35,36,37,38,39]. The criterion for assessing whether an object belongs to a given subset is the measure of the similarity of objects. In practical considerations, this is the “dissimilarity” function of objects. This means that if the distance between objects O a and O b is greater than the distance between objects O a and O c , then O a is more “dissimilar” to O b than to O c . Consequently, this leads to a situation where objects O a and O c can form a cluster because they are more “similar” to each other. In the case of qualitative data analysis, the authors of the paper propose determining the distance measure with the use of the percentage deviation [35]. The general formula for the distance calculated using the percentage deviation takes the following form:
d ( O a , O b ) = t h e   n u m b e r   o f   a l l   p a i r s   i n   w h i c h :   P a , n P b , n t h e   n u m b e r   o f   a l l   p a i r s
where:
  • O a , O b —the analyzed objects, i.e., occupational accidents a and b , where ab, and a , b { v } ;
  • P a , n ,   P b , n —the values of individual parameters that describe the analyzed accidents a and b , where a b ; a ,   b     { v } ; n = 1 ,   2 ,   3 ,   ,   N ; and P a , n ,   P b , n { 0 ,   1 } .
In the analyzed task, the objects are individual accident events A v ;   ( v = 1 ,   2 ,   3 ,   ,   V ) . The method of hierarchical cluster analysis, the agglomeration technique of grouping and the binding of objects using the Ward method were proposed in order to determine the number of clusters [40]. Grabiński’s method was proposed to determine the cut-off point of the dendrogram [41]. The next step of the analysis was the assignment of accident events A v to individual clusters, i.e., the development of subsets of similar events in terms of their causes. The k-means clustering method was proposed for this purpose. According to this method, the place of division is the achievement of the bond distance for which the inequality given by the following formula is satisfied:
d i + 1 > M + k M · s d
where:
  • d 0 ,   d 1 ,   ,   d n 1 —the distance between the bonds for subsequent stages: n ,   n 1 ,   ,   1 ;
  • M —the average value of the distance between the bonds;
  • s d —standard deviation d i ;
  • k M —the constant, ranging from 2.75 to 3.50.
The analysis of the obtained results allows the qualitative and quantitative structure of the causes of occupational accidents involving construction scaffoldings to be determined. Table 1 lists the notations used in this paper.

3. Results

An analysis of occupational accidents that occurred within the years 2010 to 2017 in the Dolnośląskie, Lubelskie, Łódzkie, Mazowieckie and Wielkopolskie voivodeships was carried out. On its basis, 213 accidents involving scaffoldings were identified, for which a set of 1198 causes was determined. The nomenclature of the detailed causes adopted for the purposes of the analysis, which is presented in Table 1, Table 2 and Table 3, is the same as the nomenclature used in the statistical post-accident cards.

3.1. The Identification of a Set of Significant Causes That Lead to Accidents on Building Scaffoldings

In the analyzed set of accidents A V , technical causes T occurred 336 times in total. Table 1 lists the identified technical causes T , which are arranged in descending order, starting with the cause that occurred the greatest number of times. Table 2 contains the cardinality of occurrences of individual t γ causes, the percentage share of individual t γ causes, the cumulative percentage share of t γ causes and the validity class of t γ causes.
Figure 2 presents a Pareto–Lorenz diagram that shows the t γ causes, which are ordered from the maximum number of occurrences to the minimum number of occurrences, and also their cumulative percentage share. The figure also shows the validity class of causes: A—very significant; B—significant; C—insignificant. When analyzing the obtained results, it should be stated that technical causes t 1 ,   t 2 ,   t 3 and t 4 , the cumulative share of which is approximately 83%, are very significant.
In the analyzed set of accidents A V , organizational causes O occurred 622 times in total. Table 3 lists the identified organizational causes O , ordered from the maximum to the minimum, starting with the cause that occurred most often. Additionally, this table includes the cardinality of occurrences of individual o δ causes, the percentage share of individual o δ causes, the cumulative percentage share of o δ causes and the validity class of o δ causes.
Figure 3 presents a Pareto–Lorenz diagram that shows o δ causes that are ordered from the maximum cardinality of occurrences to the minimum cardinality of occurrences, and also their cumulative percentage share. The figure also shows the validity class of causes: A—very significant; B—significant; C—insignificant. When analyzing the obtained results, it should be stated that the organizational causes o 1 o 7 , the cumulative share of which is approximately 77%, are very significant.
In the analyzed set of accidents A , human causes L occurred 364 times in total. Table 4 lists the identified human causes l τ arranged in descending order, starting with the cause that occurred the greatest number of times. Additionally, the table contains the cardinality of occurrences of individual l τ causes, the percentage share of individual l τ causes, the cumulative percentage share of l τ causes and the validity class of l τ causes.
Figure 4 presents a Pareto–Lorenz diagram that shows the o δ causes, which are ordered from the maximum number of occurrences to the minimum number of occurrences, and also their cumulative percentage share. The figure also shows the validity class of causes: A—very significant; B—significant; C—insignificant.
When analyzing the obtained results, it should be stated that the human causes l 1   l 8 , the cumulative share of which is about 80%, are very significant. Selected sets of very significant technical, organizational and human causes, including significant causes and insignificant causes, which were cumulated to a single indicator, t o t h e r , o o t h e r or l o t h e r (depending on the type of cause), constituted the basis for determining the subsets of accidents caused by similar causes.

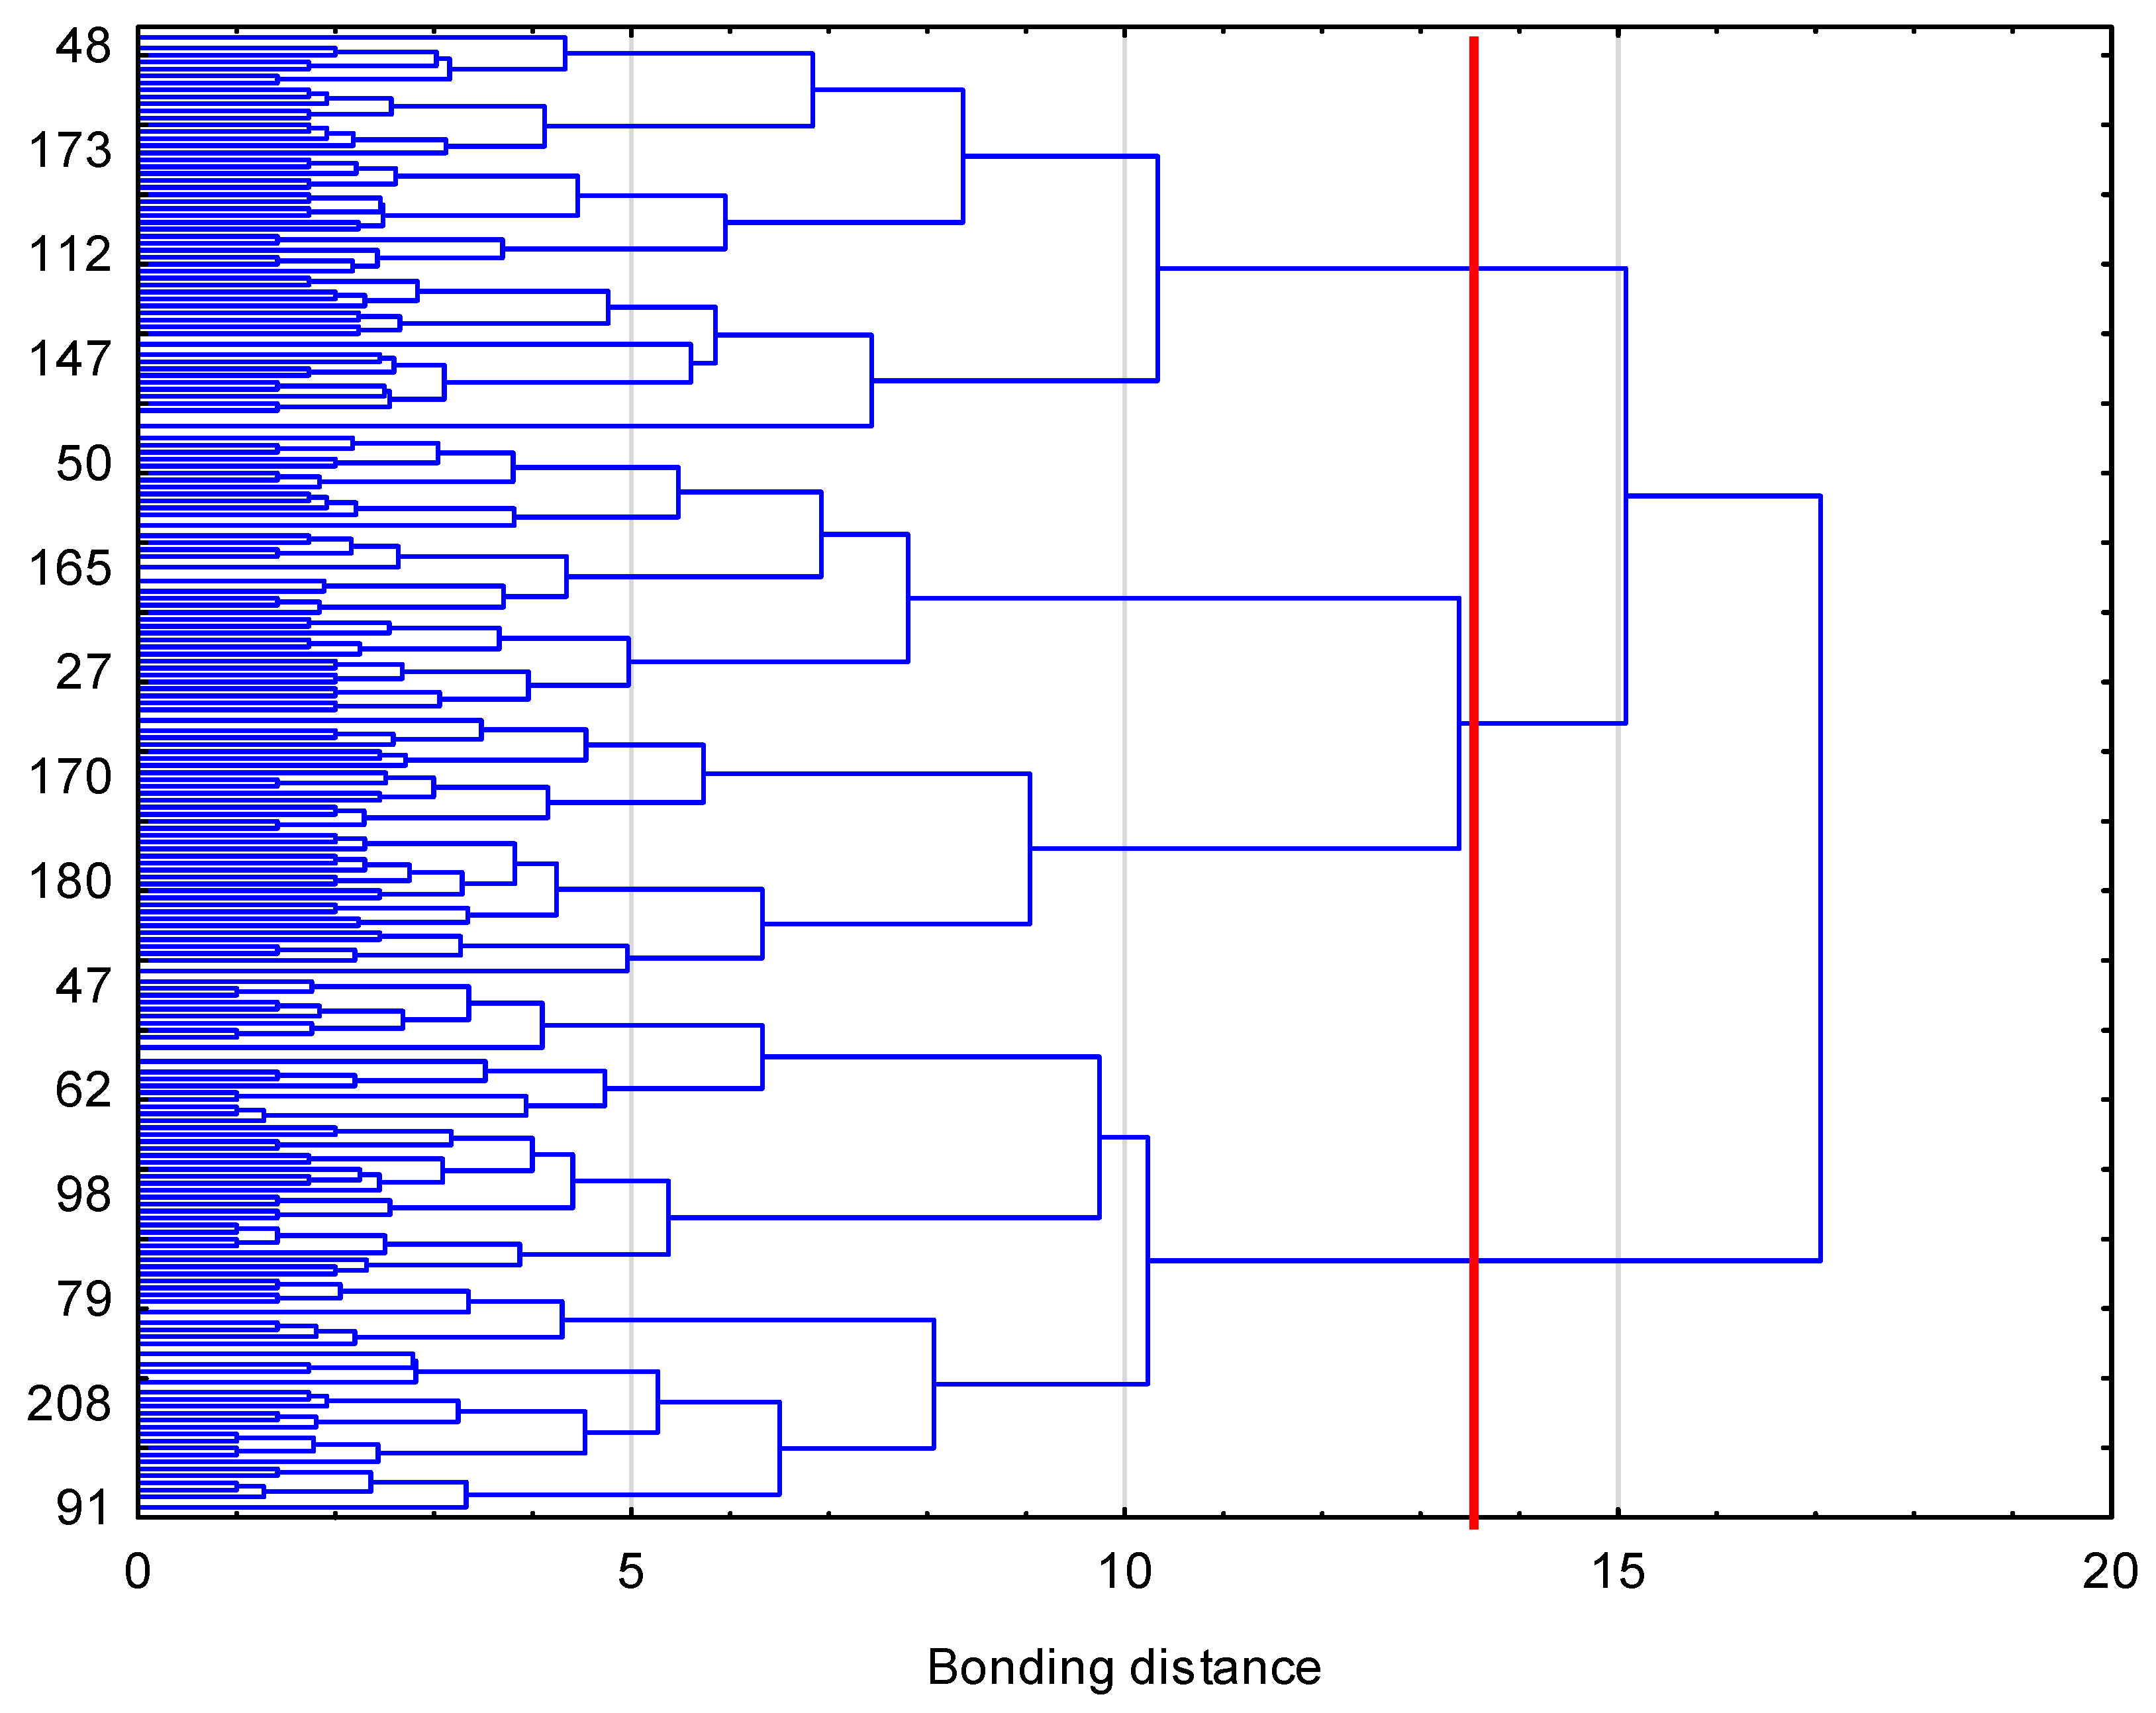
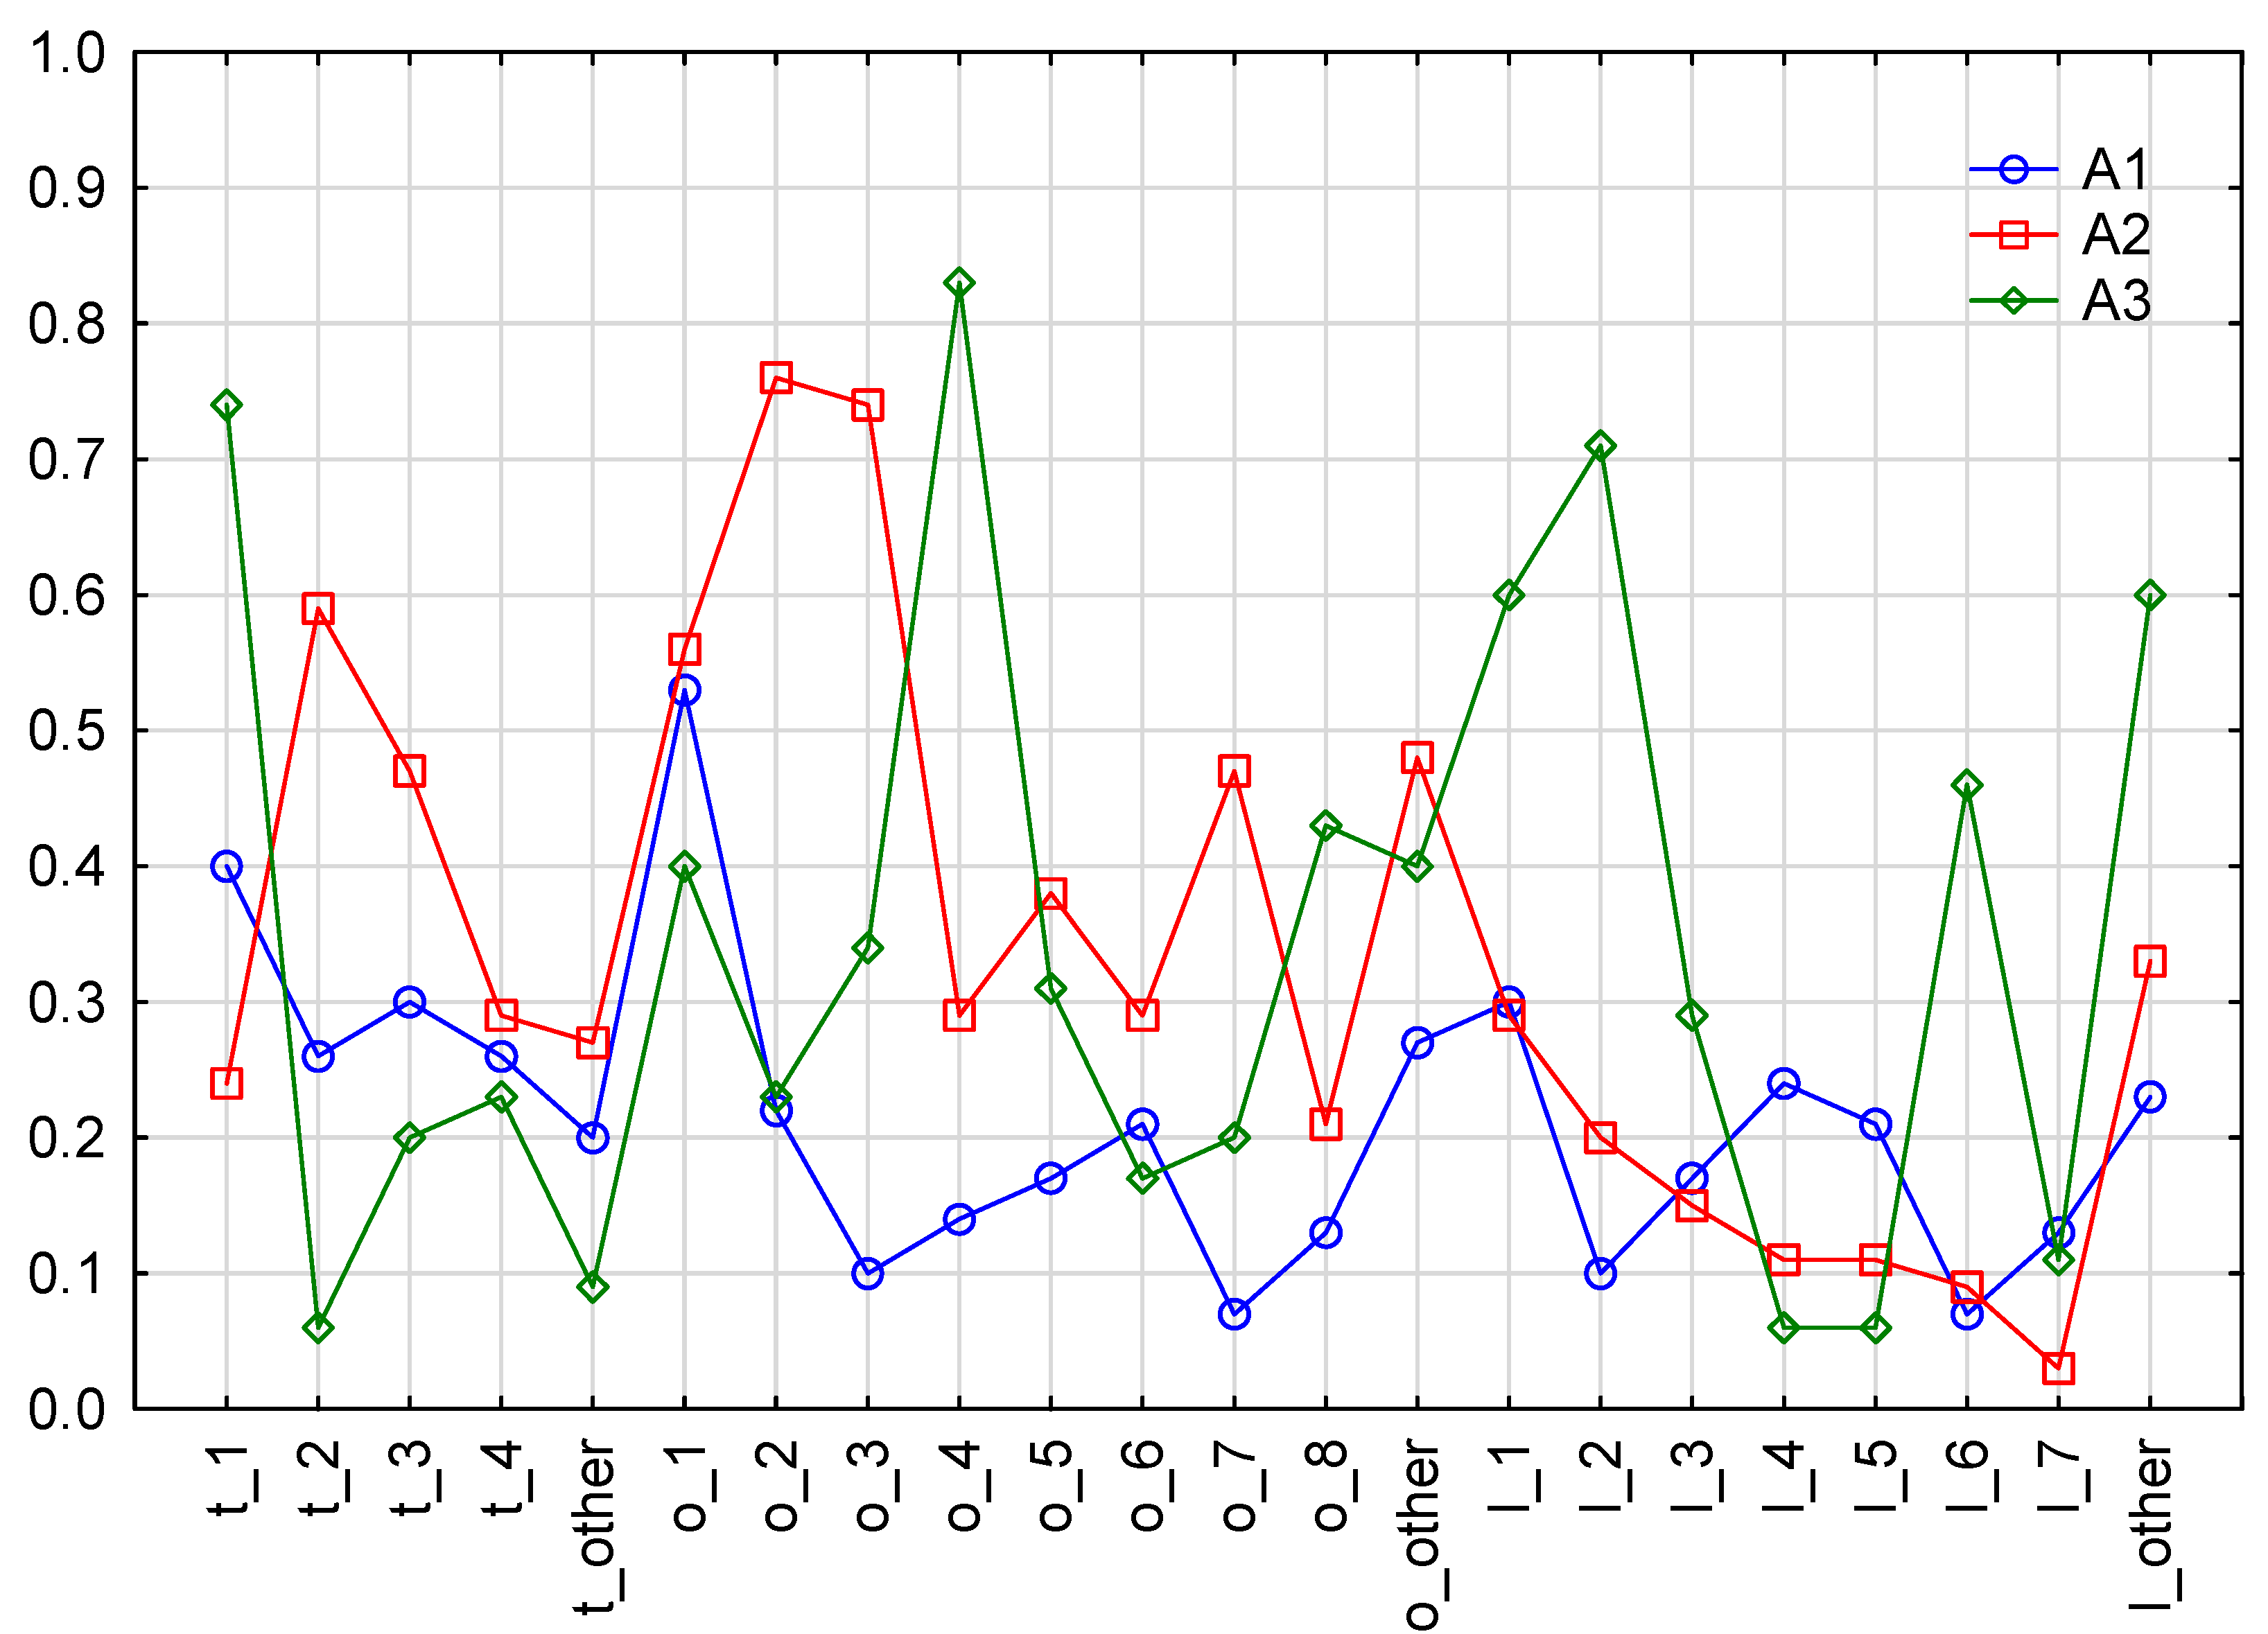
3.2. The Development of the Subsets of Similar Accidents, and the Identification of Their Causes

As a result of the calculations performed with the use of Statistica software, a dendrogram (shown in Figure 5) was obtained. The place of cutting off a dendrogram branch was determined using Grabiński’s method [41] and marked in Figure 5 with a red line. With such a cut-off, the analyzed data formed three clusters (k = 3).
In the next step of the analysis, the accidents were classified into three clusters. The k-means method was used, while at the same time, the previously determined expected number of clusters k = 3 was assumed. As a result of the conducted classification of all 213 accidents   A v into groups with a similar set of causes, three clusters of A k   ( k = 1 , ,   3 ) were obtained. The number of accident events A v in individual clusters is as follows:
  • Cluster A 1 —112 accident events A v ;
  • Cluster A 2 —66 accident events A v ;
  • Cluster A 3 —35 accident events A v .
The detailed characteristics of the obtained clusters are presented in Table 5 and illustrated by the graph in Figure 6. The individual values in Table 5 and Figure 5 show the share of a given cause in the subset of accident events A k . For example, technical causes t 1 occurred in 40% of events in group A 1 ( t 1 = 0.40 ), 24% of events in group A 2 ( t 1 = 0.24 ) and 74% of events in group A 3 ( t 1 = 0.74 ).

4. Discussion

4.1. The Identification of a Set of Significant Causes That Lead to Accidents on Building Scaffoldings

On the basis of the obtained results, it can be concluded that in the analyzed case, the Pareto principle that 20% of the identified causes occur in 80% of accidents involving scaffolding was not 100% fulfilled. In the analyzed cases, the following proportions of the causes with regard to their effects occurred:
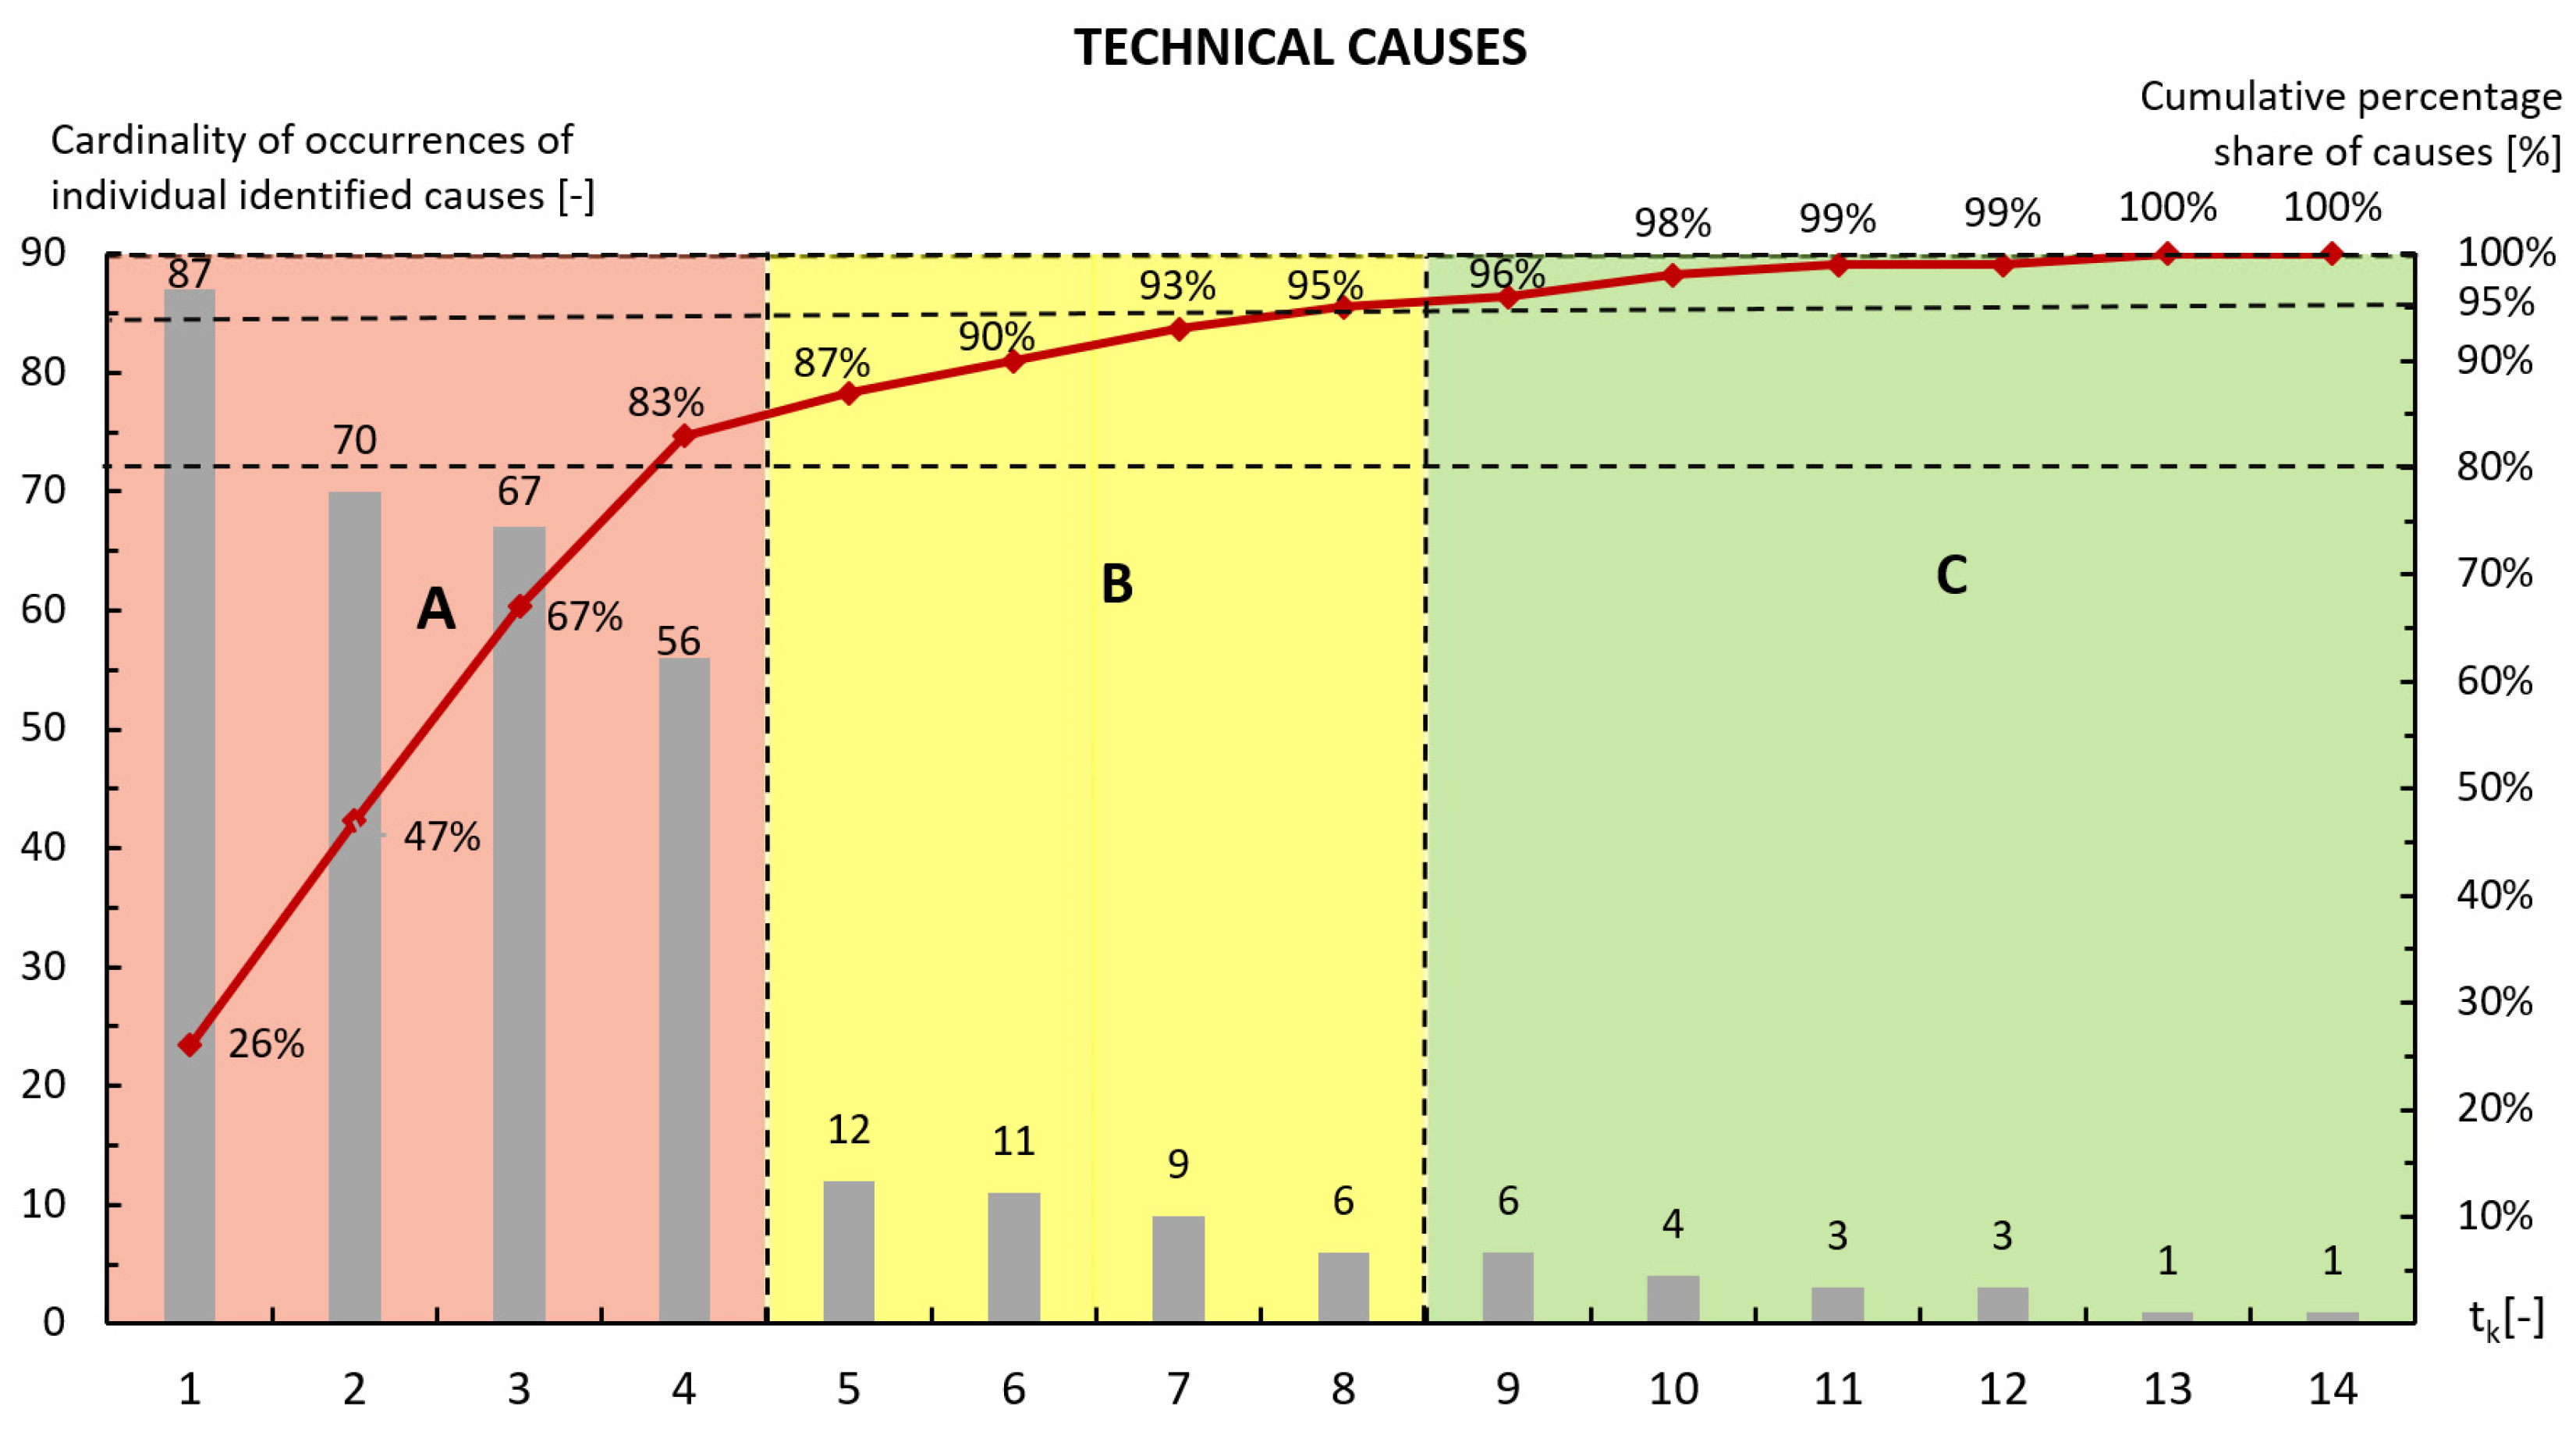
  • Very significant technical causes were: t 1 —lack of or inadequate protective devices; t 2 —lack of or inadequate measures of collective protection; t 3 —improper spatial structure of scaffoldings; t 4 —improper stability of scaffoldings. These causes constituted 28.6% of all the identified technical causes and occurred in 83% of all the accidents.
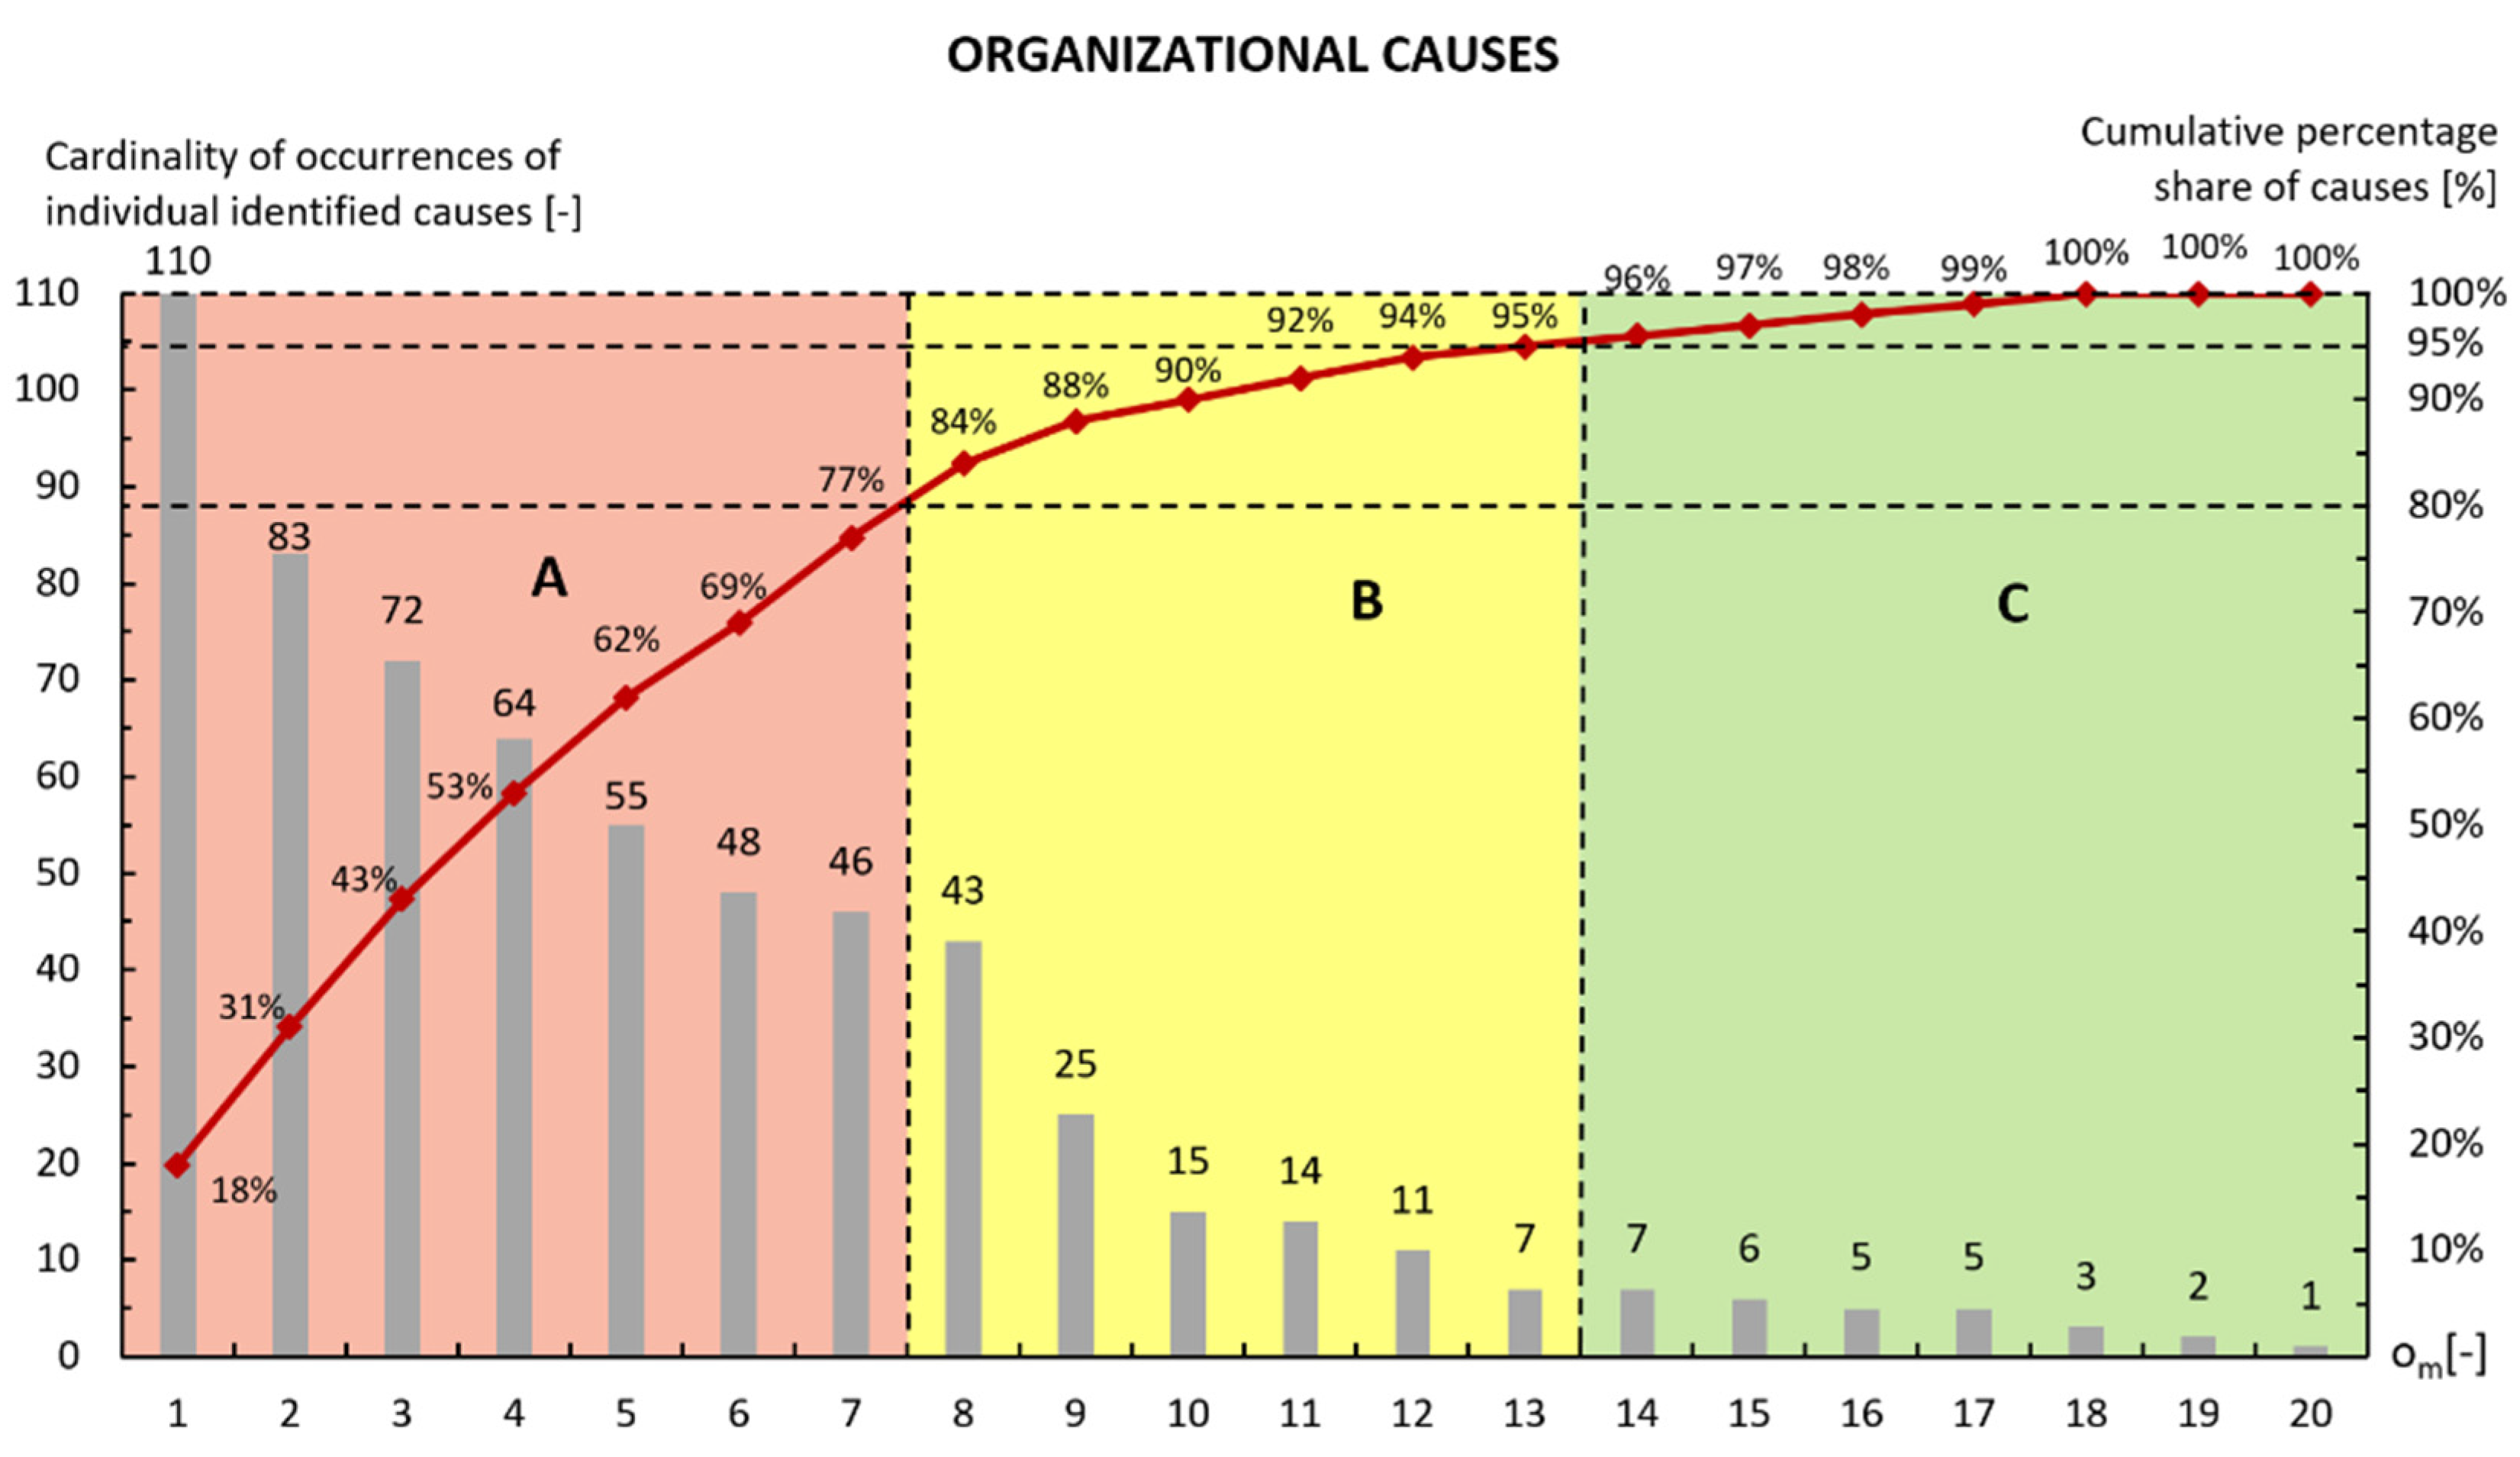
  • Very significant organizational causes were: o 1 —a lack of supervision; o 2 —admission of scaffoldings to operation without the required inspection and supervision; o 3 —lack of or inadequate training in the area of occupational health and safety; o 4 —acceptance of deviations from the rules and regulations of occupational health and safety; o 5 —inadequate professional training of an employee; o 6 —lack of instructions on how to use scaffoldings safely; o 7 —admission of an employee to work without medical examination or with medical contraindications;   o 8 —inadequate passages and access points. These causes constituted 40% of all the organizational causes and occurred in 84% all the accidents.
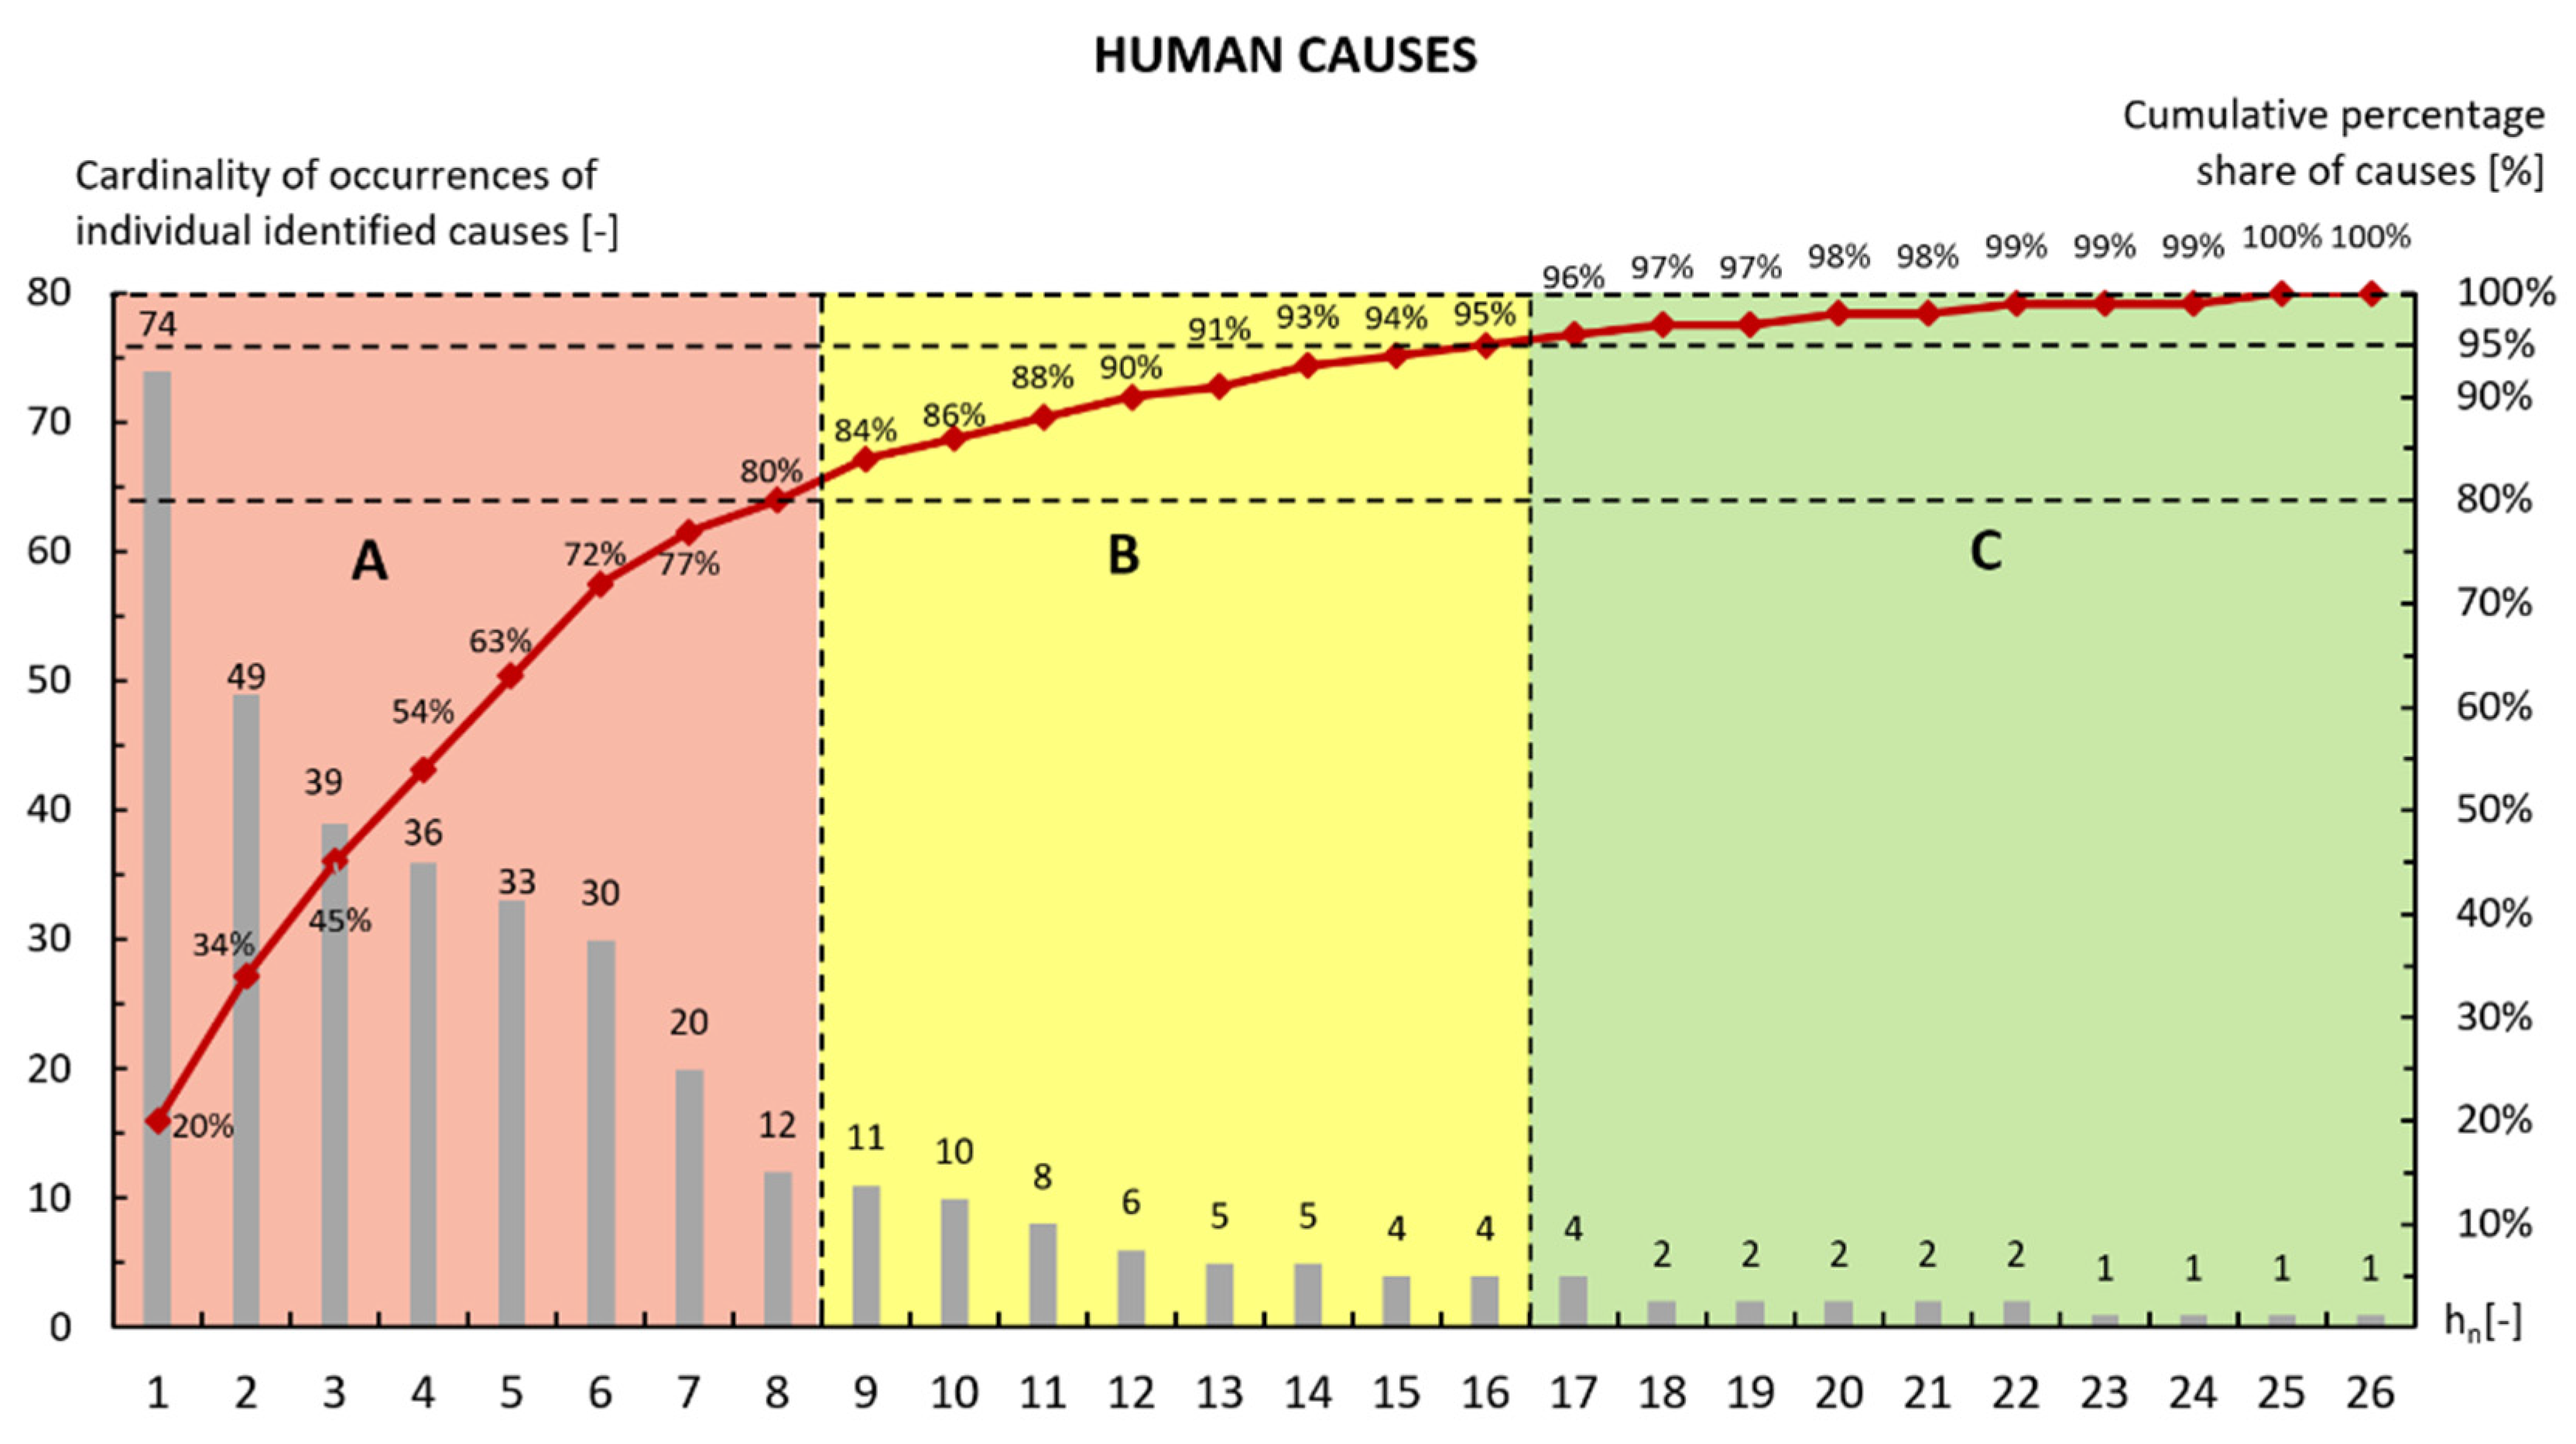
  • Very significant human causes were: l 1 —failure to use personal protective equipment by an employee; l 2 —disregarding danger; l 3 —being surprised by an unexpected event; l 4 —consumption of alcohol, drugs or psychotropic substances; l 5 —insufficient concentration; l 6 —going to, driving through or staying in places that are forbidden; l 7 —performing work that is not included in the scope of an employee’s duties; l 8 —ignorance of hazards. These causes accounted for 30.76% of all the identified human causes and occurred in 80% of all the accidents.
There is a very high probability that with an increase in the number of accidents involving scaffolding, the obtained proportions will be closer to the theoretical proportion of the Pareto principle, i.e., 20%/80%.

4.2. The Development of the Subsets of Similar Accidents, and the Identification of Their Causes

Based on the conducted calculations performed with the use of cluster analysis, three subsets were obtained, which contained accidents that are similar in terms of the causes that caused them. Set A 1 had 112 accidents. The dominant causes in the A 1 subset were: t 1 —lack of or inadequate protective devices; o 1 —lack of supervision, and tolerance of deviations from the provisions and rules of occupational health and safety by supervisors; l 1 —failure to use personal protective equipment by an employee, and ignorance of hazards. Subset A 1 included accidents with the most diverse structure of causes. This is evidenced by the low values of the share of the causes o 3 ,   o 4 ,   o 7 ,   o 8 ,   l 2 ,   l 6 and l 7 in subset A 1 —the probability of the occurrence of these causes was below 15%. The most common cause in subset A 1 was cause o 1 , which had a 53% probability of occurring.
Subset A 2 had 66 accidents. The dominant causes were those related to: lack of or inadequate means of collective protection, inadequate scaffolding stability, lack of or inadequate safety devices, lack of supervision, admission of a material factor to work without the required inspections and supervision and the fact that supervisors tolerate deviations from occupational health and safety regulations and rules. In the structure of subset A 2 , which consisted of 66 events, a high share of causes o 1 ,   o 2 ,   o 3 and t 2   (probability of the occurrence of causes was above 50%) and a low share of causes l 3 ,   l 4 ,   l 5 ,   l 6 and l 7 (probability of the occurrence of causes was less than 15%) can be noticed.
Set A3 had 35 accidents. The dominant causes were: lack of or inadequate training in occupational health and safety, and allowing an employee to work with medical contraindications or without medical examinations. It should be noted, however, that the causes that most often caused accidents in this group were: lack of supervision, lack of or inadequate safety devices and insufficient professional preparation of an employee. In the structure of subset A3, which consisted of 35 events, a high share of causes t 1 ,   o 4 ,   l 1 ,   l 2 and l o t h e r   (the probability of the occurrence of causes was above 60%) and a low share of causes t 2 ,   t o t h e r ,   l 4 ,   l 5 and l 7 (the probability of the occurrence of causes was less than 15%) can be noticed.

5. Summary

This article proposed a methodology for classifying occupational accidents involving scaffolding based on the knowledge of the causes that led to their occurrence. The causes of accidents can be classified into the following generic groups: technical, organizational and human. Each occupational accident is caused by at least several causes that belong to the above-mentioned generic groups, which occur in a different configuration. Based on the analysis of the causes of the set of accidents in each generic group of causes, the very significant causes that most often lead to an accident were identified. To identify the significance of the causes, Pareto–Lorenz analysis and the ABC classification were proposed.
The obtained set of all the causes was the basis for determining the subsets of accidents caused by similar causes. To define these subsets, the use of cluster analysis was proposed. The hierarchical cluster analysis method, the agglomeration grouping technique and the binding of objects using the Ward method were proposed in order to determine the number of characteristic clusters. The result of the adopted methodology was a dendrogram. Grabiński’s method was proposed to determine the point of cutting off a dendrogram branch. Afterwards, A v events were assigned to individual clusters, i.e., subsets of similar events in terms of the causes that caused them were developed. For this purpose, the k-means grouping method was used.
Based on the calculations, three subsets, which contained similar accidents in terms of their causes, were obtained. The methodology proposed by the authors of this research can be used in both the area of scientific research and in engineering practice. The obtained results of the tests and analyses can be the basis for the classification and comparison of other sets of accidents, which are characteristic for technologies used in the construction industry, construction machines or building facilities under construction. The practical aspect of the proposed methodology is related to the possibility of formulating conclusions that may be important for improving work safety in the construction industry by identifying the causes that most often cause accidents, and then by indicating the appropriate preventive solutions.
In the scientific research conducted by the authors, information on the number of causes in individual sets will be used to estimate the probability of an accident caused by a given cause or a set of causes. The results of these estimates can be used in further research concerning occupational risk assessment in the construction industry.

Author Contributions

Methodology, B.H., T.N., Z.W., M.B.; software, T.N., Z.W.; formal analysis, T.N.; resources, T.N.; writing—review and editing, B.H., T.N., Z.W., M.B.; visualization, T.N., Z.W.; supervision, B.H.; project administration, B.H. All authors have read and agreed to the published version of the manuscript.

Funding

This research was funded by NCBiR within the framework of the Programme for Applied Research, grant number PBS3/A2/19/2015.

Institutional Review Board Statement

Not applicable.

Informed Consent Statement

Not applicable.

Data Availability Statement

No new data were created or analyzed in this study. Data sharing is not applicable to this article.

Acknowledgments

This article is the result of the implementation by the authors of research project No. 244388 “Model of the assessment of risk of the occurrence of building catastrophes, accidents and dangerous events atworkplaces with the use of scaffolding”, financed by NCBiR within the framework of the Programme for Applied Research on the basis of contract No. PBS3/A2/19/2015.

Conflicts of Interest

The authors declare no conflict of interest.

References

  1. International Labour Organization. Safety and Health at Work: A Vision for Sustainable Prevention; International Labour Organization: Frankfurt, Germany, 2014. [Google Scholar]
  2. Hoła, B.; Nowobilski, T.; Szer, I.; Szer, J. Identification of factors affecting the accident rate in the construction industry. Procedia Eng. 2017, 208, 35–42. [Google Scholar] [CrossRef]
  3. Hoła, B.; Nowobilski, T.; Rudy, J.; Czarnocki, K. An analysis of the influence of selected factors on the accident rate in the construction industry. Tech. Trans. 2018, 6, 95–102. [Google Scholar] [CrossRef]
  4. Williams, O.S.; Hamid, R.A.; Misnan, M.S. Accident Causal Factors on the Building Construction Sites: A Review. Int. J. Built Environ. Sustain. 2018, 5, 248. [Google Scholar] [CrossRef]
  5. Goh, K.C.; Goh, H.H.; Omar, M.F.; Toh, T.C.; Zin, A.A.M. Accidents Preventive Practice for High-Rise Construction. MATEC Web Conf. 2016, 47, 4004. [Google Scholar] [CrossRef] [Green Version]
  6. Toole, T.M. Construction Site Safety Roles. J. Constr. Eng. Manag. 2002, 128, 203–210. [Google Scholar] [CrossRef]
  7. Choudhry, R.M.; Fang, D. Why operatives engage in unsafe work behavior: Investigating factors on construction sites. Saf. Sci. 2008, 46, 566–584. [Google Scholar] [CrossRef]
  8. Stępień, T. Identification of factors determining accident rate in construction industry. Czas. Tech. 2014, 111, 265–281. [Google Scholar]
  9. Hoła, A.; Sawicki, M.; Szóstak, M. Methodology of Classifying the Causes of Occupational Accidents Involving Construction Scaffolding Using Pareto-Lorenz Analysis. Appl. Sci. 2018, 8, 48. [Google Scholar] [CrossRef] [Green Version]
  10. Cañamares, M.S.; Escribano, B.M.V.; García, M.N.G.; Barriuso, Á.R.; Sáiz, Á.R. Occupational risk-prevention diagnosis: A study of construction SMEs in Spain. Saf. Sci. 2017, 92, 104–115. [Google Scholar] [CrossRef]
  11. Drozd, W. Badania Cech Terenu Budowy i ich Wpływu na Bezpieczeństwo Prowadzenia Robót Budowlanych Przy Obiektach Nieliniowych; Monografie Politechniki Krakowskiej, Seria Inżynieria Lądowa: Cracow, Poland, 2017. [Google Scholar]
  12. Szóstak, M. Analysis of occupational accidents in the construction industry with regards to selected time parameters. Open Eng. 2019, 9, 312–320. [Google Scholar] [CrossRef] [Green Version]
  13. Dąbrowski, A. Propozycje poprawy bezpieczeństwa pracy w małych firmach budowlanych. Occup. Safety. Sci. Pract. 2016, 507, 9–13. [Google Scholar] [CrossRef]
  14. Musonda, I.; Pretorius, J.-H.; Haupt, T. Investigating the Role of the External Environment to Influence Clients’ Health and Safety (H&S) Performance in the Construction Industry. In Proceedings of the 19th International CIB World Building Congress, Brisbane, Australia, 5–9 May2013. [Google Scholar]
  15. Pietrzak, L. Analiza Wypadków Przy Pracy Dla Potrzeb Prewencji; Państwowa Inspekcja Pracy: Warszawa, Poland, 2007. [Google Scholar]
  16. Hansen, A. Kompleksowa Ocena Poziomu Bezpieczeństwa i Higieny Pracy; Instytut Wydawniczy Związków Zawodowych: Warszawa, Poland, 1988. [Google Scholar]
  17. Hansen, A. Zarys Wypadkoznawstwa; Państwowa Inspekcja Pracy: Warszawa, Poland, 1992. [Google Scholar]
  18. Halperin, K.M.; McCann, M. An evaluation of scaffold safety at construction sites. J. Saf. Res. 2004, 35, 141–150. [Google Scholar] [CrossRef] [PubMed]
  19. Lin, Y.-H.; Chen, C.-Y. Statistical analysis of fatal occupational falls in the Taiwan construction industry from 1996–2007. In Proceedings of the 40th International Conference on Computers & Indutrial Engineering, Awaji, Japan, 25–28 July 2010; pp. 1–4. [Google Scholar]
  20. Lin, Y.-H.; Chen, C.-Y.; Wang, T.-W. Fatal occupational falls in the Taiwan construction industry. J. Chin. Inst. Ind. Eng. 2011, 28, 586–596. [Google Scholar] [CrossRef]
  21. Państwowa Inspekcja Pracy. Sprawozdanie z Działalności Państwowej Inspekcji Pracy w 2018 Roku; Państwowa Inspekcja Pracy: Warszawa, Poland, 2019. [Google Scholar]
  22. Państwowa Inspekcja Pracy. Sprawozdanie z Działalności Państwowej Inspekcji Pracy w 2019 Roku; Państwowa Inspekcja Pracy: Warszawa, Poland, 2020. [Google Scholar]
  23. Liy, C.; Ibrahim, S.; Affandi, R.; Rosli, N.; Nawi, M. Causes of fall hazards in construction site management. Int. Rev. Manag. Mark. 2016, 6, 257–263. [Google Scholar]
  24. Whitaker, S.M.; Graves, R.J.; James, M.; McCann, P. Safety with access scaffolds: Development of a prototype decision aid based on accident analysis. J. Saf. Res. 2003, 34, 249–261. [Google Scholar] [CrossRef]
  25. Suraji, A.; Duff, A.; Peckitt, S. Development of casual model of construction accident causation. J. Constr. Eng. Manag. 2001, 12, 337–344. [Google Scholar] [CrossRef]
  26. Chi, S.; Han, S. Analyses of systems theory for construction accident prevention with specific reference to OSHA accident reports. Int. J. Proj. Manag. 2013, 31, 1027–1041. [Google Scholar] [CrossRef] [Green Version]
  27. Evanoff, B.; Dale, A.M.; Zeringue, A.; Fuchs, M.; Gaal, J.; Lipscomb, H.J.; Kaskutas, V. Results of a fall prevention educational intervention for residential construction. Saf. Sci. 2016, 89, 301–307. [Google Scholar] [CrossRef] [Green Version]
  28. Wong, L.; Wang, Y.; Law, T.; Lo, C.T. Association of Root Causes in Fatal Fall-from-Height Construction Accidents in Hong Kong. J. Constr. Eng. Manag. 2016, 142, 04016018. [Google Scholar] [CrossRef]
  29. Gibb, A.; Hide, S.; Haslam, R.; Hastings, S.; Suraji, A.; Duff, A.R.; Abdelhamid, T.S.; Everett, J.G. Identifying Root Causes of Construction Projects. J. Constr. Eng. Manag. 2001, 127, 348–349. [Google Scholar] [CrossRef] [Green Version]
  30. Gibb, A.G.F.; Haslam, R.; Gyi, D.E.; Hide, S.; Duff, R. What causes accidents? Proc. ICE Civ. Eng. 2006, 159, 46–50. [Google Scholar] [CrossRef]
  31. Błazik-Borowa, E.; Szer, J. The analysis of the stages of scaffolding “life” with regard to the decrease in the hazard at building works. Arch. Civ. Mech. Eng. 2015, 15, 516–524. [Google Scholar] [CrossRef]
  32. Błazik-Borowa, E.; Gontarz, J. The influence of the dimension and the configuration of the geometric imperfections on the static strength of a typical façade scaffolding. Arch. Civ. Mech. Eng. 2016, 16, 269–281. [Google Scholar] [CrossRef]
  33. Chu, C.-W.; Liang, G.-S.; Liao, C.-T. Controlling inventory by combining ABC analysis and fuzzy classification. Comput. Ind. Eng. 2008, 55, 841–851. [Google Scholar] [CrossRef]
  34. Dhoka, D.; Choudary, D.Y.L. ABC Classification for Inventory Optimization. IOSR J. Bus. Manag. 2013, 15, 38–41. [Google Scholar] [CrossRef]
  35. Stanisz, A. An Easy Course of Statistics with the Use of STATISTICA PL Using Examples from Medicine, Volume 3: Linear and Nonlinear Models; Cracow: Statsoft, Poland, 2007. [Google Scholar]
  36. Wierzchoń, S.; Kłopotek, M. Cluster Analysis Algorithms; WNT Publisher: Warsaw, Poland, 2015. [Google Scholar]
  37. Leśniak, A.; Juszczyk, M.; Piskorz, G. Delays factors of a completion construction project aggregation with the use of cluster analysis. Mater. Bud. 2018, 10, 62–65. [Google Scholar]
  38. Hoła, B.; Nowobilski, T. Classification of Economic Regions with Regards to Selected Factors Characterizing the Construction Industry. Sustainability 2018, 10, 1637. [Google Scholar] [CrossRef] [Green Version]
  39. Hoła, B.; Nowobilski, T. Classification of Polish voivodeships with regards to the selected indicators that characterize the construction industry. Sci. Rev. Eng. Environ. Sci. 2018, 27, 310–318. [Google Scholar]
  40. Ward, J.H. Hierarchical Grouping to Optimize an Objective Function. J. Am. Stat. Assoc. 1963, 58, 236. [Google Scholar] [CrossRef]
  41. Grabiński, T. Metody Taksonometrii; Akademia Ekonomiczna w Krakowie: Kraków, Poland, 1992. [Google Scholar]
  42. Mojena, R. Hierarchical grouping methods and stopping rulet: An evaluation. Comput. J. 1977, 20, 359–363. [Google Scholar] [CrossRef] [Green Version]
Figure 1. Research methodology diagram.
Applsci 12 05514 g001
Figure 2. Pareto-Lorenz chart of the identified technical causes.
Applsci 12 05514 g002
Figure 3. Pareto-Lorenz chart of the identified organizational causes.
Applsci 12 05514 g003
Figure 4. Pareto-Lorenz chart of the identified human causes.
Applsci 12 05514 g004
Figure 5. Dendrogram—a graph showing the clustering of individual A accident events in the subsequent calculation steps (cut-off place—Mojen’s rule [42]).
Applsci 12 05514 g005
Figure 6. Share of technical, organizational and human causes in the subsets of accident events Ak (k = 1, 2, 3).
Applsci 12 05514 g006
Table 1. Table of notations used in this paper.
NotationDefinition
TOLMethodology of accident case classification
TTechnical causes
OOrganizational causes
LHuman causes
A V A set of analyzed accidents
ABCClassification of causes in terms of materiality
AThe set of very significant causes
BThe set of significant causes
CThe set of insignificant causes
Table 2. Analyzed detailed technical t γ   causes.
Type   of   Technical   Cause   T
T   =   { t γ : γ   =   1 ,   ,   14 }
Cardinality of
Occurrence
Share
[%]
Cumulative
Share [%]
Validity Class
of Cause
t 1 Lack of or inadequate protective devices8726%26%A
t 2 Lack of or inadequate measures of collective protection7021%47%A
t 3 Improper spatial structure of scaffoldings 6720%67%A
t 4 Improper stability of scaffoldings5617%83%A
t 5 Design defects of scaffoldings that are a source of hazards124%87%B
t 6 Use of substitute materials113%90%B
t 7 Lack of or incorrect signaling of hazards93%93%B
t 8 Insufficient strength of scaffolding components62%95%B
t 9 Failure to meet required technical parameters62%96%C
t 10 Hidden material defects41%98%C
t 11 Excessive use of scaffoldings31%99%C
t 12 Inadequate maintenance of scaffoldings31%99%C
t 13 Excessive use of scaffoldings 10%100%C
t 14 Improper repairs and renovations of scaffoldings 10%100%C
Table 3. Analyzed detailed organizational causes o δ .
Type   of   Organizational   Causes   O
O   =   { o δ : δ   =   1 ,   ,   20 }
Cardinality of
Occurrence
Share
[%]
Cumulative
Share [%]
Validity Class
of Cause
o 1 Lack of supervision11018%18%A
o 2 Admission of scaffoldings to operation without the required inspection and supervision8313%31%A
o 3 Lack of or inadequate training in the area of occupational health and safety7212%43%A
o 4 Acceptance of deviations from the rules and regulations of occupational health and safety6410%53%A
o 5 Inadequate professional training of an employee559%62%A
o 6 Lack of instructions on how to use scaffoldings safely488%69%A
o 7 Admission of an employee to work without medical examination or with medical contraindications467%77%A
o 8 Inadequate passages and access points437%84%B
o 9 Lack of personal protective equipment254%88%B
o 10 Acceptance of the use of improper technology by supervisors152%90%B
o 11 Incorrect job sharing or task scheduling142%92%B
o 12 Improper placement and storage of work tools112%94%B
o 13 Incorrect location of equipment at a workstation71%95%B
o 14 Improper selection of personal protective equipment71%96%C
o 15 Incorrect coordination of collective work61%97%C
o 16 Incorrect commands of superiors51%98%C
o 17 Not removing unnecessary tools, substances or energy, e.g., waste51%99%C
o 18 Performing work when short-staffed30%100%C
o 19 Performing work on command that is not included in the scope of an employee’s duties20%100%C
o 20 Performing work despite having the wrong tools and materials10%100%C
Table 4. Analyzed detailed human lτ causes.
Type   of   Human   Cause   L
L   =   { l τ : τ   =   1 ,   ,   26 }
Cardinality of
Occurrence
Share
[%]
Cumulative
Share [%]
Validity Class
of Cause
l 1 Failure to use personal protective equipment by an employee7420%20%A
l 2 Disregarding danger4913%34%A
l 3 Being surprised by an unexpected event3911%45%A
l 4 Consumption of alcohol, drugs or psychotropic substances3610%54%A
l 5 Insufficient concentration339%63%A
l 6 Going to, driving through or staying in places that are forbidden308%72%A
l 7 Performing work that is not included in the scope of an employee’s duties205%77%A
l 8 Ignorance of hazards123%80%A
l 9 Ignorance of regulations and rules of occupational health and safety113%84%B
l 10 Using equipment that is not appropriate for the work103%86%B
l 11 Improper securing of a device (e.g., brake not applied when parked)82%88%B
l 12 Sudden illness, physical deterioration, fatigue62%90%B
l 13 Improper grasping or holding of materials or tools 51%91%B
l 14 Carrying out activities without removing the hazard (e.g., machine shutdown, power off)51%93%B
l 15 Failure to use collective protection measures41%94%B
l 16 Disregarding superiors’ commands41%95%B
l 17 Improper pace of work41%96%C
l 18 Using a device while people are in the danger zone21%97%C
l 19 Using a device contrary to its intended purpose21%97%C
l 20 Lack of using safety devices by employees21%98%C
l 21 Entering an endangered area without making sure that there is no danger21%98%C
l 22 Lack of experience21%99%C
l 23 Performing work by hand instead of using devices10%99%C
l 24 Defective installation, fastening, suspension of devices by an employee10%99%C
l 25 Improper handling of the limbs in the danger zone10%100%C
l 26 Fatigue10%100%C
Table 5. Characteristics of the obtained clusters—the share of a given cause in the group of accident events.
CausesCluster
A 1 A 2 A 3
Technical   T t 1 0.400.240.74
t 2 0.260.590.06
t 3 0.300.470.20
t 4 0.260.290.23
t o t h e r 0.200.270.09
Organizational   O o 1 0.530.560.40
o 2 0.220.760.23
o 3 0.100.740.34
o 4 0.140.290.83
o 5 0.170.380.31
o 6 0.210.290.17
o 7 0.070.470.20
o 8 0.130.210.43
o o t h e r 0.270.480.40
Human   L l 1 0.300.290.60
l 2 0.100.200.71
l 3 0.170.150.29
l 4 0.240.110.06
l 5 0.210.110.06
l 6 0.070.090.46
l 7 0.130.030.11
l o t h e r 0.230.330.60
Publisher’s Note: MDPI stays neutral with regard to jurisdictional claims in published maps and institutional affiliations.

