1. Introduction
An automotive wheel bearing is a component that connects the drive shaft and wheel, supports the load applied to the shaft, and transmits power to the wheel. The wheel bearings are classified into ball and taper roller types based on the rolling element. The ball type is used when the vehicle weight is low, and the taper roller type is used when the vehicle weight is high. Wheel bearings have been gradually developed into compact units owing to the increasing demand for energy savings and convenience. According to the structural changes of the wheel bearing, it can be classified into first, second, and third generations. Third-generation wheel bearings have been commonly used to improve weight reduction, assembly, and durability by reducing the number of parts [
1].
The rolling bearing necessarily fails owing to rolling contact fatigue between the ball and inner/outer ring raceway. Given that bearings that can be used for a long time without damage are required in the industrial field, their service life has been considered as the most important performance indicator among all the performance indicators of bearings. To standardize the bearing life, the ISO, the international standardization organization, proposed a method for calculating the basic rating life of rolling bearings [
2]. Additionally, many researchers proposed models for understanding the physical mechanism of rolling contact fatigue and predicting the fatigue life of rolling bearing [
3,
4,
5]. Some researchers investigated the effects of other factors such as the crown profile of a roller, the radial internal clearance of a ball bearing, and cage motion of a ball bearing on vibration level and the bearing life [
6,
7,
8].
Furthermore, wheel bearings are a type of rolling bearing, and studies have been conducted to predict and improve the life of wheel bearings [
9,
10,
11,
12,
13,
14]. Raju et al. [
9] expressed the relationship between contact stress and life in a wheel bearing using a formula based on finite element analysis. Zhang et al. [
10] calculated the internal stress distribution of a wheel bearing using simulations and predicted the failure that can occur in wheel bearings by analyzing the results. Zhao et al. [
11] proposed a life prediction method for multi-axis wheel loads to predict the wheel bearing life under realistic load conditions. Conversely, Rizzo and Pagliassotto [
12] and Lee et al. [
13] improved the fatigue life of wheel bearings by developing the material of the rolling element and outer ring, respectively. Furthermore, Min [
14] suggested guidelines for design, testing, quality, and production to improve the durability of wheel bearings by investigating the various causes of failure.
Rolling bearings, including wheel bearings, lead to various defects in the raceway surface during operation. These defects significantly affect bearing life; therefore, studies are being conducted on identifying bearing defects. Defect diagnosis of a rolling bearing is usually analyzed based on the vibration and noise signals generated when the bearing rotates. Given that the defect diagnosis analyzes the changes in the small noise/vibration due to a slight defect on the bearing surface, the accuracy of the defect diagnosis varies based on the signal processing method. Therefore, various signal processing methods have been proposed to detect and identify defects in rolling bearings [
15,
16,
17,
18]. Rubio and Jauregui [
19] explained the suitability and limitations of each method by applying and comparing various signal-processing methods to the defect diagnosis of wheel bearings. Huang et al. [
20] proposed a method for diagnosing wheel-bearing defects via road-surface acoustic detection. A study was also performed to predict the remaining useful life of the wheel bearing based on the fault signals [
21].
Recently, a noise problem occurred in a wheel bearing applied to an electric vehicle while it was being driven. As electric vehicles are relatively quieter than internal combustion vehicles, new noise issues that have not been a problem in existing internal combustion vehicles are emerging. Specifically, wheel-bearing noise is a new issue. Many cases of wheel-bearing noise are due to surface defects of the balls, inner ring, and outer ring. However, the noise-generating wheel bearings used in this study do not exhibit surface defects. Therefore, it is necessary to investigate the cause and mechanism of the wheel bearing noise, which is a new problem.
The purpose of this study involves identifying the noise generated by automotive wheel bearings. In this study, we analyzed an assembled wheel bearing in which the wheel bearing, knuckle, and dust shield are bolted together. First, the noise and vibration, which are generated when the assembled wheel bearing rotates, were experimentally measured, and the time responses and frequency spectra for these signals were analyzed. Subsequently, modal testing was performed to investigate the relationship between the noise of the assembled wheel bearing and vibration generated from the main component. Next, the defect frequencies of the wheel bearing were examined to determine the excitation source that caused the noise and vibration of the wheel bearing. Finally, the defect mechanism inside the wheel bearing was investigated using simulations.
2. Noise and Vibration of Assembled Wheel Bearing
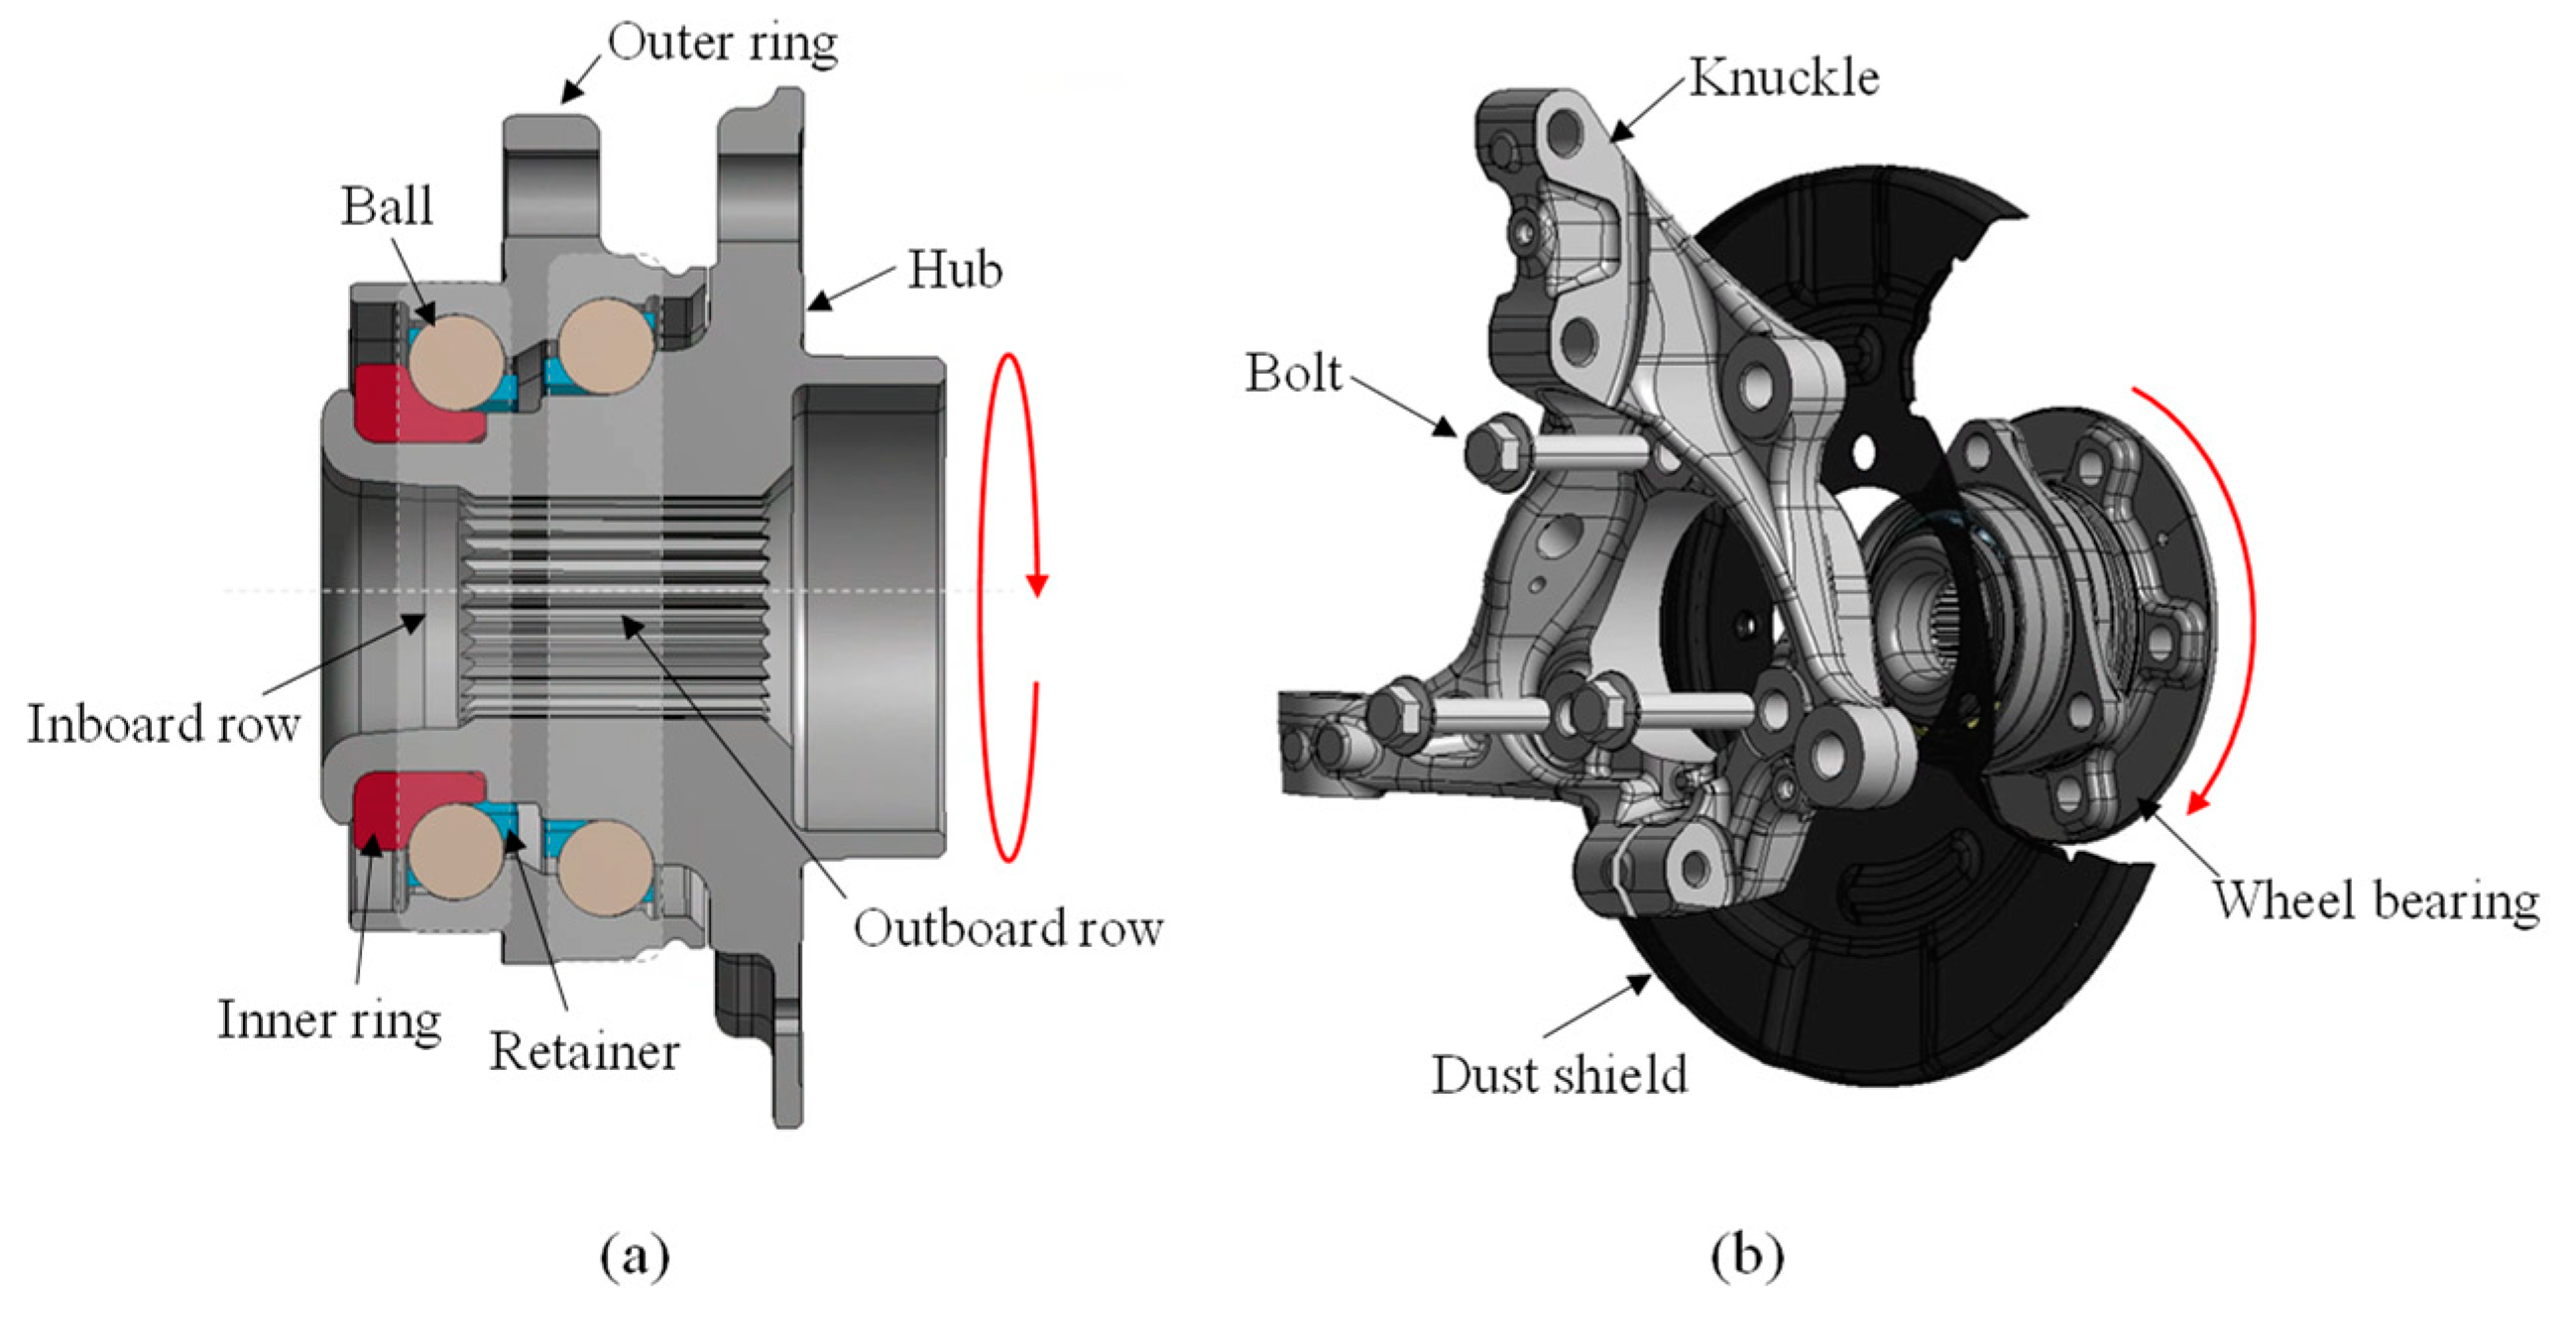
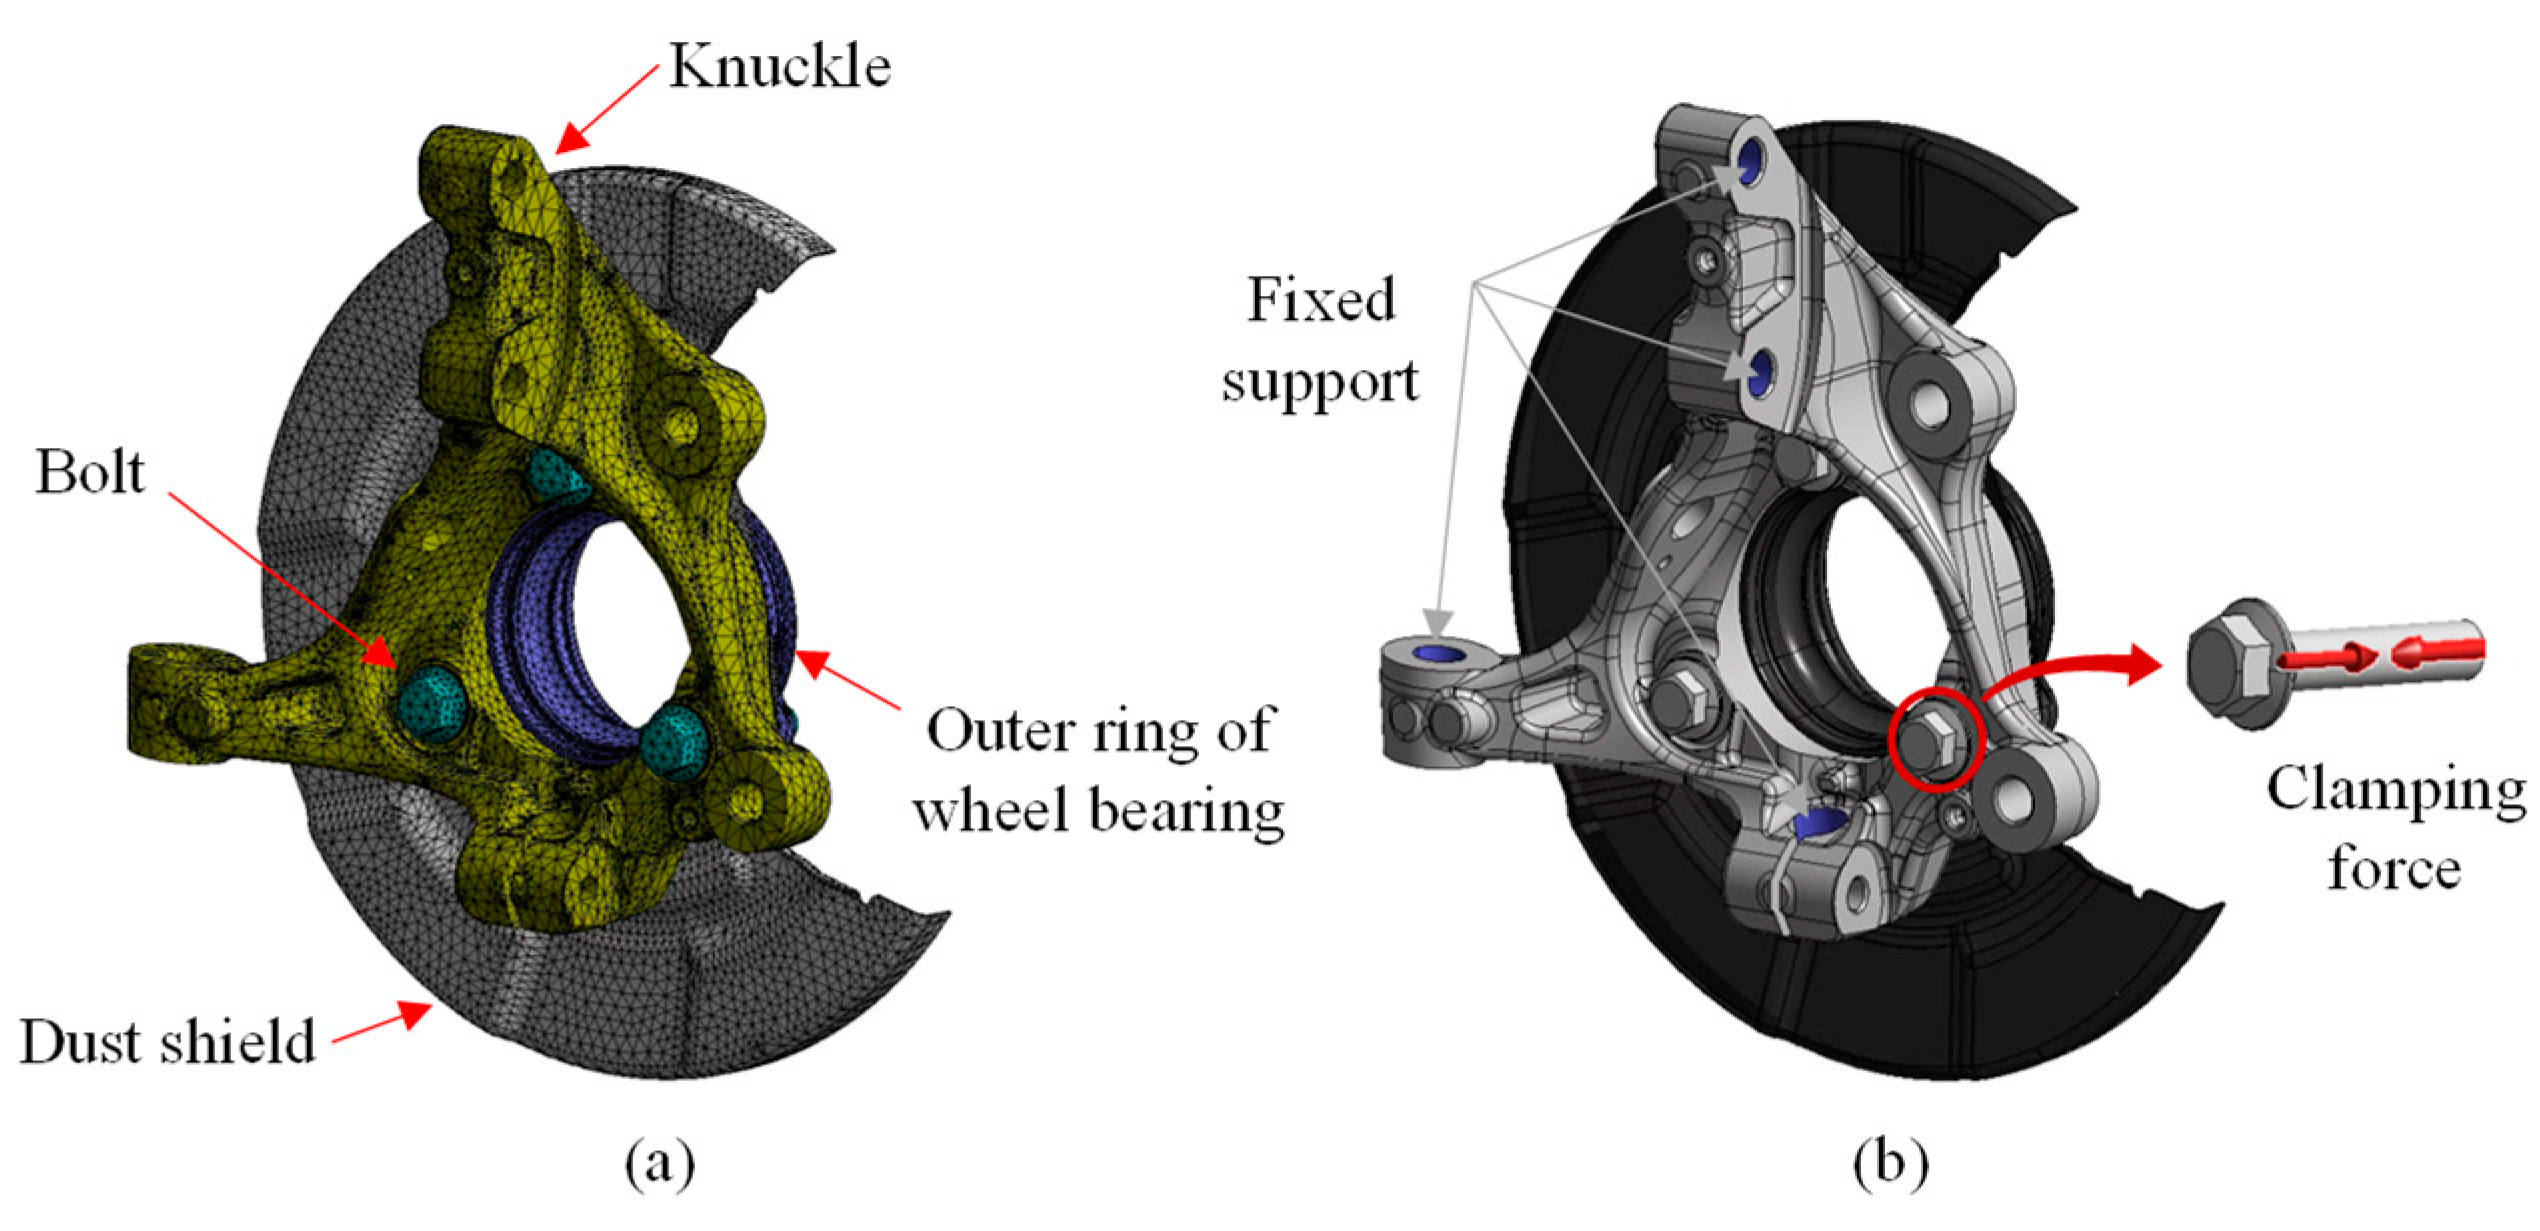
In this study, the wheel bearing is a third-generation double-row angular contact ball bearing composed of a hub, inner ring, outer ring, retainer, and balls, as shown in
Figure 1a. This third-generation wheel bearing has structural features wherein the hub and inner ring are integrated and the outer ring has a flange. Additionally, the double rows of balls can be divided into an inboard row close to the vehicle body and an outboard row close to the wheel. The bearing specifications of the wheel bearings used in this study are summarized in
Table 1, where
N denotes the number of balls,
Bd denotes the ball diameter,
Pd denotes the pitch diameter, and
θ denotes the contact angle.
To mount the wheel bearing on the vehicle, the wheel bearing and dust shield are bolted to the knuckle connected to the vehicle body, as shown in
Figure 1b. Hence, the dust shield prevents brake dust from accumulating in various components, including wheel bearings. The wheel bearing in the vehicle rotates when the outer ring is fixed by the knuckle, and the hub and inner ring rotate together with the drive shaft. Noise is generated when the wheel bearing is mounted on the vehicle and rotated. Thus, we analyzed the noise and vibration of the assembled wheel bearing, which included the knuckle and dust shield.
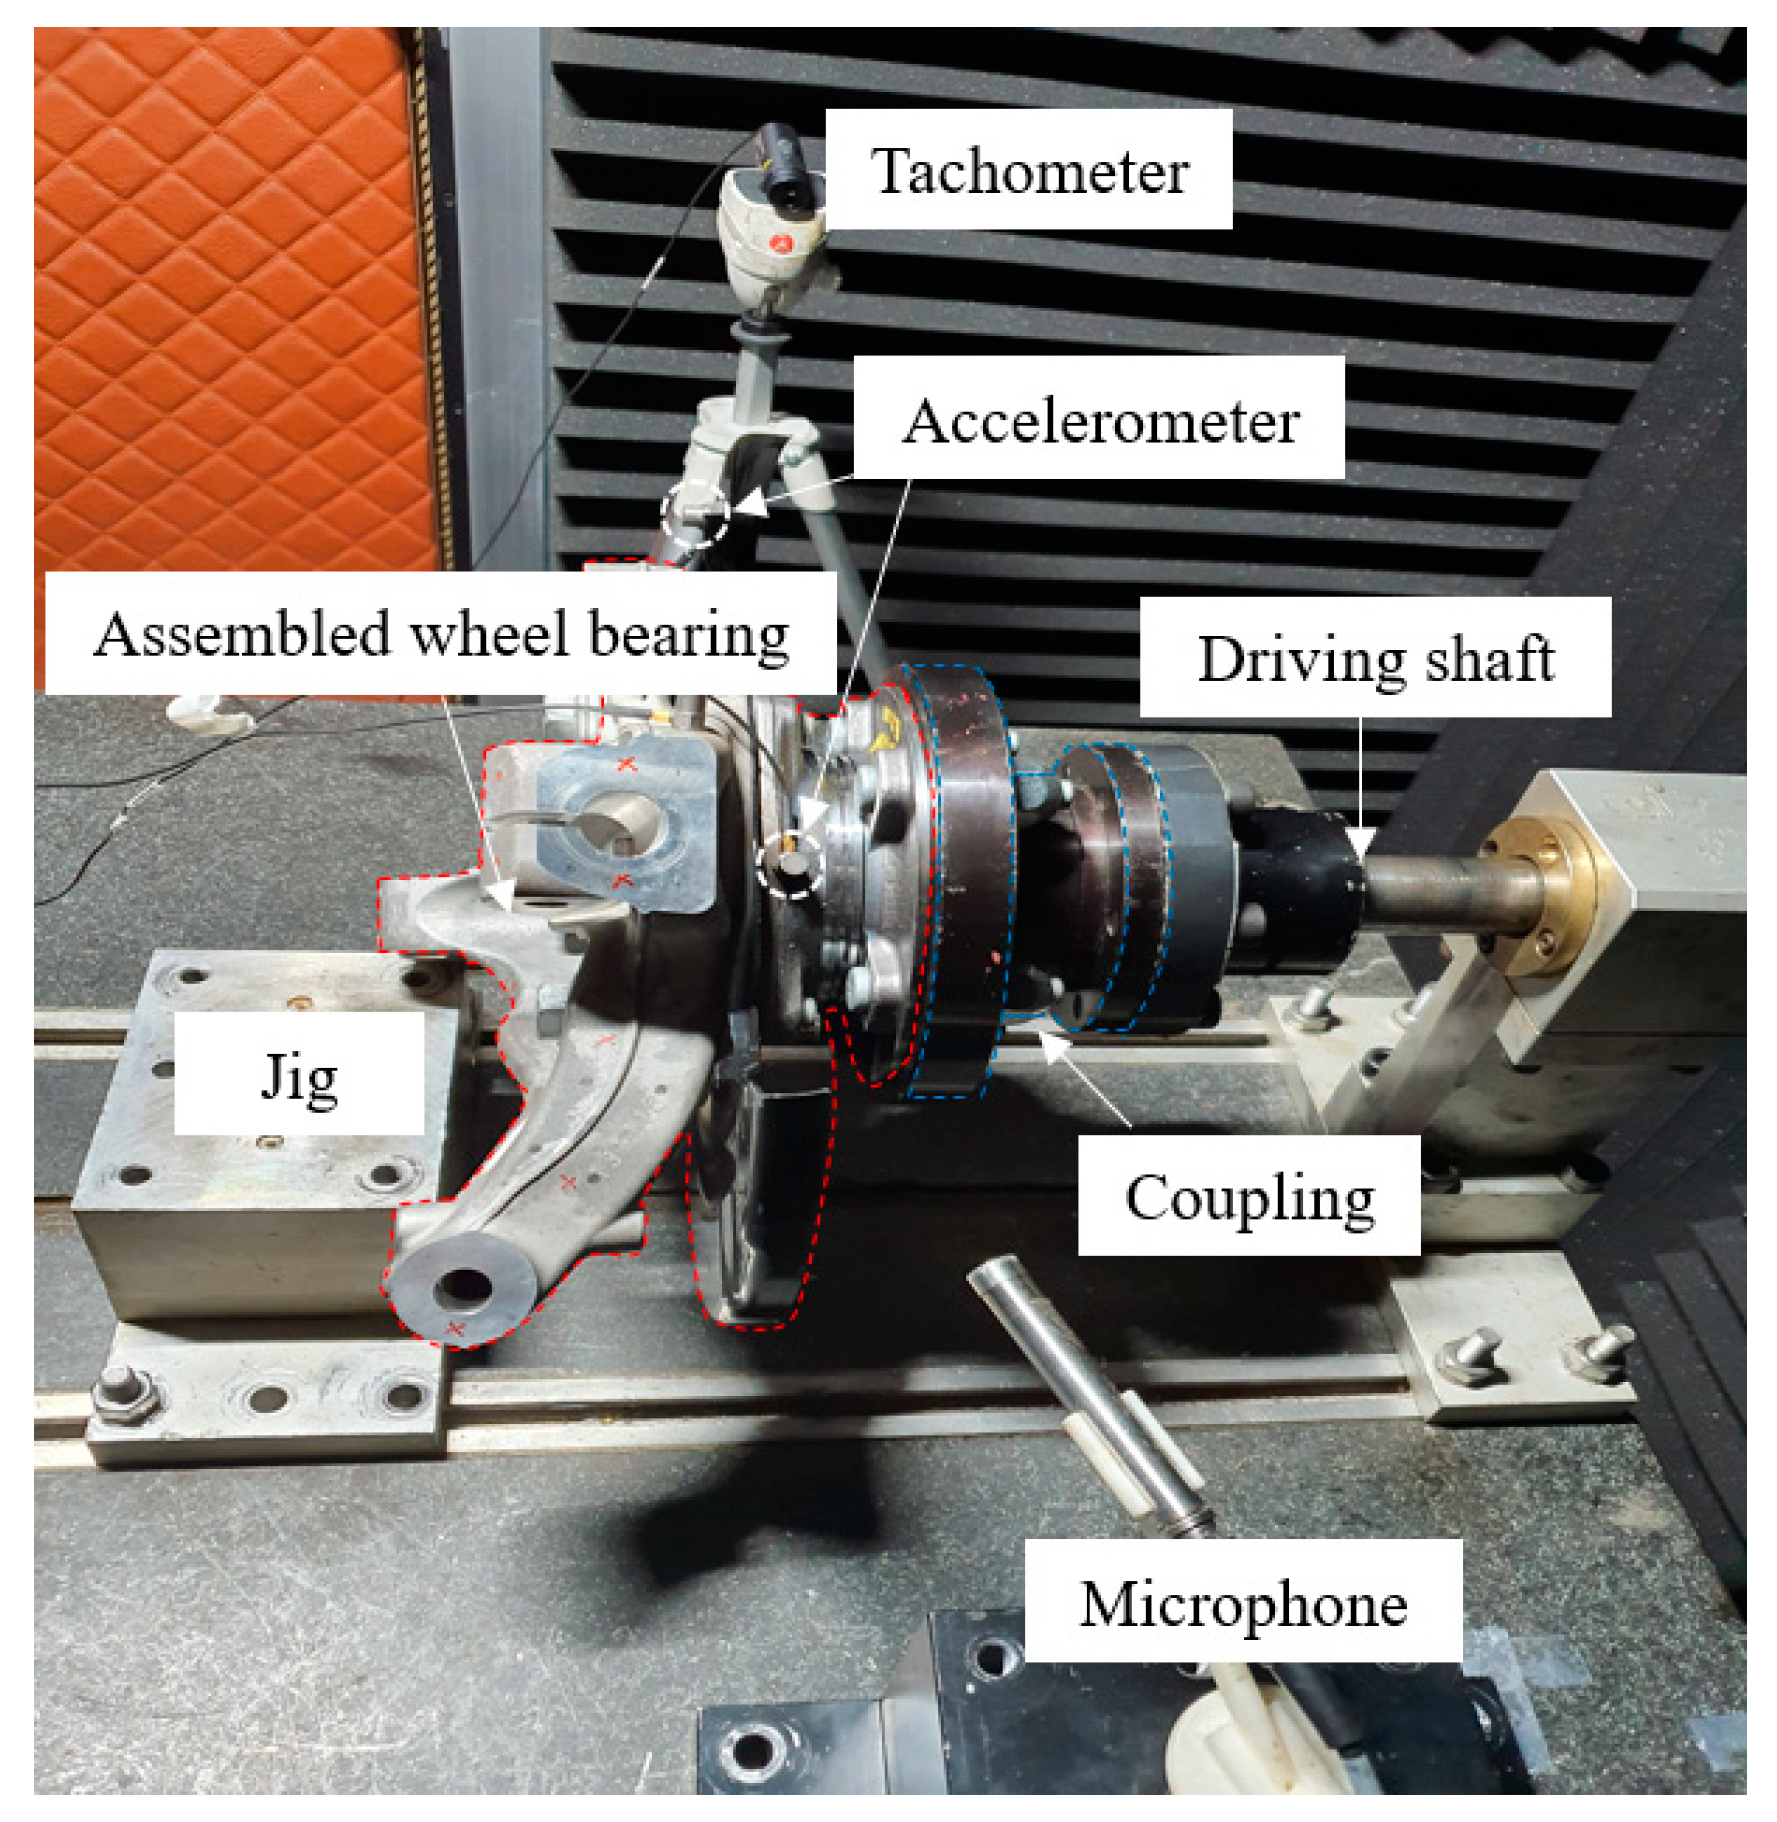
The noise and vibration of the assembled wheel bearings were measured and analyzed experimentally. As shown in
Figure 2, the experimental setup for noise/vibration measurement is constructed inside a semi-anechoic room. A motor for rotating the driving shaft was installed outside the semi-anechoic room to minimize the noise generated by the test equipment. The maximum rotation speed of the motor is 2000 rpm. The hub flange of the wheel bearing was bolted to a coupling connected to the driving shaft to fix the assembled wheel bearing to the test device. Then, the knuckle was placed against the edge of the jig to restrict the rotation. In a manner similar to the wheel bearing mounted on the vehicle, the outer ring is fixed by a knuckle whose rotation is restricted, and the hub and inner ring rotate with the driving shaft. The rotational speed of the wheel bearing was confirmed by measuring the rotational speed of the coupling, which rotates with the wheel bearing, via a tachometer (B&K MM-0360). The noise signal was measured by installing a microphone (PCB 378B02) 0.1 m away from the outer ring flange of the wheel bearing, and the vibration signals were measured using the accelerometers (B&K 4383) attached to the dust shield and outer ring. Meanwhile, given that the knuckle is relatively heavy and thick, it only has slight relevance to noise generation; therefore, it was excluded from the vibration measurements. The measured noise and vibration signals were analyzed using a spectrum analyzer (B&K 3050-B-060).
First, the characteristics of the noise and vibration generated on the assembled wheel bearing were investigated. The time responses for the noise and vibration, when the assembled wheel bearing rotates at a constant speed of 200 rpm, are shown in
Figure 3. Furthermore,
Figure 3a shows the time response for noise while an A-weighting filter is applied.
Figure 3b,c show the time responses of the vibration of the dust shield and outer ring, respectively. In
Figure 3a, the root–mean–square value for the noise response is 9.34 mPa(A) on a linear scale and 53.4 dB(A) on a logarithmic scale. In
Figure 3b,c, the root–mean–square values for the vibration responses are 0.76 m/s
2 and 0.19 m/s
2, respectively. The vibration of the dust shield was approximately four times higher than that of the outer ring.
Conversely, periodic peaks with an interval of 0.31 s were observed in the noise and vibration responses of
Figure 3a–c. The periodic oscillation was converted to a frequency of 3.23 Hz. This frequency is similar to the rotational frequency (3.33 Hz, 1
X) of a system rotating at 200 rpm. It is well known that 1
X in a rotating system is due to the eccentricity between the rotation axis and center of gravity of the system. Thus, it can be stated that the periodic vibration of 3.23 Hz in
Figure 3a–c corresponds to the rotational frequency of 1
X, which is due to the eccentricity between the rotation axis of driving shaft and center of gravity of assembled wheel bearing. However, 1
X was not considered in further analysis because it does not affect bearing defects or structural problems. Moreover, in
Figure 3c, periodic peaks at 0.044 s are observed in addition to the periodic peaks at 0.31 s.
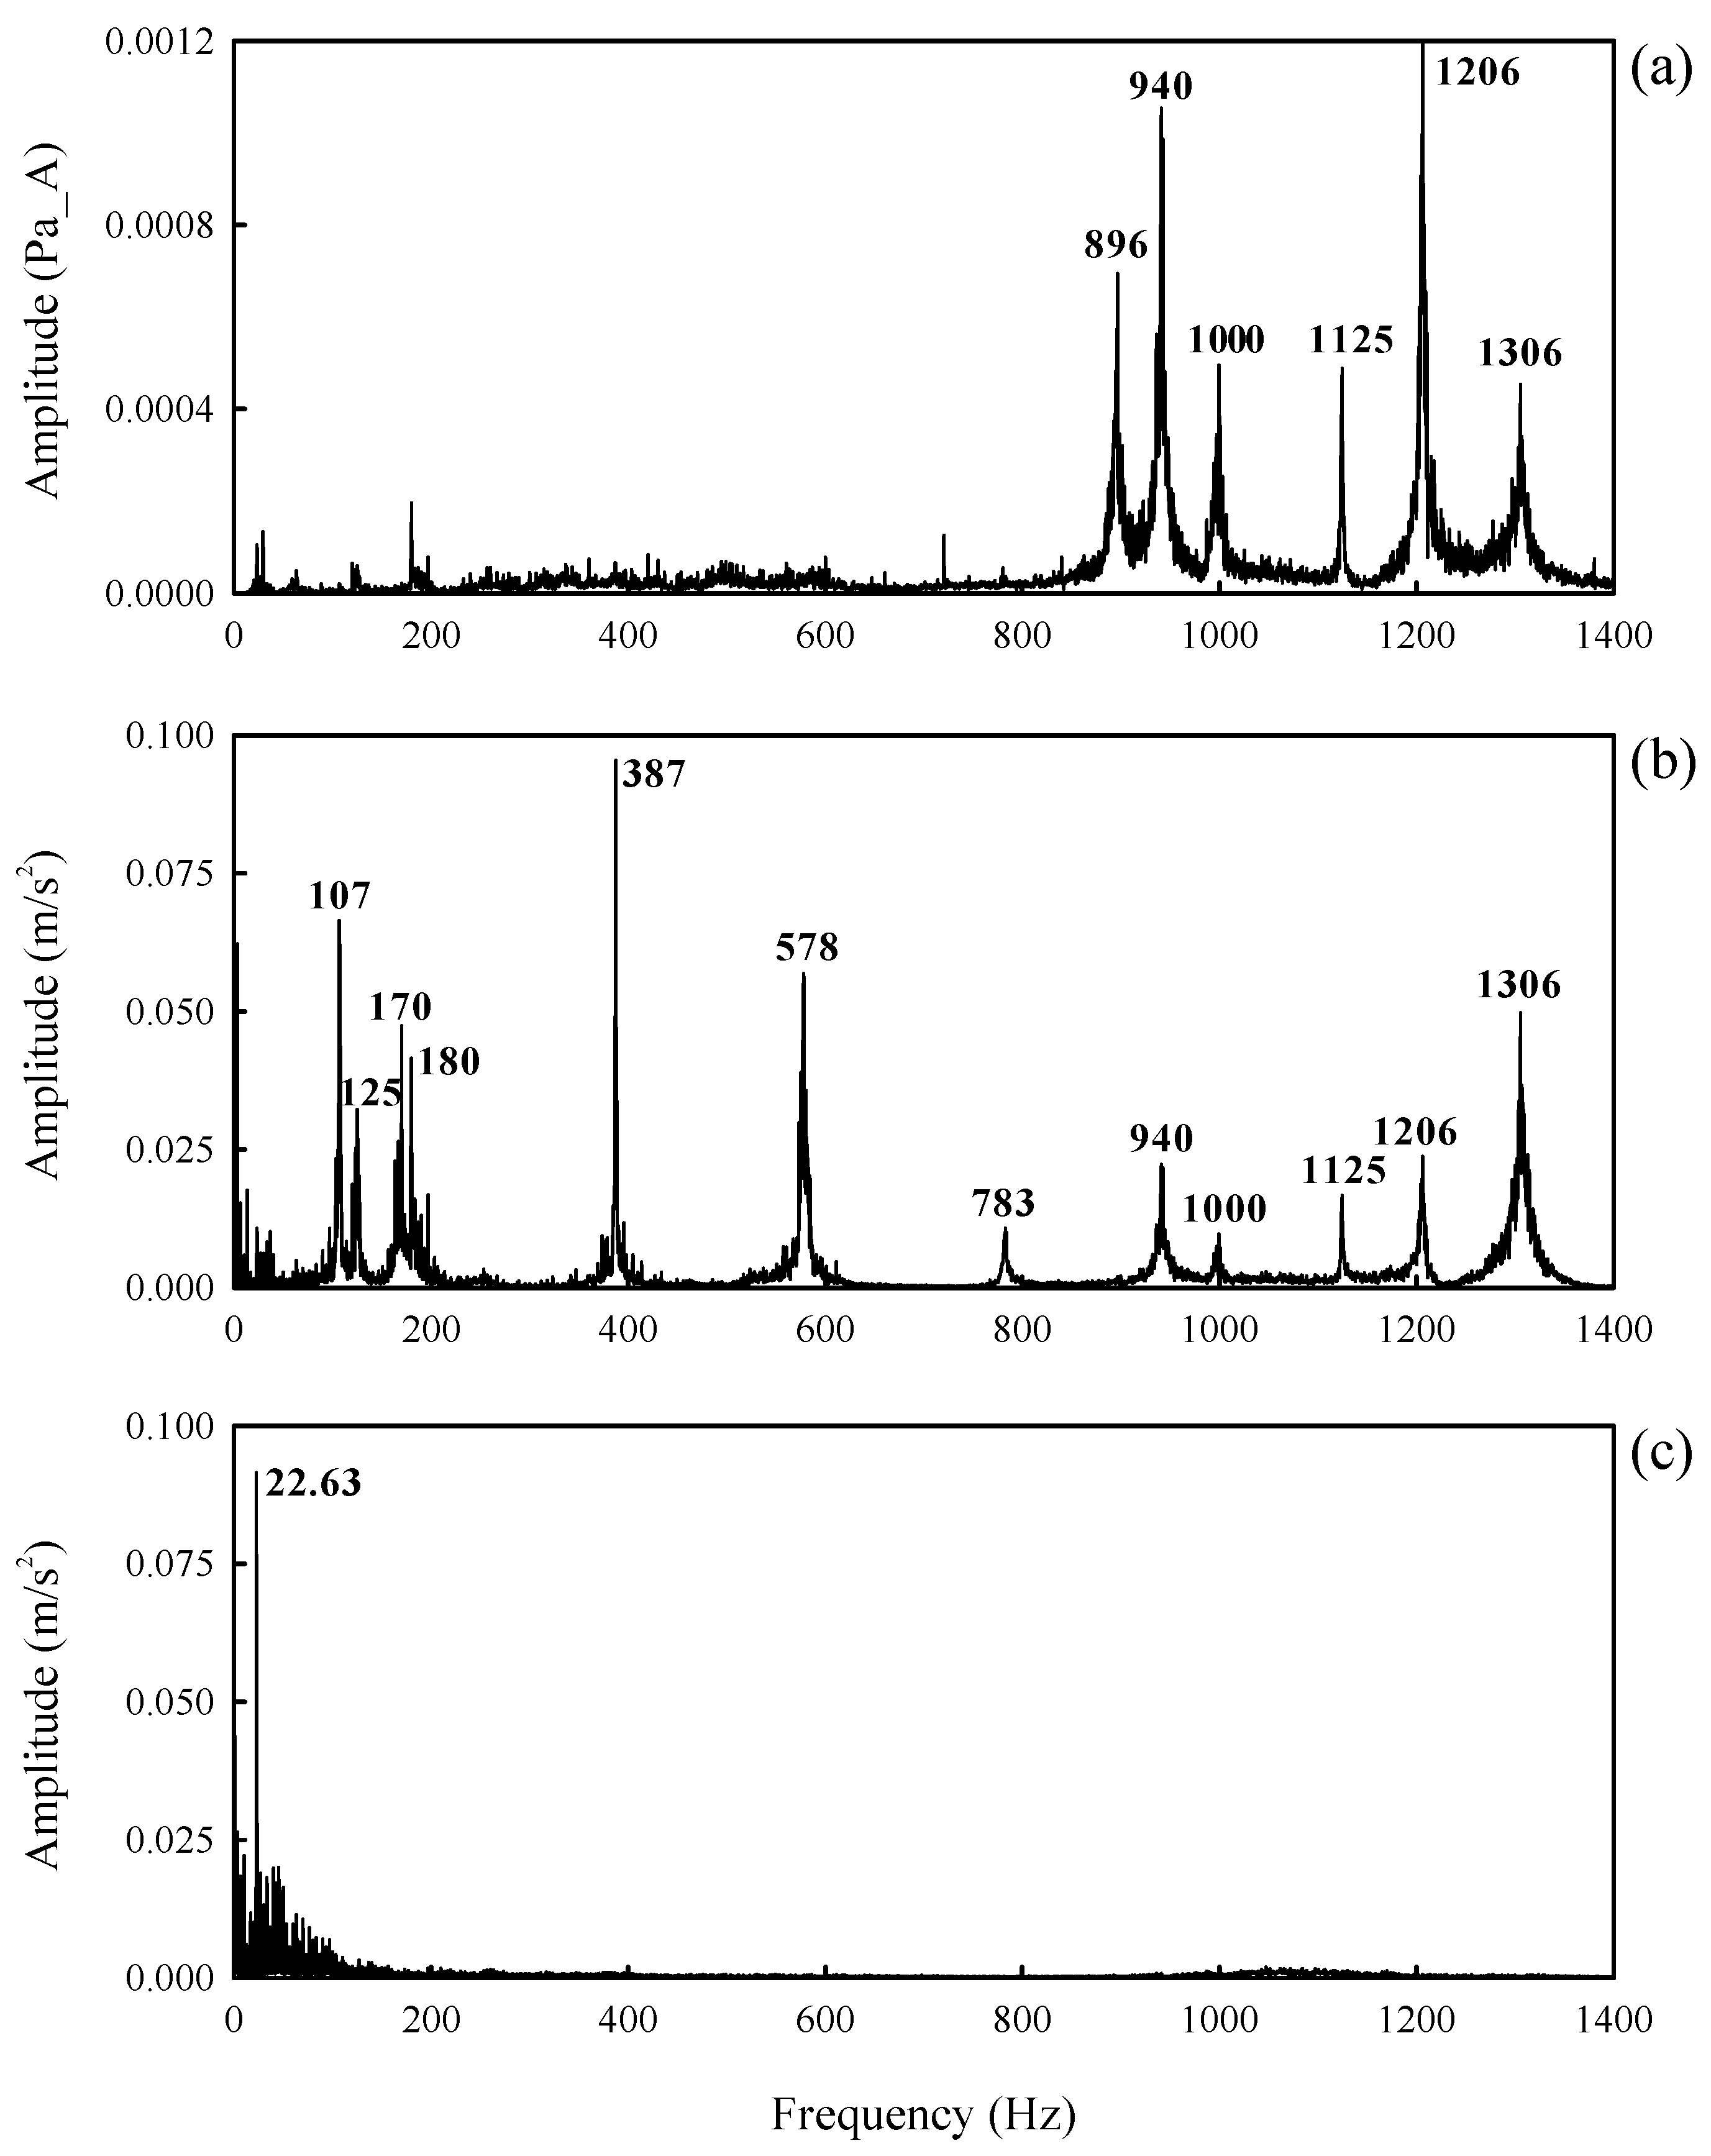
Frequency spectra are obtained by applying a Fourier transform (FFT) to the time responses shown in
Figure 3, and the results are illustrated in
Figure 4. As shown in
Figure 4a, the peak frequencies for the noise were predominantly observed at 896, 940, 1000, 1125, 1206, and 1306 Hz. This implies the noise of the assembled wheel bearing exhibits a high-frequency range of approximately 800–1300 Hz. In
Figure 4b, the peak frequencies for the vibration of the dust shield are observed at several frequencies, including at 940 Hz, 1000 Hz, 1125 Hz, 1206 Hz, and 1306 Hz, which coincide with the peak noise frequencies. Conversely, in
Figure 4c, the peak frequencies for the vibration of the outer ring were observed at low frequencies below 100 Hz. Specifically, it was significantly observed at 22.63 Hz. This peak frequency corresponds to periodic oscillation with an interval of 0.044 s in the time response shown in
Figure 3c.
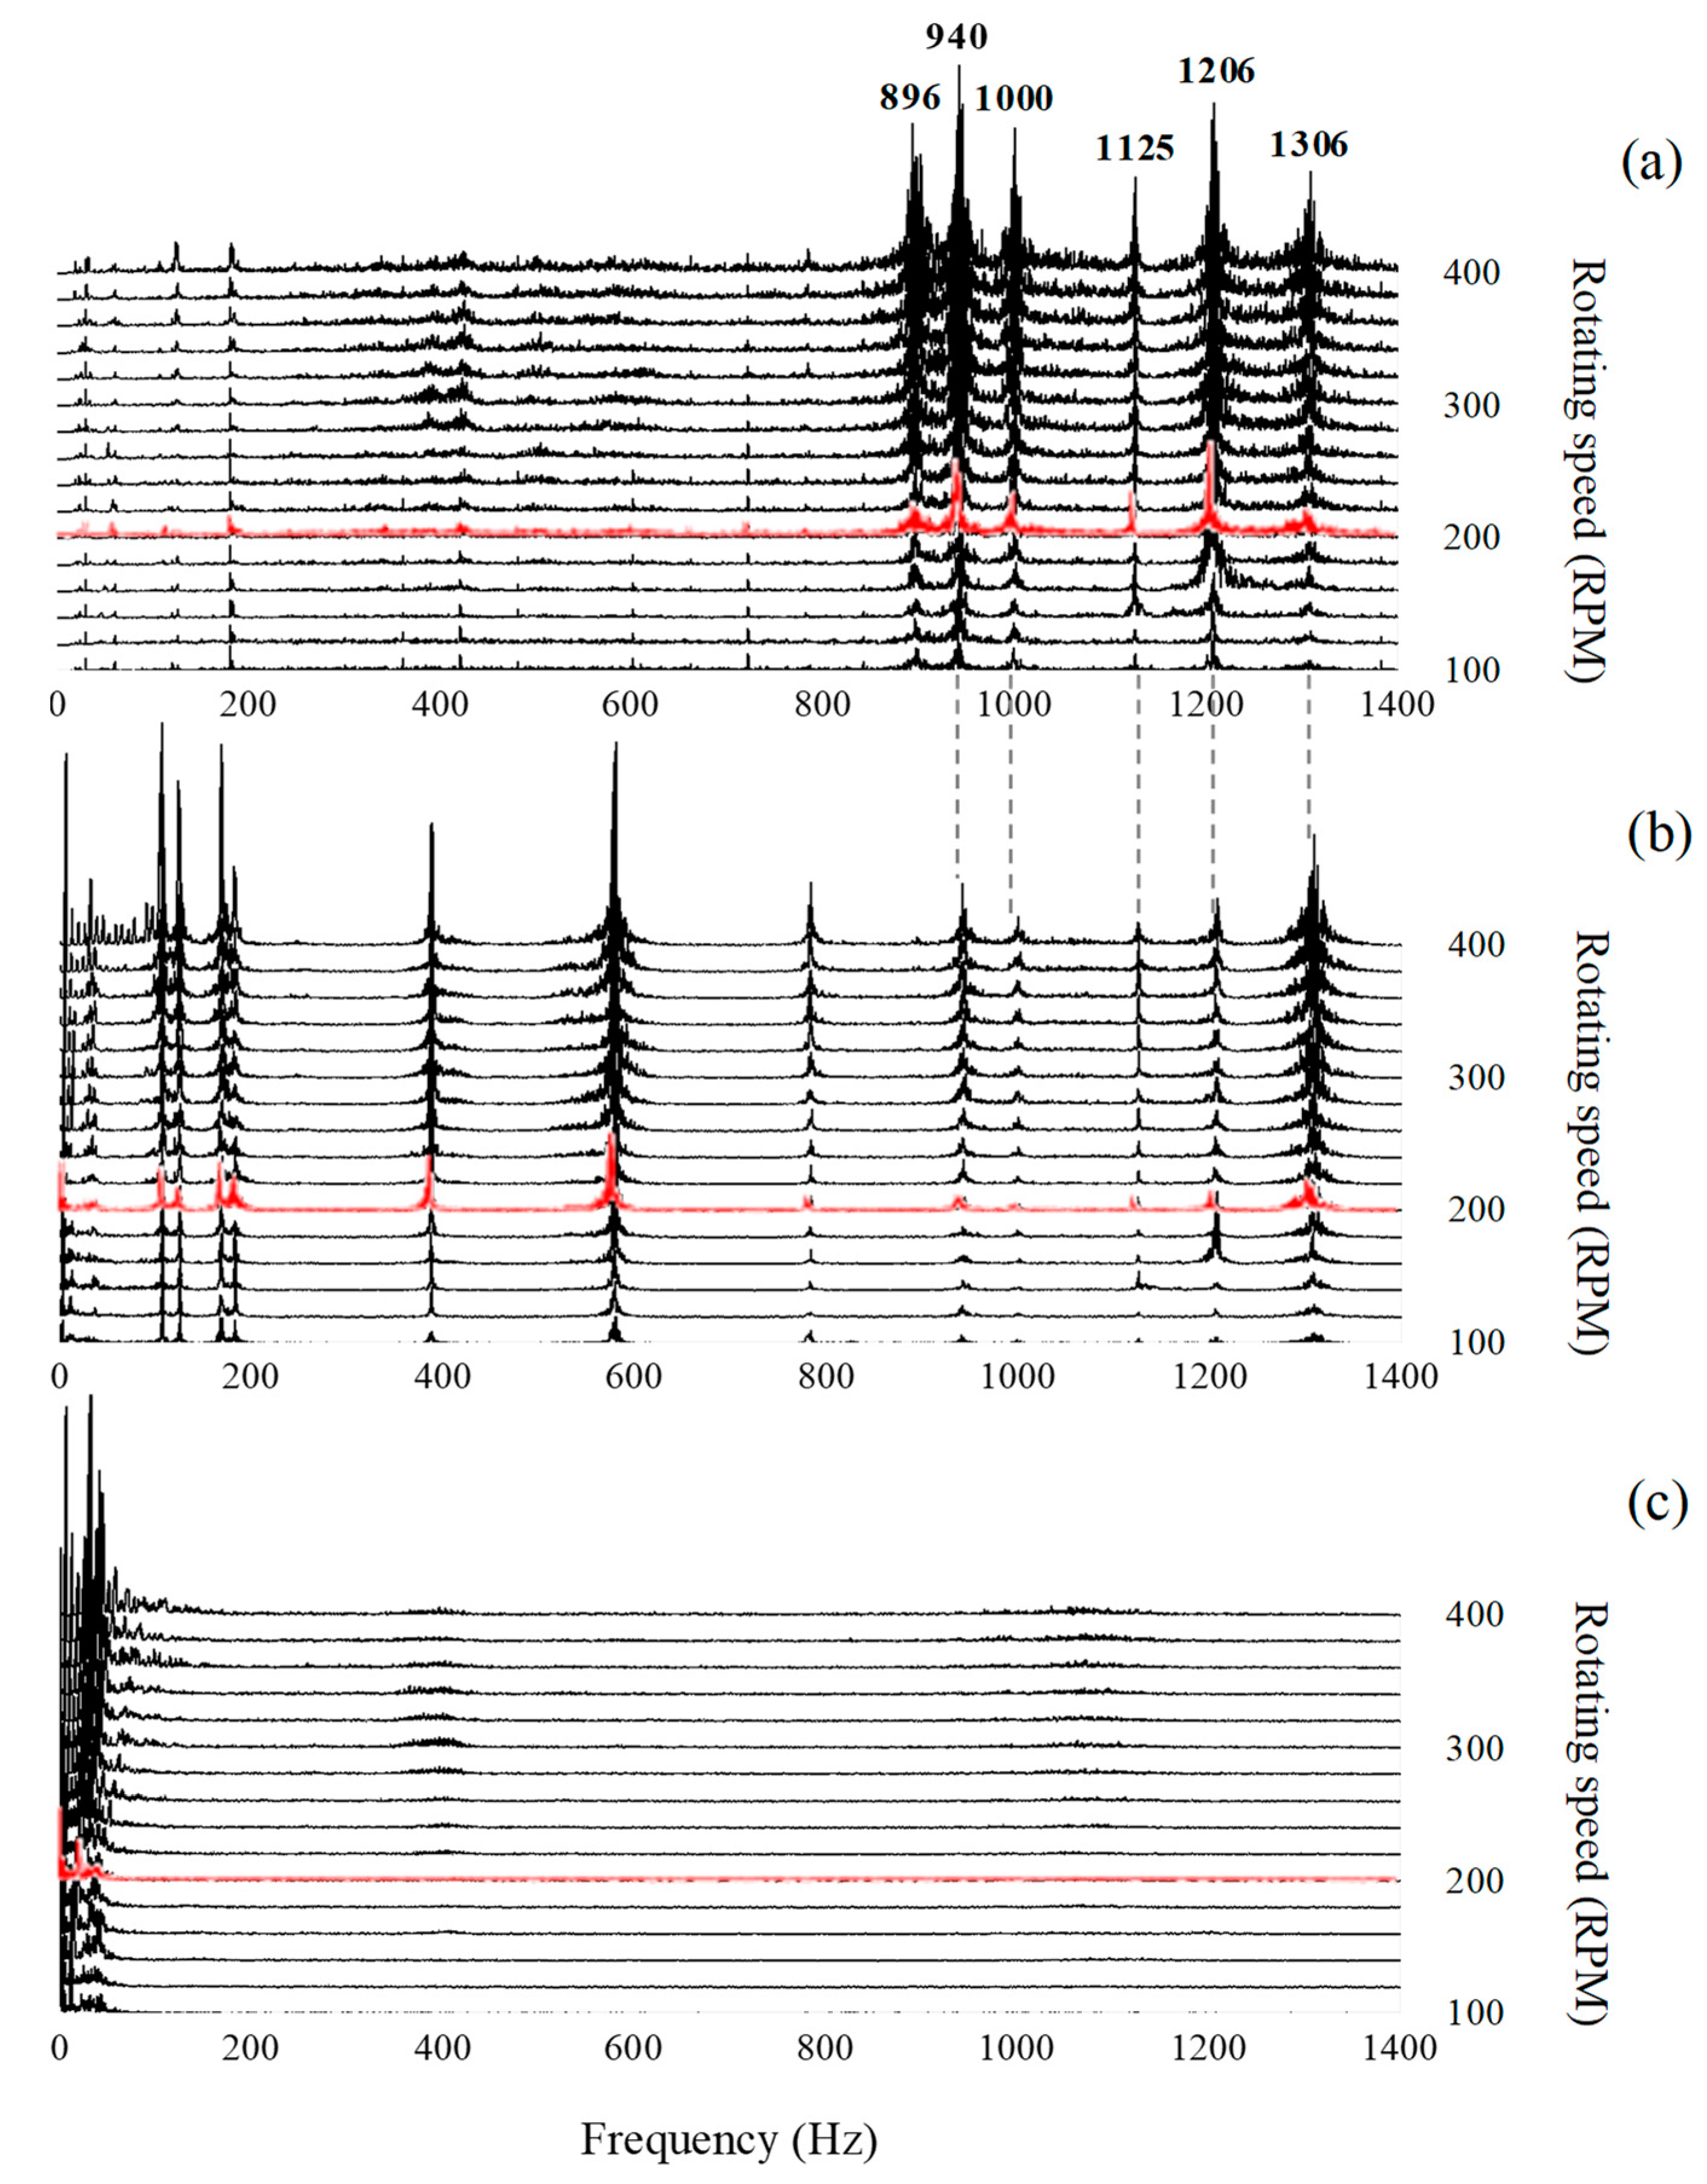
Next, the noise and vibration of the assembled wheel bearing were measured while increasing the rotational speed from 100 rpm to 400 rpm at intervals of 20 rpm. The measured results are plotted as a waterfall plot that expresses the frequency spectrum in three dimensions as shown in
Figure 5. The previously analyzed frequency spectrum at 200 rpm is indicated in red in
Figure 5. As shown in
Figure 5a, the peak noise frequencies are always observed at 896, 940, 1000, 1125, 1206, and 1306 Hz regardless of the rotational speed. Furthermore, in
Figure 5b, the peak vibration frequencies for the dust shield are same as those for all rotational speeds, and these peak frequencies coincide with the frequencies observed in
Figure 4b. Among the frequencies, 940, 1000, 1125, 1206, and 1306 Hz always coincided with the peak noise frequencies regardless of the rotational speed. The peak vibration frequencies for the outer ring in
Figure 5c are observed at low frequencies and are independent of the peak noise frequencies in
Figure 5a. Therefore, it was observed that the noise for assembled wheel bearing is not affected by the rotational speed, and it is closely related to the vibration of dust shield.
3. Noise Identification
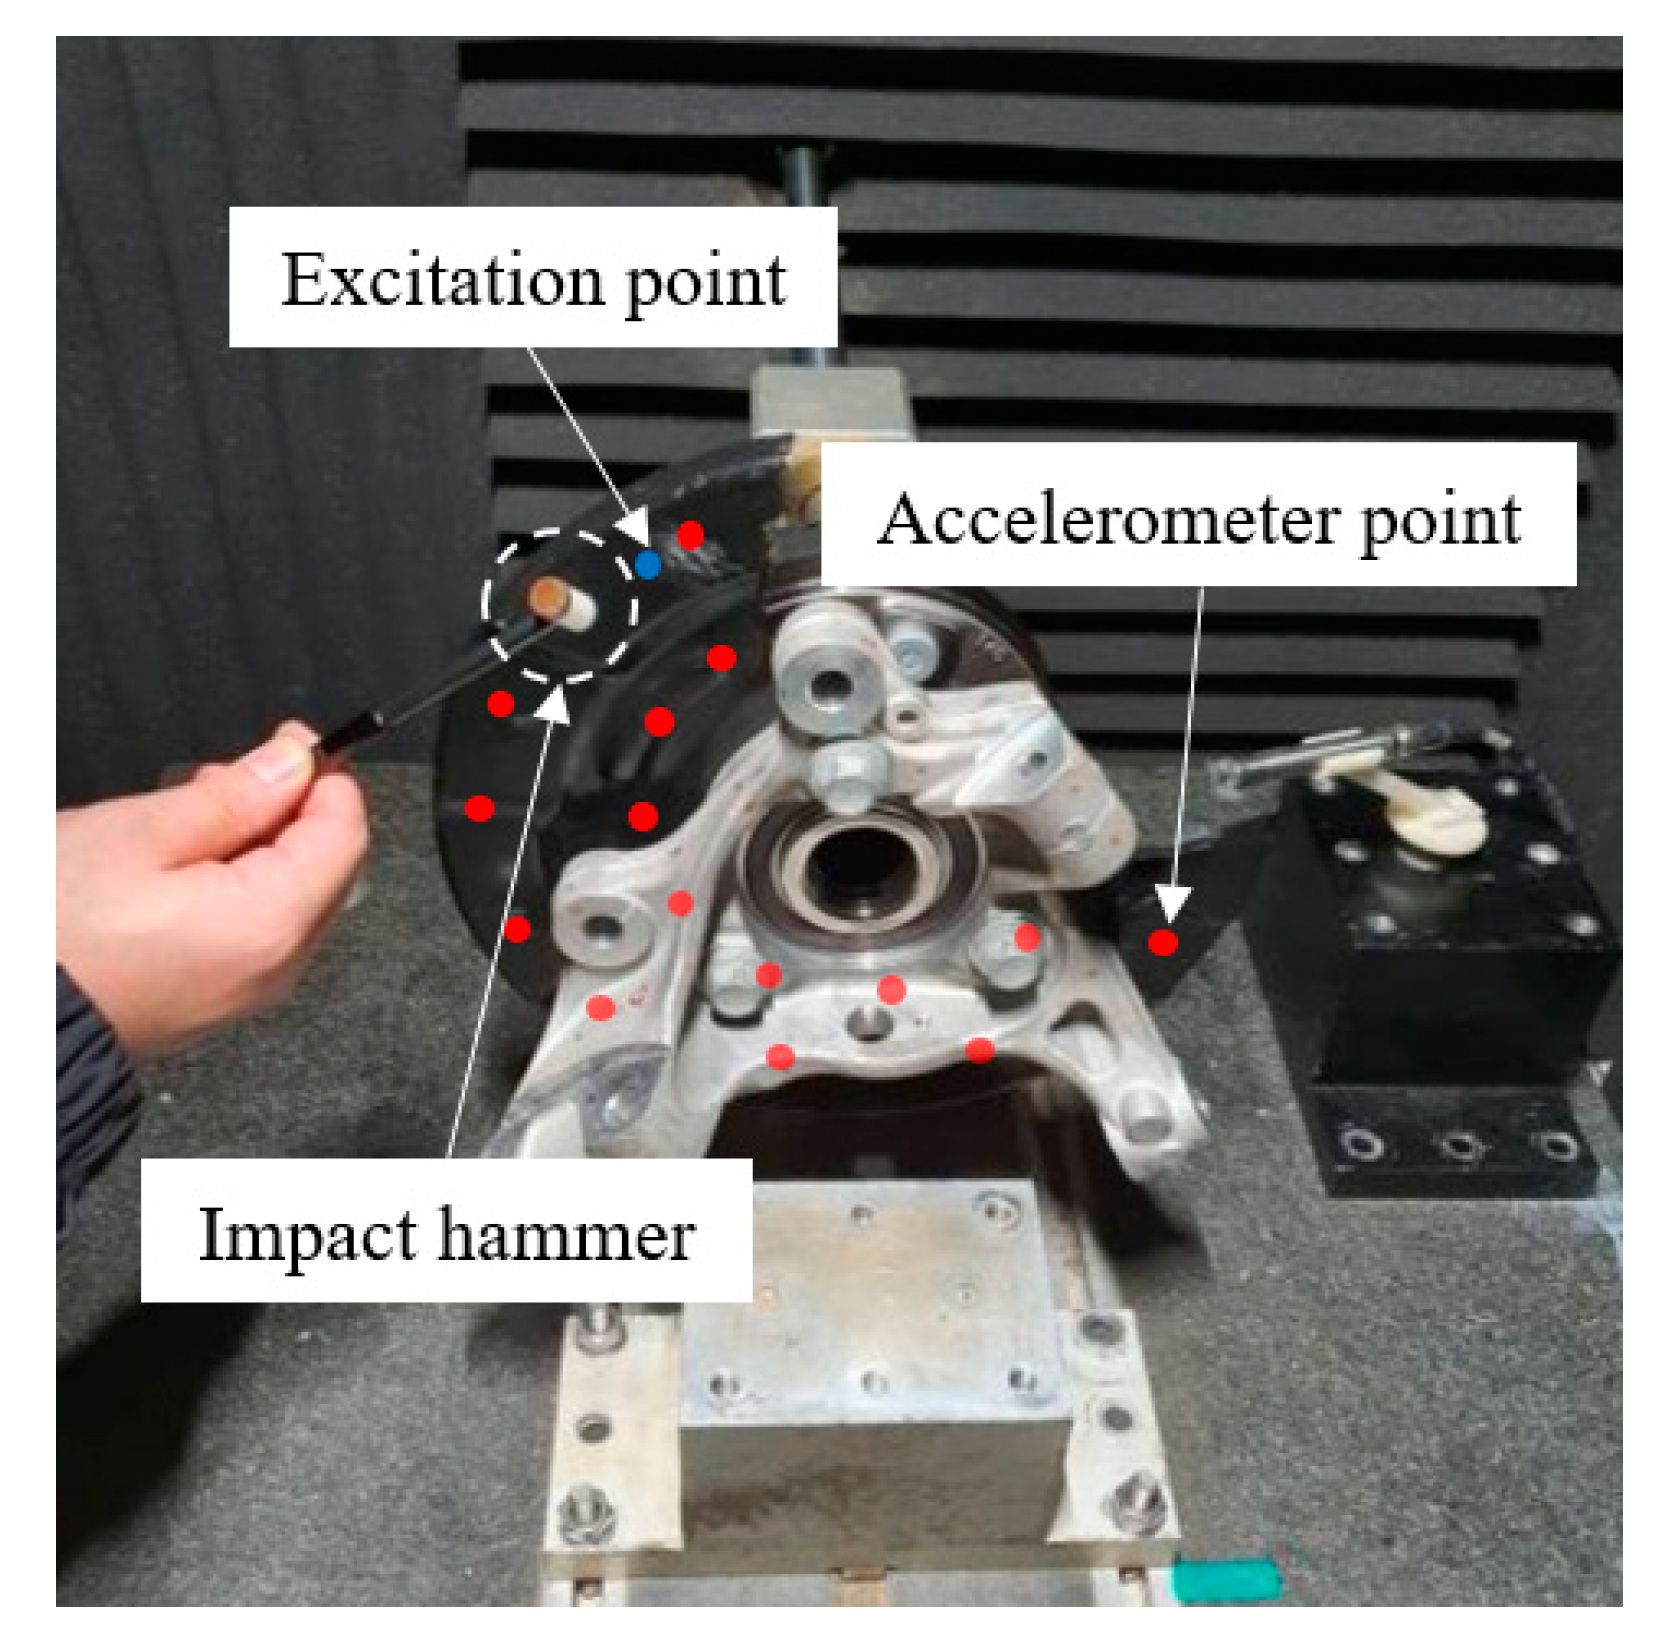
To confirm whether the noise of the assembled wheel bearing was due to the vibration of the dust shield, modal testing was conducted on the dust shield.
Figure 6 shows the configuration for the modal testing of the dust shield. As shown in the figure, the assembled wheel bearing is installed in a stationary experimental device without rotation. The red and blue points on the dust shield indicate the attachment position of the accelerometer and excitation position of the impact hammer, respectively. By attaching one accelerometer to the red point and hitting the impact hammer at the blue point, the excitation force of the impact hammer and acceleration response of the accelerometer were measured. The signals were acquired in a similar manner by moving the accelerometer to another red point. The frequency response function, which represents the relationship between the excitation force (input) and acceleration response (output), was obtained from the acquired signals.
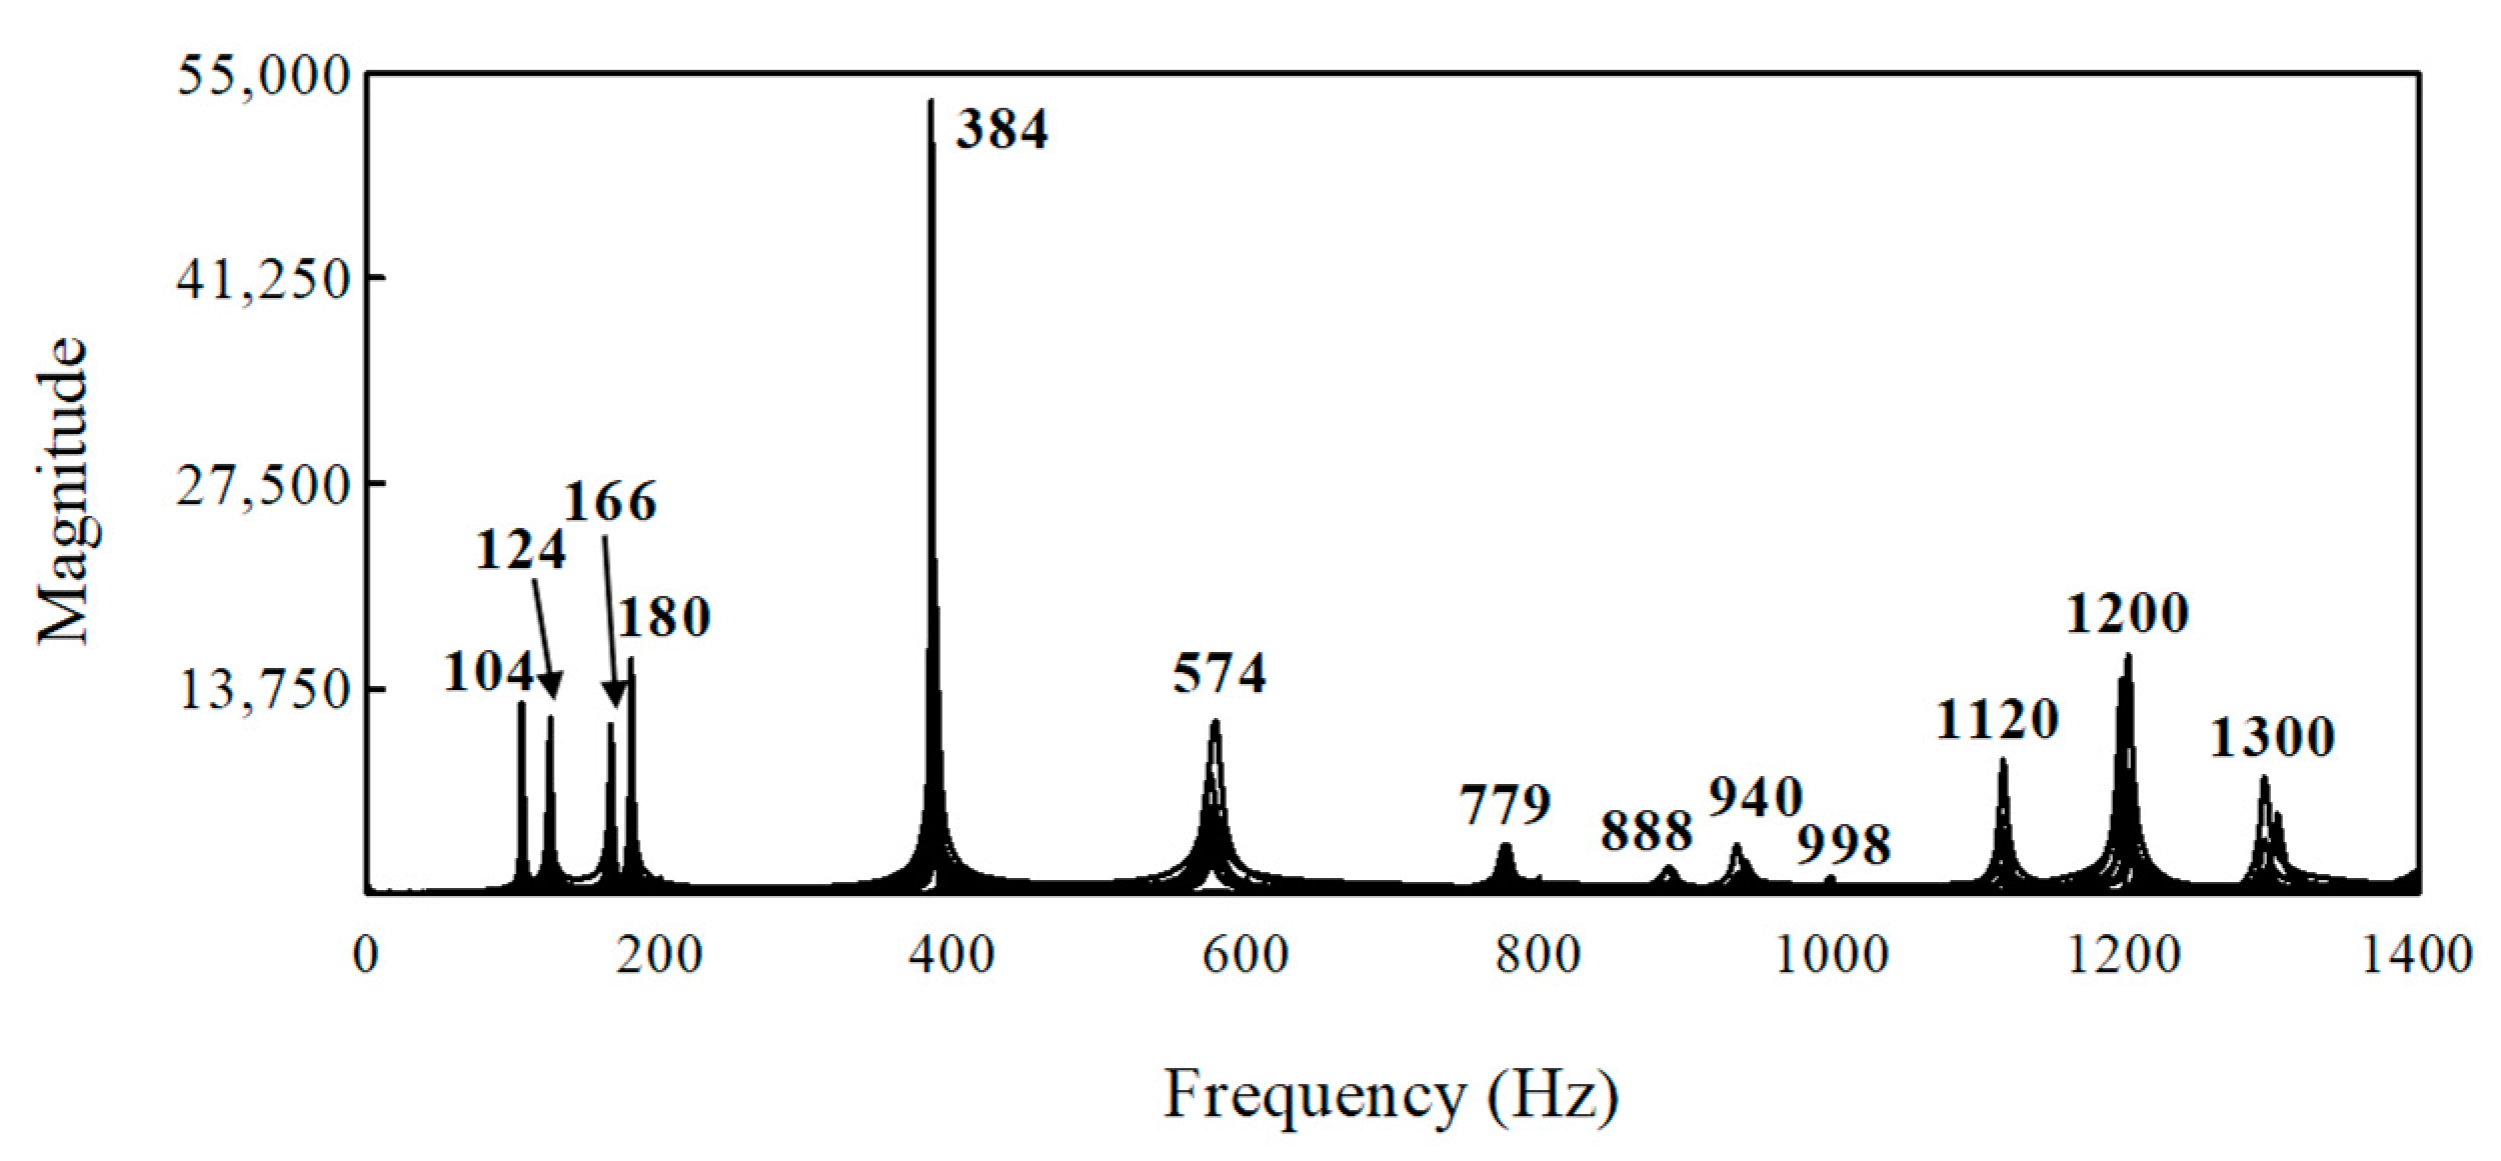
The natural frequencies and mode shapes were analyzed using modal analysis. The frequency response function for all measurement positions is illustrated in
Figure 7, where the peak frequencies denote the natural frequencies of the dust shield. To compare the noise/vibration frequency, which are generated when the assembled wheel bearing rotates, with the natural frequency of the dust shield, the peak noise frequencies in
Figure 4a, peak vibration frequencies in
Figure 4b, and natural frequencies of the dust shield in
Figure 7 are summarized in
Table 2. As listed in
Table 2, the natural frequencies of dust shield and peak vibration frequencies of the dust shield are almost the same. However, a frequency corresponding to the natural frequency of 888 Hz was not observed in the peak vibration frequency of the dust shield. The reason for this is explained later during the analysis of the mode shape. Among the natural frequencies of the dust shield, 888, 940, 998, 1120, 1200, and 1300 Hz were similar to the peak noise frequencies for the assembled wheel bearing.
The mode shapes of the dust shield close to the peak noise frequencies of the assembled wheel bearing are shown in
Figure 8. Each point in
Figure 8 is an accelerometer position, and the mode shapes before and after deformation are indicated by dotted and solid lines, respectively. In
Figure 8a, it can be observed that there is a nodal point where the magnitude of the vibration becomes zero on the mode shape corresponding to 888 Hz. This point is the same as the location where the accelerometer is attached to measure the vibration of the dust shield in the previous analysis (
Figure 2). Hence, at the peak vibration frequency of the dust shield, a frequency of 888 Hz was not observed because the vibration was measured at the nodal point. If the accelerometer is attached to a different location, which avoids the nodal point when measuring the vibration of the dust shield, a frequency similar to 888 Hz can be observed in the frequency spectrum.
However, a common feature corresponds to the large deformation that occurs outside the dust shield. This implies that a large amount of noise was radiated from the outside position of the dust shield. Therefore, it can be stated that the noise frequencies of the assembled wheel bearing, i.e., 896 Hz, 940 Hz, 1000 Hz, 1125 Hz, 1206 Hz, and 1306 Hz, were radiated by the deformation of the dust shield.
4. Excitation Source for Noise
In this section, the excitation source that induces noise and vibration of the assembled wheel bearing is analyzed. In an assembled wheel bearing, the knuckle and dust shield are stationary, whereas only the wheel bearing rotates with the driving shaft. It can be inferred that an excitation force is generated inside the wheel bearing, and this force is transmitted to the knuckle and dust shield. Therefore, the vibration of the wheel bearing in the outer ring obtained in the previous section was analyzed in more detail.
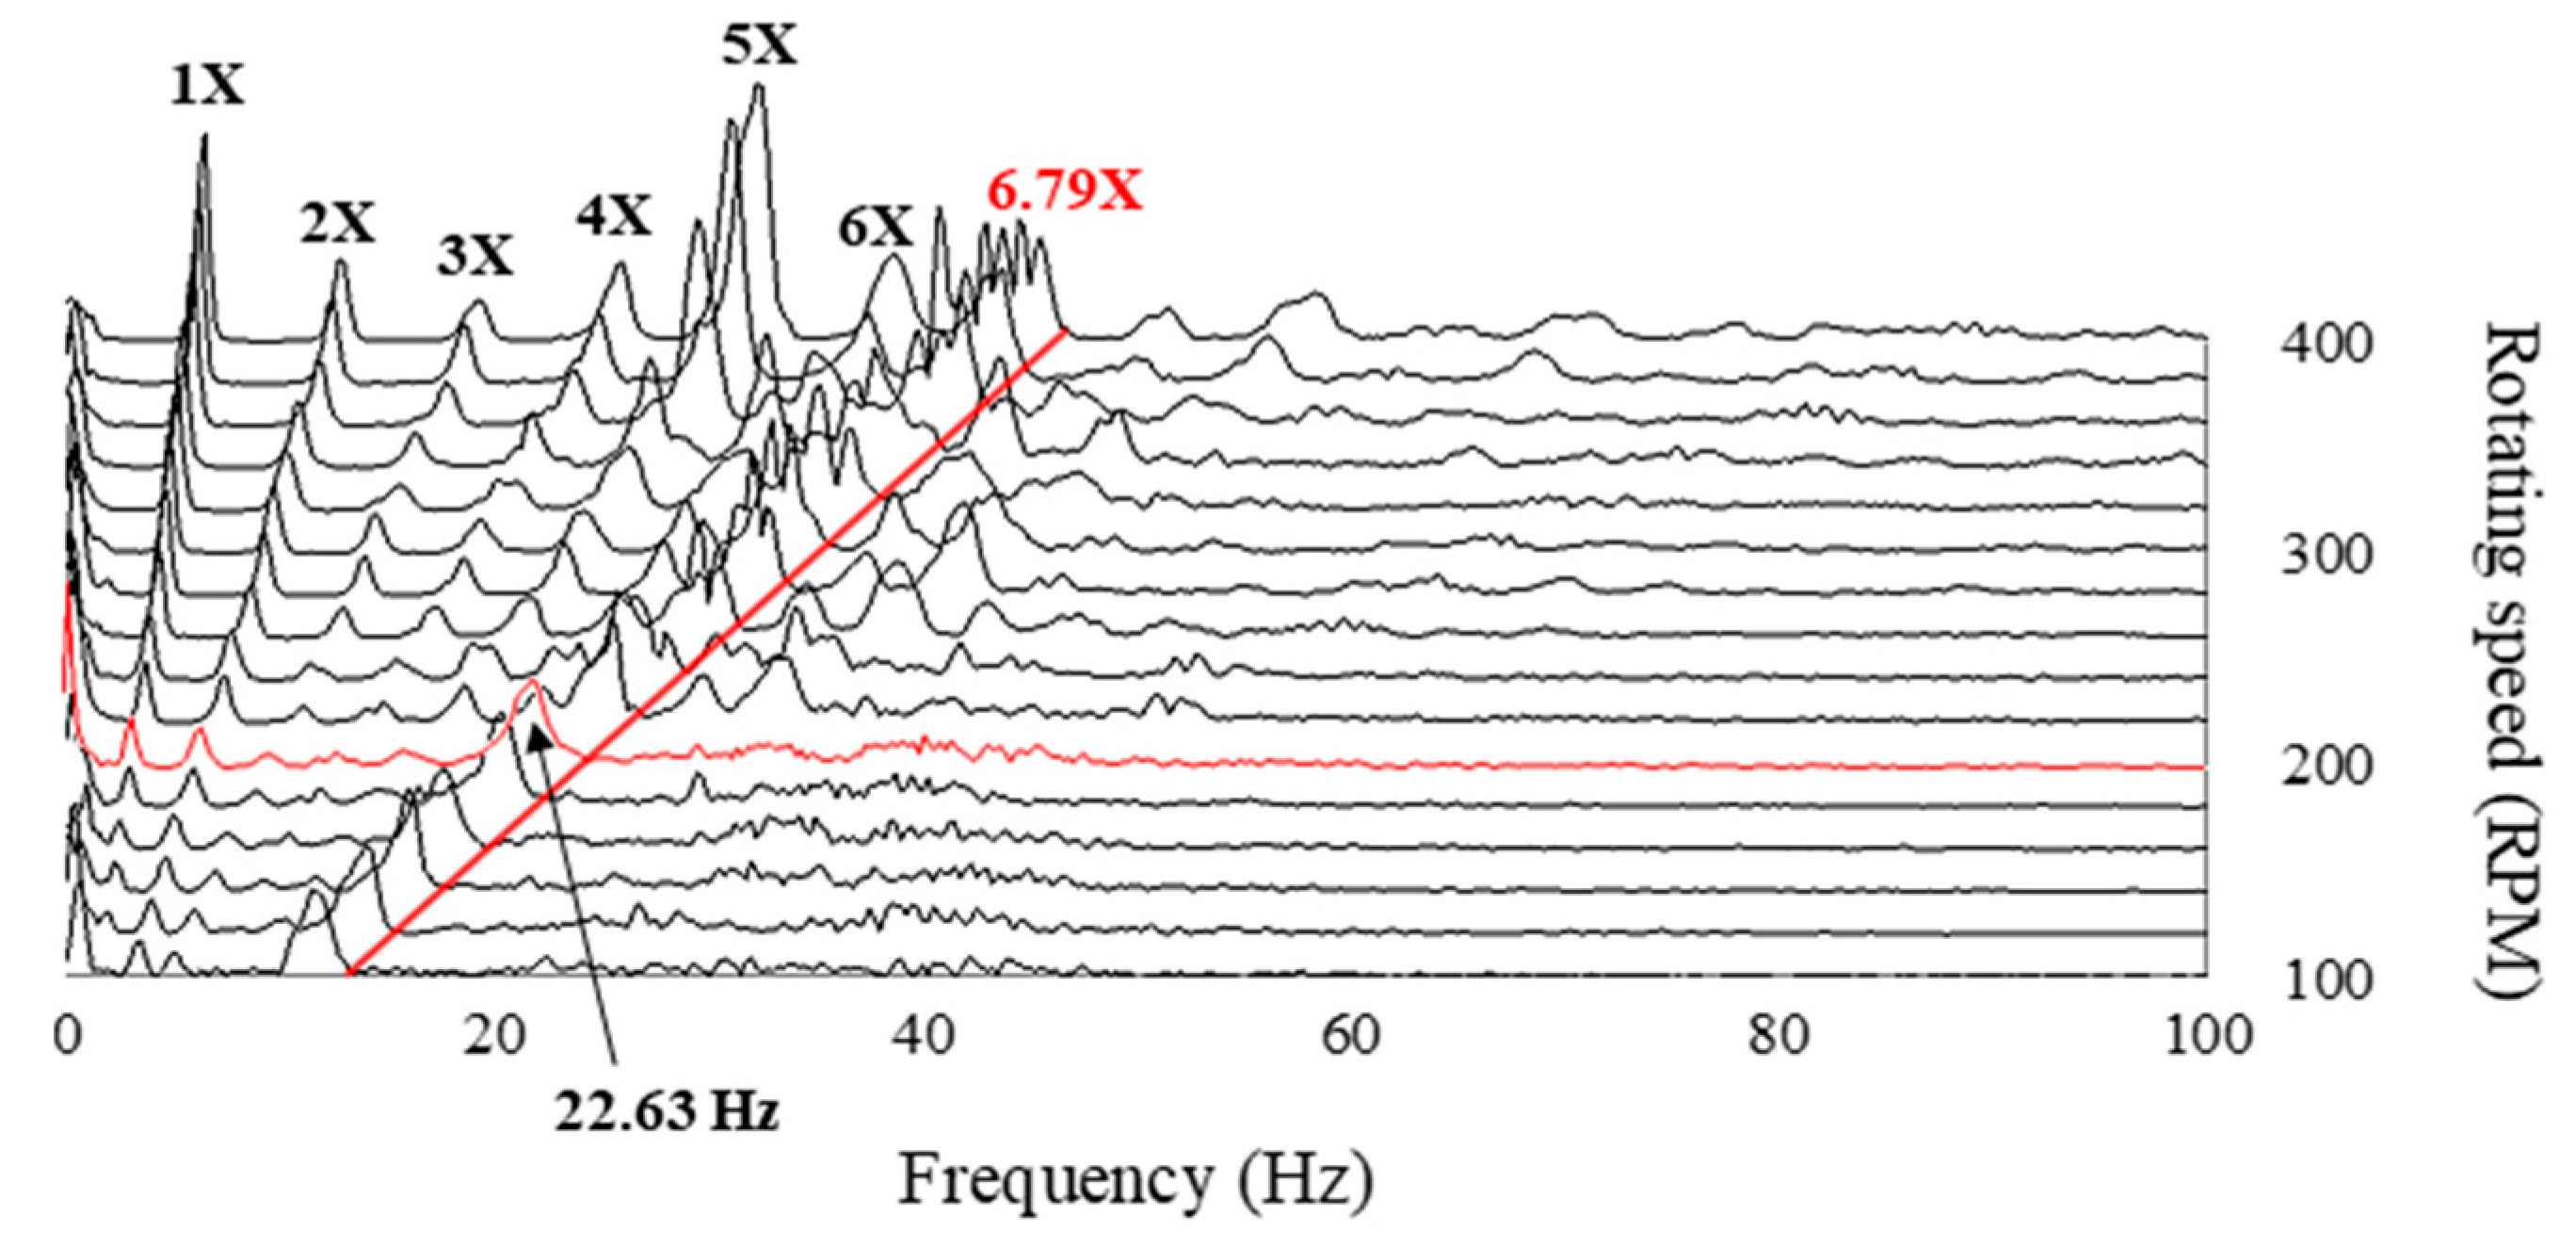
Figure 9 is an enlarged figure, showing frequencies below 100 Hz, to clearly denote the low-frequency components of
Figure 5c. As shown in
Figure 9, the rotational frequencies of 1
X, 2
X, 3
X, 4
X, 5
X, 6
X, and 6.79
X are observed, where
X denotes the rotating frequency. If the rotation speed is 300 rpm, the rotating frequency
X becomes 5 Hz. Specifically, frequency of 22.63 Hz, which is largely observed in
Figure 4c, corresponds to 6.79
X. In general, the magnitude of the rotational frequency tends to increase gradually because the centrifugal force increases as the rotational speed increases. However, the frequency corresponding to 6.79
X in
Figure 9 has a large magnitude even at a low rotational speed regardless of the rotational speed. This implies that another force, which causes 6.79
X, along with the centrifugal force exists. Given that no additional external force was applied to the wheel bearing, it can be considered that the previously mentioned force was due to defects inside the wheel bearing.
To verify the cause for 6.79
X, the characteristic frequencies (often called the defect frequencies) of the bearing were investigated. The characteristic frequencies include fundamental train frequency (
fFTF), ball pass frequency outer ring (
fBPFO), ball pass frequency inner ring (
fBPFI), and ball spin frequency (
fBSF), which are obtained by the following equations [
22,
23]:
where, as mentioned before,
X is the rotating frequency,
N is the number of balls,
Bd is the ball diameter,
Pd is the pitch diameter, and
θ is the contact angle. The characteristic frequencies are obtained by substituting the design specifications in
Table 1 into Equations (1)–(4), and the results are listed in
Table 3. As shown in
Table 3,
fFTF,
fBPFO,
fBPFI, and
fBSF of the inboard row are 0.42
X, 6.29
X, 8.71
X, and 2.47
X, respectively, whereas
fFTF,
fBPFO,
fBPFI, and
fBSF of the outboard row are 0.42
X, 6.79
X, 9.21
X, and 2.65
X, respectively. Consequently, the value observed for 6.79
X in
Figure 9 is consistent with
fBPFO of the outboard row. This implies that a defect on the outer ring of the outboard row was detected in the vibration of the wheel bearing. Thus, the excitation force that induces the noise and vibration of the assembled wheel bearing is generated by the outer-ring defect of the wheel-bearing outboard row.
5. Simulation for Structural Defect
A simulation of the finite element analysis was performed to determine the reason for structural defects inside the wheel bearing. A simulation model of the assembled wheel bearing is constructed as shown in
Figure 10a. A commercial software, ANSYS, was used for the simulation. As shown in
Figure 10a, the finite element model is composed of an outer ring, dust shield, knuckle, and three bolts connecting them. The other components (hub, inner ring, balls, and retainer) were excluded from the finite element model for simplification and efficiency of the analysis. In the finite element model, the outer ring, dust shield, knuckle, and bolt had 74,249, 48,653, 13,8673, and 8023 nodes, respectively, and 44,808, 24,246, 87,833, and 4528 elements, respectively. Furthermore, steel, which has a Young’s modulus of 206 GPa and Poisson’s ratio of 0.3, was used for each component.
The boundary and load conditions applied to the analysis model are shown in
Figure 10b. As shown in this figure, specific parts of the knuckle that connect to the vehicle body were applied under fixed conditions. Next, given that the outer ring flange, dust shield, and knuckle were fastened using bolts, a fastening force was applied to the bolts. The bolt-clamping force was obtained using the following equation:
where
F denotes the bolt clamping force,
T denotes the bolt-tightening torque,
K denotes the torque coefficient, and
D denotes the bolt diameter. In this study, the bolt tightening torque
T was 100 Nm, bolt diameter
D was 0.012 m, and torque coefficient
K was 0.15. By substituting these values into Equation (5), the bolt clamping force
F was calculated as 55,556 N, and the obtained value was applied to the analysis model. The effect of the weight of the wheel bearing was also considered by applying gravity.
The radial deformation of the assembled wheel bearing is analyzed in the radial direction, as shown in
Figure 11. Specifically, the nodes of the outer ring deformed in the outward radial direction are displayed in red (or positive values), while the nodes deformed in the inward radial direction are displayed in blue (or negative values). In
Figure 11, the radial deformation is relatively large in the outer ring, and almost no radial deformation occurs in the other components. After removing other components that slightly affect radial deformation, the radial deformations are solely reanalyzed for the outer ring raceway of the inboard/outboard row, and these results are illustrated in
Figure 12. In
Figure 12a, the outer ring raceway of the inboard row is deformed in the inward direction near the flange and deformed in the outward direction between the flanges. Conversely, in
Figure 12b, the outer ring raceway of the outboard row was deformed in the outward direction near the flange and in the inward direction between the flanges. This phenomenon occurs because the outer ring flange is bent in the inboard row direction (the axial direction) when the bolt is fastened as shown in the enlarged figure in
Figure 11. Generally, the bending deformation of the outer ring flange occurs when the bolts are tightened. Thus, the outer ring of the inboard row is compressed near the flange, while the outer ring of the outboard row is tensioned near the flange.
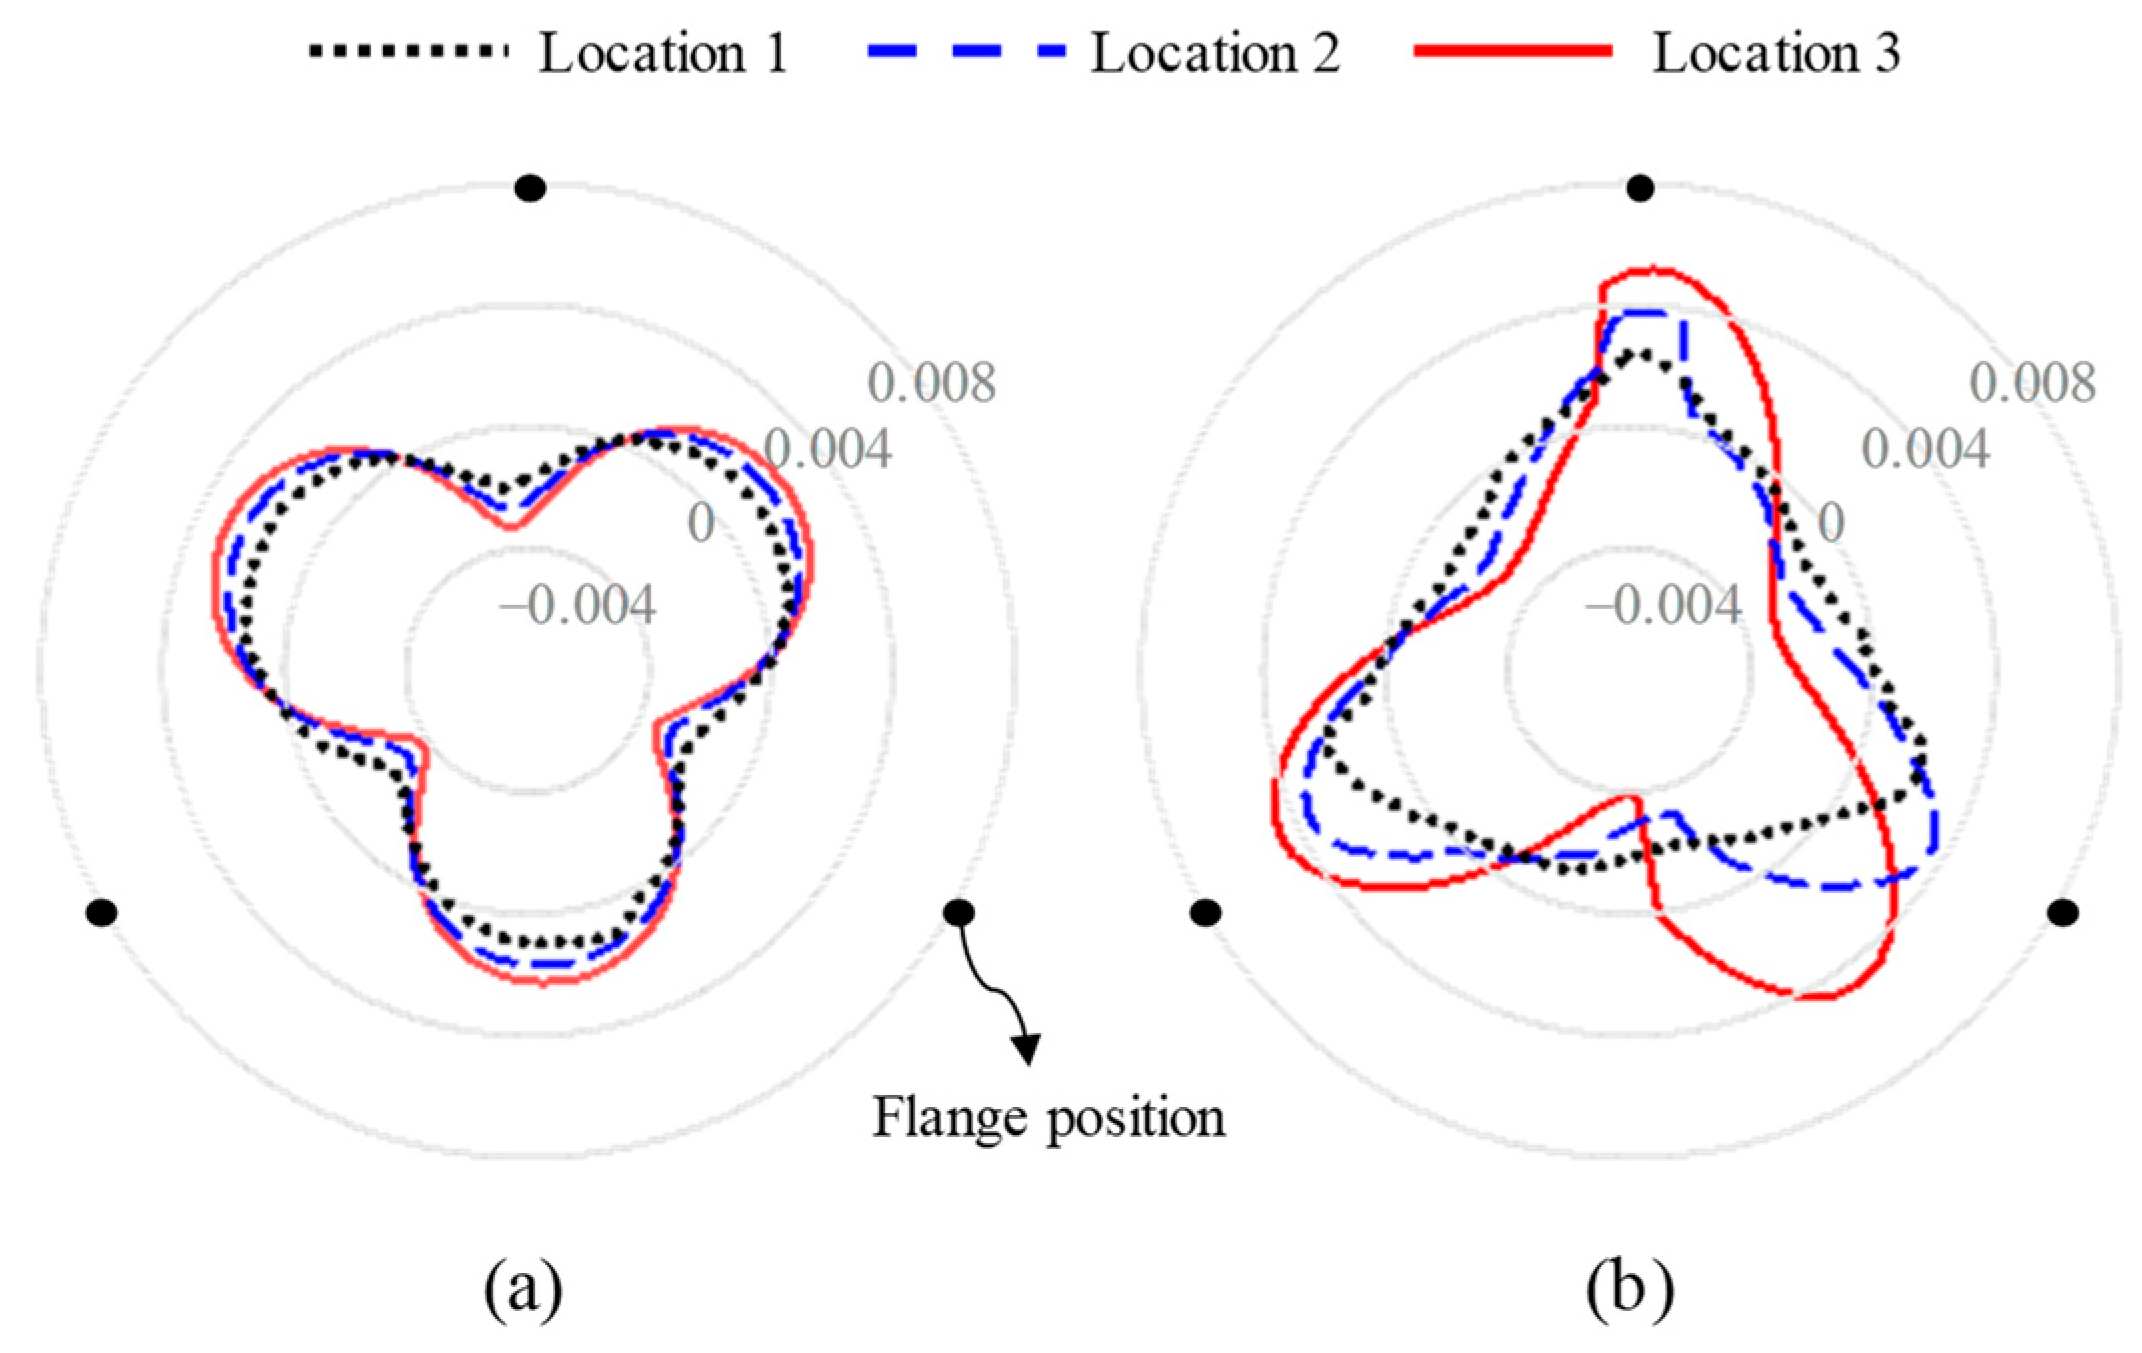
To quantitatively represent the radial deformations of the outer ring of the inboard/outboard row and compare these values, the roundness of the outer ring raceways of the inboard/outboard rows was investigated. The analysis location for roundness in the outer ring raceway of the inboard/outboard row is shown in
Figure 13. The roundness shapes of the outer ring raceways of the inboard/outboard rows are shown in
Figure 14. These roundness shapes were drawn by extracting the radial deformation data for nodes on the same lines in the circumferential direction shown in
Figure 13. The roundness in
Figure 14a is observed as a shape that deforms inward near the flanges and deforms outward between the flanges, whereas the roundness in
Figure 14b is observed as a shape that deforms outward near the flanges and deforms inward between the flanges. Consequently, the roundness shapes in
Figure 14a,b show the same tendency as the analysis results for the radial deformations in
Figure 12a,b, respectively. The roundness value was calculated as the sum of the maximum deformation values in the inward and outward radial directions. The roundness of the inboard row in
Figure 14a has values of 4.23 μm, 5.48 μm, and 6.66 μm in the order of locations 1, 2, and 3, respectively, and the roundness of the outboard row in
Figure 14b has values of 4.41 μm, 6.81 μm, and 9.01 μm in the order of locations 1, 2, and 3, respectively. When comparing the roundness values corresponding to the same location in the inboard/outboard row, the roundness value of the outboard row is greater than that of the inboard row. Furthermore, as the analysis location moved outward, the change in roundness value in the outboard row was larger than the change in roundness value in the inboard row. This implies that the radial deformation in the outboard row was higher than the radial deformation in the inboard row when the bolt was fastened.
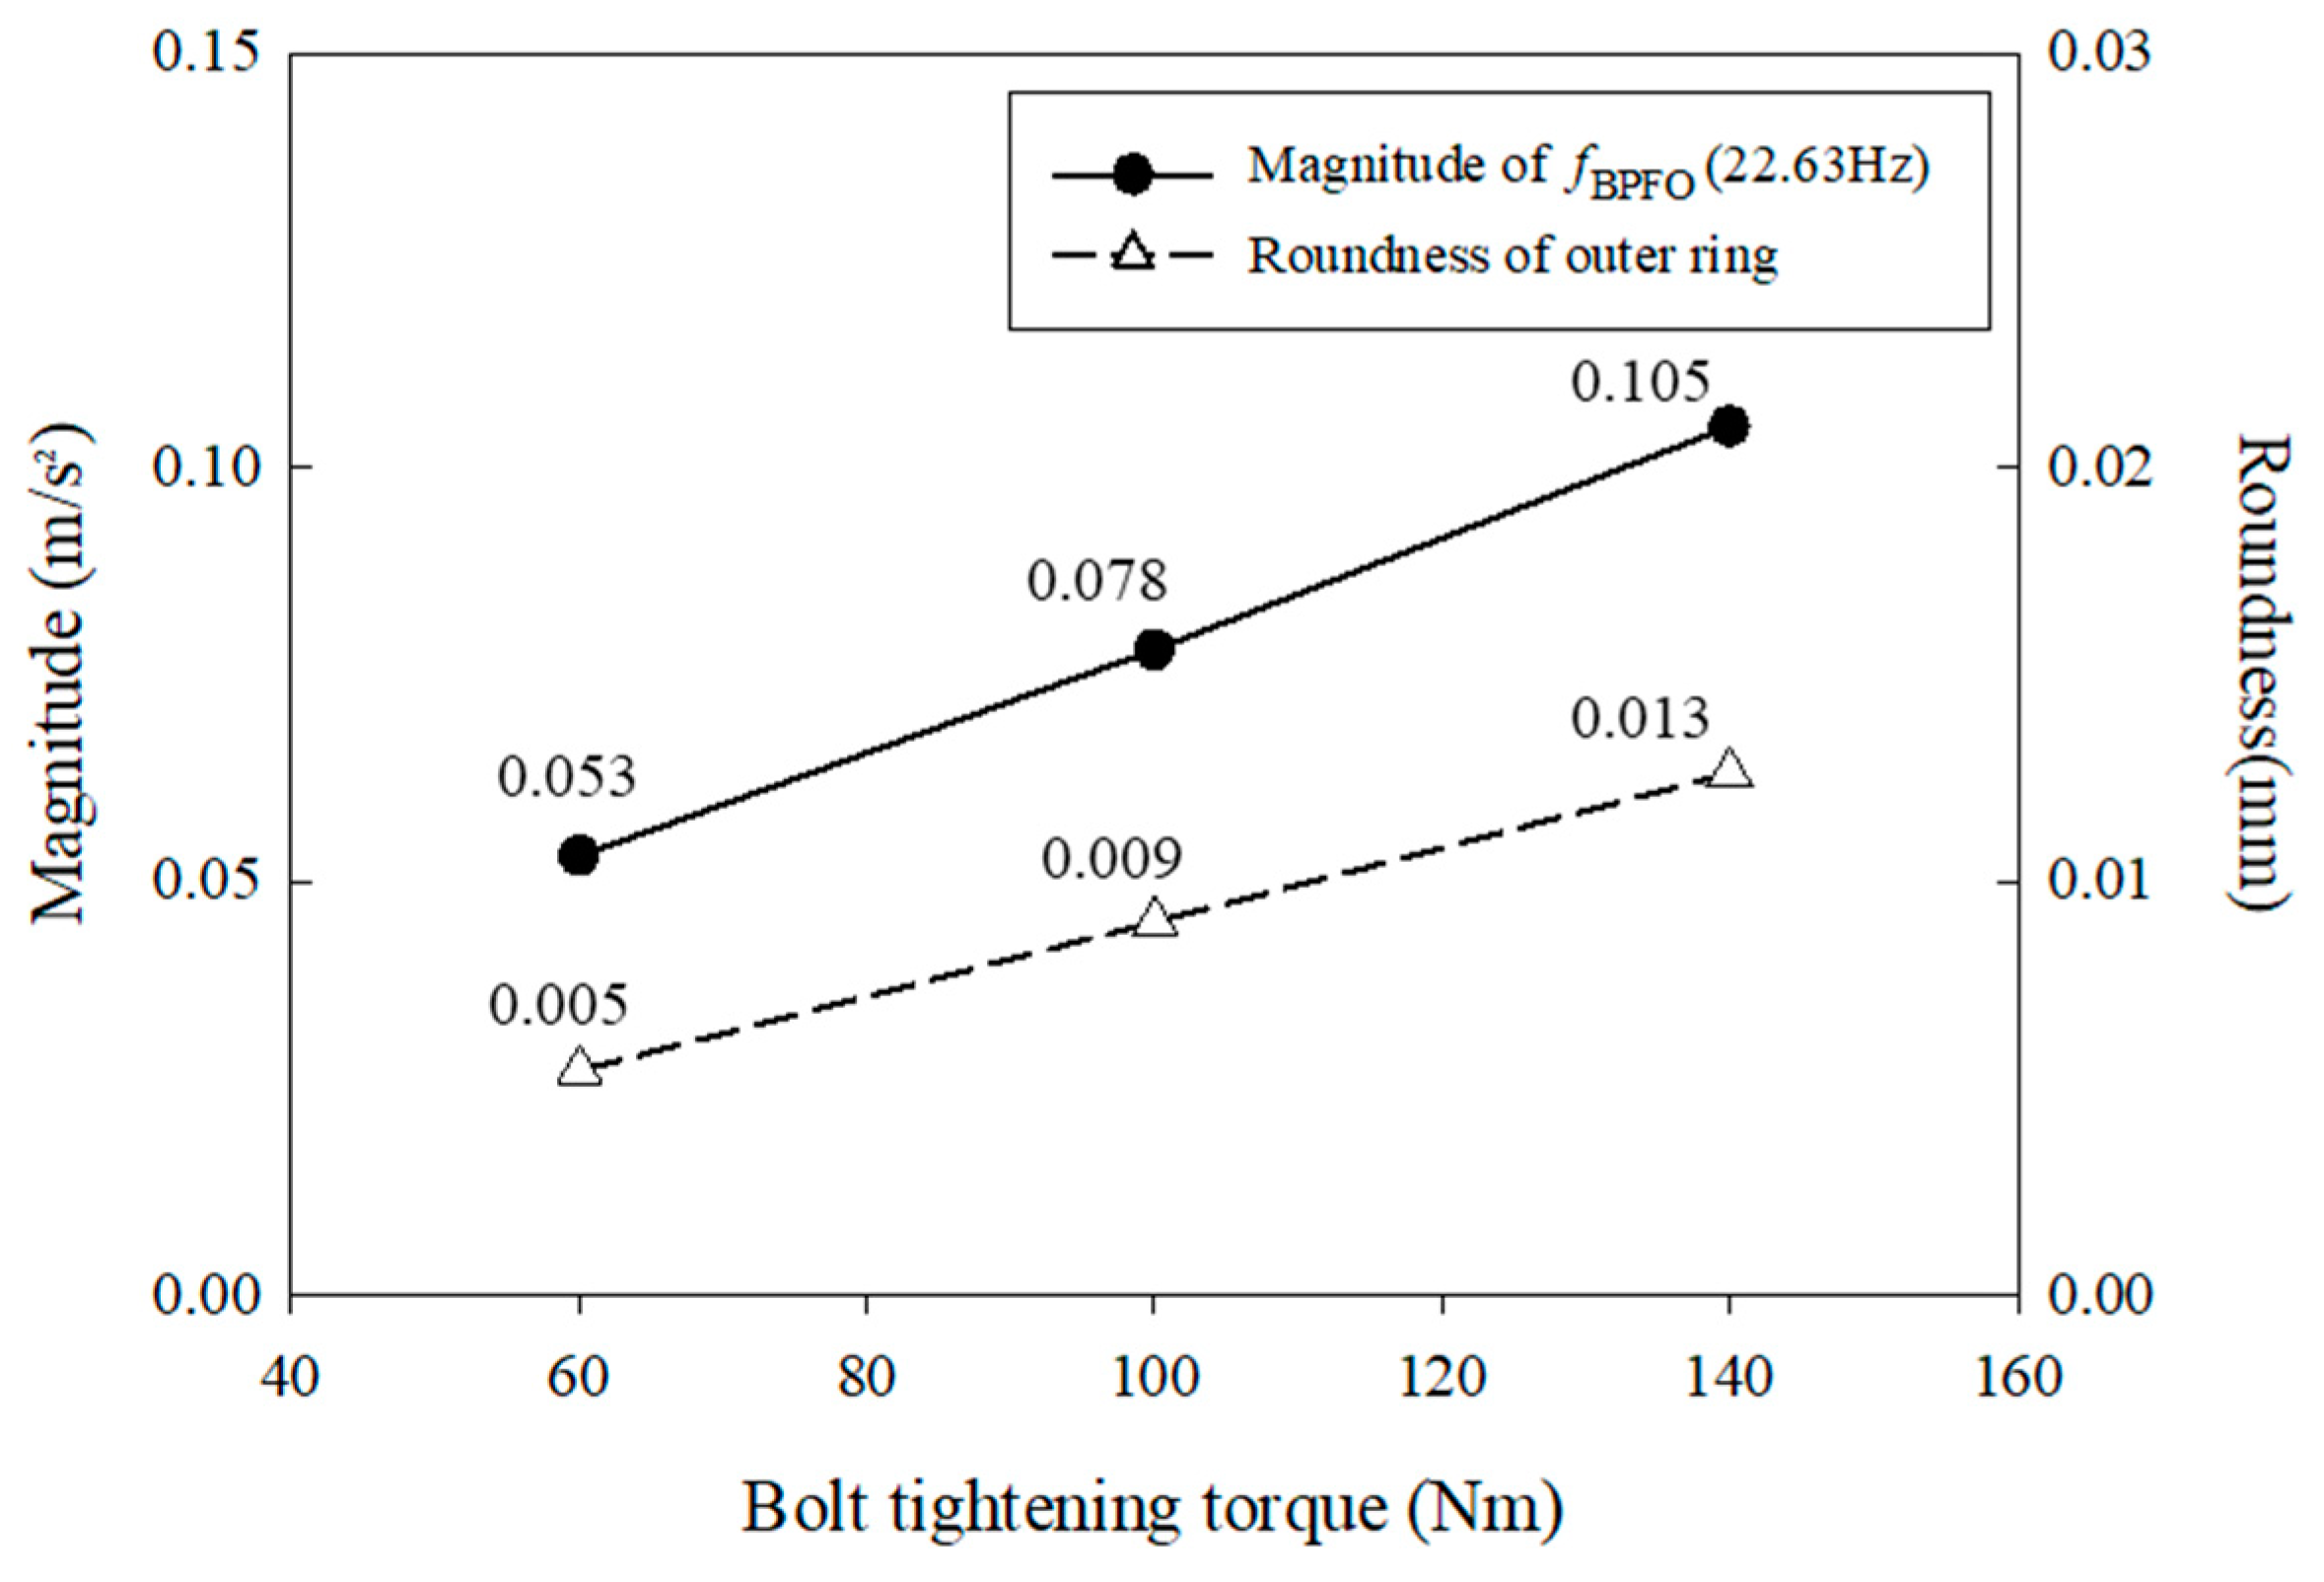
Finally, the relationship between the deformation of the outer ring and vibration of the wheel bearing was investigated. For analysis, the roundness and vibration of the outer ring were obtained with respect to the variation in the bolt tightening torques of 60, 100, and 140 Nm. The roundness of the outer ring is analytically computed using simulation as in the previous analysis, and the analysis location corresponds to location 3 of the outboard row as shown in
Figure 13. The vibration of the outer ring was experimentally measured when the wheel bearing rotated at 200 RPM, and the peak vibration magnitudes in the outboard row were analyzed at the characteristic frequency,
fBPFO (22.73 Hz at 200 RPM).
Figure 15 shows the values of vibration magnitude and roundness for bolt tightening torques of 60, 100, and 140 Nm. As shown in
Figure 15, when the bolt tightening torques are 60, 100, and 140 Nm, the roundness of the outer ring in the outboard row is 0.005, 0.009, and 0.013 mm, respectively. Meanwhile, the vibration magnitudes were 0.053, 0.078, and 0.105 m/s
2, respectively, with respect to the bolt tightening torque. Consequently, when the bolt-tightening torque increases, not only the value of roundness but also the vibration magnitude increases. Therefore, it can be concluded that the deterioration of the roundness in the outer ring by bolt fastening leads to vibration in the assembled wheel bearing.


