Article

Discrimination of Tumor Texture Based on MRI Radiomic Features: Is There a Volume Threshold? A Phantom Study

by
João Santinha
1,2,†,
Linda Bianchini
3,†,
Mário Figueiredo
2,4,
Celso Matos
1,5,
Alessandro Lascialfari
3,
Nikolaos Papanikolaou
1,6,
Marta Cremonesi
7,
Barbara A. Jereczek-Fossa
8,9,
Francesca Botta
10,* and
Daniela Origgi
10
1
Champalimaud Experimental Clinical Research Programme, Champalimaud Foundation, 1400-038 Lisboa, Portugal
2
Instituto Superior Técnico, Universidade de Lisboa, 1049-001 Lisboa, Portugal
3
Department of Physics, Università degli Studi di Pavia, 27100 Pavia, Italy
4
Instituto de Telecomunicações, 1049-001 Lisboa, Portugal
5
Champalimaud Clinical Centre, Champalimaud Foundation, 1400-038 Lisboa, Portugal
6
Department of Radiology, Royal Marsden Hospital, Downs Road, Sutton SM2 5PT, UK
7
Radiation Research Unit, IEO European Institute of Oncology IRCCS, 20141 Milan, Italy
8
Department of Radiation Oncology, IEO European Institute of Oncology IRCCS, 20141 Milan, Italy
9
Department of Oncology and Hemato-Oncology, University of Milan, 20122 Milan, Italy
10
Medical Physics Unit, IEO European Institute of Oncology IRCCS, 20141 Milan, Italy
*
Author to whom correspondence should be addressed.
These authors contributed equally to this work.
Appl. Sci. 2022, 12(11), 5465; https://doi.org/10.3390/app12115465
Submission received: 15 March 2022 / Revised: 25 May 2022 / Accepted: 26 May 2022 / Published: 27 May 2022
(This article belongs to the Special Issue Medical Image Processing and Analysis Methods for Cancer Applications)

Abstract

:

Featured Application

This study provides quantitative data about the loss of informative content of MRI radiomic features when calculated on small volumes. Besides providing useful information for the design of MRI radiomic studies in the pelvic region, it proposes a methodology that might be replicated for other imaging modalities and clinical scenarios upon the development of suitable phantoms.

Abstract

Radiomics is emerging as a promising tool to extract quantitative biomarkers—called radiomic features—from medical images, potentially contributing to the improvement in diagnosis and treatment of oncological patients. However, technical limitations might impair the reliability of radiomic features and their ability to quantify clinically relevant tissue properties. Among these, sampling the image signal in a too-small region can reduce the ability to discriminate tissues with different properties. However, a volume threshold guaranteeing a reliable analysis, which might vary according to the imaging modality and clinical scenario, has not been assessed yet. In this study, an MRI phantom specifically developed for radiomic investigation of gynecological malignancies was used to explore how the ability of radiomic features to discriminate different image textures varies with the volume of the analyzed region. The phantom, embedding inserts with different textures, was scanned on two 1.5T and one 3T scanners, each using the T2-weighted sequence of the clinical protocol implemented for gynecological studies. Within each of the three inserts, six cylindrical regions were drawn with volumes ranging from 0.8 cm3 to 29.8 cm3, and 944 radiomic features were extracted from both original images and from images processed with different filters. For each scanner, the ability of each feature to discriminate the different textures was quantified. Despite differences observed among the scanner models, the overall percentage of discriminative features across scanners was >70%, with the smallest volume having the lowest percentage of discriminative features for all scanners. Stratification by feature class, still aggregating data for original and filtered images, showed statistical significance for the association between the percentage of discriminative features with VOI sizes for features classes GLCM, GLDM, and GLSZM on the first 1.5T scanner and for first-order and GLSZM classes on the second 1.5T scanner. Poorer results in terms of features’ discriminative ability were found for the 3T scanner. Focusing on original images only, the analysis of discriminative features stratified by feature class showed that the first-order and GLCM were robust to VOI size variations (>85% discriminative features for all sizes), while for the 1.5T scanners, the GLSZM and NGTDM feature classes showed a percentage of discriminative features >80% only for volumes no smaller than 3.3 cm3, and equal or larger than 7.4 cm3 for the GLRLM. As for the 3T scanner, only the GLSZM showed a percentage of discriminative features >80% for all volume sizes above 3.3 cm3. Analogous considerations were obtained for each filter, providing useful indications for feature selection in this clinical case. Similar studies should be replicated with suitably adapted phantoms to derive useful data for other clinical scenarios and imaging modalities.

1. Introduction

Radiomics is the practice of converting standard-of-care medical images into minable high-dimensional data (hereinafter referred to as radiomic features) in order to support clinical decisions [1]. It is based on the hypothesis that quantitative imaging of the tumor anatomy can yield information on its functional and progression mechanisms by investigating the spatial variations in the tumoral tissues and their surroundings [2,3] through texture analysis. As a matter of fact, when a tumor originates, many complex mechanisms occur, at the cellular level, possibly resulting in intra-tumoral heterogeneity, which might be captured by medical images. Tumors with higher heterogeneity are thought to be associated with a worse prognosis [1].
Most radiomic features were initially developed to characterize two-dimensional rectangular aerial photographs, which shared the same pixel dimensions and therefore did not require normalization to differences in the size of the region of interest [4]. In medical radiomics, these descriptors are extracted from volumes-of-interest (VOIs) encompassing the tissue under investigation, typically a tumor, which will vary in terms of area and volume. Several studies assessed the dependency of some radiomic features with volume and suggested corrections to remove such dependencies [4,5]. Identifying the dependencies of radiomic features with the size of the VOI is of major importance for their use as imaging biomarkers, as it allows the disentanglement of the texture component from the size component and, therefore, improves reliability [5].
Nonetheless, even after the removal of the dependencies of radiomic features with size, it is possible that below a certain VOI size, not enough information is available for the proper calculation of the radiomic feature, making it inaccurate and hence unable to distinguish two different textures, potentially reflecting the different clinical outcomes radiomics aims to predict. Brooks and Grigsby [6,7] analyzed the behavior of texture quantifiers as a function of the tumor volume on 18F-fluorodeoxyglucose positron emission tomography (18F-FDG PET) images. They concluded that small tumors (volume below 700 voxels) should not be included in studies of intratumoral heterogeneity of tracer uptake since they do not include a high enough number of voxels to adequately sample the underlying tracer distribution and properly calculate some radiomic features.
Similar research has not yet been performed in magnetic resonance imaging (MRI). We hypothesize that, also in MRI, some radiomic features may lose their texture-discriminative power when obtained using volumes below a certain threshold to be identified.
This study aimed to investigate how the ability of MRI-based radiomic features to discriminate different textures varies as a function of the volume of the region considered for the feature extraction. For this purpose, an MRI phantom specifically designed for radiomic applications in the pelvic region, embedding inserts with different textures, was imaged on three scanners with a T2-weighted sequence included in the clinical protocol for the diagnosis of pelvic tumors.

2. Materials and Methods

2.1. Phantom

The radiomic phantom used for this study was described in detail in a previous article [8]. Briefly, it consists of a pelvis-shaped container filled with an aqueous solution of MnCl2 to reproduce the transverse relaxation time T2 of the abdominal muscle tissue. The phantom includes four cylindrical inserts prepared with a mixture of agar gel and polystyrene spheres to simulate the T2 average signal and the texture of female pelvic tumors. The inserts differ in the spheres’ diameter, which varies from 1 mm to 8 mm, to obtain a range of different textures. One insert is prepared with 1 mm diameter spheres only (small spheres), two inserts have 3–4 mm diameter spheres (medium spheres), and the other one contains both small, medium, and 7–8 mm diameter spheres (the latter referred to as large spheres). The phantom was imaged with an axial T2-weighted sequence on three MRI scanners, exploiting the usual setup for pelvic diagnostic imaging in clinics. The phantom was imaged at IEO European Institute of Oncology IRCCS, Milan, Italy, using a 1.5T GE Healthcare Optima MR450w scanner, and at Champalimaud Clinical Centre, Champalimaud Foundation, Lisboa, Portugal, using a 1.5T and a 3T Philips Healthcare Ingenia scanner. On each scanner, two acquisitions were performed in a test-retest setting, meaning that the phantom was positioned, scanned a first time, and scanned again after fifteen minutes without repositioning the phantom. These images, along with other acquisitions, have been previously exploited for a multicentric study on the repeatability and reproducibility of MRI radiomic features [9]. The imaging parameters are listed in Table 1.

2.2. Region-of-Interest Definition and Radiomic Feature Extraction

Three phantom inserts corresponding to three different textures were chosen for the analysis (Figure 1).
An example of the phantom imaged on each of the three scanners is shown in Figure 2.
To assess the texture-discriminative power of each radiomic feature as a function of the VOI size, six concentric cylindrical VOIs of different radii were drawn in each insert, as shown in Figure 1, on three consecutive slices placed in correspondence with the middle of the insert along the z-axis (see Supplementary Material Figure S1). For each scanner, these VOIs were used to extract radiomic features from both the test and retest scans.
Before feature extraction, intensity normalization was performed by rescaling the intensities of the different images to have a mean value of 300 and a standard deviation (s.d.) of 100. Then, for each VOI, radiomic features from the classes first-order, gray level co-occurrence matrix (GLCM), gray level run length matrix (GLRLM), gray level size zone matrix (GLSZM), neighboring gray-tone difference matrix (NGTDM), and gray level dependence matrix (GLDM) were extracted in 2D from both original and filtered images (Laplacian of Gaussian, LoG, with σ = 6 mm; wavelet; square; square root; logarithm; exponential) using PyRadiomics 3.0.1 package (available at https://github.com/AIM-Harvard/pyradiomics/releases/tag/v3.0.1, accessed on 5 January 2021) [10]. A total of 944 radiomic features were extracted for each VOI. Parameter files used for the feature extraction are provided at https://github.com/ReliabilityRadiomicsIEOFC/PhantomStudy, accessed on 5 January 2021.
The following 8 features were corrected, after calculation, for their intrinsic volume dependence, not accounted for in the package version used in this study but confirmed in the literature [4,5]: firstorder_Energy, firstorder_TotalEnergy, glrlm_GreyLevelNonUniformity, glrlm_RunLengthNonUniformity, glszm_GreyLevelNonUniformity, gldm_DependenceNonUniformity, gldm_GreyLevelNonUniformity, and ngtdm_Coarseness.
Then, only repeatable features were considered by using the results obtained by Bianchini et al. on these same test-retest images [9]. As a result, 829, 810, and 689 radiomic features were included in the subsequent analysis for scanners A, B, and C, respectively.

2.3. Radiomics Tumor Texture Discrimination at Different VOI Volume

The radiomic feature values extracted from each VOI on the test and retest images were used to determine the repeated measures’ mean and difference ( d i f f ). A similar principle to the Bland–Altman analysis [11] was used to determine the upper and lower bound variability range of each feature, related to the 95% confidence interval bounds of the Bland–Altman analysis, as shown in Equations (1) and (2),
v a r i a b i l i t y   l o w e r   b o u n d i , j , k = m e a n ( t e s t , r e t e s t ) i , j , k 1.96   d i f f ( t e s t , r e t e s t ) i , j , k
v a r i a b i l i t y   u p p e r   b o u n d i , j , k = m e a n ( t e s t , r e t e s t ) i , j , k + 1.96   d i f f ( t e s t , r e t e s t ) i , j , k ,
where i represents a specific feature, j is used to indicate an insert and is k the VOI size. These bounds define the test-retest variability range, r i , j , k , for feature i , insert j , and VOI size, k .
Then, for each feature i and VOI size k , the discrimination power, d between two different inserts, p and q , representing different tumoral textures, is given by
d p   v s .   q i , k = { 1 ,   i f   r i , p , k     r i , q , k   =   0 ,   i f   r i , p , k     r i , q , k   ,   p q   a n d   p ,   q   { 1 ,   2 ,   3 }
where d p   v s .   q i , k = 0 indicates that feature i for VOI size k does not allow the discrimination between the textures in inserts p and q , while d p   v s .   q i , k = 1 shows that this discrimination is possible.
The source code and respective data for this analysis are available at https://github.com/ReliabilityRadiomicsIEOFC/Radiomics_Size_Dependency, created on 7 March 2022.

2.4. Statistical Analysis

Several levels of aggregation were used to study (1) the overall discriminability of the insert textures by the radiomic features across VOI volumes for the different scanners, (2) the discriminability at different volumes for each feature class, and (3) the discriminability at different volumes for each filter and feature class. Spearman correlation was used to assess the correlation between discriminability and the VOI sizes, and the corresponding coefficient of determination, R-squared, and p-value were obtained. The level of significance α was set at 5%.

3. Results

Due to the high volume of data, results are presented in aggregated form. The overall discriminability of the insert textures across VOI volumes for the different scanners was obtained by contemplating the discriminability of inserts 1 vs. 2, 1 vs. 3, and 3 vs. 2 for all filters and feature classes. The percentage of discriminative features for each scanner at different VOI volumes is shown in Figure 3.
The level of aggregation was subsequently decreased to obtain the percentage of discriminative features separated by feature class at different volumes for each scanner, still aggregating the different filters and including the comparisons among all texture couples. The corresponding coefficients of determination to assess the association between the percentage of discriminative features and VOI volume were also determined. These results are shown in Figure 4. Additionally, in the Supplementary Material, Figures S2–S10 show, for each scanner, the discriminability of each radiomic feature for all filters, for different VOI volumes, this time separating for each pair of inserts. Detailed examples and comparisons are also provided in Figure S11. Similarly, Figure S12 reports the percentage of discriminative features at different volumes separated by the filter for each scanner, aggregating the different feature classes and all texture couples.
In Figure 5, the same plot as Figure 4 is reported, this time considering only the features extracted from original images without filtering. This was performed in consideration of the fact that different filters act differently on image texture (Figure S13). A similar analysis was performed for each of the applied filters, and results are shown in Supplementary Material Figures S14–S22.

4. Discussion

In this study, a phantom specifically designed for MRI radiomic studies in the pelvic region was used to investigate the dependency on VOI size of the ability of radiomic features to discriminate between different textures. Three scanners of different manufacturers and different magnetic field strengths were used to perform these assessments, aiming to understand to what extent such dependency may vary across these different settings.
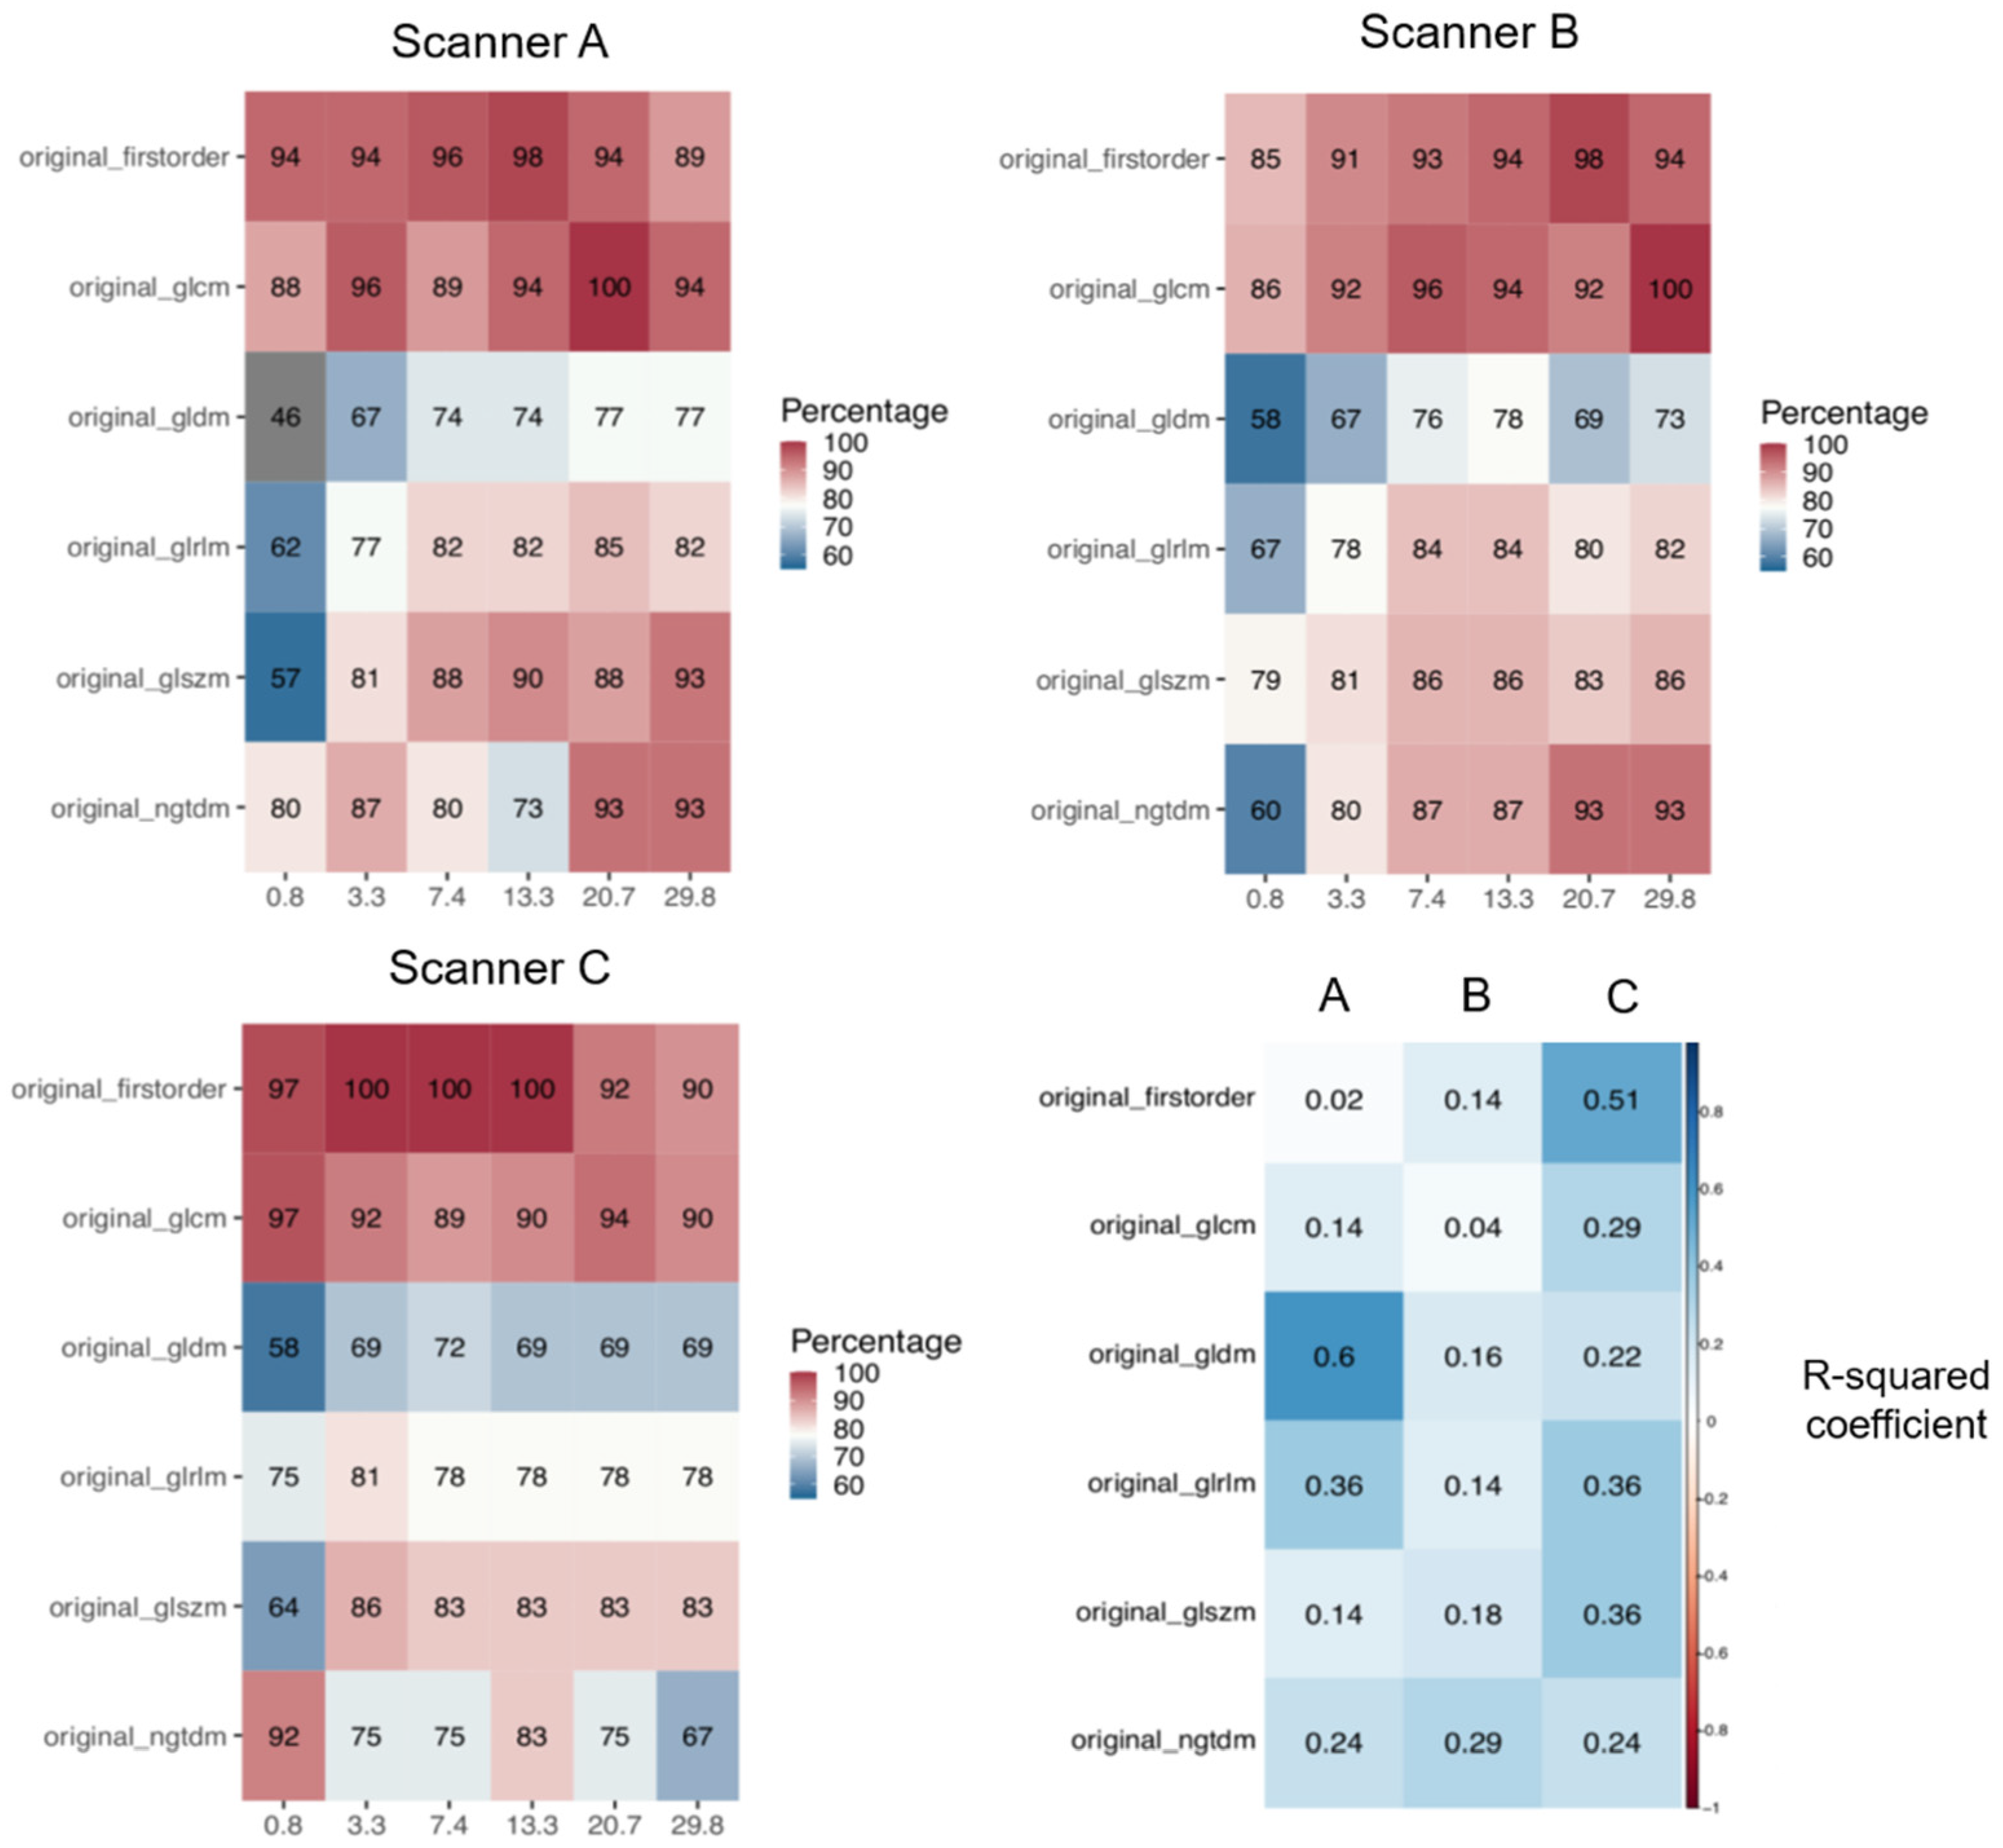
Only the radiomic features that had proved to be repeatable at test-retest imaging in a previous study performed on the same images [9] were included in this analysis. As a result, the number of analyzed features was different for the three scanners: 829 for scanner A, 810 for scanner B, and 689 for scanner C (this lower number is likely due to the increased water-fat shift artifact).
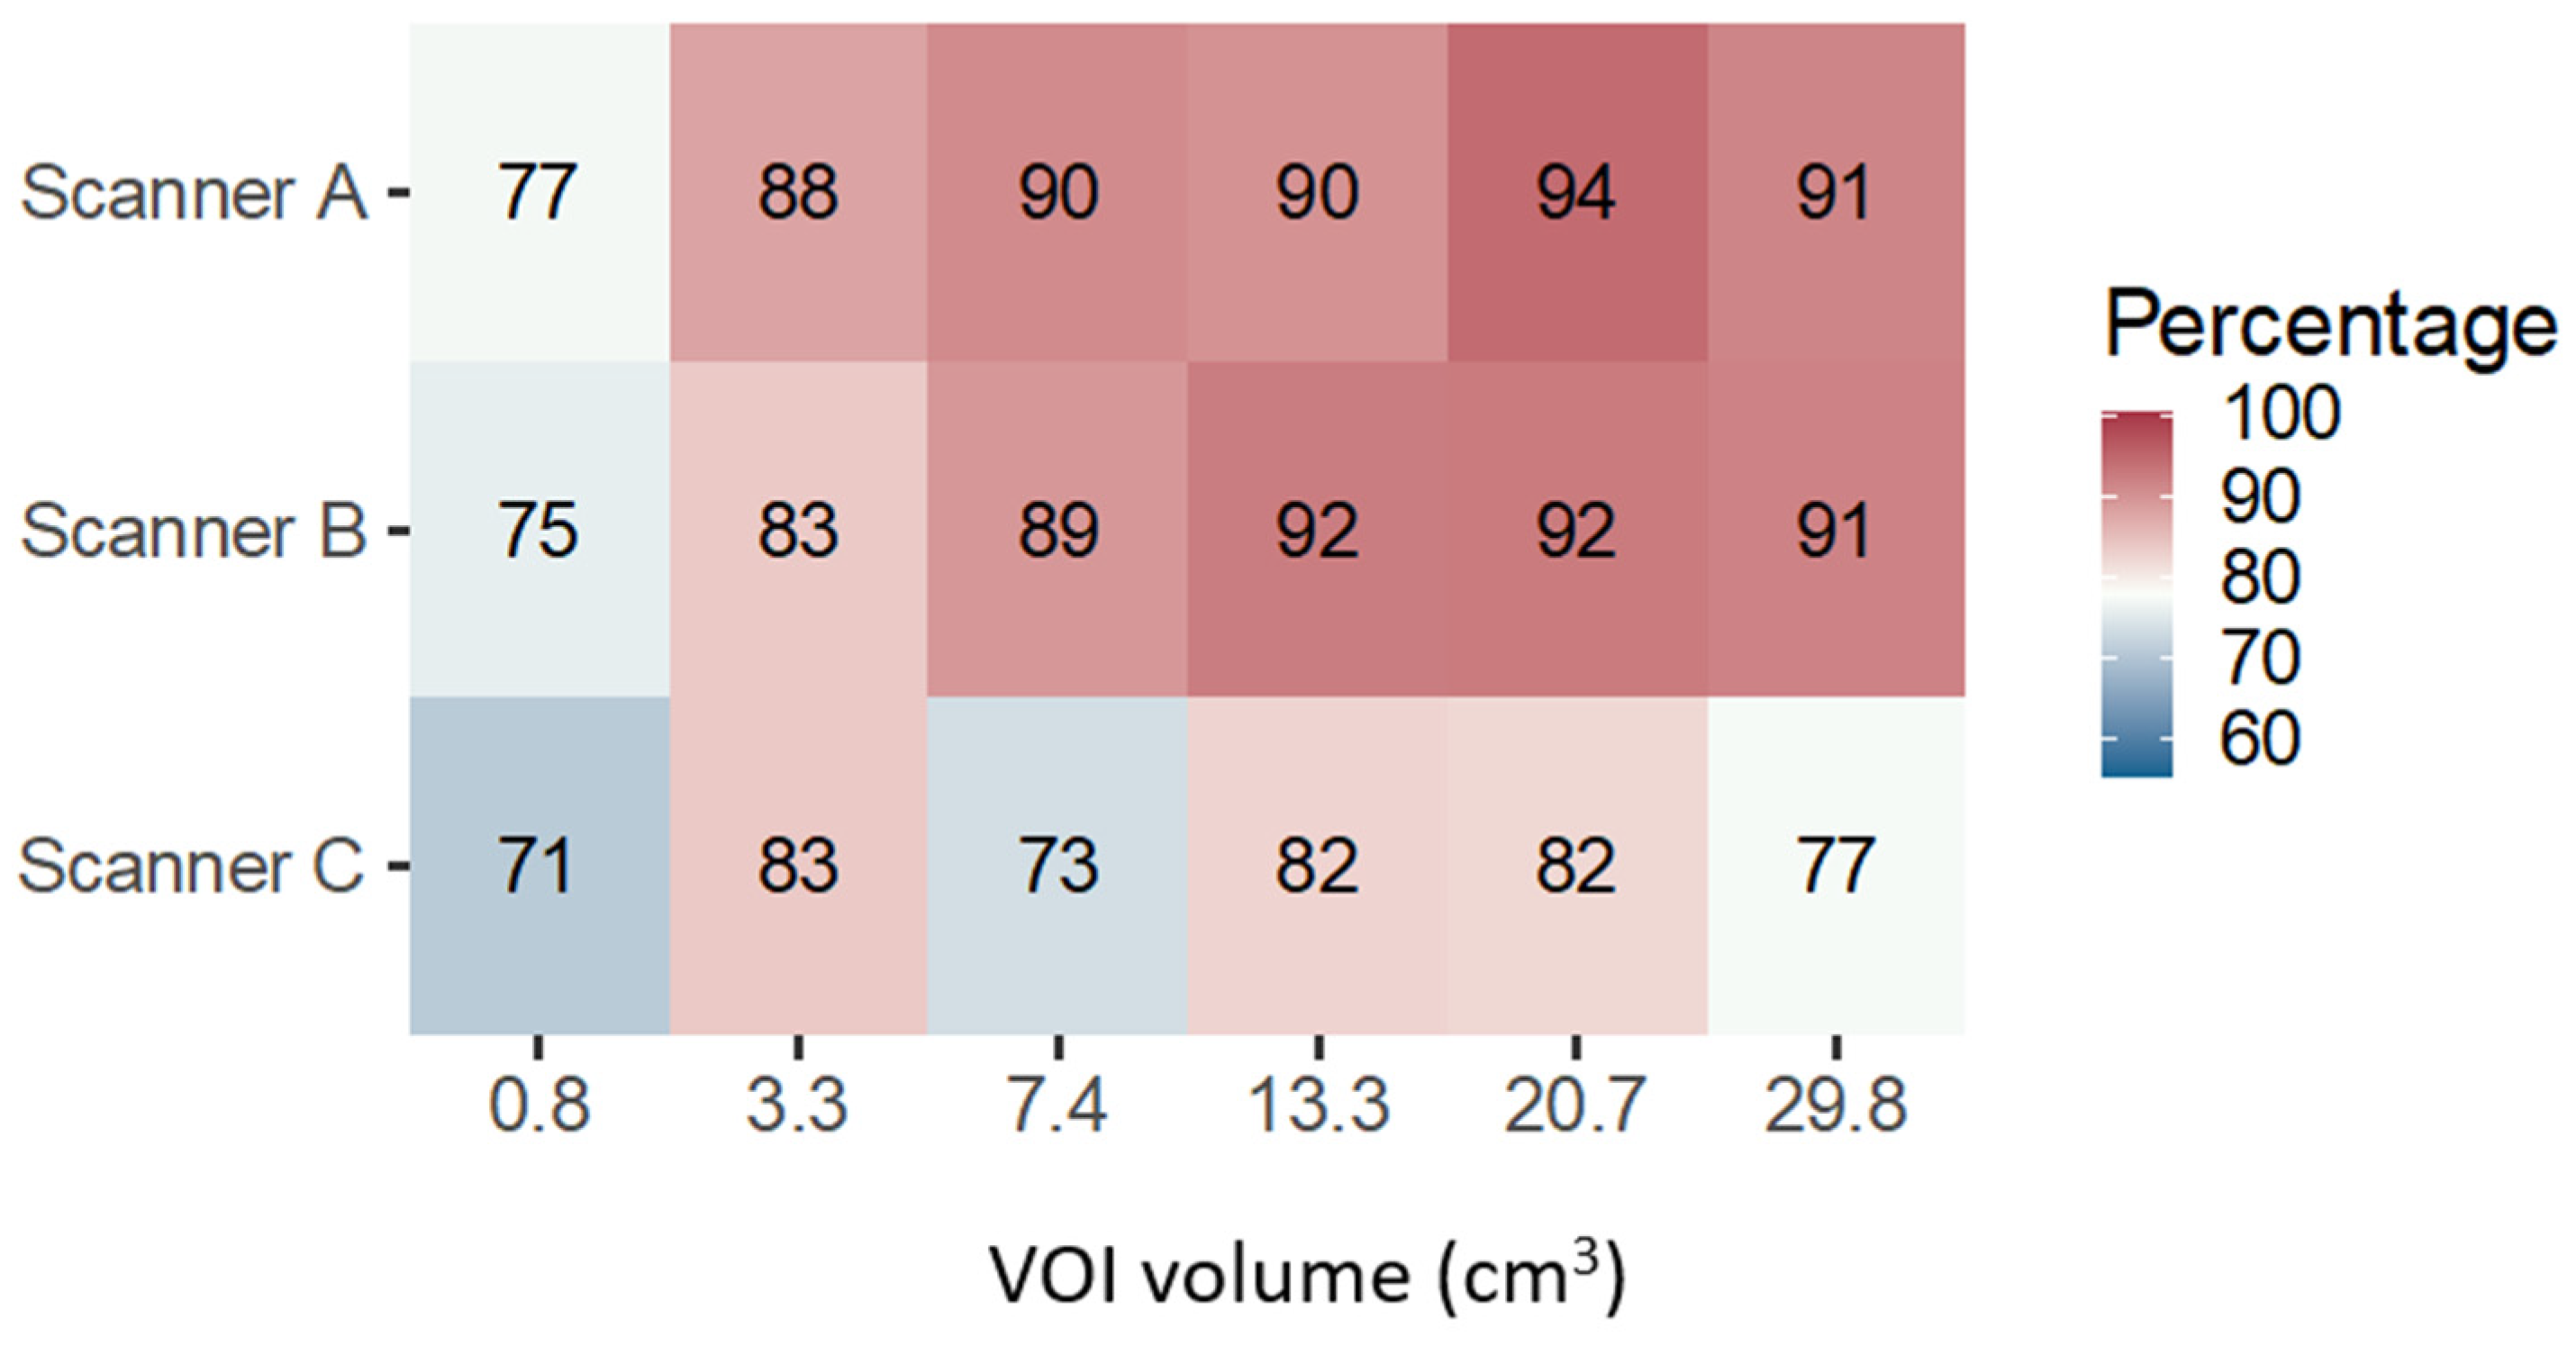
At the very first level of analysis, performed for each scanner separately, but aggregating the results for all feature classes, imaging filters, and texture couples, the main result emerged indicating that, for any scanner and VOI volume, a non-negligible fraction of features (>70%) was actually able to discriminate the different textures (Figure 3). It was also observed that the smallest volume (0.8 cm3) was less discriminative irrespectively of the scanner manufacturer and magnetic field strength; this is likely related to the reduced amount of information in the VOI (e.g., number of voxels), which might lead to inadequate sampling of the signal distribution therein, degrading the ability of the features to quantify the texture properties. Another common trend among scanners was the reduction in the proportion of discriminative features when increasing the VOI volume from 20.7 cm3 to 29.8 cm3, the latter being the largest VOI drawn in correspondence with the insert edge. In this regard, it might be argued that a slight amount of partial volume effect/background signal was included in the 29.8 cm3 VOIs, possibly affecting the value of some features, which would have been discriminative otherwise. Finally, in the volume range from 3.3 cm3 to 20.7 cm3, an increasing trend in the proportion of discriminative features with volume was found for scanners A and B, supporting the hypothesis that a volume threshold (in terms of volume, or number of voxels) does exist for each feature to become discriminative, whereas noisy results were obtained for scanner C. While the number of features being considered was already different between scanners following the repeatability study performed on [9], the percentage of discriminative features still varied across different scanners. Possible causes for such findings may be the different signal-to-noise ratios between scanners, artifacts affecting different scanners with different magnitudes, system types, e.g., digital versus analog, and coils used.
While the aggregated results captured interesting, broad, and succinct information, a more detailed analysis allows a deeper understanding and potentially provides more practical indications.
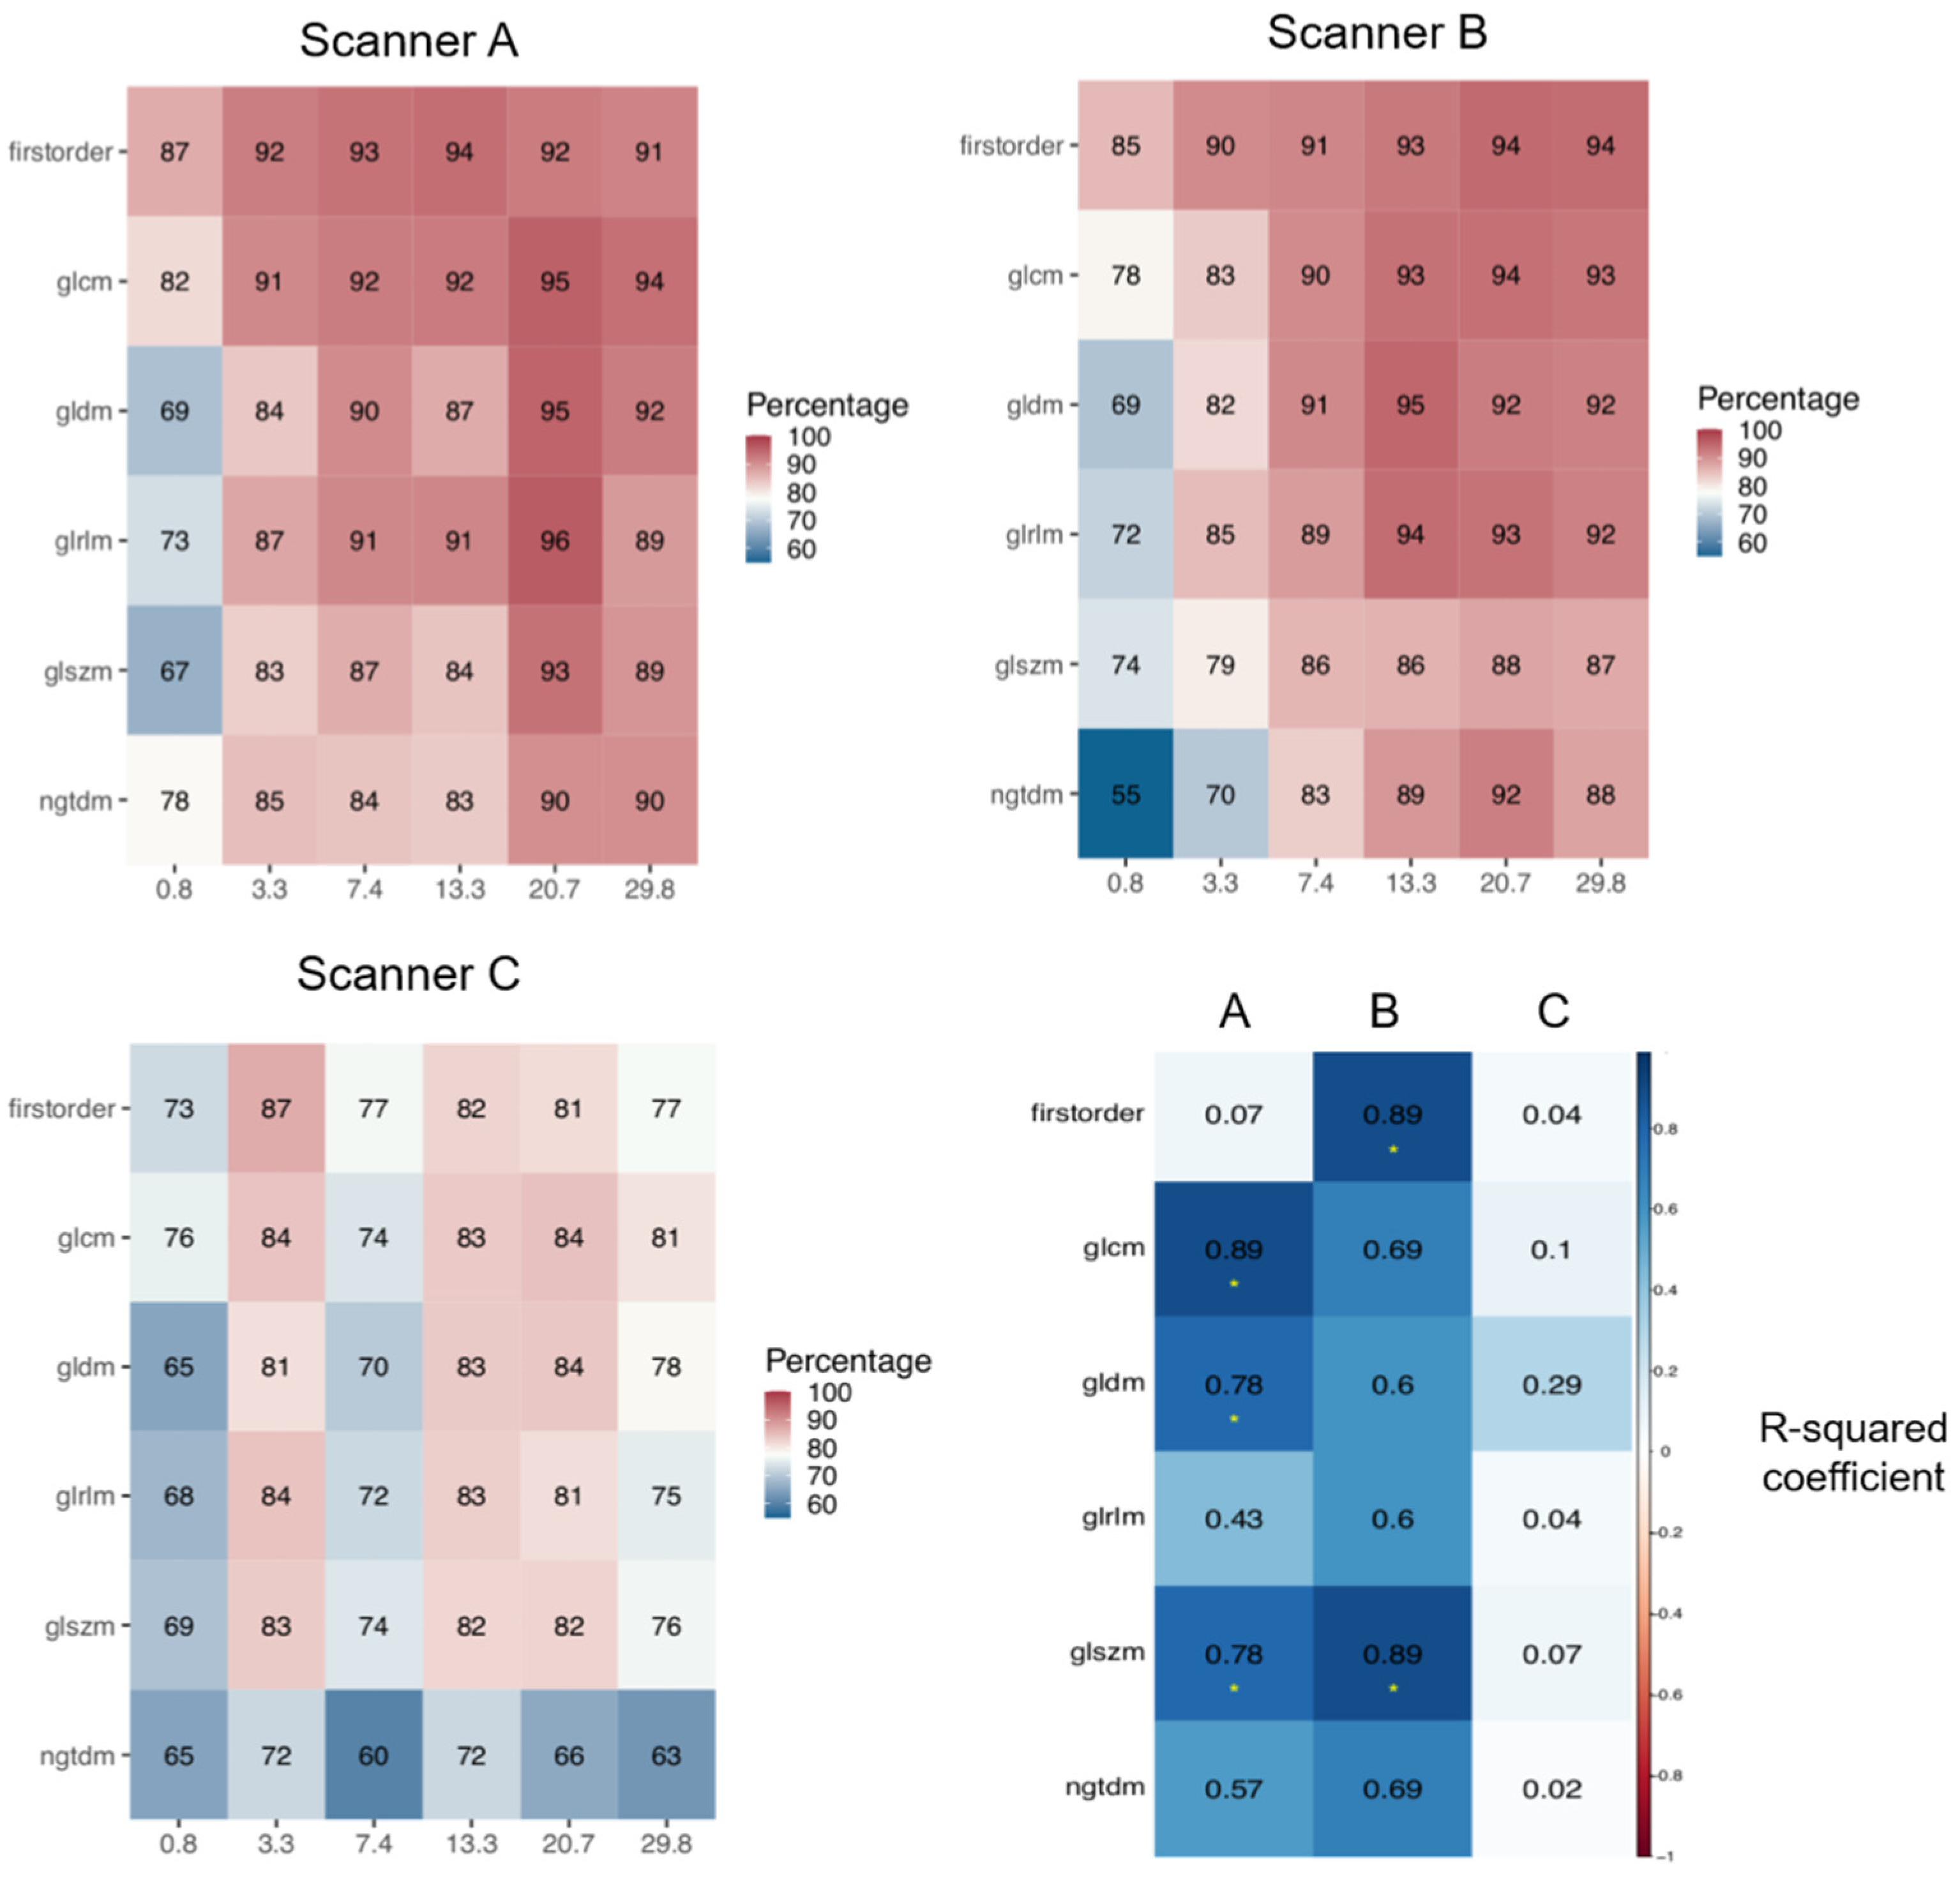
For this reason, the analysis of discriminative features was first stratified, for each scanner, according to feature class, still aggregating data by imaging filters (Figure 4). For scanners A and B, while confirming the lower discriminability of the 0.8 cm3 volume with respect to the larger volumes across all feature classes, the first-order class distinguished itself for better discrimination, even with the 0.8 cm3 volume, with >85% of discriminative features, versus 55–81% for the other classes. In addition, a monotonic trend for the percentage of discriminative features as a function of volume (R2 > 0.85) was obtained for GLCM, GLDM, and GLSZM classes for scanner A and for first-order and GLSZM classes for scanner B (Figure 4, bottom right). In the case of scanner C, a general worse performance across volumes and feature classes was obtained, with no apparent trends. Supplementary Figures S2–S10 report detailed results for each feature and separately for each couple of textures.
Aggregating data by image filters might mask some additional and informative trends. Indeed, as shown in Supplementary Figure S13, the differences among the three textures might be suppressed or highlighted by specific filters. Hence, the inability to discriminate textures of some features might be wrongly attributed to VOI size when it might be an effect of the filter instead. For this reason, in Figure 5, we report the analysis of discriminative features stratified by scanner and feature class for unfiltered (original) images only. For all scanners, a very interesting result emerged about the discriminative reliability of almost all features belonging to first-order and GLCM classes, for all volumes, without an apparent association between the percentage of discriminative features and volume (Figure 5, bottom right). According to these results, these categories should be favored when analyzing original images, especially if small volumes are present in the data set under investigation. As for the remaining feature classes, with 1.5T scanners, GLRLM, GLSZM, and NGTDM categories appear to be discriminative with a quite high percentage of features (80–93%) but only above the 3.3 cm3 volume threshold. Similar considerations can be derived for each filtered image by inspecting Supplementary Materials Figures S14–S22. As a general comment, focusing on 1.5T scanners only, for most filtered images, it can be observed that first-order and GLCM features confirm their discriminative superiority across all volumes, even the small ones. The GLDM and GLRLM features are generally less discriminative, and finally, GLSZM and NGTDM features can equal first-order and GLCM performance but in most cases for larger volumes only. The worst discriminative performance was found with the wavelet-HH filter and with the Laplacian of Gaussian (LoG) filter, in the latter case possibly due to the high sigma value considered (6 mm), resulting in a smoothing level that reduces the texture differences among inserts; different values of sigma might be investigated to improve the discriminative power of the features. Conversely, wavelet-LL filtered images, meant as an approximation of original images, which likely reduces noise and other artifacts affecting radiomic features, provided very high discriminative performance, not only confirming the results observed with first-order and GLCM features on original images but also increasing the performance of NGTDM features in the case of scanners A and B, and even of GLRLM and GLSZM features in the case of scanner B.
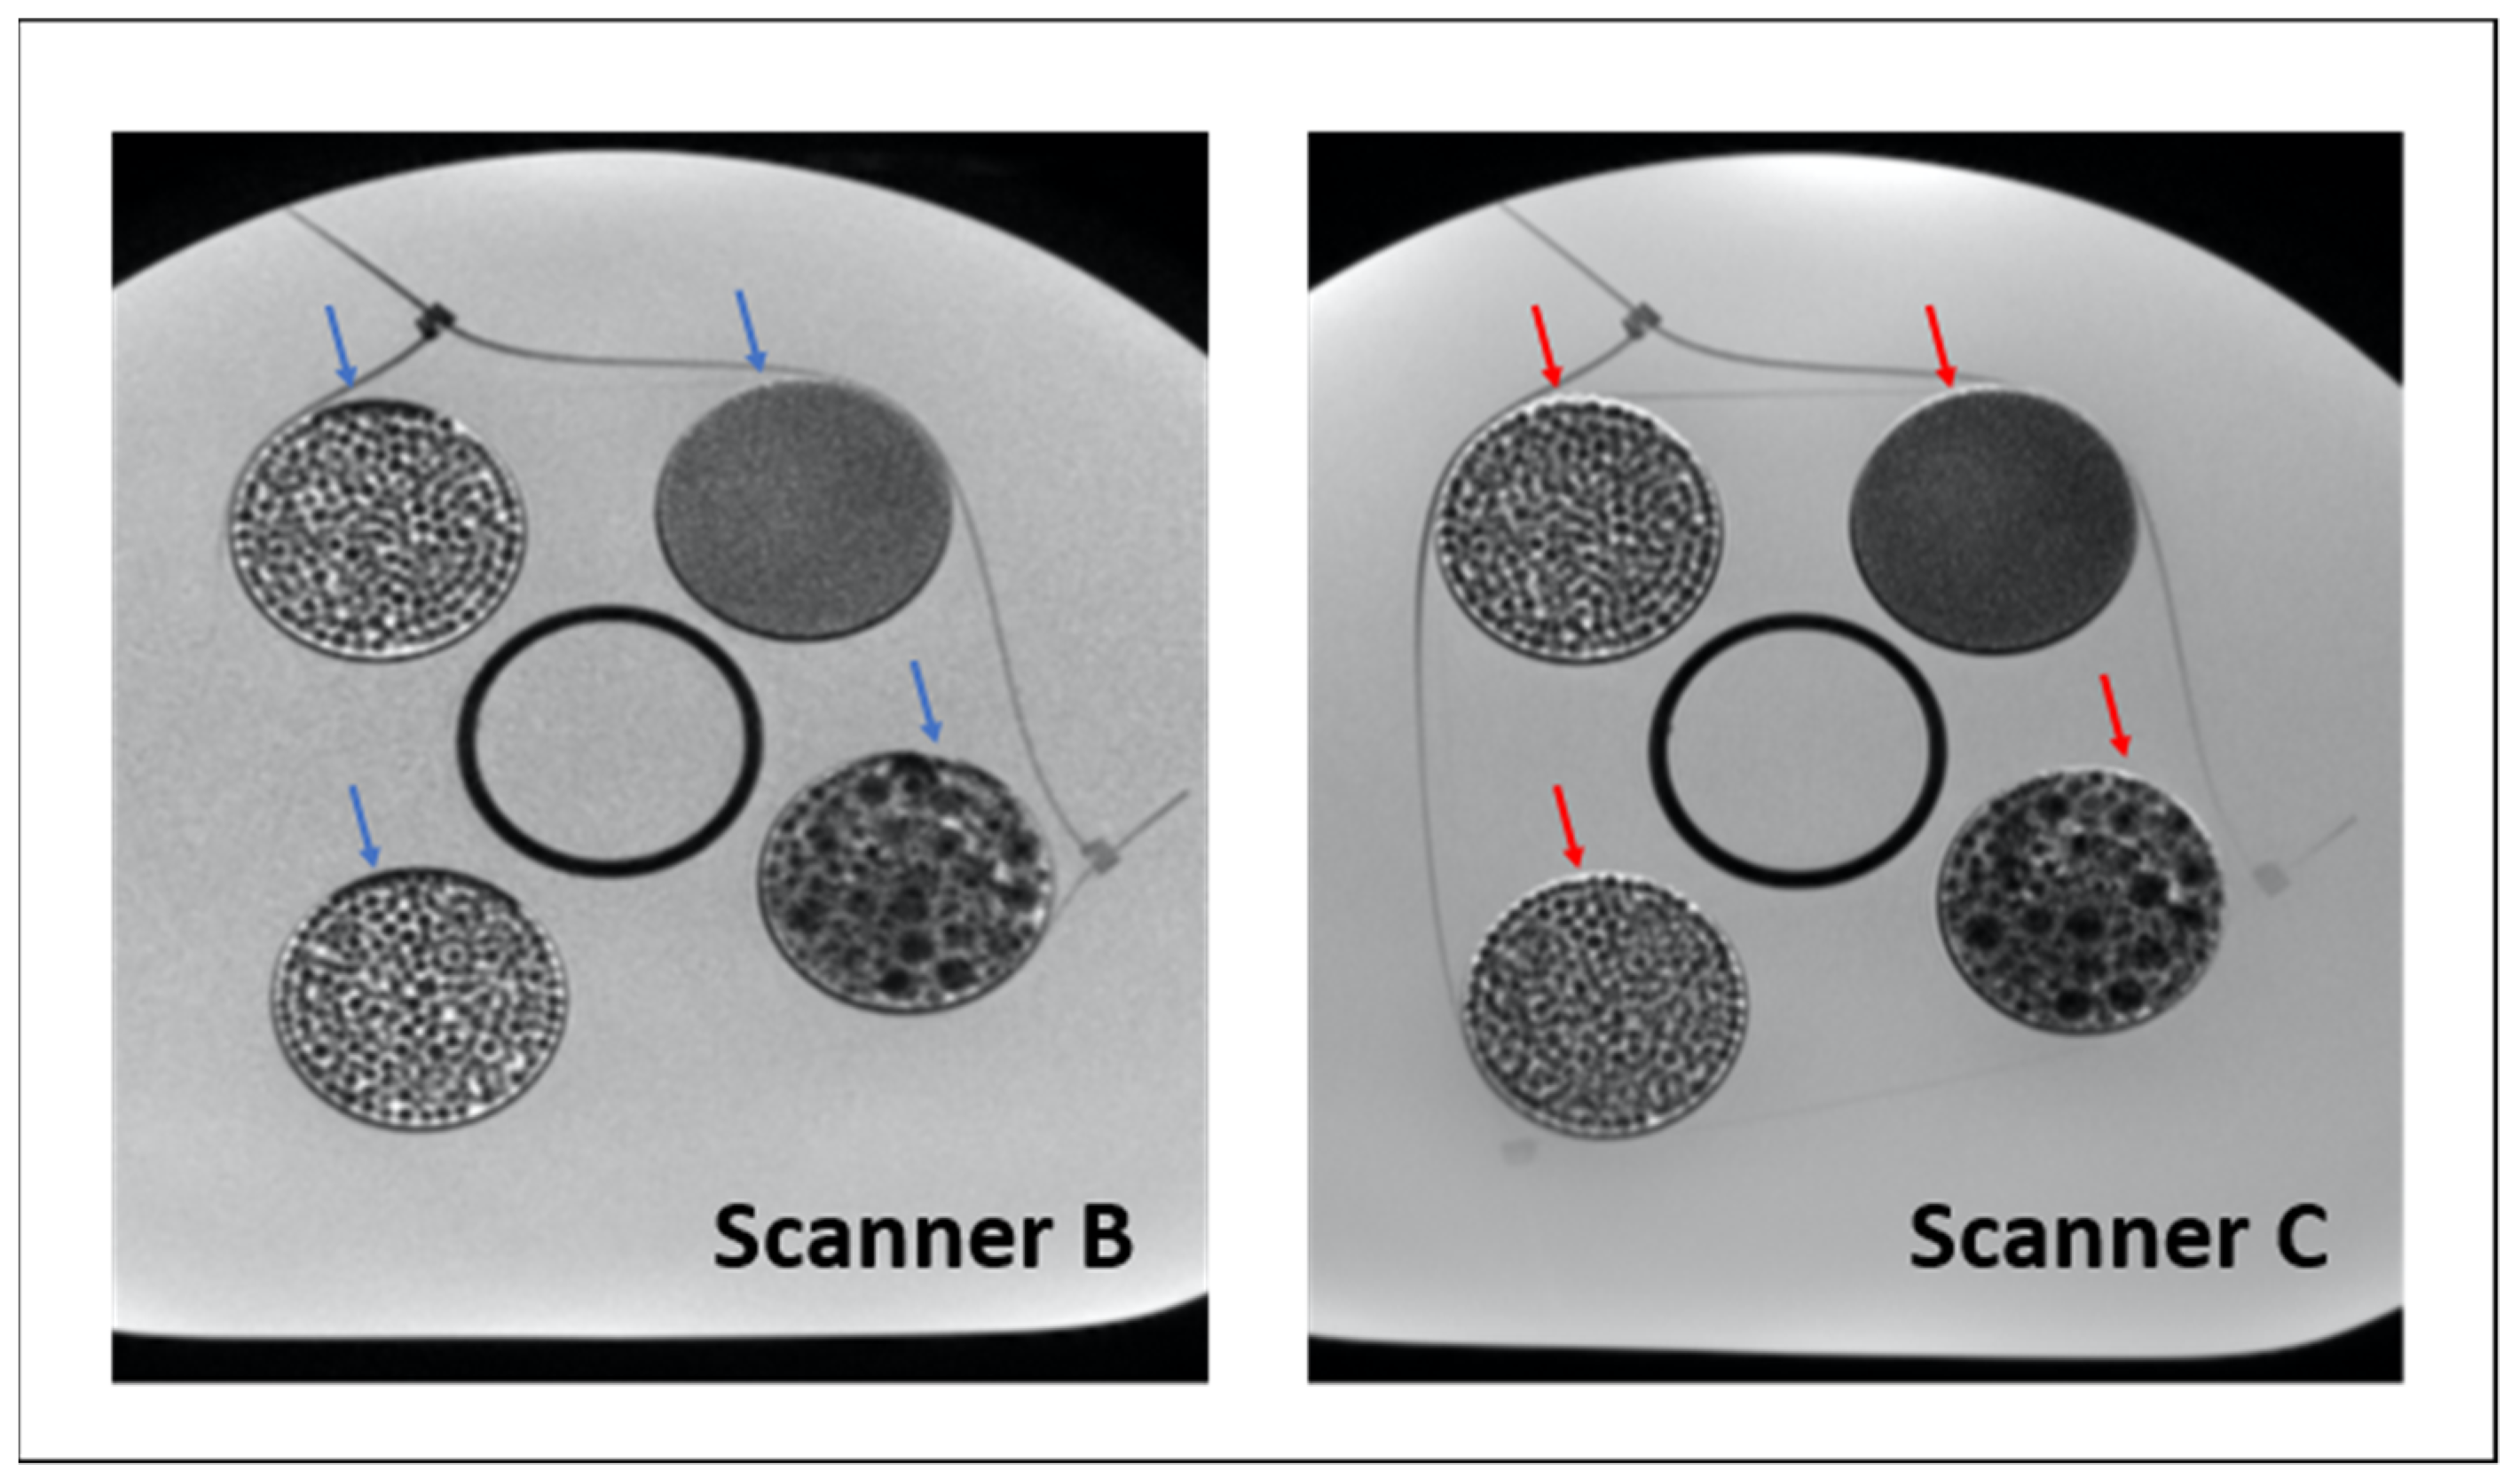
Scanner C, the 3T scanner, provided, in general, worse discriminative performance and noisier results without evidence of specific trends. More in detail, it demonstrated an overall lower discriminability of radiomic features across sizes when compared with the 1.5T scanners (scanners A and B). This result is likely due to the higher magnetic field that leads to higher water-fat shift artifacts and possibly other artifacts (related to hardware, differences of SNR, parallel imaging not used in the current study, susceptibility, and bandwidth) that may reduce the discriminative ability of radiomic features between textures, as also seen in terms of repeatability. 
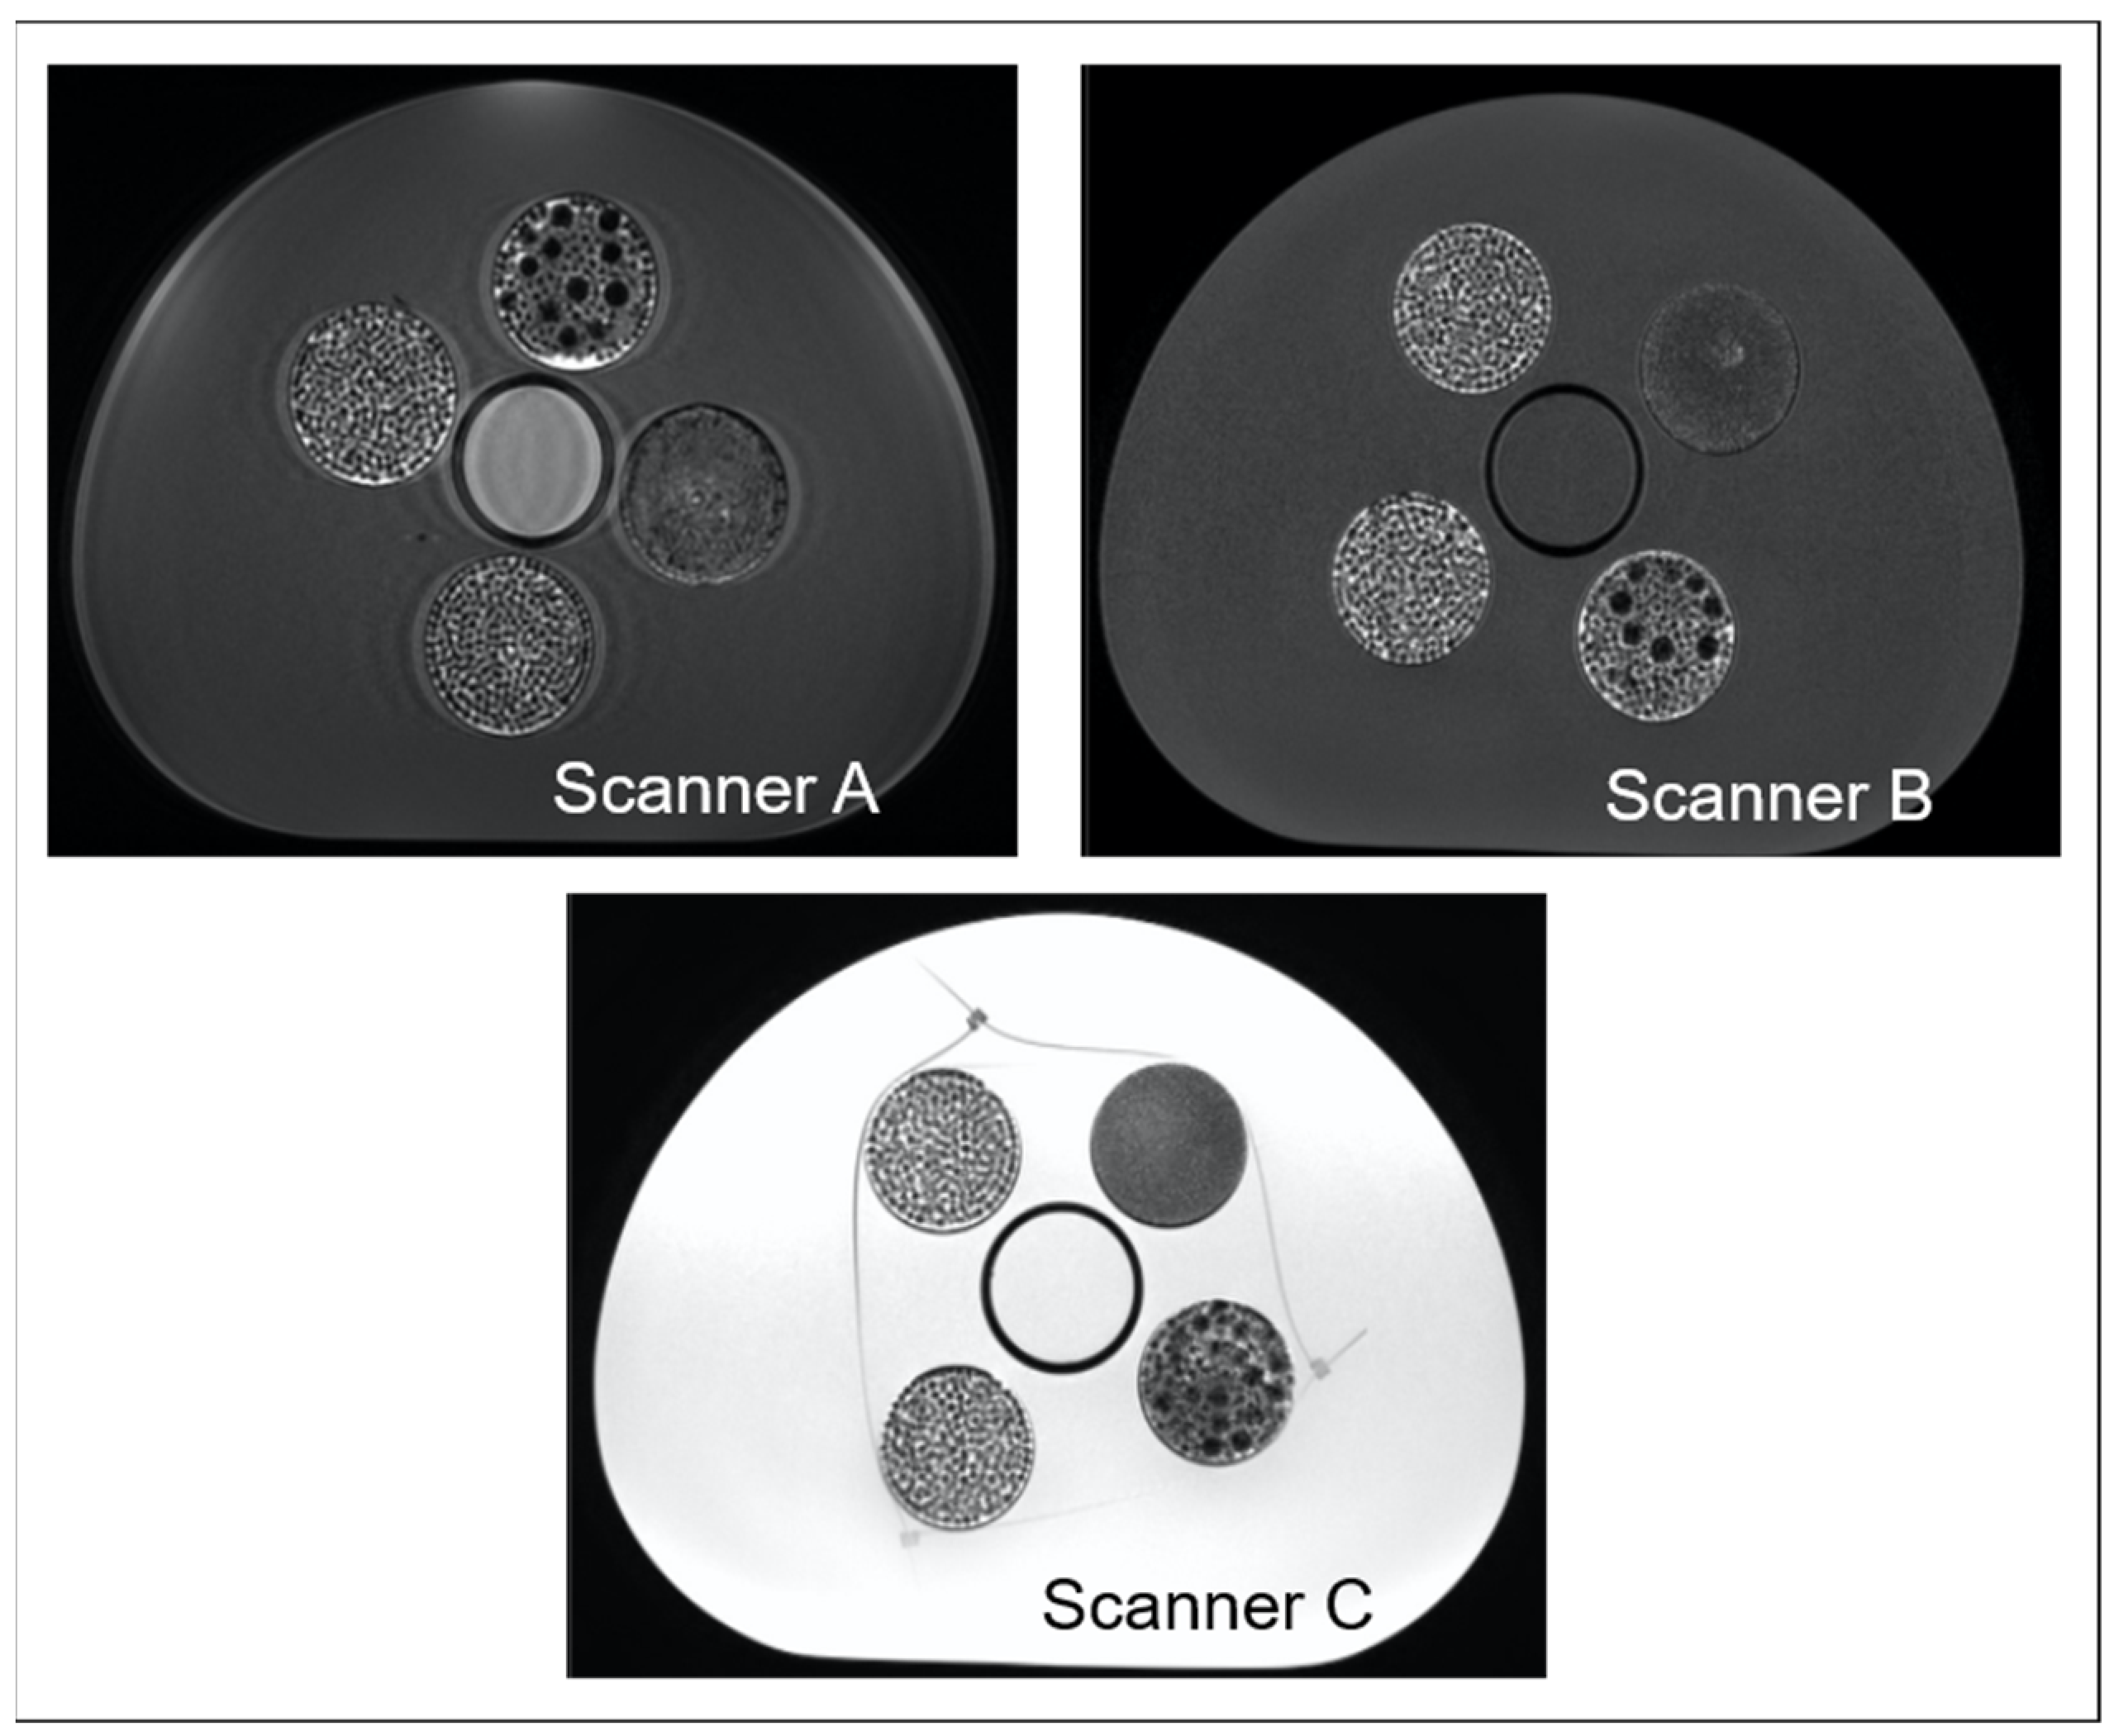
Figure 6 provides an example of the increased water-shift artifact in scanner C, particularly visible at the inserts’ edges but potentially present also within the inserts, where many interfaces occur. In addition, it appears evident, especially in the case of texture 2, that scanner C images are more blurry, which might have reduced the difference among textures, resulting in a lower ability of radiomic features to distinguish them. Hence, in the case of 3T scanners, additional investigation is required, especially with further adjustment of the bandwidth, which could reduce the chemical shift observed and improve the discriminability of radiomic features.
The results discussed so far refer to the specific settings used in this study for the calculation of features; future studies might investigate a filter-dependent optimization of such parameters, aiming to improve the ability of features to discriminate different textures at different volumes.
A similar study with both 1.5T and 3T scanners was performed by Ammari et al. [12], who acquired images of phantom embedding inserts with different textures. Radiomic features were extracted for each insert considering a fixed VOI volume (6 cm3). The authors report that texture features that are able to differentiate phantom textures were significantly influenced by field strength, in line with our findings. However, they did not report whether the number of discriminative features was higher in the case of 1.5T or 3T images, not allowing a straightforward comparison with our data. It must be highlighted, however, that to explain the different behavior of 1.5T and 3T scanners, not only the field strength has to be taken into account, but also the coil properties, which might be different between the two scanners, and the sequence parameters, which can be varied and optimized in different ways. For example, Waugh et al. [13] found comparable texture misclassification with 1.5T images and 3T images acquired with a high temporal resolution and low spatial resolution sequence, whereas misclassification at 3T was notably reduced when using a high spatial resolution sequence. In our study, 3T images were acquired with the same acquisition parameters used on the 1.5T scanner from the same vendor.
In general terms, these data are a first attempt to quantify to what extent the ability of radiomic features to discriminate different textures depends on the VOI size, the textures to be discriminated, the magnetic field strength, the radiomic feature, and the image filter type, in case of T2-weighted imaging of pelvic region. Despite not being directly generalizable to every clinical scenario, they are important for offering the first guide in the absence of more adequate data and, most importantly, for setting the basis and methodology for further investigation. To allow other researchers to adapt this analysis to their clinical scenario, the source code and data files used in this study are publicly available in the Github repository: https://github.com/ReliabilityRadiomicsIEOFC/Radiomics_Size_Dependency, created on 7 March 2022.
Aiming at a clinical application of radiomics, especially in the case of the classical radiomic approach with the calculation of handcrafted radiomic features, it should be of paramount importance to assess these dependencies before designing a new radiomic study, along with other methodological investigations such as radiomic feature repeatability and reproducibility upon image acquisition and reconstruction parameters. If available, such information would allow customizing the patient inclusion criteria, setting a threshold/range to the size of the regions that can be properly investigated with radiomics, and would guide the choice of the most suitable image filter and feature categories for each study, avoiding an unnecessary proliferation of the parameters calculated from the images. Conversely, in the absence of this information, noise could be introduced, which might ultimately mask the information radiomics is expected to quantify and prevent the possibility of identifying useful associations between radiomic features and clinically relevant information.
Despite its relevance, this issue has not been extensively investigated in the case of MRI, probably due to the lack of suitable phantoms to perform systematic acquisitions under controlled settings. Jensen et al. [14] investigated the stability of radiomic features across different VOI sizes using a homogeneous phantom and evidenced the need to repeat the analysis with heterogeneous objects to allow clinical translation of the phantom results. Ammari et al. [12] developed a phantom with heterogeneous objects, but they considered one VOI volume only. To assess the volume dependency, instead, it is necessary not only to have objects with different textures, possibly simulating the texture of the tissues under investigation in the clinical application, but also that each object is homogeneous and large enough to incorporate different VOIs with different volumes but fixed texture. In this sense, the phantom developed by our group appears suitable for the purpose, even if the pattern within each insert is not obtained via replication of a texture kernel to increasingly larger volumes, as would be more appropriate, and even if until now only texture 1—small spheres—was demonstrated to be comparable to a real clinical scenario (gynecological diseases [
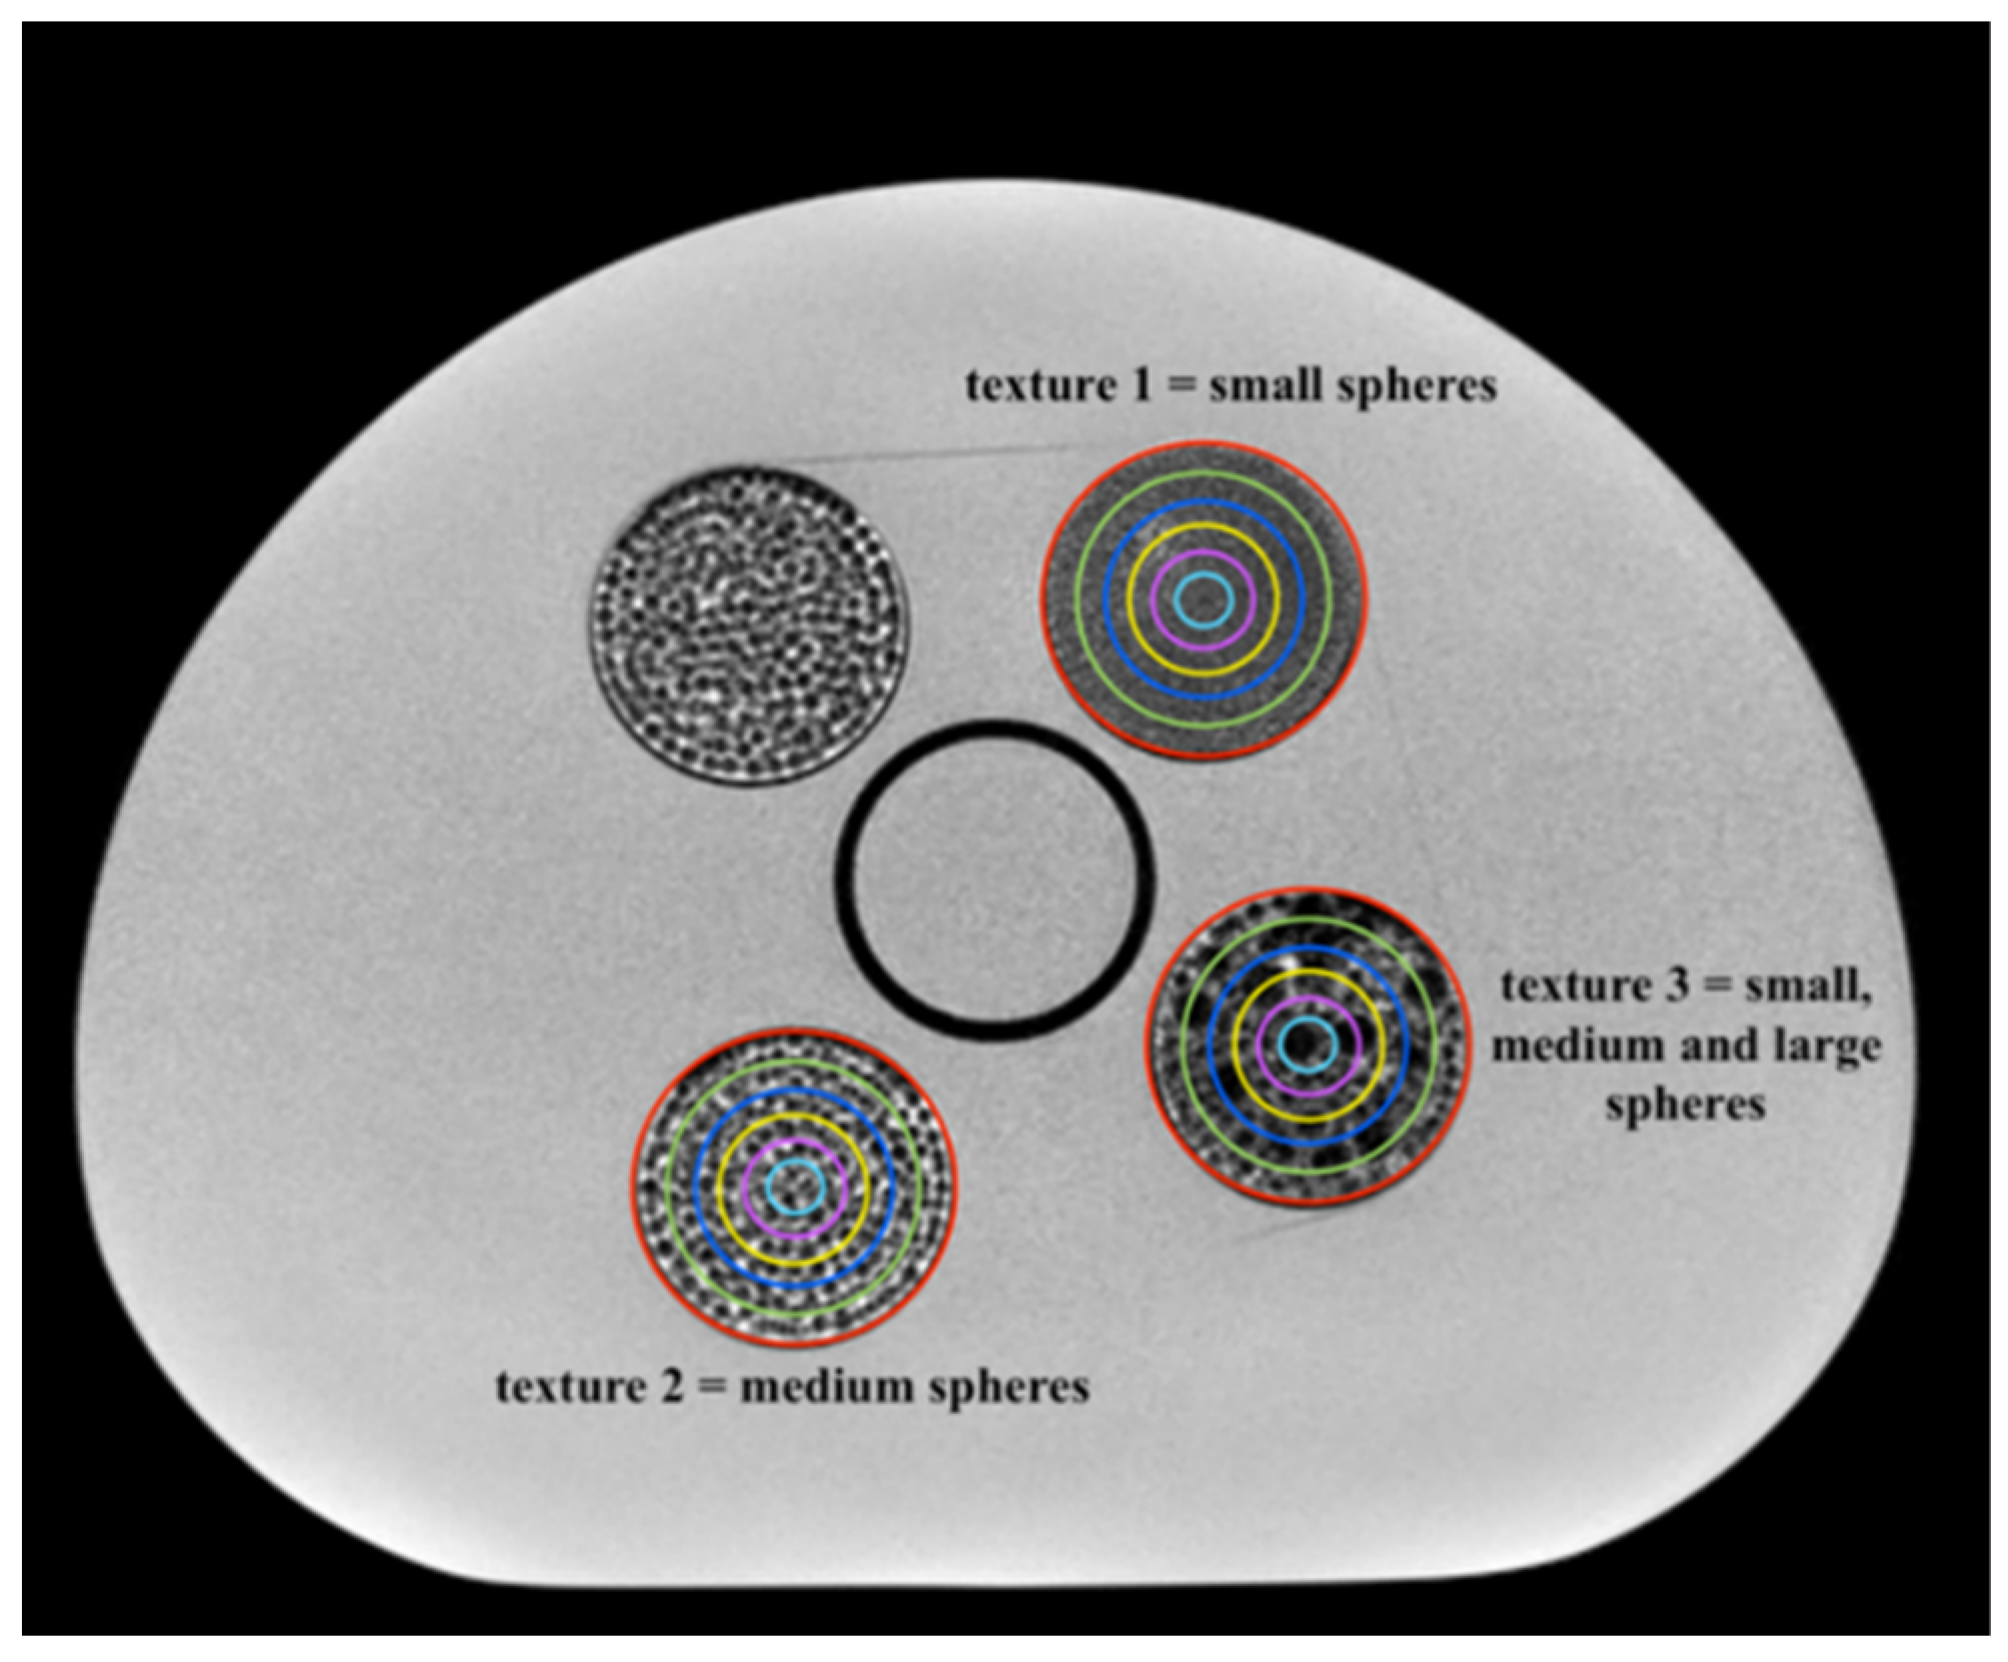
8]). Nonetheless, despite these two limitations, this phantom incorporates three textures that are different by construction, a difference that radiomic features should theoretically be able to reflect. In addition, despite the random distribution of small, medium, and large spheres in each insert, it is still true that the textures within different VOIs of the same insert are far more similar among them than the textures within VOIs drawn on different inserts. For these reasons, important information can be obtained from this phantom prototype, laying the basis for further studies, possibly with improved phantom versions to match more closely specific clinical scenarios.

Supplementary Materials

The following supporting information can be downloaded at: https://www.mdpi.com/article/10.3390/app12115465/s1.

Author Contributions

Conceptualization, F.B., D.O., M.C. and A.L.; methodology, J.S., L.B., M.F., C.M., A.L., N.P. and F.B.; software, J.S. and L.B.; validation, J.S., L.B., M.F., A.L., N.P. and F.B.; formal analysis, J.S. and L.B.; investigation, J.S., L.B., F.B. and D.O.; resources, J.S., L.B., A.L., C.M. and M.C.; data curation, J.S. and L.B.; writing—original draft preparation, J.S. and L.B.; writing—review and editing, J.S., L.B., F.B., D.O. and M.C.; visualization, J.S., L.B., F.B., D.O., A.L., M.F., C.M. and N.P.; supervision, F.B. and D.O.; project administration, F.B., D.O., A.L., M.C. and B.A.J.-F.; funding acquisition, M.C. and B.A.J.-F. All authors have read and agreed to the published version of the manuscript.

Funding

The work was partially supported by the Italian Ministry of Health with Ricerca Corrente and 5x1000 funds. Part of the research leading to these results has received funding from the European Union’s Horizon 2020 research and innovation program under grant agreement No. 952159 (ProCAncer-I).

Institutional Review Board Statement

Not applicable.

Informed Consent Statement

Not applicable.

Data Availability Statement

The data presented in this study are openly available at https://github.com/ReliabilityRadiomicsIEOFC/Radiomics_Size_Dependency, accessed on 5 January 2021. The source code used for the analysis of this data is also provided in the same repository. Parameter files used for the feature extraction are provided at https://github.com/ReliabilityRadiomicsIEOFC/PhantomStudy, created on 7 March 2022.

Acknowledgments

The authors thank Nuno Loução, Philips’ Clinical Scientist and Product Specialist MR for his insights used in the Discussion. In addition, the authors thank the Breast Radiology Division of the European Institute of Oncology for providing access to the 1.5T GE scanner for phantom measurements.

Conflicts of Interest

The authors declare no conflict of interest.

References

  1. Lambin, P.; Rios-Velazquez, E.; Leijenaar, R.; Carvalho, S.; van Stiphout, R.G.P.M.; Granton, P.; Zegers, C.M.L.; Gillies, R.; Boellard, R.; Dekker, A.; et al. Radiomics: Extracting more information from medical images using advanced feature analysis. Eur. J. Cancer 2012, 48, 441–446. [Google Scholar] [CrossRef] [PubMed] [Green Version]
  2. Aerts, H.J.W.L.; Velazquez, E.R.; Leijenaar, R.T.H.; Parmar, C.; Grossmann, P.; Carvalho, S.; Bussink, J.; Monshouwer, R.; Haibe-Kains, B.; Rietveld, D.; et al. Decoding tumour phenotype by noninvasive imaging using a quantitative radiomics approach. Nat. Commun. 2014, 5, 4006. [Google Scholar] [CrossRef] [PubMed]
  3. Gillies, R.J.; Kinahan, P.E.; Hricak, H. Radiomics: Images Are More than Pictures, They Are Data. Radiology 2016, 278, 563–577. [Google Scholar] [CrossRef] [PubMed] [Green Version]
  4. Fave, X.; Zhang, L.; Yang, J.; Mackin, D.; Balter, P.; Gomez, D.; Followill, D.; Jones, A.K.; Stingo, F.; Court, L.E. Impact of image preprocessing on the volume dependence and prognostic potential of radiomics features in non-small cell lung cancer. Transl. Cancer Res. 2016, 5, 349–363. [Google Scholar] [CrossRef] [Green Version]
  5. Shafiq-Ul-Hassan, M.; Zhang, G.G.; Latifi, K.; Ullah, G.; Hunt, D.C.; Balagurunathan, Y.; Abdalah, M.A.; Schabath, M.; Goldgof, D.G.; Mackin, D.; et al. Intrinsic dependencies of CT radiomic features on voxel size and number of gray levels. Med. Phys. 2017, 44, 1050–1062. [Google Scholar] [CrossRef] [PubMed]
  6. Brooks, F.J.; Grigsby, P.W. Current measures of metabolic heterogeneity within cervical cancer do not predict disease outcome. Radiat. Oncol. 2011, 6, 69. [Google Scholar] [CrossRef] [PubMed] [Green Version]
  7. Brooks, F.J.; Grigsby, P.W. The Effect of Small Tumor Volumes on Studies of Intratumoral Heterogeneity of Tracer Uptake. J. Nucl. Med. 2014, 55, 37–42. [Google Scholar] [CrossRef] [PubMed] [Green Version]
  8. Bianchini, L.; Botta, F.; Origgi, D.; Rizzo, S.; Mariani, M.; Summers, P.; García-Polo, P.; Cremonesi, M.; Lascialfari, A. PETER PHAN: An MRI phantom for the optimisation of radiomic studies of the female pelvis. Phys. Med. 2020, 71, 71–81. [Google Scholar] [CrossRef] [PubMed]
  9. Bianchini, L.; Santinha, J.; Loução, N.; Figueiredo, M.; Botta, F.; Origgi, D.; Cremonesi, M.; Cassano, E.; Papanikolaou, N.; Lascialfari, A. A multicenter study on radiomic features from T2-weighted images of a customized MR pelvic phantom setting the basis for robust radiomic models in clinics. Magn. Reson. Med. 2021, 85, 1713–1726. [Google Scholar] [CrossRef] [PubMed]
  10. van Griethuysen, J.J.M.; Fedorov, A.; Parmar, C.; Hosny, A.; Aucoin, N.; Narayan, V.; Beets-Tan, R.G.H.; Fillion-Robin, J.-C.; Pieper, S.; Aerts, H.J.W.L. Computational radiomics system to decode the radiographic phenotype. Cancer Res. 2017, 77, e104–e107. [Google Scholar] [CrossRef] [PubMed] [Green Version]
  11. Altman, D.G.; Bland, J.M. Measurement in medicine: The analysis of method comparison studies. Statistician 1983, 32, 307–317. [Google Scholar] [CrossRef]
  12. Ammari, S.; Pitre-Champagnat, S.; Dercle, L.; Chouzenoux, E.; Moalla, S.; Reuze, S.; Talbot, H.; Mokoyoko, T.; Hadchiti, J.; Diffetocq, S.; et al. Influence of Magnetic Field Strength on Magnetic Resonance Imaging Radiomics Features in Brain Imaging, an In Vitro and In Vivo Study. Front. Oncol. 2021, 10, 2950. [Google Scholar] [CrossRef] [PubMed]
  13. Waugh, S.A.; Lerski, R.A.; Bidaut, L.; Thompson, A.M. The influence of field strength and different clinical breast MRI protocols on the outcome of texture analysis using foam phantoms. Med. Phys. 2011, 38, 5058–5066. [Google Scholar] [CrossRef] [PubMed] [Green Version]
  14. Jensen, L.; Kim, D.; Elgeti, T.; Steffen, I.; Hamm, B.; Nagel, S. Stability of Radiomic Features across Different Region of Interest Sizes—A CT and MR Phantom Study. Tomography 2021, 7, 238–252. [Google Scholar] [CrossRef] [PubMed]
Figure 1. MR representation of the inserts embedded in the phantom, with corresponding textures and VOIs placement. Three phantom inserts were chosen as representative of three textures, from a finer texture (1) to a coarser one (3) through a medium texture (2). The volumes of the selected VOIs were: 29.8 cm3 (red), 20.7 cm3 (green), 13.3 cm3 (blue), 7.4 cm3 (yellow), 3.3 cm3 (pink), and 0.8 cm3 (cyan). Window width/window level for the image: 1970/1165.
Applsci 12 05465 g001
Figure 2. MR representation of the inserts embedded in the phantom on different scanners. On top left, the representation obtained on scanner A is shown. The representation obtained on scanner B is shown on top right, while the representation obtained on scanner C is shown at the bottom. NOTE: differences in background between scanner C and scanners A and B are due to the replacement of the aqueous solution of MnCl2 by phantom oil (Spectrasyn 4 phantom oil; Philips Healthcare; T1 = 230 ms and T2 = 194 ms at 3T) to avoid dielectric artifacts intensified at higher field [9]. Window width/window level for the image of scanner A: 2175/1088; window width/window level for the image of scanner B: 43,380/22,690; window width/window level for the image of scanner C: 2208/1044.
Applsci 12 05465 g002
Figure 3. Overall percentage of features discriminative at different volumes for each scanner.
Applsci 12 05465 g003
Figure 4. Overall percentage of features discriminative at different volumes for each feature class in scanners A (top left), B (top right), and C (bottom left). At bottom right, coefficient of determination, R-squared, of the percentage of discriminative features explained by the volume for each scanner.
Applsci 12 05465 g004
Figure 5. Overall percentage of features discriminative at different volumes for each feature class extracted from the original images in scanners A (top left), B (top right), and C (bottom left). At bottom right, coefficient of determination, R-squared, of the percentage of discriminative features explained by the volume for each scanner.
Applsci 12 05465 g005
Figure 6. Comparison between water-fat shift artifacts between scanner B (left) and scanner C (right). Arrows in blue indicate the overlap region of the artifact for different inserts in scanner B. Arrows in red indicate the overlap region of the artifact for different inserts in scanner C. Window width/window level for the image of scanner B: 1970/1165; window width/window level for the image of scanner C: 2208/1104.
Applsci 12 05465 g006
Table 1. Scanner properties and imaging parameters. TR = repetition time; TE = echo time; FoV = field of view; FRFSE = fast recovery fast spin echo; FSE = fast spin echo.
ScannerField Strength (T)VendorModelSequenceTR (ms)TE (ms)Slice Thickness (mm)Slice Spacing (mm)Pixel Spacing (mm)FoV
(mm × mm)
A1.5GEOptima MR450wFRFSE476310955.50.6 × 0.6320 × 320
B1.5PhilipsIngeniaFSE375090550.6 × 0.6340 × 340
C3PhilipsIngeniaFSE375090550.6 × 0.6340 × 340
Publisher’s Note: MDPI stays neutral with regard to jurisdictional claims in published maps and institutional affiliations.

