
Detection of Walking Features Using Mobile Health and Deep Learning


Abstract
1. Introduction
2. Experiment Methods
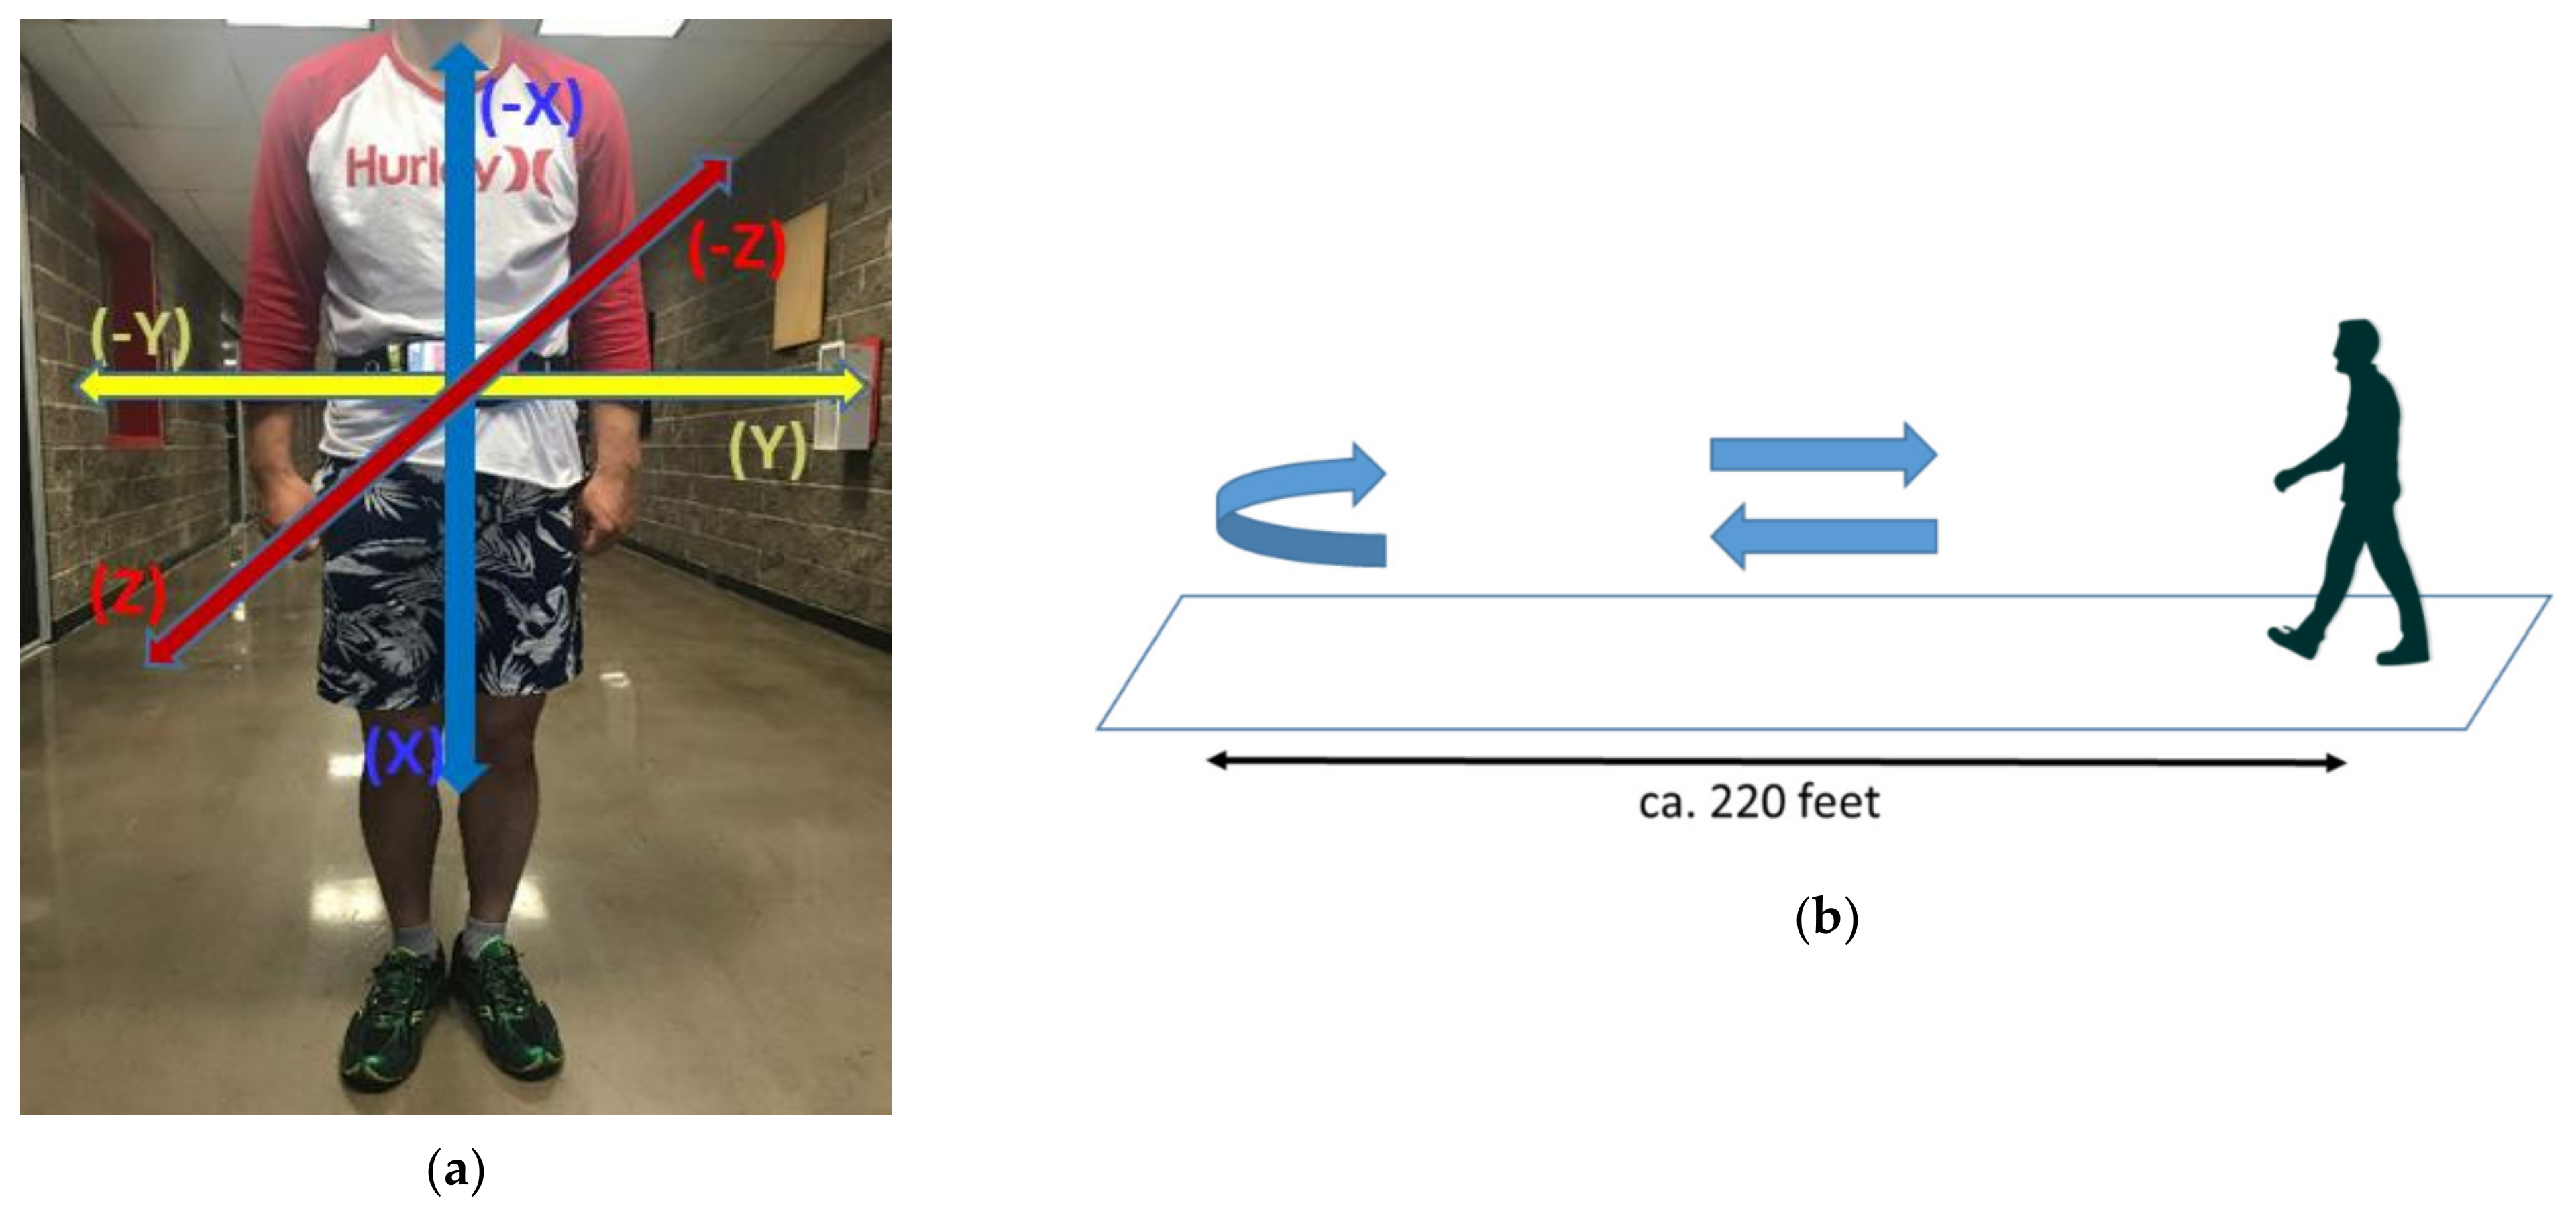
2.1. Mobile Health Application
2.2. Data Collection
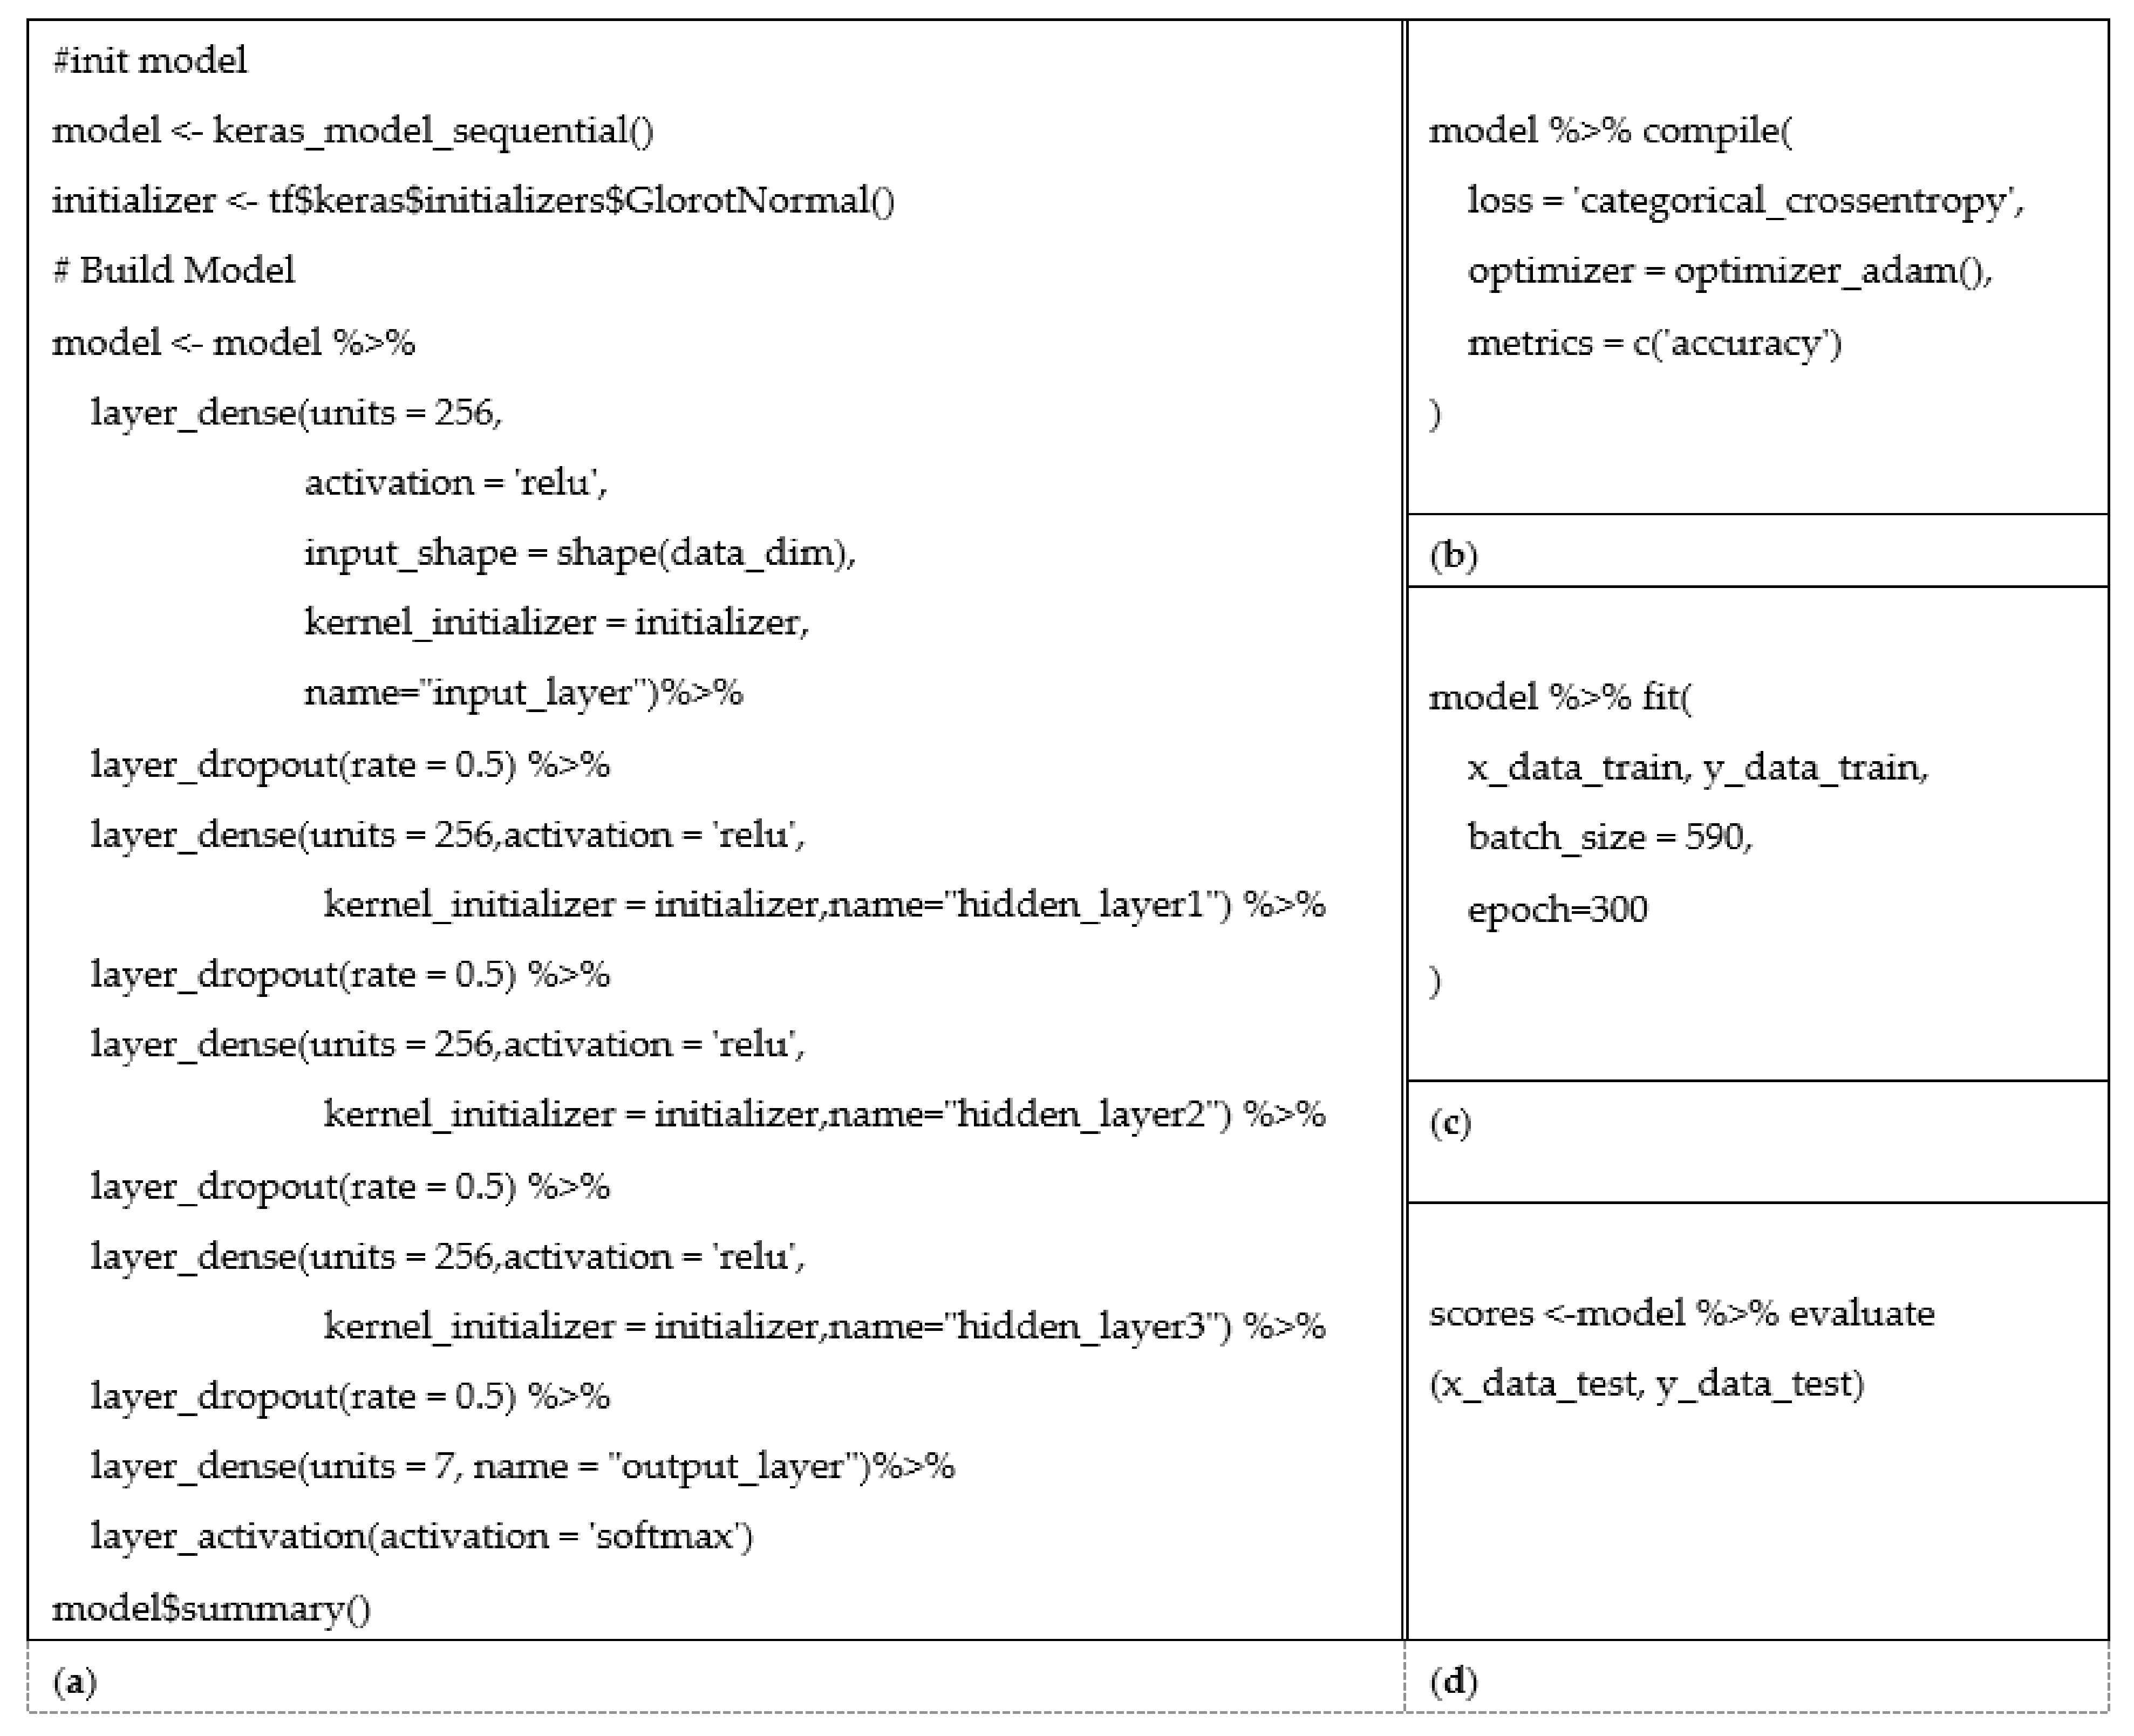
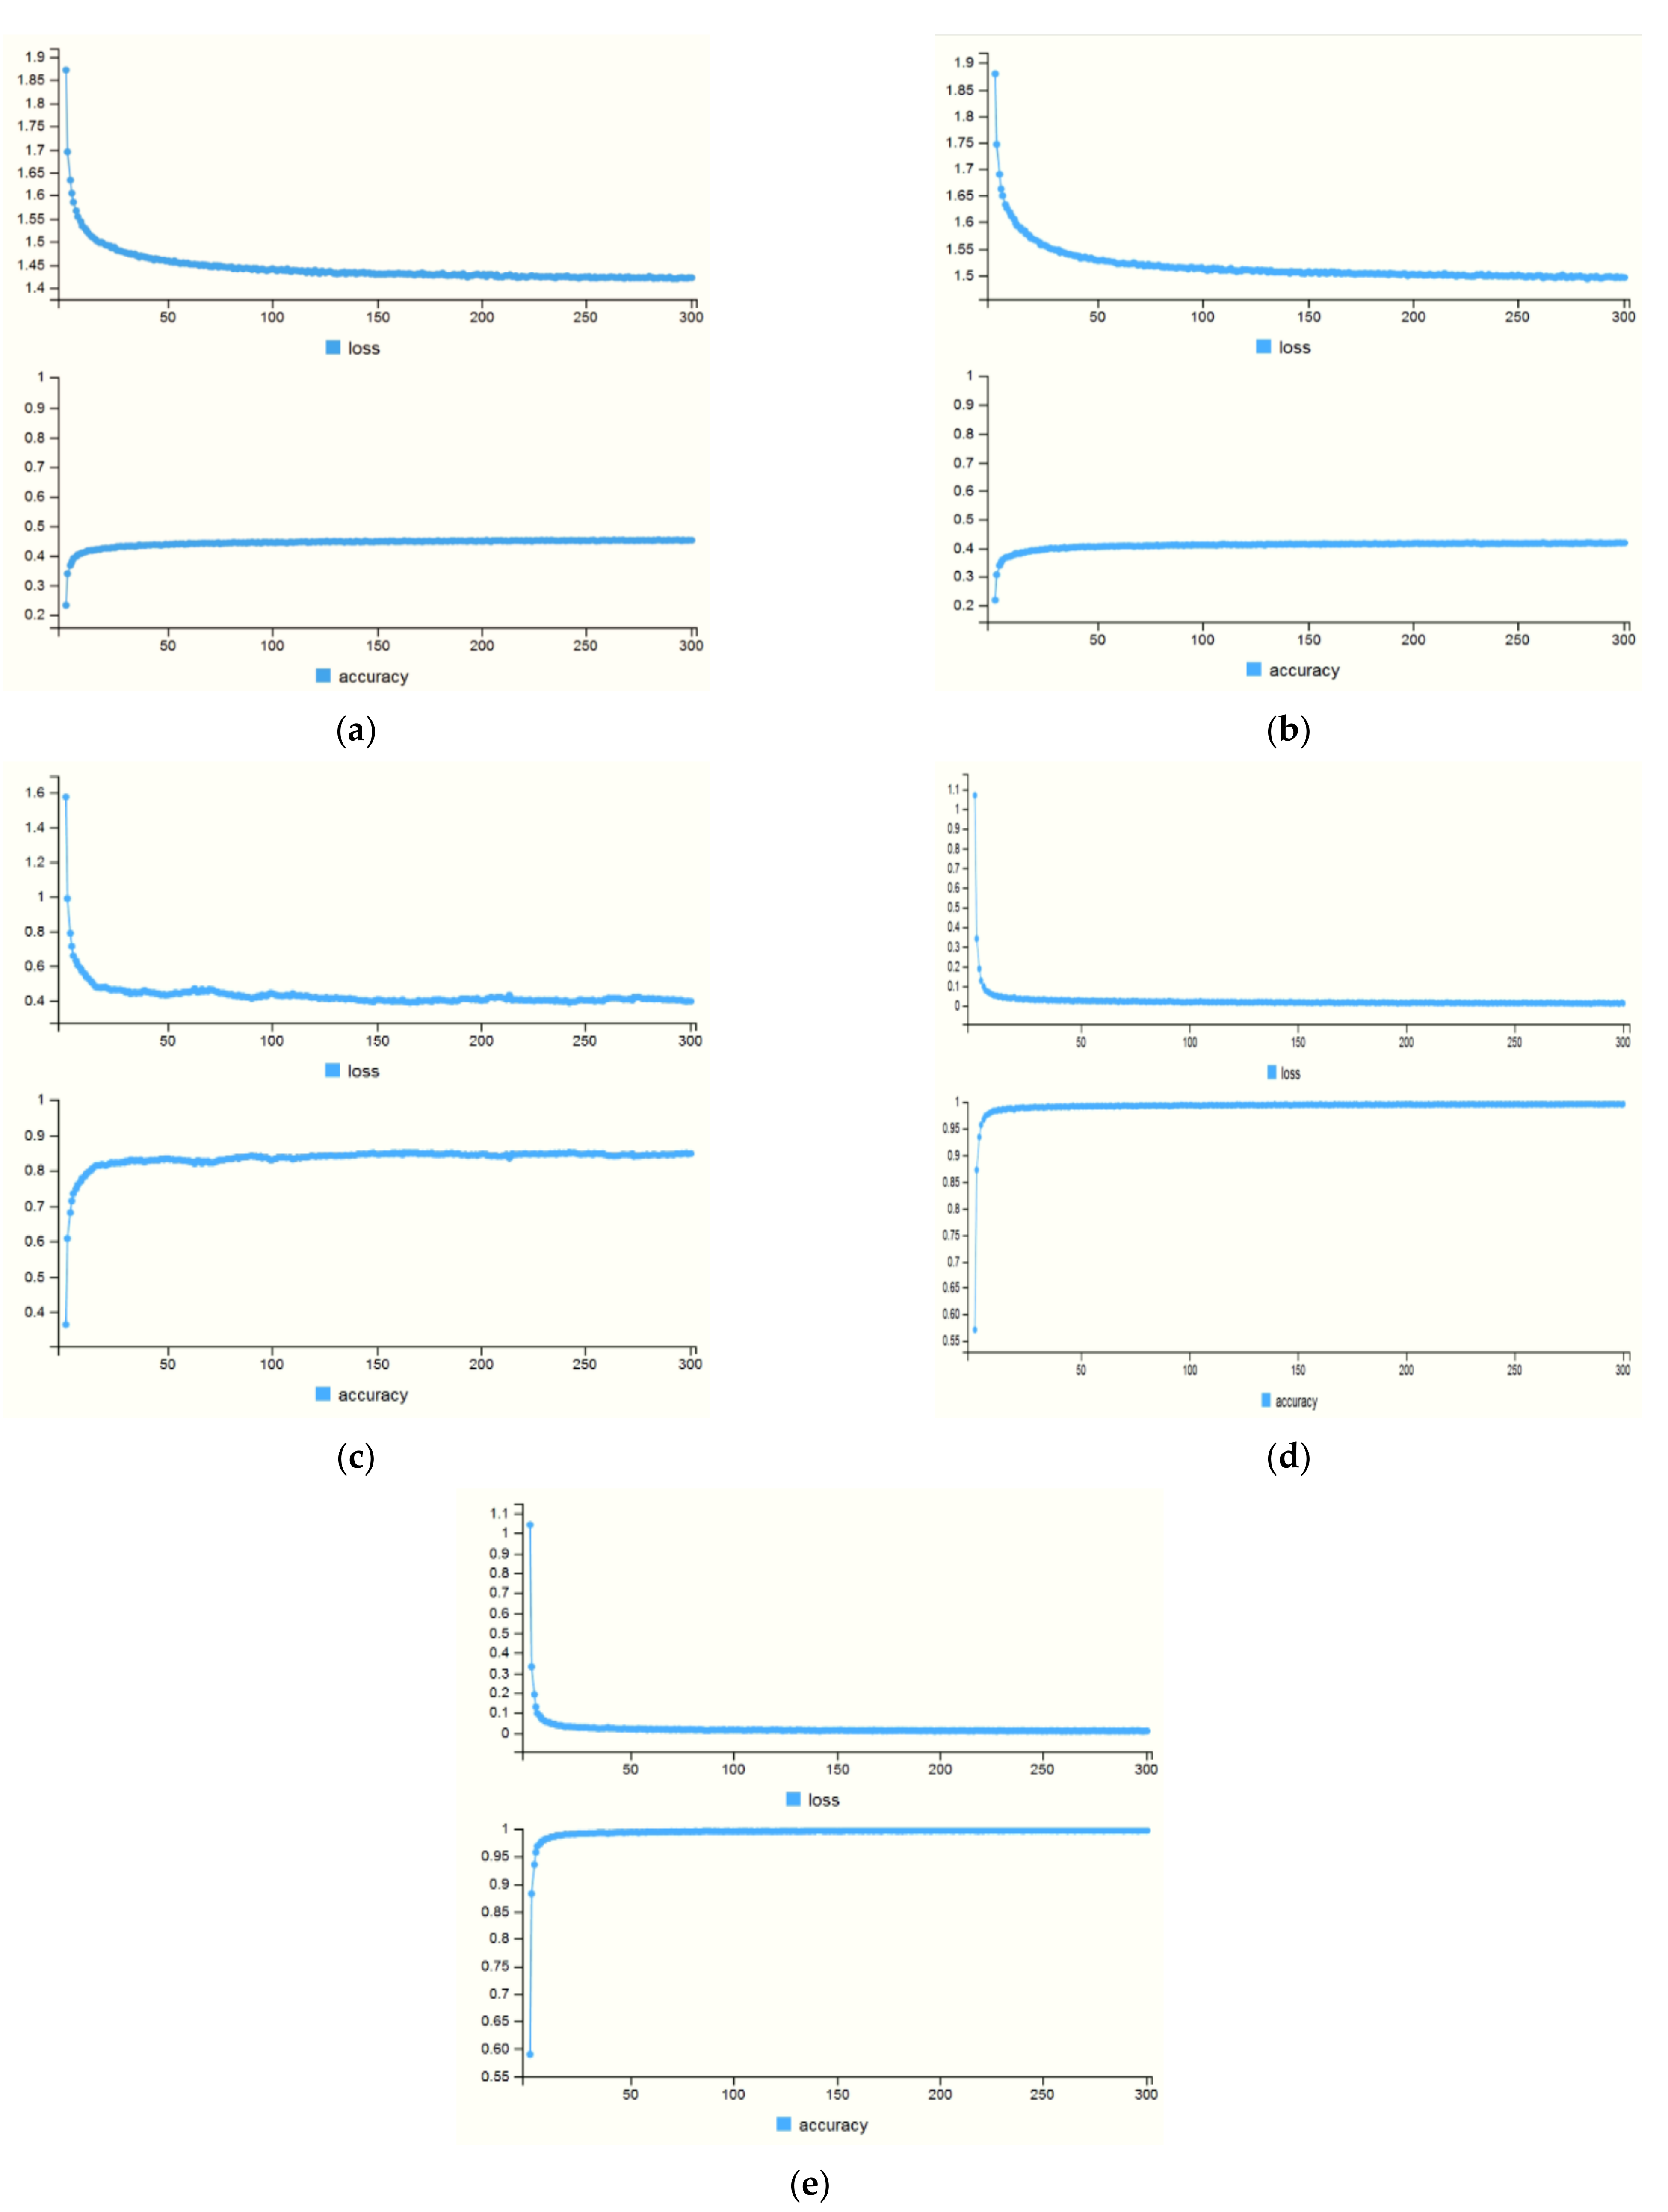
3. Analysis and Experimental Results
4. Conclusions and Future Work
Author Contributions
Funding
Institutional Review Board Statement
Informed Consent Statement
Conflicts of Interest
Appendix A
| ID | Sensor | Min | Max | Mean | Med | Var | SD | Q1 | Q2 | Q3 | Q4 |
|---|---|---|---|---|---|---|---|---|---|---|---|
| A01 | accX | 4.111 | 17.638 | 9.459 | 8.731 | 4.848 | 2.202 | 4.111 | 7.844 | 8.731 | 10.873 |
| accY | −5.259 | 5.494 | −0.276 | −0.309 | 2.207 | 1.486 | −5.259 | −1.286 | −0.309 | 0.692 | |
| accZ | −6.954 | 7.104 | −0.174 | 0.230 | 3.122 | 1.767 | −6.954 | −1.101 | 0.230 | 1.105 | |
| gyroX | −1.185 | 2.714 | 0.014 | 0.042 | 0.190 | 0.436 | −1.185 | −0.315 | 0.042 | 0.344 | |
| gyroY | −1.260 | 1.510 | 0.002 | −0.033 | 0.094 | 0.306 | −1.260 | −0.213 | −0.033 | 0.181 | |
| gyroZ | −1.115 | 1.229 | 0.002 | −0.008 | 0.103 | 0.322 | −1.115 | −0.209 | −0.008 | 0.200 | |
| rotX | −0.756 | 0.749 | 0.033 | −0.412 | 0.260 | 0.510 | −0.756 | −0.466 | −0.412 | 0.552 | |
| rotY | −0.600 | 0.011 | −0.493 | −0.493 | 0.004 | 0.060 | −0.600 | −0.544 | −0.493 | −0.444 | |
| rotZ | −0.662 | 0.672 | 0.056 | −0.393 | 0.251 | 0.501 | −0.662 | −0.433 | −0.393 | 0.567 | |
| A02 | accX | 3.429 | 20.308 | 9.247 | 9.126 | 8.345 | 2.889 | 3.429 | 7.083 | 9.126 | 11.076 |
| accY | −6.690 | 5.626 | −0.130 | −0.074 | 2.734 | 1.653 | −6.690 | −1.103 | −0.074 | 1.003 | |
| accZ | −8.901 | 3.527 | −2.067 | −1.641 | 4.072 | 2.018 | −8.901 | −3.553 | −1.641 | −0.565 | |
| gyroX | −0.799 | 3.170 | 0.016 | 0.003 | 0.076 | 0.276 | −0.799 | −0.141 | 0.003 | 0.150 | |
| gyroY | −0.936 | 1.213 | −0.002 | 0.029 | 0.112 | 0.335 | −0.936 | −0.271 | 0.029 | 0.226 | |
| gyroZ | −0.994 | 0.845 | −0.004 | 0.010 | 0.079 | 0.281 | −0.994 | −0.241 | 0.010 | 0.229 | |
| rotX | −0.783 | 0.783 | 0.079 | −0.430 | 0.346 | 0.589 | −0.783 | −0.495 | −0.430 | 0.682 | |
| rotY | −0.703 | 0.013 | −0.493 | −0.555 | 0.014 | 0.116 | −0.703 | −0.605 | −0.555 | −0.379 | |
| rotZ | −0.622 | 0.623 | 0.067 | −0.345 | 0.220 | 0.469 | −0.622 | −0.389 | −0.345 | 0.548 | |
| A04 | accX | 3.520 | 18.975 | 9.341 | 8.983 | 5.798 | 2.408 | 3.520 | 7.494 | 8.983 | 10.952 |
| accY | −6.312 | 7.734 | 0.226 | 0.397 | 5.936 | 2.436 | −6.312 | −1.764 | 0.397 | 2.075 | |
| accZ | −12.249 | 3.984 | −1.193 | −0.390 | 8.057 | 2.838 | −12.249 | −1.809 | −0.390 | 0.592 | |
| gyroX | −1.867 | 2.629 | 0.015 | 0.006 | 0.482 | 0.694 | −1.867 | −0.576 | 0.006 | 0.574 | |
| gyroY | −1.911 | 2.213 | 0.004 | −0.014 | 0.274 | 0.524 | −1.911 | −0.343 | −0.014 | 0.320 | |
| gyroZ | −1.087 | 1.237 | −0.004 | 0.005 | 0.146 | 0.381 | −1.087 | −0.257 | 0.005 | 0.230 | |
| rotX | −0.731 | 0.729 | 0.027 | −0.427 | 0.353 | 0.594 | −0.731 | −0.566 | −0.427 | 0.625 | |
| rotY | −0.610 | 0.061 | −0.447 | −0.449 | 0.004 | 0.059 | −0.610 | −0.489 | −0.449 | −0.406 | |
| rotZ | −0.696 | 0.691 | 0.011 | −0.427 | 0.280 | 0.529 | −0.696 | −0.517 | −0.427 | 0.543 | |
| C17 | accX | 2.249 | 17.106 | 9.411 | 9.174 | 5.381 | 2.320 | 2.249 | 7.679 | 9.174 | 11.153 |
| accY | −4.707 | 6.073 | 0.096 | 0.206 | 1.790 | 1.338 | −4.707 | −0.730 | 0.206 | 0.907 | |
| accZ | −8.789 | 6.298 | 1.599 | 1.819 | 4.147 | 2.036 | −8.789 | 0.715 | 1.819 | 3.005 | |
| gyroX | −1.485 | 3.033 | 0.015 | 0.014 | 0.168 | 0.410 | −1.485 | −0.263 | 0.014 | 0.267 | |
| gyroY | −1.246 | 1.663 | 0.002 | −0.039 | 0.185 | 0.430 | −1.246 | −0.300 | −0.039 | 0.228 | |
| gyroZ | −1.053 | 1.275 | 0.011 | −0.021 | 0.080 | 0.283 | −1.053 | −0.200 | −0.021 | 0.202 | |
| rotX | −0.638 | 0.658 | 0.047 | −0.292 | 0.180 | 0.425 | −0.638 | −0.353 | −0.292 | 0.495 | |
| rotY | −0.610 | 0.024 | −0.477 | −0.504 | 0.006 | 0.076 | −0.610 | −0.545 | −0.504 | −0.407 | |
| rotZ | −0.776 | 0.767 | 0.057 | −0.362 | 0.255 | 0.505 | −0.776 | −0.418 | −0.362 | 0.594 | |
| C20 | accX | 3.271 | 15.704 | 9.413 | 9.617 | 4.846 | 2.201 | 3.271 | 7.698 | 9.617 | 11.002 |
| accY | −3.575 | 4.934 | 0.435 | 0.447 | 1.728 | 1.314 | −3.575 | −0.517 | 0.447 | 1.290 | |
| accZ | −6.564 | 2.625 | −0.880 | −0.340 | 2.924 | 1.710 | −6.564 | −1.711 | −0.340 | 0.297 | |
| gyroX | −0.955 | 2.356 | 0.016 | −0.013 | 0.103 | 0.321 | −0.955 | −0.208 | −0.013 | 0.211 | |
| gyroY | −1.137 | 1.324 | 0.001 | −0.009 | 0.131 | 0.362 | −1.137 | −0.271 | −0.009 | 0.260 | |
| gyroZ | −1.028 | 1.051 | −0.002 | 0.001 | 0.090 | 0.301 | −1.028 | −0.185 | 0.001 | 0.171 | |
| rotX | −0.761 | 0.763 | 0.075 | −0.415 | 0.300 | 0.547 | −0.761 | −0.464 | −0.415 | 0.628 | |
| rotY | −0.626 | 0.011 | −0.480 | −0.510 | 0.011 | 0.103 | −0.626 | −0.579 | −0.510 | −0.386 | |
| rotZ | −0.664 | 0.651 | 0.050 | −0.403 | 0.251 | 0.501 | −0.664 | −0.443 | −0.403 | 0.557 | |
| C21 | accX | 4.314 | 15.072 | 9.442 | 9.086 | 2.473 | 1.572 | 4.314 | 8.384 | 9.086 | 10.512 |
| accY | −3.994 | 5.240 | 0.578 | 0.500 | 1.523 | 1.234 | −3.994 | −0.220 | 0.500 | 1.371 | |
| accZ | −6.882 | 5.154 | −0.264 | −0.029 | 2.322 | 1.524 | −6.882 | −0.957 | −0.029 | 0.684 | |
| gyroX | −1.607 | 2.609 | 0.013 | 0.021 | 0.206 | 0.454 | −1.607 | −0.316 | 0.021 | 0.318 | |
| gyroY | −1.276 | 1.426 | 0.005 | −0.016 | 0.066 | 0.256 | −1.276 | −0.164 | −0.016 | 0.166 | |
| gyroZ | −0.763 | 0.650 | 0.002 | −0.003 | 0.039 | 0.197 | −0.763 | −0.134 | −0.003 | 0.156 | |
| rotX | −0.727 | 0.727 | −0.007 | −0.449 | 0.247 | 0.497 | −0.727 | −0.496 | −0.449 | 0.500 | |
| rotY | −0.604 | 0.077 | −0.516 | −0.517 | 0.001 | 0.032 | −0.604 | −0.533 | −0.517 | −0.502 | |
| rotZ | −0.687 | 0.695 | −0.042 | −0.477 | 0.232 | 0.482 | −0.687 | −0.515 | −0.477 | 0.447 | |
| CS03 | accX | 1.900 | 21.839 | 9.326 | 8.969 | 13.316 | 3.649 | 1.900 | 6.293 | 8.969 | 12.385 |
| accY | −6.451 | 6.068 | −0.004 | 0.024 | 5.227 | 2.286 | −6.451 | −1.941 | 0.024 | 1.924 | |
| accZ | −15.912 | 7.004 | −1.262 | −0.502 | 9.513 | 3.084 | −15.912 | −2.084 | −0.502 | 0.646 | |
| gyroX | −2.138 | 3.812 | 0.019 | 0.075 | 0.746 | 0.864 | −2.138 | −0.750 | 0.075 | 0.754 | |
| gyroY | −2.553 | 2.288 | −0.005 | −0.046 | 0.192 | 0.438 | −2.553 | −0.272 | −0.046 | 0.243 | |
| gyroZ | −1.259 | 1.548 | −0.004 | 0.015 | 0.303 | 0.551 | −1.259 | −0.454 | 0.015 | 0.435 | |
| rotX | −0.718 | 0.718 | 0.051 | 0.507 | 0.323 | 0.568 | −0.718 | −0.515 | 0.507 | 0.616 | |
| rotY | −0.658 | 0.072 | −0.473 | −0.482 | 0.007 | 0.086 | −0.658 | −0.541 | −0.482 | −0.411 | |
| rotZ | −0.690 | 0.698 | 0.050 | 0.501 | 0.260 | 0.510 | −0.690 | −0.461 | 0.501 | 0.557 |
Appendix B
 |  |  |
| A01′s Rotation X and Y | A01’s Rotation X and Z | A01′s Rotation Y and Z |
 |  |  |
| A02′s Rotation X and Y | A02′s Rotation X and Z | A02′s Rotation Y and Z |
 |  |  |
| A04′s Rotation X and Y | A04′s Rotation X and Z | A04′s Rotation Y and Z |
 |  |  |
| C17′s Rotation X and Y | C17′s Rotation X and Z | C17′s Rotation Y and Z |
 |  |  |
| C20′s Rotation X and Y | C20′s Rotation X and Z | C20′s Rotation Y and Z |
 |  |  |
| C21′s Rotation X and Y | C21′s Rotation X and Z | C21′s Rotation Y and Z |
 |  |  |
| CS03′s Rotation X and Y | CS03′s Rotation X and Z | CS03′s Rotation Y and Z |
References
- Bruttini, C.; Esposti, R.; Bolzoni, F.; Vanotti, A.; Mariotti, C.; Cavallari, P. Temporal disruption of upper-limb anticipatory postural adjustments in cerebellar ataxic patients. Exp. Brain Res. 2015, 233, 197–203. [Google Scholar] [CrossRef] [PubMed]
- Lee, H.; Lee, S.; Salado, L.; Estrada, J.; White, J.; Muthukumar, V.; Lee, S.P.; Mohapatra, S. Proof-of-Concept Testing of a Real-Time mHealth Measure to Estimate Postural Control During Walking: A Potential Application for Mild Traumatic Brain Injuries. Asian/Pac. Isl. Nurs. J. 2018, 3, 175–189. [Google Scholar] [CrossRef] [PubMed][Green Version]
- Montecchi, M.G.; Muratori, A.; Lombardi, F.; Morrone, E.; Briant, K. Trunk recovery scale: A new tool to measure posture control in patients with severe acquired brain injury. A study of the psychometric properties. Eur. J. Phys. Rehabil. Med. 2013, 49, 341–351. [Google Scholar] [PubMed]
- Jurgens, R.; Nasios, G.; Becker, W. Vestibular optokinetic and cognitive contribution to the guidance of passive self-rotation toward instructed targets. Exp. Brain Res. 2003, 151, 90–107. [Google Scholar] [CrossRef] [PubMed]
- Lee, H.; Lee, S.; Black, I.; Salado, L.; Estrada, J.; Isla, K. Long-Term Impact of Mild Traumatic Brain Injuries on Multiple Functional Outcomes and Epigenetics: A Pilot Study with College Students. Appl. Sci. 2020, 10, 4131. [Google Scholar] [CrossRef]
- Degani, A.M.; Santos, M.M.; Leonard, C.T.; Rau, T.F.; Patel, S.A.; Mohapatra, S.; Danna-Dos-Santos, A. The effects of mild traumatic brain injury on postural control. Brain Inj. 2016, 31, 49–56. [Google Scholar] [CrossRef] [PubMed]
- Merchant-Borna, K.; Jones, C.M.; Janigro, M.; Wasserman, E.B.; Clark, R.A.; Bazarian, J.J. Evaluation of Nintendo Wii Balance Board as a Tool for Measuring Postural Stability After Sport-Related Concussion. J. Athl. Train. 2017, 52, 245–255. [Google Scholar] [CrossRef] [PubMed]
- Tsuruoka, M.; Tsuruoka, Y.; Shibasaki, R.; Yasuoka, Y. Spectral Analysis of Walking with Shoes and without Shoes. In Proceedings of the 2006 International Conference of the IEEE Engineering in Medicine and Biology Society, New York, NY, USA, 30 August–3 September 2006; pp. 6125–6128. [Google Scholar] [CrossRef]
- Venugopalan, J.; Cheng, C.; Stokes, T.H.; Wang, M.D. Kinect-based rehabilitation system for patients with traumatic brain injury. In Proceedings of the 35th Annual International Conference of the IEEE Engineering in Medicine and Biology Society (EMBC), Osaka, Japan, 3–7 July 2013; pp. 4625–4628. [Google Scholar] [CrossRef] [PubMed]
- Heitger, M.H.; Jones, R.D.; Anderson, T.J. A new approach to predicting postconcussion syndrome after mild traumatic brain injury based upon eye movement function. In Proceedings of the 30th Annual International Conference of the IEEE Engineering in Medicine and Biology Society (EMBC), Vancouver, BC, Canada, 20–25 August 2008; pp. 3570–3573. [Google Scholar] [CrossRef] [PubMed]
- Petersen, E.; Zech, A.; Hamacher, D. Walking barefoot vs. with minimalist footwear—Influence on gait in younger and older adults. BMC Geriatr. 2020, 20, 88. [Google Scholar] [CrossRef] [PubMed]
- Patrick, K.; Griswold, W.G.; Raab, F.; Intille, S.S. Health and the mobile phone. Am. J. Prev. Med. 2008, 35, 177–181. [Google Scholar] [CrossRef] [PubMed]
- Juen, J.; Cheng, Q.; Prieto-Centurion, V.; Krishnan, J.A.; Schatz, B. Health monitors for chronic disease by gait analysis with mobile phones. Telemed. J. E-Health 2014, 20, 1035–1041. [Google Scholar] [CrossRef] [PubMed]
- Rosenbaum, S.B.; Lipton, M.L. Embracing chaos: The scope and importance of clinical and pathological heterogeneity in mTBI. Brain Imaging Behav. 2012, 6, 255–282. [Google Scholar] [CrossRef] [PubMed]
- Cancela, J.; Pastorino, M.; Tzallas, A.T.; Tsipouras, M.G.; Rigas, G.; Arredondo, M.T.; Fotiadis, D.I. Wearability assessment of a wearable system for Parkinson’s disease remote monitoring based on a body area network of sensors. Sensors 2014, 14, 17235–17255. [Google Scholar] [CrossRef] [PubMed]
- Lamont, R.M.; Daniel, H.L.; Payne, C.L.; Brauer, S.G. Accuracy of wearable physical activity trackers in people with Parkinson’s disease. Gait Posture 2018, 63, 104–108. [Google Scholar] [CrossRef]
- TensorFlow. TensorFlow Core v2.2.0. Available online: https://www.tensorflow.org/api_docs/python/tf/keras/losses/CategoricalCrossentropy (accessed on 1 May 2020).
- Keras. Available online: https://keras.io/ (accessed on 1 May 2020).
- Developers. Motion Sensors. Available online: https://developer.android.com/guide/topics/sensors/sensors_motion#sensors-motion-rotate (accessed on 10 April 2020).
- Lee, S.; Hwang, E.; Kim, Y.; Demir, F.; Lee, H.; Mosher, J.J.; Jang, E.; Lim, K. Mobile Health App for Adolescents: Motion Sensor Data and Deep Learning Technique to Examine the Relationship between Obesity and Walking Patterns. Appl. Sci. 2022, 12, 850. [Google Scholar] [CrossRef]
- Developers. API reference. Available online: https://developer.android.com/reference (accessed on 10 April 2020).
- Christopher, M. Bishop, Pattern Recognition and Machine Learning; Springer: Berlin/Heidelberg, Germany, 2006. [Google Scholar]
- Nair, V.; Hinton, G.E. Rectified Linear Units Improve Restricted Boltzmann Machines. In Proceedings of the 27th International Conference on Machine Learning, Haifa, Israel, 21–24 June 2010. [Google Scholar]
- Krizhevsky, A.; Sutskever, I.; Hinton, G.E. System and Method for Addressing Overfitting in a Neural Network. USA Patent US 9406017B2, 2 August 2016. [Google Scholar]
- Glorot, X.; Bengio, Y. Understanding the difficulty of training deep feedforward neural networks. In Proceedings of the 13th International Conference, Sardinia, Italy, 13–15 May 2010. [Google Scholar]
- Diederik, P.; Kingma, J.B. Adam: A Method for Stochastic Optimization. In Proceedings of the 3rd International Conference for Learning Representations, San Diego, CA, USA, 7–9 May 2015. [Google Scholar]
- Teasdale, G.; Jennett, B. Assessment of coma and impaired consciousness. A practical scale. Lancet 1974, 13, 81–84. [Google Scholar] [CrossRef]
- Bond, M.R. The stages of recovery from severe head injury with special reference to late outcome. Int. Rehabil. Med. 1979, 1, 155–159. [Google Scholar] [CrossRef] [PubMed]


| ID | Age | Race | Gender | # of mTBI Injuries | Year of Last Injury | Weight | Height |
|---|---|---|---|---|---|---|---|
| A01 | 23 | Asian | Female | 1 | 2019 | 127 | 5′1″ |
| A02 | 35 | Asian | Male | 5 | 2018 | 148 | 5′4″ |
| A04 | 20 | Asian | Female | 1 | 2015 | 117 | 4′11″ |
| C20 | 32 | White | Female | 3 | 2015 | 155 | 5′4″ |
| C21 | 19 | White | Female | 4 | 2019 | 132 | 5′8″ |
| C17 | 21 | White | Female | 1 | 2015 | 115 | 5′1″ |
| CS03 | 24 | White | Female | 0 | 0 | 115 | 5′2″ |
| ID | Sensor | Min | Max | Mean | Med | Var | SD | Q1 | Q2 | Q3 | Q4 |
|---|---|---|---|---|---|---|---|---|---|---|---|
| A01 | accX | 4.111 | 17.638 | 9.459 | 8.731 | 4.848 | 2.202 | 4.111 | 7.844 | 8.731 | 10.873 |
| accY | −5.259 | 5.494 | −0.276 | −0.309 | 2.207 | 1.486 | −5.259 | −1.286 | −0.309 | 0.692 | |
| accZ | −6.954 | 7.104 | −0.174 | 0.230 | 3.122 | 1.767 | −6.954 | −1.101 | 0.230 | 1.105 | |
| gyroX | −1.185 | 2.714 | 0.014 | 0.042 | 0.190 | 0.436 | −1.185 | −0.315 | 0.042 | 0.344 | |
| gyroY | −1.260 | 1.510 | 0.002 | −0.033 | 0.094 | 0.306 | −1.260 | −0.213 | −0.033 | 0.181 | |
| gyroZ | −1.115 | 1.229 | 0.002 | −0.008 | 0.103 | 0.322 | −1.115 | −0.209 | −0.008 | 0.200 | |
| rotX | −0.756 | 0.749 | 0.033 | −0.412 | 0.260 | 0.510 | −0.756 | −0.466 | −0.412 | 0.552 | |
| rotY | −0.600 | 0.011 | −0.493 | −0.493 | 0.004 | 0.060 | −0.600 | −0.544 | −0.493 | −0.444 | |
| rotZ | −0.662 | 0.672 | 0.056 | −0.393 | 0.251 | 0.501 | −0.662 | −0.433 | −0.393 | 0.567 |
| Model Data Type | Loss | Accuracy |
|---|---|---|
| Acc X, Y, Z | 1.291 | 0.505 (50.5%) |
| Gyro X, Y, Z | 1.316 | 0.483 (48.3%) |
| Rot X, Y, Z | 0.540 | 0.771 (77.1%) |
| Rot vector—9 | 0.014 | 0.995 (99.5%) |
| All data set | 0.010 | 0.999 (99.9%) |
Publisher’s Note: MDPI stays neutral with regard to jurisdictional claims in published maps and institutional affiliations. |
© 2022 by the authors. Licensee MDPI, Basel, Switzerland. This article is an open access article distributed under the terms and conditions of the Creative Commons Attribution (CC BY) license (https://creativecommons.org/licenses/by/4.0/).
Share and Cite
Lee, S.; Lee, H. Detection of Walking Features Using Mobile Health and Deep Learning. Appl. Sci. 2022, 12, 5444. https://doi.org/10.3390/app12115444
Lee S, Lee H. Detection of Walking Features Using Mobile Health and Deep Learning. Applied Sciences. 2022; 12(11):5444. https://doi.org/10.3390/app12115444
Chicago/Turabian StyleLee, Sungchul, and Hyunhwa Lee. 2022. "Detection of Walking Features Using Mobile Health and Deep Learning" Applied Sciences 12, no. 11: 5444. https://doi.org/10.3390/app12115444
APA StyleLee, S., & Lee, H. (2022). Detection of Walking Features Using Mobile Health and Deep Learning. Applied Sciences, 12(11), 5444. https://doi.org/10.3390/app12115444