
Fatigue Performance Test and Numerical Analysis of Composite Girders with CSW-CFST Truss Chords

Abstract
:1. Introduction
2. Model Test
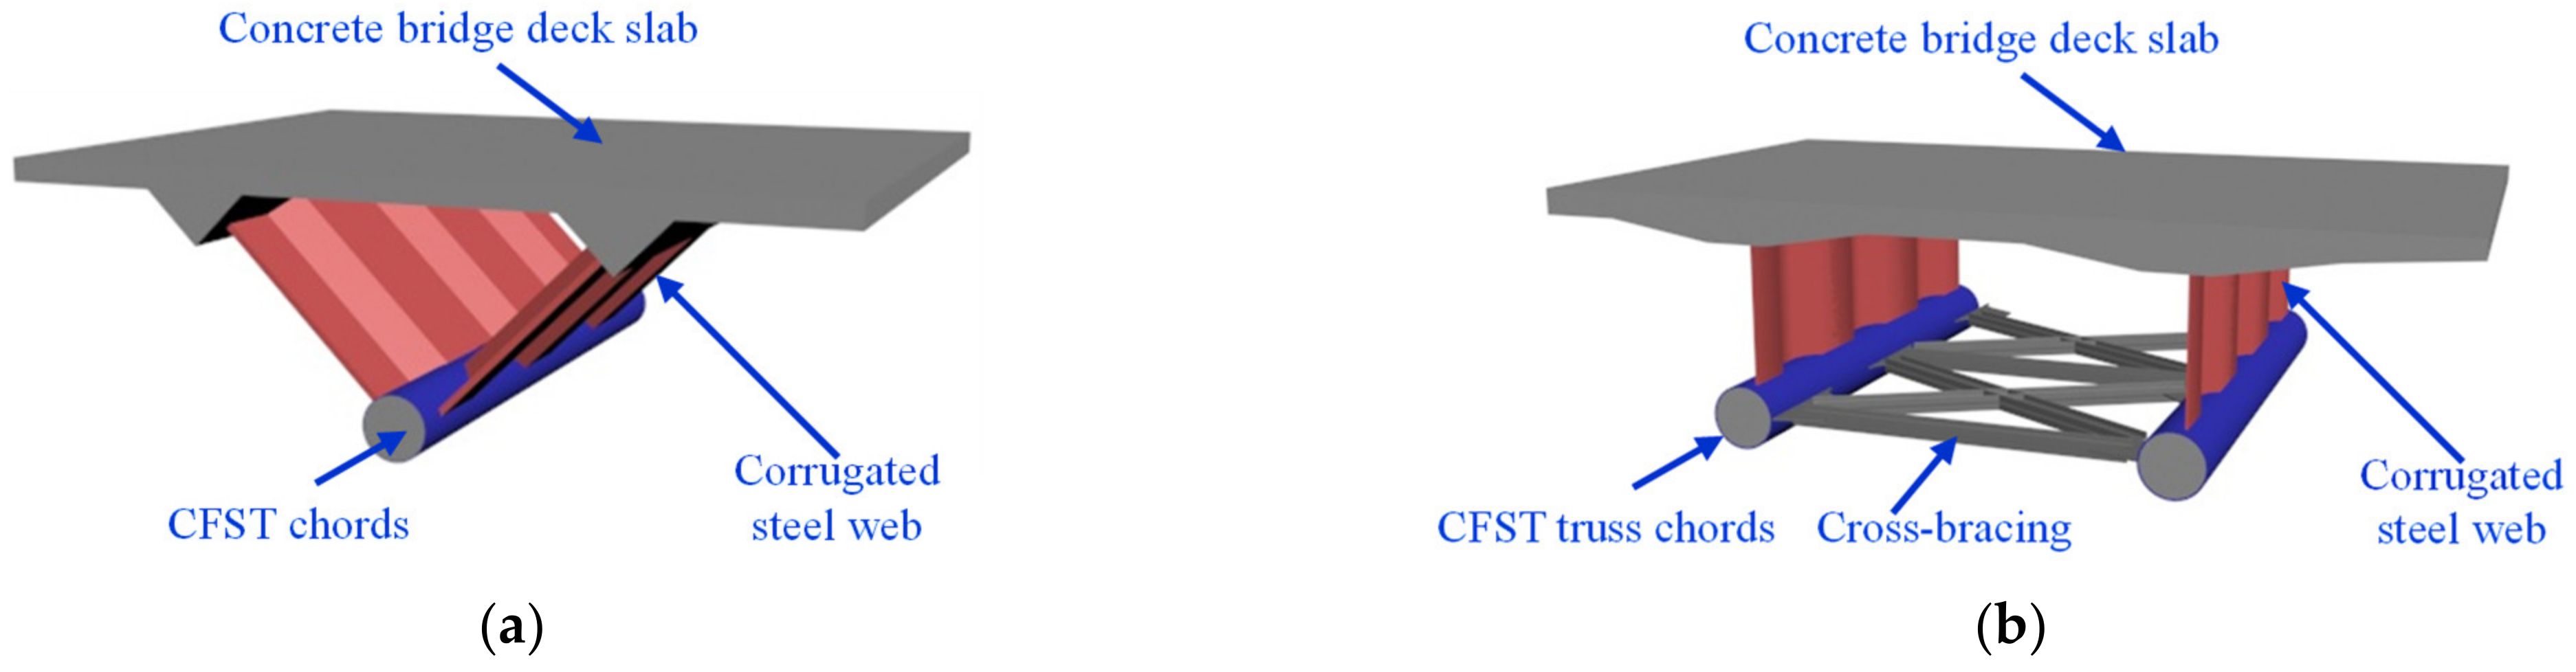
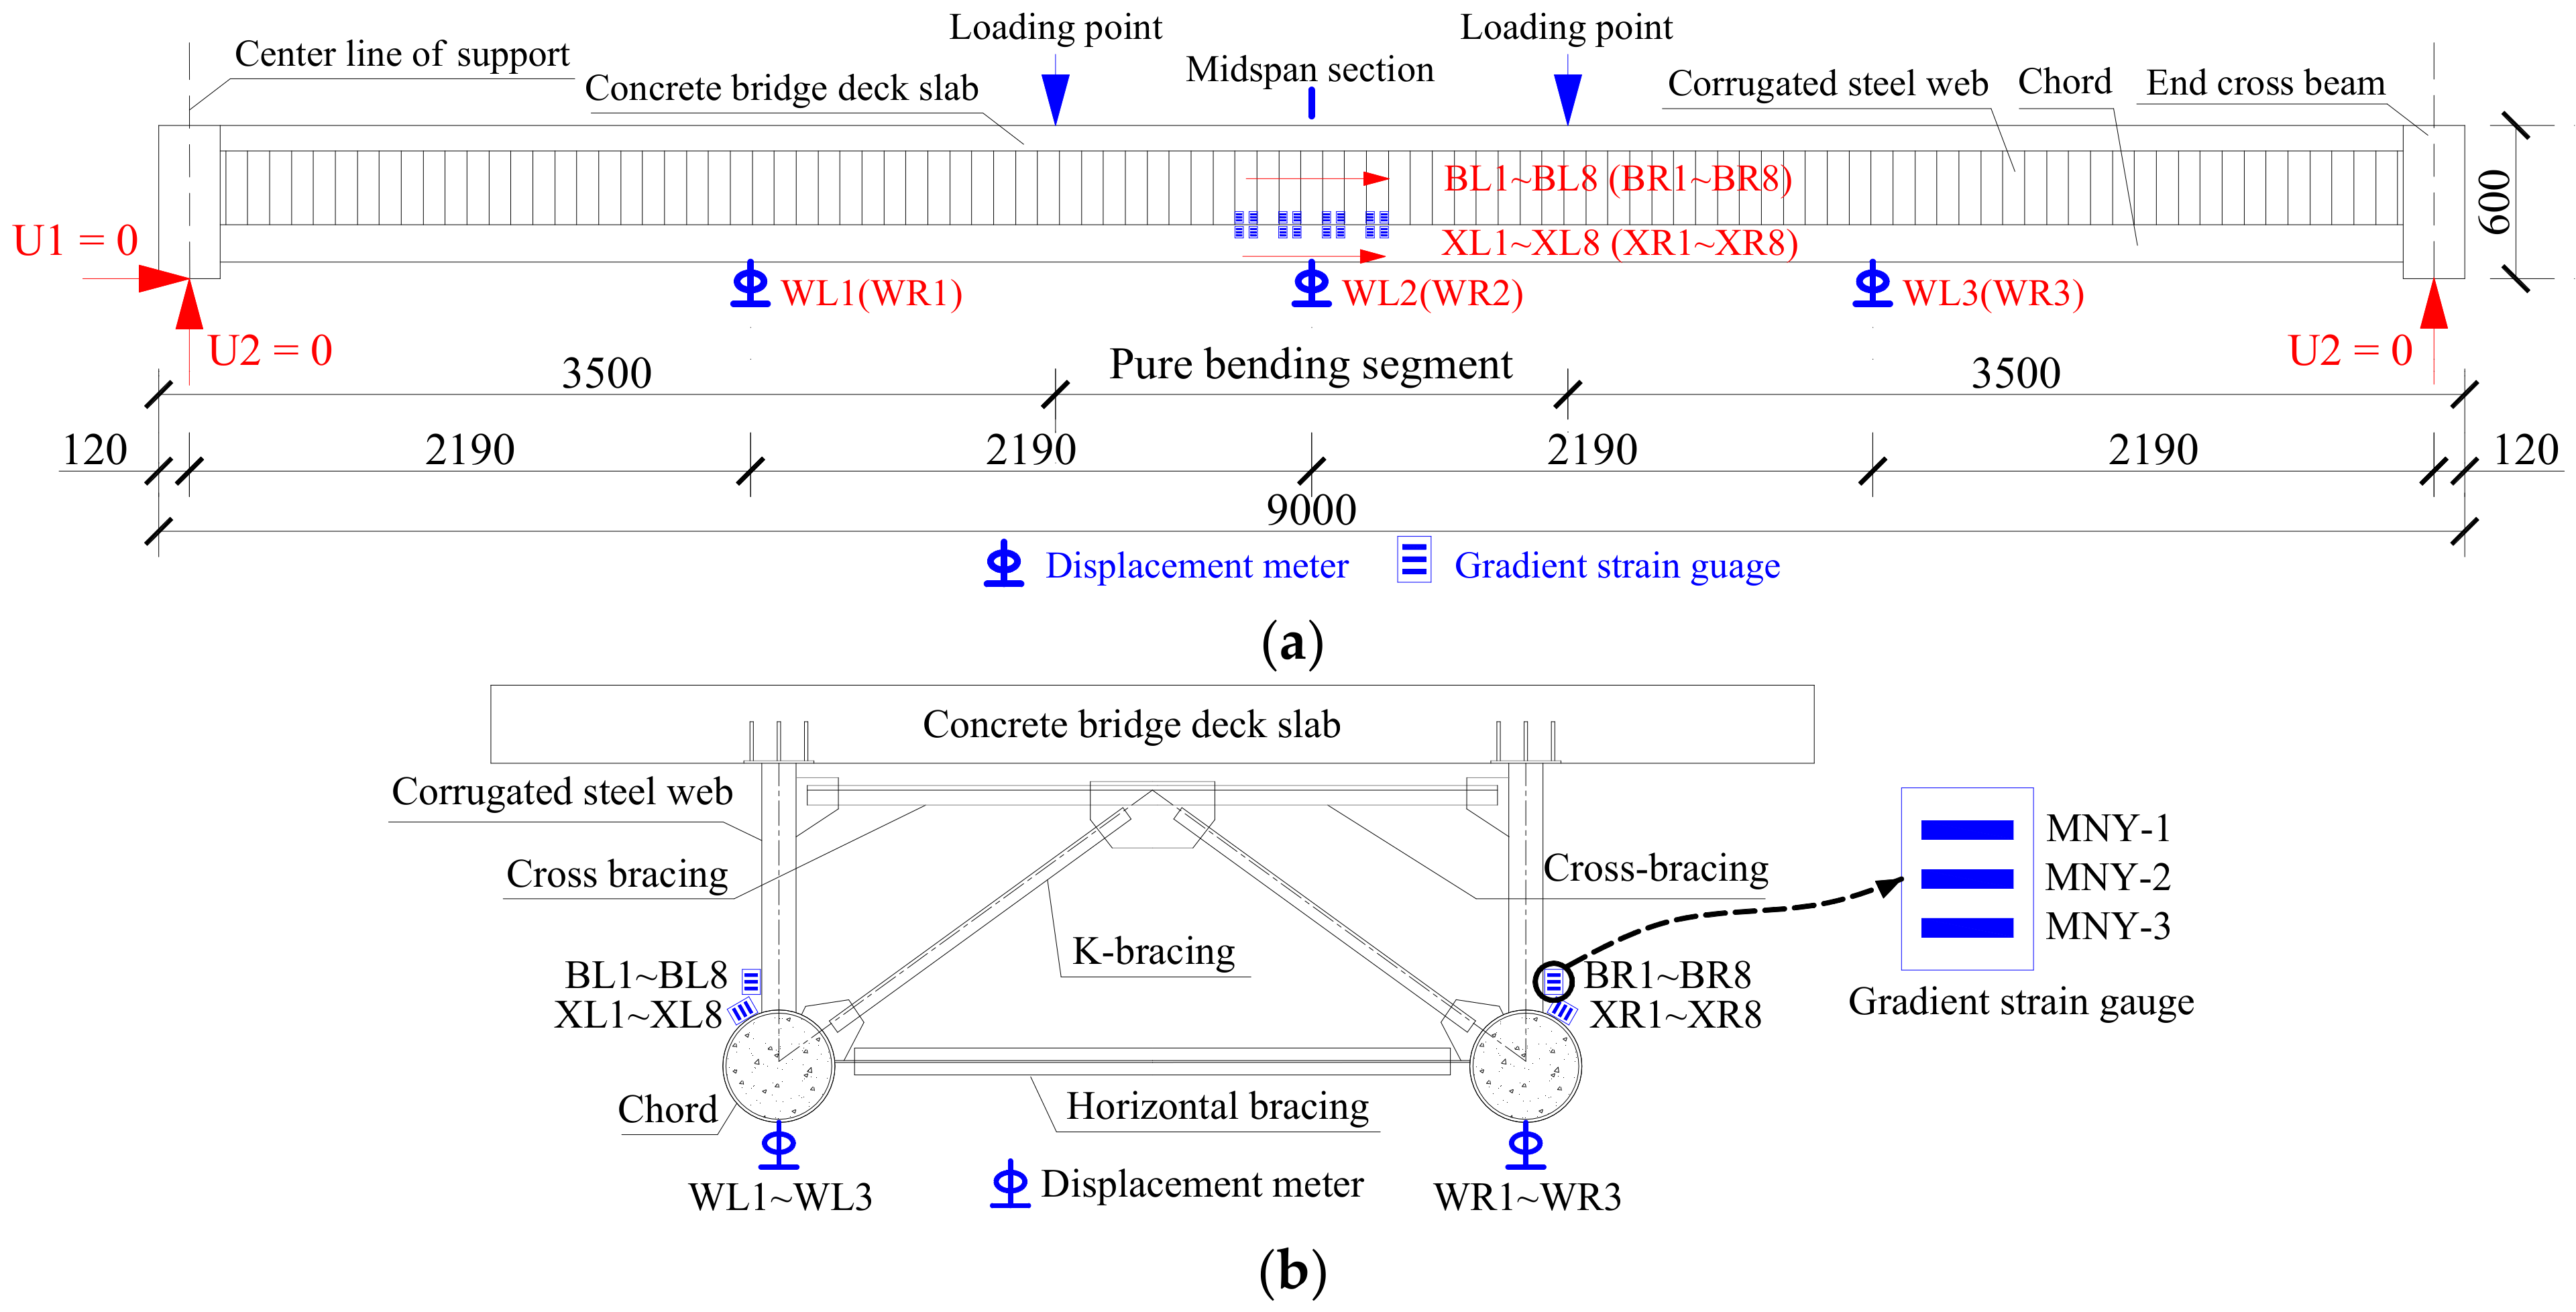
2.1. Model Design
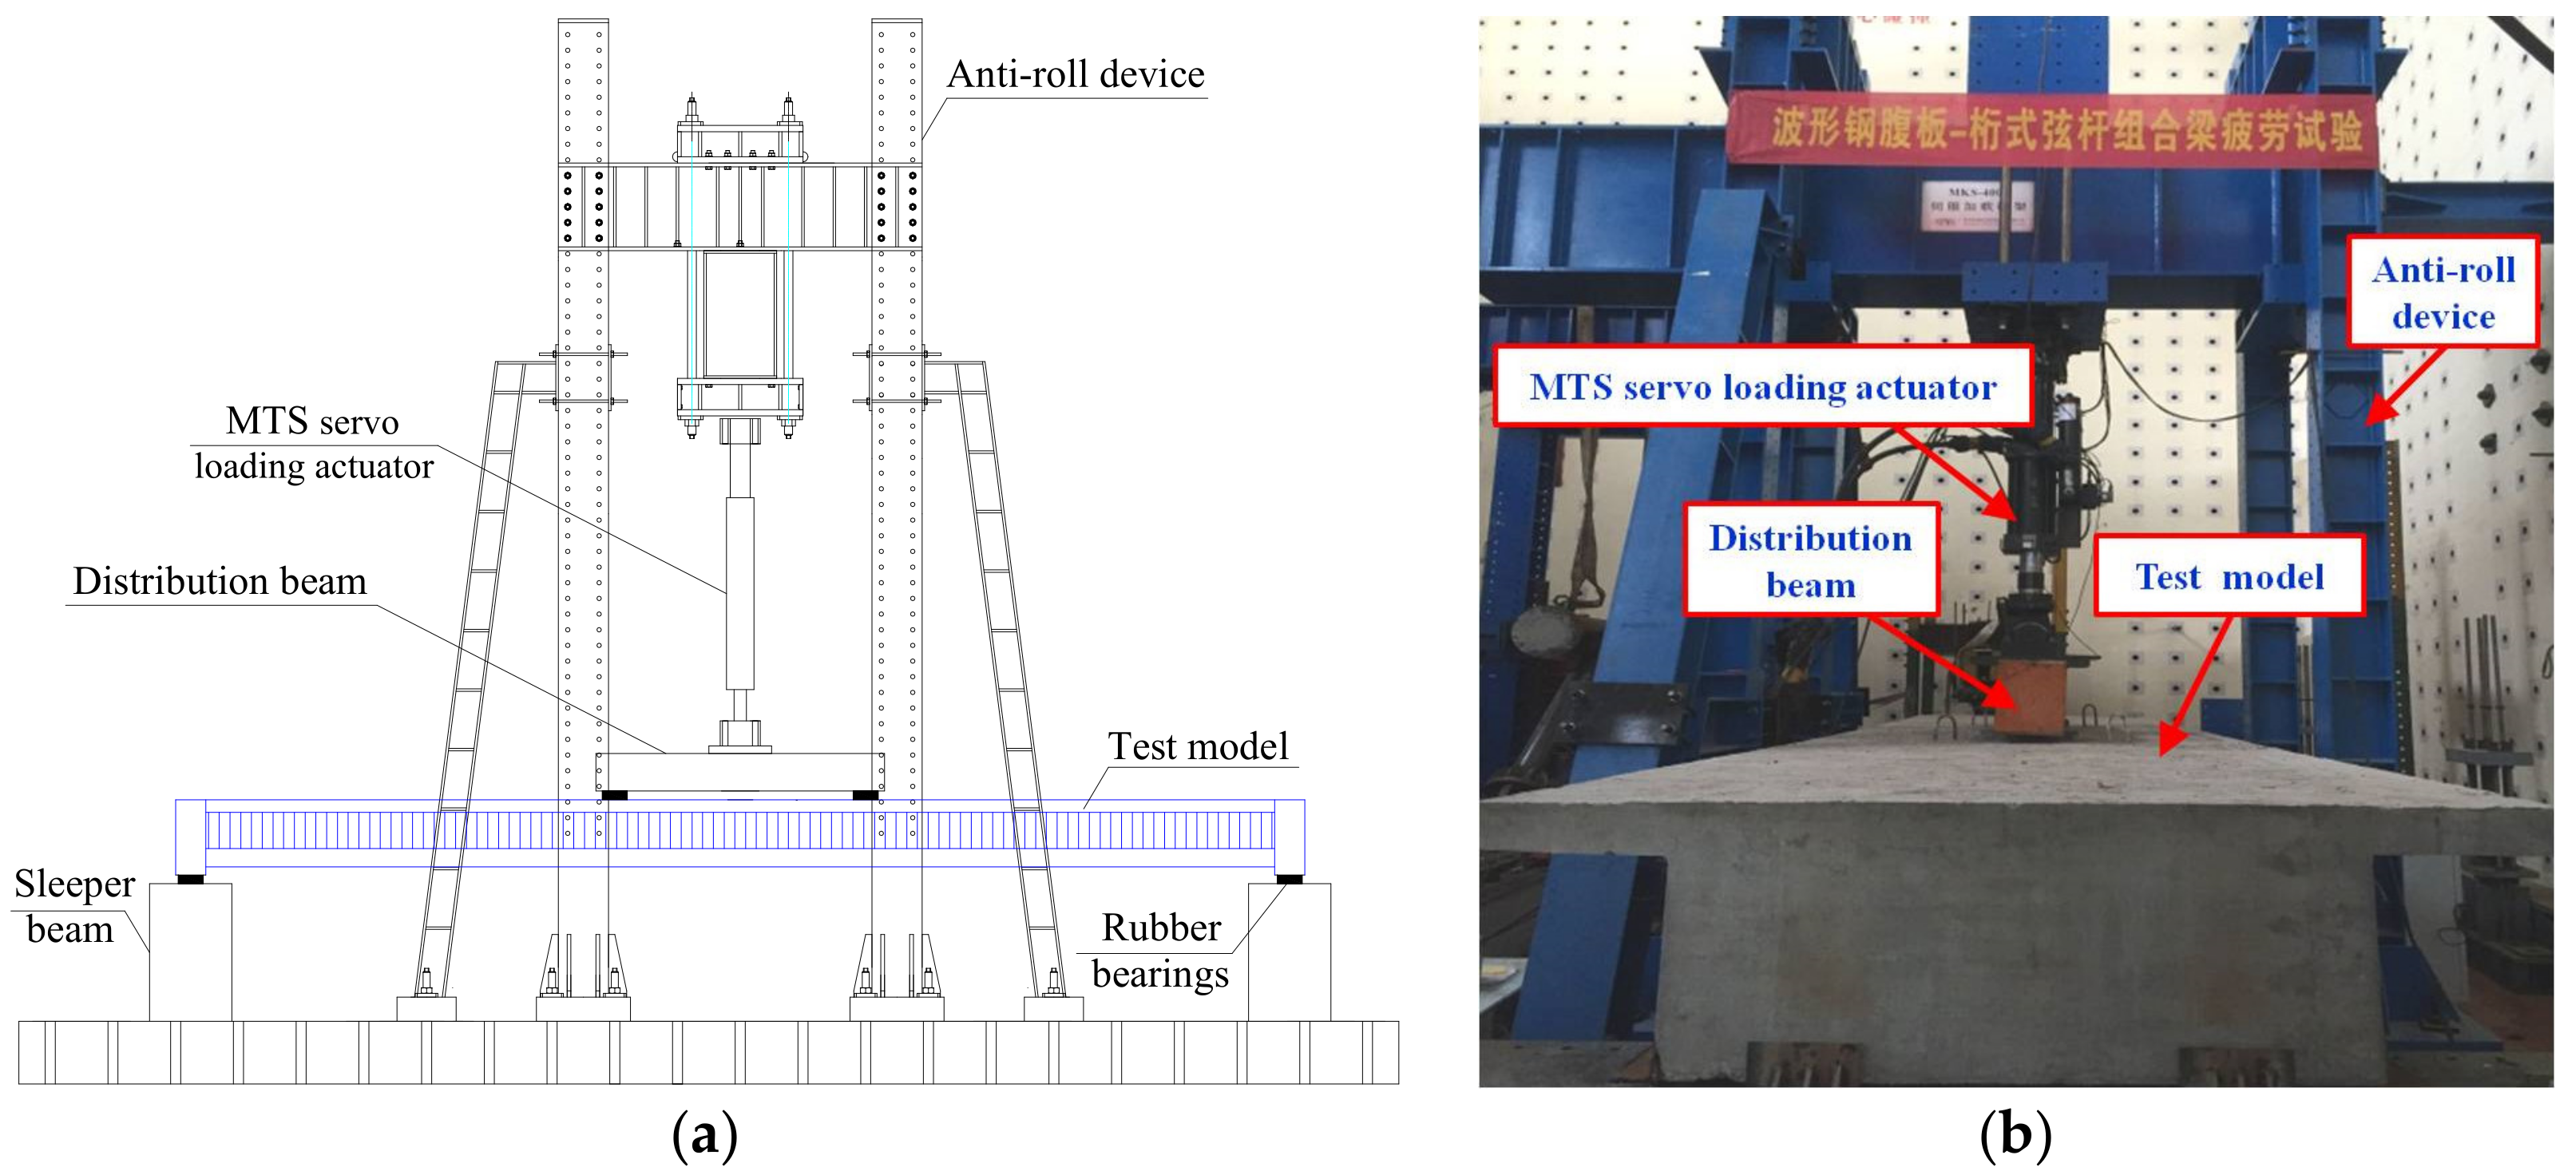
2.2. Loading Method and Rig
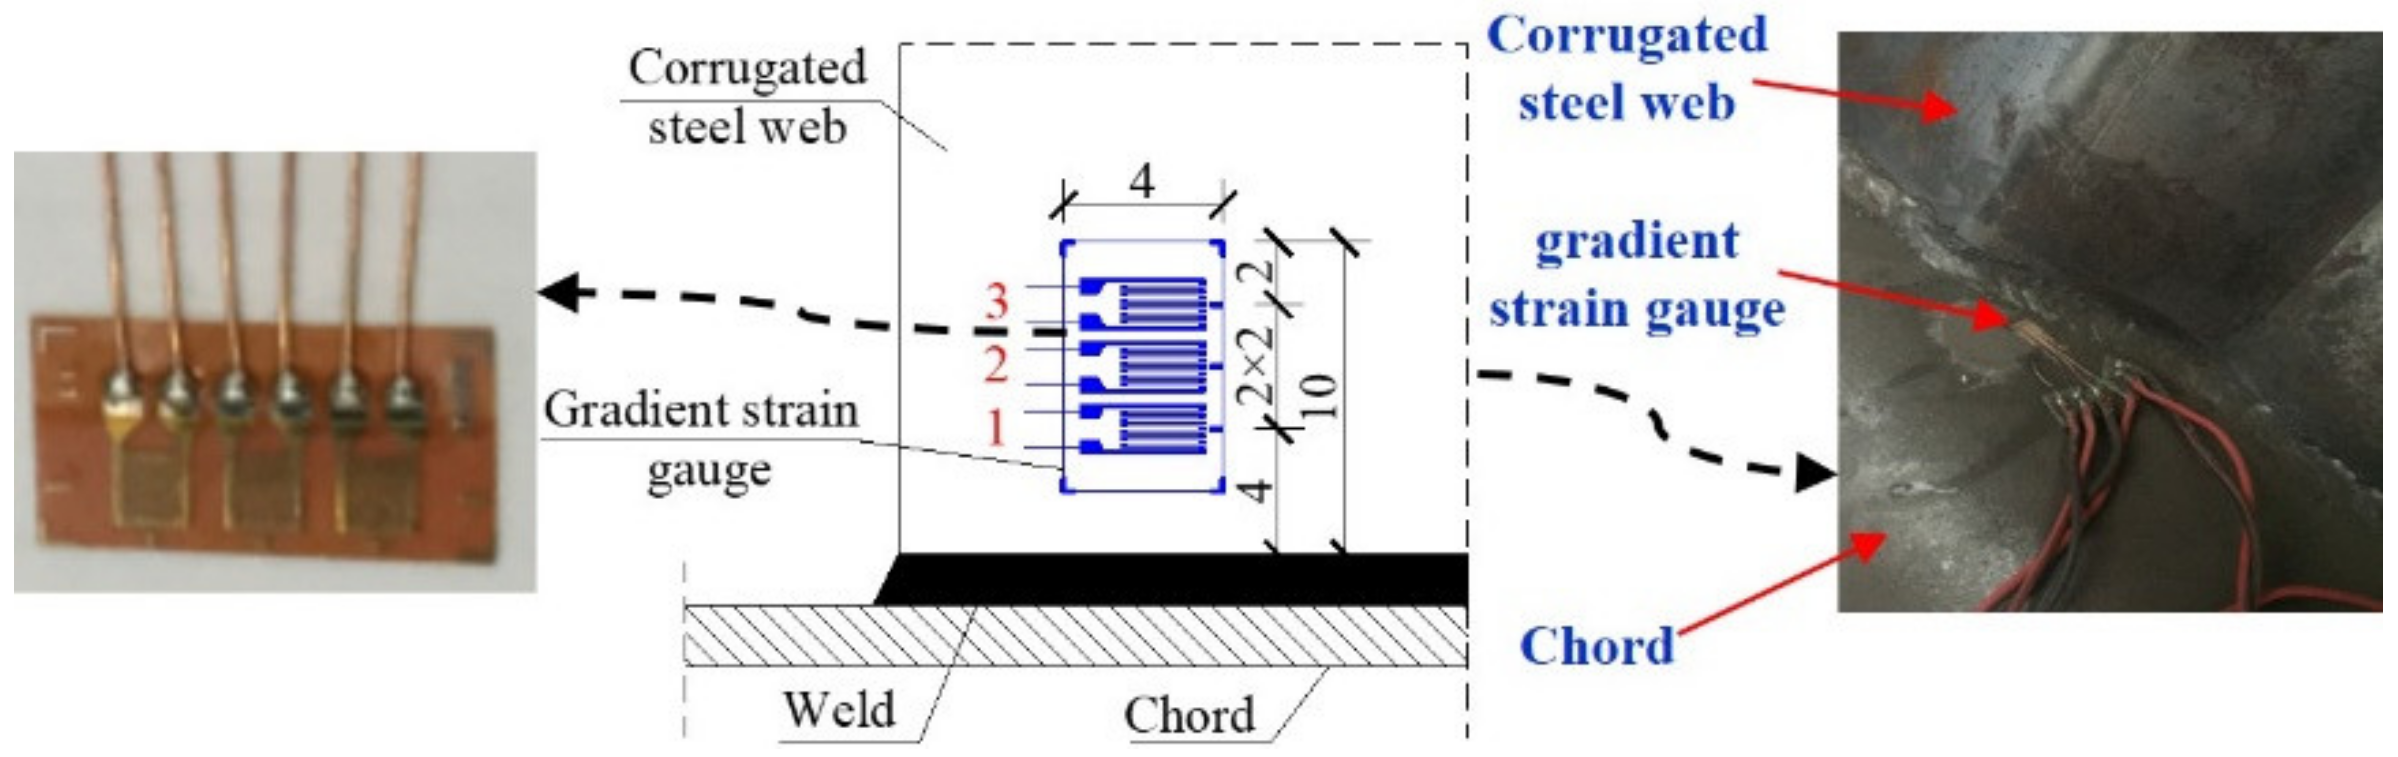
2.3. Instrumentation Layout of Measurement Points and Inspection Procedures
3. Analysis of Fatigue Performance Results
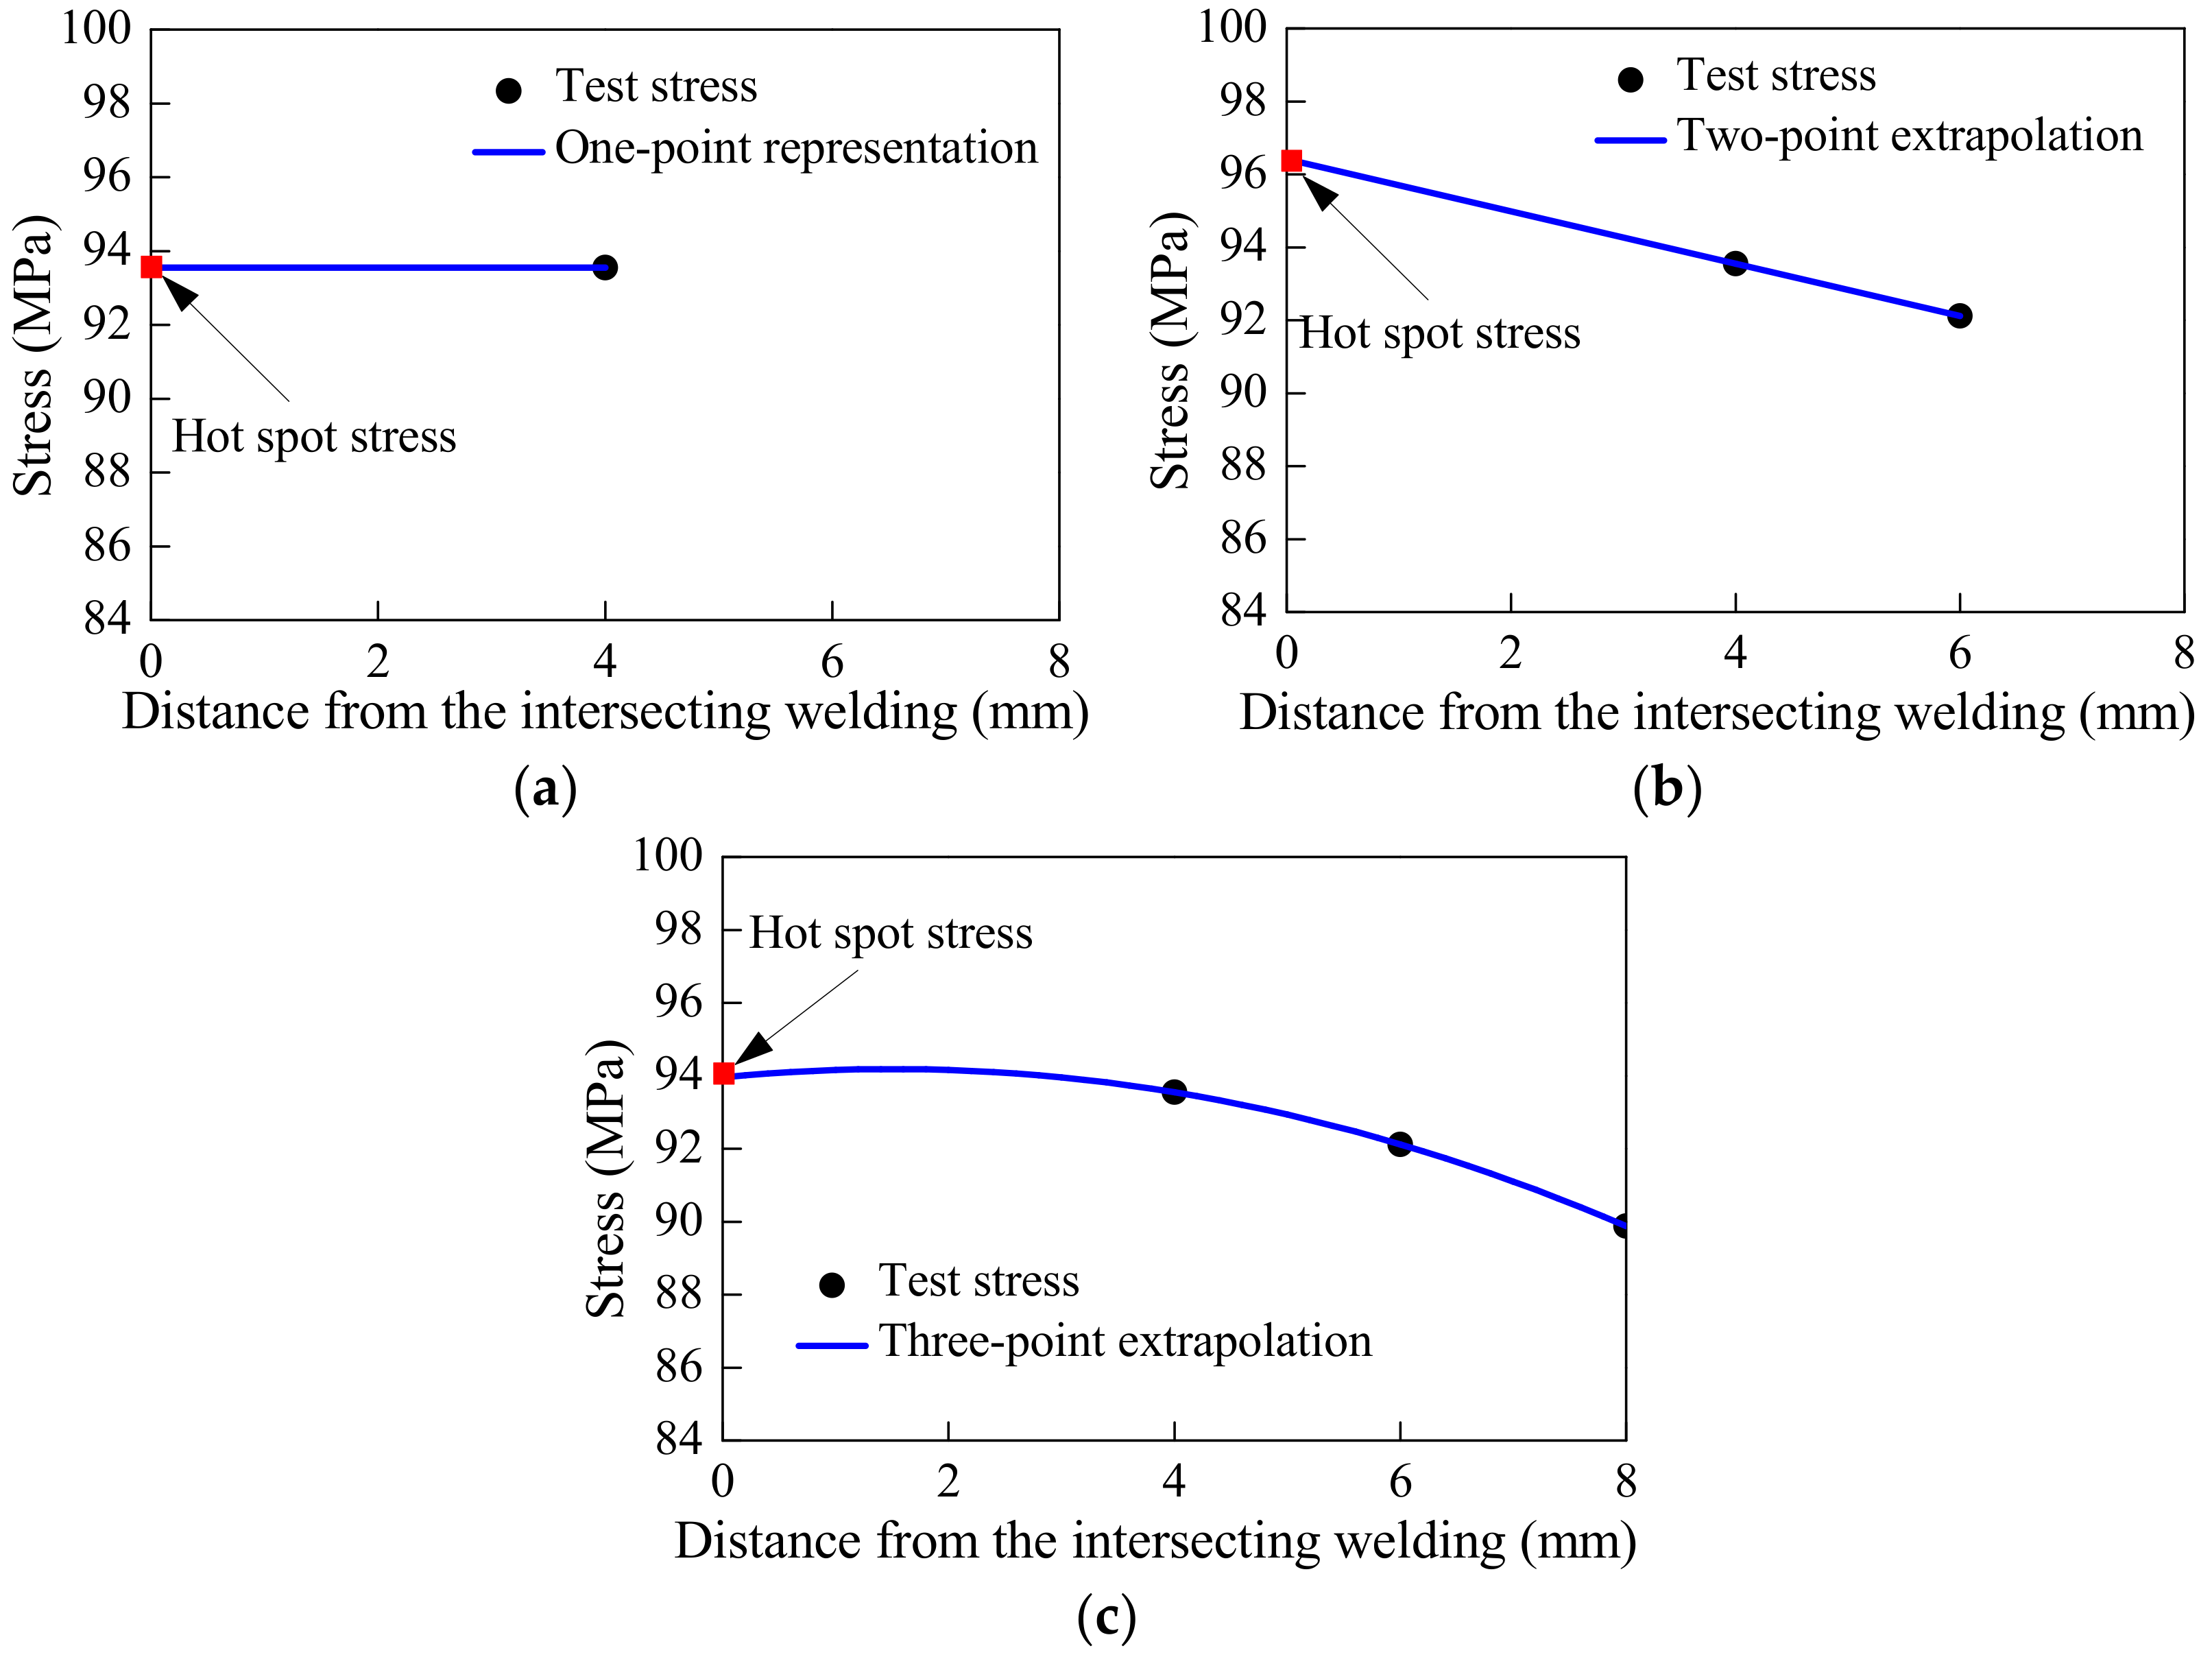
3.1. Extrapolation Methods for Hot-Spot Stress
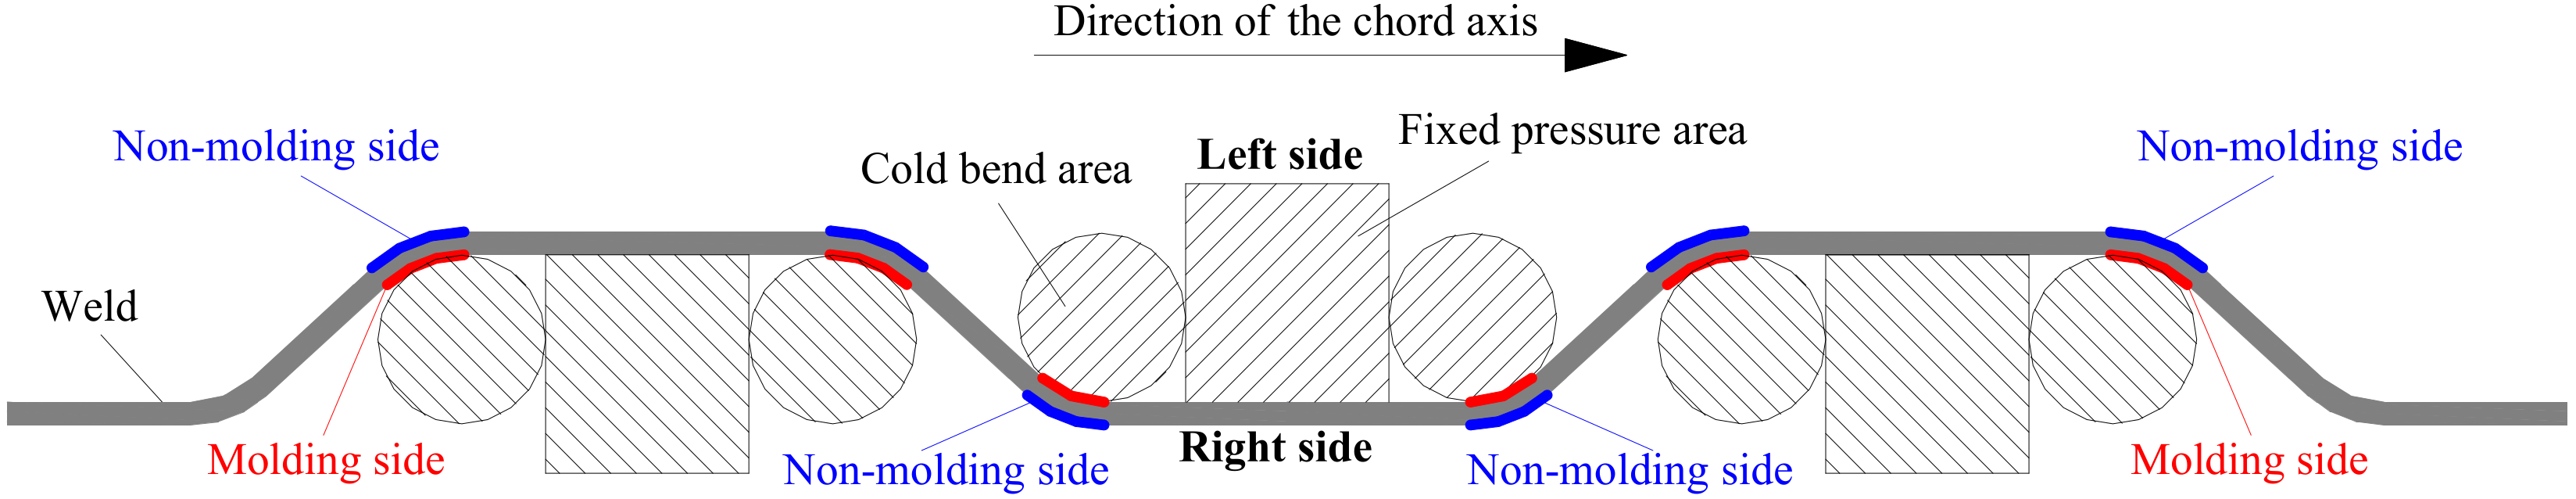
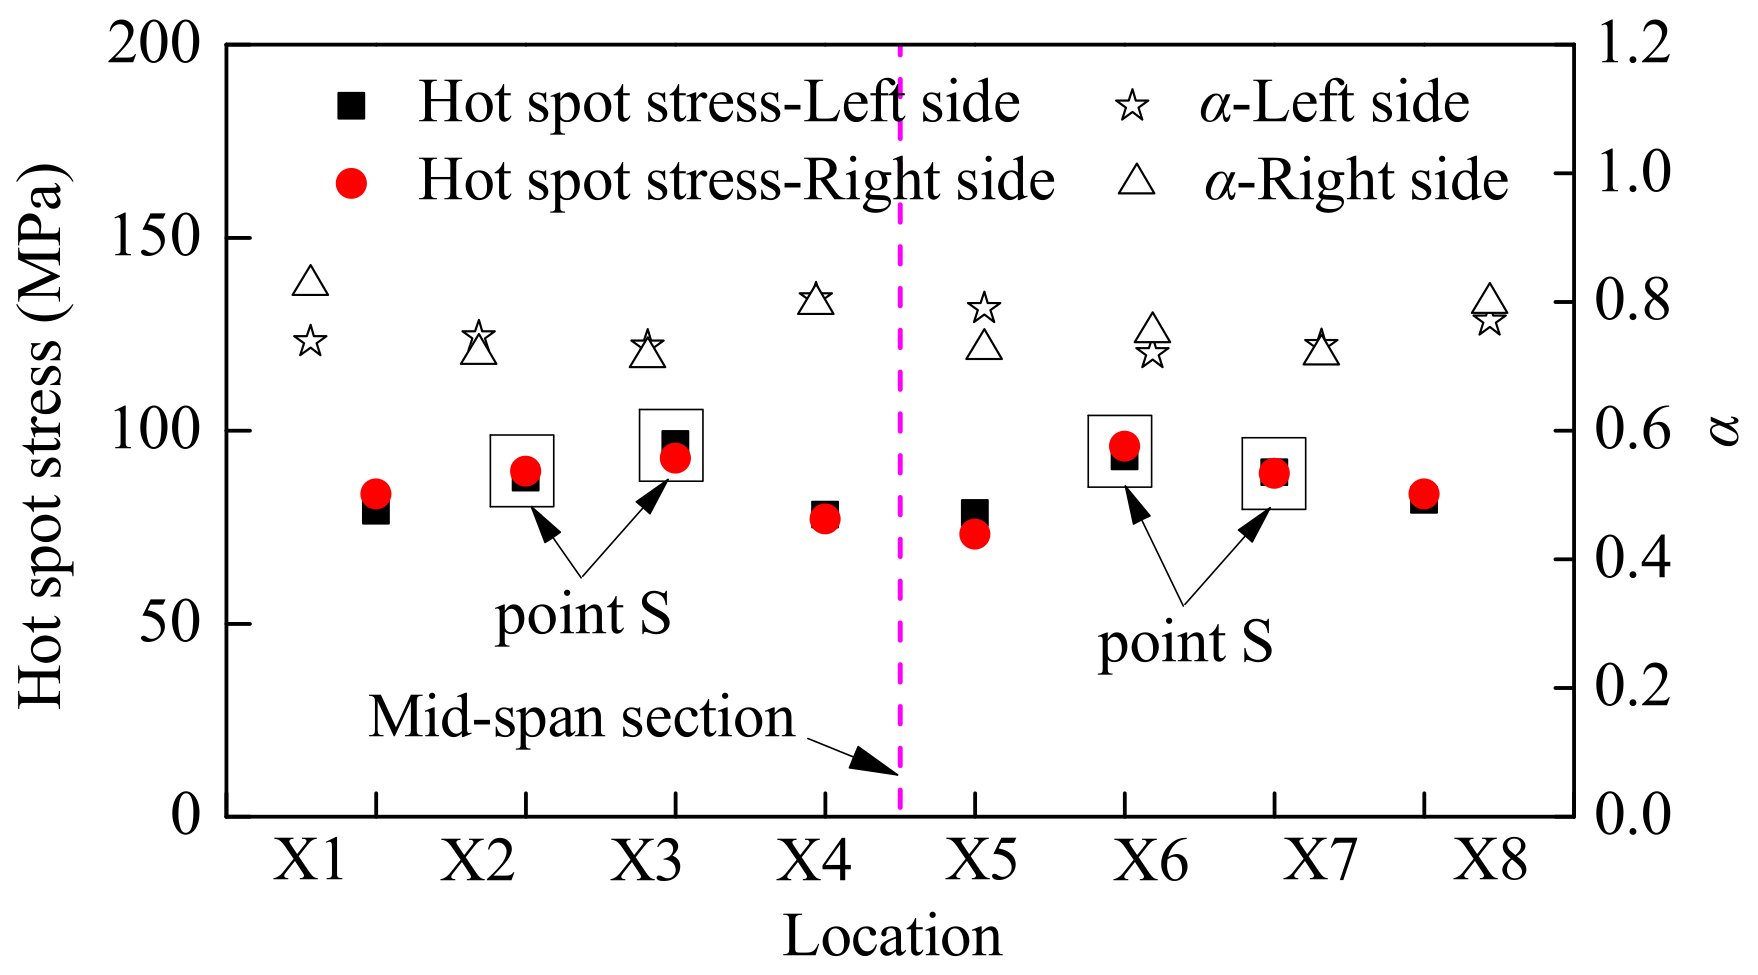
3.2. Hot-Spot Stress Distribution
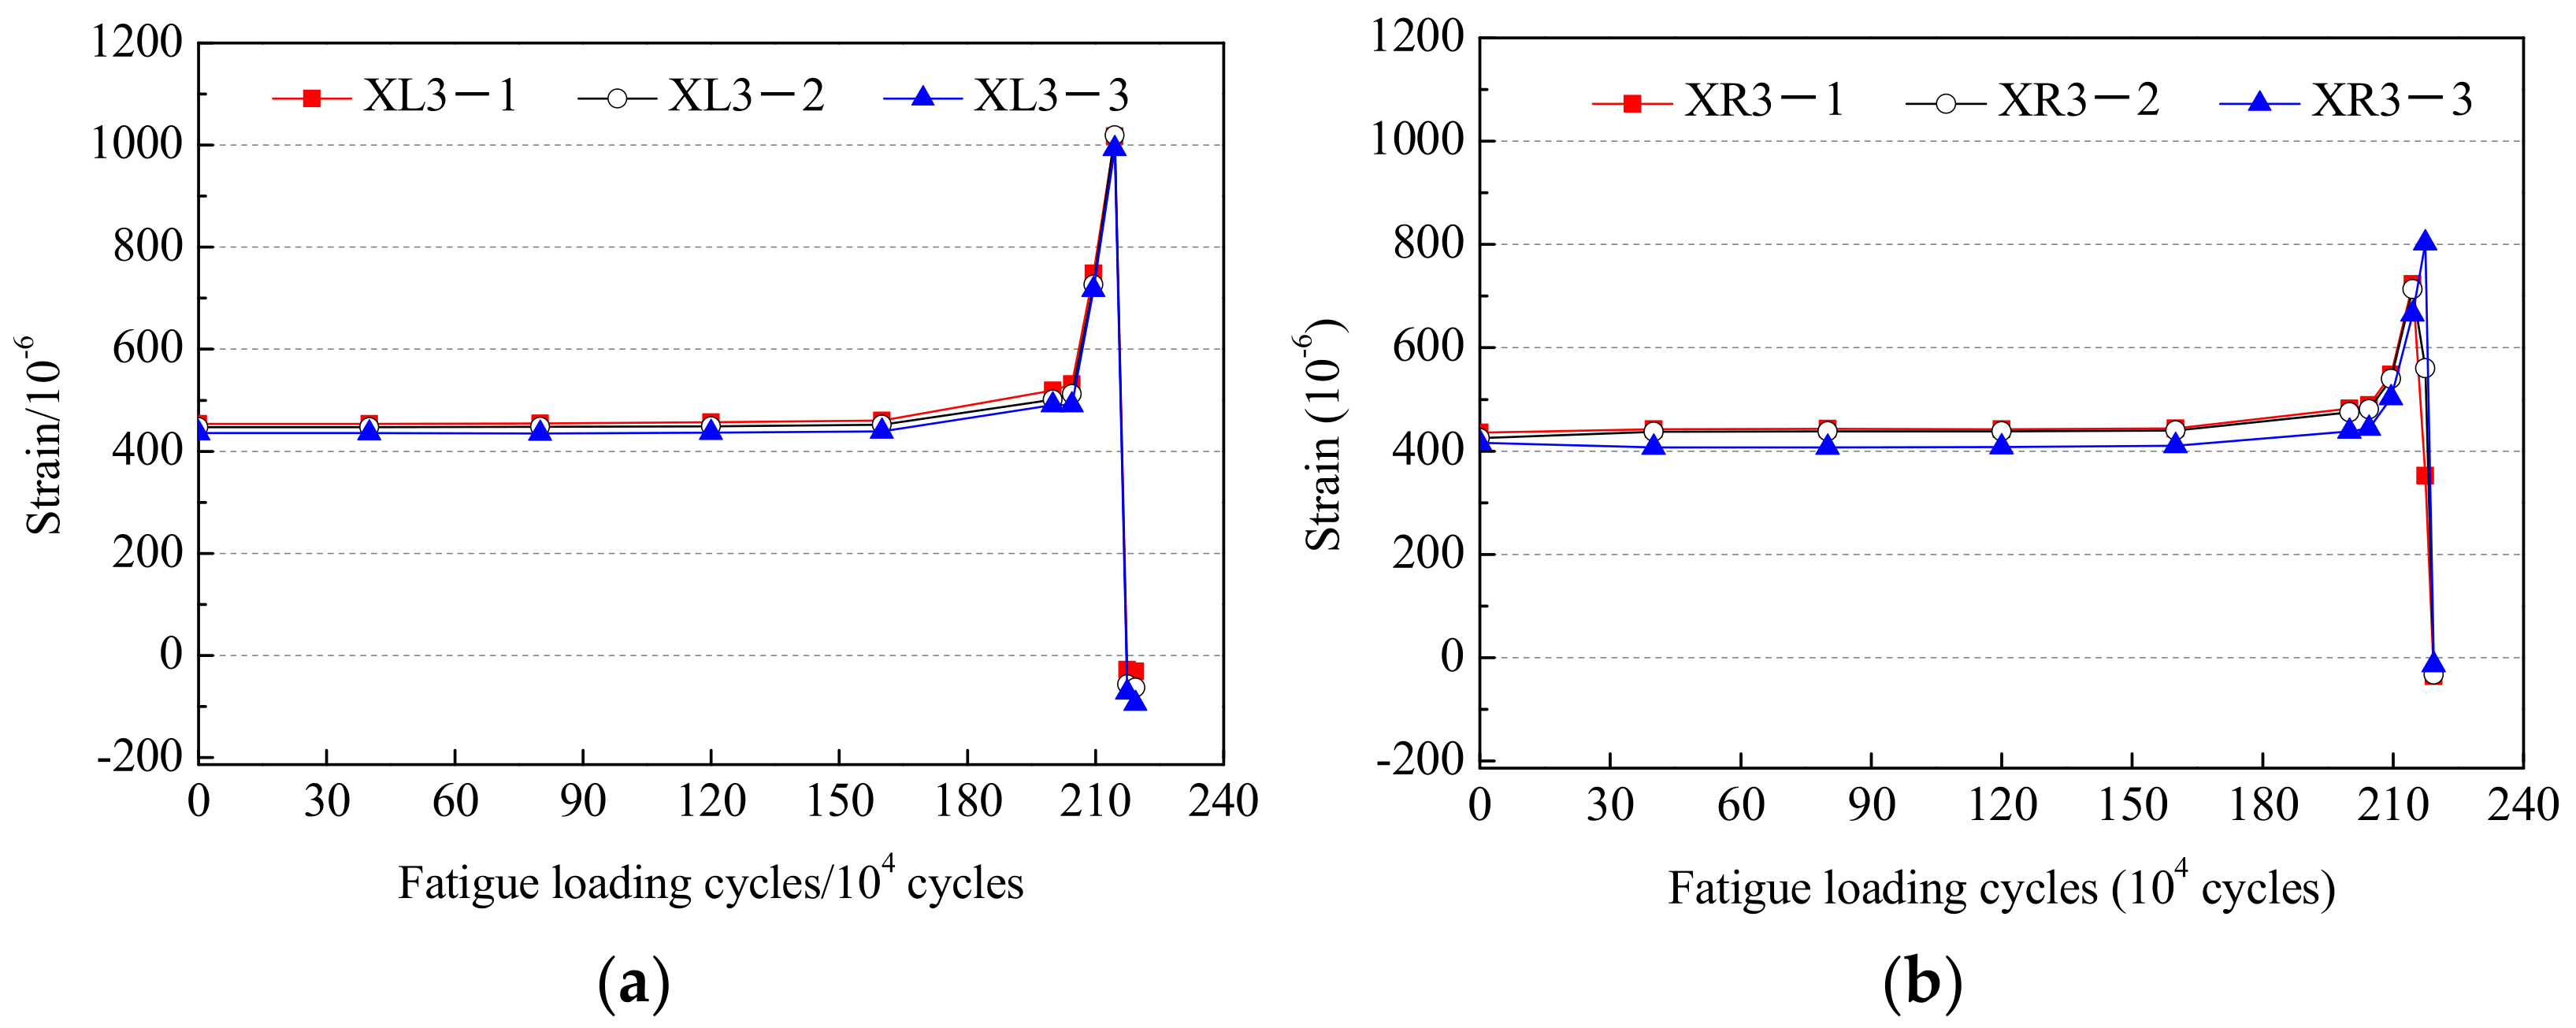
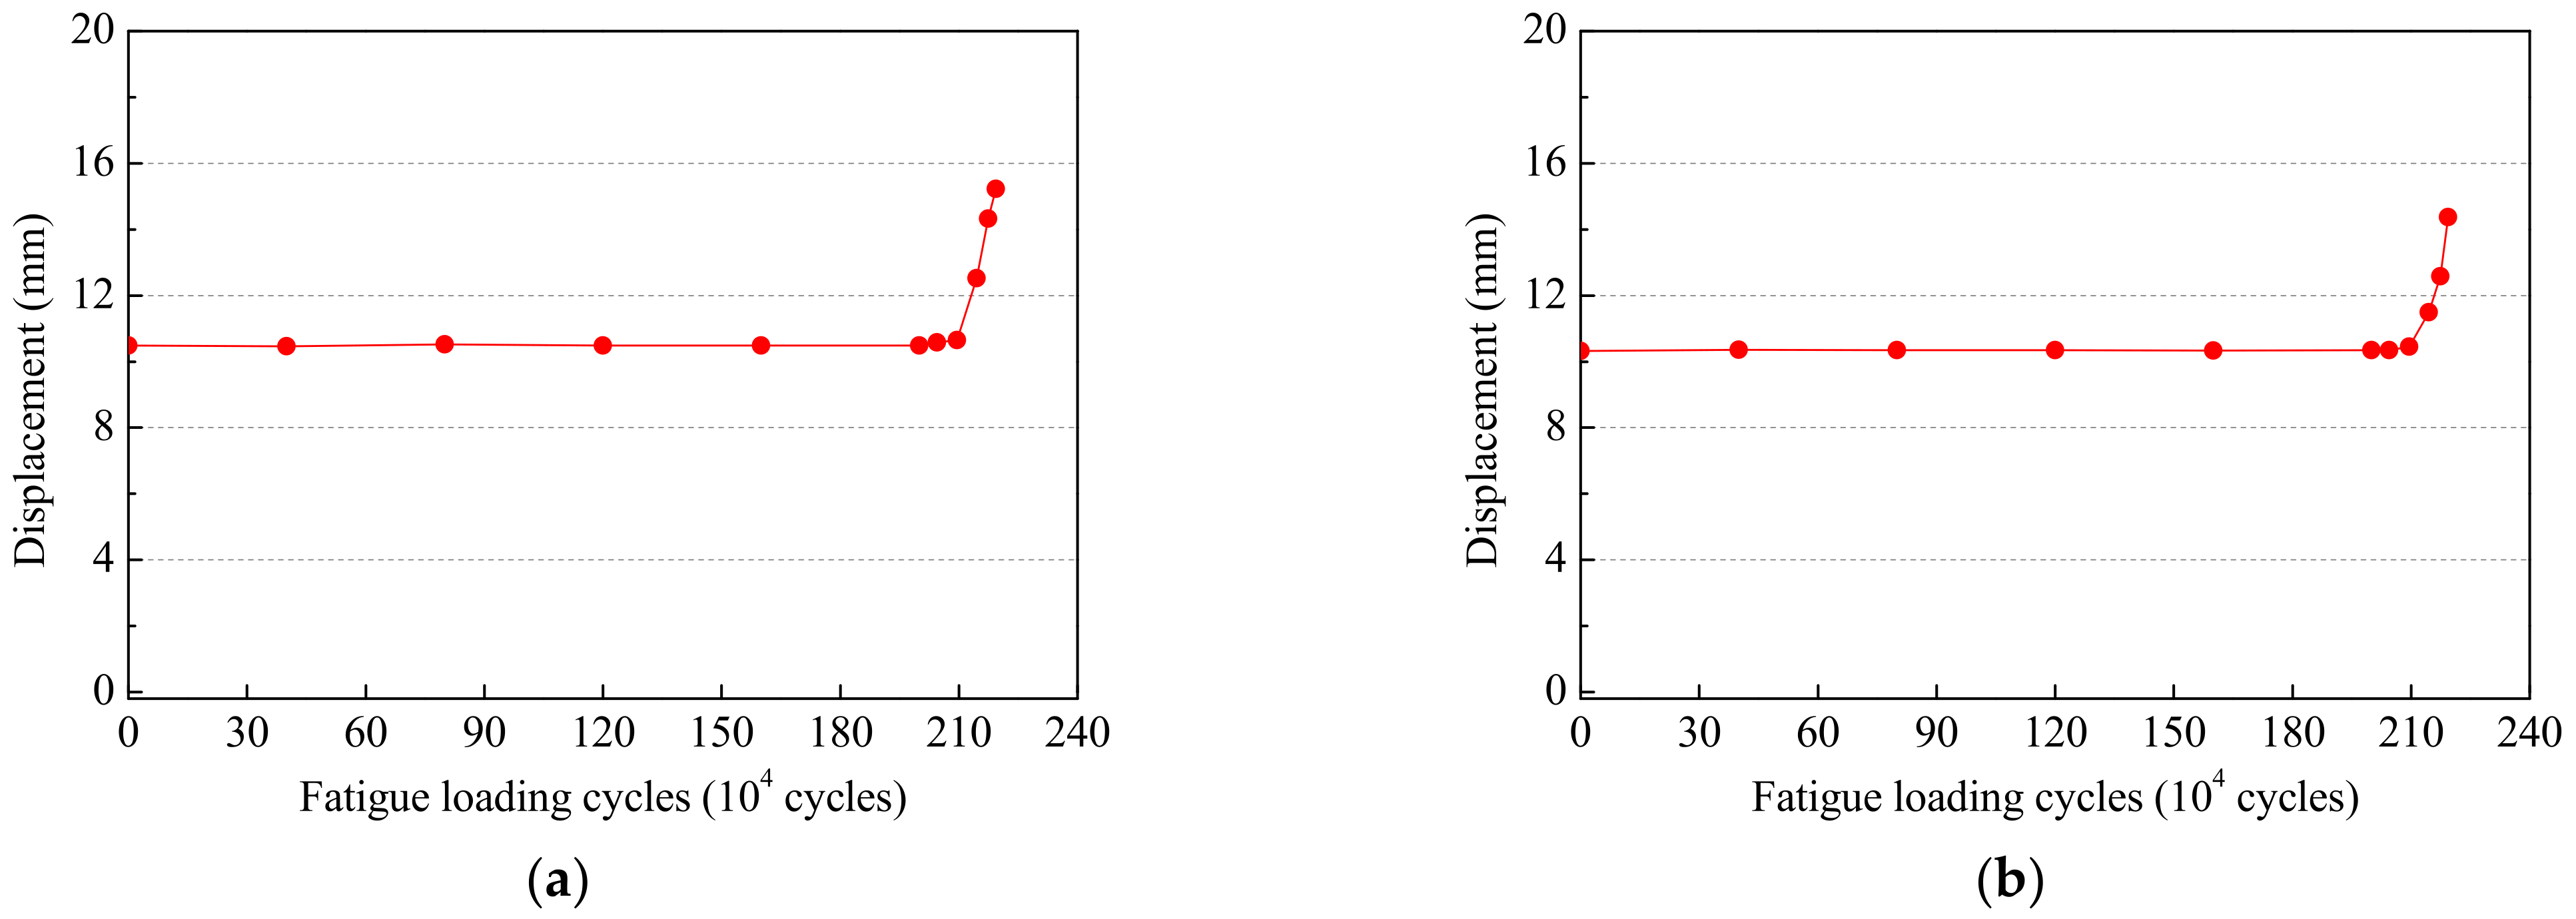
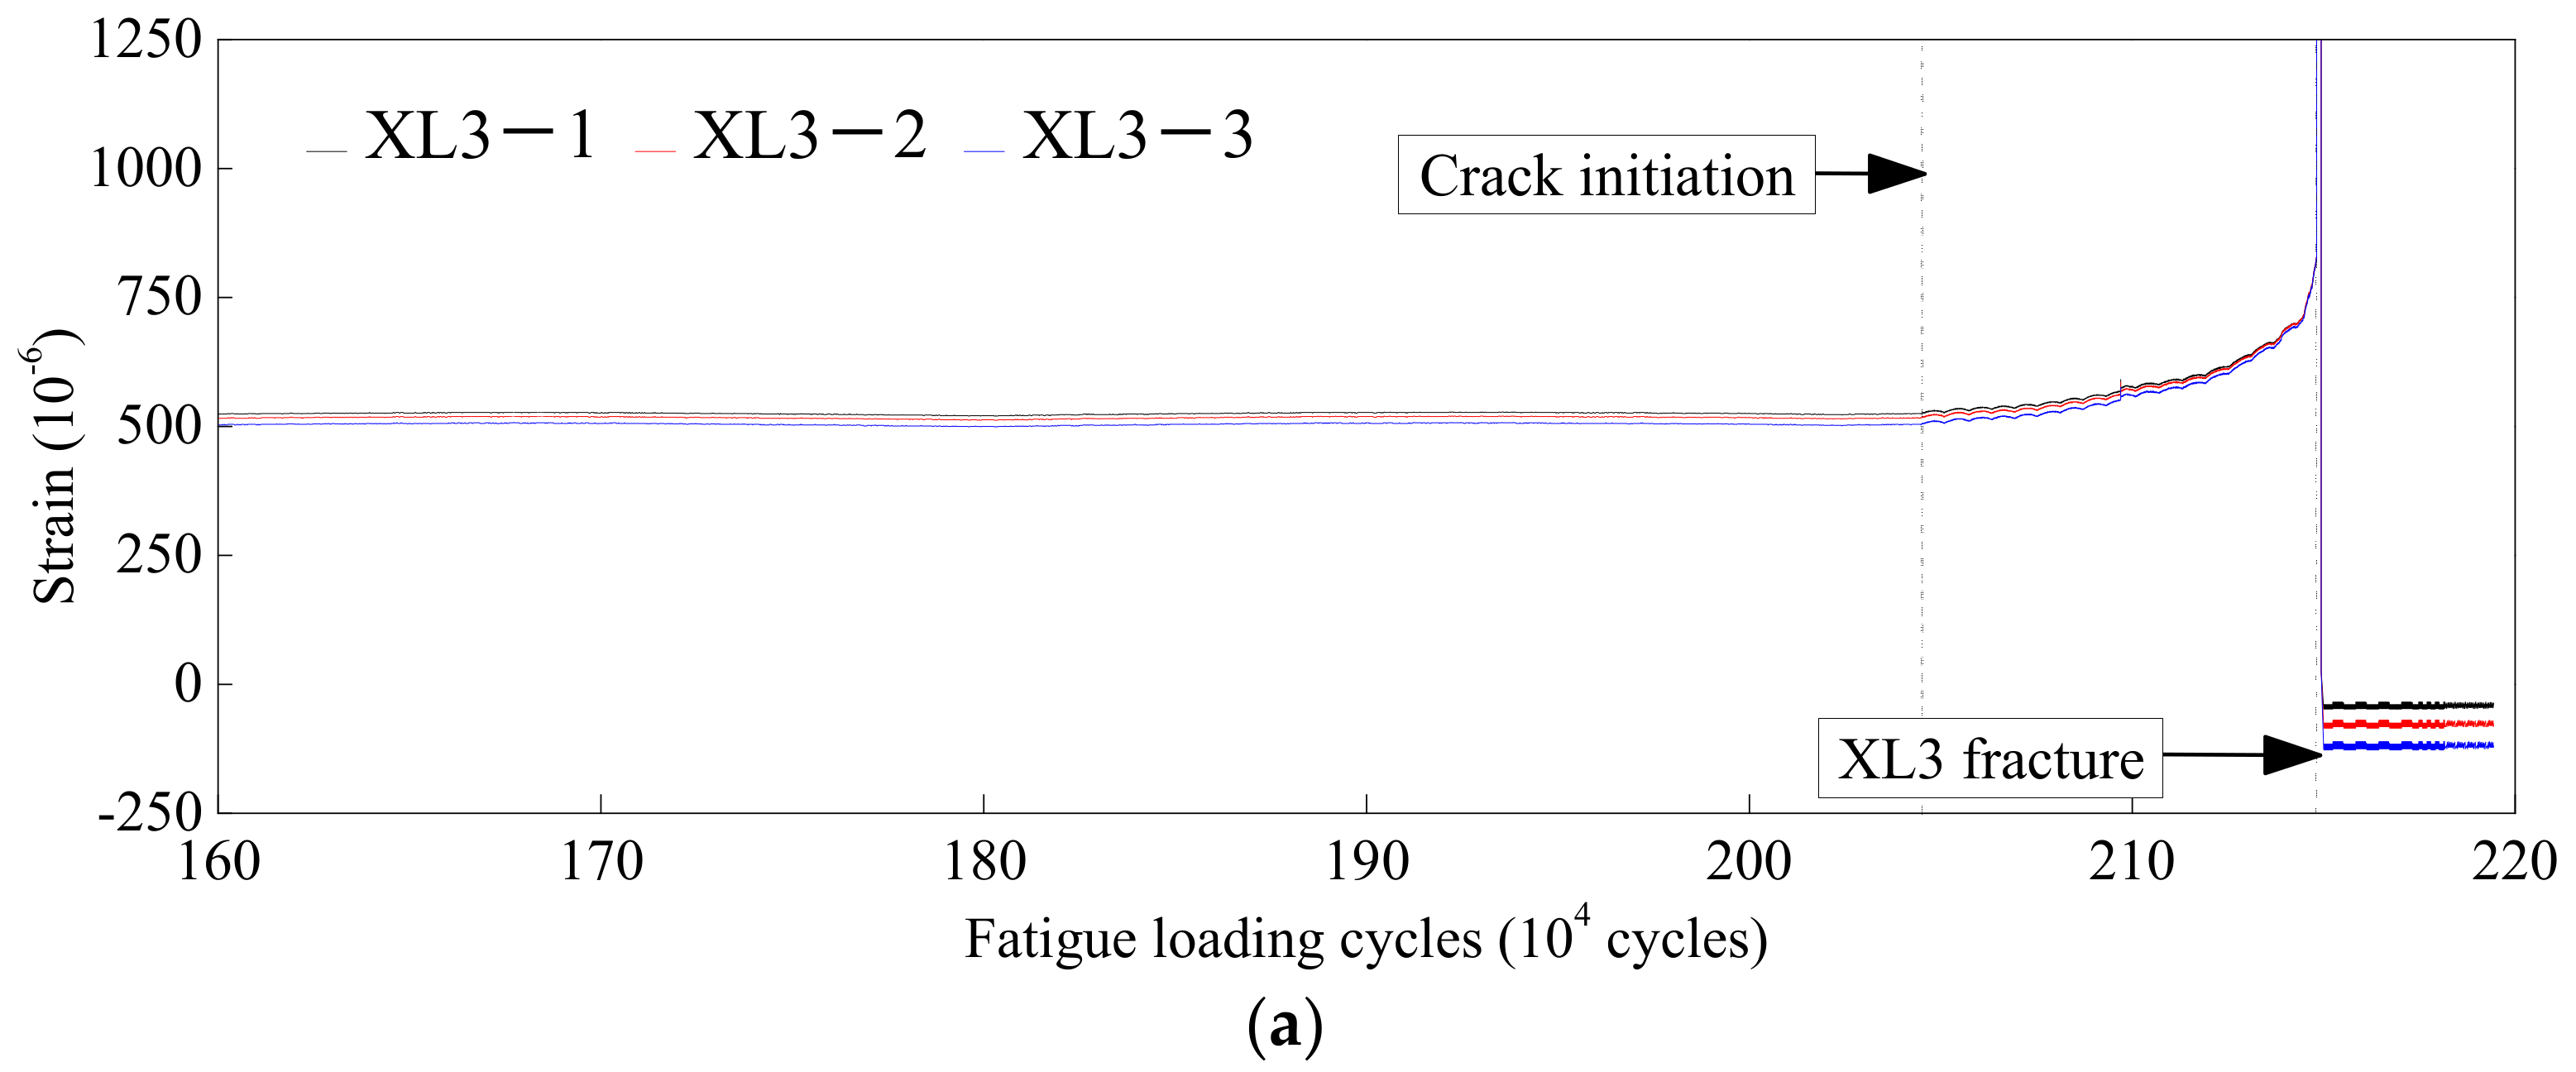
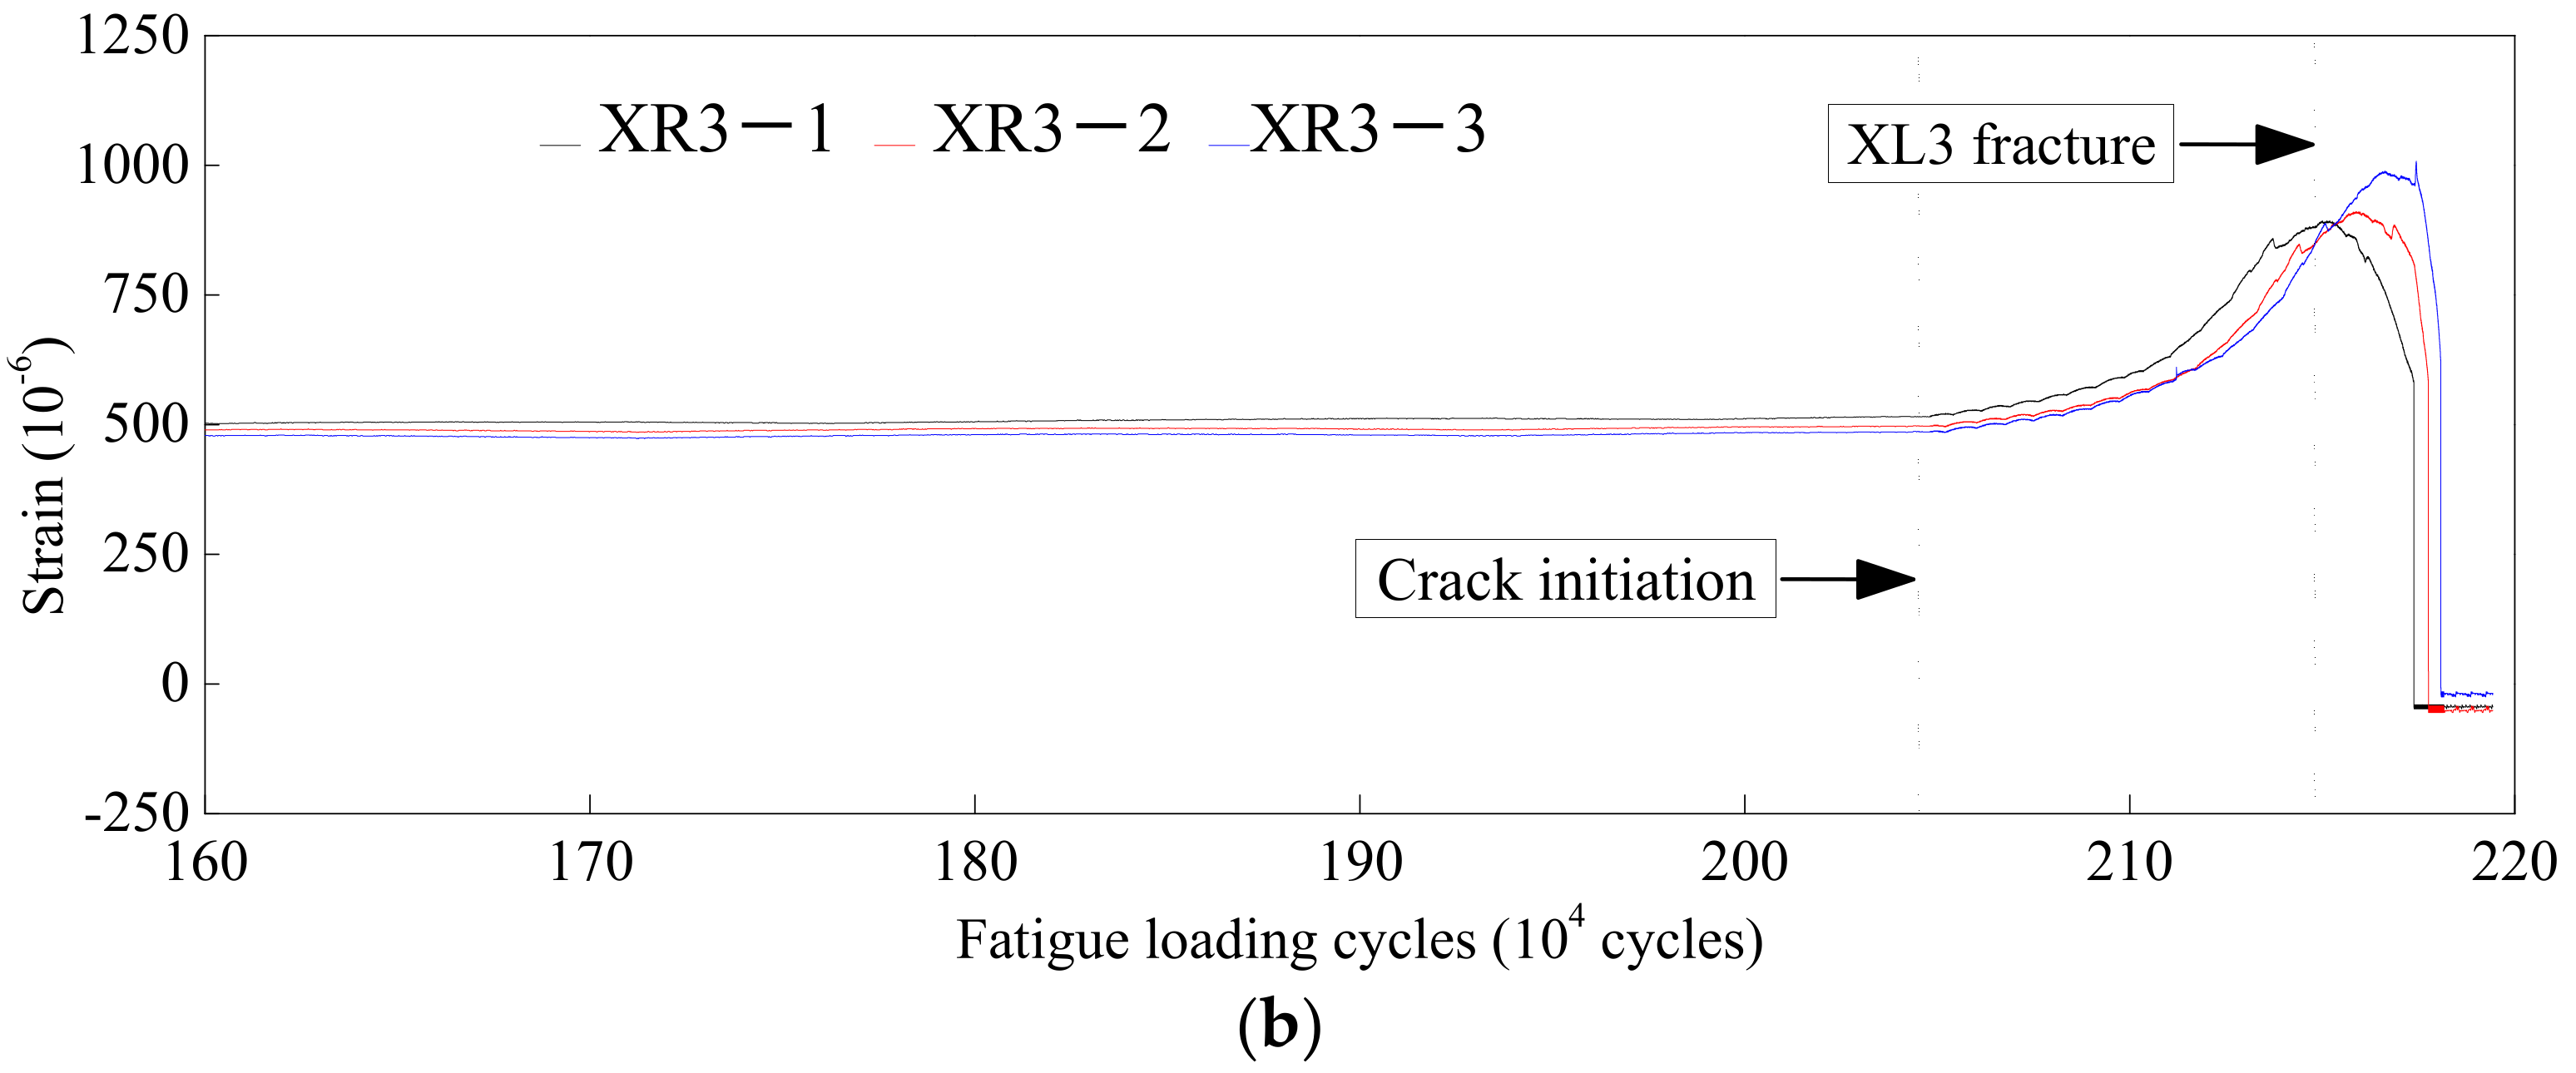
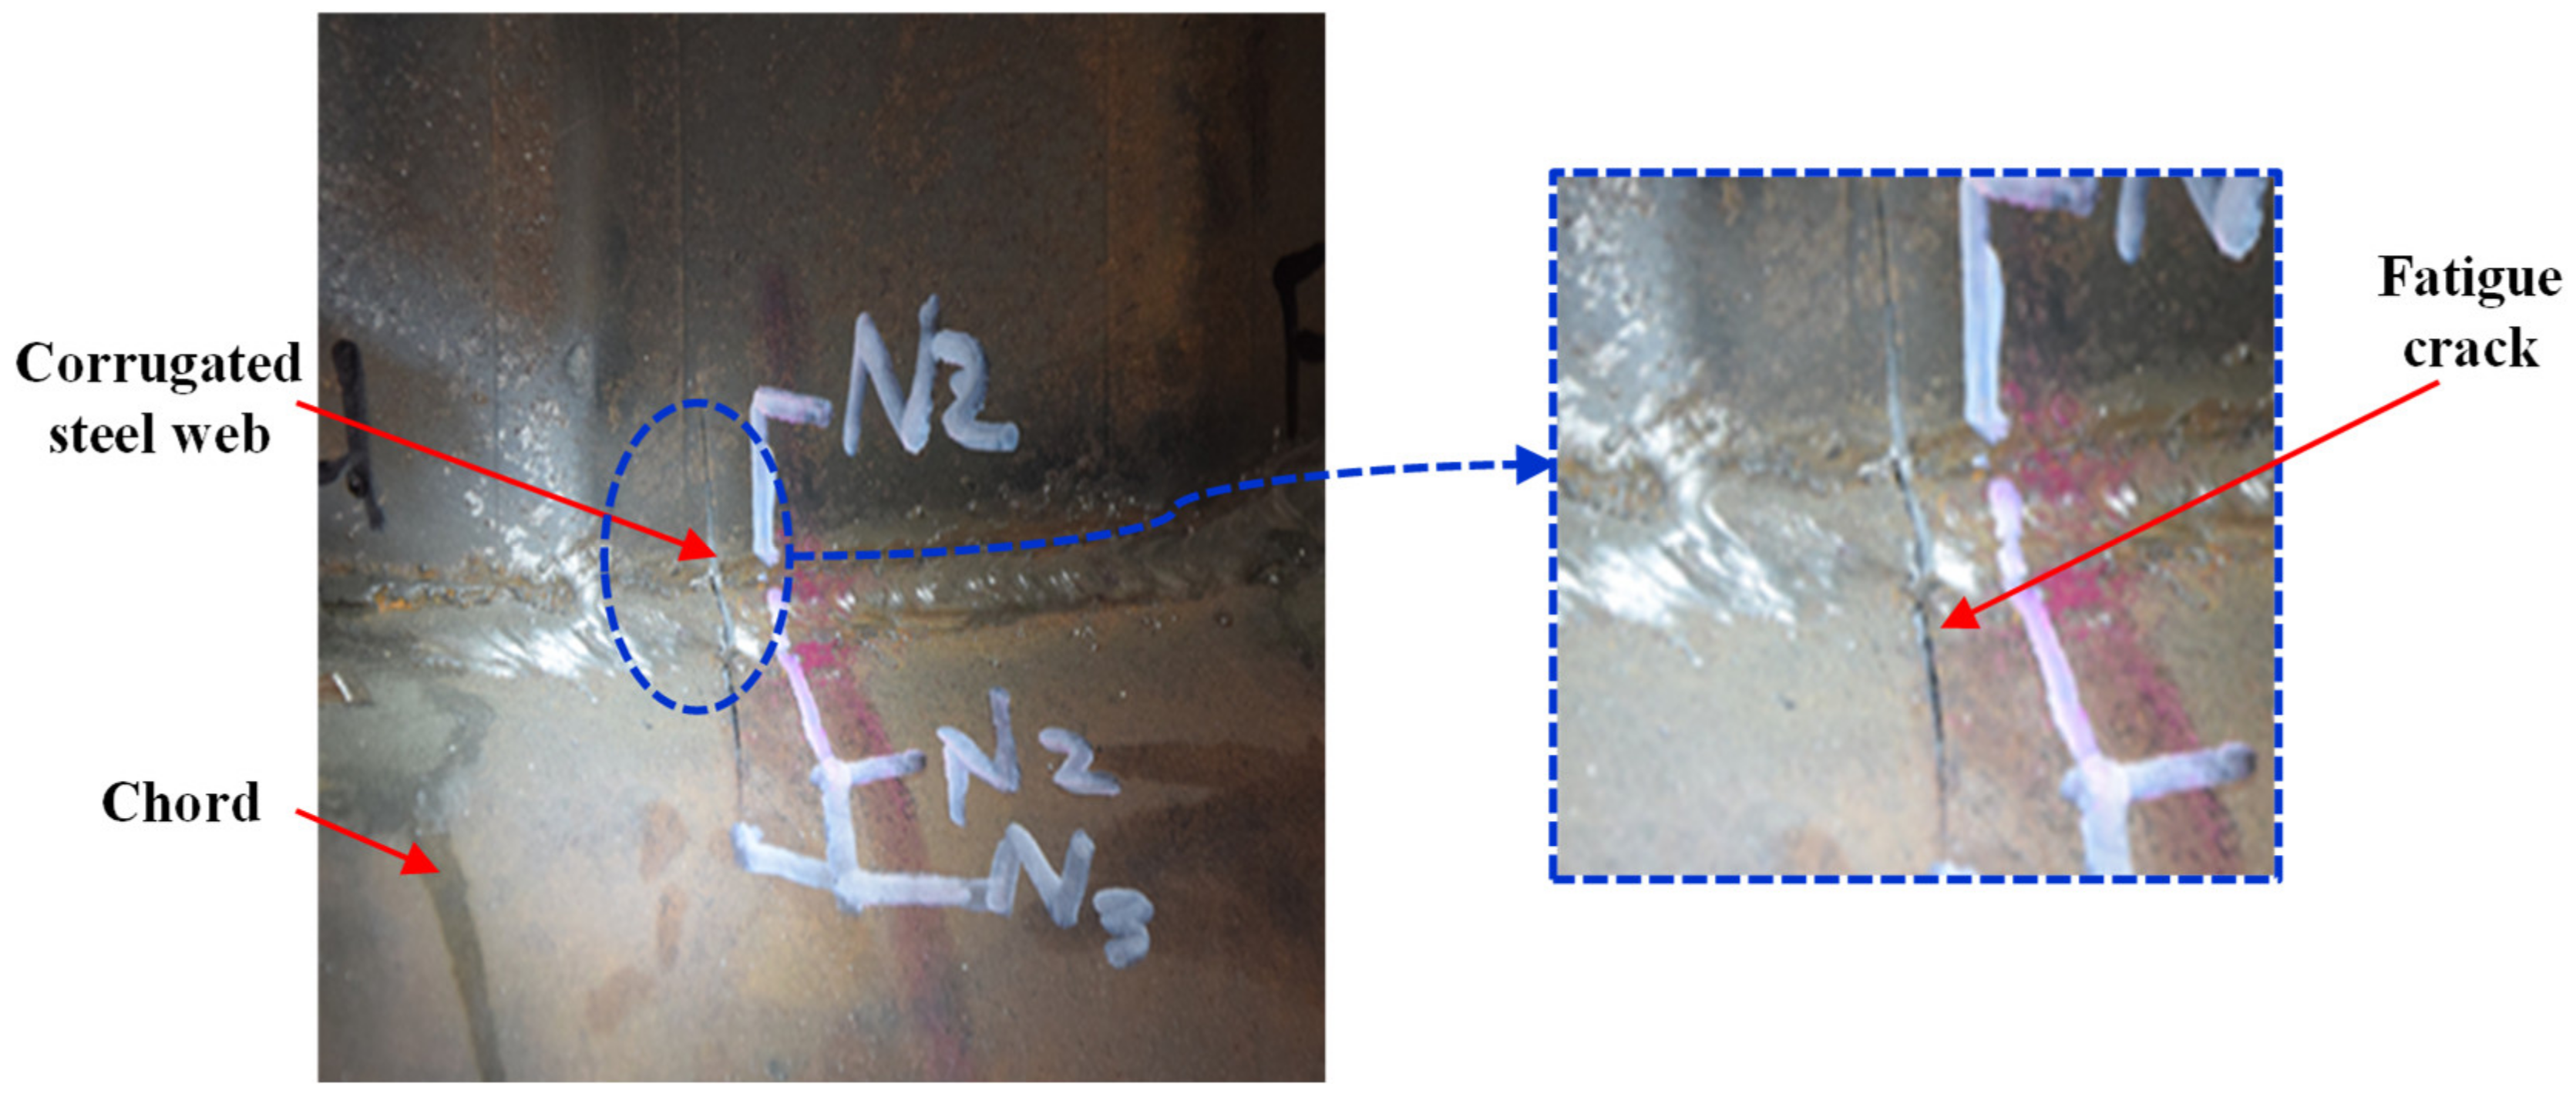
3.3. Fatigue Failure Process
4. Non-Linear Numerical Analysis
4.1. Non-Linear Numerical Analysis Model
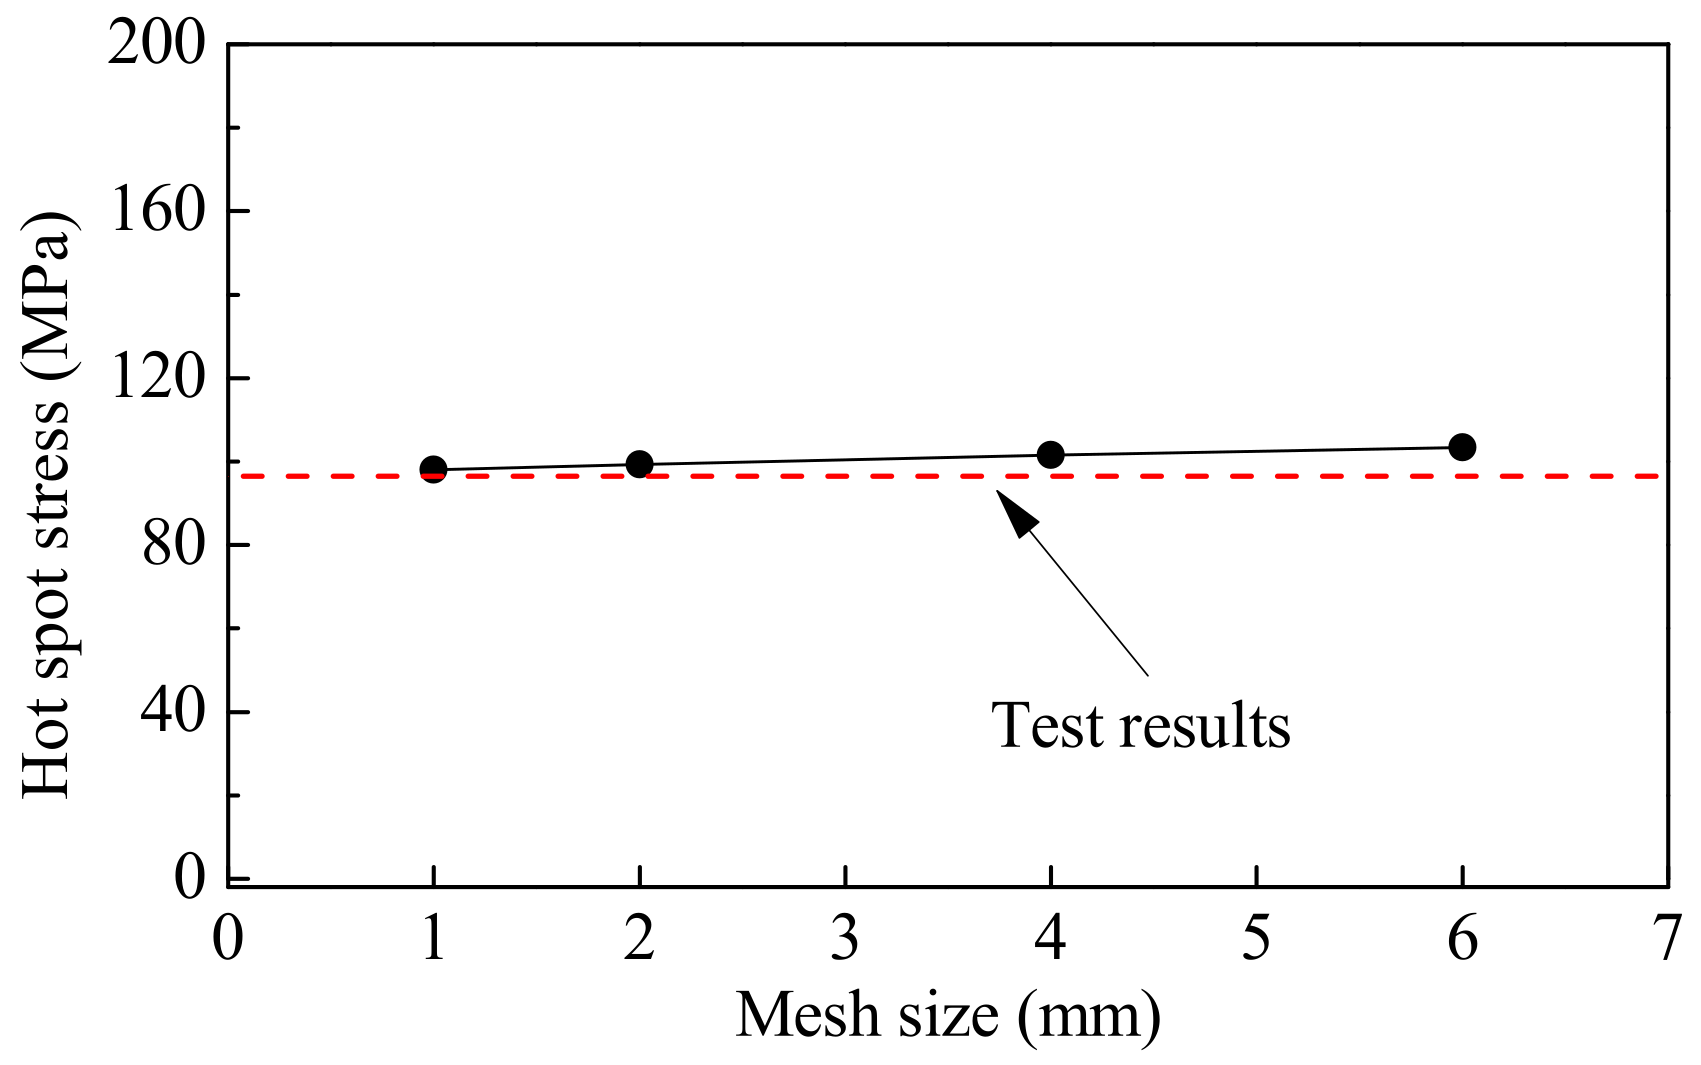
4.2. Sensitivity Analysis of Hot-Spot Stress
5. Fatigue Life Evaluation Method
5.1. Definition of Fatigue Life
5.2. Fatigue Design S-N Curve
6. Conclusions
- (1)
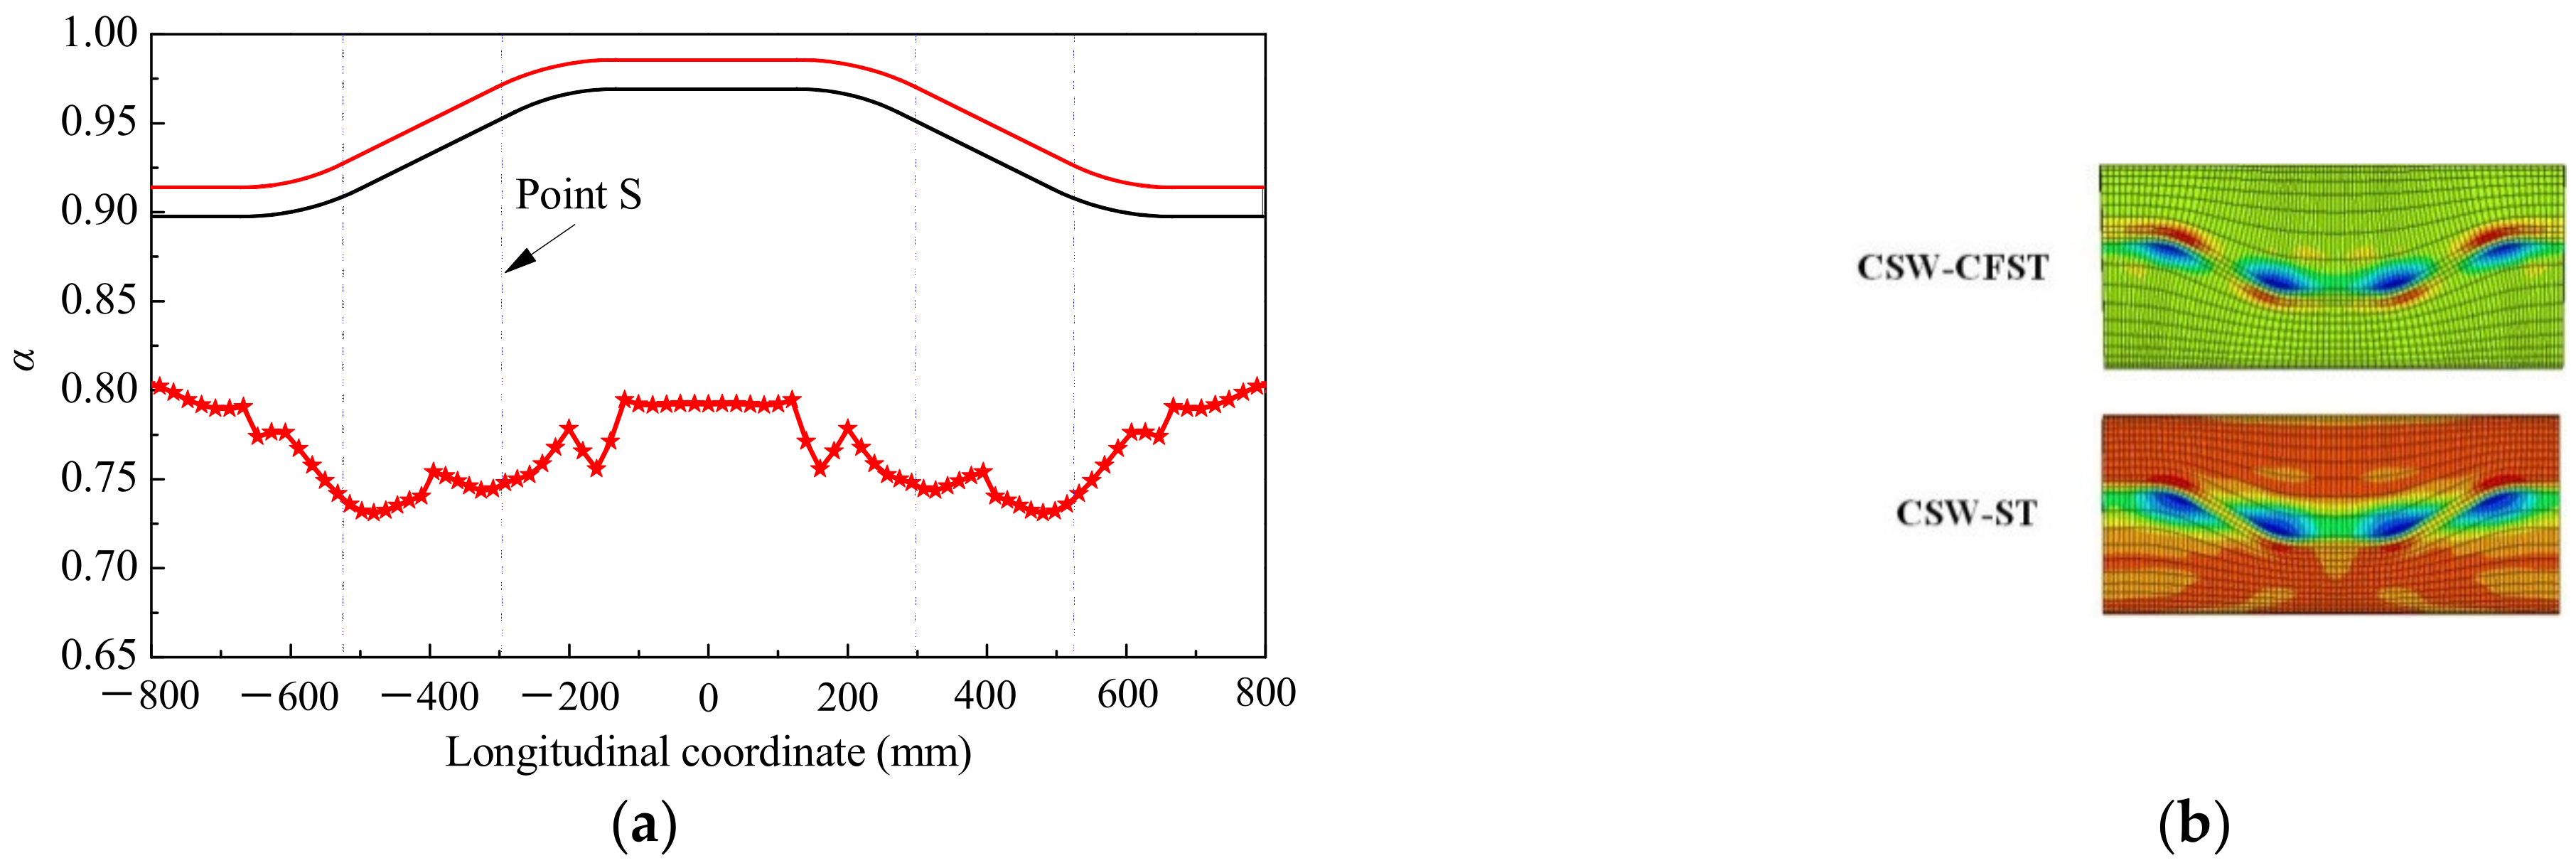
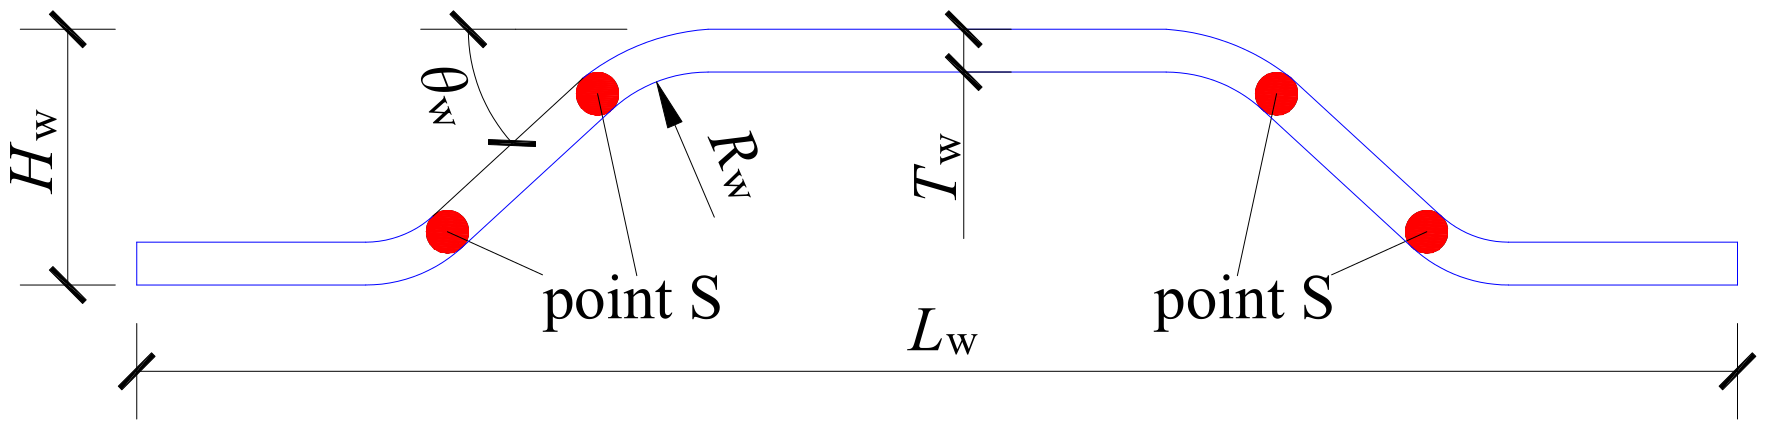
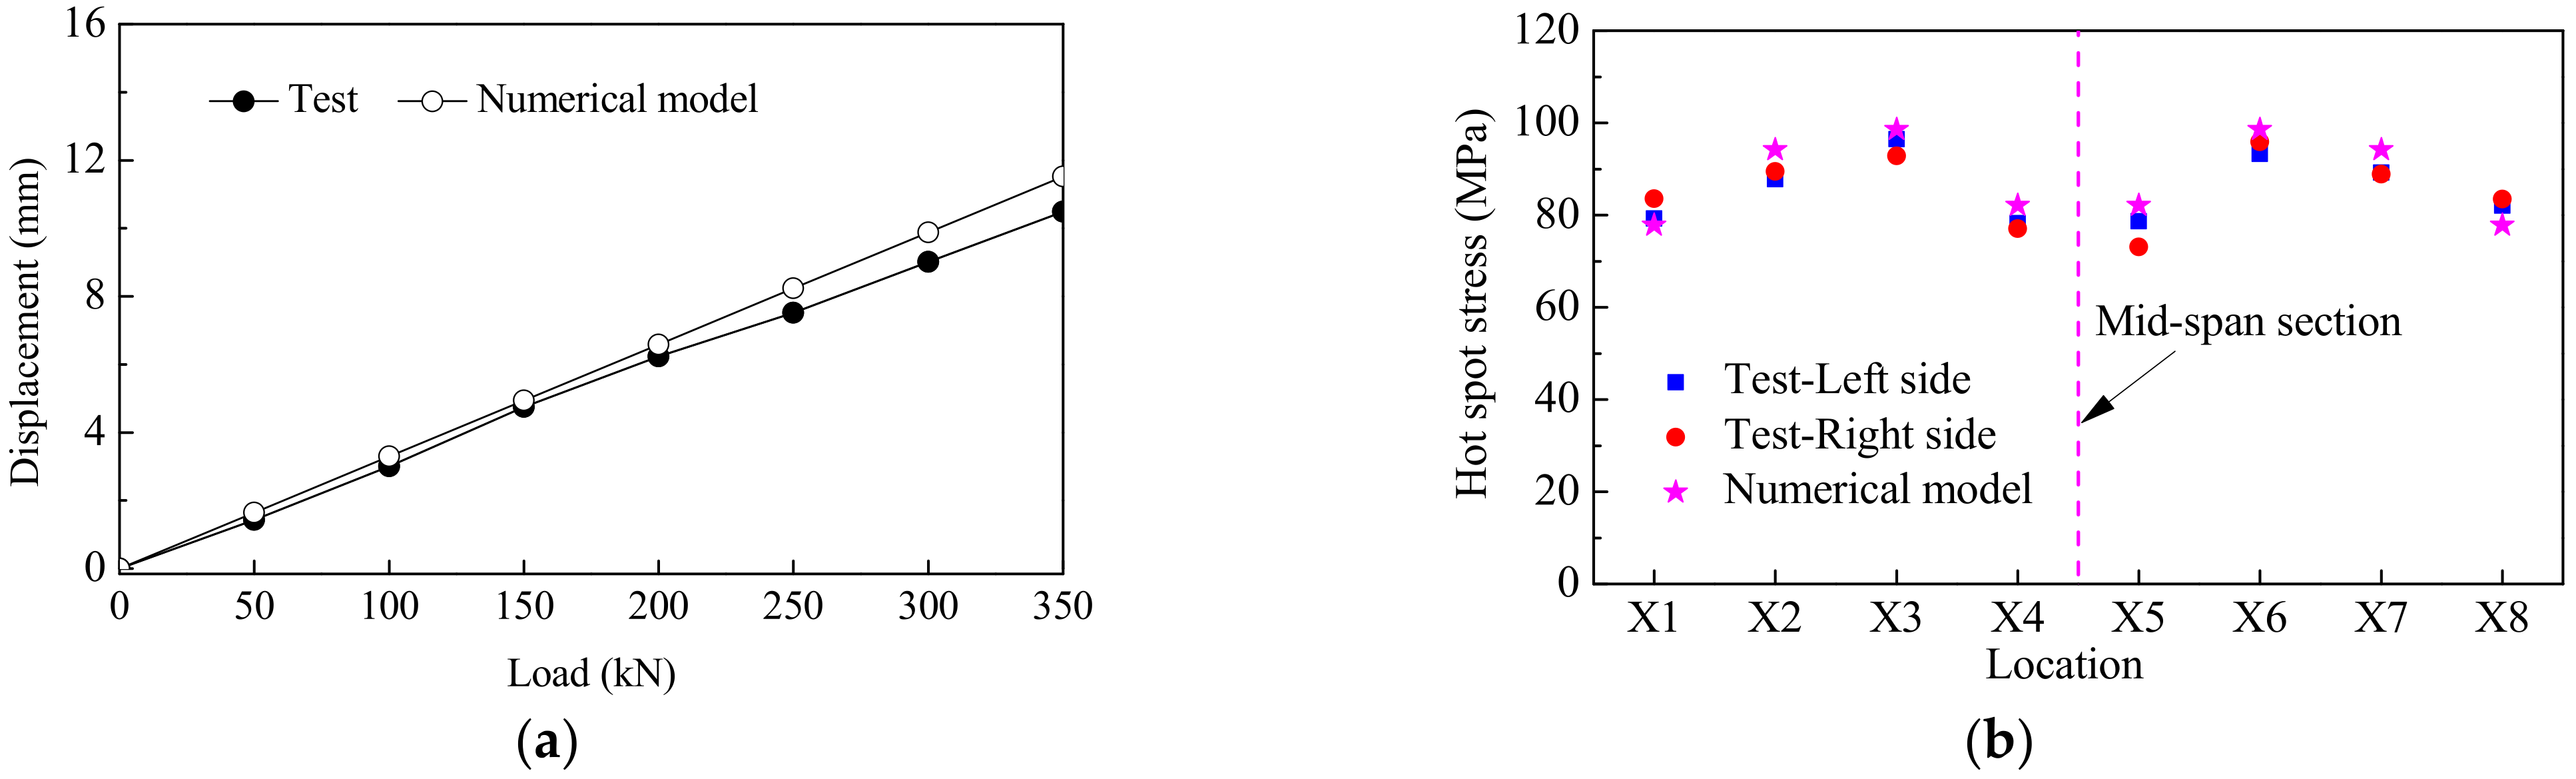
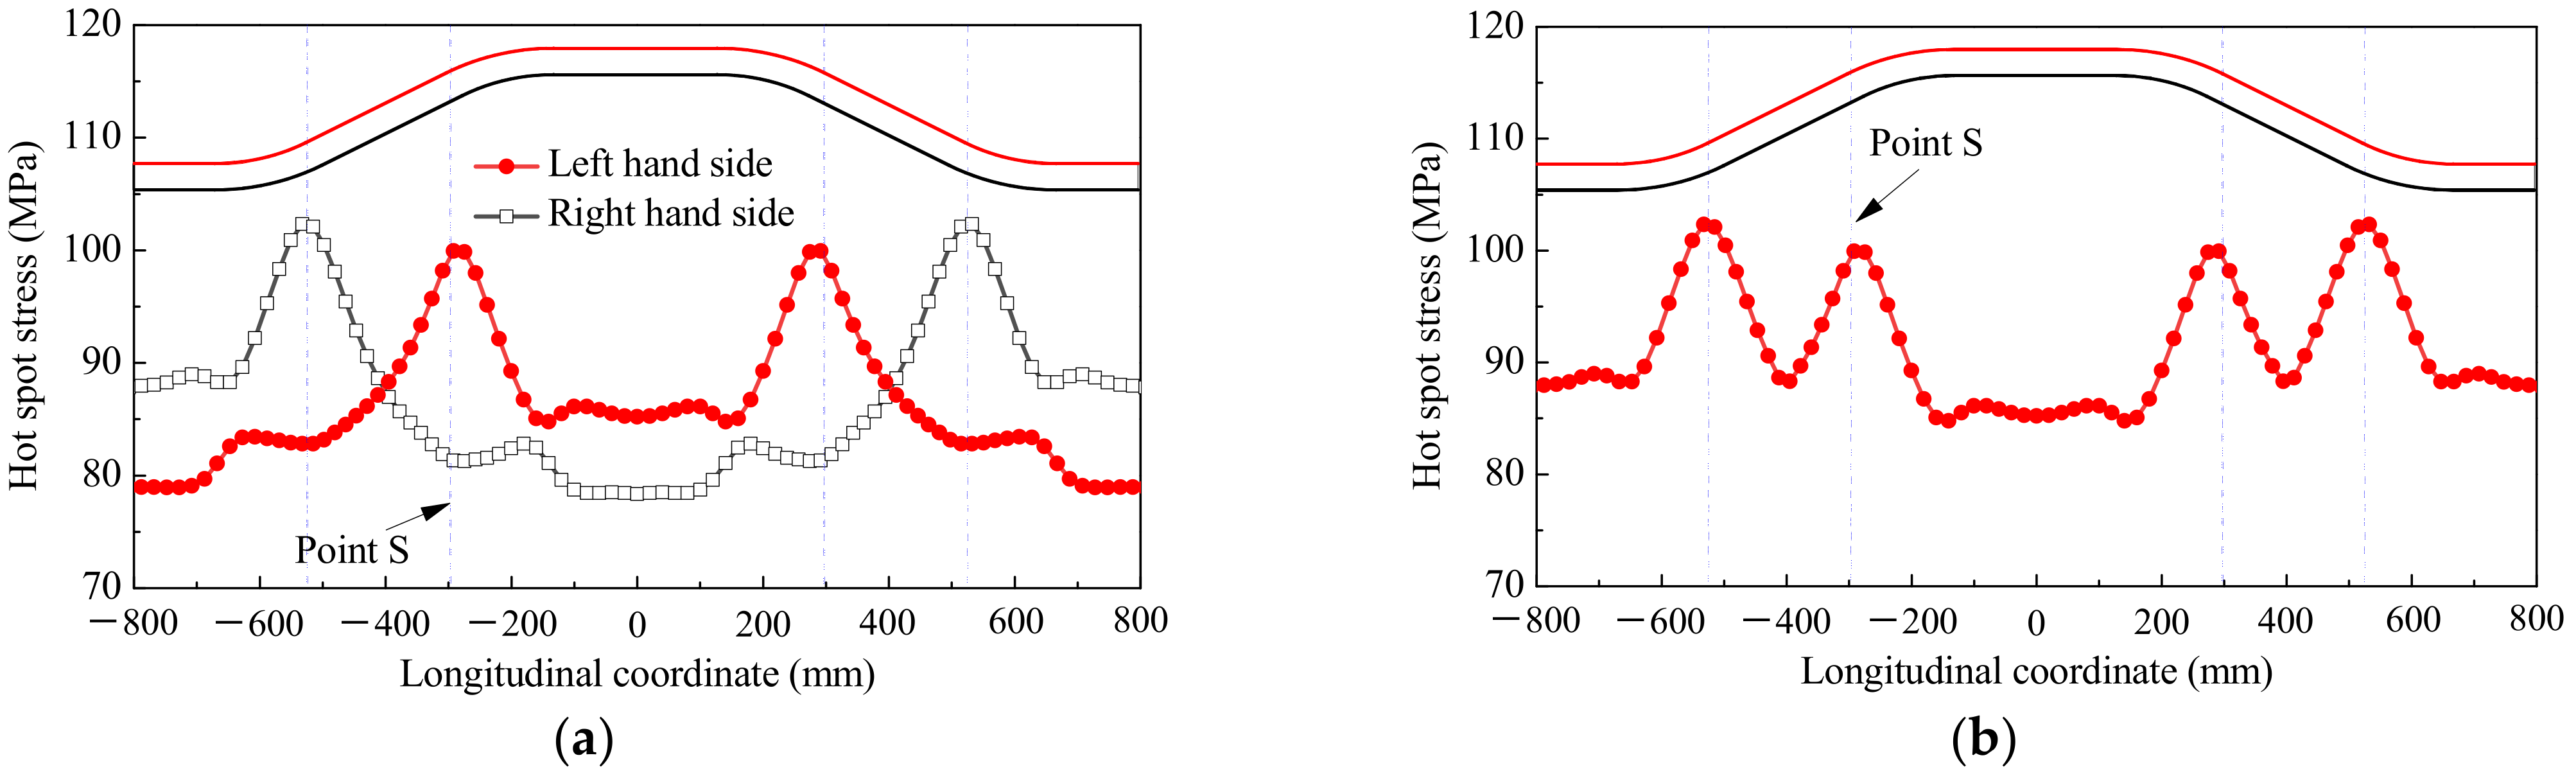
- The fatigue performance test conducted on a composite girder with CSW-CFST truss chords demonstrated that the hot-spot stress in a composite girder with CSW-CFST and CSW-ST truss chords can be obtained by the two-point extrapolation method. The extrapolation interval and measurement point layout can be determined from the CIDECT specifications. The maximum hot-spot stress position was at point S, which was the next-nearest point to the mid-span section.
- (2)
- The maximum hot-spot stress at the left- and right-hand-sides of the intersecting weld did not occur at point S of the same section, and the hot-spot stress in the inclined web segment was markedly greater than that in the straight web segment.
- (3)
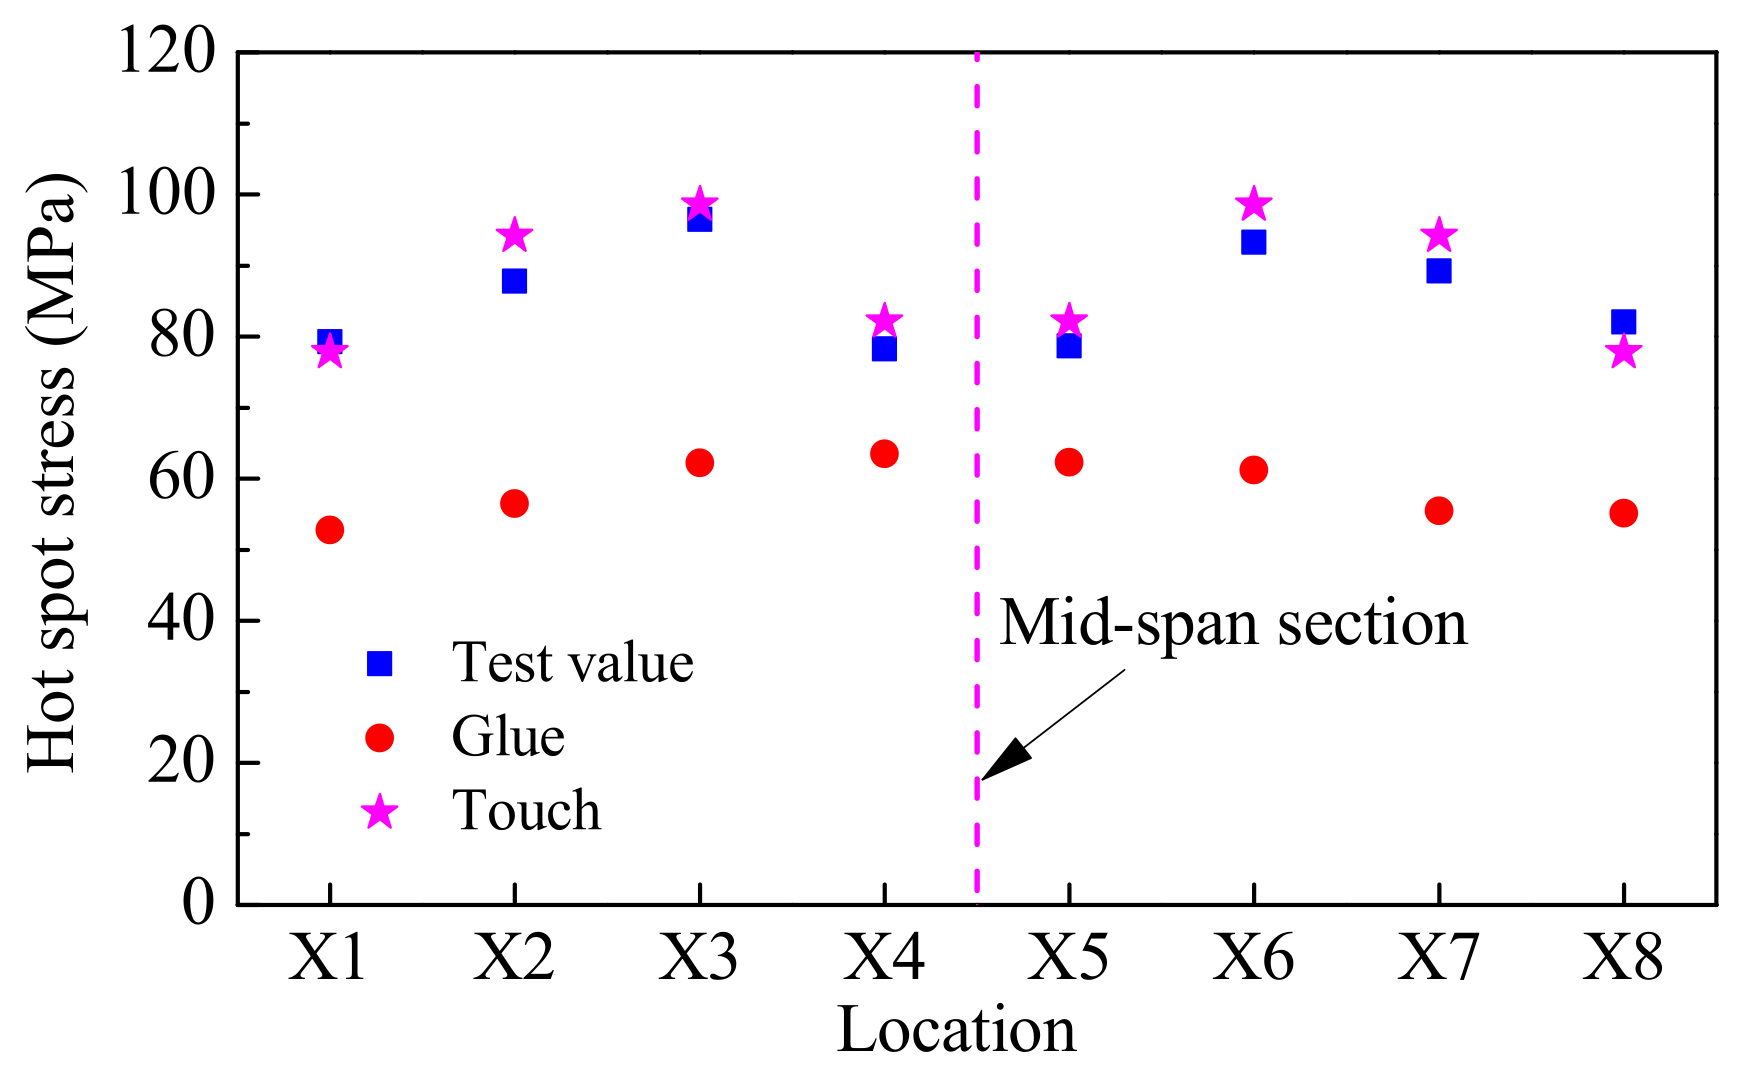
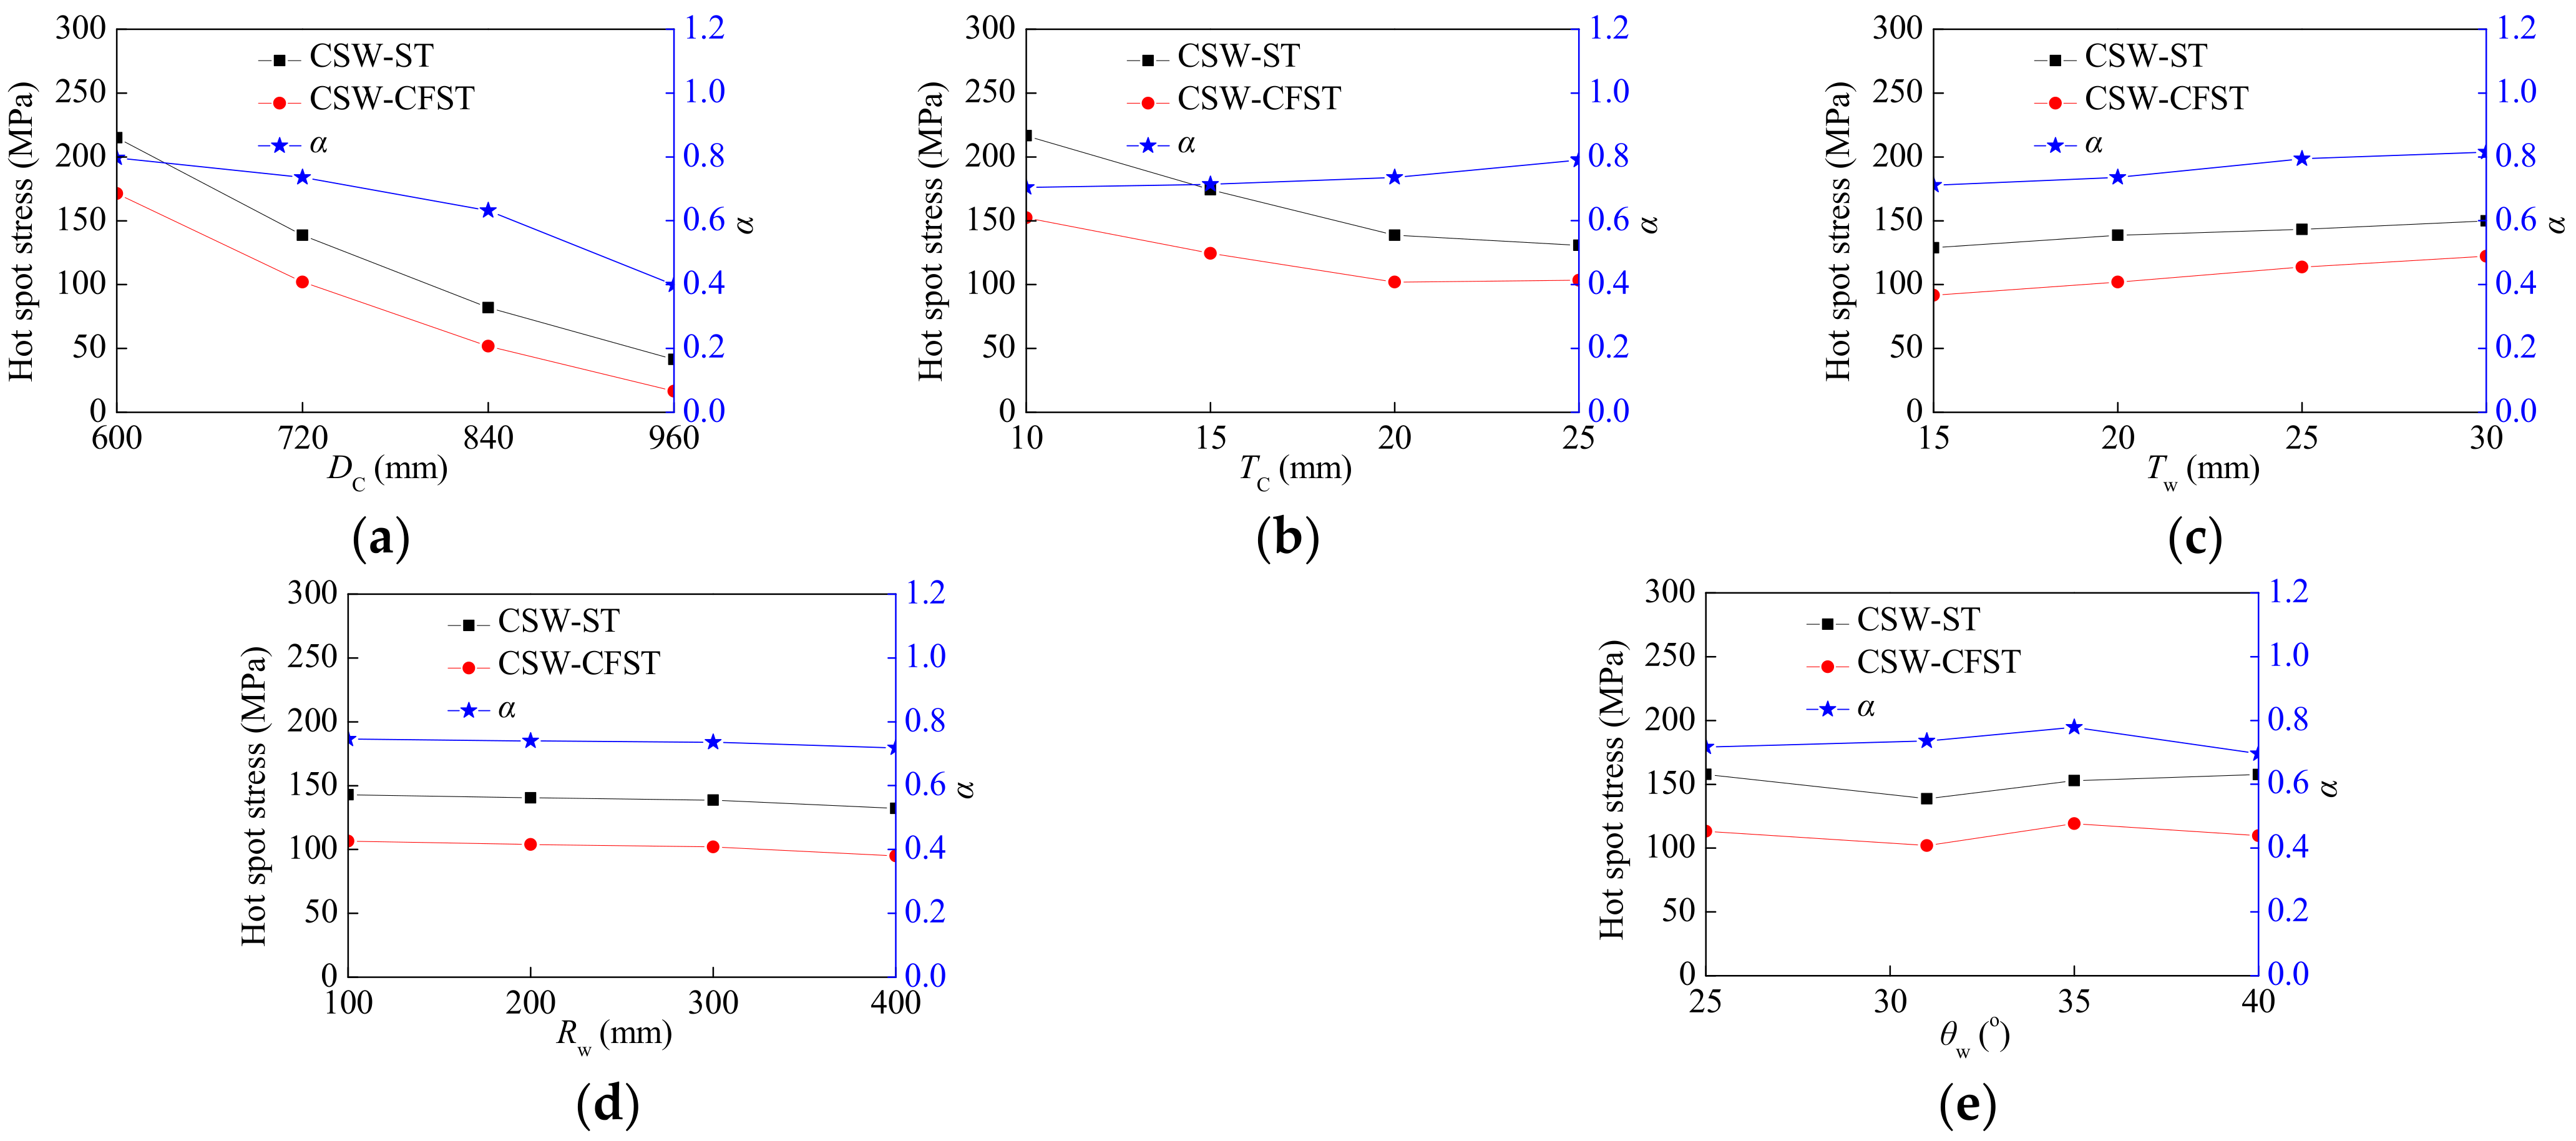
- When the chord is filled with concrete, the hot-spot stress distribution in the intersecting weld zone between the corrugated steel web and the chord is more uniform. The maximum hot-spot stress of a composite girder with CSW-CFST truss chords can be decreased by 18.5% to 60.1% of that of composite girders with CSW-ST truss chords.
- (4)
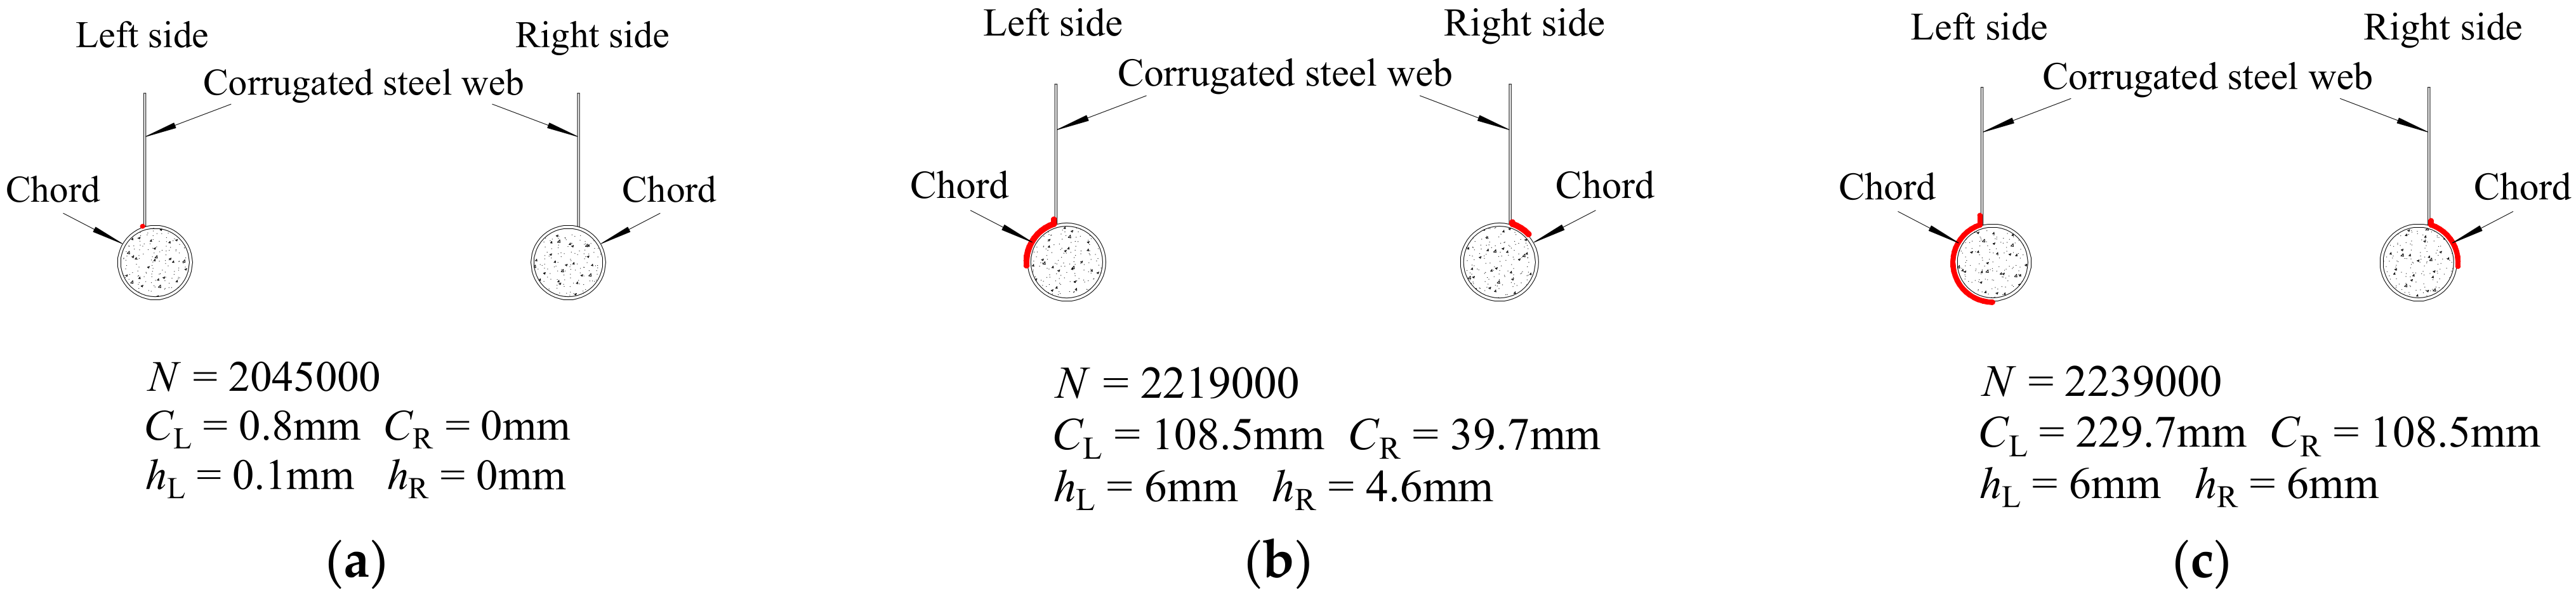
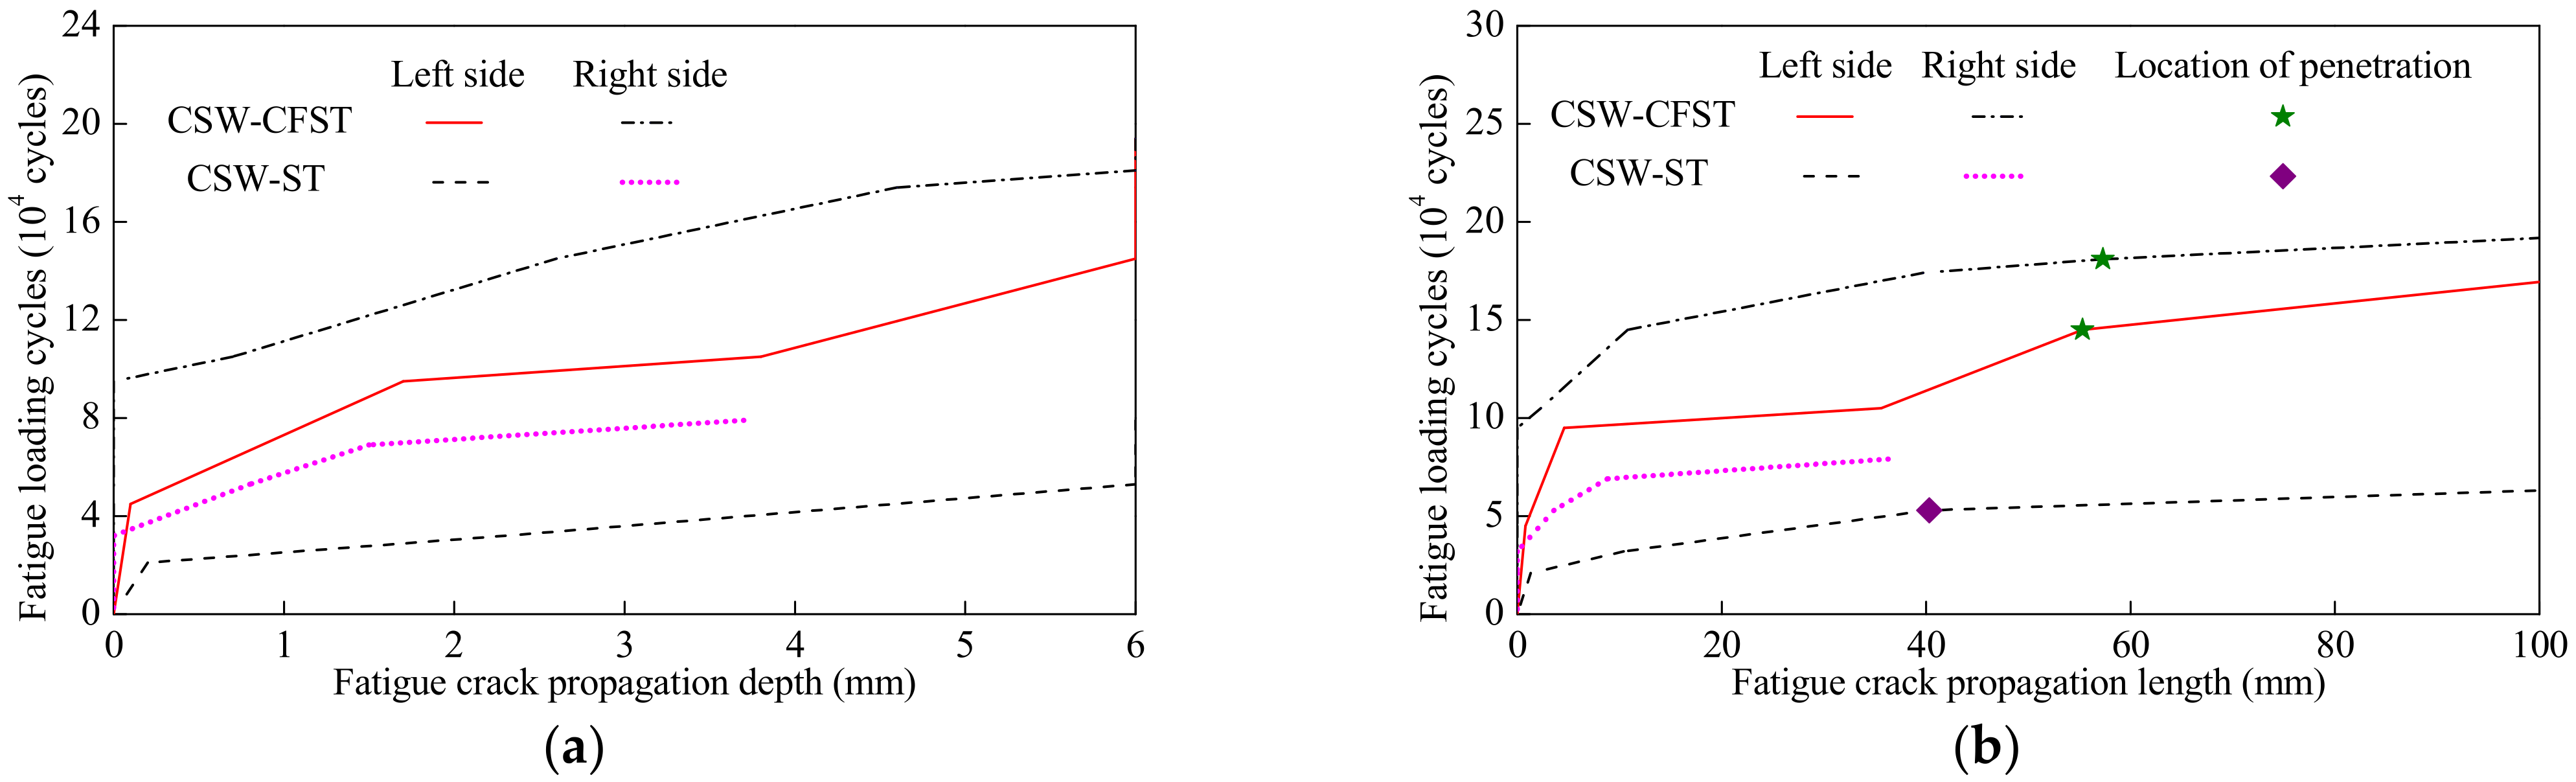
- Under the same fatigue load, concrete in the chord increased the fatigue life by 61.5% compared to composite girders with CSW-ST truss chords. The fatigue crack growth rates of the composite girder with CSW-CFST truss chords along both depth and length directions were slower than those of the composite girder with CSW-ST truss chords during crack propagation and failure stages.
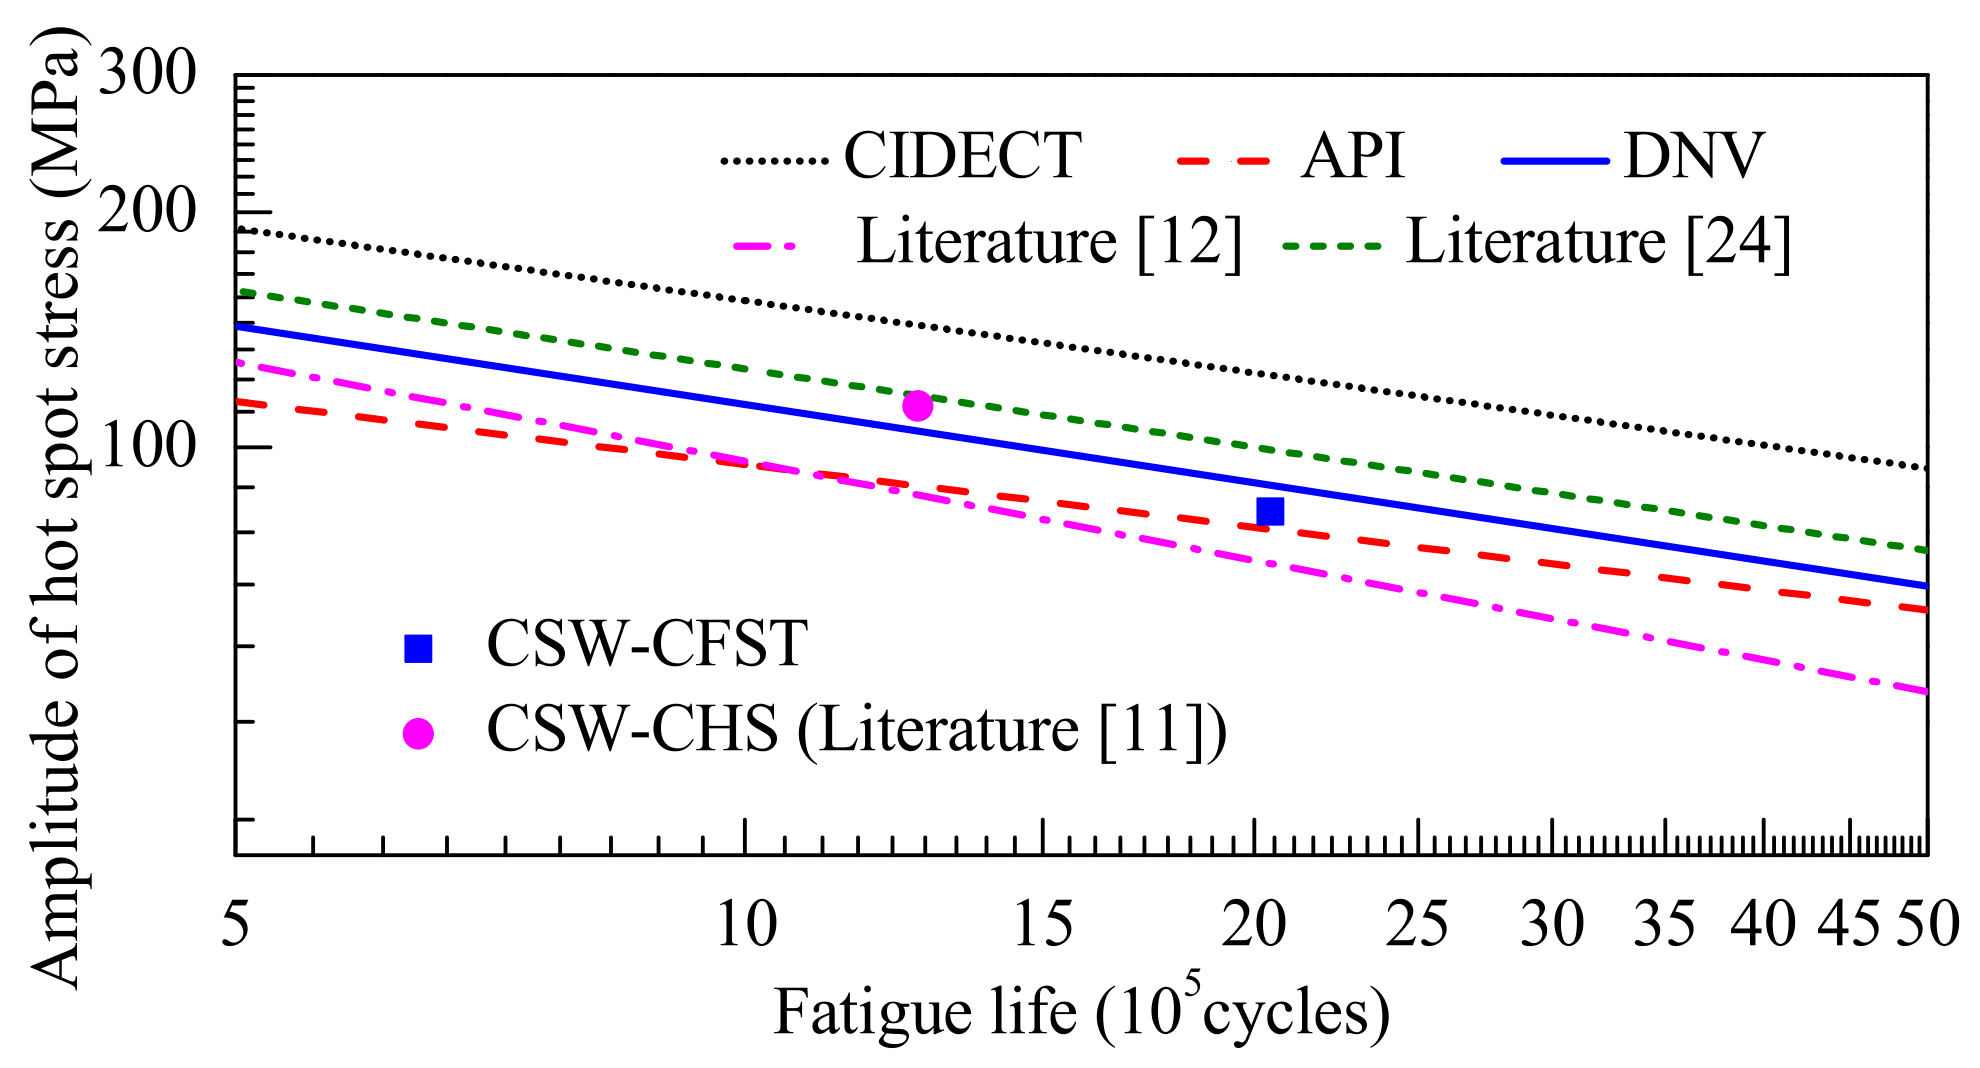
- (5)
- Based on the existing fatigue design S-N curve, it was found that when there is no fatigue design S-N curve with higher accuracy, the fatigue design S-N curve given in API can be used to evaluate the fatigue life of composite girders with CSW-CFST truss chords, and the deviation is less than 17.4%.
Author Contributions
Funding
Data Availability Statement
Acknowledgments
Conflicts of Interest
References
- Chen, Y.Y.; Dong, J.C.; Tong, Z.J.; Jiang, R.J.; Yue, Y. Flexural behavior of composite box girders with corrugated steel webs and trusses. Eng. Struct. 2020, 209, 1–10. [Google Scholar] [CrossRef]
- Chen, Y.Y.; Dong, J.C.; Xu, T.H. Composite box girder with corrugated steel webs and trusses-A new type of bridge structure. Eng. Struct. 2018, 166, 354–362. [Google Scholar] [CrossRef]
- Dong, J.C.; Chen, Y.Y.; Wu, Q.X.; Hu, A.X.; Jiang, R.J.; Wang, C.W.; Tong, Z.J.; Song, H.; Xu, T.H. Research on flexural behavior of composite box continuous girder with corrugated steel webs and trusses. Adv. Struct. Eng. 2021, 24, 3580–3593. [Google Scholar] [CrossRef]
- Jiang, R.J.; Wu, Q.M.; Xu, T.H. Effective flange width for composite box girder with corrugated steel webs. In Proceedings of the 2016 Structures Congress (Structures16), Jeju, Korea, 28 August–1 September 2016. [Google Scholar]
- Huang, W.; Fenu, L.; Chen, B.; Briseghella, B. Experimental study on joint resistance and failure modes of concrete filled steel tubular (CFST) truss girders. J. Constr. Steel Res. 2018, 141, 241–250. [Google Scholar] [CrossRef]
- Chen, Y.Y.; Dong, J.C.; Xu, T.H.; Xiao, Y.F.; Jiang, R.J.; Nie, X.M. The shear-lag effect of composite box girder bridges with corrugated steel webs and trusses. Eng. Struct. 2019, 181, 617–628. [Google Scholar] [CrossRef]
- Dong, J.C. Research on Mechanical Performance of Composite Box-Girder Bridges with Corrugated Steel Web and Chords. Ph.D. Thesis, Fuzhou University, Fuzhou, China, 2017. [Google Scholar]
- Wang, C.W. Research on the Bending Behavior of CSW-CFST Truss-Chord Continuous Girder. Master’s Thesis, Fuzhou University, Fuzhou, China, 2017. [Google Scholar]
- Pan, Y.Z. Study on Mechanical Behavior of Composite Beam Bridge with Corrugated Steel Webs and Concrete Filled Steel Tube under Vehicle Load. Master’s Thesis, Fuzhou University, Fuzhou, China, 2020. [Google Scholar]
- Huang, J.Y. Research on the Bending and Torsion of Composite Beams with Corrugated Steel Web. Master’s Thesis, Fuzhou University, Fuzhou, China, 2019. [Google Scholar]
- Lin, Q.H. Experimental Research on Fatigue Performance of Composite Girders with CWS-ST Truss Chords. Master’s Thesis, Fuzhou University, Fuzhou, China, 2018. [Google Scholar]
- Wei, X.; Wen, Z.Y.; Xiao, L.; Wu, C.T. Review of fatigue assessment approaches for tubular joints in CFST trusses. Int. J. Fatigue 2018, 113, 43–53. [Google Scholar] [CrossRef]
- Zheng, J.; Nakamura, S.; Okumatsu, T.; Nishikawa, T. Formulation of stress concentration factors for concrete-filled steel tubular (CFST) K-joints under three loading conditions without shear forces. Eng. Struct. 2019, 190, 90–100. [Google Scholar] [CrossRef]
- Musa, I.A.; Mashiri, F.R. Stress concentration factor in concrete-filled steel tubular K-joints under balanced axial load. Thin-Walled Struct. 2019, 139, 186–195. [Google Scholar] [CrossRef]
- Xu, F.; Chen, J.; Jin, W. Experimental investigation of SCF distribution for thin-walled concrete-filled CHS joints under axial tension loading. Thin-Walled Struct. 2015, 93, 149–157. [Google Scholar] [CrossRef]
- Musa, I.A.; Mashiri, F.R.; Zhu, X. Parametric study and equation of the maximum SCF for concrete filled steel tubular T-joints under axial tension. Thin-Walled Struct. 2018, 129, 145–156. [Google Scholar] [CrossRef]
- IIW: 1996. Fatigue Design of Welded Joints and Components; Abington Publishing: Cambridge, UK, 1996. [Google Scholar]
- Elamary, A.S.; Alharthi, Y.; Abdalla, O.; Alqurashi, M.; Sharaky, I.A. Failure mechanism of hybrid steel beams with trapezoidal corrugated-web non-welded inclined folds. Materials 2021, 14, 1424. [Google Scholar] [CrossRef] [PubMed]
- Chen, B.; Ye, Z.N.; Chen, Z.S.; Xie, X. Bridge vehicle load model on different grades of roads in China based on Weigh-in-Motion (WIM) data. Measurement 2018, 122, 670–678. [Google Scholar] [CrossRef]
- Chen, K.M.; Huang, H.H.; Wu, Q.X.; Nakamura, S.; Chen, B.C. Experimental and finite element analysis research on the fatigue performance of CHS K-joints. Eng. Struct. 2019, 197, 1–14. [Google Scholar] [CrossRef]
- CIDECT: 2001. Part 8: Design Guide for Circular and Rectangular Hollow Section Joints under Fatigue Loading; TÜV-Verlag GmbH: Köln/Berlin, Germany, 2001. [Google Scholar]
- Zhou, Y.L.; Qian, X.D.; Birnie, A.; Zhao, X.L. A reference free ultrasonic phased array to identify surface cracks in welded steel pipes based on transmissibility. Int. J. Press. Vessel. Pip. 2018, 168, 66–78. [Google Scholar] [CrossRef]
- Qian, X.D.; Swaddiwudhipong, S.; Nguyen, C.T.; Petchdemaneengam, Y.; Marshall, P.; Ou, Z. Overload effect on the fatigue crack propagation in large-scale tubular joints. Fatigue Fract. Eng. Mater. Struct. 2013, 36, 427–438. [Google Scholar] [CrossRef]
- JSSC: 1995. Fatigue Design Recommendations for Steel Structures; Jihodobooks: Tokyo, Japan, 1995. [Google Scholar]
- Shao, Y.B.; Du, Z.F.; Lie, S.T. Prediction of hot spot stress distribution for tubular K-joints under basic loadings. J. Constr. Steel Res. 2009, 65, 2011–2026. [Google Scholar] [CrossRef]
- Zheng, J.; Nakamura, S.; Ge, Y.; Chen, K.M. Extended Formulation of Stress Concentration Factors for CFST T-Joints. J. Bridge Eng. 2020, 25, 1–5. [Google Scholar] [CrossRef] [Green Version]
- DNV-RP-C203: 2005. Fatigue Design of Offshore Steel Structures; DNV Services: Høvik, Norway, 2008. [Google Scholar]
- API: 2002. Recommended Practice for Planning, Designing, and Constructing Fixed Offshore Platforms Working Stress Design; API Publishing Servives: Washington, DC, USA, 2002. [Google Scholar]


| Chord | K-Bracing | Horizontal Bracing | Cross-Bracing | Corrugated Steel Web | ||||
|---|---|---|---|---|---|---|---|---|
| TW | θW | LW | HW | RW | ||||
| Ø146 mm × 6 mm | L23 mm × 4 mm | L5 mm | L40 mm × 3 mm | 4 mm | 31° | 320 mm | 44 mm | 60 mm |
| Component | fy (MPa) | fu (MPa) | Es (GPa) | μs |
|---|---|---|---|---|
| Chord | 348 | 491 | 204 | 0.3 |
| K-bracing | 361 | 457 | 203 | 0.3 |
| Cross-bracing | 349 | 482 | 199 | 0.3 |
| Horizontal bracing | 355 | 468 | 203 | 0.3 |
| Concrete Grade | fck (MPa) | fcd (MPa) | Ec (MPa) | μc |
|---|---|---|---|---|
| C50 | 34.7 | 26.2 | 35.2 | 0.2 |
| Monitored Parts | Chord Side | Corrugated Steel Web Side |
|---|---|---|
| Lr,min (mm) | 4.0 | 4.0 |
| Lr,max (mm) | 10.0 | 14.0 |
Publisher’s Note: MDPI stays neutral with regard to jurisdictional claims in published maps and institutional affiliations. |
© 2022 by the authors. Licensee MDPI, Basel, Switzerland. This article is an open access article distributed under the terms and conditions of the Creative Commons Attribution (CC BY) license (https://creativecommons.org/licenses/by/4.0/).
Share and Cite
Huang, H.; Chen, K.; Wu, Q.; Nakamura, S. Fatigue Performance Test and Numerical Analysis of Composite Girders with CSW-CFST Truss Chords. Appl. Sci. 2022, 12, 5459. https://doi.org/10.3390/app12115459
Huang H, Chen K, Wu Q, Nakamura S. Fatigue Performance Test and Numerical Analysis of Composite Girders with CSW-CFST Truss Chords. Applied Sciences. 2022; 12(11):5459. https://doi.org/10.3390/app12115459
Chicago/Turabian StyleHuang, Hanhui, Kangming Chen, Qingxiong Wu, and Shozo Nakamura. 2022. "Fatigue Performance Test and Numerical Analysis of Composite Girders with CSW-CFST Truss Chords" Applied Sciences 12, no. 11: 5459. https://doi.org/10.3390/app12115459
APA StyleHuang, H., Chen, K., Wu, Q., & Nakamura, S. (2022). Fatigue Performance Test and Numerical Analysis of Composite Girders with CSW-CFST Truss Chords. Applied Sciences, 12(11), 5459. https://doi.org/10.3390/app12115459