1. Introduction
Landslides owing to heavy rainfall during the monsoon season are representative natural disasters that cause human casualties. Mountainous areas represent 63% of the land in Korea, and the average soil layer in such areas has a shallow depth of less than 4 m. Landslides that occur every year from June to September owing to extreme rainfall are dominated by shallow failure with soil depths less than 2 m [
1,
2,
3]. Considering that shallow failure commonly occurs at locations close to residential areas, small soil failure or loss leads to human casualties in many cases.
While large-scale failure mainly occurs during the monsoon season when low rainfall amounts are extended over a long period of time [
4], shallow failure tends to be caused by heavy rainfall [
5]. Therefore, measuring soil moisture is effective in predicting shallow failure that occur due to rainfall infiltration [
6,
7,
8,
9,
10]. Lu et al. [
11] reported that direct measurements of soil moisture are most appropriate for the rainfall that reached the ground surface because the amount that penetrates into the ground can be limited by surface runoff and the influence of vegetation. Bordoni et al. [
12] calculated the safety factor based on the information obtained in the field and found that the volumetric water content (VWC) is more effective than the pore water pressure in predicting failure when the ground is saturated.
The studies conducted to identify the saturation characteristics before and after shallow failure revealed that the VWC responds directly to the penetration of rainfall, and the maximum value is maintained for a long time before failure is reached. Based on these VWC characteristics, many researchers reported the possibility of predicting shallow failure [
13,
14,
15]. Kim et al. [
16] reported that the possibility of failure increases significantly in the third stage, at which time the VWC increases rapidly. However, this study is limited in its capacity to be applied in practice because it is introduced only as a conceptual method for predicting failure according to the VWC change pattern. Previous studies revealed that the change in the VWC in the ground can be used as a precursor to shallow failure. However, to date, specific measurement standards have not been developed due to the difficulties in securing data that explain the VWC change pattern during the actual shallow failure process.
Previous studies were mostly conducted to identify the characteristics of shallow failure caused by rainfall according to indoor model experiments [
17,
18,
19]. This is because the experiments can be repeated using the same boundary conditions, and the deformation inside the slope can be directly observed [
20].
This study aimed to derive a measurement standard that can identify a sign of forthcoming shallow failure using the change in the VWC caused by rainfall penetration. To this end, soil slope failure was simulated by performing flume experiments, and the increasing tendency of the VWC in the slope where failure occurred was confirmed by collecting the VWC measurement data during the failure process. Testbeds were operated to identify the increasing VWC characteristics of the area where no failure occurred. Based on this, the VWC gradient and the failure rate were analyzed to propose measurement and management criteria. To use the proposed measurement and management criteria in the field, it is necessary to determine appropriate measurement positions. Therefore, a full-scale flume experiment was performed twice to examine the appropriateness of the proposed measurement and management criteria and the method of selecting measurement positions.
2. Materials and Methods
2.1. VWC Gradient
Chae and Kim [
21] proposed a failure prediction method according to the VWC characteristics. According to this method, the VWC responds directly to water that penetrates into the soil slope, and the maximum value is achieved for a long time before reaching failure. The VWC gradient was calculated using the time of the increase in the VWC and the increment during the failure process through an indoor experiment, and it was compared with the VWC gradient calculated using the VWC values measured in testbeds in which failure did not occur.
To express the amount of water required for the VWC to reach the maximum value, the concept of effective cumulative rainfall (ECR) was used. ECR can be calculated according to Equation (1).
where t is the time from the moment when the VWC begins to increase to the moment when the maximum VWC is reached.
To calculate the VWC gradient, the VWC change was normalized using the ratio (t/t
max) of the VWC increase start time (t) to the maximum VWC arrival time (t
max) as shown in
Figure 1, and the slope by linear regression analysis was used as the VWC gradient.
This method can predict failure by monitoring the VWC increase patterns in real time (
Figure 2).
2.2. Flume Experiment
2.2.1. Experimental Conditions and Equipment
Our analysis of the VWC gradient characteristics, which can determine a sign of shallow failure on a soil slope, was based on the results of previous studies. Therefore, we performed flume experiments under specific experimental conditions, namely various slope inclinations, rainfall conditions, soil characteristics, and sensor measurement positions, which can all affect the VWC. Other factors such as soil texture, vegetation type and coverage, and topographic features may affect the occurrence of shallow failure. However, there is a limit to reproducing all these factors in the flume experiments. Therefore, in this study, the flume experiments were performed by simplifying the slope condition. A rainfall simulation device was used to reproduce soil failure; the wetting front moves from the surface of the soil slope to the base, which causes the surface layer to collapse.
Most natural bedrock in Korea is composed of granite and gneiss [
22]. Landslides in Korea are more related to weathered granite layers than other rocks as in granite areas small slides are dominant, there are few outcroppings, and the depth of weathering is evenly distributed [
23]. In total, 3435 landslides that occurred after 1990 showed that granite was more vulnerable to landslides than other rocks [
3]. Based on the above research results, in this study, the slope of the model experiment was created using weathered granite soil (
Table 1). To maintain the bulk density of the slope at 1.67 Mg m
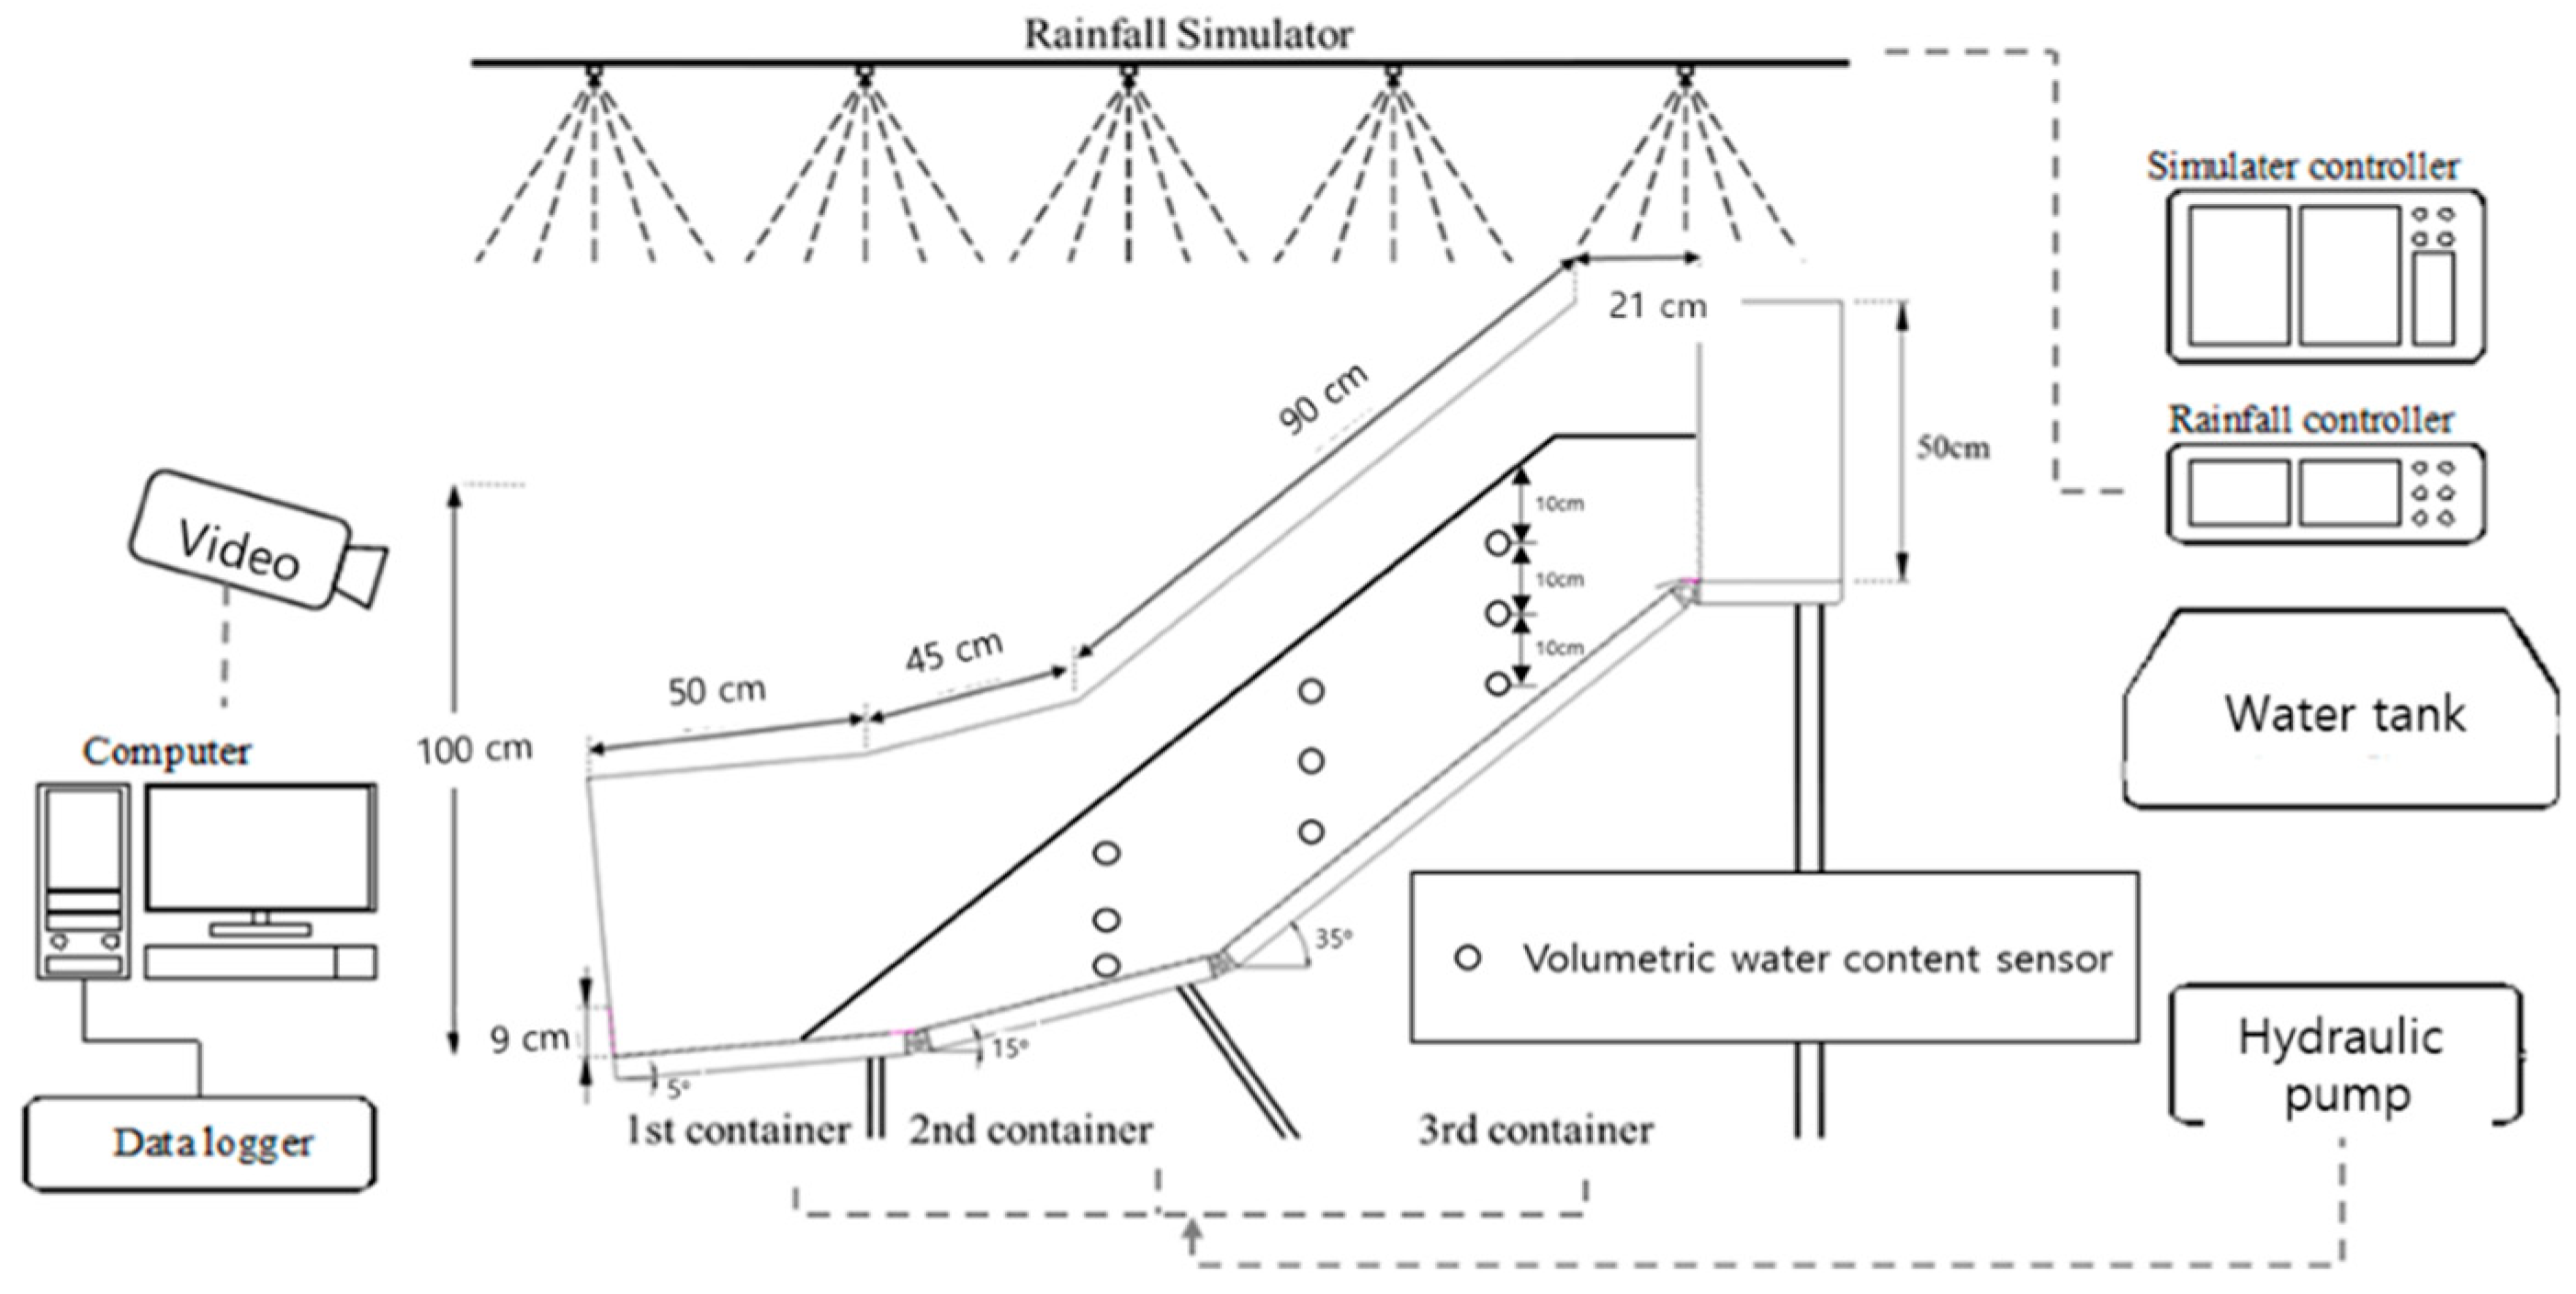
−3, a flume made of steel plates was divided uniformly into six layers, and compaction was performed by calculating the soil weight for each layer’s volume. Different depths were applied to the crest, slope, and toe parts of the slope, and VWC sensors were installed to investigate changes in the VWC before and after failure (
Figure 3). To secure measurements at various positions, the sensors were installed at depths in the range of 5 to 30 cm in the crest, slope, and toe parts of the created soil slope (
Table 2).
2.2.2. VWC Gradient Analysis in Flume Experiments
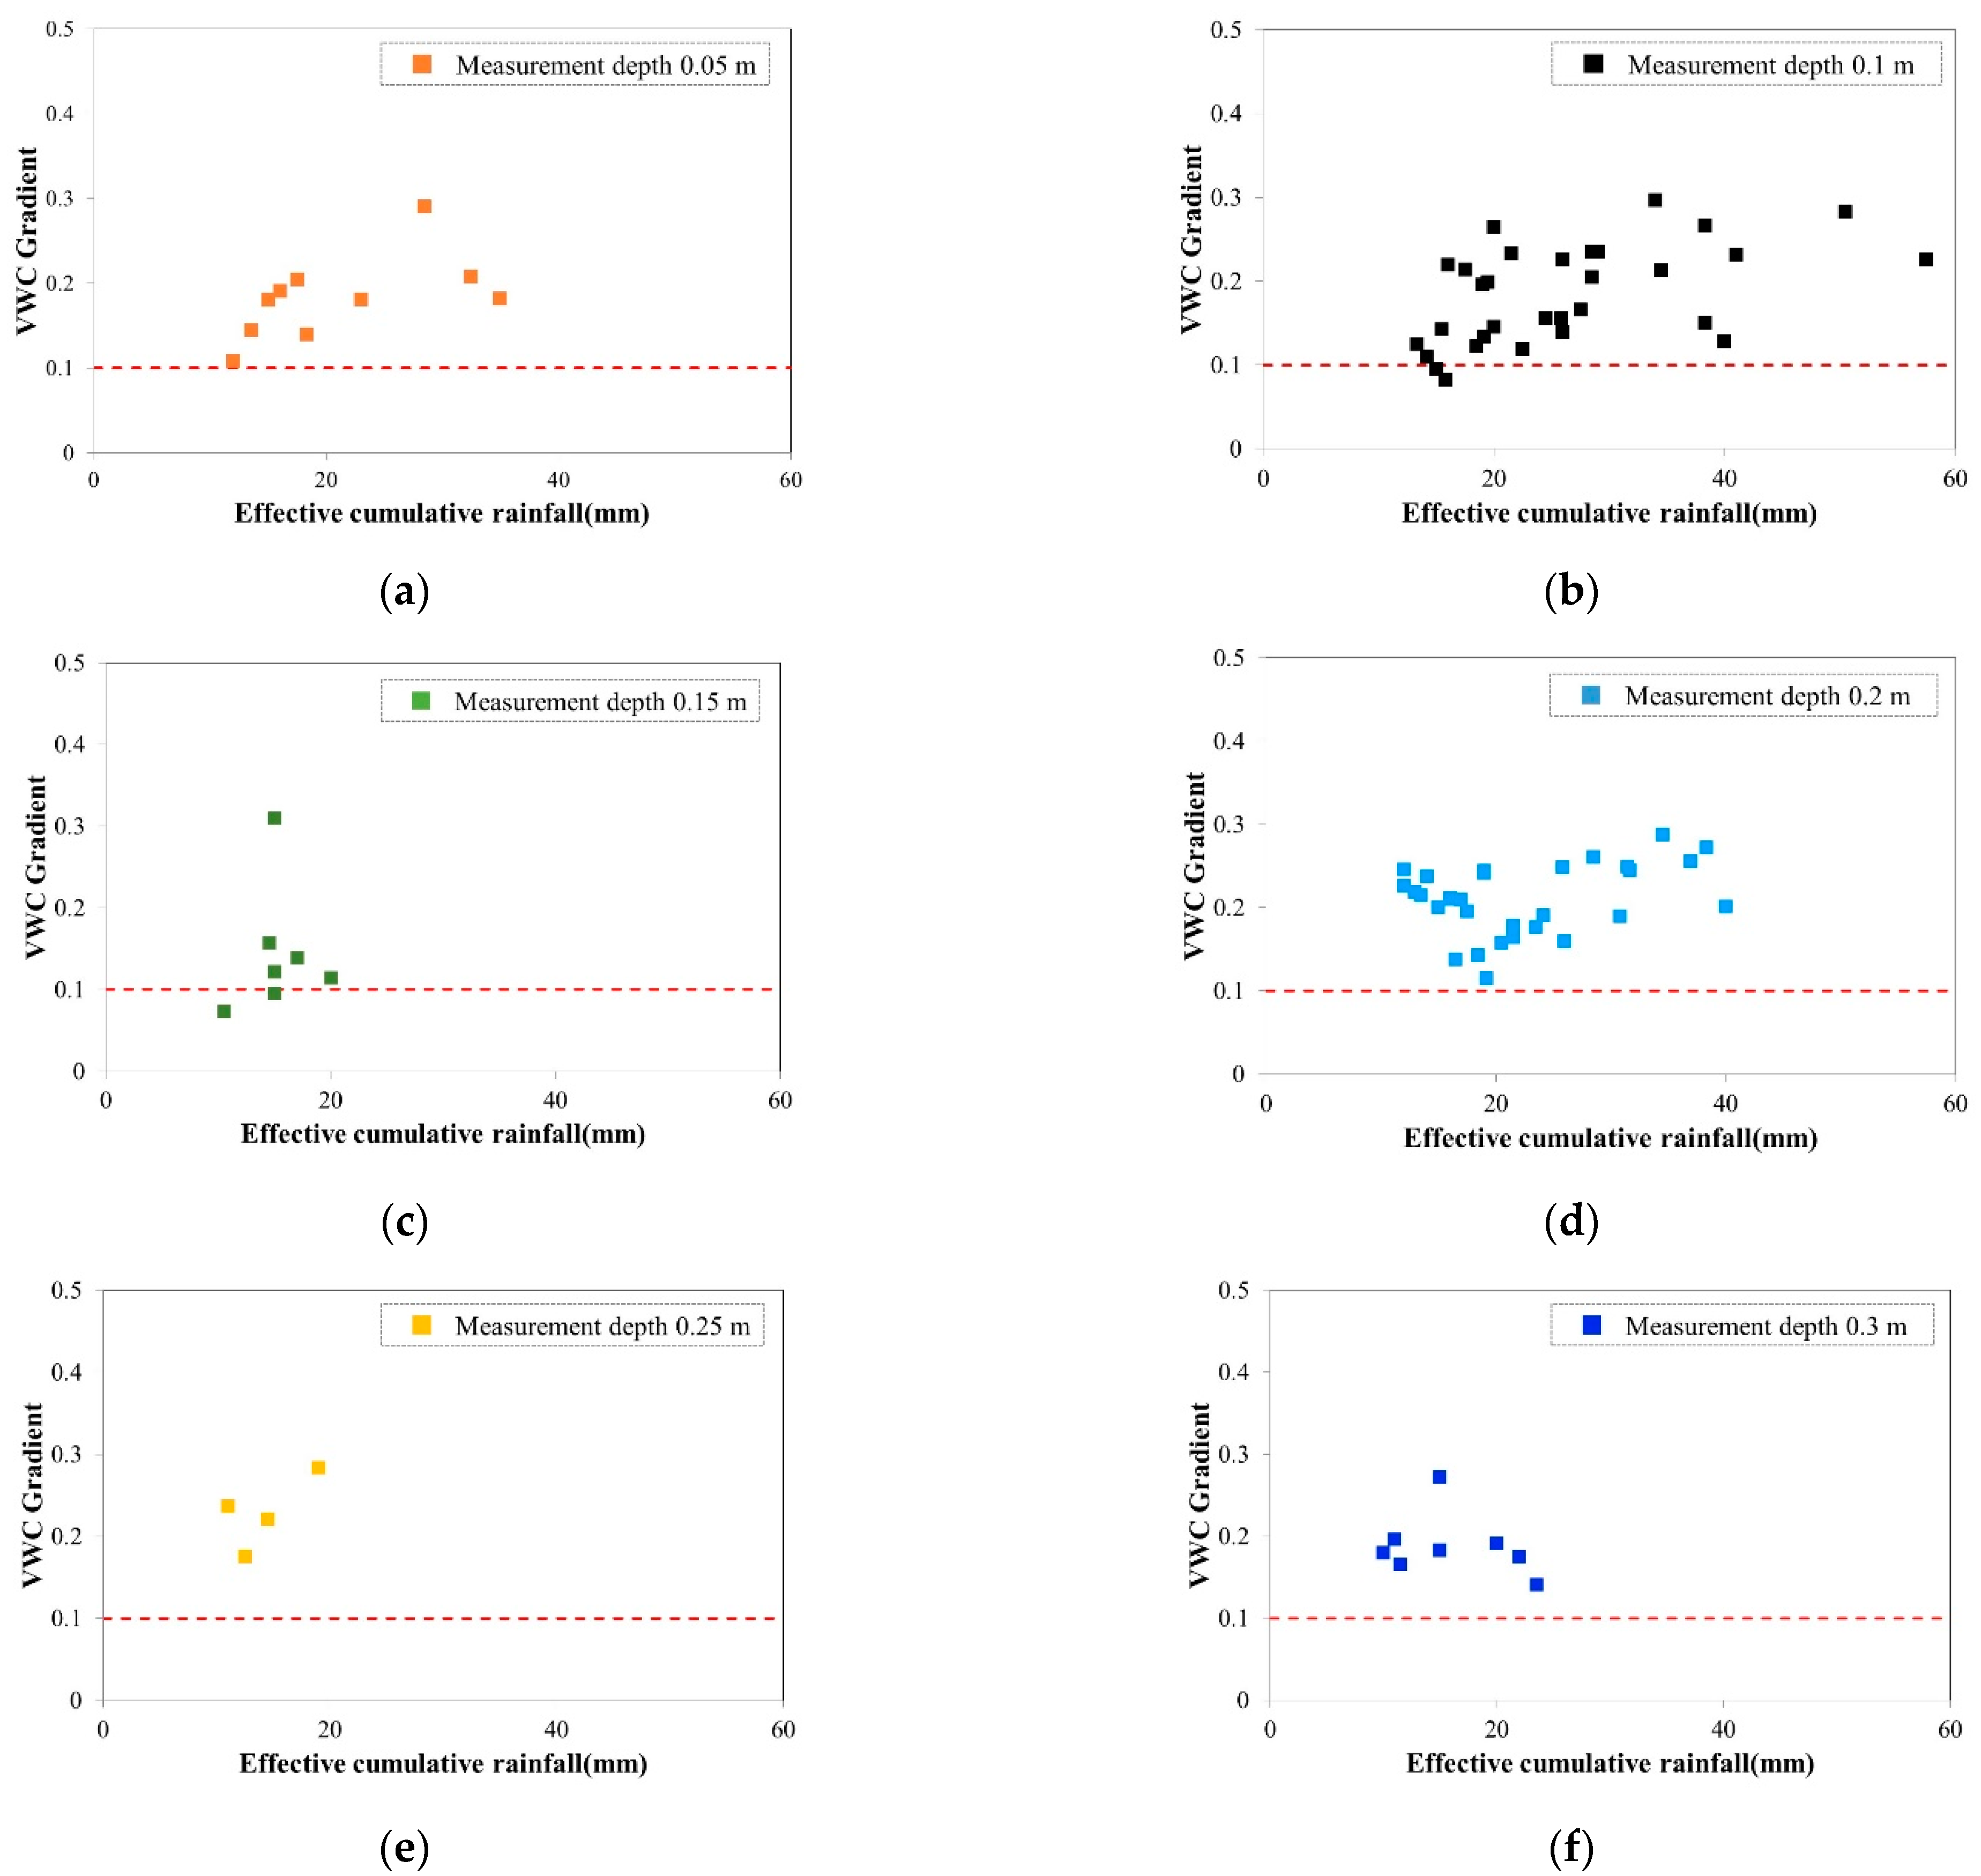
The VWC gradient at each installation depth was examined (
Figure 4). At almost all measurement depths, the VWC gradient was 0.1 or higher, but it was less than 0.1 in some cases. No correlation was found between ECR and the VWC gradient. Even at the same ECR value, the VWC gradient could exist in various ranges. This appears to be because the penetration rate of the created slope was not constant in the repeated experiments, and the difference in the measurement depth was not large.
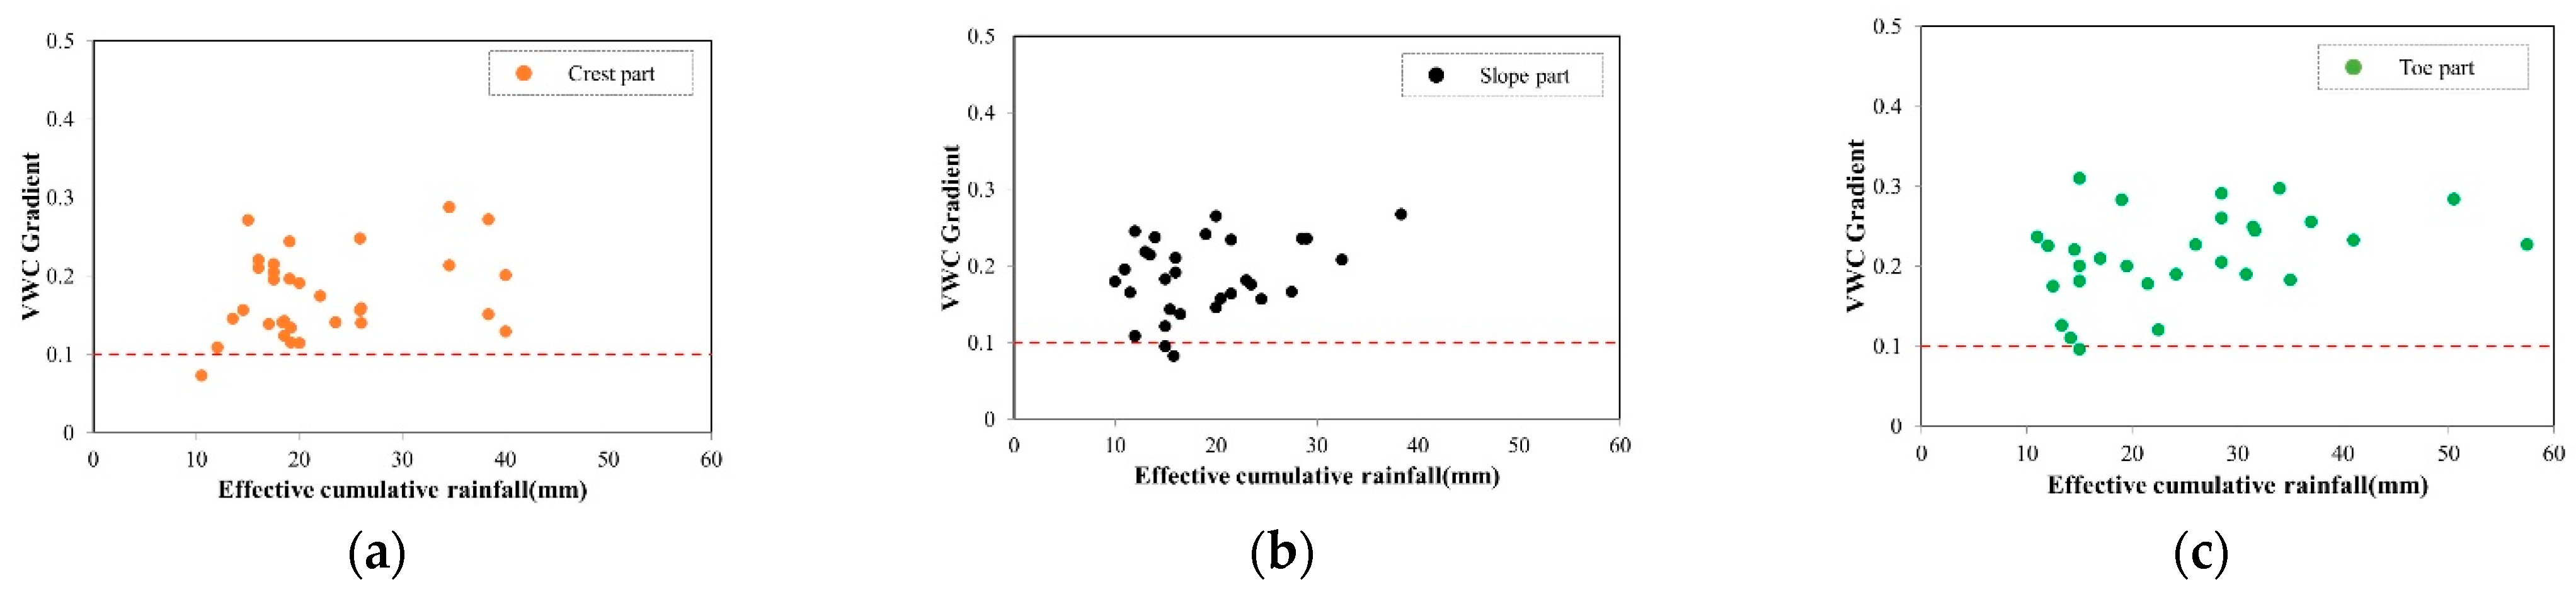
For the utilization of sensors, the sensor installation position is also very important. The characteristics of the VWC gradient were examined according to the installation position, but no characteristic was observed according to the slope angle and the installation position on the slope (crest, slope, and toe parts) in this study (
Figure 5).
In general, soil slopes with a high slope angle are vulnerable to frequent failure in the berm part of a slope. These tendencies, however, were not observed in the experimental results. This may be attributed to the fact that the scale of the flume experiments was small, and different types of failure from actual soil slopes occurred. Therefore, to identify characteristics according to the installation position, it was inferred that large-scale flume experiments are required considering the scale of an actual site.
2.3. Testbed
2.3.1. Testbed Conditions
The VWC values measured in testbeds were used as a control group for the flume experiments. Among the testbeds operated by the National Disaster Management Research Institute from 2010 to 2013, the testbeds in Dongrae, Busan; Yeonki, Chungnam; and Inje, Gangwon—which have the same weathered granite soil as the flume experiments—were utilized [
24]. In the testbeds, the VWC sensors were installed at the depths of 20 and 40 cm at positions with slope angles equal to 20°, 30°, 40°, and 50°, and the measurement data from 6 January 2012 to 15 September 2012 were used for analyses in this study (
Figure 6).
2.3.2. VWC Gradient Analysis in the Testbeds
We examined rainfall events in the three regions during the measurement period. The highest total rainfall was recorded in Yeonki (905 mm), followed by Inje (541 mm) and Dongrae (256 mm) (
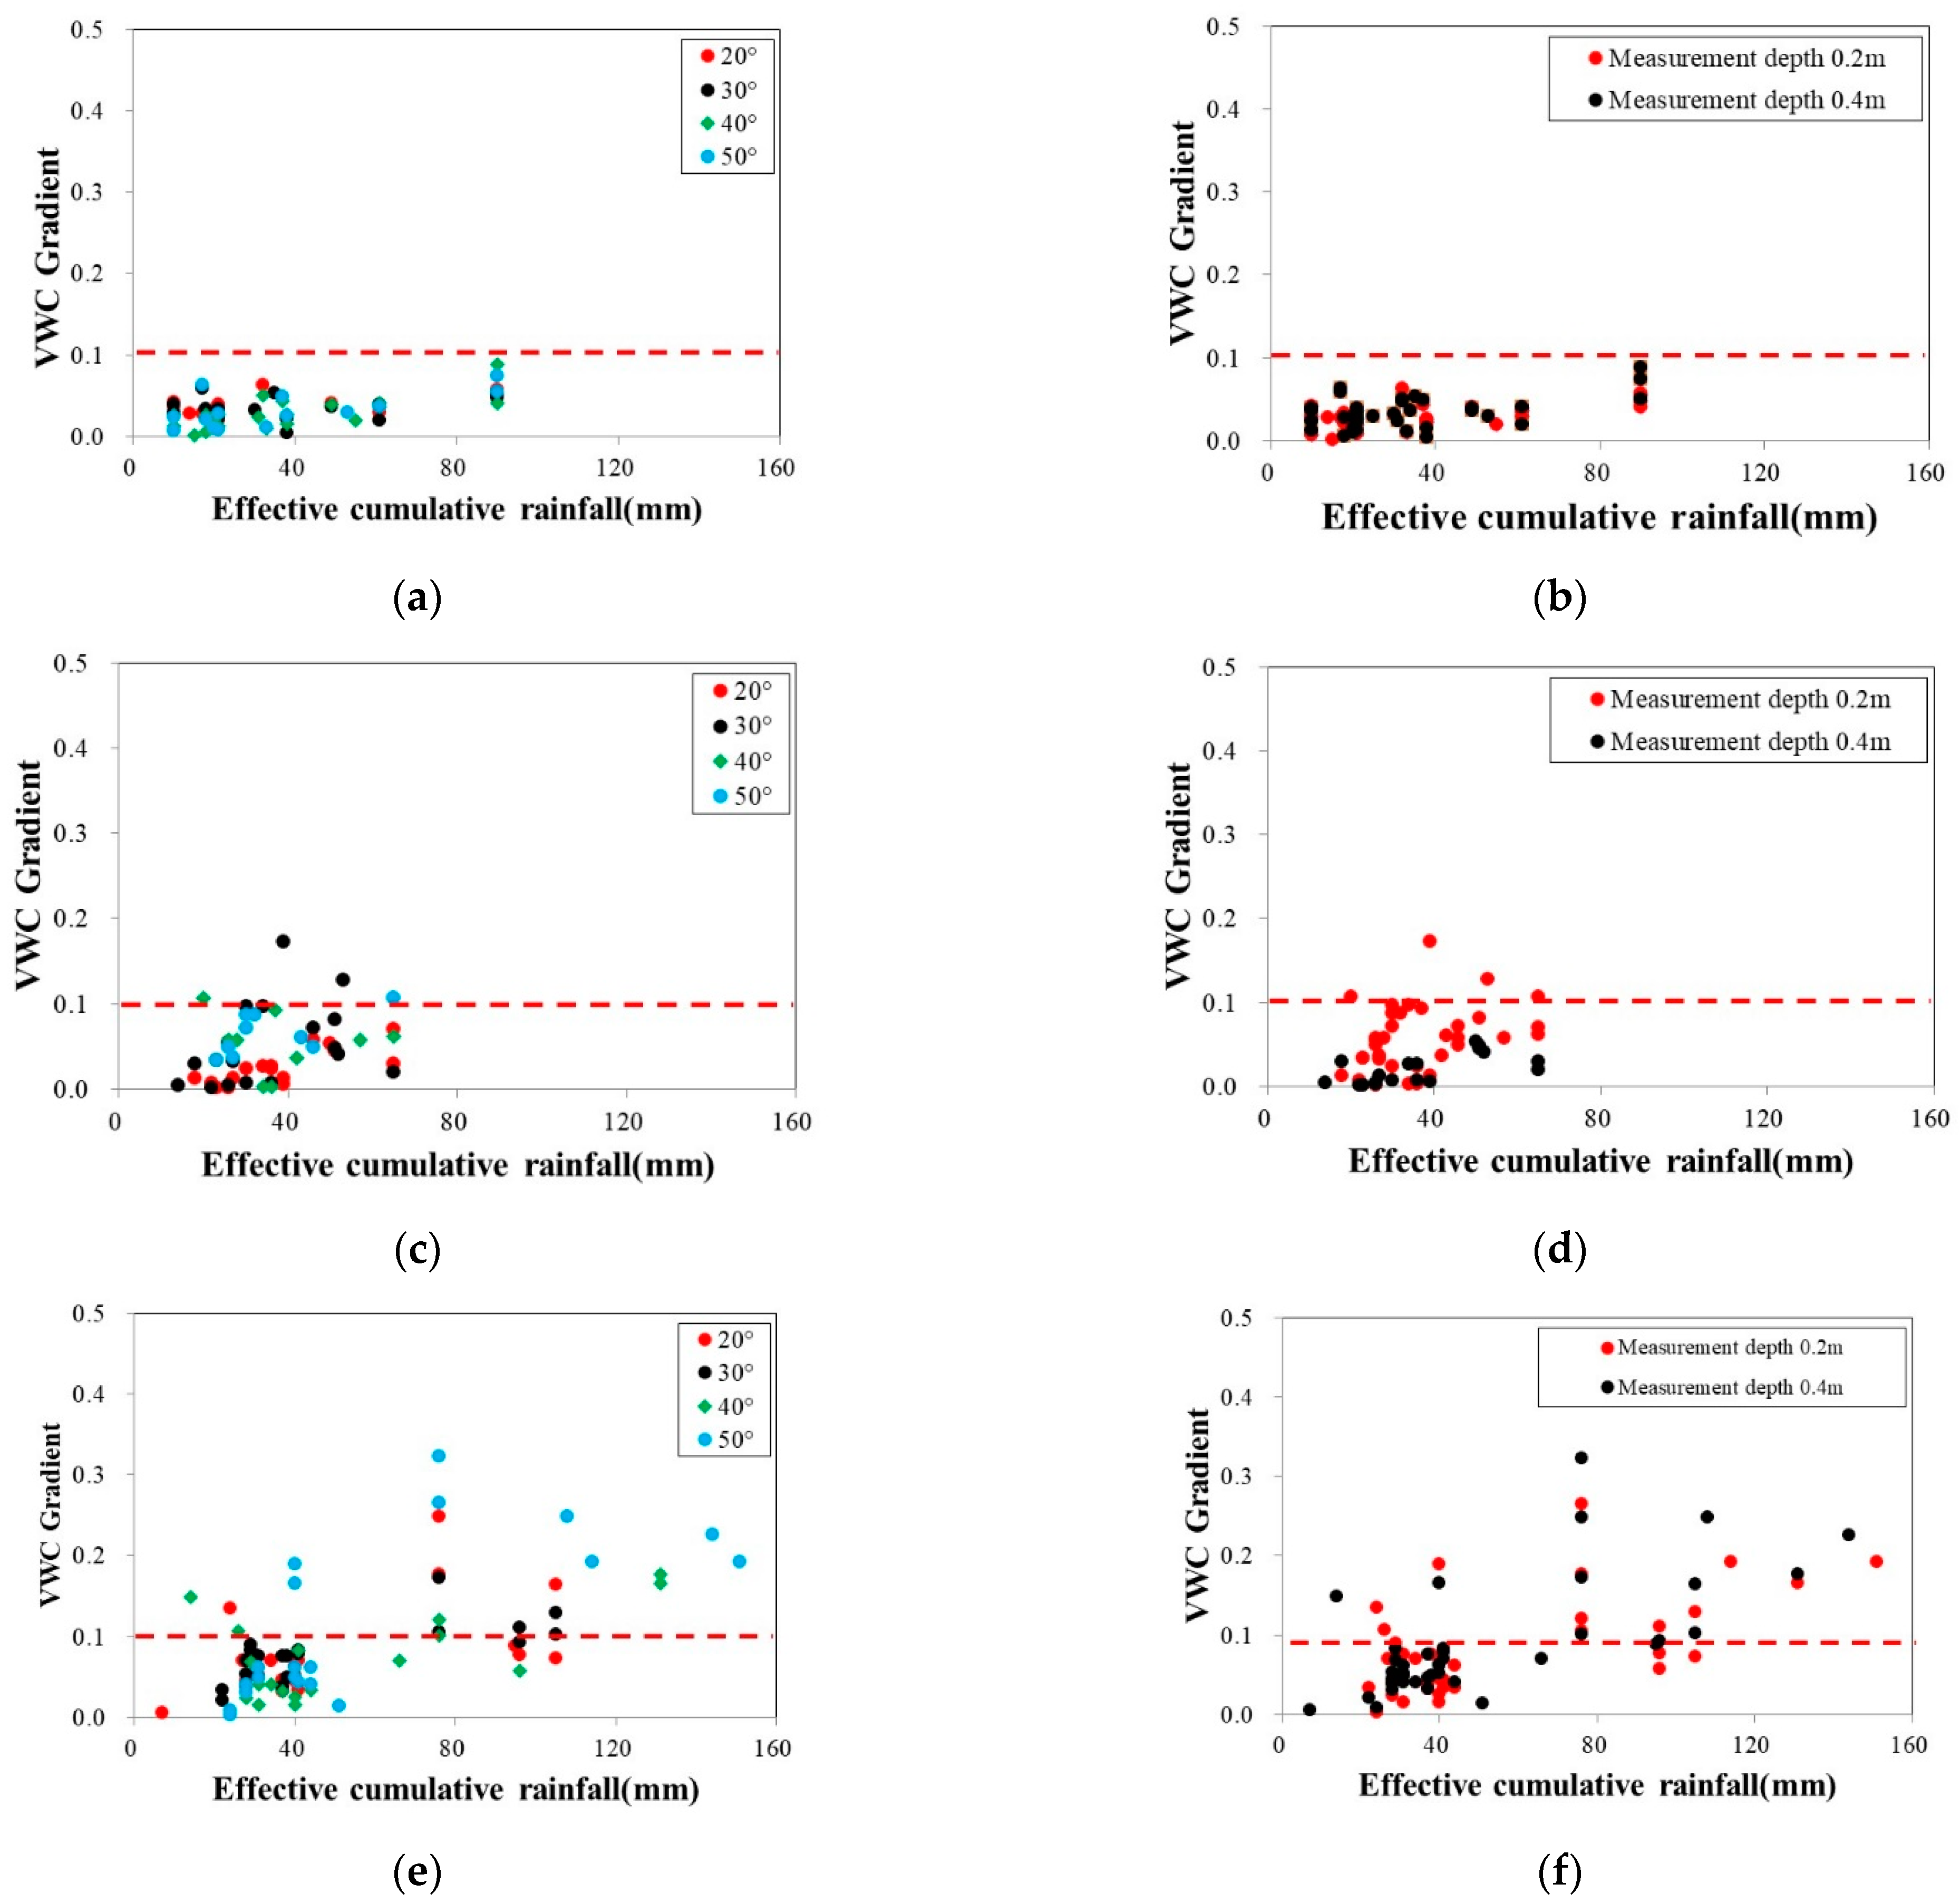
Table 3). For these three regions, the characteristics of the VWC gradient were examined at different slope angles (20°, 30°, 40°, and 50°) and installation depths (0.2 and 0.4 m) (
Figure 7). In all of the three regions, the characteristics of the VWC gradient were not distinguished according to the slope angle or measurement depth. For Dongrae, the VWC gradient was less than 0.1. For Inje, the VWC gradient values that were less than 0.1 were dominant, but 0.1 was exceeded in some cases. Comparison of these two regions showed that Yeonki yielded a higher ECR range, and there were many VWC gradient values that were higher than 0.1.
Figure 7 shows that the VWC gradient can have various ranges even at sites where no failure occurs. Yeonki, where the VWC gradient was higher than 0.1 in many cases, shows that the VWC gradient can be increased by rainfall conditions as the highest rainfall was observed in the region. As in the flume experiment results, the characteristics of the VWC gradient were not distinguished according to the measurement depth or slope angle. This may be because the sensor installation locations had different soil characteristics, and the increase pattern of the VWC was also different even though all of the testbed sites were granite areas. As it is practically difficult to identify changes in the VWC characteristics based on considerations of all the soil characteristics, it may not be reasonable to clearly determine the presence or absence of failure based on the specific values of the VWC gradient using only some measurement data.
3. Early Warning Criteria Using VWC Characteristics
In this study, an attempt was made to compare the characteristics of the VWC gradient according to the presence or absence of shallow failure. As it is challenging to secure the measured data during the failure process at actual sites, flume experiments that can be repeated can be an alternative. Therefore, the flume experiment results were used as measurement data for shallow failure cases, while the testbed measurement results were used as data for nonfailure cases. However, in the case of flume experiments, boundary conditions, soil characteristics, and rainfall reproduction characteristics are different from those in the field. Thus, it is difficult to directly compare them with the testbed results. To compare only the tendencies of the two control groups, considering the limitations of the measurement data secured from flume experiments, the VWC gradient values subject to the condition that caused slope failure in flume experiments and those of the testbeds were analyzed (
Figure 8).
While ECR was distributed below 50 mm, and the VWC gradient ranged from 0.072 to 0.309 when failure occurred in the flume experiment, the range of ECR was relatively wider and the VWC gradient was also distributed in a wide range between 0.01 and 0.32 at the testbed sites where no failure occurred. This shows a different tendency from the distribution of the testbed values below 0.1 in the study by Chae and Kim [
21]. The VWC gradient increased in flume experiments as the VWC responded to high rainfall intensity of 50 mm/h, whereas the VWC gradient was gradually increased in the testbeds owing to the long rainfall duration despite the relatively low rainfall intensity. Among the VWC gradient values of the testbeds in which no failure occurred, some exceeded 0.1. This can be frequently observed during measurements at actual sites, meaning that the VWC gradient is not directly related to the occurrence of shallow failure. When no failure occurs, however, the VWC gradient rarely has a high value. This is because either: (a) the rainfall needed to saturate the ground and cause failure is not sufficient, or (b) the VWC does not increase rapidly owing to the effective drainage in the ground. Therefore, when no failure occurs, it is highly likely that the VWC gradient is relatively low.
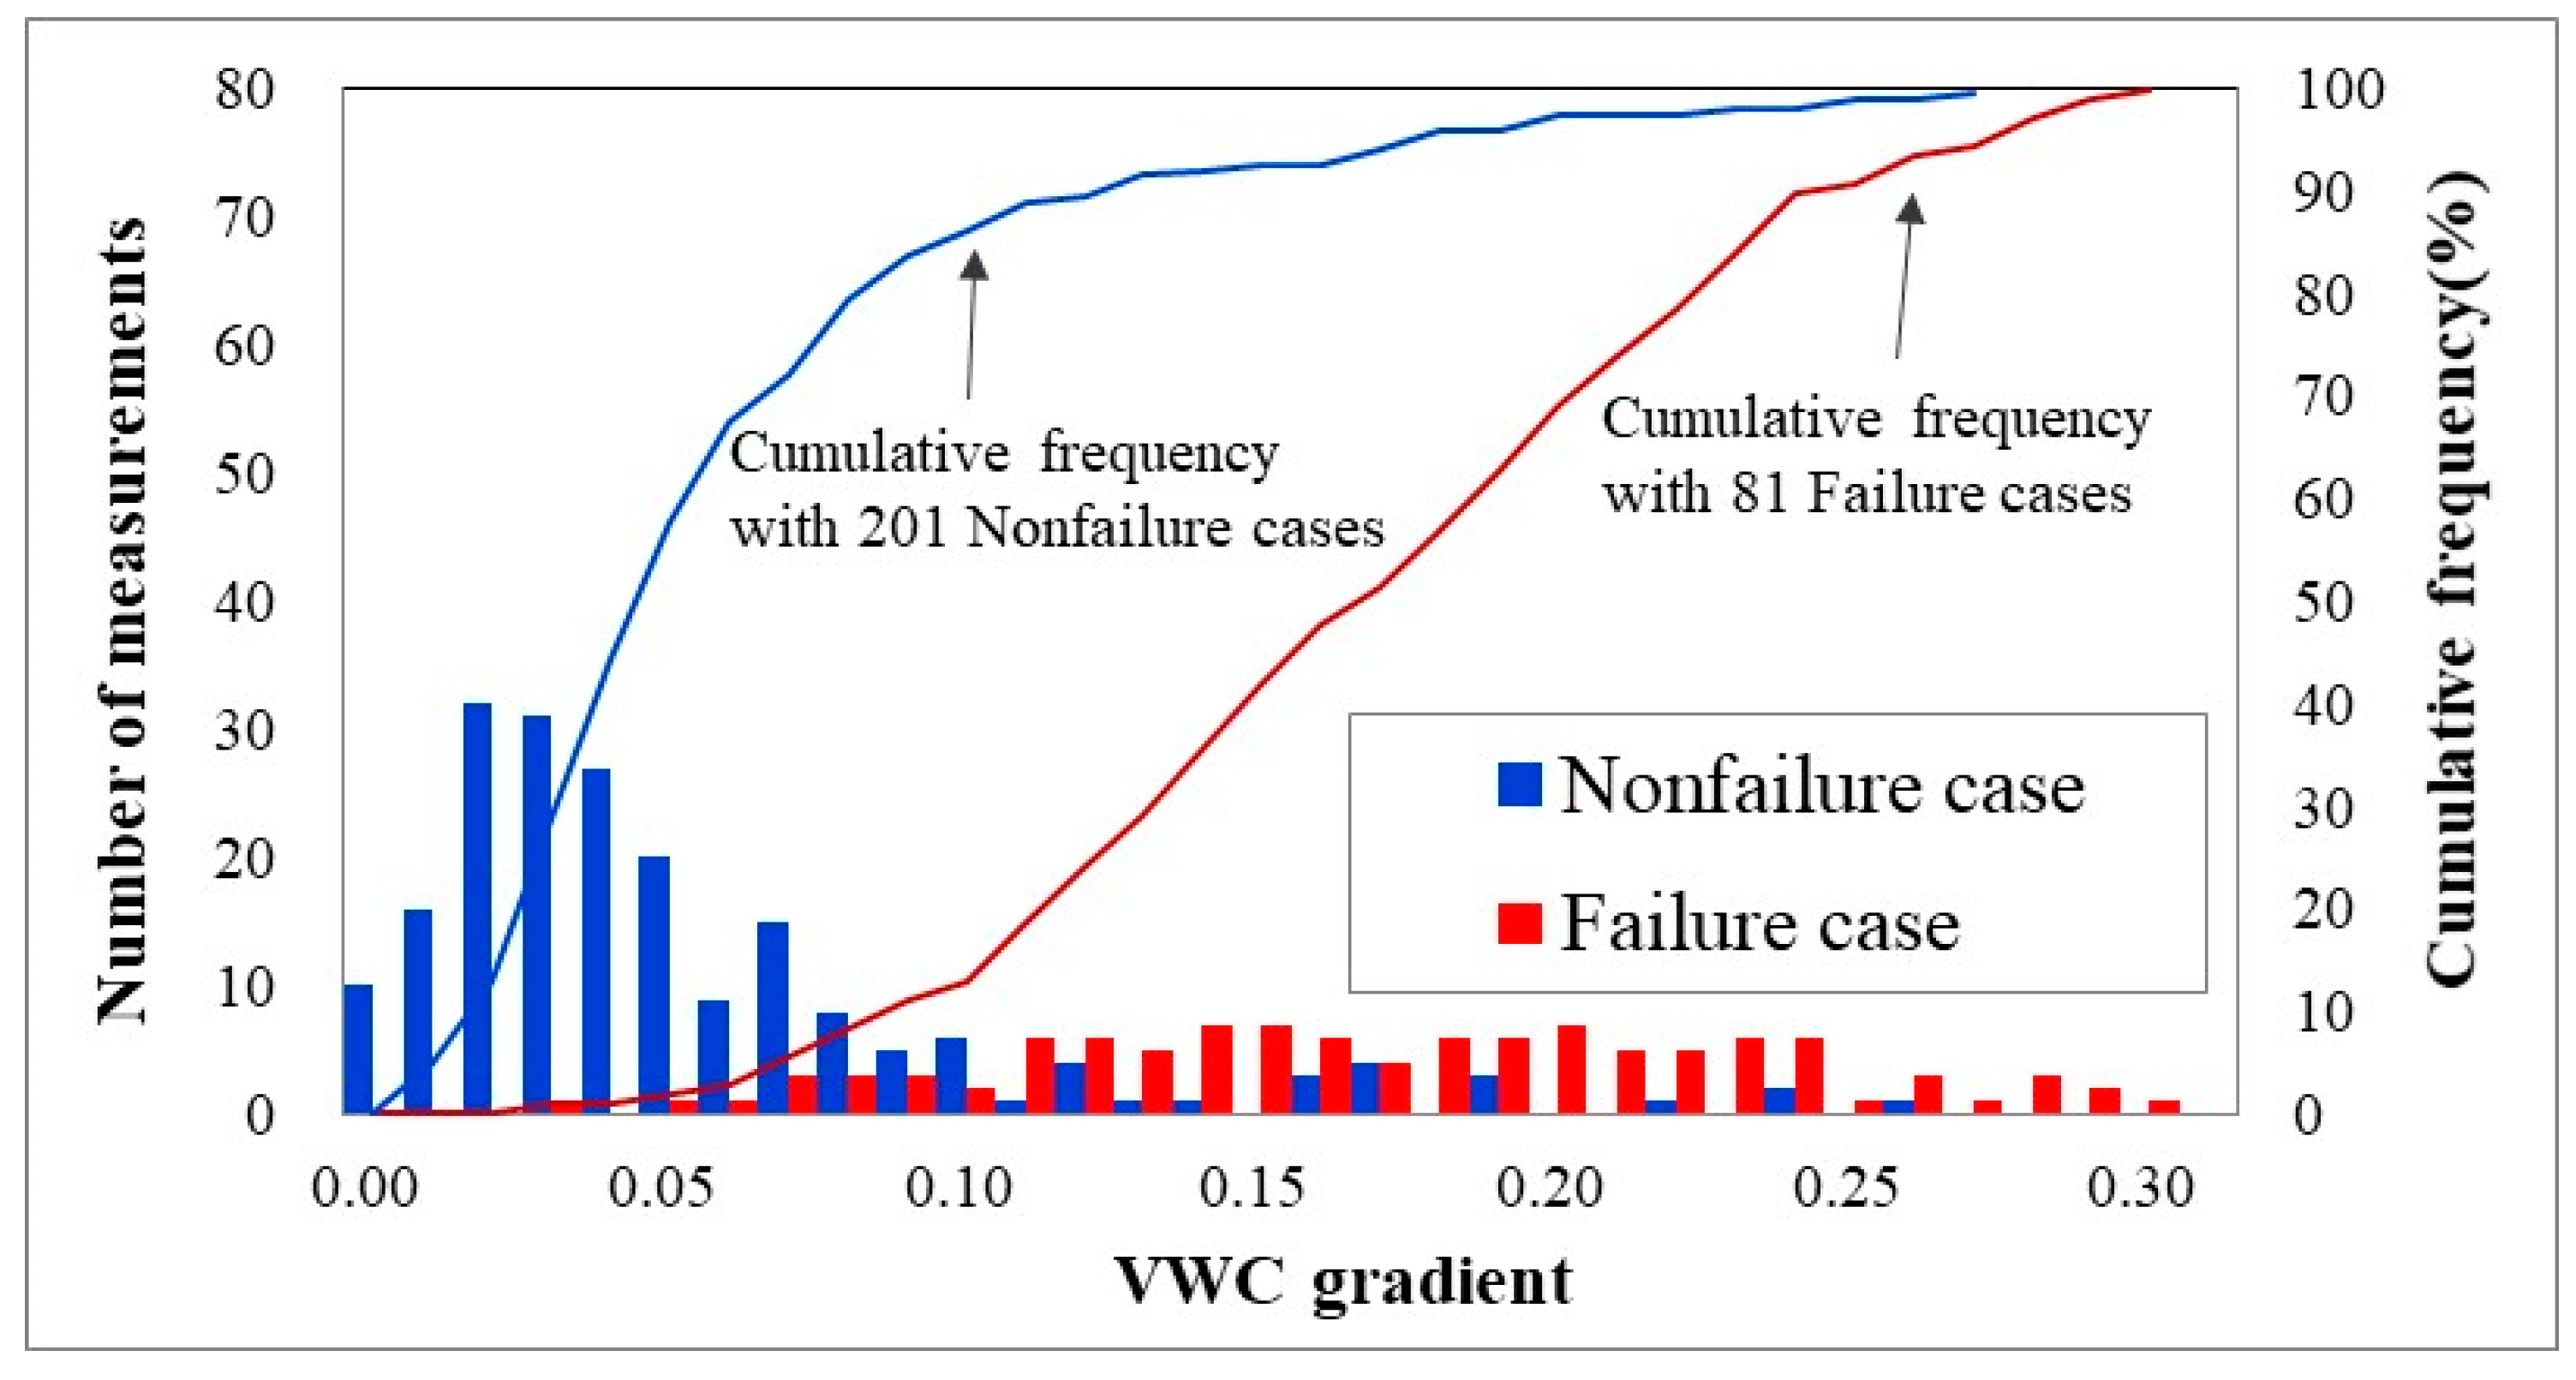
The distribution of the VWC gradient values according to the presence or absence of failure is plotted in a histogram form (
Figure 9). While the cumulative rate increased abruptly in the section with low VWC gradient values when no failure occurred, it increased continuously as the VWC gradient increased when failure occurred.
The failure rate according to the VWC gradient was examined for a total of 282 datapoints secured in this study using the distribution characteristics of the VWC according to the presence or absence of failure (
Figure 10). As the VWC gradient increased, the failure rate showed a tendency to increase. In particular, when the gradient exceeded 0.2, a high failure rate >80% was observed. The failure rate in this study does not have an absolute meaning because it was obtained based on the experimental and testbed data. The failure rate may change if failure case data obtained using flume experiments or nonfailure case data obtained using testbeds are added. As confirmed in this study, however, there will be no significant difference in the tendency of the failure rate to increase as the VWC gradient increases. In reference to the failure rate for each VWC gradient section, criteria for the measurement and management of the VWC gradient are proposed as listed in
Table 4. The section with the VWC gradient values <0.075 that yields failure rates <3% was defined as “prealert,” the 0.075–0.1 section with failure rates equal to ~20% as “alert”, the 0.1–0.2 section with a failure rate > 66% as “prewarning,” and the section with a VWC gradient >0.2 and failure rates >80% as “warning.” The management stages proposed in this study considered only the analyzed results for the experimentally acquired data. For the accuracy of the criteria, it is necessary to supplement the failure site data.
To identify a sign of failure on a slope with a risk of failure using the VWC, it is also necessary to determine the most effective measurement positions along with the management criteria presented above. In the flume experiments, measurement positions were not analyzed because there were no differences in the VWC gradient values at different positions. This appears to be because the VWC sensors installed in the flume experiments and testbeds had low depths. Considering that the failure depth ranged from 1 to 2 m at sites where shallow failure actually occurred, it is necessary to analyze the data measured at higher depths. It is predicted that large-scale flume experiments are required to secure measurement data in the event of shallow failure.
4. Measurement Position Setting Method
4.1. Full-Scale Flume Experiment
Full-scale flume experiments were performed to verify the proposed VWC measurement criteria and identify effective measurement positions.
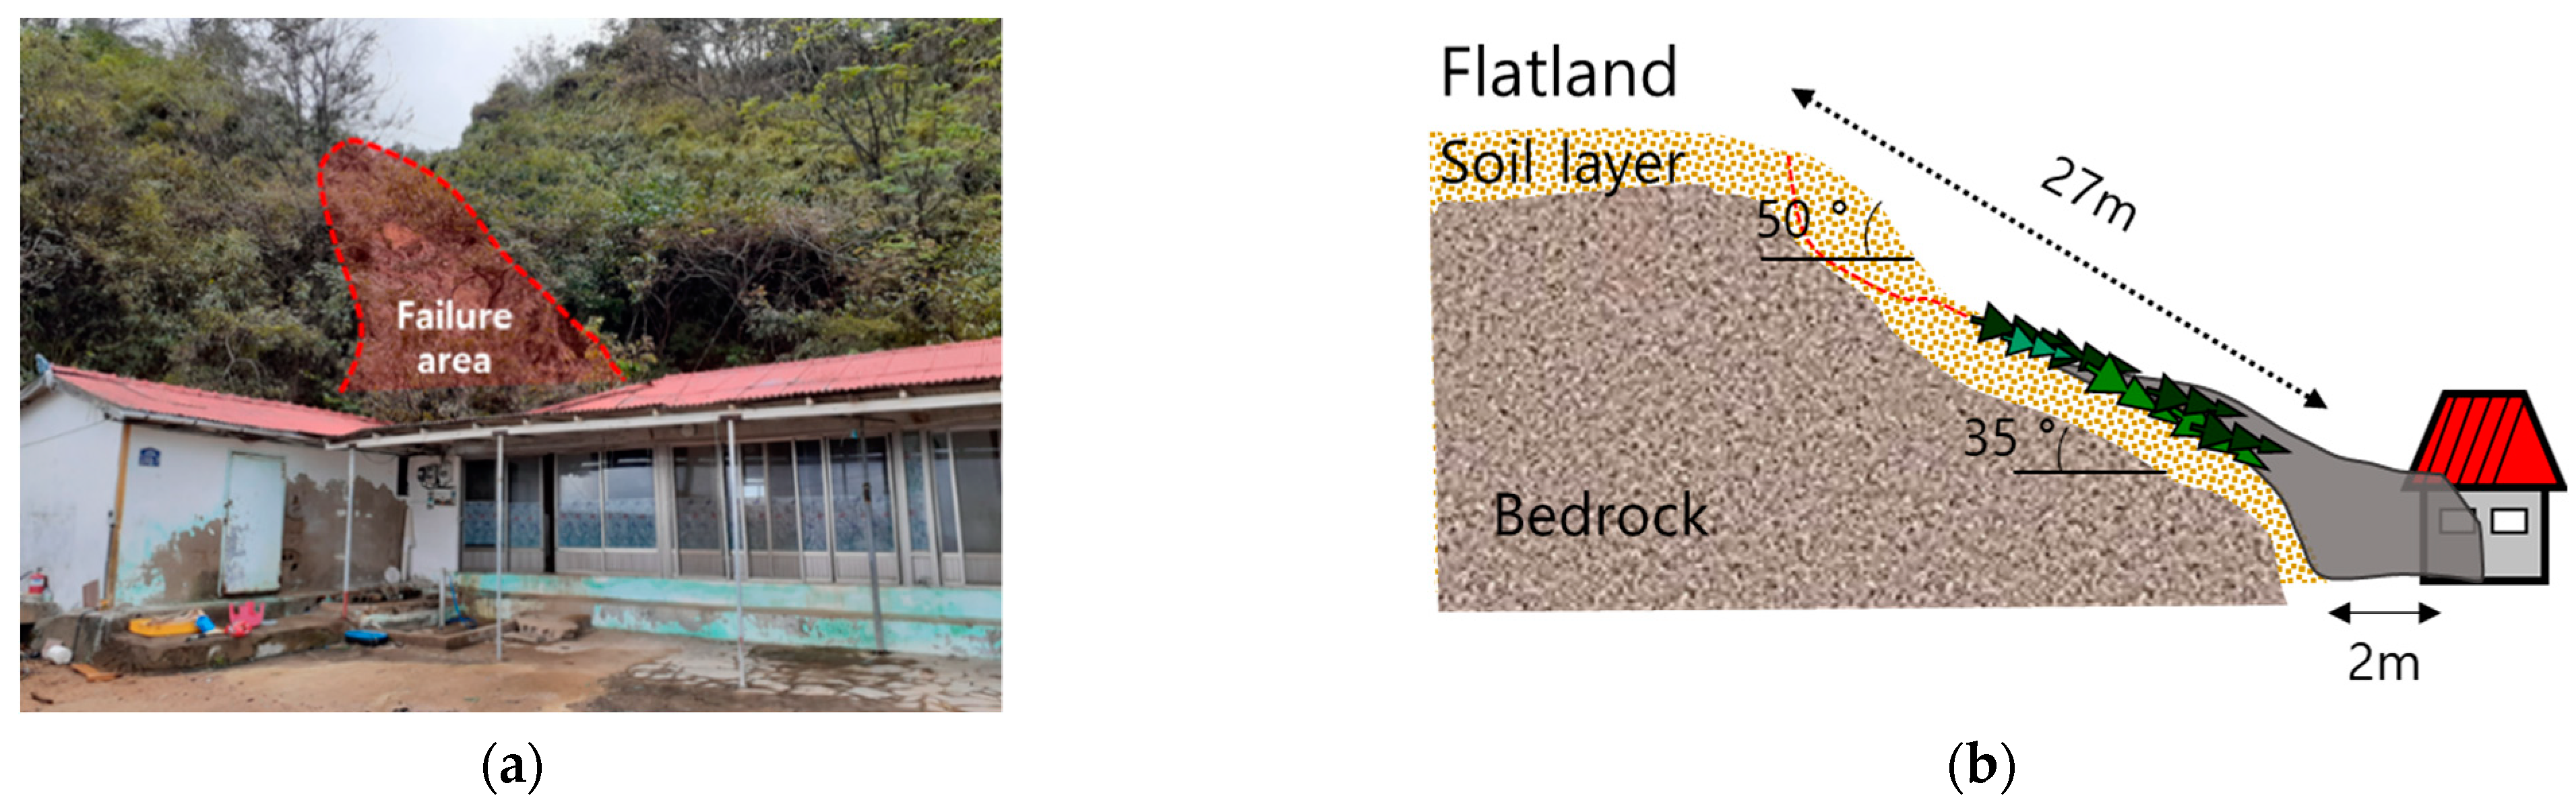
Figure 11 shows a site where shallow failure damage occurred during the invasion of the 18th typhoon Mitag in 2019. The shallow failure that occurred on the slope behind a house due to heavy rainfall damaged the wall of the house and caused two human casualties. In this study, an attempt was made to simulate this site through full-scale experiments subject to the assessment that this case is associated with a typical damage type that may occur during heavy rainfall.
Figure 12 shows the cross section of the full-scale flume experiments. The slope was created by reflecting the soil depth and soil characteristics of the damaged area identified through an onsite investigation. In particular, considering that the failure surface occurred at the boundary of the bedrock at the site, an impermeable layer with a thickness of 0.5 m was created under the soil layer at a depth of 1.5 m to reproduce shallow failure that occurred owing to the impermeable layer that served as an active surface. Sensors were installed in the berm, crest, inclined slope, and toe parts.
A full-scale flume experiment was performed two times in
Table 5. In the second experiment, some of the measurement positions were adjusted according to the feedback based on the results of the first experiment.
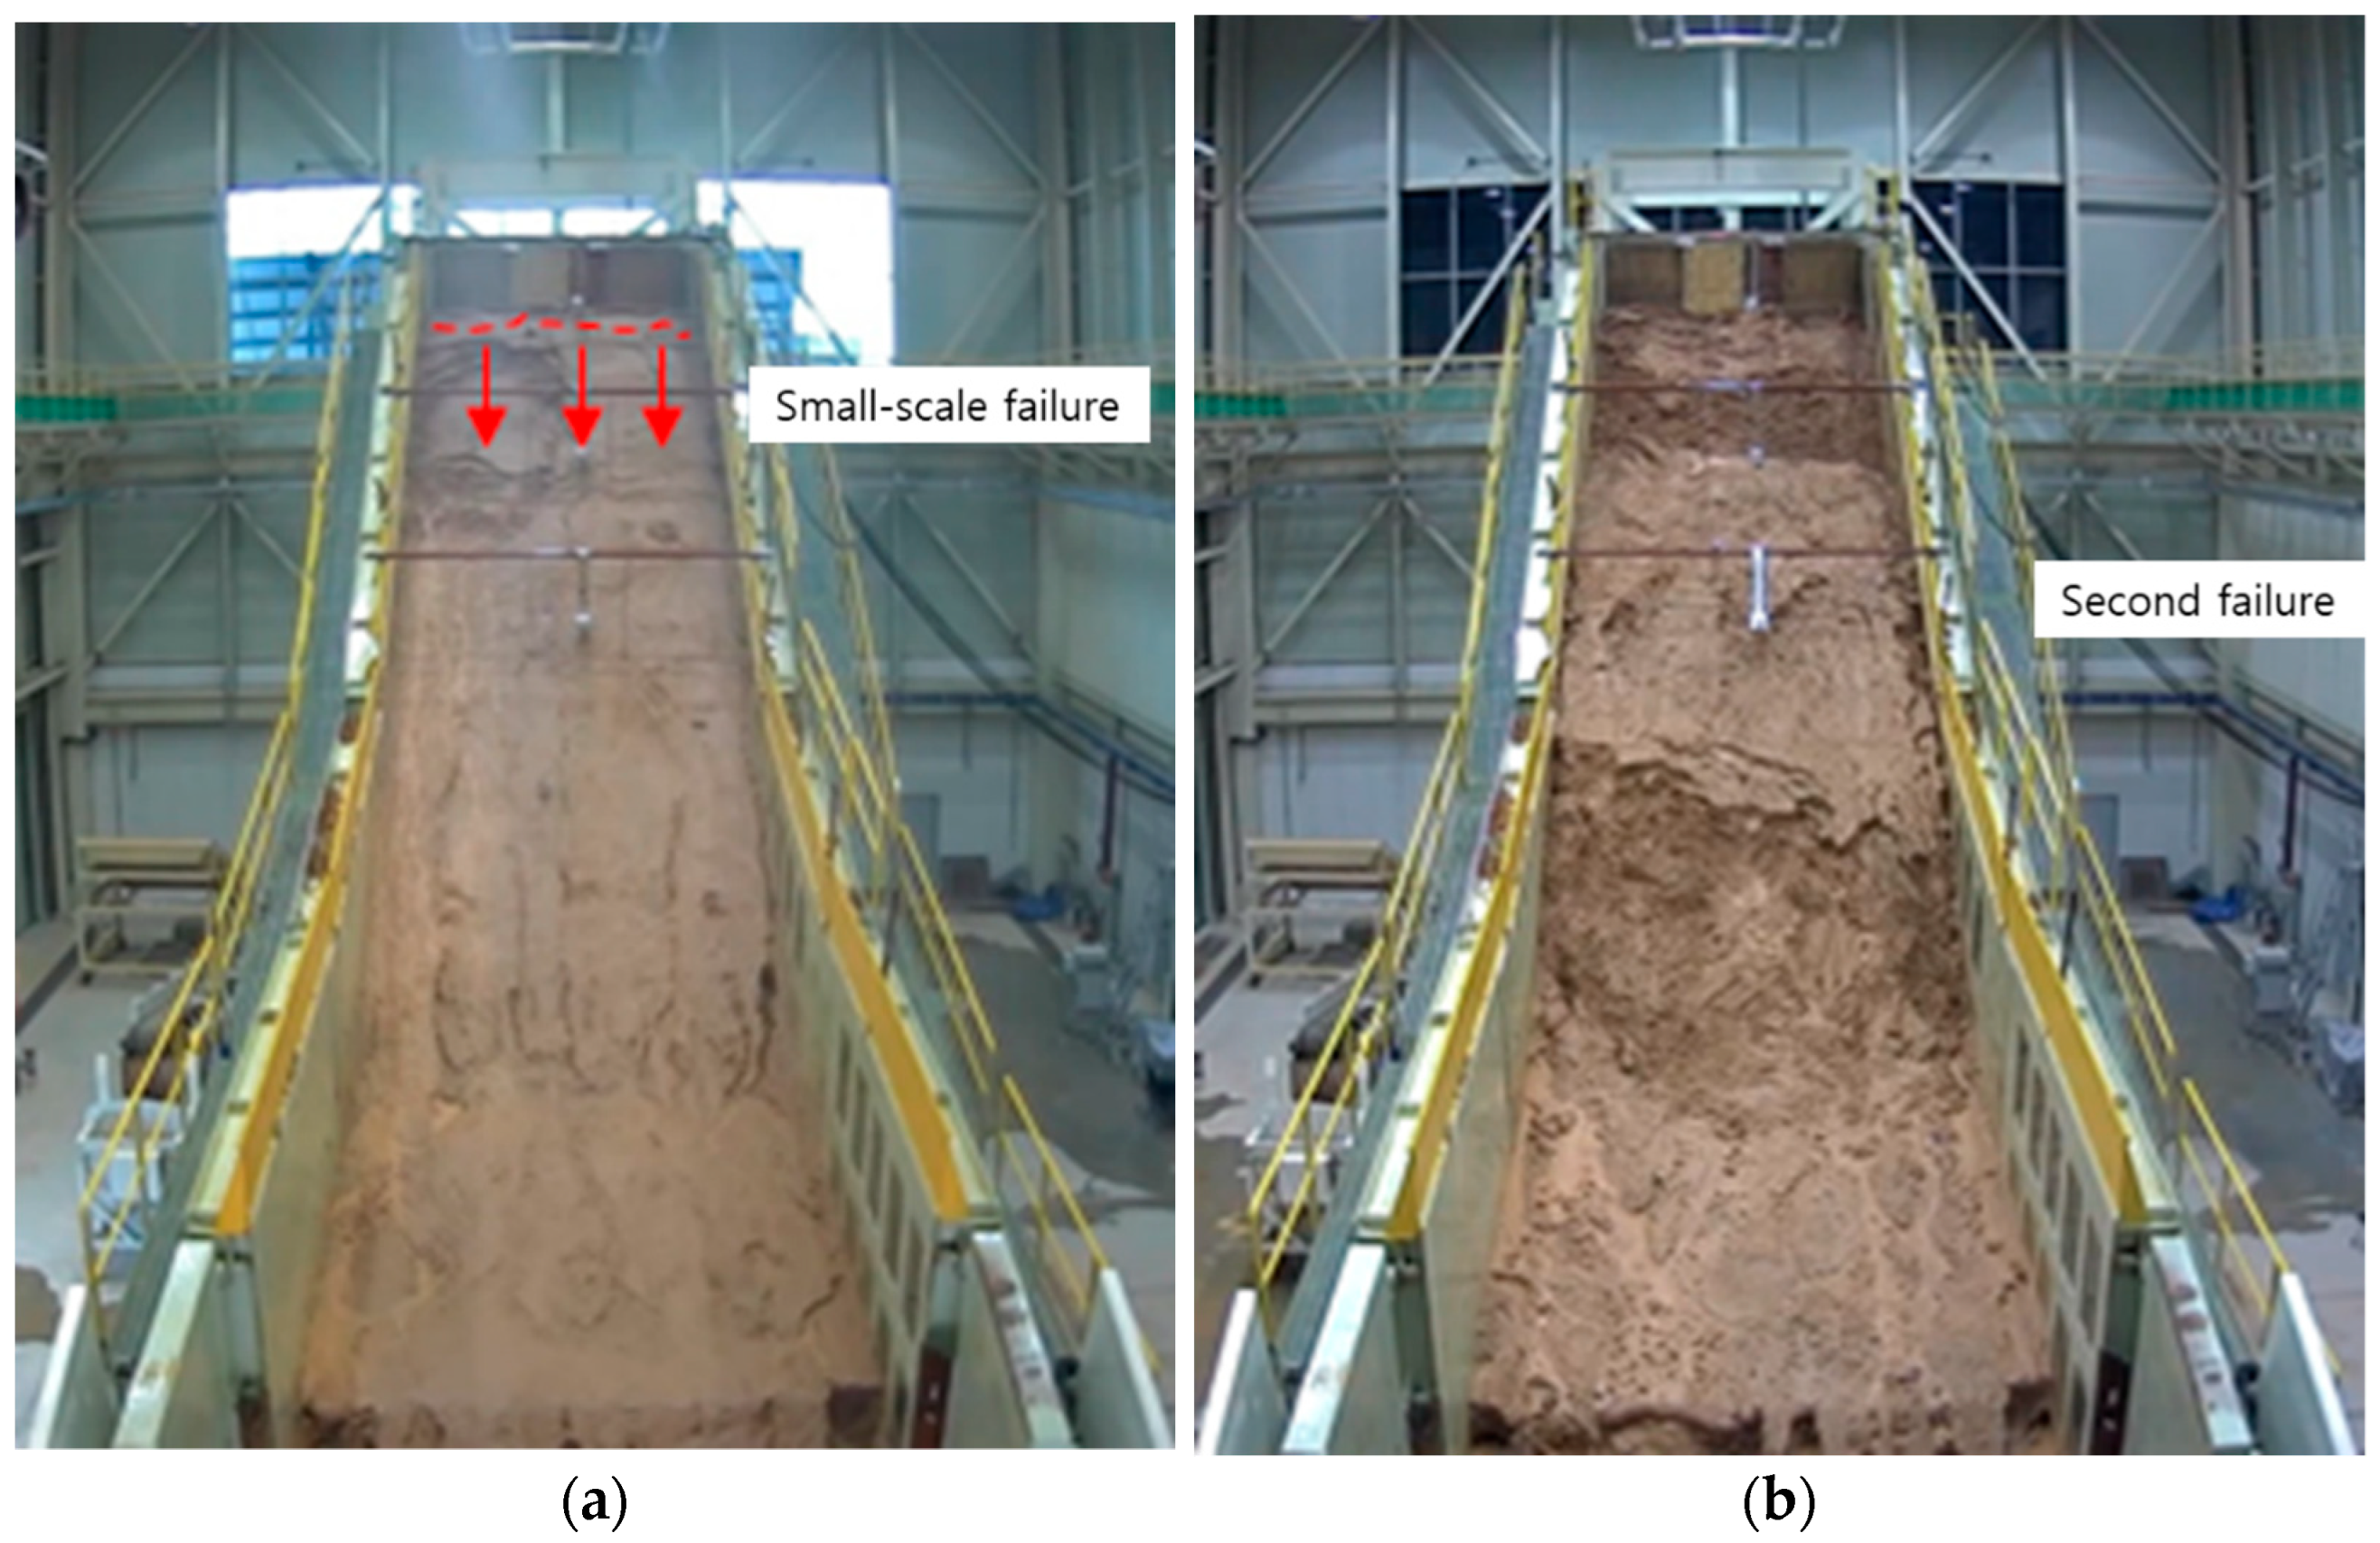
Figure 13a,b shows the failure process of the first full-scale flume experiment. Approximately 5 h and 28 min after spraying artificial rainfall with a rainfall intensity of 50 mm/h, local small-scale failure occurred at the boundary of the berm part on the slope (
Figure 14a). This is the position at which failure frequently occurs in the field. The position also appears to be most vulnerable to failure in this experiment. At 11 h and 16 min, the second collapse occurred; at this stage, the entire soil layer on the slope collapsed and shallow failure occurred.
4.2. Sensor Installation Positions
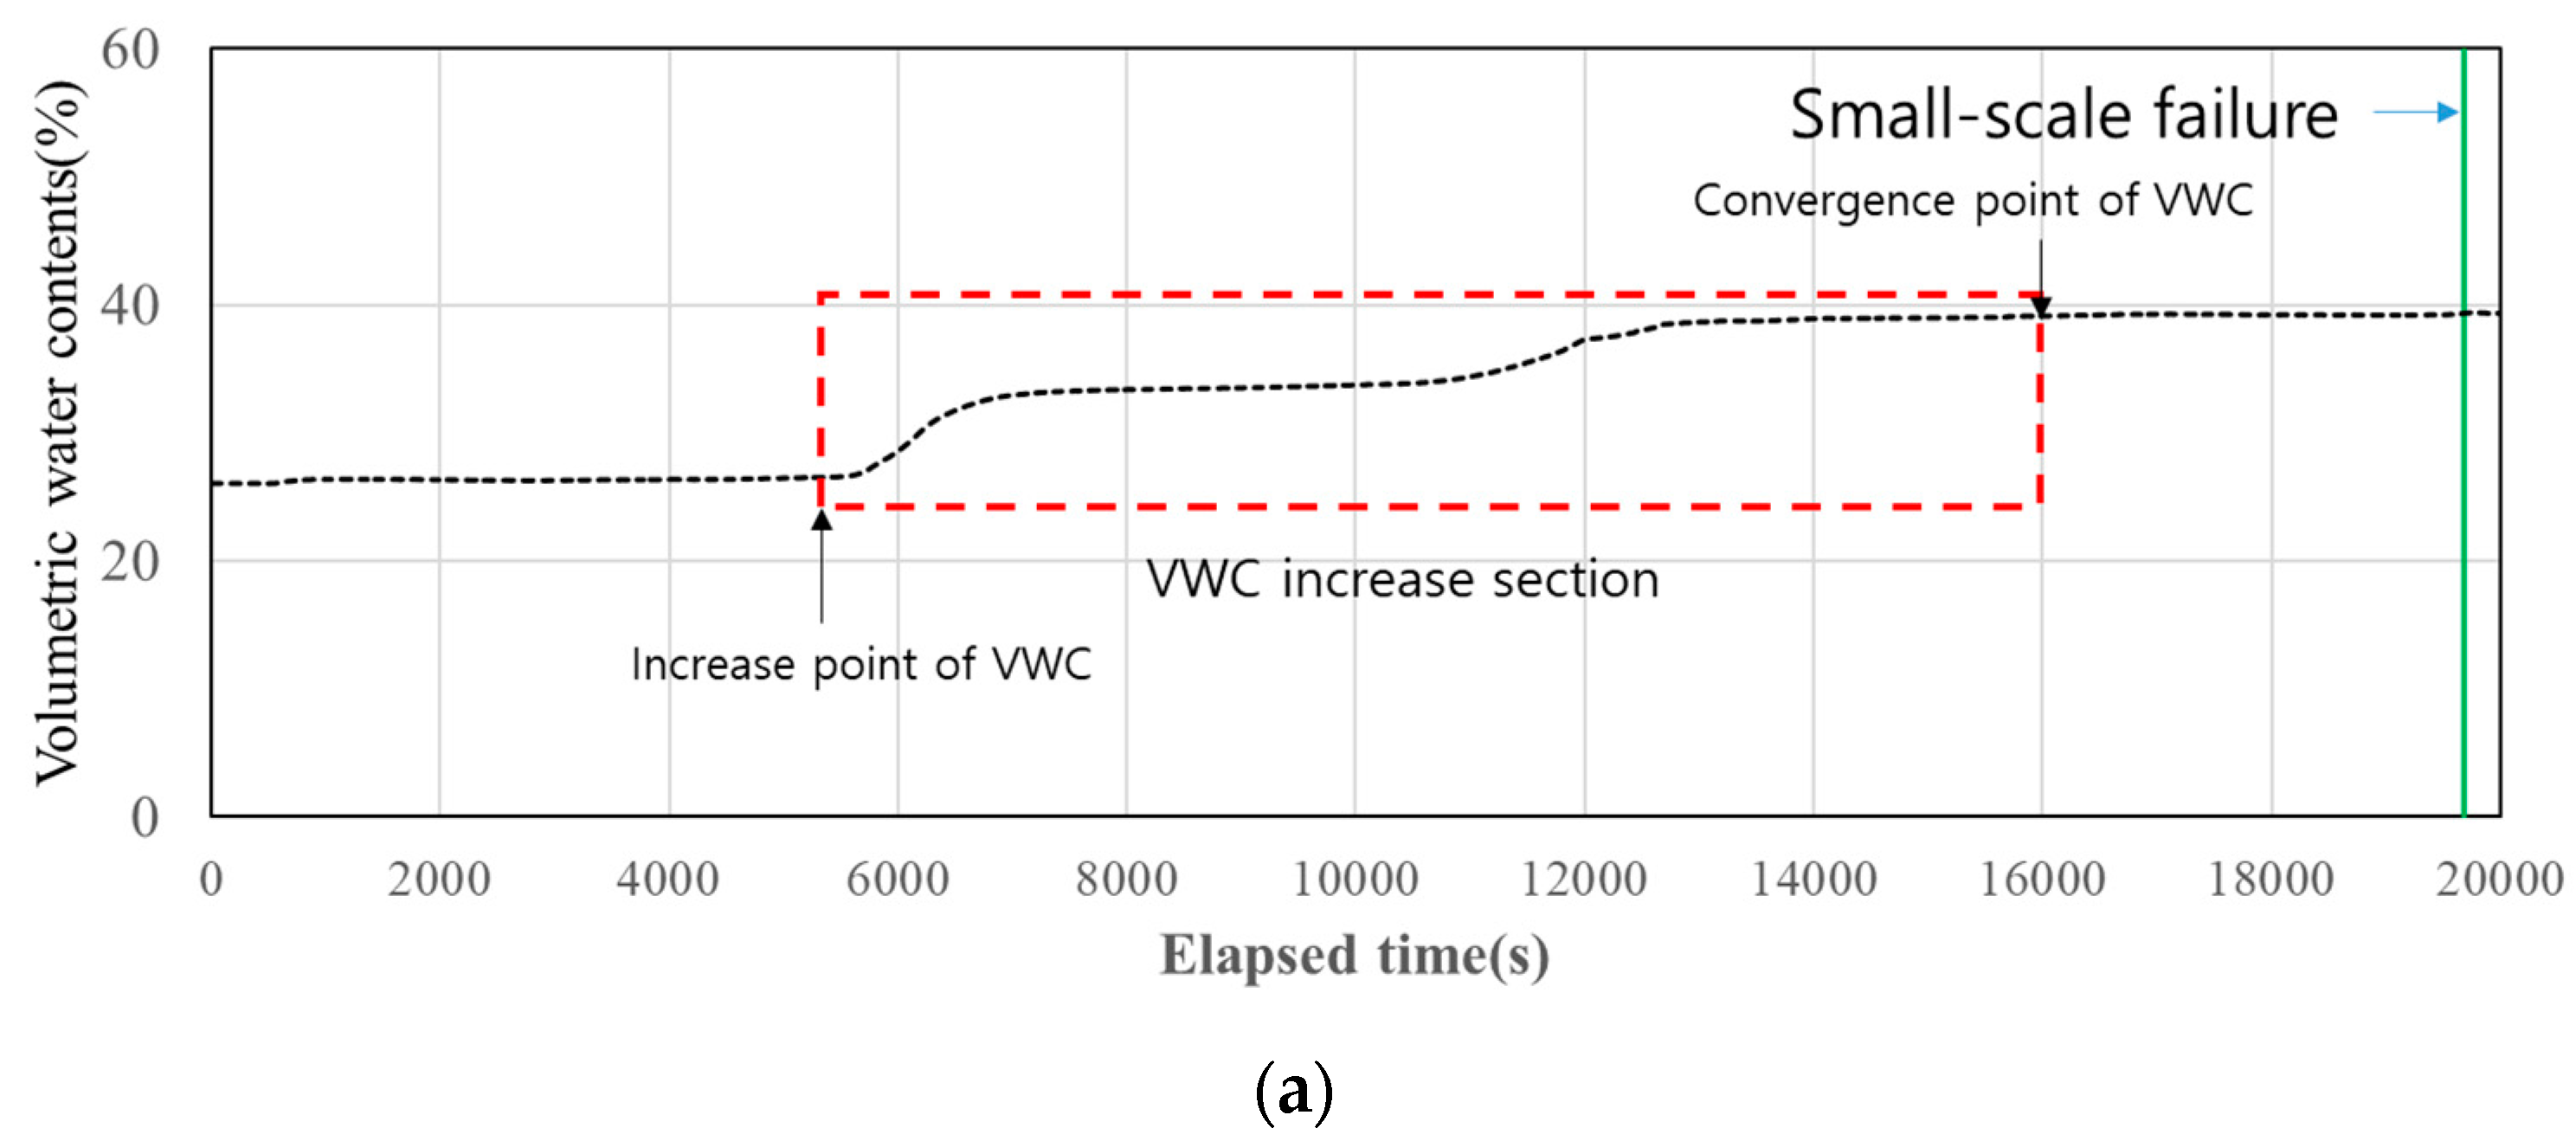
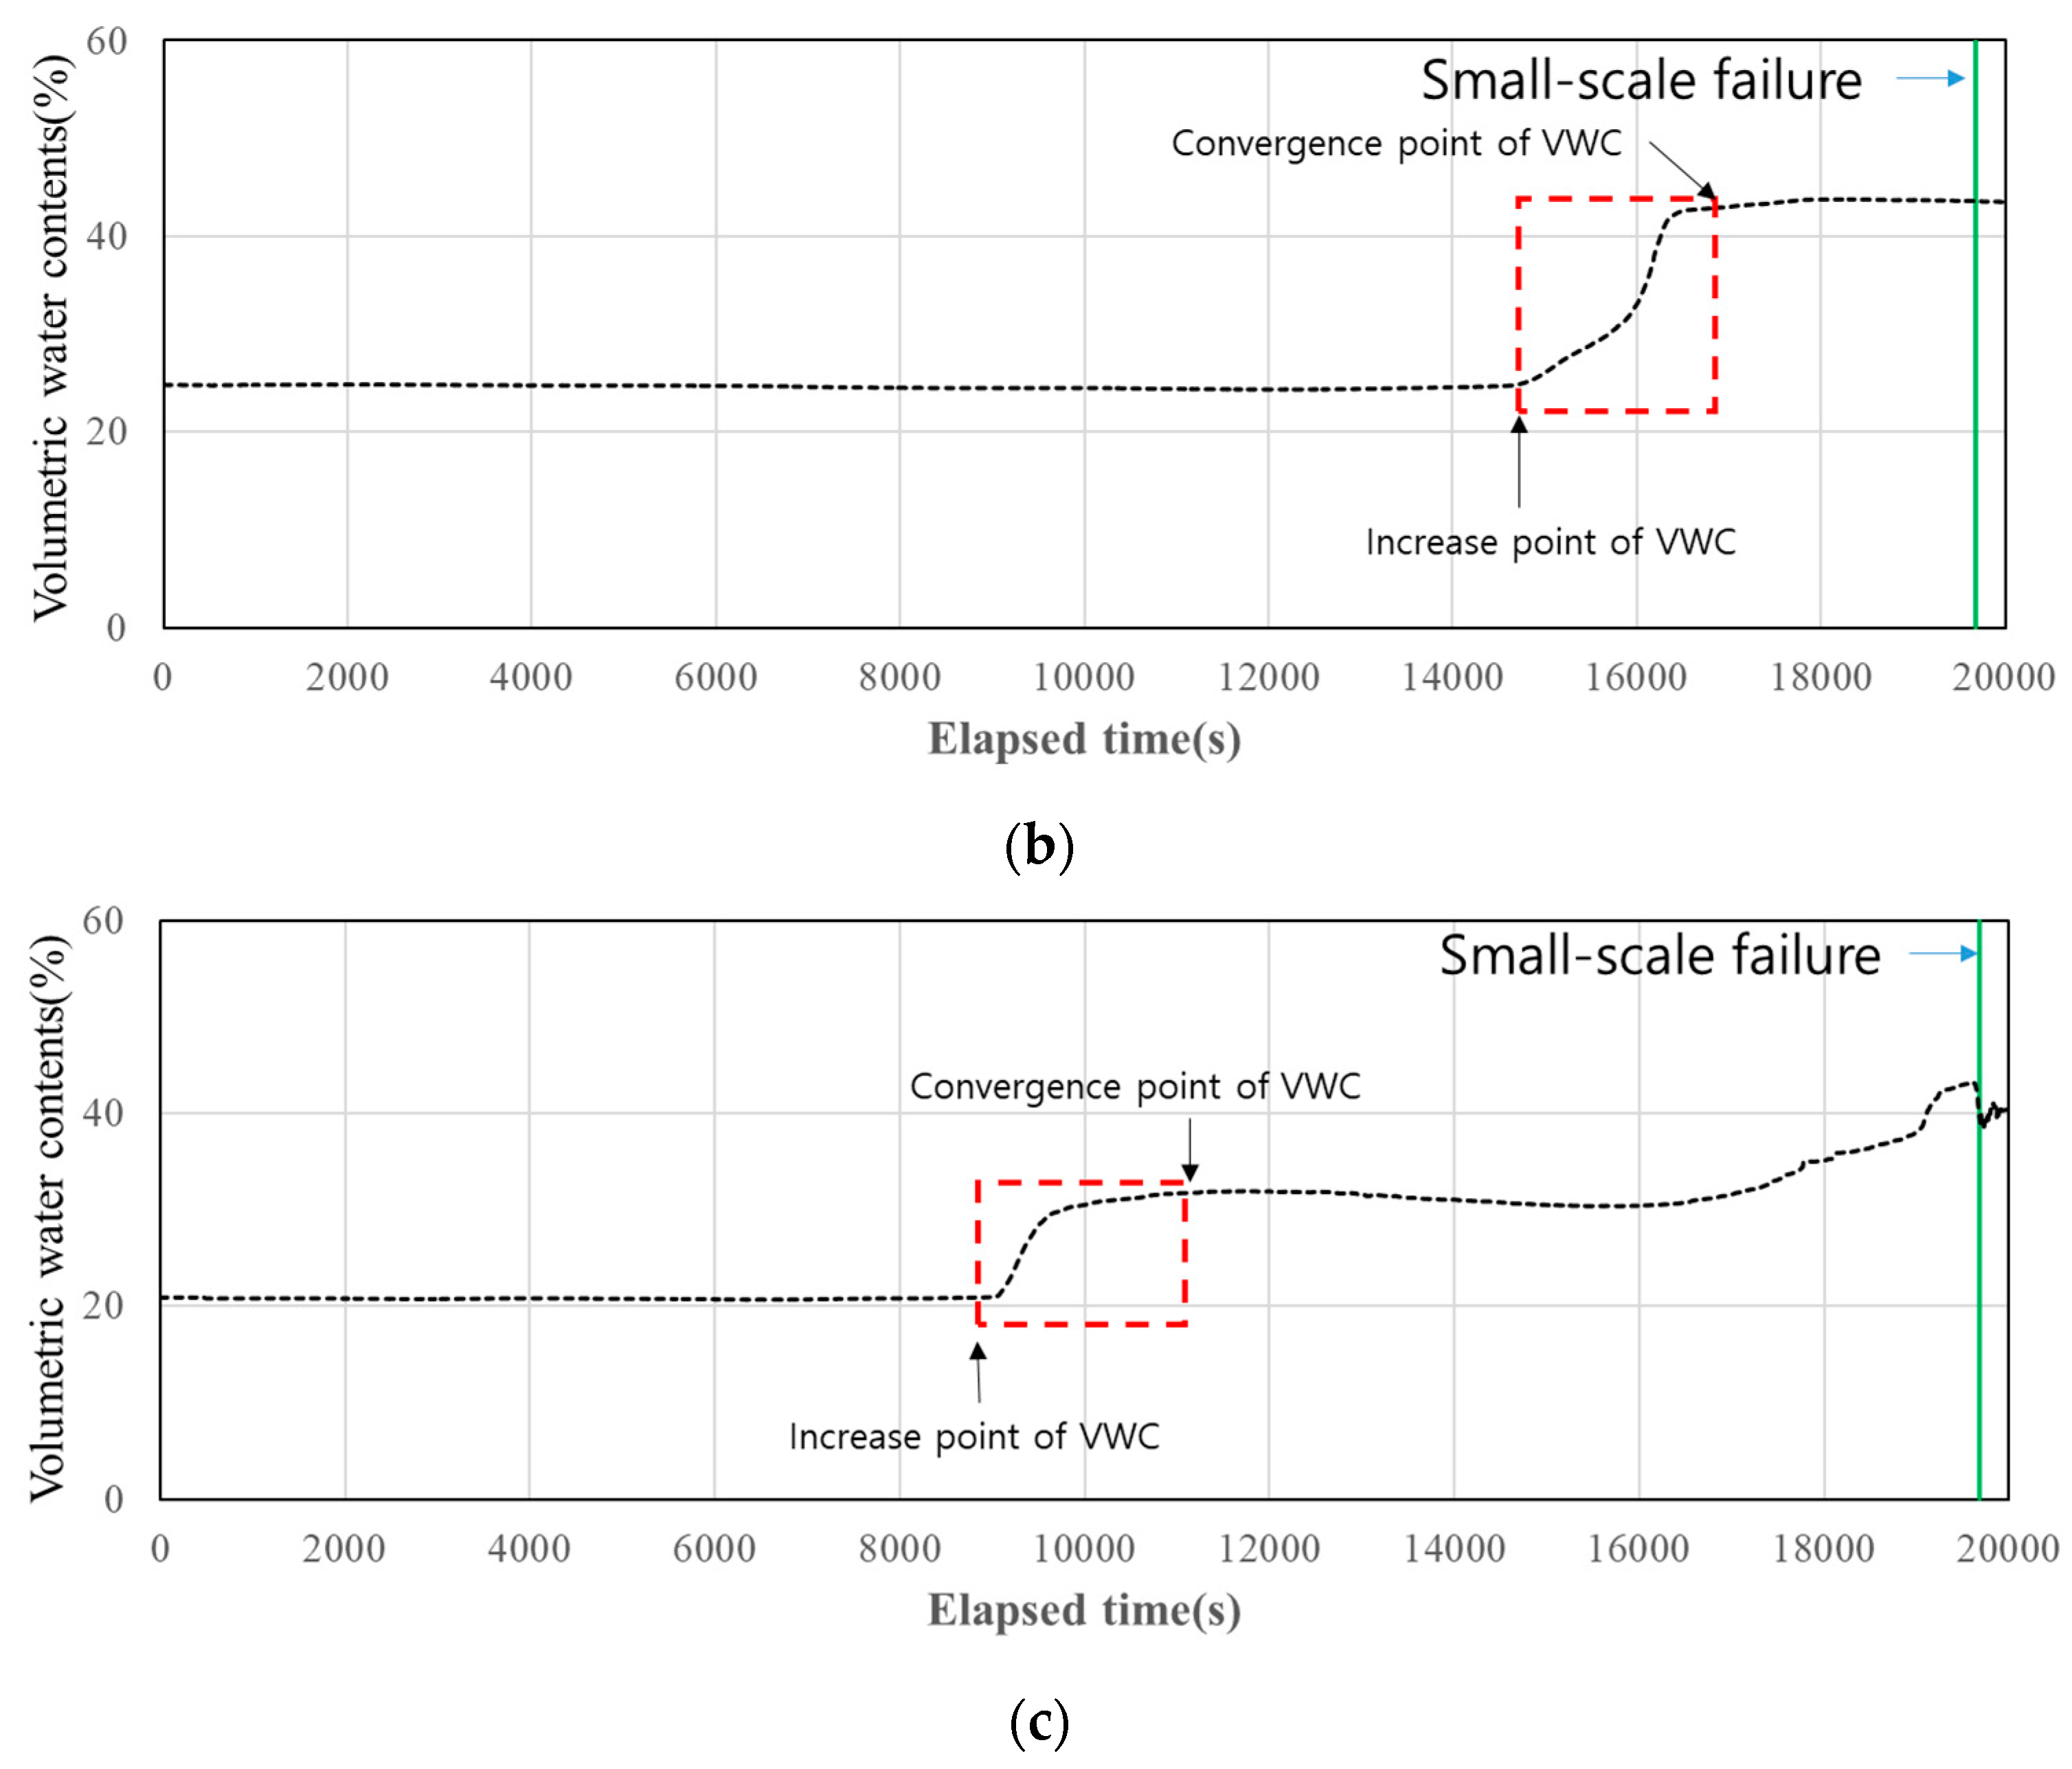
Figure 14 shows the VWC response to the small-scale failure that occurred in the first experiment. Owing to rainfall infiltration, the VWC showed different increase patterns at each position. The results measured in the crest part with convergence values > 40% were considered most directly related to the small-scale failure because the VWC rapidly increased immediately before the time of failure. This indicates that the measurement position is important to use the VWC as a precursor of failure.
In the first experiment, the active surface of the second failure occurred at the boundary of a soil depth of approximately 1.8 m. However, the installed VWC sensor with a maximum depth of 1.5 m, could not observe responses directly related to the failure. Based on the trial and error efforts of the first experiment, the maximum measurement depth of the VWC sensor was modified to 1.8 m in the second experiment. In the second experiment, small-scale and shallow failures followed the same pattern as those in the first experiment.
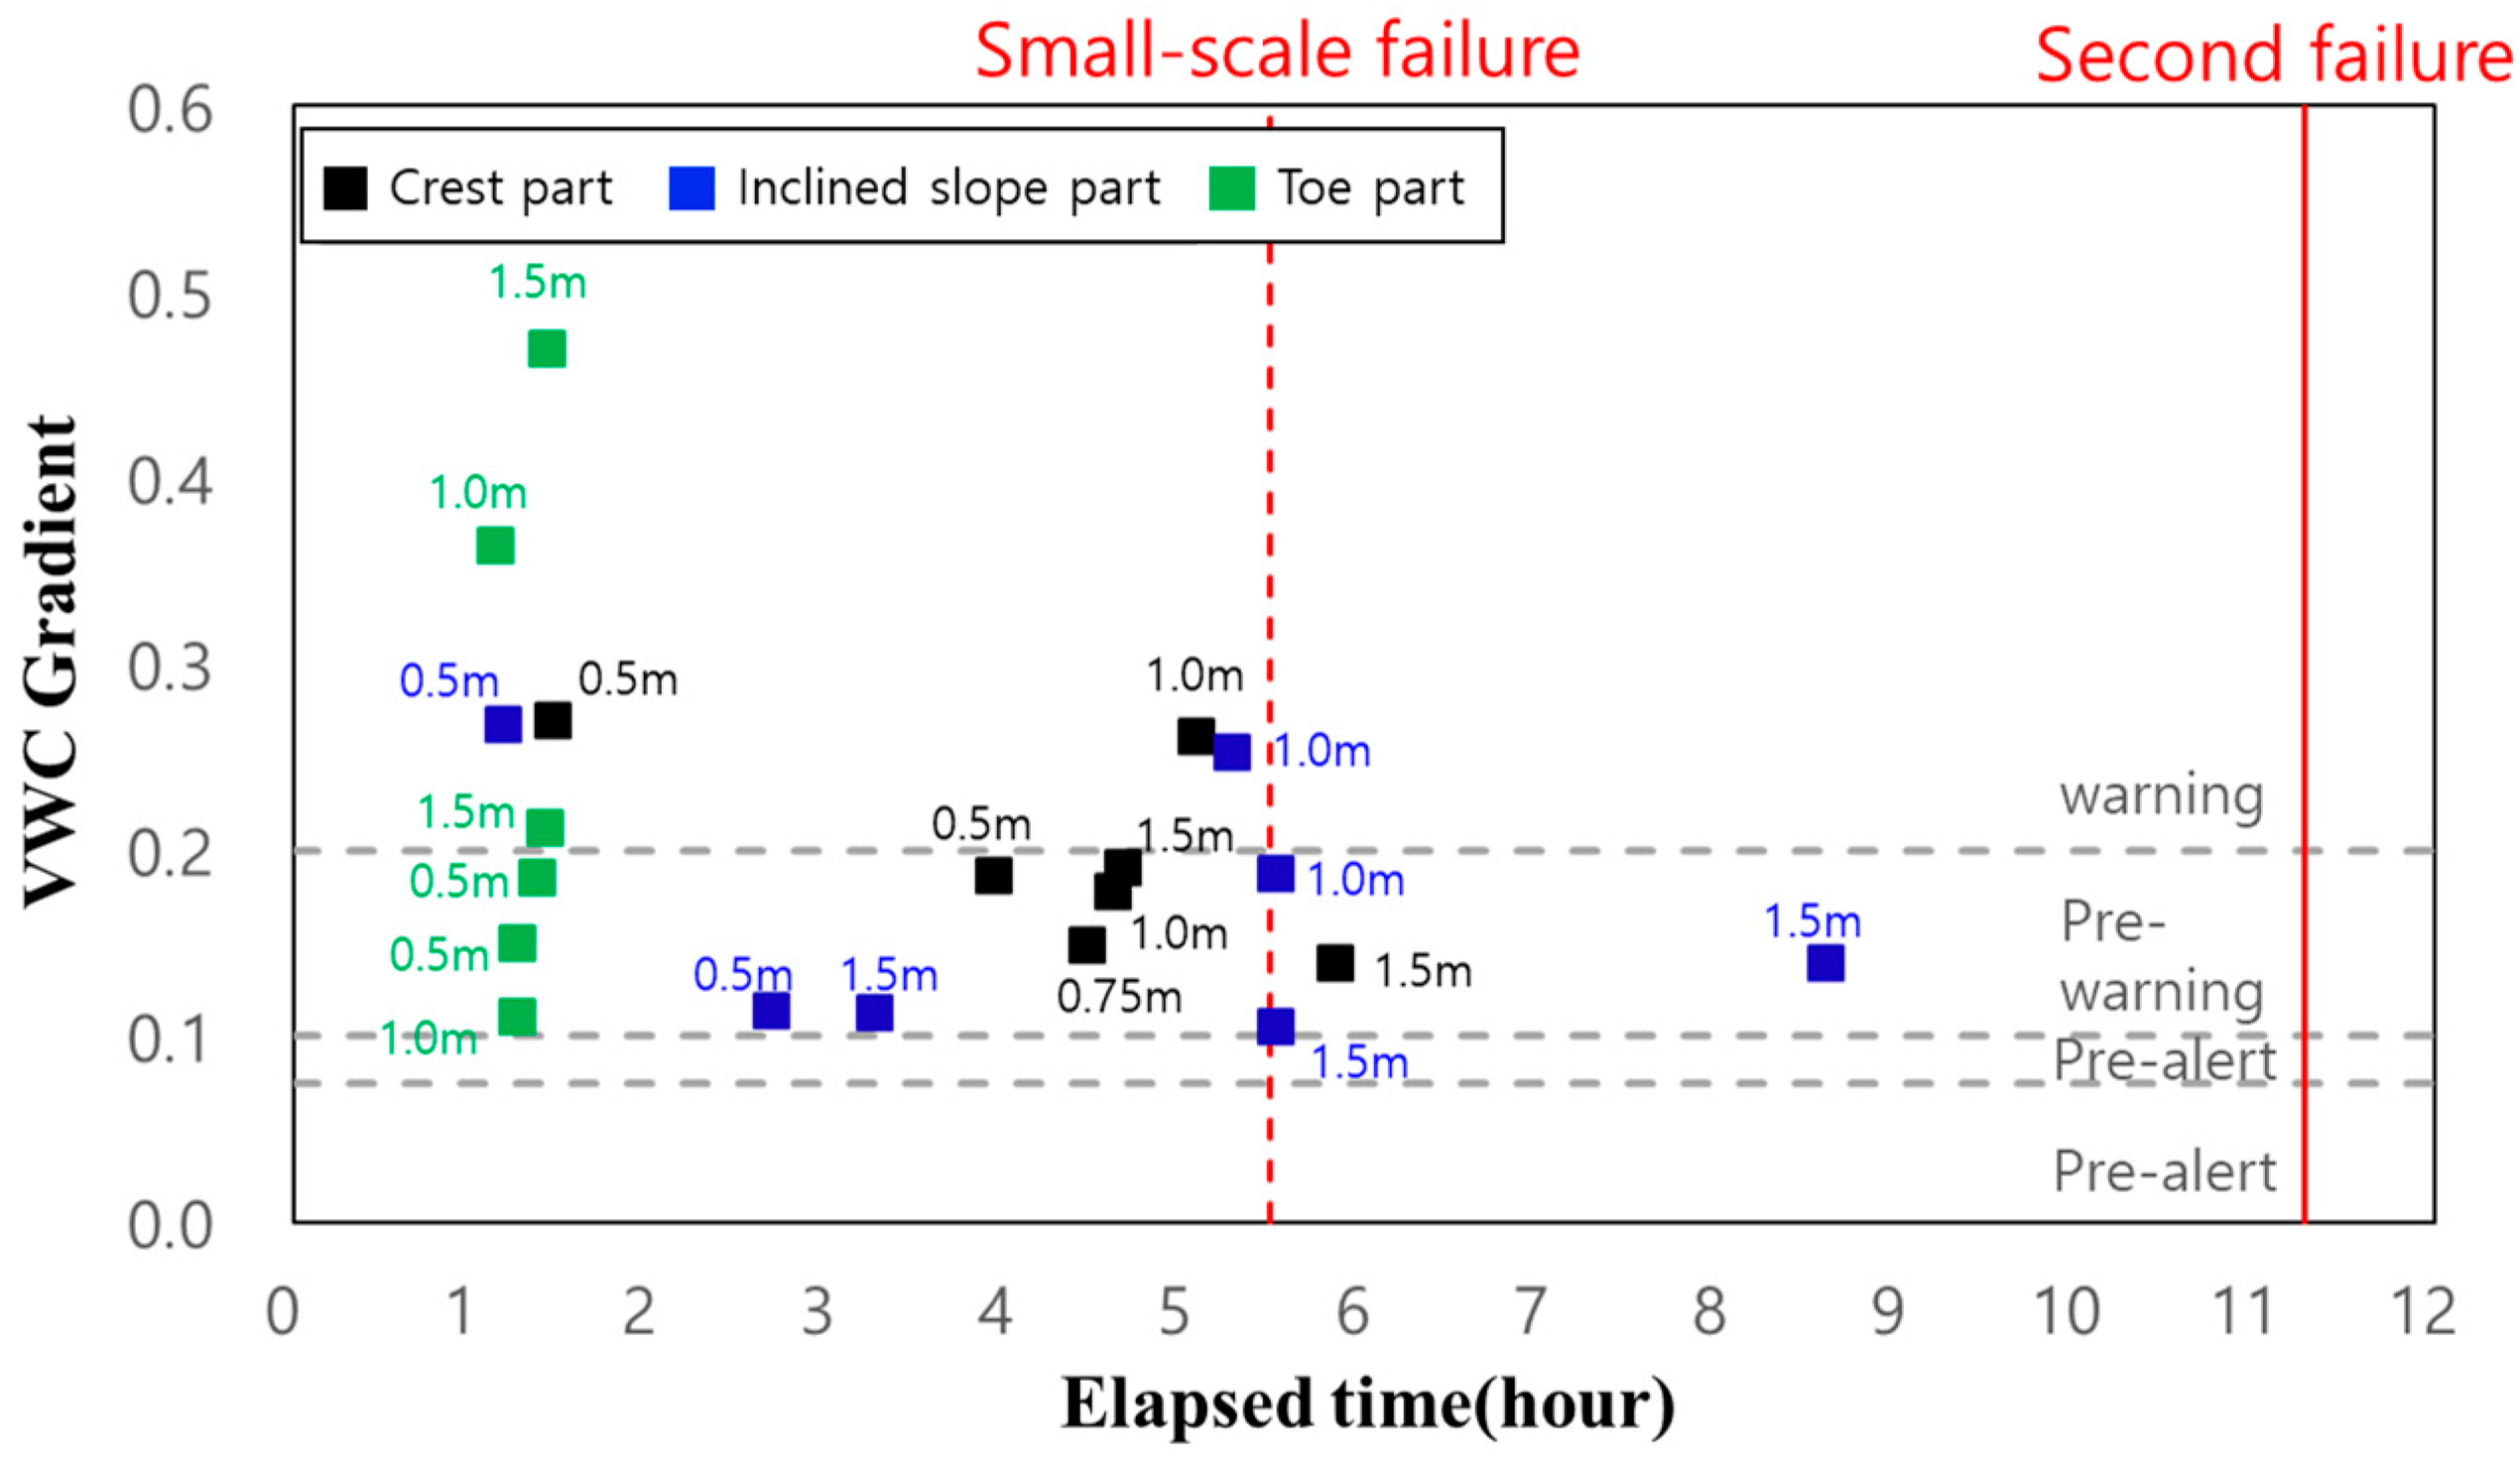
In the first and second experiments, the VWC gradient was calculated for each VWC sensor installation position and depth (
Figure 15 and
Figure 16).
In the first experiment, the VWC gradient was higher than 0.1 at all times. In the lower part, all sensors issued “prewarning” or “warning” alerts approximately 10 h before the occurrence of the final failure. However, the image analysis showed that high VWC gradient values were obtained regardless of the failure that occurred under the influence of surface loss and scour. Given that most of the sensors installed in the upper part issued “prewarning” alerts approximately 1 h before the occurrence of failure in the berm part, the position is suitable for predicting failure in the berm. However, the position is not suitable for predicting the final failure because the VWC value converged too early to predict the second failure.
In the case of depth, the sensors installed at a depth of 0.5 m and in the lower part exhibited high VWC gradient values regardless of failure subject to the influence of surface loss and scour. The sensors installed at depths of 1.0 and 1.5 m showed no significant differences as a function of depth. Consequently, in the first experiment, the lower part and the shallow depth (0.5 m) appeared to be inappropriate as sensor installation positions because high VWC gradient values were mostly observed under the influence of surface loss and scour. Therefore, sensors need to be installed in the upper part (a minimum depth of 1.0 m) to predict failure in the berm part and at a depth higher than 1.5 m to predict the final failure.
When the VWC gradient in the second experiment was examined, the values relevant to the sensors installed in the lower part and at a depth of 0.5 m mostly converged at the beginning of the experiment as in the first experiment, indicating that the positions are not suitable for sensor installations. The sensors in the upper and middle parts installed at a depth of 1.0 m could predict the small-scale failure that occurred in the upper part approximately 1 h earlier on average, thus showing that the positions are suitable for measurements. The sensors in the upper and middle parts installed at a depth of 1.8 m could predict failure 1.74 h and 1.03 h earlier, respectively, on average.
Based on the above results, it was confirmed that the lower part and a shallow depth of 0.5 m are not suitable for measurement because: (a) water was concentrated due to surface loss and scour, and (b) the VWC value rapidly converged regardless of failure. In addition, it was concluded that sensors needed to be installed at a depth of 1.0 m in the upper part to predict failure in the berm part where a sign of failure could be identified. Finally, for the prediction of shallow failure that occurs at the boundary of the impermeable layer, the upper and middle parts at a high depth (1.8 m) or positions immediately above the impermeable layer are considered to be the most suitable sensor installation positions.
5. Conclusions
This study aimed to develop a method to predict shallow failure using the VWC change characteristics that occur on a slope owing to rainfall infiltration. Considering the results of previous studies according to which the characteristics of the VWC can be used as a precursor to shallow failure, flume experiments were performed to identify the characteristics of the VWC gradient in the event of failure. Through the flume experiments, characteristics for each VWC sensor installation position were examined at various slope conditions. In addition, the characteristics of the VWC gradient according to the presence or absence of failure were compared through the VWC measurement data at actual sites where no failure occurred.
It was found that the probability of failure increased as the VWC gradient increased. The results obtained from the analysis of the flume experiment and testbed data showed that the failure rate was: (a) less than 3% when the VWC gradient was less than 0.075, (b) less than 20% when it was between 0.075 and 0.1, (c) more than 66% when it was between 0.1 and 0.2, and (d) more than 80% when it was higher than 0.2. Based on these ranges, early warning criteria for these four stages were proposed.
Considering that it was difficult to determine appropriate sensor installation positions in small-scale flume experiments, full-scale flume experiments were performed. For the full-scale flume experiments, a slope was created by simulating an actual site where failure occurred, and the shallow failure caused by rainfall infiltration was reproduced.
In both the first and second full-scale flume experiments, small-scale and second failures finally occurred in the forms of shallow failures in the berm part. When the characteristics of the VWC gradient were investigated at each measurement position (berm, crest, inclined slope, and toe parts) and depth (0.5 m, 1.0 m, 1.5 m, and, 1.8 m) before the occurrence of failure, it was confirmed that the lower part (toe part) and a shallow depth of 0.5 m were not suitable for measurements because water was concentrated due to surface loss and scour, and the VWC value rapidly converged regardless of failure. In addition, it is inferred that sensors need to be installed at a depth of 1.0 m in the upper part (crest part) to predict small-scale failure in the berm part, where a sign of failure can be identified. Finally, for the prediction of shallow failure (second failure) that occurs at the boundary of the impermeable layer, the upper and middle parts at a high depth (1.8 m) or positions immediately above the impermeable layer are considered to be the most suitable sensor installation positions.
In Korea, monitoring is generally performed by installing sensors when there is a risk of failure on a slope. In many cases, however, signs of failure are only observed using displacement meters, closed-circuit televisions, and clinometers. It can be stated that VWC sensors are highly applicable to the field because they can be used as a means to determine the presence or absence of failure in advance. The early warning criteria proposed in this study can be used as criteria for determining the possibility of the occurrence of shallow failure. Field verification is required for the early warning criteria proposed in this study. Considering that it is difficult to secure measurement data at sites where failure occurred, it is inferred that the applicability of the criteria to the field is secured as the results of the flume and full-scale flume experiments confirmed the possibility of predicting failure using the VWC gradient value. It is necessary to supplement the proposed measurement criteria by researching soils with various properties other than the weathered granite soil used in this study.
Author Contributions
Conceptualization, J.-W.S., S.-G.C. and M.-S.J.; methodology, H.-S.K.; formal analysis, J.-W.S., H.-J.K.; writing—original draft preparation, J.-W.S.; writing—review and editing, H.-S.J.; supervision, H.-S.J. All authors have read and agreed to the published version of the manuscript.
Funding
This research was supported by the project “Development of Slope Disaster Vulnerability Assessment based on Empirical Experiments (II)” (grant number NDMI-PR-2022-07-02) from the National Disaster Management Research Institute.
Institutional Review Board Statement
Not applicable.
Informed Consent Statement
Not applicable.
Data Availability Statement
MDPI Research Data Policies.
Conflicts of Interest
The authors declare no conflict of interest.
References
- Kim, J.H.; Jeong, S.S.; Park, S.W.; Sharma, J. Influence of rainfall-induced wetting on the stability of slopes in weathered soils. Eng. Geol. 2004, 75, 251–262. [Google Scholar] [CrossRef]
- Kim, K.S. Soil Characteristics according to the geological condition of soil slopes in landslides area. J. Eng. Geol. 2006, 16, 359–371. [Google Scholar]
- Kim, W.Y.; Chae, B.G. Characteristics of rainfall, geology and failure geometry of the landslide areas on natural terrains, Korea. J. Eng. Geol. 2009, 19, 331–344. [Google Scholar]
- Bonnard, C.; Noverraz, F. Influence of Climate Change on Large Landslides: Assessment of Long-term Movements and Trends. In Proceedings of the International conference on landslides—Causes, Impacts and Countermeasures, Davos, Switzerland, 17–21 June 2001; pp. 121–138. [Google Scholar]
- Cannon, S.H.; Ellen, S.D. Rainfall conditions for abundant debris avalanches, San Francisco Bay region, California. Calif. Geol. 1985, 38, 267–272. [Google Scholar]
- Crozier, M.J. Prediction of rainfall-triggered landslides: A test of the antecedent water status model. Earth Surf. Processes Landf. 1999, 24, 825–833. [Google Scholar] [CrossRef]
- Glade, T.; Crozier, M.; Smith, P. Applying probability determination to refine landslide-triggering rainfall thresholds using an empirical “Antecedent Daily Rainfall Model”. Pure Appl. Geophys. 2000, 157, 1059–1079. [Google Scholar] [CrossRef]
- Tsai, T.L.; Chen, H.F. Effects of degree of saturation on shallow landslides triggered by rainfall. Environ. Earth Sci. 2010, 59, 1285–1295. [Google Scholar] [CrossRef]
- Hawke, R.; McConchie, J. In situ measurement of soil moisture and pore-water pressures in an “Incipient” landslide: Lake Tutira, New Zealand. J. Environ. Manag. 2011, 92, 266–274. [Google Scholar] [CrossRef]
- Valenzuela, P.; Domínguez-Cuesta, M.J.; García, M.A.M.; Jimenéz-Sánchez, M. Rainfall thresholds for the triggering of landslides considering previous soil moisture conditions (Asturias, NW Spain). Landslides 2018, 15, 273–282. [Google Scholar] [CrossRef]
- Lu, N.; Godt, J.W.; Wu, D.T. A closed-form equation for effective stress in unsaturated soil. Water Resour. Res. 2010, 46, 1–14. [Google Scholar] [CrossRef]
- Bordoni, M.; Meisina, C.; Valentino, R.; Persichillo, M.G.; Bittelli, M.; Chersich, S. The impact of hydrological parameters on modelling slope safety factor towards shallow landslides: A case study from Oltrepo Pavese. E3S Web Conf. 2016, 9, 15055. [Google Scholar] [CrossRef] [Green Version]
- Seo, W.G.; Choi, J.H.; Chae, B.G.; Song, Y.S. Characteristics of landslide occurrence and change in the matric suction and volumetric water content due to rainfall infiltration. J. Eng. Geol. 2017, 27, 475–487. [Google Scholar] [CrossRef]
- Suk, J.W.; Park, S.Y.; Na, G.H.; Kang, H.S. A Study for characterization on shallow behavior of soil slope by flume experiments. J. Eng. Geol. 2018, 28, 489–499. [Google Scholar]
- Kim, M.I.; Chae, B.G.; Cho, Y.C.; Seo, Y.S. Study on rainfall infiltration characteristics for weather soils: Analysis of soil volumetric water content and its application. J. Eng. Geol. 2008, 18, 83–92. [Google Scholar]
- Kim, M.I.; Nishigaki, M. Slope failure predicting method using the monitoring of volumetric water content in soil slope. J. Eng. Geol. 2006, 16, 135–143. [Google Scholar]
- Acharya, G.; Cochrane, T.A.; Davies, T.; Bowman, E. The influence of shallow landslides on sediment supply: A flume-based investigation using sandy soil. Eng. Geol. 2009, 109, 161–169. [Google Scholar] [CrossRef]
- Okura, Y.; Kitahara, H.; Ochiai, H.; Sammori, T.; Kawanami, A. Landslide fluidization process by flume experiments. Eng. Geol. 2002, 66, 65–78. [Google Scholar] [CrossRef]
- Sasahara, K. Prediction of the shear deformation of a sandy model slope generated by rainfall based on the monitoring of the shear strain and the pore pressure in the slope. Eng. Geol. 2017, 224, 75–86. [Google Scholar] [CrossRef]
- National Emergency Management Agency. Development of Landslide Prediction Technology and Damage Mitigation Countermeasures; National Emergency Management Agency: Soul, Korea, 2008; p. 123.
- Chae, B.G.; Kim, M.I. Suggestion of a method for landslide early warning using the change in the volumetric water content gradient due to rainfall infiltration. Environ. Earth Sci. 2012, 66, 1973–1986. [Google Scholar] [CrossRef]
- Cho, S.E.; Lee, S.R. Surficial stability evaluation of homogeneous slopes considering rainfall characteristics. J. Korean Geotechnol. Soc. 2000, 16, 107–116. [Google Scholar] [CrossRef]
- Kim, S.W.; Jung, S.J.; Choi, E.K.; Kim, S.H.; Lee, K.H.; Park, D.G. An analysis of the current status of disasters occurring on the steep slopes in Korea. J. Environ. Sci. Int. 2013, 22, 1529–1538. [Google Scholar] [CrossRef]
- National Disaster Management Research Institute. Real-Time Stability Evaluation of Steep Slope Considering Geotechnical Characteristics; National Disaster Management Research Institute: Ulsan, Korea, 2013.
Figure 1.
Example showing the calculation of the volumetric water content (VWC) gradient.
Figure 1.
Example showing the calculation of the volumetric water content (VWC) gradient.
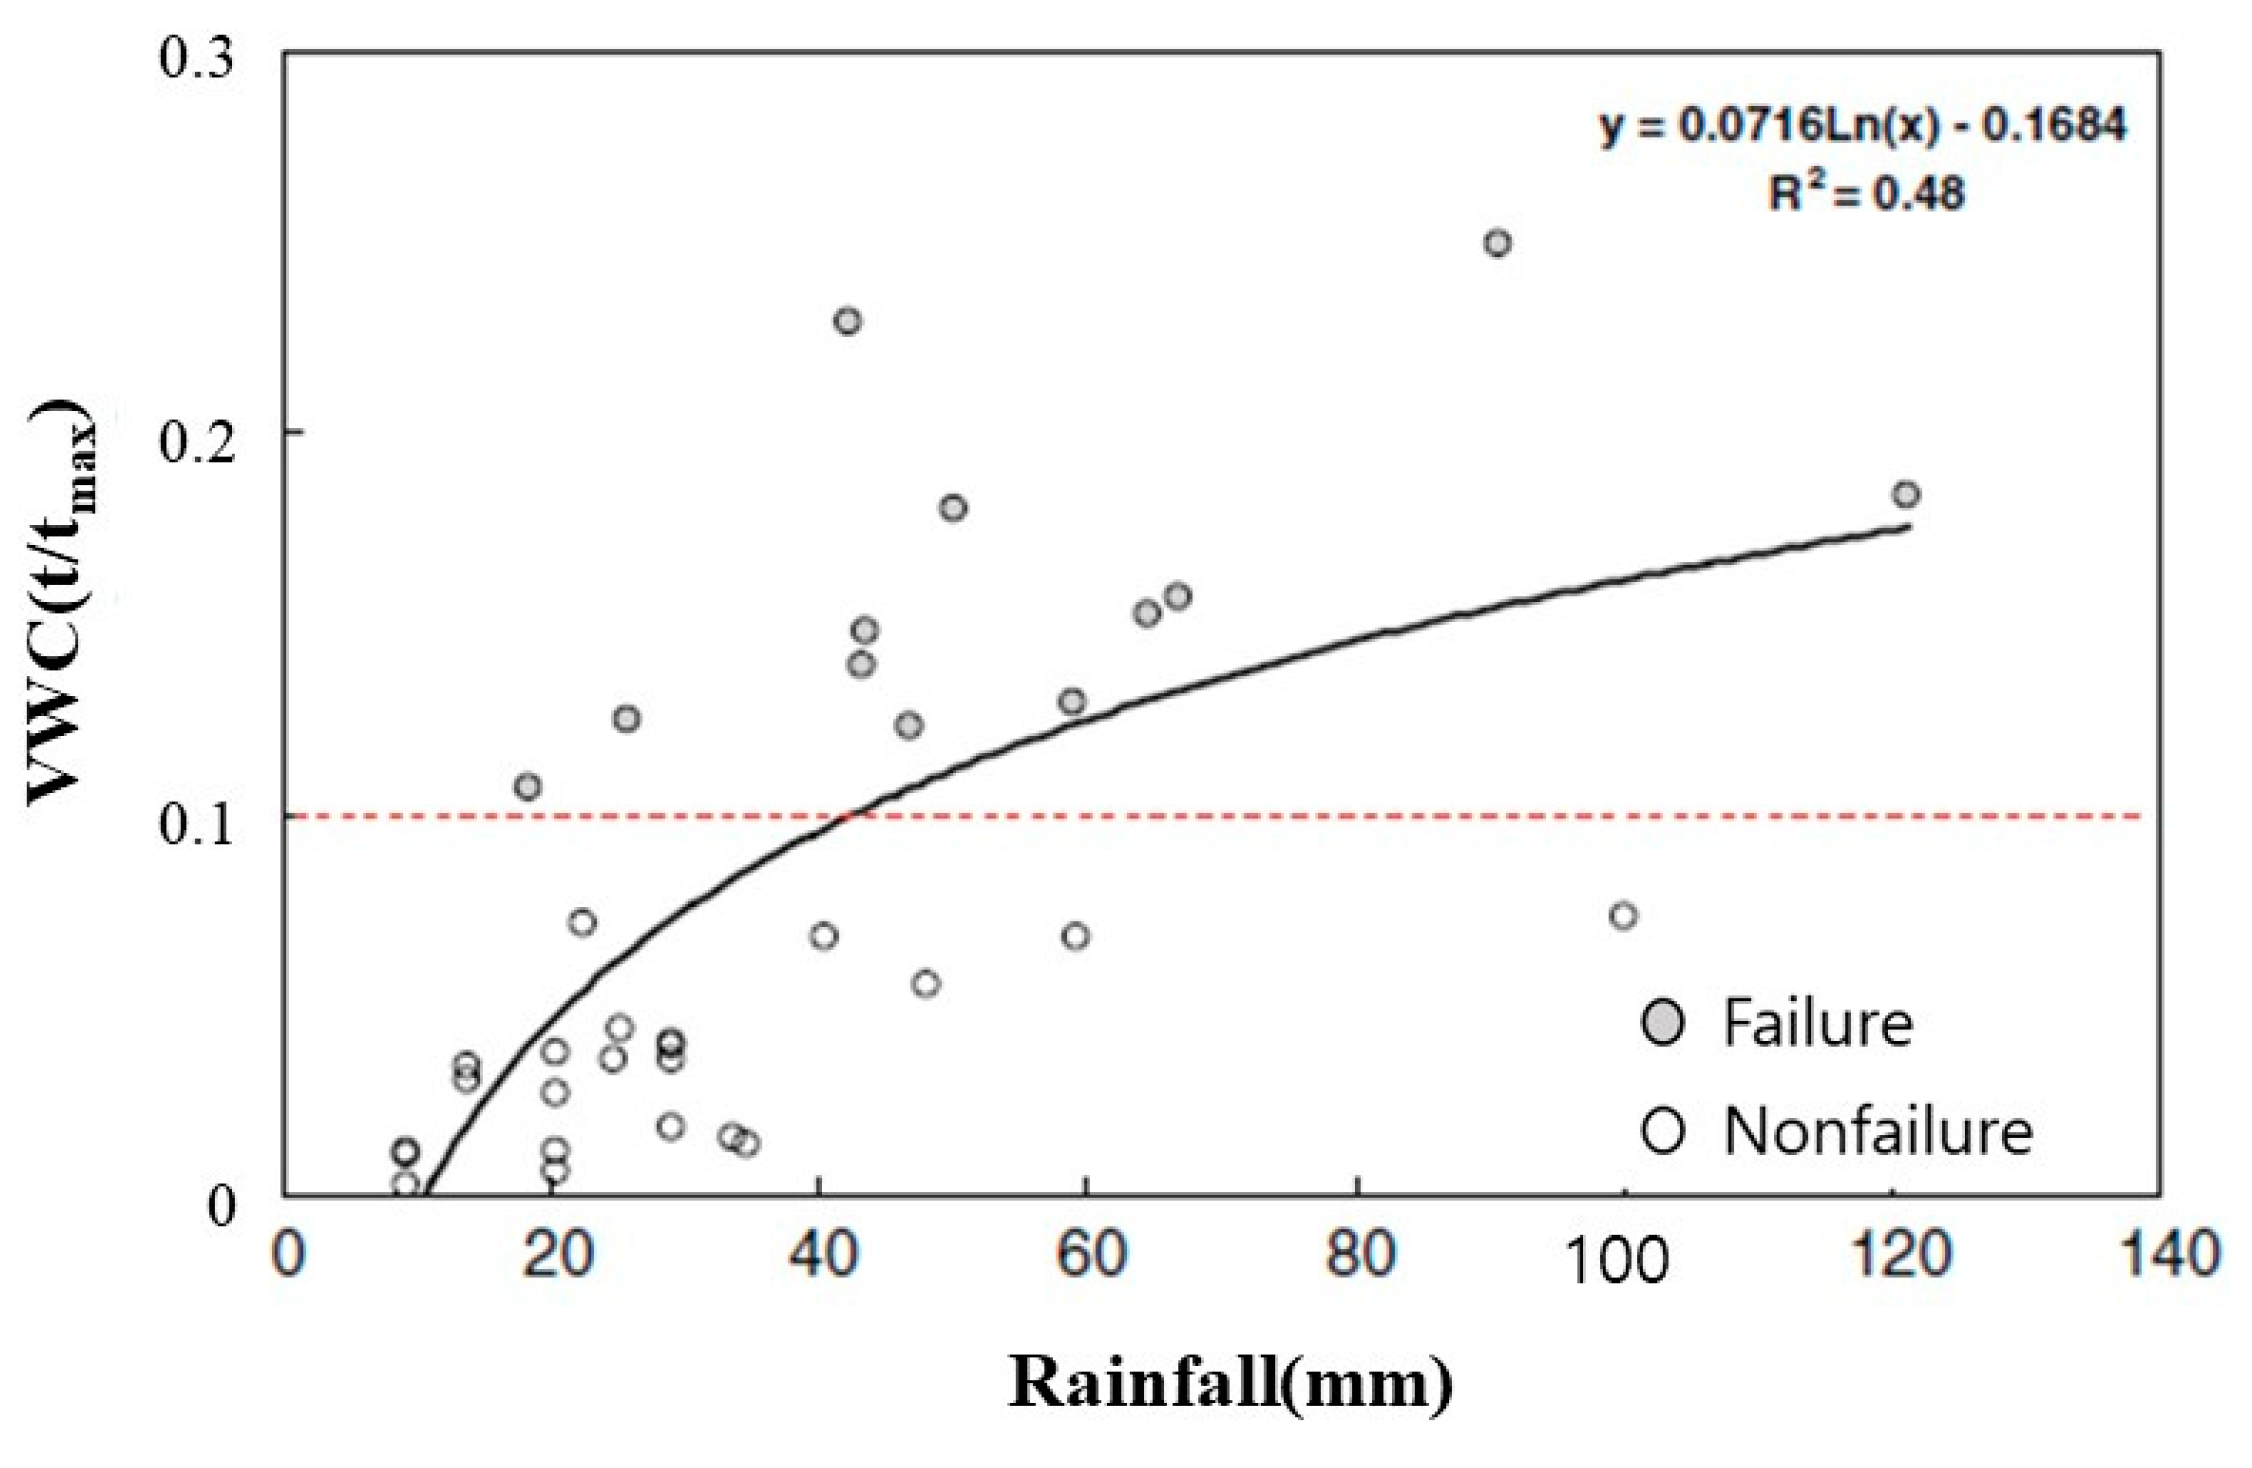
Figure 2.
Relationship between the VWC gradient and rainfall (Reprinted with permission from ref. [
21]).
Figure 2.
Relationship between the VWC gradient and rainfall (Reprinted with permission from ref. [
21]).
Figure 3.
Schematic representation of the flume test equipment used for measurements at a slope angle of 35°.
Figure 3.
Schematic representation of the flume test equipment used for measurements at a slope angle of 35°.
Figure 4.
VWC at different measurement depths: (a) 0.05 m; (b) 0.1 m; (c) 0.15 m; (d) 0.2 m; (e) 0.25 m; (f) 0.3 m.
Figure 4.
VWC at different measurement depths: (a) 0.05 m; (b) 0.1 m; (c) 0.15 m; (d) 0.2 m; (e) 0.25 m; (f) 0.3 m.
Figure 5.
VWC gradient at different measurement locations (depths): (a) crest; (b) slope part; (c) toe part.
Figure 5.
VWC gradient at different measurement locations (depths): (a) crest; (b) slope part; (c) toe part.
Figure 6.
Testbed site: (a) location of testbed sites; (b) cross section of the installed sensor.
Figure 6.
Testbed site: (a) location of testbed sites; (b) cross section of the installed sensor.
Figure 7.
Plots of the VWC gradients of different testbeds: (a) slope angle (Busan); (b) measurement depth (Busan); (c) slope angle (Inje); (d) measurement depth (Inje); (e) slope angle (Yeonki); (f) measurement depth (Yeonki).
Figure 7.
Plots of the VWC gradients of different testbeds: (a) slope angle (Busan); (b) measurement depth (Busan); (c) slope angle (Inje); (d) measurement depth (Inje); (e) slope angle (Yeonki); (f) measurement depth (Yeonki).
Figure 8.
Relationship between volumetric water content gradient (VWC) and effective cumulative rainfall (ECR) based on the data from testbed and flume tests.
Figure 8.
Relationship between volumetric water content gradient (VWC) and effective cumulative rainfall (ECR) based on the data from testbed and flume tests.
Figure 9.
Comparison of frequency between nonfailure cases and failure cases.
Figure 9.
Comparison of frequency between nonfailure cases and failure cases.
Figure 10.
Rate of landslide occurrence according to the VWC gradient.
Figure 10.
Rate of landslide occurrence according to the VWC gradient.
Figure 11.
Shallow failure site and failure section: (a) field; (b) description.
Figure 11.
Shallow failure site and failure section: (a) field; (b) description.
Figure 12.
Schematic representation of full-scale flume experiment set up with soil profiles.
Figure 12.
Schematic representation of full-scale flume experiment set up with soil profiles.
Figure 13.
Full-scale flume experimental results (first experiment): (a) small-scale failure; (b) second failure (shallow failure).
Figure 13.
Full-scale flume experimental results (first experiment): (a) small-scale failure; (b) second failure (shallow failure).
Figure 14.
Variations of the VWC before small-scale failure in the flume experiments: (a) berm; (b) crest; and (c) inclined slope parts.
Figure 14.
Variations of the VWC before small-scale failure in the flume experiments: (a) berm; (b) crest; and (c) inclined slope parts.
Figure 15.
Variation of the VWC gradient as a function of time (first experiment).
Figure 15.
Variation of the VWC gradient as a function of time (first experiment).
Figure 16.
Variation of the VWC gradient as a function of time (second experiment).
Figure 16.
Variation of the VWC gradient as a function of time (second experiment).
Table 1.
Physical properties of the soil used in flume tests.
Table 1.
Physical properties of the soil used in flume tests.
| Property | Value |
|---|
| Specific gravity (g cm−3) | 2.60 |
| Moisture content (%) | 18.95 |
| Bulk density (Mg m−3) | 1.67 |
| Effective grain size (D10) | 0.16 |
| Soil conductivity (cm s−1) | 2.5 × 10⁻³ |
| Liquid limit (%) | 22.56 |
| Plastic limit (%) | 18.92 |
| Uniformity coefficient (Cu) | 9.38 |
| Curvature coefficient (Cg) | 0.84 |
| Cohesion(kPa) | 11.84 |
Table 2.
Measurement depths at different slope angles.
Table 2.
Measurement depths at different slope angles.
| Slope Angle (°) | Measurement Depth (cm) |
|---|
| Crest Part | Slope Part | Toe Part |
|---|
| 35 | 10, 20, 30 | 10, 20, 30 | 10, 20, 25 |
| 40 | 10, 20, 30 | 10, 20, 30 | 10, 20, 25 |
| 50 | 5, 15, 25 | 5, 15, 25 | 5, 10, 15 |
Table 3.
Rainfall in Testbed Area.
Table 3.
Rainfall in Testbed Area.
| Label | Busan | Yeonki | Inje |
|---|
| Total rainfall(mm year−1) | 256 | 905 | 541 |
| Maximum rainfall (mm h−1) | 56 | 70 | 29 |
| Maximum rainfall (mm day−1) | 90 | 155 | 70 |
Table 4.
The early warning criteria using the VWC gradient.
Table 4.
The early warning criteria using the VWC gradient.
| Volumetric Water Content Gradient | Level of Alarm | Description |
|---|
| <0.075 | Prealert | Very low failure rate (<3%) |
| 0.075–0.1 | Alert | Low Failure rate (<20%) |
| 0.1–0.2 | Prewarning | High Failure rate (<66%) |
| >0.2 | Warning | Very high failure rate (>80%) |
Table 5.
Soil condition and positions of sensors for full-scale flume experiments.
Table 5.
Soil condition and positions of sensors for full-scale flume experiments.
| Specification | First Experiment | Second Experiment |
|---|
| Slope | Wet density (Mg m−3) | 1.603 | 1.543 |
| Water content (%) | 19.6 | 18.8 |
| Slope angle (°) | 35 | 35 |
| Depth of soil (m) | 1.8 | 1.8 |
| Depth of impermeable layer (m) | 0.5 | 0.5 |
| Sensors | Number | 20 | 22 |
| Depth of measurement (m) | Berm part: 0.35, 0.75
crest part, inclined part, toe part: 0.5, 1.0, 1.5 | Berm part: 0.35, 0.75
crest part, inclined part, toe part: 0.5, 1.0, 1.8 |
| Rainfall intensity (mm/h) | 50 | 50 |
| Publisher’s Note: MDPI stays neutral with regard to jurisdictional claims in published maps and institutional affiliations. |
© 2022 by the authors. Licensee MDPI, Basel, Switzerland. This article is an open access article distributed under the terms and conditions of the Creative Commons Attribution (CC BY) license (https://creativecommons.org/licenses/by/4.0/).


