Article

Allowable Pitch Angle of Aerodynamic Imbalance Due to Individual Pitch Movement for Ultimate Loads on Offshore Wind Turbine Using Artificial Neural Network

1
Department of Global Industry, Jeonju Kijeon College, Jeonju 54989, Korea
2
Department of Mechanical Engineering, Kunsan National University, Gunsan 54150, Korea
3
Institute of Offshore Wind Energy, Kunsan National University, Gunsan 54150, Korea
*
Author to whom correspondence should be addressed.
Appl. Sci. 2022, 12(10), 5177; https://doi.org/10.3390/app12105177
Submission received: 11 March 2022 / Revised: 29 April 2022 / Accepted: 18 May 2022 / Published: 20 May 2022
(This article belongs to the Special Issue Recent Advanced Technologies on Renewable Energy (AFORE 2021))

Abstract

:
This study aims to calculate the ultimate loads through integrated load analysis under aerodynamic imbalance by individual pitch movement of offshore wind turbines, and based on this, to identify the allowable region of the individual pitch angle of the blade. For this, 5 MW offshore wind turbines were modeled using GH-BladedTM based on jacket type substructure data of the NREL-5 MW generic model and Upwind reports. For integrated load analysis, wind speeds were selected: 11 m/s, 14 m/s, 17 m/s, 20 m/s, 22 m/s, and 24 m/s. Ultimate load analysis was performed through the fixed pitch control mode with the individual pitch angles at an interval of 2°, ranging from 0° to 30°. Analysis was performed for the collective pitch control under the same environmental conditions as IPC. Through the comparison of loads at hub for CPC and the individual pitch movement states calculated through integrated load analysis, we identified the allowable pitch angle region where the ultimate loads of the individual pitch movement conditions were less than those of the CPC conditions. Furthermore, pattern analysis was performed using the artificial neural network for numerical modeling of the allowable pitch angle region. The results confirmed a high success rate of over 99%. Based on these results, this study suggested a new model according to the wind speed for the allowable pitch angle region.

1. Introduction

It has been a recent trend that the wind industry shifts to large offshore wind turbines, with the advantages of large-scale MW, high wind speeds, and installation area for sustainable energy production [1,2,3]. As wind turbines become larger, aerodynamic loads on the rotors account for a large share of the loads that offshore wind turbine structures must withstand. In addition, rotor imbalance loads are generated in wind turbines due to the wind shear, tower shadow effect, yaw error, pitch error, and mass imbalance [4]. These loads could degrade the performance of wind turbines and shorten their lifespan. Therefore, to address these problems, numerous research has been performed from the conventional collective pitch control (CPC) to the individual pitch control (IPC) [5,6,7]. Engelen, T. [5] derived a simple model for the combined design of collective and individual pitch control for a typical 3 MW, 3-bladed variable speed wind turbine. The performance was evaluated in aero-elastic simulations. According to Bossanyi [6], a very significant reduction in operational loading can be achieved by means of individual pitch action, provided a proper measurement of asymmetric loading is available. In order to design the necessary control algorithms utilizing sensors based on linear-quadratic-gaussian (LQG) control design technique, it is mentioned that a linear model of turbine is required. According to Larsen et al. [7], a new load-reducing control strategy for individual blade control of large pitch-controlled wind turbines was explained based on local blade inflow measurements and the possibility of larger load reductions without loss of power production. They also discussed advantages and drawbacks of the system.
Sarkar et al. [8] considered the effects of reduction in structural loads. A low-authority linear-quadratic (LQ) controller was proposed, and this proposed controller was compared with the baseline controller (BC) utilized by the state-of-the-art wind turbine simulator FAST using a high-fidelity offshore wind turbine model. In Aghaeinezhad et al. [9], a controller that utilized a simplified two-mass model and an adaptive fractional-order non-singular fast terminal sliding mode controller (AFO-NFTSMC), based on individual pitch control strategy considering uncertainties and external disturbances, was proposed. The proposed controller was implemented in the FAST environment considering the wind profiles utilizing TurbSim, and was explored in the presence of parametric uncertainties. Lara et al. [10] proposed a control structure composed of the PI controller, adaptive feedforward compensator for the wind speed, and adaptive gain compensator for tower damping. This control structure was based on a Pareto optimization, multi-objective genetic algorithms and multi-criteria decision-making (MCDM) methods, and its performance was evaluated and compared with a classic baseline PI controller.
Hanifi et al. [11] reviewed the state-of-the-art approaches of wind power forecasting utilizing physical, statistical (time series and artificial neural networks), and hybrid methods. A guideline was provided for wind power forecasting, allowing the wind turbine/farm operators to identify the most appropriate predictive methods.
Robertson et al [12] assessed input parameters such as wind-inflow conditions, turbine structural, and aerodynamic properties, and an elementary effects sensitivity analysis was performed using the National Renewable Energy Laboratory 5 MW base-line wind turbine under normal turbine operation conditions. They explained that inboard lift distribution, blade-twist distribution, and blade mass imbalance are the most important secondary parameters.
Since aerodynamic imbalance loads due to individual pitch movement of the blade could adversely affect the entire offshore wind turbine, research on this subject is becoming more and more important [13]. Therefore, there are needs for continuous and systematic research on characteristics of ultimate loads and allowable pitch angle regions due to individual pitch movement when aerodynamic imbalance loads occur.
In this study, a NREL- 5 MW offshore wind turbine was modeled using GH-BladedTM with a jacket-type substructure for the integrated load analysis under the aerodynamic imbalance of individual pitch movement. Here, the study scope was focused on 11 m/s, 14 m/s, 17 m/s, 20 m/s, 22 m/s, and 24 m/s of wind speed for pitch control. For aerodynamic imbalance load analysis, ultimate load analysis was performed by changing the individual pitch angle of the blade at 2° intervals from 0° to 30° under the steady state wind speed. Then, the maximum force and moment of the stationary hub were converted into resultant loads for quantitative load analysis. Allowable Pitch Angle (APA) region for each wind speed was confirmed by comparing ultimate loads and aerodynamic imbalance loads analyzed in the CPC state. Additionally, the APA region was modeled using the artificial neural network (ANN) to identify the possible integration with the IPC strategy.

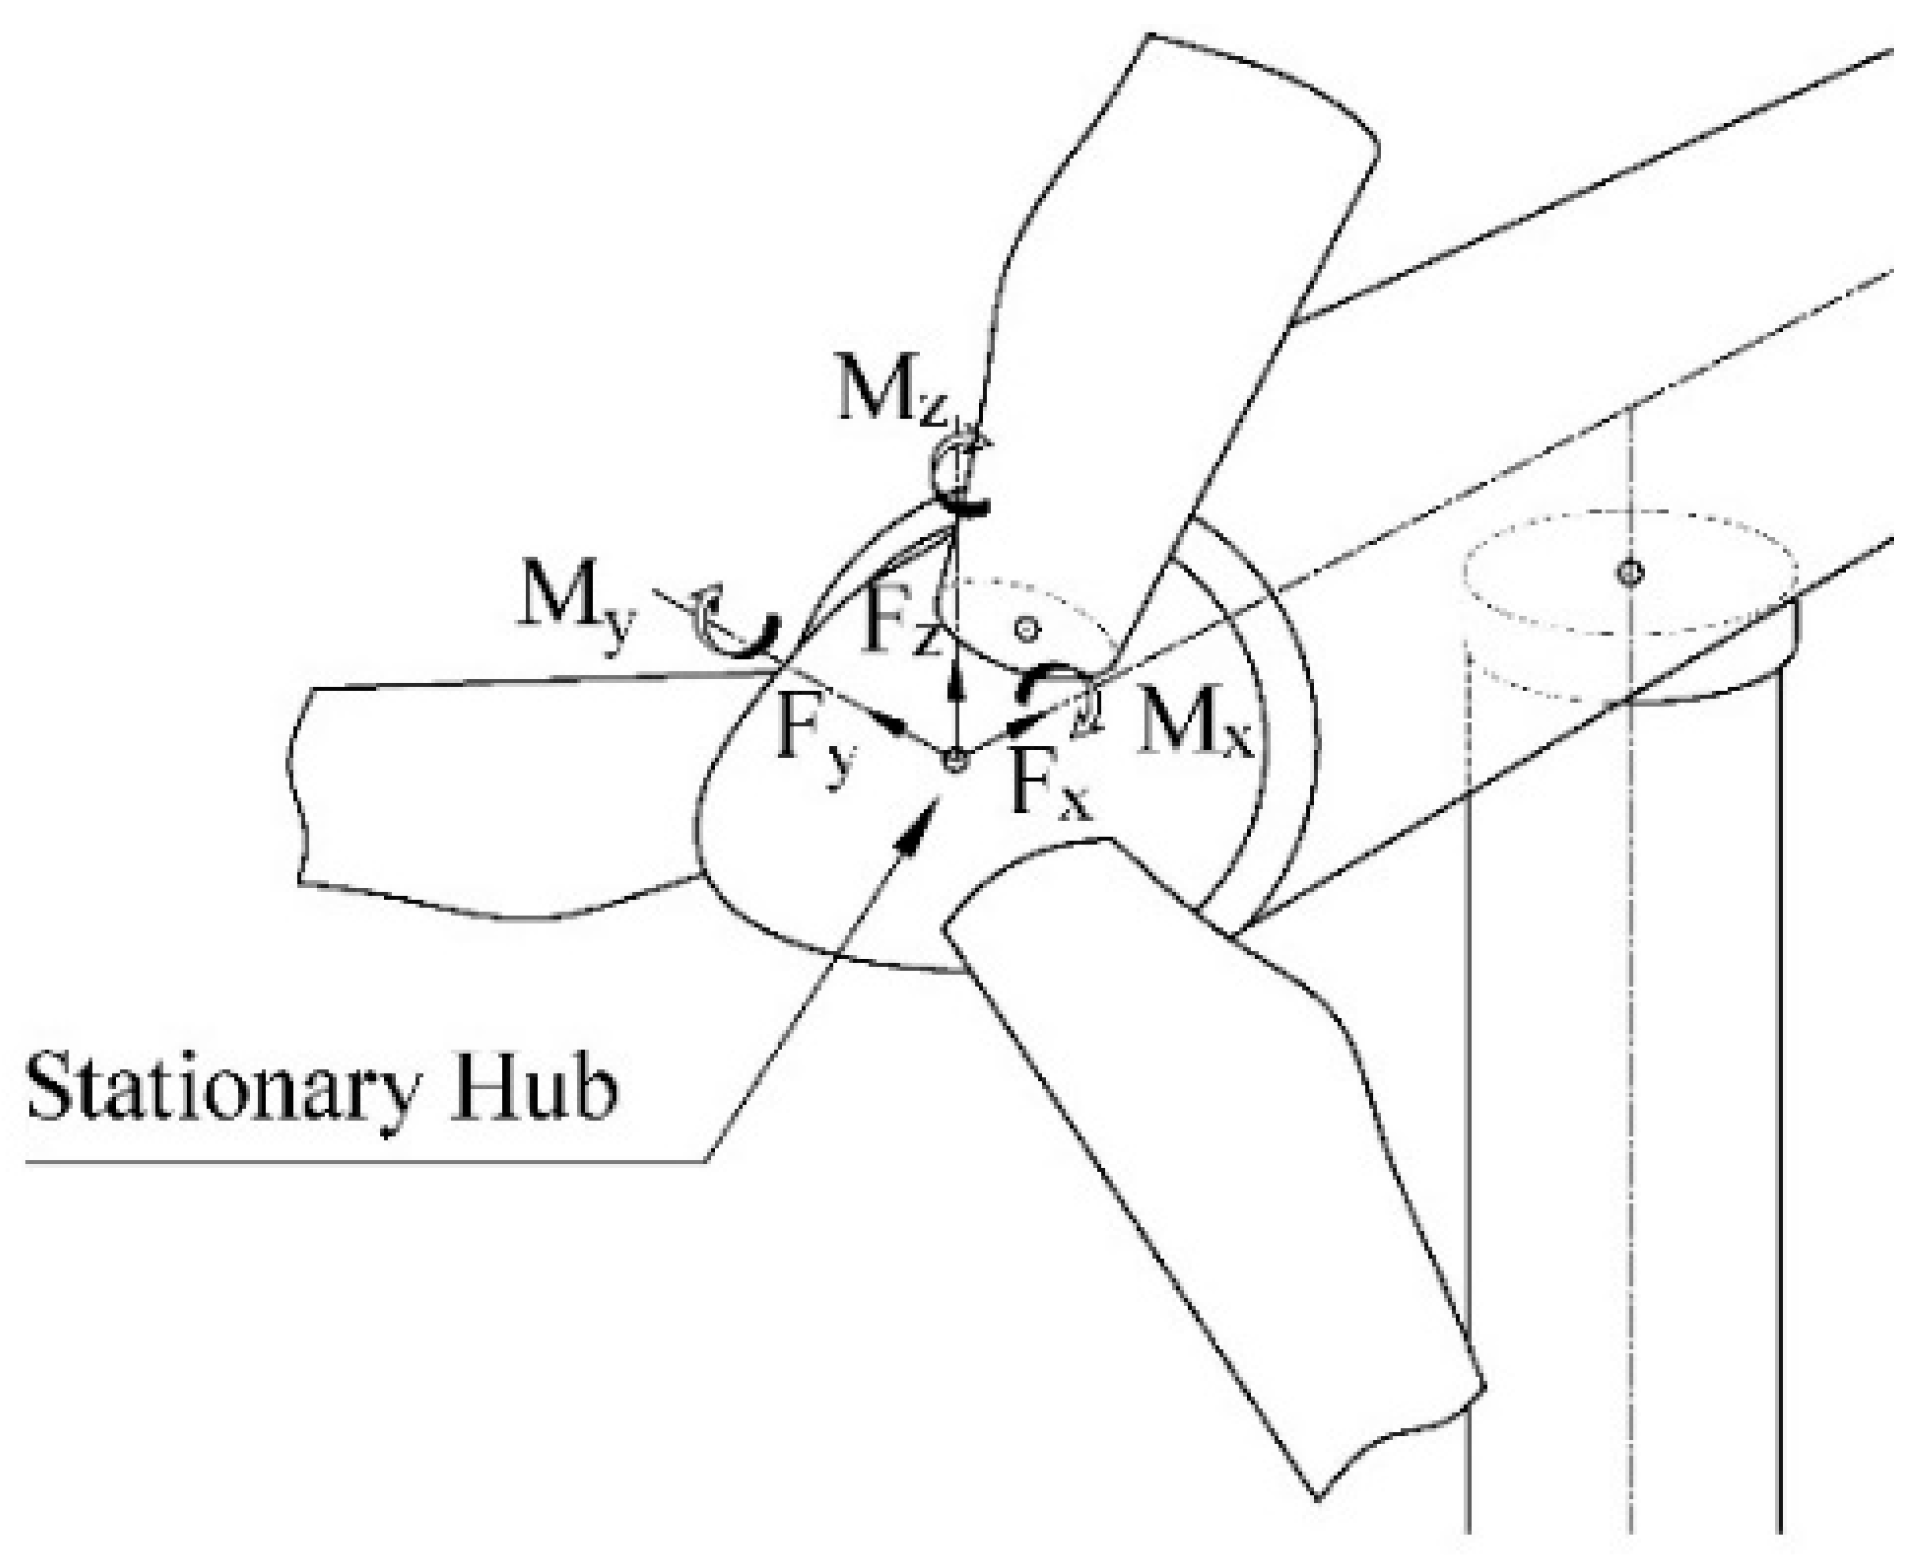
2. Integrated Loads Analysis

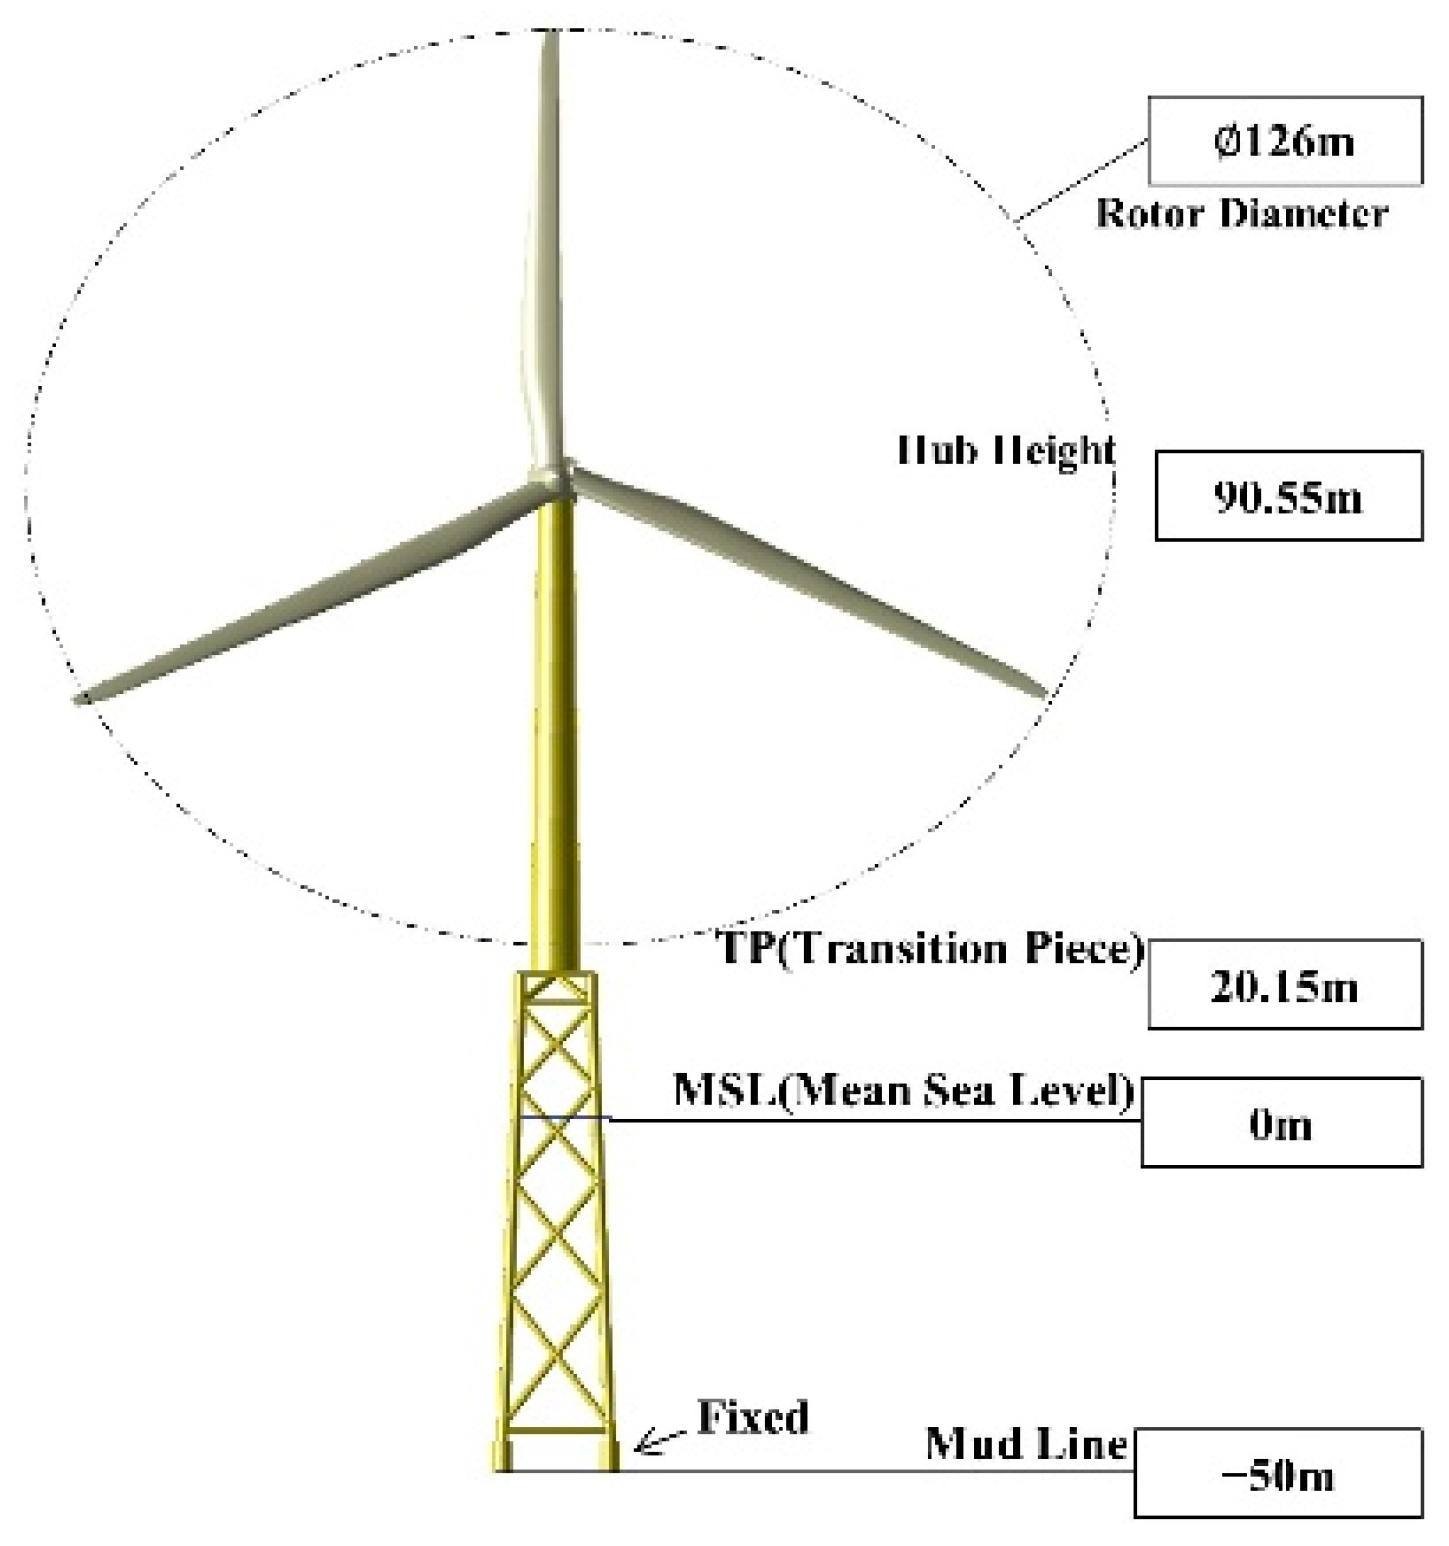
2.1. Offshore Wind Turbine Model

The superstructure model of the offshore wind turbine used in this study was 5 MW, which was conceptually designed in the NREL report [14]. As shown in Figure 1, the wind turbine has the basic structure of a 3-blade horizontal axis wind turbine with a rotor diameter of 126 m. The substructure of the wind turbine was modeled with the structure of a depth of 50 m and 20.15 m above the water surface by adopting the jacket type of the UpWind report. The height of the hub is 90.55 m above the water surface and has a structure with a transition piece (TP) section where the tower and substructure of the hollow cylindrical steel are connected. The specifications of the offshore wind turbine model are shown in Table 1 [15,16].

2.2. Ultimate Load Analysis Condition

The ultimate loads of the offshore wind turbine were analyzed under steady state wind condition at each wind speed. This is because marine environmental loads such as turbulence, irregular waves, and currents generate complex vibrations depending on the substructure, and eventually affect the ultimate load of the superstructure [17]. In addition, steady state wind conditions can reduce analytical errors with regards to the complexity of dynamic response loads of the offshore wind turbine. Table 2 shows the environmental conditions used in this study. For steady state wind conditions, wind speeds of 11 m/s, 14 m/s, 17 m/s, 20 m/s 22 m/s, and 24 m/s without turbulence were selected; they are above the rated wind speed. The wind shear exponent employed was 0.1, the tower shadow effect coefficient was 1 and yaw error was 8°, respectively. Using these data, the integrated load analysis for ultimate loads was performed under the individual pitch movement and CPC condition, respectively.

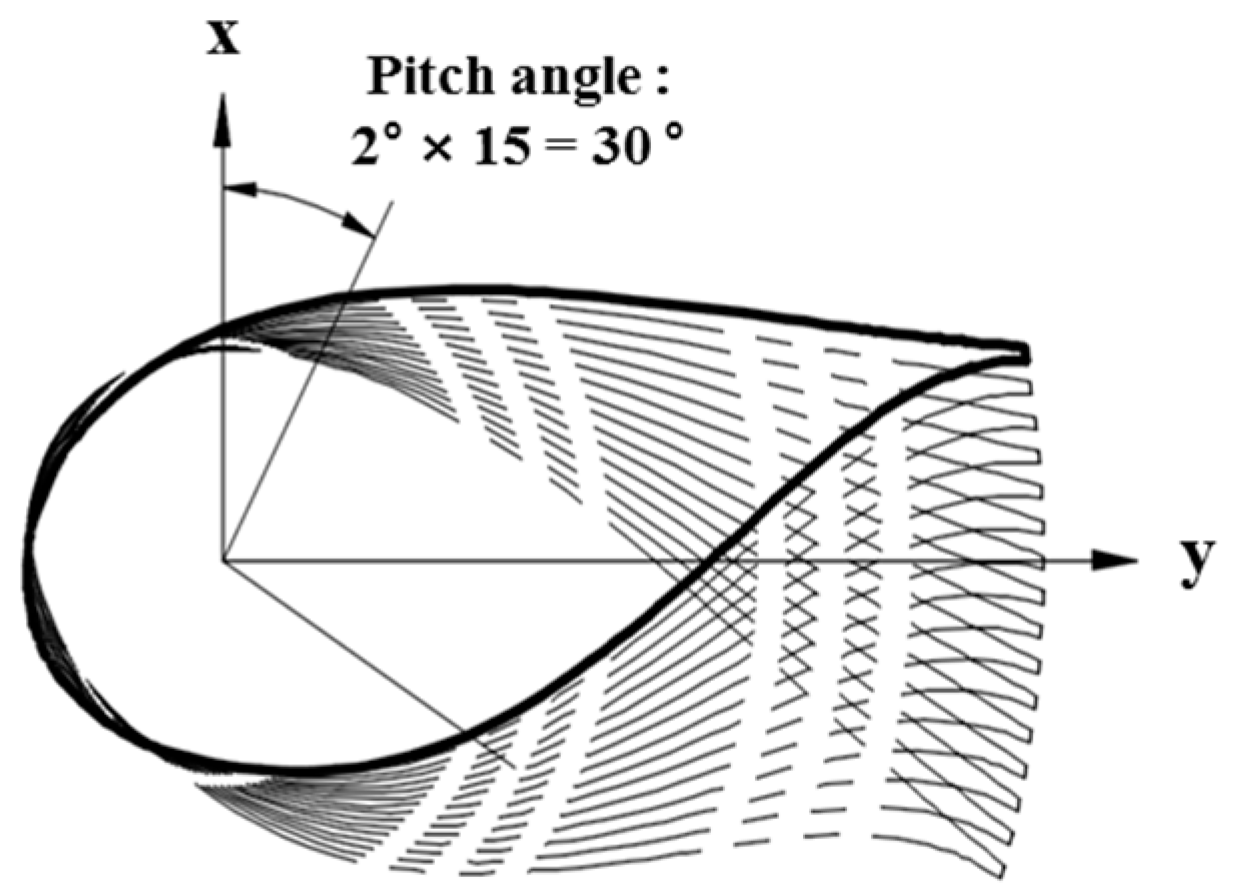
2.3. Aerodynamic Imbalance Condition

In this study, ultimate load analysis was performed on individual pitch movement under aerodynamic imbalance conditions using the commercial code GH-BladedTM V4.1 [18]. Table 3 shows the detailed analysis conditions. The maximum pitch error angle considers the maximum pitch angle of the wind turbine at turbulent wind speed, as shown in Figure 2. Here, the maximum pitch angle was identified to be about 28°. Figure 3 shows the pitch angle change as an example. Therefore, as defined in Figure 3 and Table 3, each of the three blades had 16 analysis cases at 2° intervals from 0° to 30°, respectively. Considering these aerodynamic imbalances and the six wind speed conditions described above, aerodynamic imbalance load analysis was performed on 24,576 (163 × 6) cases. Additionally, ultimate load analysis was carried out on each individual pitch angle, where pitch control was set up for the fixed pitch control mode for each blade.

3. Results and Discussion

3.1. Ultimate Load Analysis for CPC

In order to evaluate the ultimate loads of the offshore wind turbine with aerodynamic imbalance, ultimate load analysis was performed by the CPC state using the GH-BladedTM V4.1. The reference wind speeds were 11 m/s, 14 m/s, 17 m/s, 20 m/s, 22 m/s, and 24 m/s in the CPC state. The ultimate loads (i.e., maximum force (Fxc, Fyc, Fzc), and maximum moment (Mxc, Myc, Mzc)) were obtained through the ultimate load analysis, with reference to each wind speed. Using these results, resultant force and moment was calculated by Equations (1) and (2), respectively. Figure 4 represents the coordinate system of the hub. Table 4 shows the ultimate resultant loads and pitch angles of the CPC for each reference wind speed. The CPC is the principle of reducing the load by increasing the pitch angle of the three blades equally as the wind speed increases. Here, the CPC control used the basic algorithm built into the GH-BladedTM V4.1.
F R c = F x c 2 + F y c 2 + F z c 2
M R c = M x c 2 + M y c 2 + M z c 2

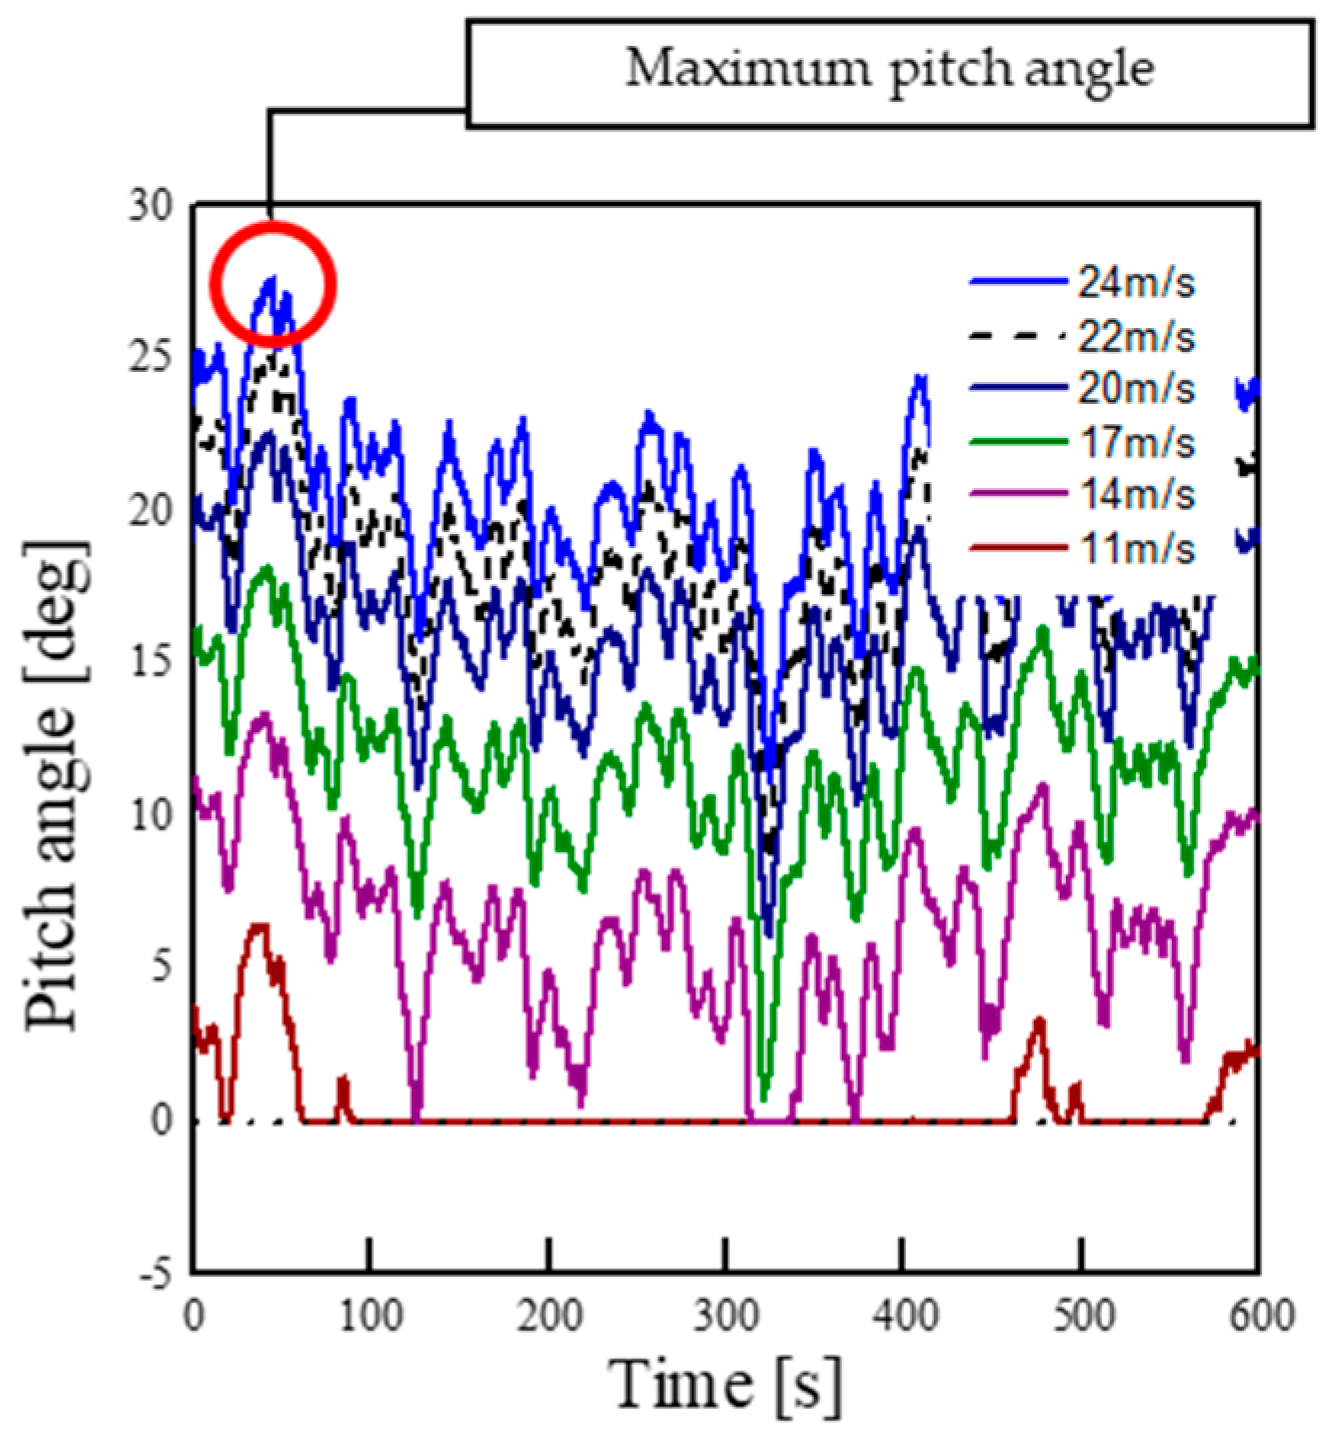
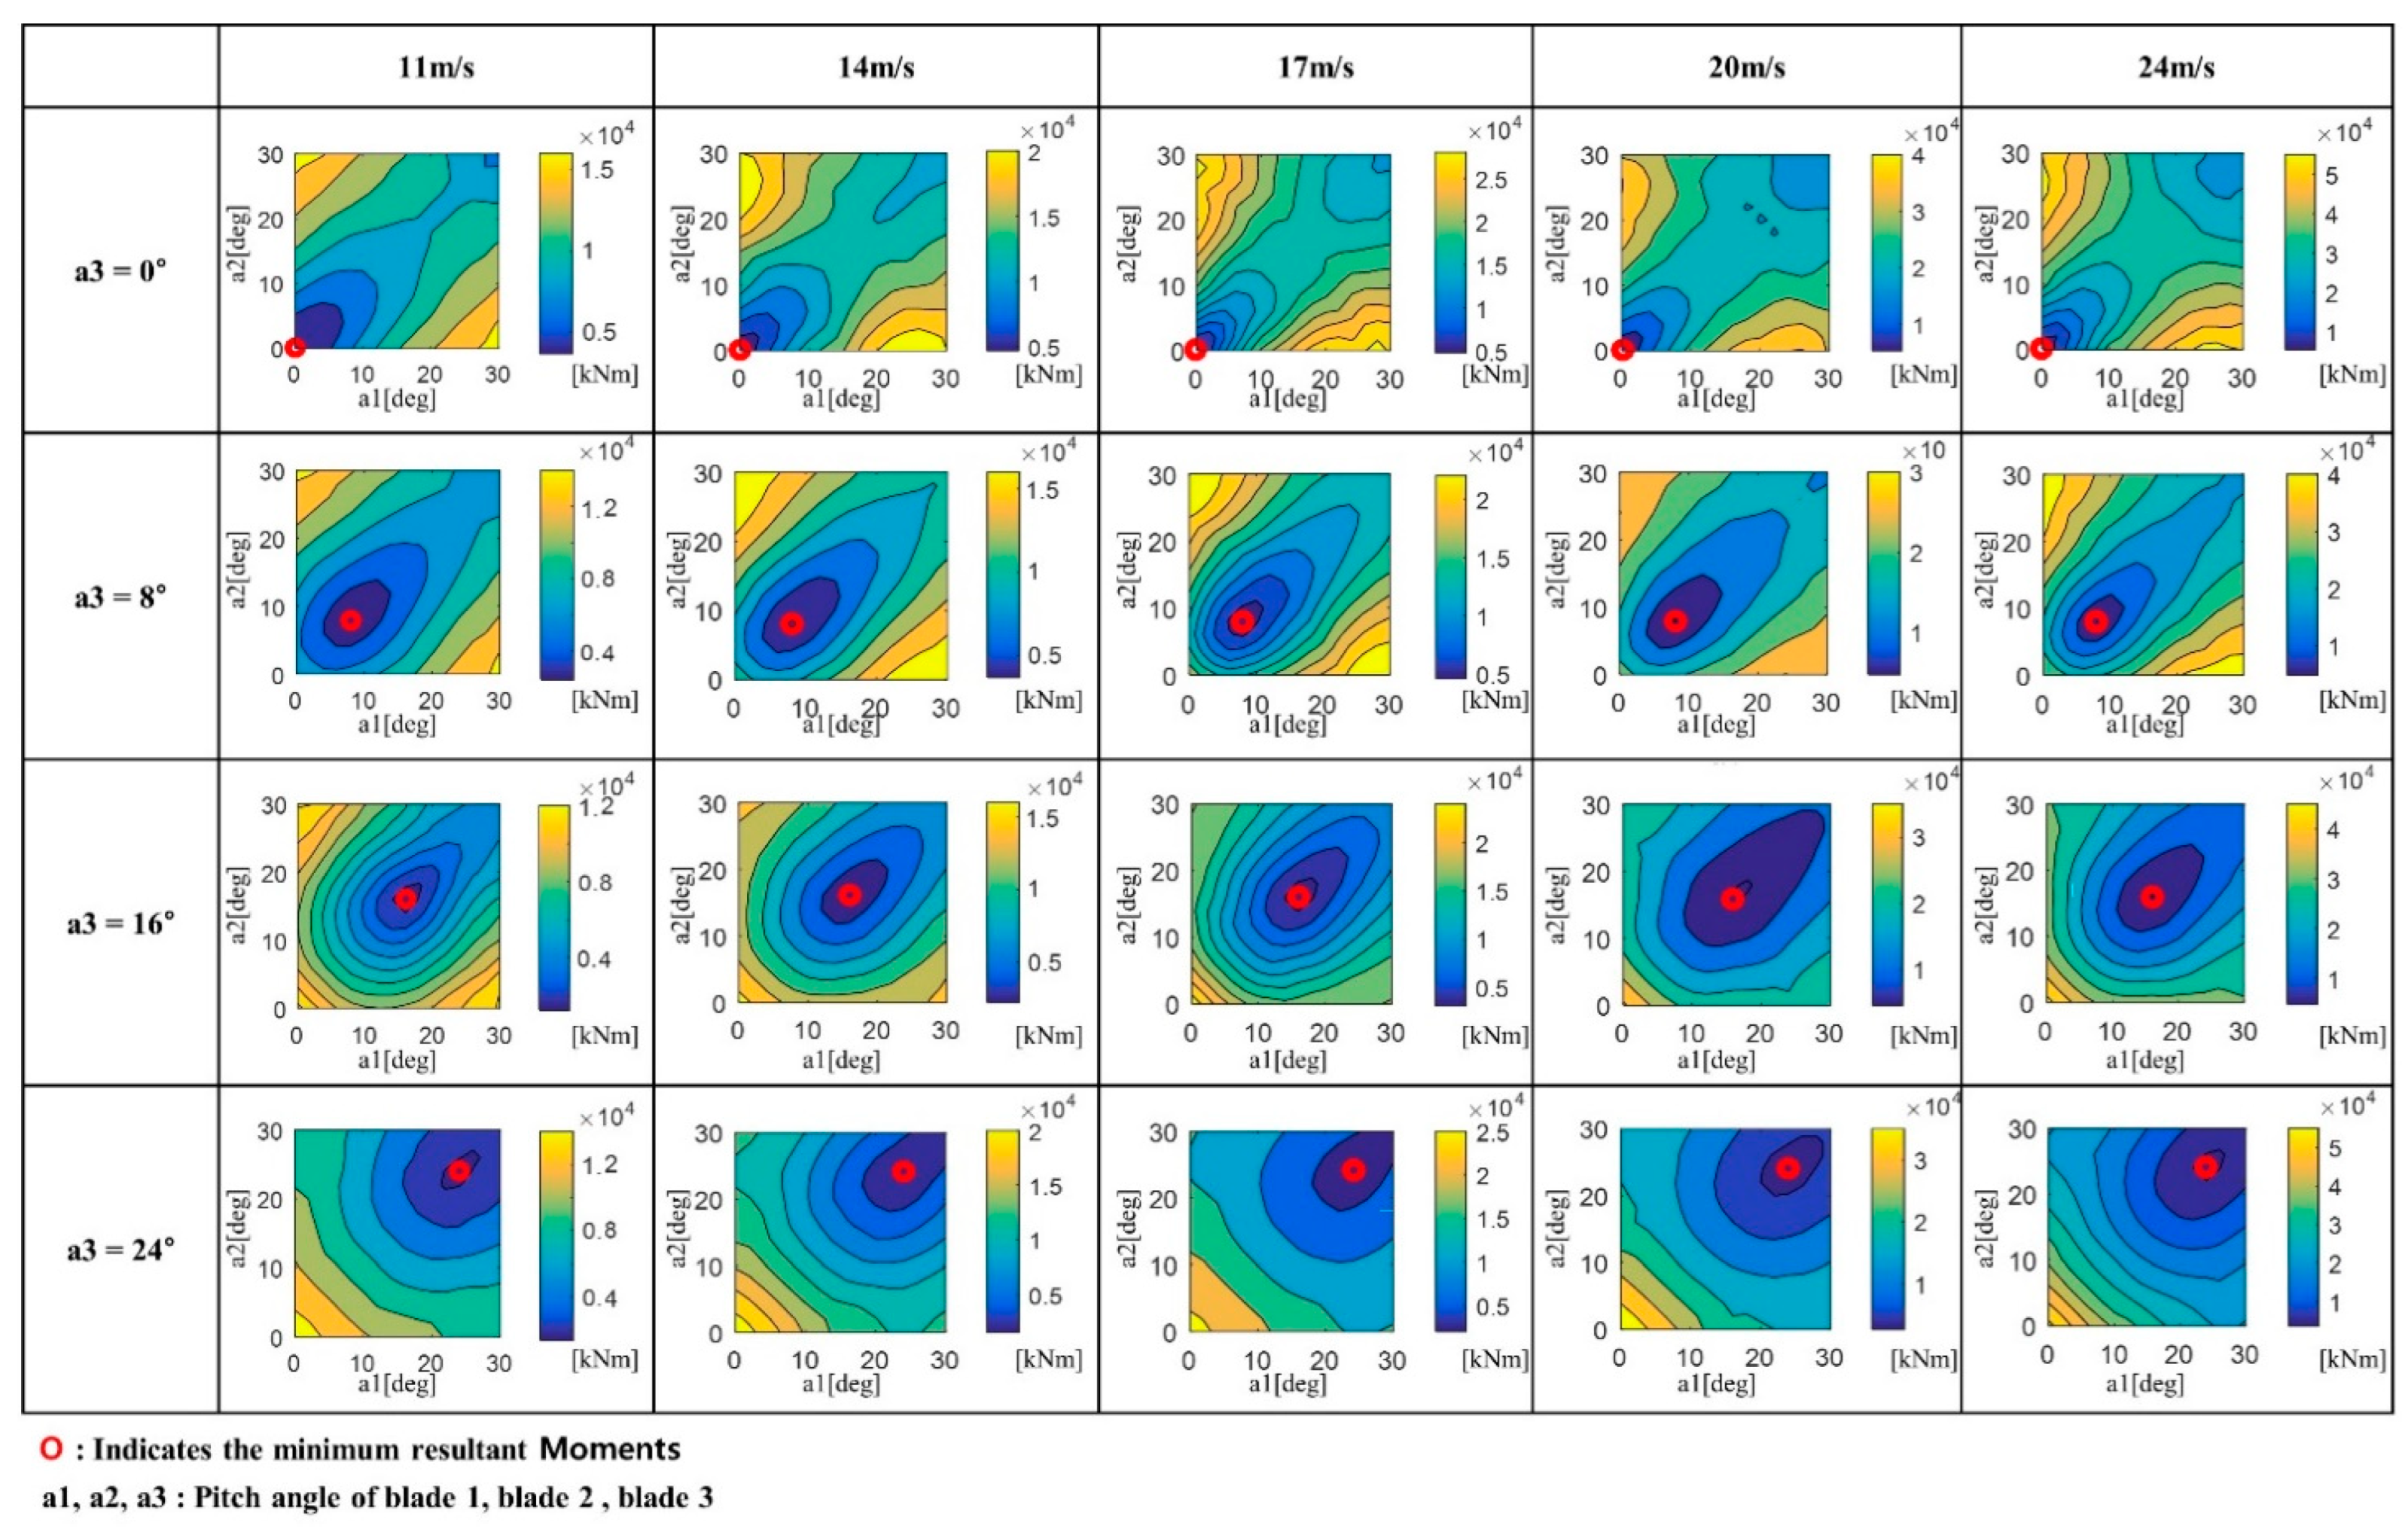
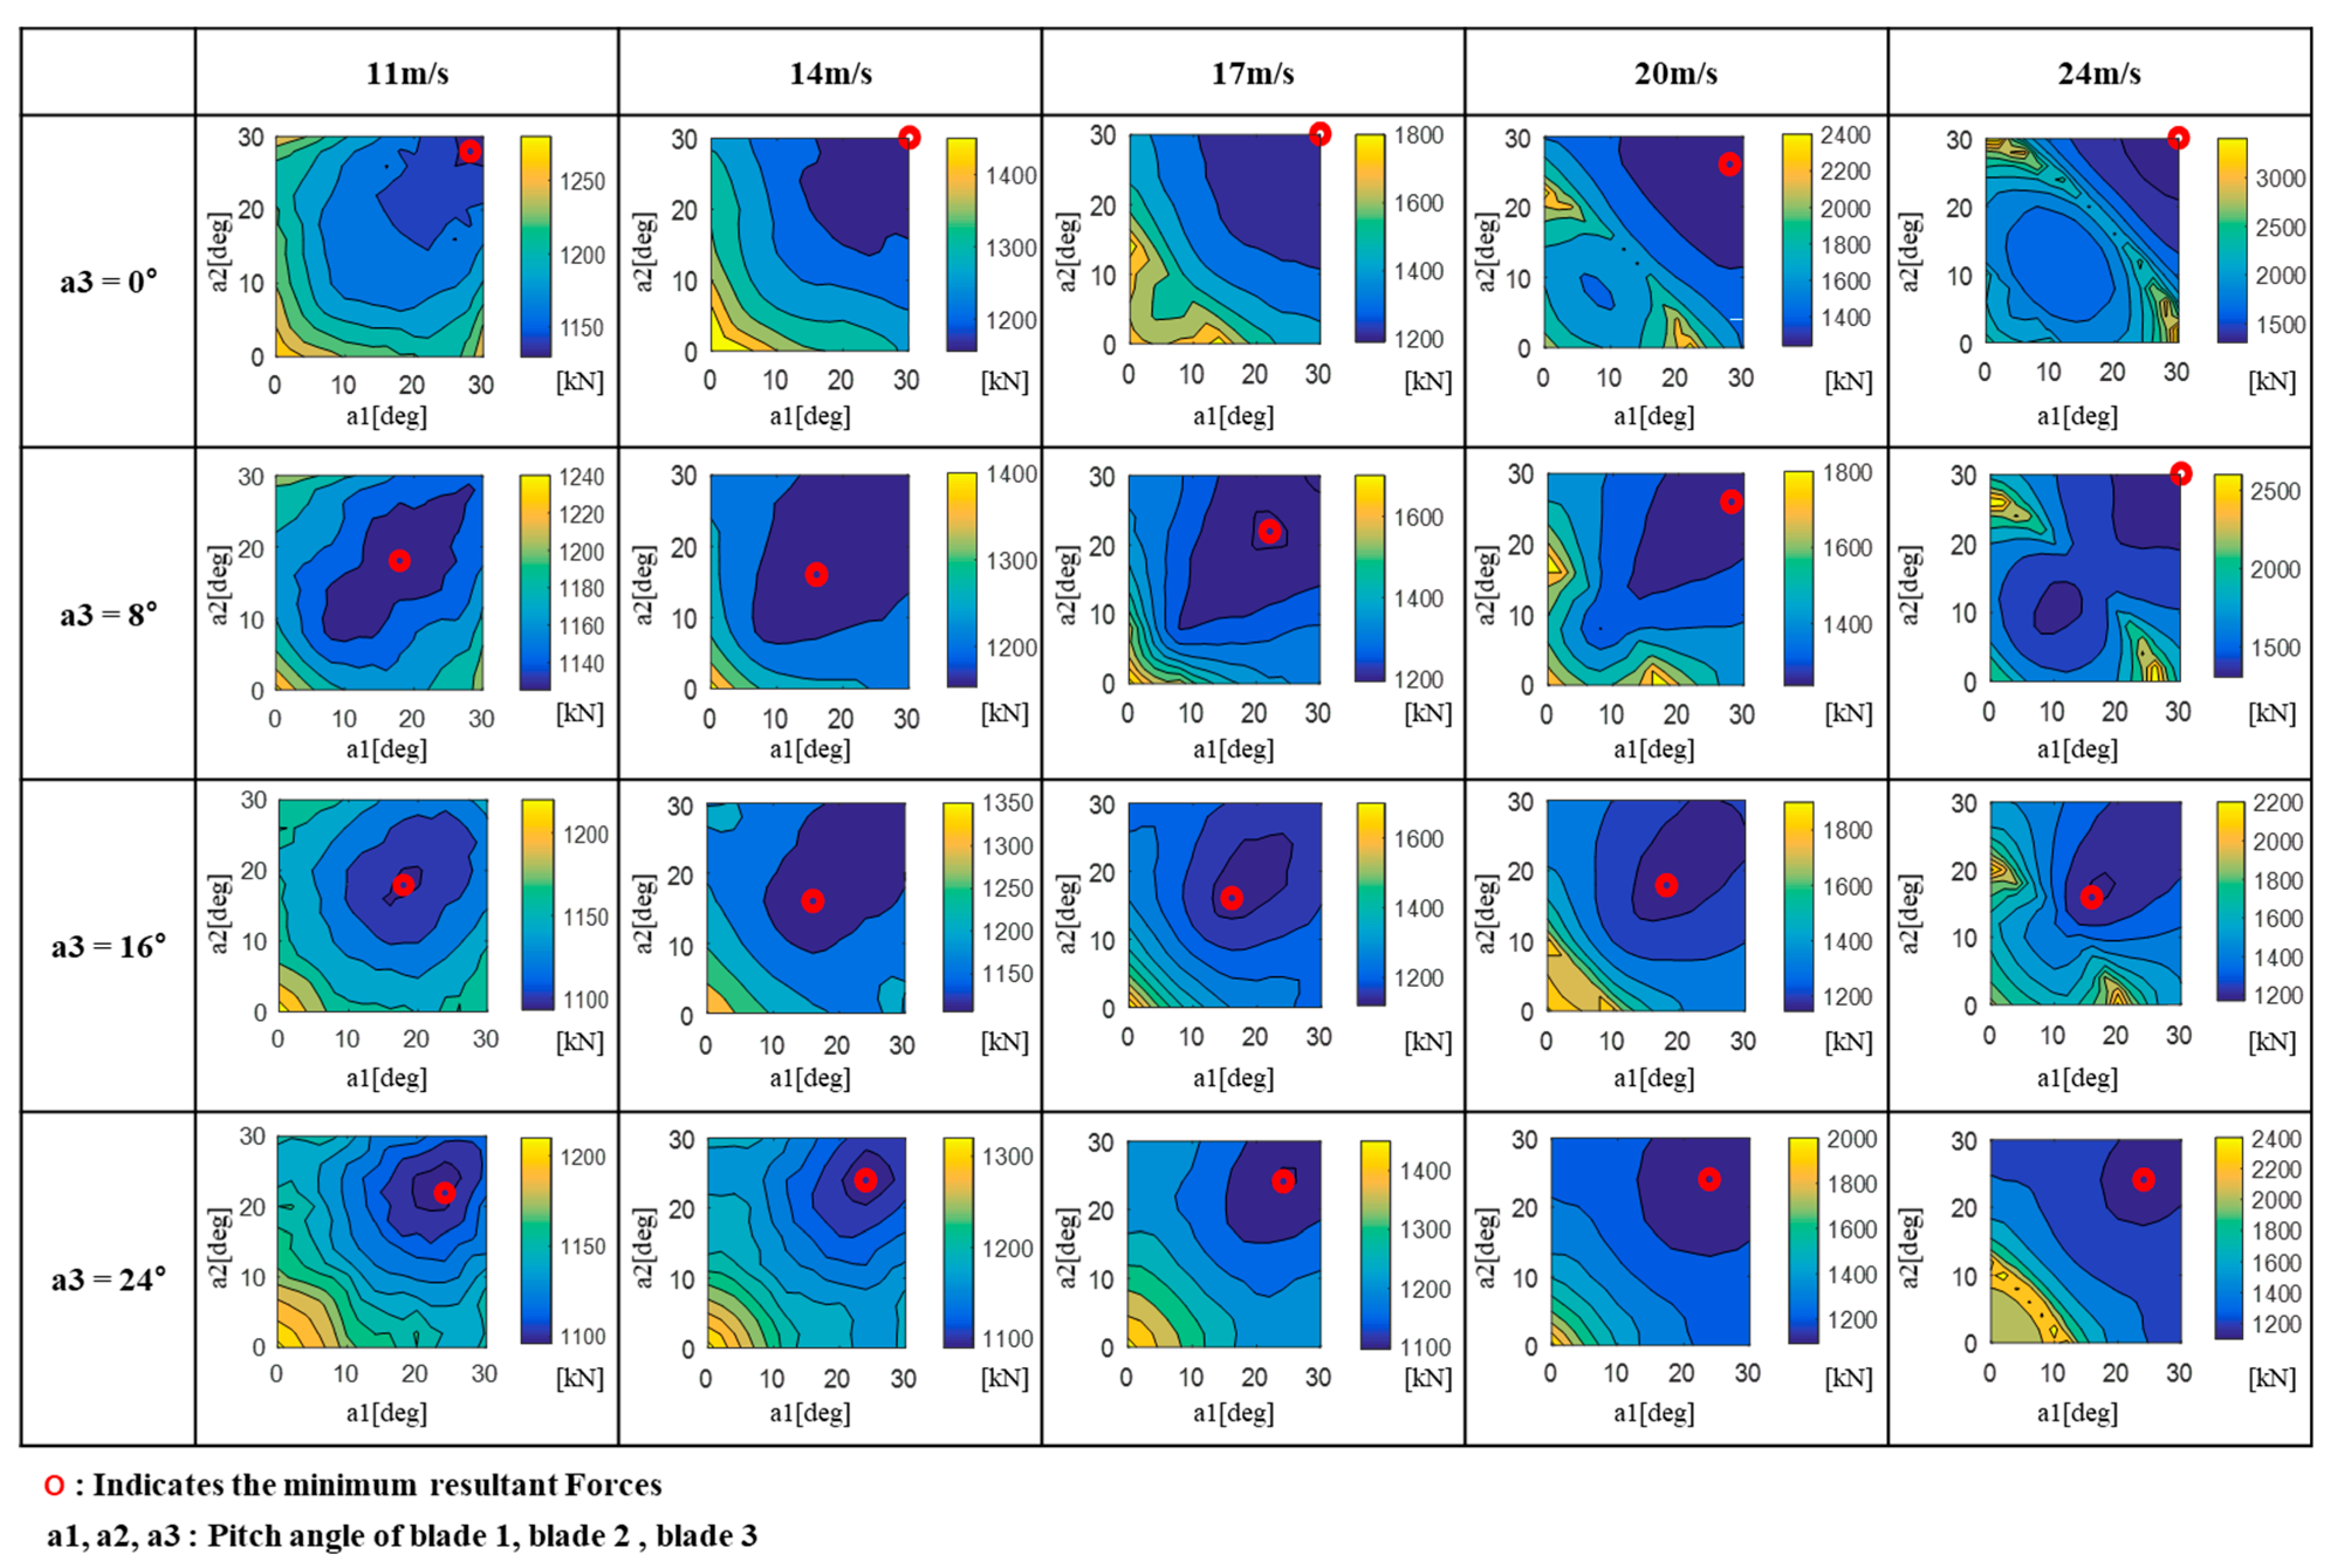
3.2. Ultimate Load Analysis under Aerodynamic Imbalance

Ultimate load analysis was performed under aerodynamic imbalance conditions for an individual pitch angle of each reference wind speed using the GH-BladedTM V4.1 The ultimate loads (i.e., maximum force (Fx_ipa, Fy_ipa, Fz_ipa), and maximum moment (Mxc, Myc, Mzc) were obtained through the ultimate load analysis. Using these results, resultant force and moment were calculated by Equations (3) and (4), respectively.
F R _ i p a = ( F x _ i p a ) n 1 2 + ( F y _ i p a ) n 2 2 + ( F z _ i p a ) n 3 2
M R _ i p a = ( M x _ i p a ) n 1 2 + ( M y _ i p a ) n 2 2 + ( M z _ i p a ) n 3 2
where, ( n 1 = 0 , 2 , 4 , , 30 ), ( n 2 = 0 , 2 , 4 , , 30 ), ( n 3 = 0 , 2 , 4 , , 30 )
Figure 5 and Figure 6 show the matrix of the pitch angles of a1 (blade) and a2 (blade 2) against a3 (blade 3) for each average wind speed for the resultant moment MR_ipa and the resultant force FR_ipa, respectively. Here, each cell of the matrix represents a load distribution contour plot for the pitch angles of a1 (blade 1) and a2 (blade 2) against a3 (blade 3). Additionally, red dots indicate the minimum resultant moment and force. From these results, the ultimate load characteristics were identified for the individual pitch movement of each blade at specific wind speeds. For Figure 5 (i.e., resultant moment), referring to the vertical scale bar of each matrix, we can identify that the differences between the minimum resultant moment and the maximum resultant moment become more than four-fold as the difference of relative pitch angles between the blades increases. On the other hand, the difference in the load is smaller as the relative difference between the pitch angle gets smaller. However, we can also identify that the position of the minimum resultant moment (set of individual pitch angle) according to the increase in the wind speed does not change significantly. In detail, the pitch angles (set of individual pitch angle) of the a1 and a2 blades that generate the minimum resultant moment are not sensitive to the wind speed when the pitch angle of the a3 blade is constant. This behavior similarly appears in the resultant force in Figure 6. However, in the case of the resultant force, even though the relative difference between pitch angle of the blades is large, the difference between the minimum and the maximum resultant force is insignificant compared to the resultant moment. It is, therefore, reasonable to say that the influence of the resultant moment is dominant when aerodynamic imbalance occurs.

3.3. Allowable Pitch Angle (APA) Region

In order to calculate the allowable pitch angle (APA) region (i.e., ultimate load reduction area) where IPC could be applied, we should find the pitch angle region where the individual pitch movement ultimate loads are smaller than the CPC ultimate load, as shown in Equations (5) and (6).
F a = ( F R _ i p a ) n ,   ( F R _ i p a ) n F R c
M a = ( M R _ i p a ) n ,   ( M R _ i p a ) n M R c
Here, Ma and Fa refer to the allowable resultant moment and resultant force, respectively, and n refers to the pitch angle of 0°, 2°, ···, 30°.
In this study, the APA region was analyzed for the resultant moment Ma. This is because the influence of the resultant moment is dominant when aerodynamic imbalance loads occur, as described in Section 3.2. Figure 7, Figure 8, Figure 9, Figure 10, Figure 11 and Figure 12 show the Ma-based APA region (blue circle) obtained through the process according to the wind speed described in Equation (6), and summarized in Table 5. In these figures, the APA region shows the shape that spreads like a cone as the pitch angle increases. This occurs because the pitch angle of each blade increases with the growth in the APA, thus leading to the aerodynamic stall effect, which results in the load reduction of the wind turbine. In addition, the pitch angle increases with the increase in wind speed, and the relative pitch angle between the blades can only be within in a relatively small region.

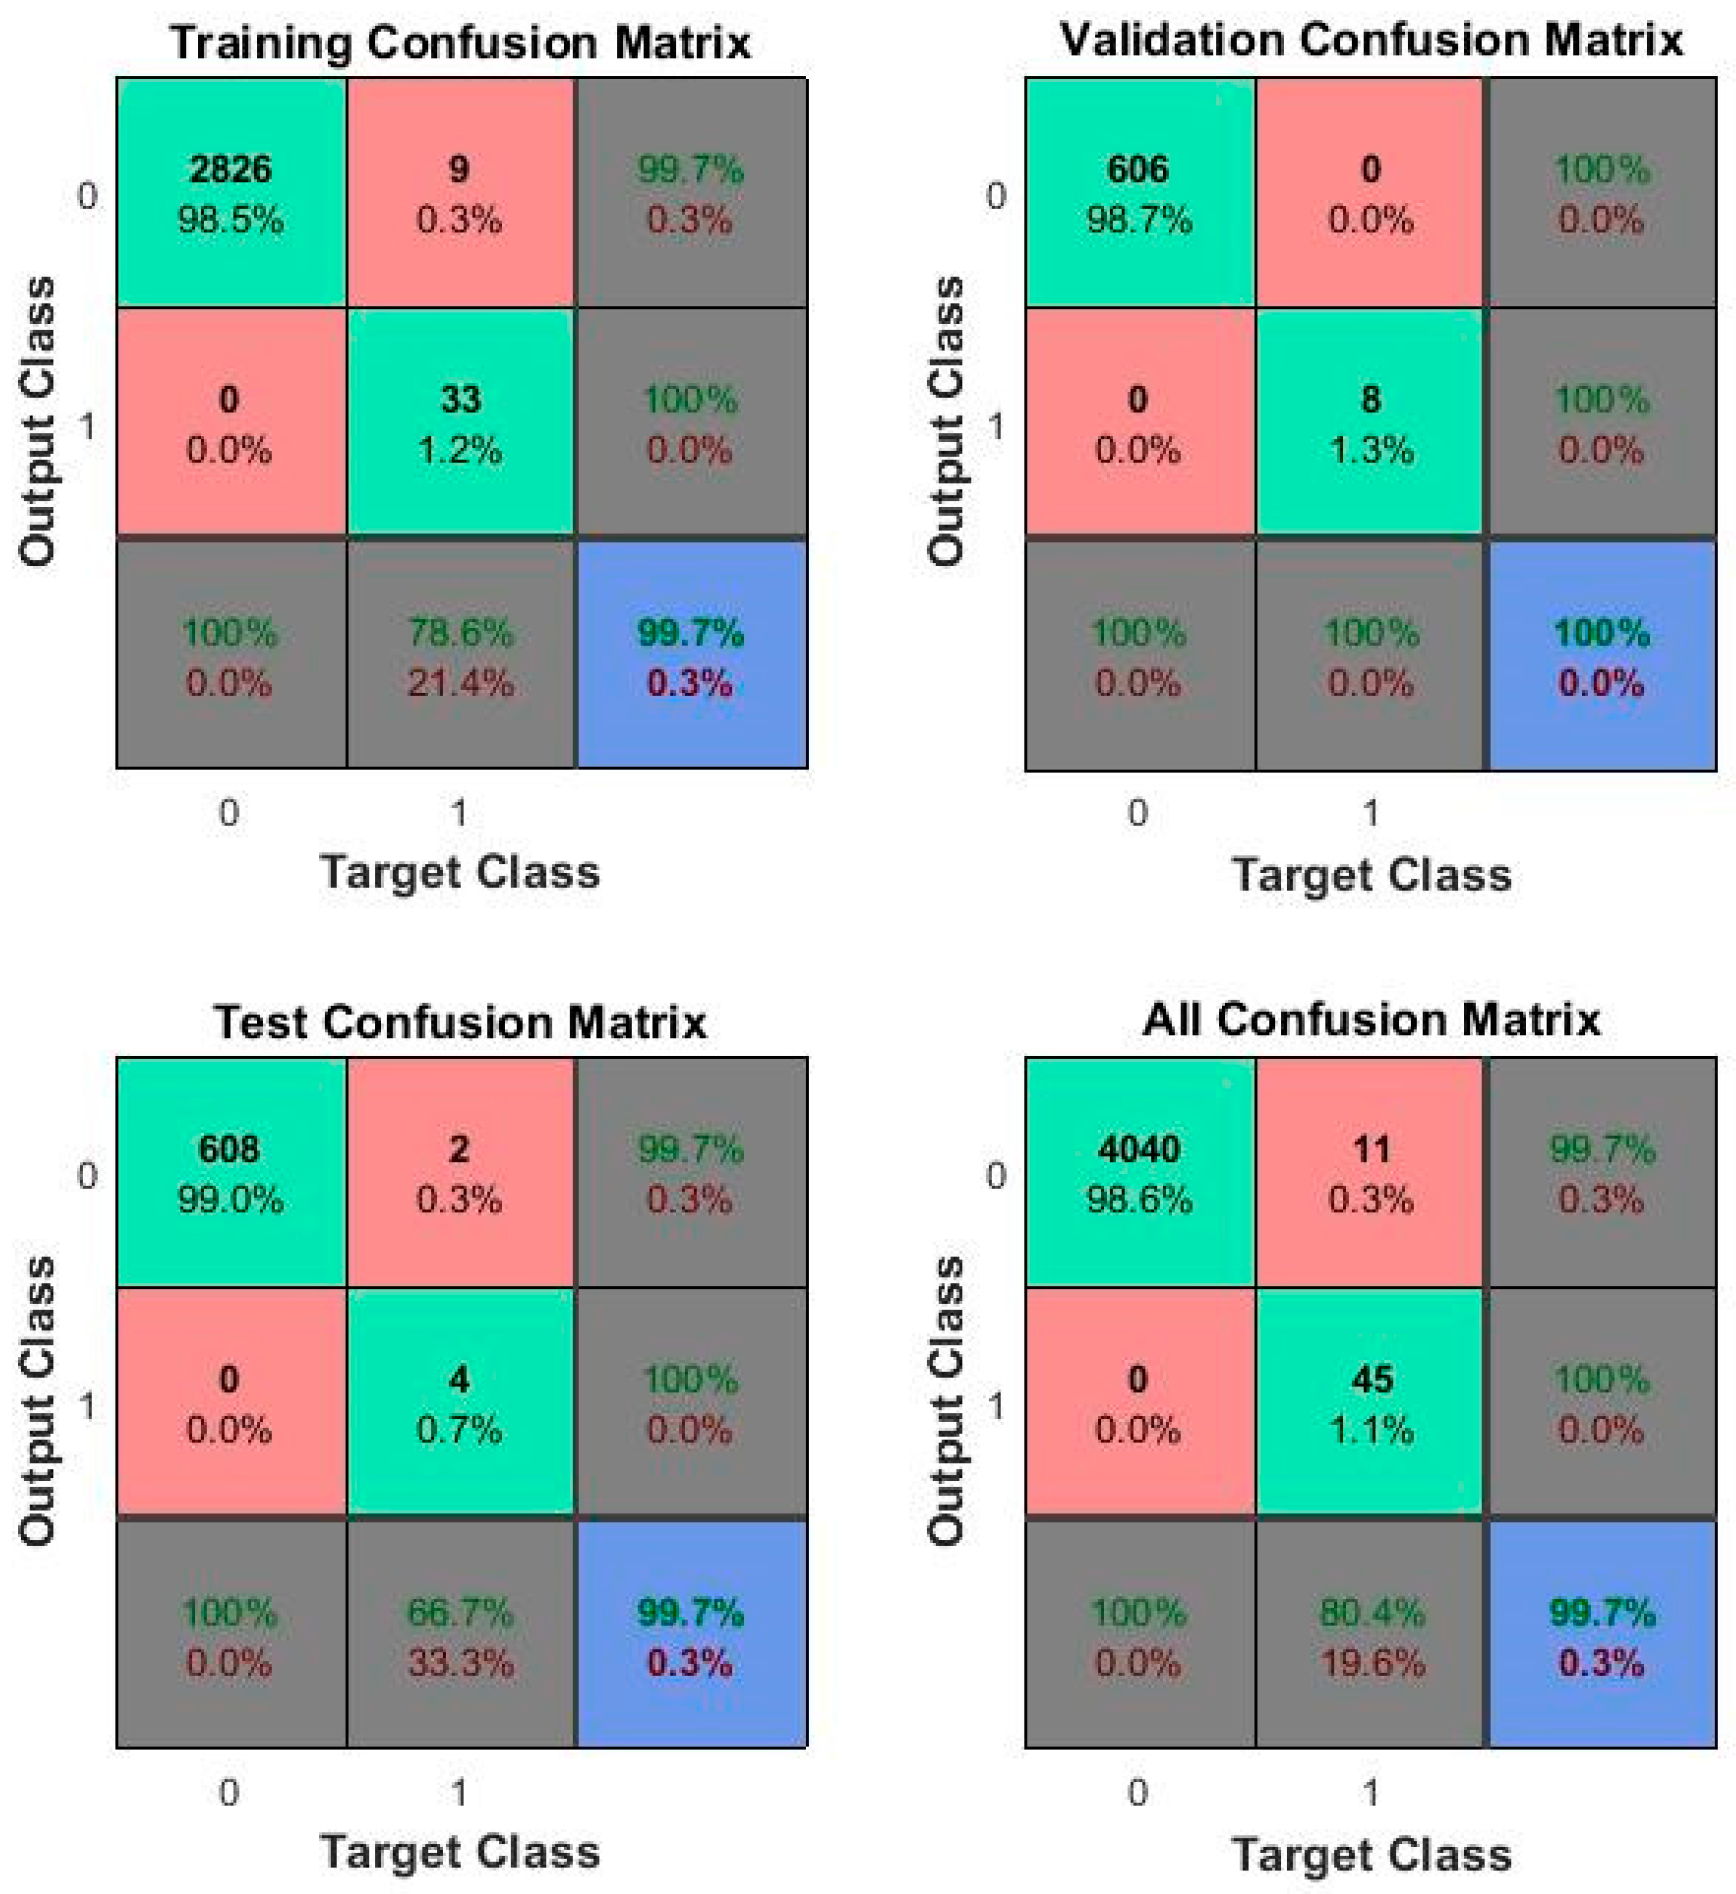
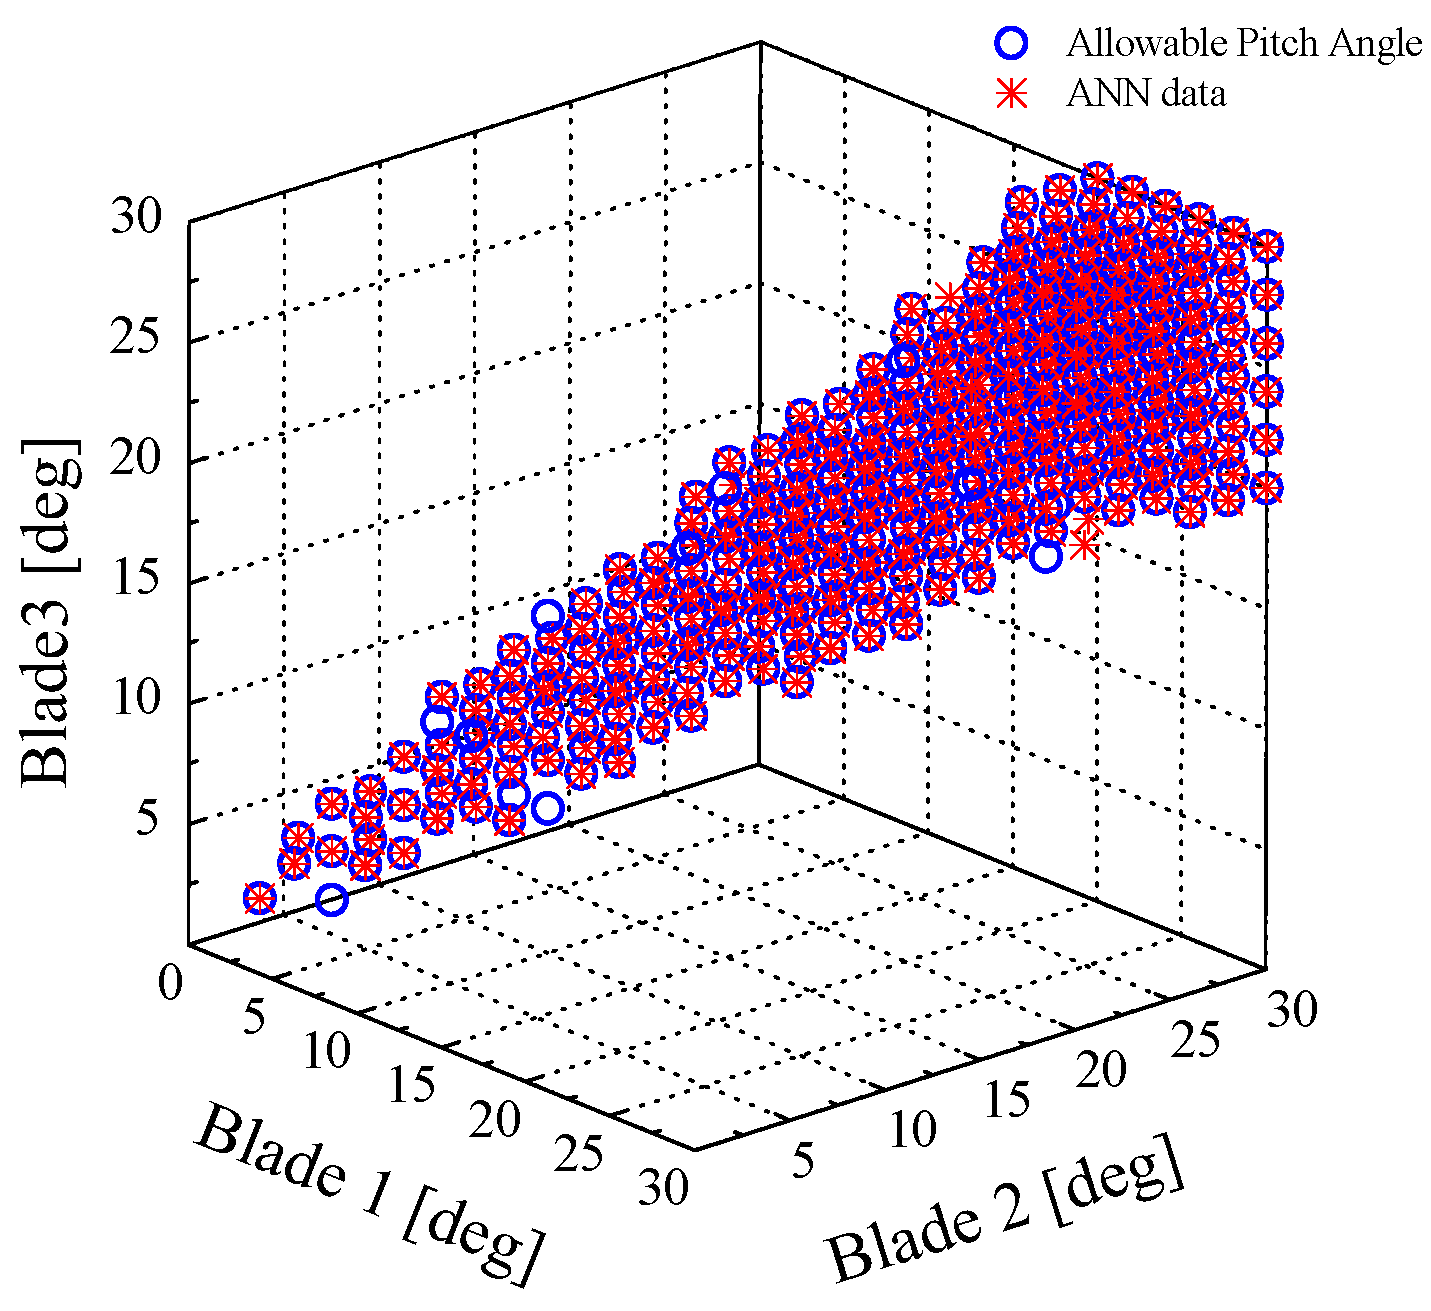
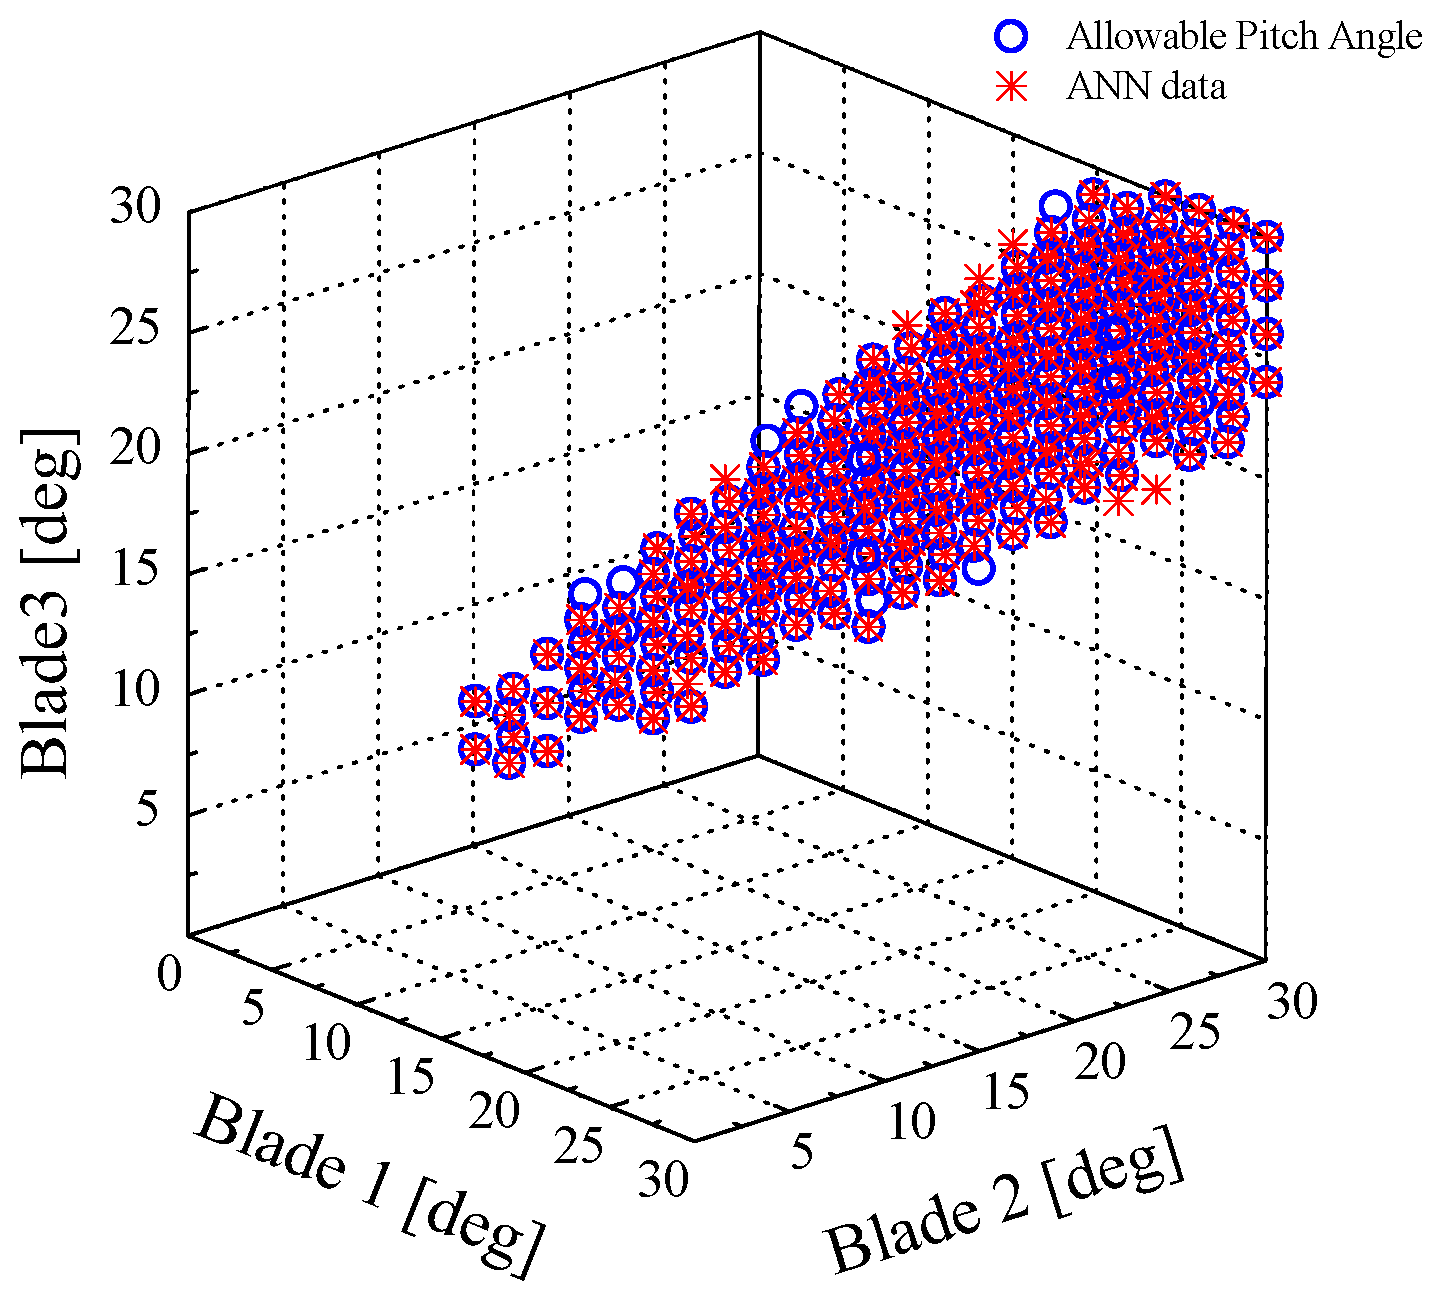
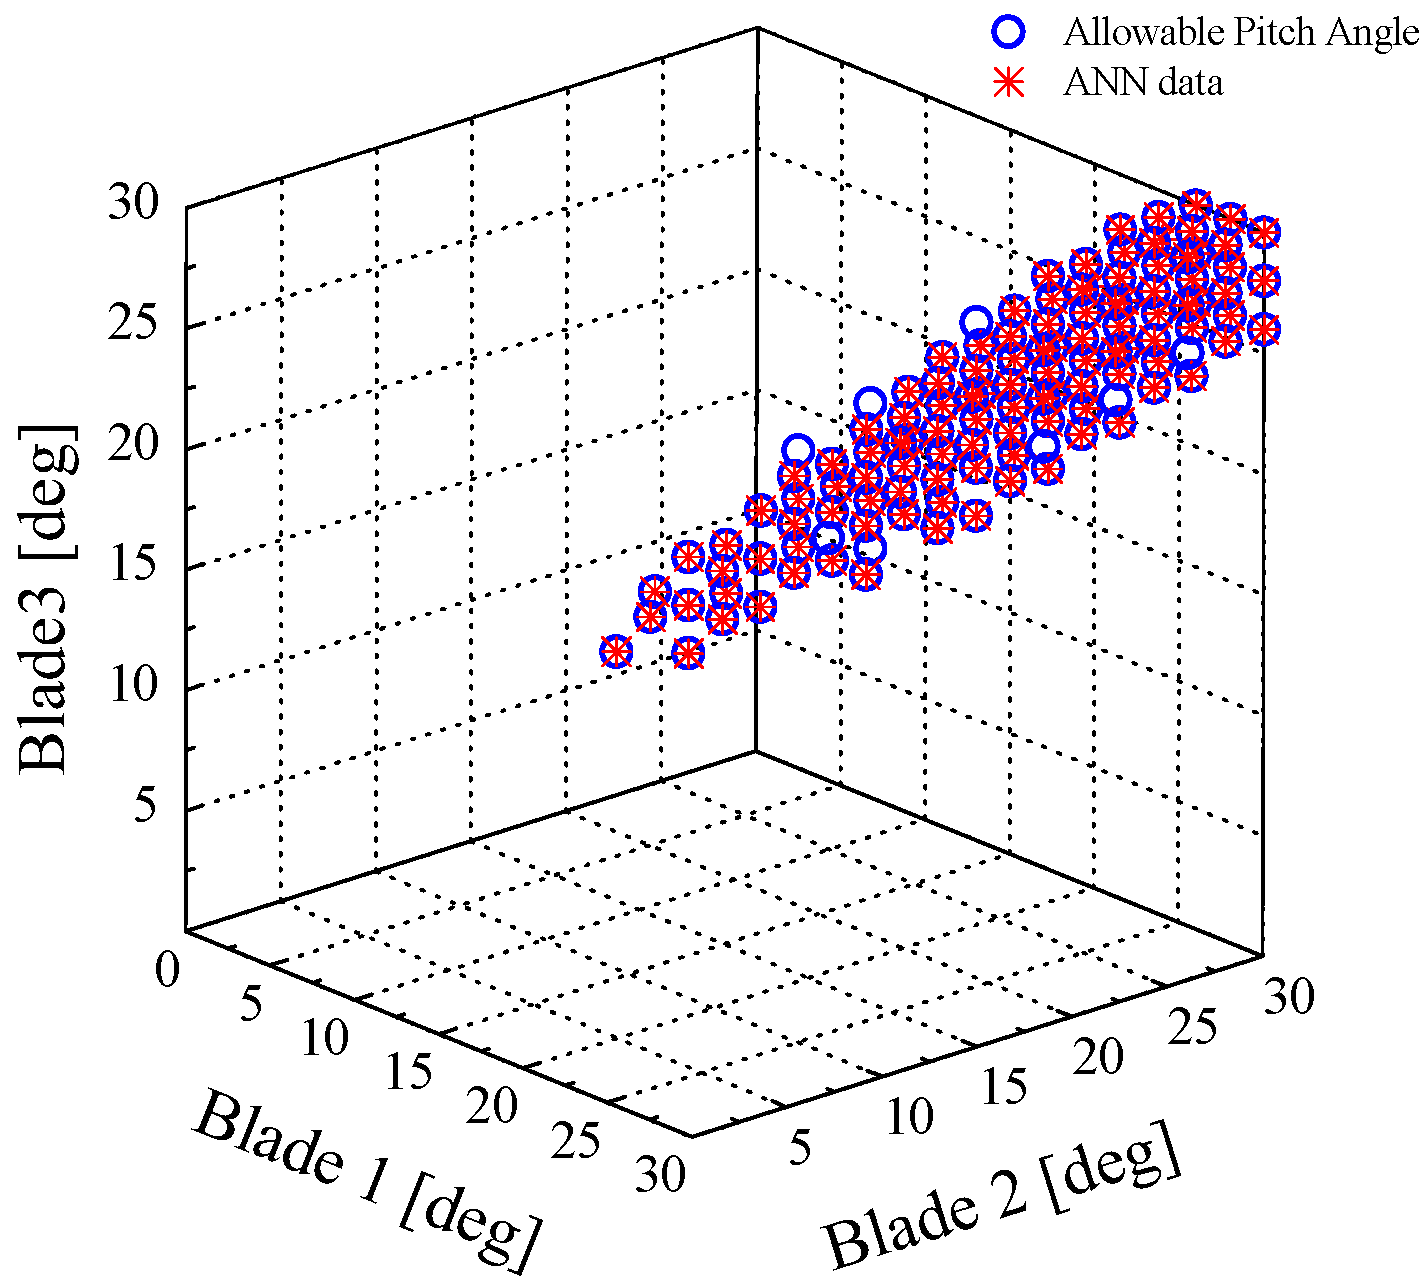
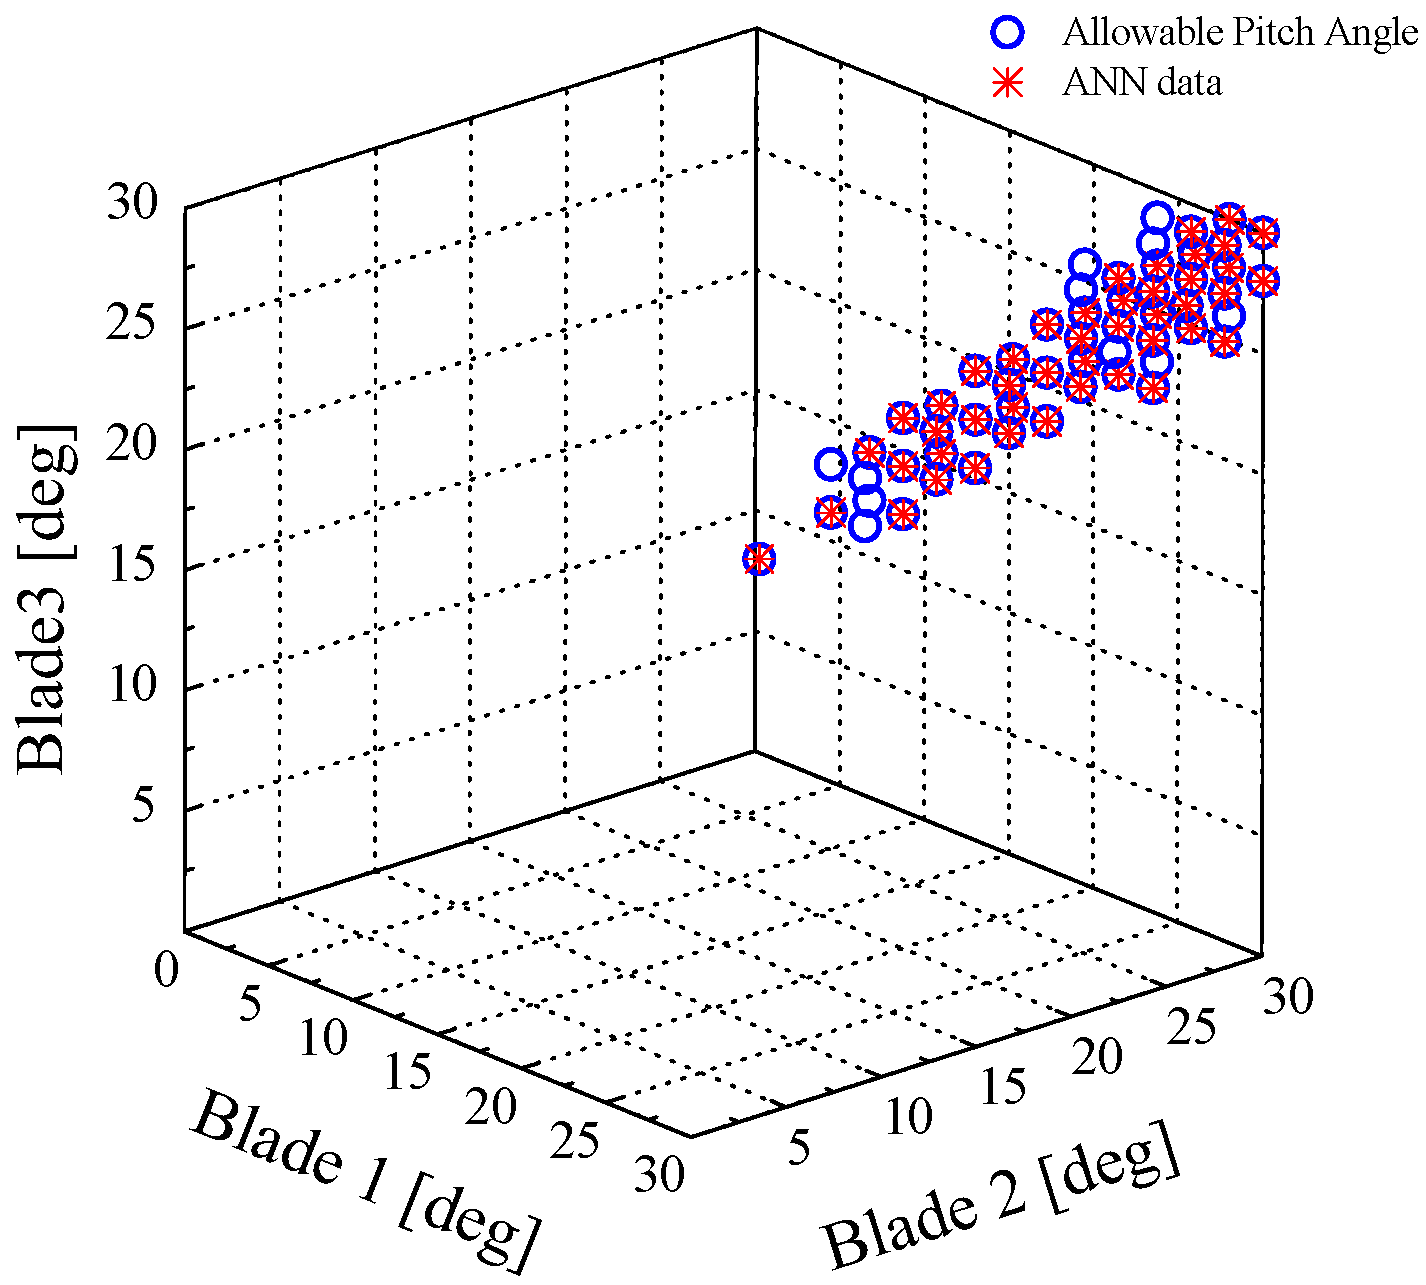
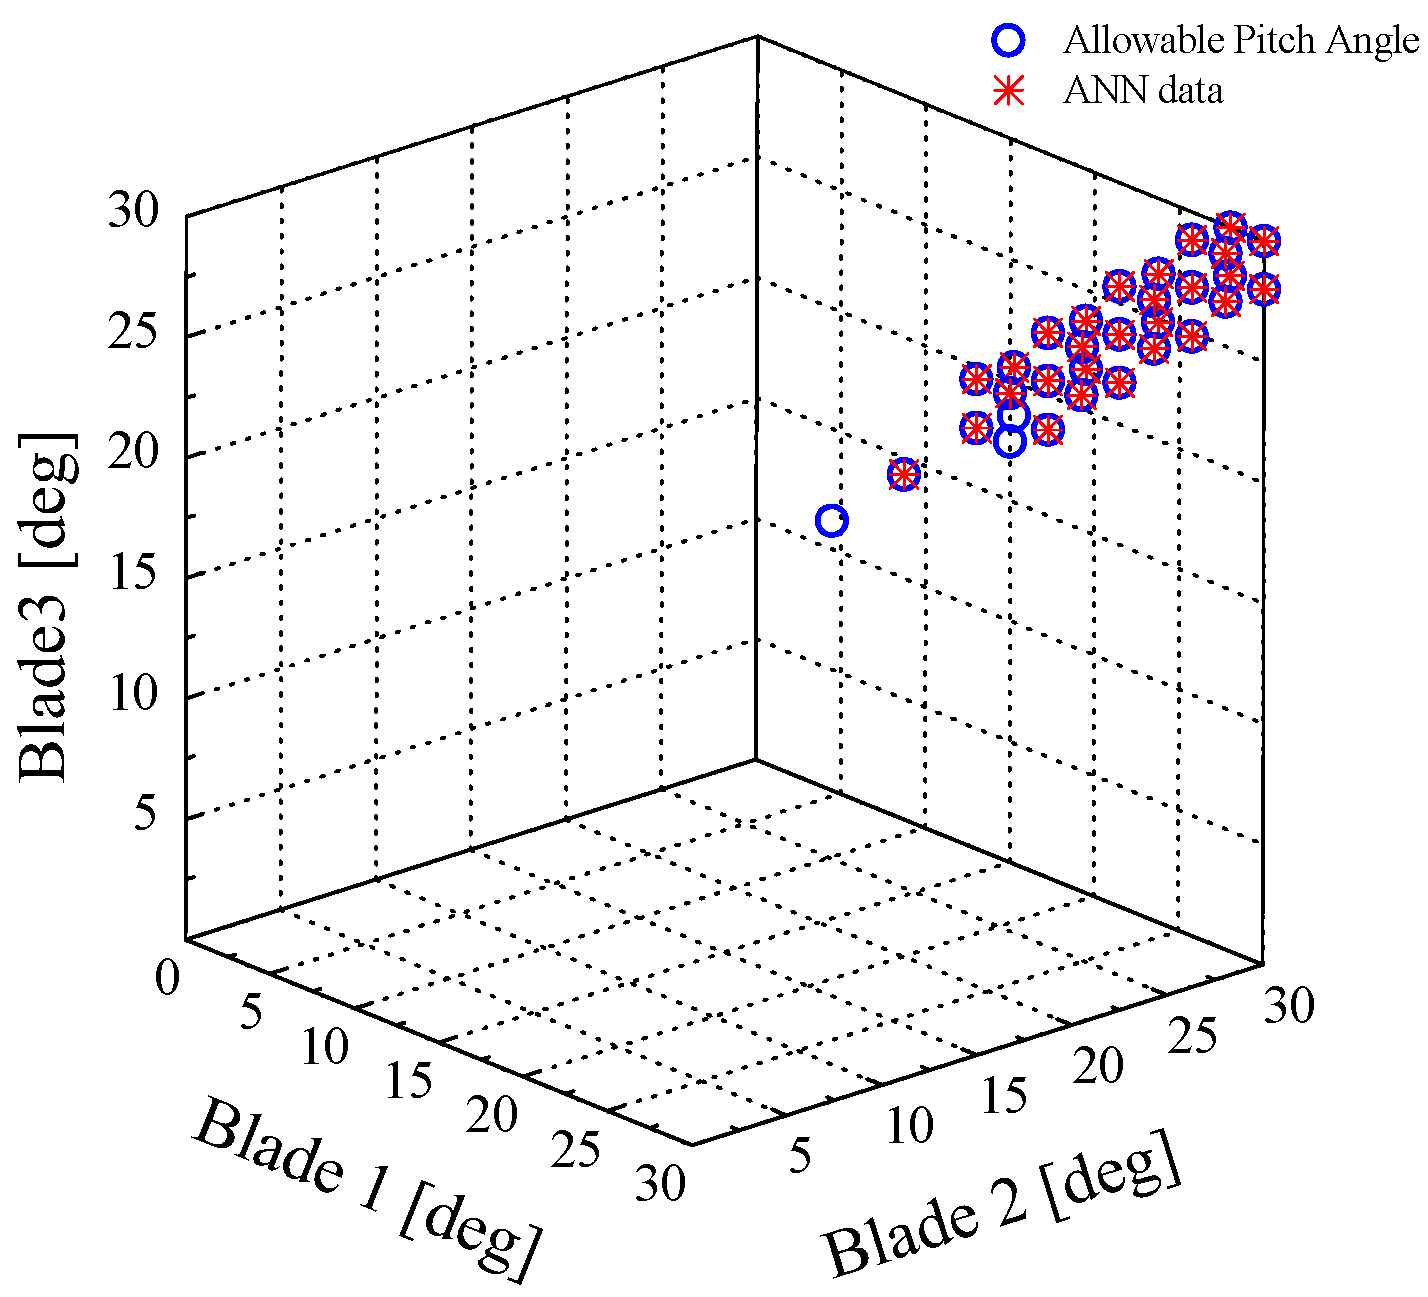
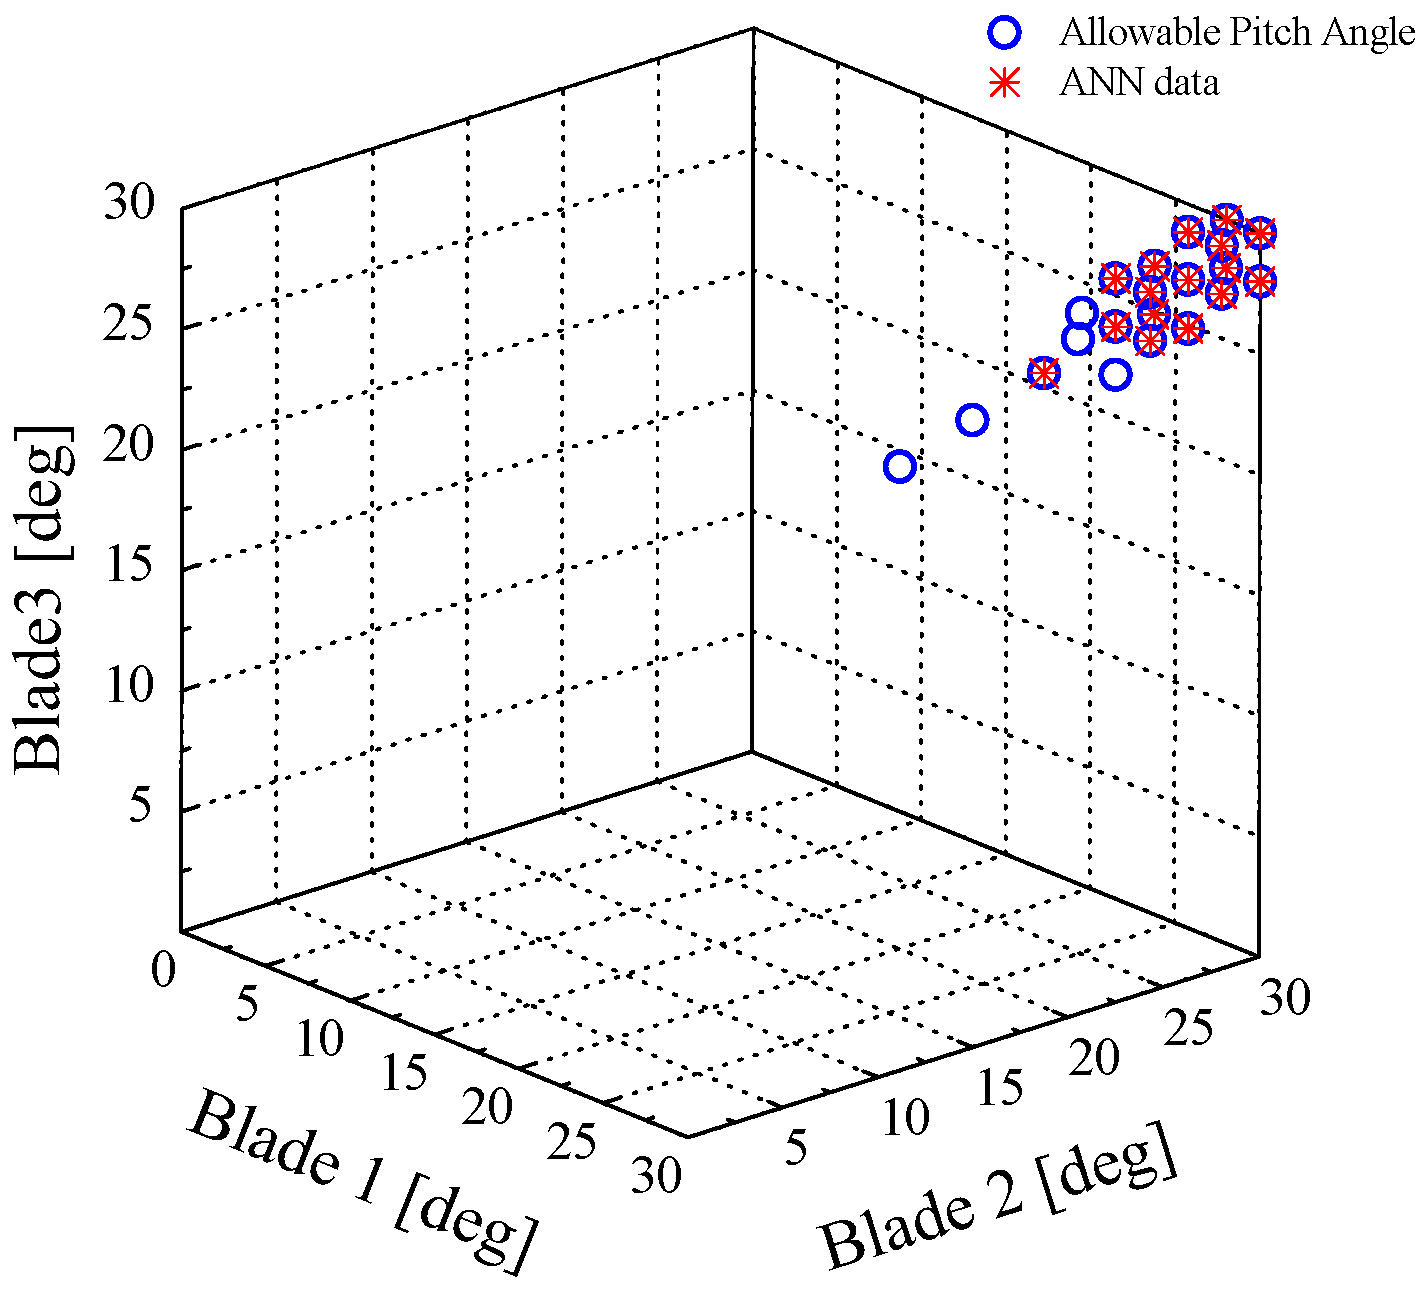
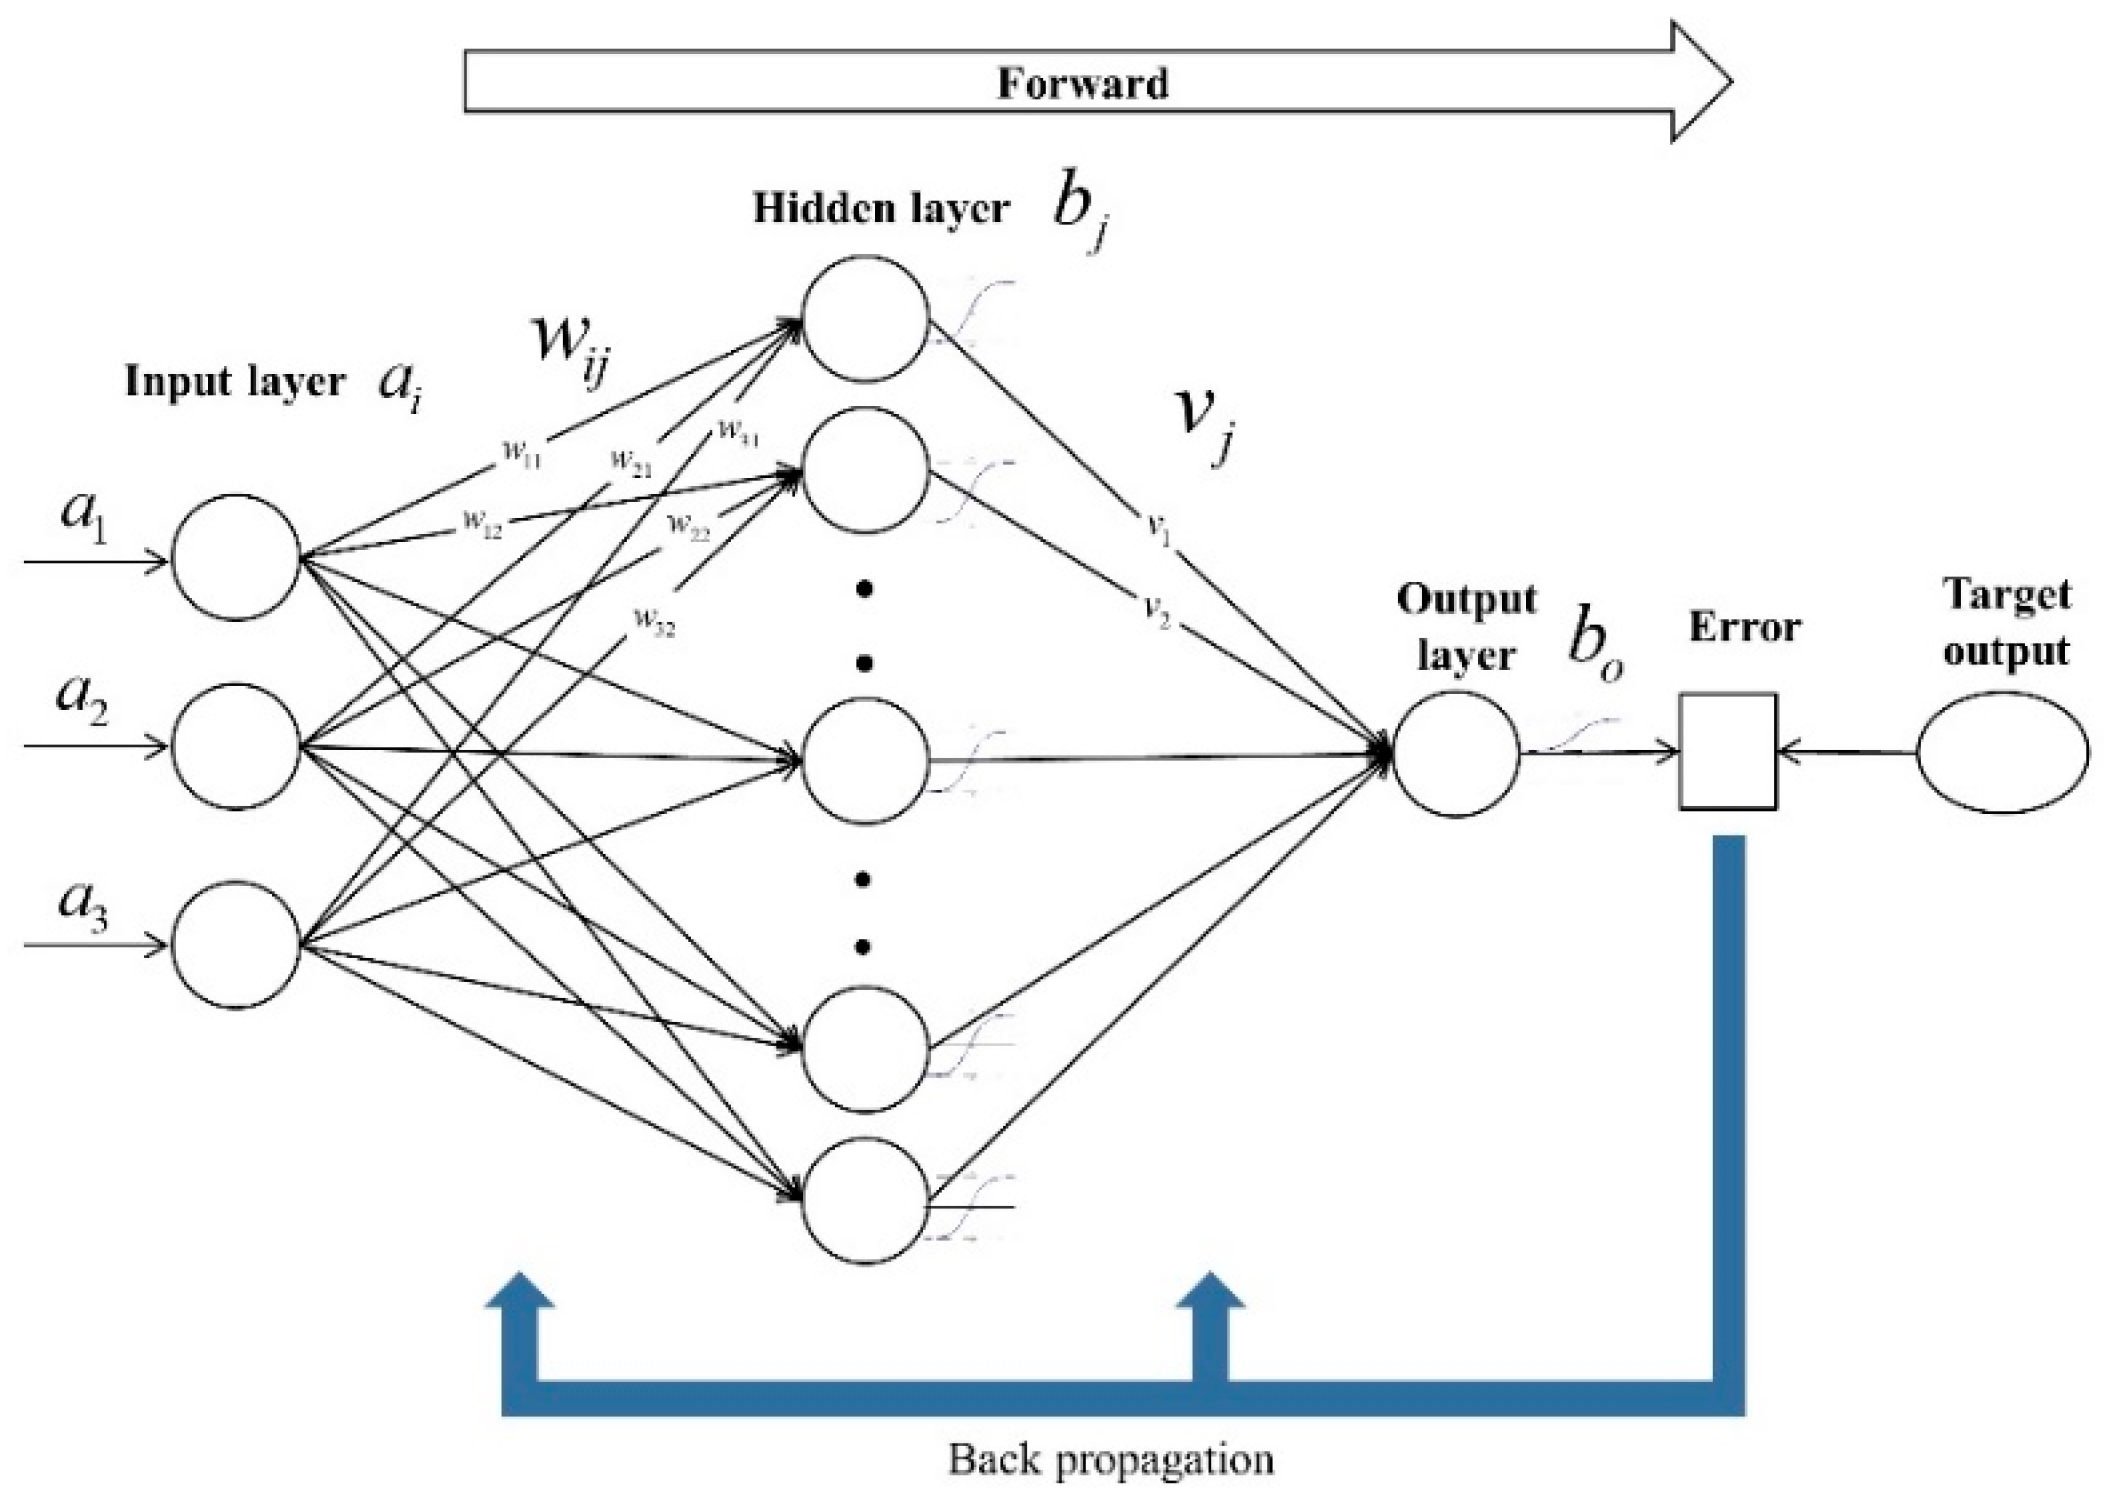
3.4. Pattern Analysis for APA Using Machine Learning

In order to review the applicability of the aerodynamic imbalance APA region and IPC determined in Section 3.3, a pattern analysis using the artificial neural network–one of the machine learning techniques–was performed. Here, we used the commercial code Matlab [19]. This study employed the scaled conjugate gradient back propagation (SCGBP) algorithm suitable for pattern recognition among back propagation algorithms among the ANN techniques [20]. The ANN structure consists of the input, hidden, and output layers, as shown in Figure 13; the input layer has three input vectors. Additionally, the number of neurons used in the hidden layer were 10 to 40, due the convergence of results and unnecessary learning time, and the transfer function was obtained by tangent sigmoid function in Equation (7). The transfer function of the output layer used the sigmoid function shown in Equation (8), and the output of the neuron y was expressed as a result value from 0 to 1, as shown in Equation (9).
f 1 = 2 ( 1 + e 2 x j ) 1
f 2 = 1 1 + e x o
y = f 2 ( v j f 1 ( w i j a i + b j ) + b o )
For pattern analysis, we generalized the target value of 1 for the APA region, and the target value of 0 for the non-allowable pitch angle. There were a total of 4096 data for each wind speed, and they were randomly classified into 70% training data, 15% validation data, and 15% test data. Next, pattern analysis was performed.
Figure 14 shows the confusion matrix that represents the values that resulted from the ANN training with the Ma at the hub at a wind speed of 20 m/s. First, the training confusion matrix in the upper left corner was examined. We considered values where the target and prediction values matched to be true values. For the true values, 2826 (98.5%) of 0 and 33 (1.2%) of 1, respectively, matched–that is, a total of 2859 (99.7%) matched. Hence, these results were identified as having a 99.7% success rate. Combining this with the results of the validation confusion matrix (100%) and the test confusion matrix (99.7%), the success rate of all confusion matrix was 99.7%. Table 6 shows the success rates of all confusion matrix for each wind speed, and the appropriate number of neurons to obtain them. The success rate may change slightly depending on the number of neurons and hidden layers.
Figure 7, Figure 8, Figure 9, Figure 10, Figure 11 and Figure 12 show the prediction results (red asterisk) obtained through the above ANN pattern analysis, and the APA region analysis results (blue circle) for each wind speed based on the resultant moment. From these figures, the APA prediction results by ANN very well match the APA analysis results by ultimate loads analysis. This shows that the APA pattern analysis using ANN can implement the meta models for each wind speed. Furthermore, it is expected that this procedure can be used to make the basic design data of IPC strategy.

4. Conclusions

In this study, we proposed the procedure to determine the allowable pitch angle (APA) region that the relative pitch angle deviations should adhere to by performing ultimate load analysis under aerodynamic imbalance for a NREL-5 MW offshore wind turbine. We also performed pattern analysis using the artificial neural network (ANN) to obtain meta models for the APA region for each wind speed.
(1)
The results of the ultimate load analysis under aerodynamic imbalance indicate that the difference in the resultant moment tends to increase largely as the relative difference of pitch angle between the blades increases. On the other hand, the resultant force is insignificant compared to the resultant moment.
(2)
We proposed a procedure to determine the APA region for each wind speed, and also determined that the proposed APA region expands like a cone as the pitch angle increases. This seems to occur when reducing the load of the wind turbine due to the aerodynamic stall with the increase in the APA. In addition, we identified that the relative difference in the pitch angle between the blades was only possible in a small area. This approach may be used to reduce the blade loads due to the relative pitch angle deviation under aerodynamic imbalance.
(3)
We proposed the pattern analysis procedure to implement the meta models for APA region at each wind speed using the artificial neural network (ANN), which is one of the machine learning techniques. The prediction results for the APA region using the ANN very well matched the APA analysis results by ultimate loads analysis. This approach may be used to reduce blade loads due to the relative pitch angle deviation under aerodynamic imbalance.
(4)
This decision can only be generalized to this wind turbine. Applicability to other wind turbines will require further testing and studies. In addition, further studies considering comparative evaluations with other researchers’ IPCs are recommended.

Author Contributions

Writing-original draft preparation, B.-S.K.; investigation, D.-Y.J.; resources, Y.-J.J., writing-review and editing, K.-W.K. All authors have read and agreed to the published version of the manuscript.

Funding

This work was supported by Korea Institute of Energy Technology Evaluation and Planning (KETEP) grant funded by the Korea Government (MOTIE) (20213030020120, 20213030020380).

Conflicts of Interest

The authors declare no conflict of interest.

References

  1. Pire, T.; Le Sourne, H.; Echeverry, S.; Rigo, P. Analytical formulations to assess the energy dissipated at the base of an offshore wind turbine jacket impacted by a ship. Mar. Struct. 2018, 59, 192–218. [Google Scholar] [CrossRef]
  2. Nagel, T.; Julien, C.; Wirth, A.; Bonamy, C. On the multi-scale interactions between an offshore-wind-turbine wake and the ocean-sediment dynamics in an idealized framework—A numerical investigation. Renew. Energy 2018, 115, 783–796. [Google Scholar] [CrossRef]
  3. Taylor, J.W.; Jeon, J.Y. Probabilistic forecasting of wave height for offshore wind turbine maintenance. Eur. J. Oper. Res. 2018, 267, 877–890. [Google Scholar] [CrossRef]
  4. Rezaeiha, A.; Pereira, R.; Kotsonis, M. Fluctuations of angle of attack and lift coefficient and the resultant fatigue loads for a large Horizontal Axis Wind turbine. Renew. Energy 2017, 114, 904–916. [Google Scholar] [CrossRef]
  5. Engelen, T. Design Model and Load Reduction Assessment for Multi- rotational Mode Individual Pitch Control. In Proceedings of the European Wind Energy Conference (EWEC 2006), Athens, Greece, 27 February–2 March 2006. [Google Scholar]
  6. Bossanyi, E. Individual Blade Pitch Control for Load Reduction. Wind Energy 2003, 6, 119–128. [Google Scholar] [CrossRef]
  7. Larsen, T.J.; Madsen, H.A.; Thomsen, K. Active Load Reduction Using Individual Pitch, Based on Local Blade Flow Measurements. Wind Energy 2005, 8, 67–80. [Google Scholar] [CrossRef]
  8. Sarkar, S.; Fitzgerald, B.; Basu, B. Individual Blade Pitch Control of Floating Offshore Wind Turbines for Load Mitigation and Power Regulation. IEEE Trans. Control. Syst. Technol. 2021, 29, 305–315. [Google Scholar] [CrossRef]
  9. Aghaeinezhad, S.M.; Taghizadeh, M.; Mazare, M.; Kazemi, M.G. Individual Pitch Angle Control of a Variable Speed Wind Turbine Using Adaptive Fractional Order Non-Singular Fast Terminal Sliding Mode Control. Int. J. Precis. Eng. Manuf. 2021, 22, 511–522. [Google Scholar] [CrossRef]
  10. Lara, M.; Garrido, J.; Ruz, M.L.; Vázquez, F. Adaptive Pitch Controller of a Large-Scale Wind Turbine Using Multi-Objective Optimization. Appl. Sci. 2021, 11, 2844. [Google Scholar] [CrossRef]
  11. Hanifi, S.; Liu, X.; Lin, Z.; Lotfian, S. A Critical Review of Wind Power Forecasting Methods—Past, Present and Future. Energies 2020, 13, 3764. [Google Scholar] [CrossRef]
  12. Robertson, A.N.; Shaler, K.; Sethuraman, L.; Jonkman, J. Sensitivity analysis of the effect of wind characteristics and turbine properties on wind turbine loads. Wind. Energy Sci. 2019, 4, 479–513. [Google Scholar] [CrossRef] [Green Version]
  13. Niebsch, J.; Ramlau, R.; Nguyen, T.T. Mass and Aerodynamic Imbalance Estimates of Wind Turbines. Energies 2010, 3, 696–710. [Google Scholar] [CrossRef] [Green Version]
  14. Jonkman, J.; Butterfield, S.; Musial, W.; Scott, G. Definition of a 5-MW Reference Wind Turbine for Offshore System Development; National Renewable Energy Laboratory (NREL): Golden, CO, USA, 2009.
  15. Vemula, N.K. Design Solution for the Upwind Reference Offshore Support Structure; Ramboll: Esbjerg, Denmark, 2010. [Google Scholar]
  16. Cordle, A.; Kaufer, D.; Vorpahl, F.; Fischer, T. Final Report for WP4.3: Enhancement of Design Methods and Standards; Garrad Hassan and Partners Ltd.: Bristol, UK, 2011. [Google Scholar]
  17. Kim, B.S.; Jin, J.W.; Bitkina, O.; Kang, K.W. Ultimate load characteristics of NREL 5-MW offshore wind turbines with different substructures. Int. J. Energy Res. 2016, 40, 639–650. [Google Scholar] [CrossRef]
  18. GL Garrad Hassan. GH-BladedTM. version 4.1.
  19. Demuth, H.; Beale, M.; Hagan, M. Neural Network ToolboxTM User’s Guide; The MathWorks: Natick, MA, USA, 2009. [Google Scholar]
  20. Moller, M.F. A scaled conjugate gradient algorithm for fast supervised learning. Neural Netw. 1993, 6, 525–533. [Google Scholar] [CrossRef]
Figure 1. Schematic of jacket type substructure.
Applsci 12 05177 g001
Figure 2. Pitch angle with wind speed histories.
Applsci 12 05177 g002
Figure 3. Section view for blade pitch angle.
Applsci 12 05177 g003
Figure 4. Coordinate systems for stationary hub loads.
Applsci 12 05177 g004
Figure 5. Aerodynamic imbalance loads of MR_ipa.
Applsci 12 05177 g005
Figure 6. Aerodynamic imbalance loads of FR_ipa.
Applsci 12 05177 g006
Figure 7. APA and ANN data for Ma of 11 m/s.
Applsci 12 05177 g007
Figure 8. APA and ANN data for Ma of 14 m/s.
Applsci 12 05177 g008
Figure 9. APA and ANN data for Ma of 17 m/s.
Applsci 12 05177 g009
Figure 10. APA and ANN data for Ma of 20 m/s.
Applsci 12 05177 g010
Figure 11. APA and ANN data for Ma of 22 m/s.
Applsci 12 05177 g011
Figure 12. APA and ANN data for Ma of 24 m/s.
Applsci 12 05177 g012
Figure 13. Simple ANN model.
Applsci 12 05177 g013
Figure 14. Confusion matrix for success rate (Ma, 20 m/s).
Applsci 12 05177 g014
Table 1. General specification.
Rated power5 MW
ClassIB
No. of blade3
Blade length61.5 m
Hub height90.55 m
Tower height88.15 m
Cut-in, Rated, Cut-out wind speed3 m/s, 11.4 m/s, 25 m/s
Cut-in, Rated rotational speed6.9 rpm, 12.1 rpm
Rotor overhang5 m
Rotor positionUpwind
TransmissionGearbox
Power controlPitch/Permanently stuck
Fixed/VariableVariable
Gear ratio97
Substructure typeJacket
Table 2. Ultimate load analysis condition.
Wind ConditionSteady State (Constant Wind)
Wind shear0.1
Tower shadow factor1
Yaw position error
Table 3. Aerodynamic imbalance condition.
Wind speed (m/s)11, 14, 17, 20, 22, 24
Individual pitch angle (Deg.)0, 2, 4, ···, 30
Pitch controlFixed pitch
No. of blade3
Total number of cases 24,576 = 16 3 × 6
Table 4. Ultimate loads and pitch angles for CPC.
Steady Wind Speed (m/s)MRc (kNm)FRc (kN)Pitch Angles
1136771280
14446912276.3°
174516117911.6°
204581115415.9°
224632114318.5°
244706113320.8°
Table 5. Approx. APA region for Ma.
a3 (Blade 3)a1 (Blade 1), a2 (Blade 2)
11 m/s14 m/s17 m/s20 m/s22 m/s24 m/s
2°~6°
4°~10°
6°~12°8°~10°
10°6°~14°8°~14°
12°8°~18°10°~16°12°~14°
14°10°~20°10°~20°12°~16°
16°12°~22°12°~22°14°~20°16°
18°12°~26°14°~24°16°~22°18°~20°
20°14°~30°14°~26°16°~24°18°~22°20°20°
22°16°~30°16°~30°18°~26°20°~24°22°~24°22°
24°18°~30°18°~30°20°~28°22°~28°22°~26°24°~26°
26°20°~30°20°~30°22°~30°24°~30°24°~28°24°~28°
28°20°~30°22°~30°24°~30°24°~30°26°~30°26°~30°
30°20°~30°22°~30°26°~30°26°~30°28°~30°28°~30°
Table 6. All confusion matrix for success rate.
Steady Wind Speed (m/s)Moment
Success Rate (%)Neuron Number
Stationaryhub1199.510
1499.410
1799.810
2099.710
2210020
2499.810
Average99.7-
Publisher’s Note: MDPI stays neutral with regard to jurisdictional claims in published maps and institutional affiliations.

