Article

Maximization of the Power Production of an Offshore Wind Farm

by
Raj Kiran Balakrishnan
1 and
Sung-ho Hur
2,*
1
School of Electronic and Electrical Engineering, Kyungpook National University, Daegu 41566, Korea
2
School of Electronics Engineering, Kyungpook National University, Daegu 41566, Korea
*
Author to whom correspondence should be addressed.
Appl. Sci. 2022, 12(8), 4013; https://doi.org/10.3390/app12084013
Submission received: 4 March 2022 / Revised: 5 April 2022 / Accepted: 13 April 2022 / Published: 15 April 2022
(This article belongs to the Special Issue Recent Advanced Technologies on Renewable Energy (AFORE 2021))

Abstract

:
Operating wind turbines together as a wind farm can be more advantageous and economical. As a result, onshore and offshore wind farms are being built at a rapid pace around the world. Wake effects, which have a negative impact on overall wind farm electricity generation, are one of the key concerns in wind farms. This work concentrates on the maximization of power output from wind farms by ameliorating the wake effect. This work introduces a dynamic wind farm controller that adjusts turbines’ yaw angles or axial induction factors following the flow field conditions to maximize the overall power output of the wind farm. This research examines a real-life offshore wind farm in South Korea and the wind farm controller is evaluated in Wind Farm Simulator (WFSim), a control-oriented dynamic wind farm model environment built by Delft University of Technology. The main contribution of this work includes investigating the impact of wind farm control methods on the power production of a wind farm model that simulates a real-life wind farm.

1. Introduction

Wind energy is a foremost inexhaustible eco-friendly energy resource that can be considered a major power generating source in the future. The development of the wind energy industry accounts for a significant portion of the reduction in carbon emissions. Wind energy industries have the potential to provide a wide range of job opportunities in the future, including wind turbine manufacture, structural development, logistics, maintenance, and research and development.
Operating wind turbines collectively as a wind farm is more beneficial and economical. However, the utmost pertaining concern in wind farms is the wake effect. When the wind turbine is in operation, it extracts energy from the wind, and a wake is thus developed behind the turbine that reduces the wind speed downstream. More specifically, it results in a reduction of the wind speed, an increase in turbulence, and finally a reduction in the overall wind farm power production [1]. This is illustrated in Figure 1.
The wake developed throughout the wind farm can be characterised by its strength and direction. The downstream turbines’ power generation may be hampered by the wake behind the upstream turbines, which results in reduced wind speed and turbulent wind flow [1,2]. As a result, the overall power output is lowered, while the fatigue loading on the downstream turbines is increased [3,4]. The flow field across the wind farm can be modified by managing the wake behind individual turbines, potentially boosting the wind farm’s total energy generation [5].
Research on wind farm control for reducing the impact of the wake is attaining importance. The review [6] on wind farm control strategies deals with the following three main concepts: Power derating [7,8,9], yaw misalignment-based wake steering [10,11,12,13] and turbine re-positioning [14,15]. It is noted that the concept of power derating, wake redirection control (WRC), and turbine re-positioning [16] could result in a remarkable rise in power output.
Power derating, also known as axial induction control (AIC) [17,18] is used to improve the efficiency of the downstream turbines by minimizing the strength of the wake by power derating the upstream turbines. This technique utilizes control of generator torque, pitch control of turbine blades, or turbine tilting to change the axial induction factor, a n . The turbine blade pitch control of upstream turbines reduces their power output, but the enhanced performance of downstream turbines could potentially improve the overall wind farm power output. When the axial induction method is used, some studies show significant power improvement [19,20], while other studies [17,18] do not demonstrate notable improvement in power production.
When the WRC method [21,22] is used, the upstream wind turbine is steered away from the upcoming wind to redirect the wake. The upstream turbine’s power output is reduced due to its steering, but the overall power output could be greatly improved by improving downstream turbine performance. Various studies [23,24] have found improvements and associated advantages of this method. Previous research on an optimization based wake steering approach evaluated on an operational wind farm found a power increase of 7–13% for site average wind speed and 28–47% for low wind speed, respectively [16]. The work carried out in [18] shows a 3.3% increase in the wind farm power production when the AIC is incorporated into the upstream turbines in a real-life wind farm in the UK. The preliminary investigation performed in [25] demonstrates further improvement when the WRC is incorporated into the turbines in a real-life wind farm in China.
In this work, the Wind Farm Simulator (WFSim) is used for simulation studies. It is a dynamic wind farm control model developed by Delft University of Technology [26]. WFSim is implemented in MATLAB and it has two control variables, yaw angle and axial induction factor. It takes into account wind farm flow field features, and includes a power production optimizer [27] based on the gradient method to help maximize wind farm power production. The power production optimizer is employed to bring up the overall wind farm power output by optimizing the yaw angle or the axial induction factor or even both. How the WFSim can be used to test various active wind farm control algorithms for maximizing the wind farm power production is discussed in [26,28].
Simulation studies are conducted for two wind farm layouts. In the first case, a virtual two-turbine wind farm is considered to investigate the impact of varying the distances between turbines on the power production and to analyze the outcome of using the WRC strategy on the maximization of power. A real-life wind farm configuration of an offshore wind farm is analyzed in the second scenario, which consists of 20 turbines with a spacing between them of roughly 800 m. In this situation, a steady-state optimized power production controller is used to maximize the power output by controlling the yaw angle or axial induction factor of wind farm turbines, or a combination of both. The main contribution of this paper is a preliminary investigation of the impact of WRC and AIC on the power production of a virtual wind farm model of two turbines and a wind farm model of 20 turbines, which simulate a real-life wind farm in the WFSim. Simulations carried out in this study using the WFSim provide dynamic responses in contrast to the work reported in [26,28] that focuses on the steady state responses.
The paper is organized as follows. Section 2 discusses wind farms modeled in WFSim, including details of the two wind farm layouts. In Section 3, wind farm control strategies, i.e., AIC and WRC, are described. In Section 4, the wind farm control strategies are applied to the wind farm layouts, with the simulation results presented. Section 5 draws conclusions and discusses future work.

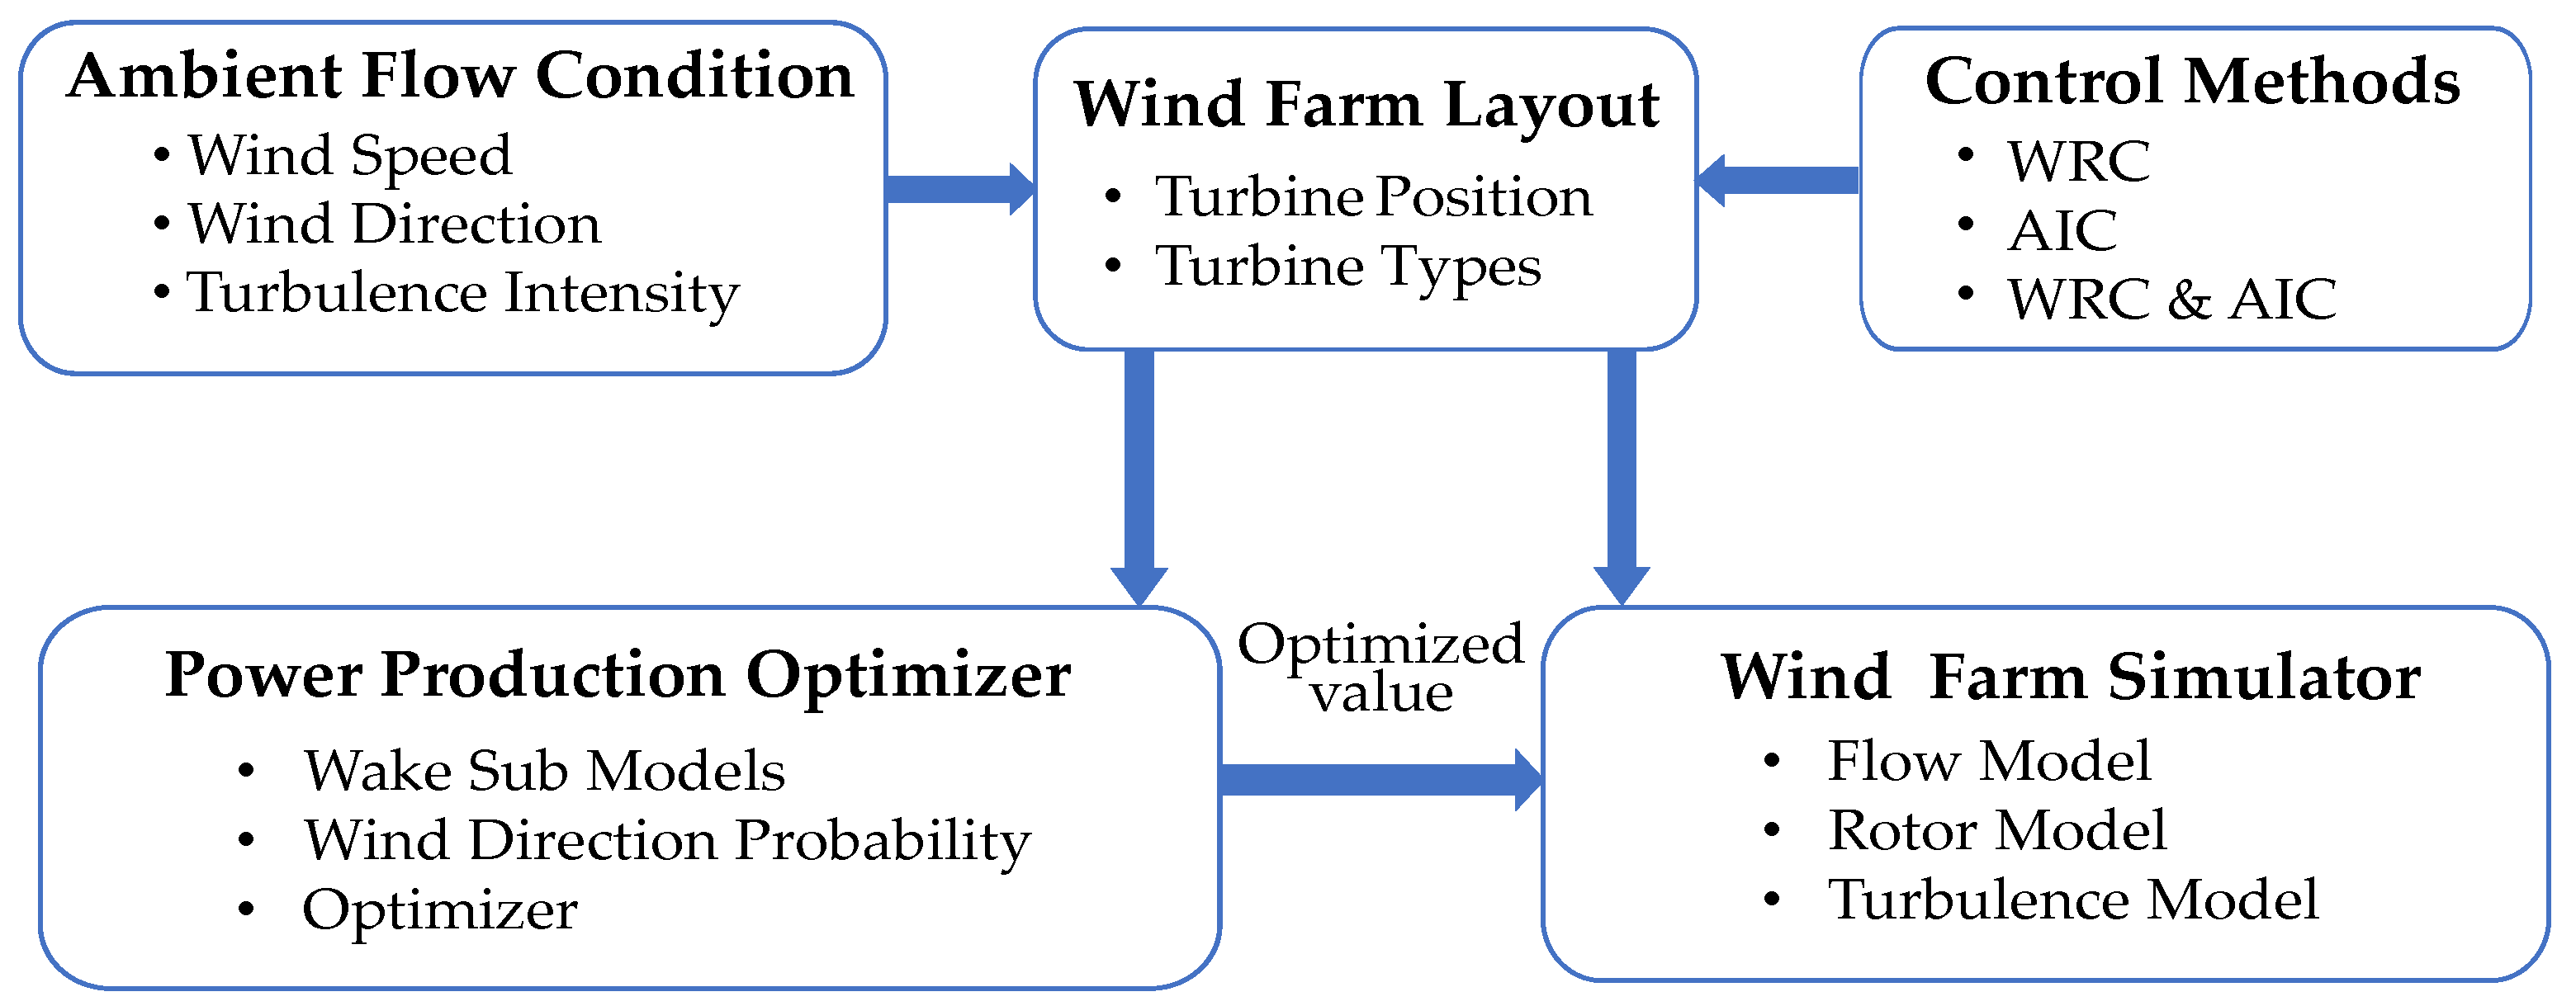
2. Wind Farm Modeling

This section gives an overview of the dynamic wind farm modeling tool, WFSim, and the two wind farm cases modeled, i.e., a two-turbine wind farm and a real-life 20-turbine wind farm. In general, wind farm control research focuses on steady-state control with set parameters, and the dynamic behavior is frequently overlooked. WFSim, on the other hand, considers wake dynamics over time as well as changing atmospheric conditions.

2.1. Wind Farm Simulator

WFSim developed by Delft University of Technology is a dynamic medium fidelity wind farm modeling tool. Navier-Stokes equations used to model flow field form the fundamental lead in developing the WFSim [26]. WFSim’s computational complexity is reduced by simplifying the three-dimensional flow equation to two-dimensional equation by disregarding flow features in the z-direction, where it solves the Navier–Stokes equation to get flow velocities at hub height. The WFSim is a control-oriented, medium-fidelity modeling tool that can be used to build and test various control techniques with tuning parameters. It employs flow velocities to determine the total power output [29]. It allows wind farms to be designed flexibly, and control methods based on actuator disk theory and actuator line model can be applied to the models.
A schematic representation of WFSim is shown in Figure 2. It consists of two modules, i.e., a flow model and a rotor model, as shown in the diagram. The flow model defines the behavior of the flow field by taking into account the atmospheric conditions, force on the flow field by the wind turbines, wind velocities, pressure, wind directions, and so on. The inputs to the flow model are the atmospheric condition qatm and the force f applied by the turbines on the flow field. The output from the flow model are state variables q = [u v p] T that comprise velocities u and v in the x and y directions, respectively, and air pressure p. The rotor model calculates the force exerted on the flow field by the turbines and is linked to the power generated by the turbines. The inputs to the rotor model include q in addition to the control input ω , which influences force f, fed to the flow model and is a function of power P. Prandtl’s mixing length model [26] is the turbulence model used in WFSim, and wind farm turbines in wind farm are modeled as non-rotating actuator disk models.
Mathematically, f in Figure 3 applied by the turbine to the flow field is expressed in terms of hub-height flow velocity U n , yaw angle γ n , and inflow angle ϕ as follows:
f = n = 1 N T f n
f n = c f 2 C T n [ U n cos ( γ n ) ] 2 cos ( γ n + ϕ ) sin ( γ n + ϕ ) × H [ D 2 s t n 2 ] δ [ ( s t n ) . e , n ]
where c f is a tuning parameter, N T denotes the number of turbines and, H and δ are Heaviside and Dirac delta functions, respectively [26]. For the n t h turbine, the disk-based thrust coefficient C T n [30] is a function of axial induction factor a n and classical thrust coefficient C T n as follows:
C T n = C T n ( 1 a n ) 2
The power P generated by the wind farm is function of air density δ , swept area A, wind flow velocity U n , and yaw angle γ n as follows:
P = n = 1 N T 1 2 ρ A C P n [ U n cos γ n ] 3
where C P n = C P C T n is the loss factor, which is the function of C P , a tuning variable. The control variables in the WFSim model are yaw angle γ n and C T n , which relates to a n . These control variables are regulated to maximize the energy production and enhance the wind farm performance.

2.2. Two-Turbine Wind Farm

A two-turbine virtual test case is developed to investigate the effect of wake on the overall wind farm power production. The rotor diameter of the turbine is 126.4 m [26]. When the WRC technique is employed, the effect of altering the spacing between the turbines on the overall power production is evaluated in Section 4.1.

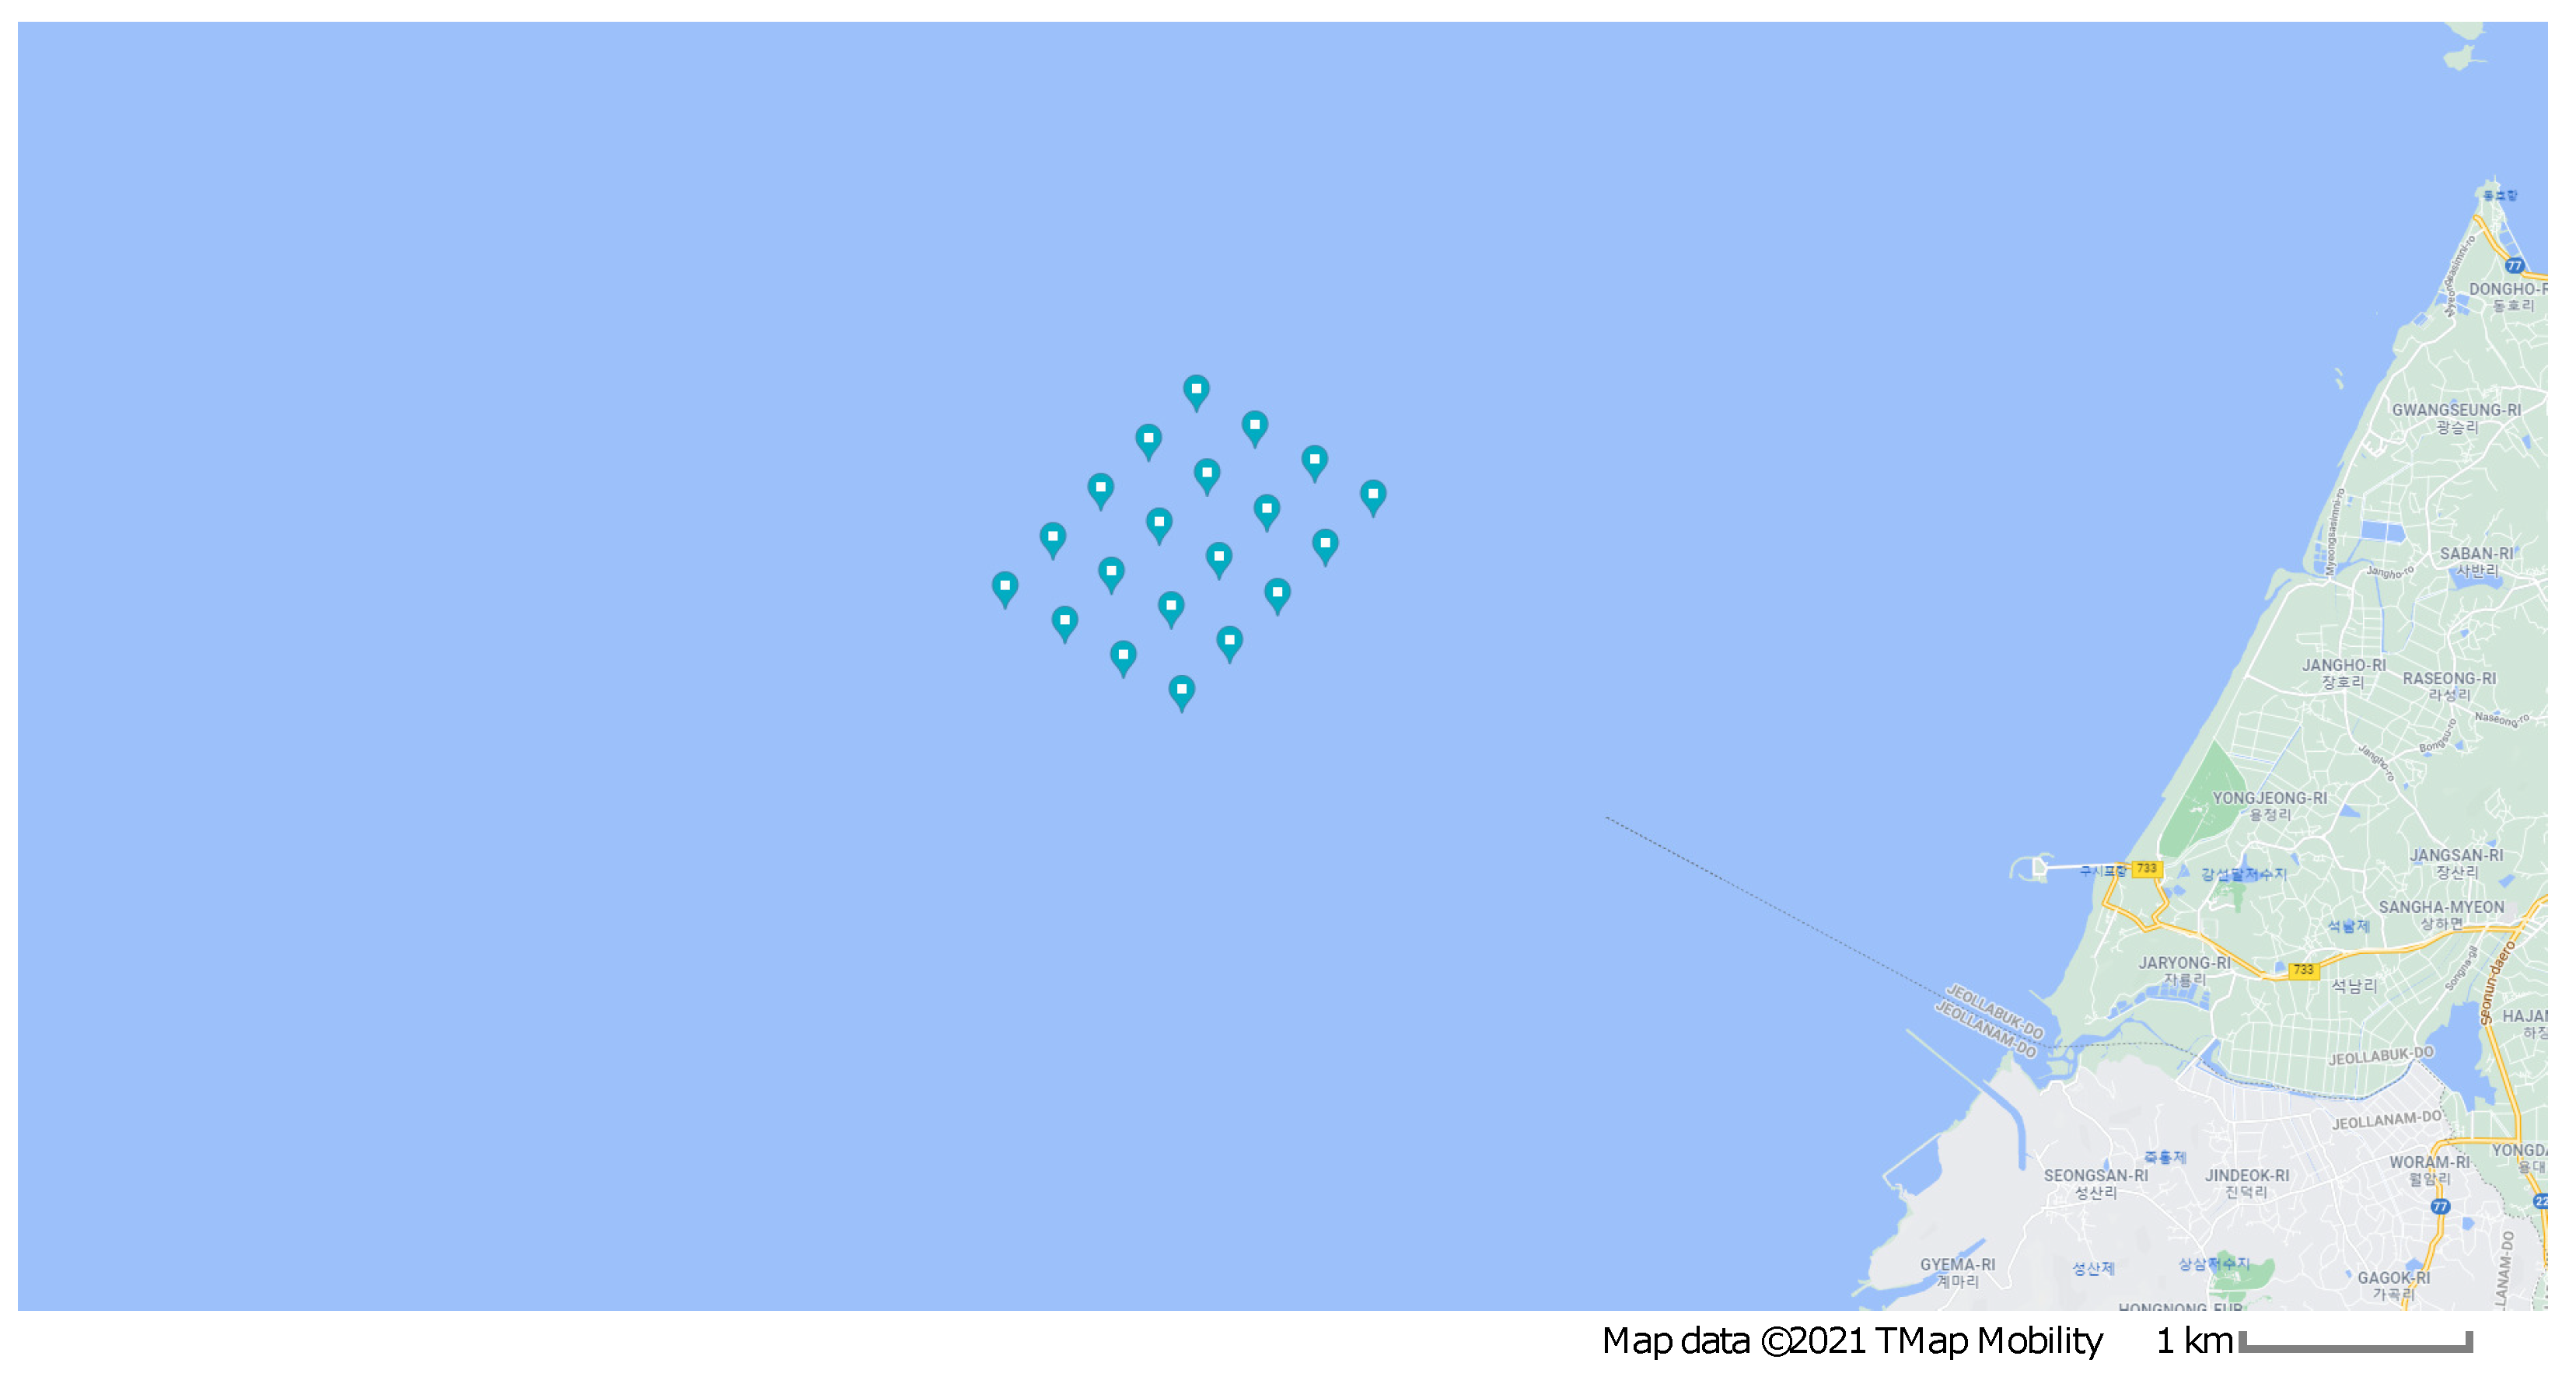
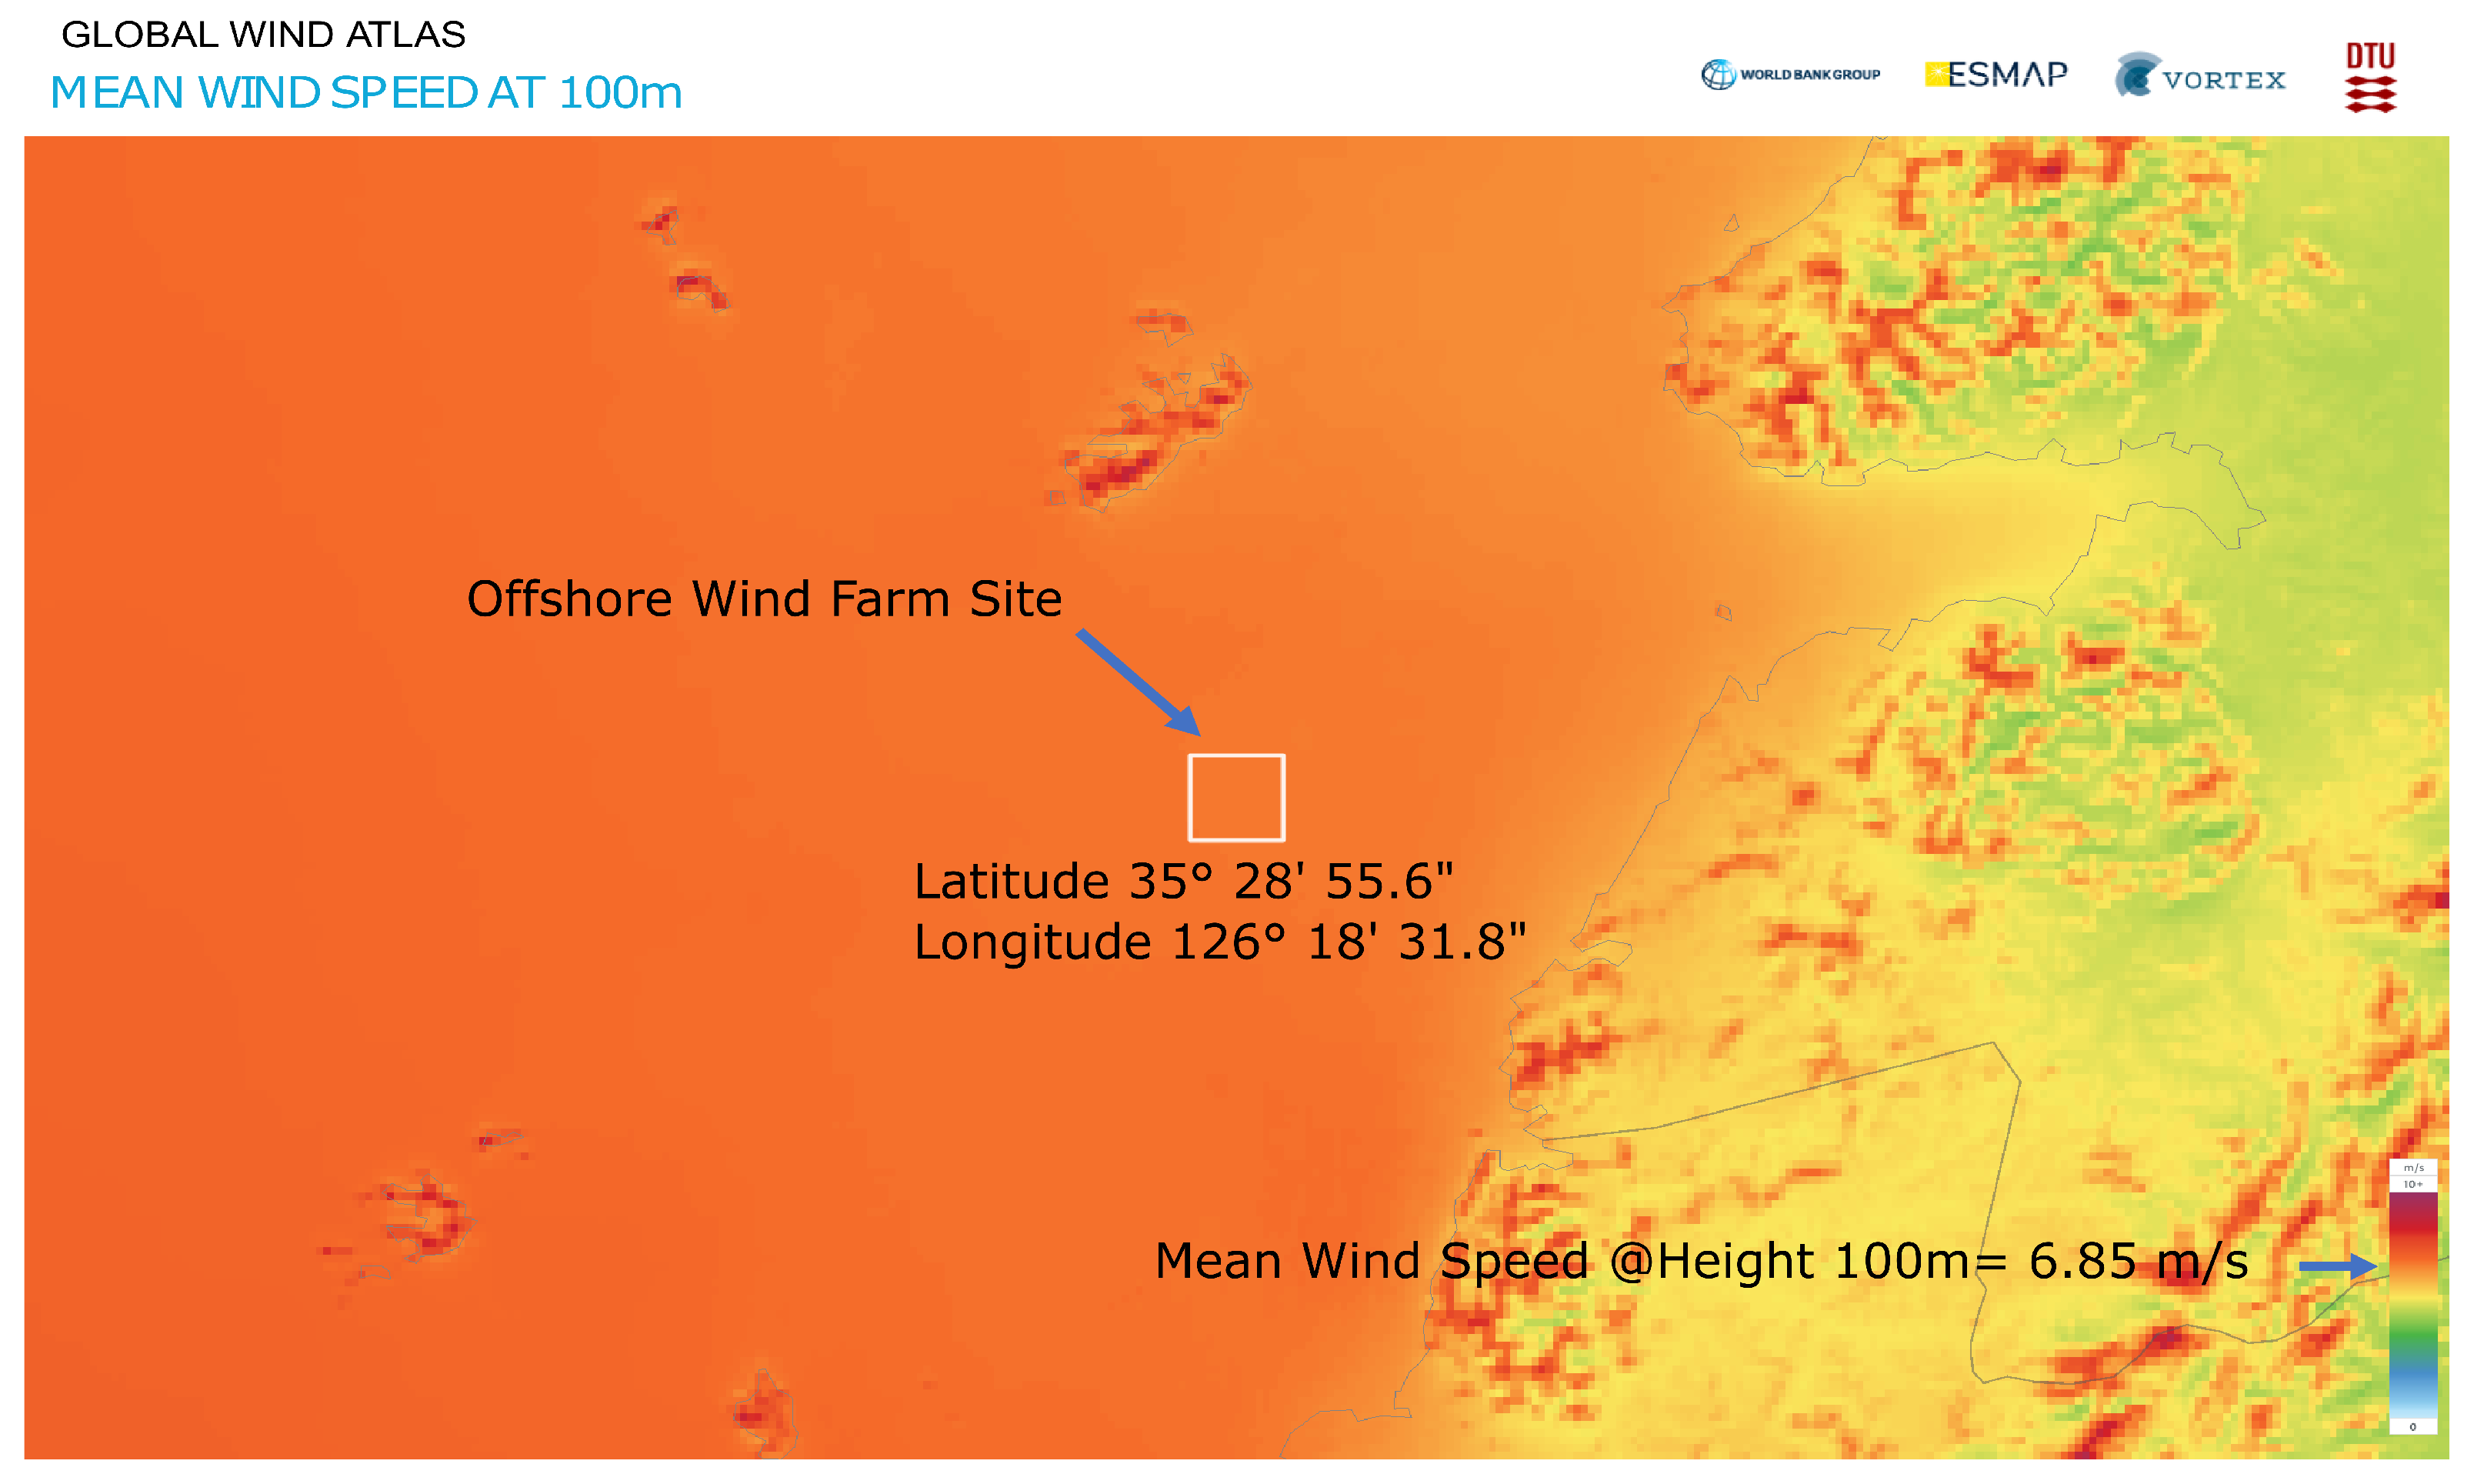
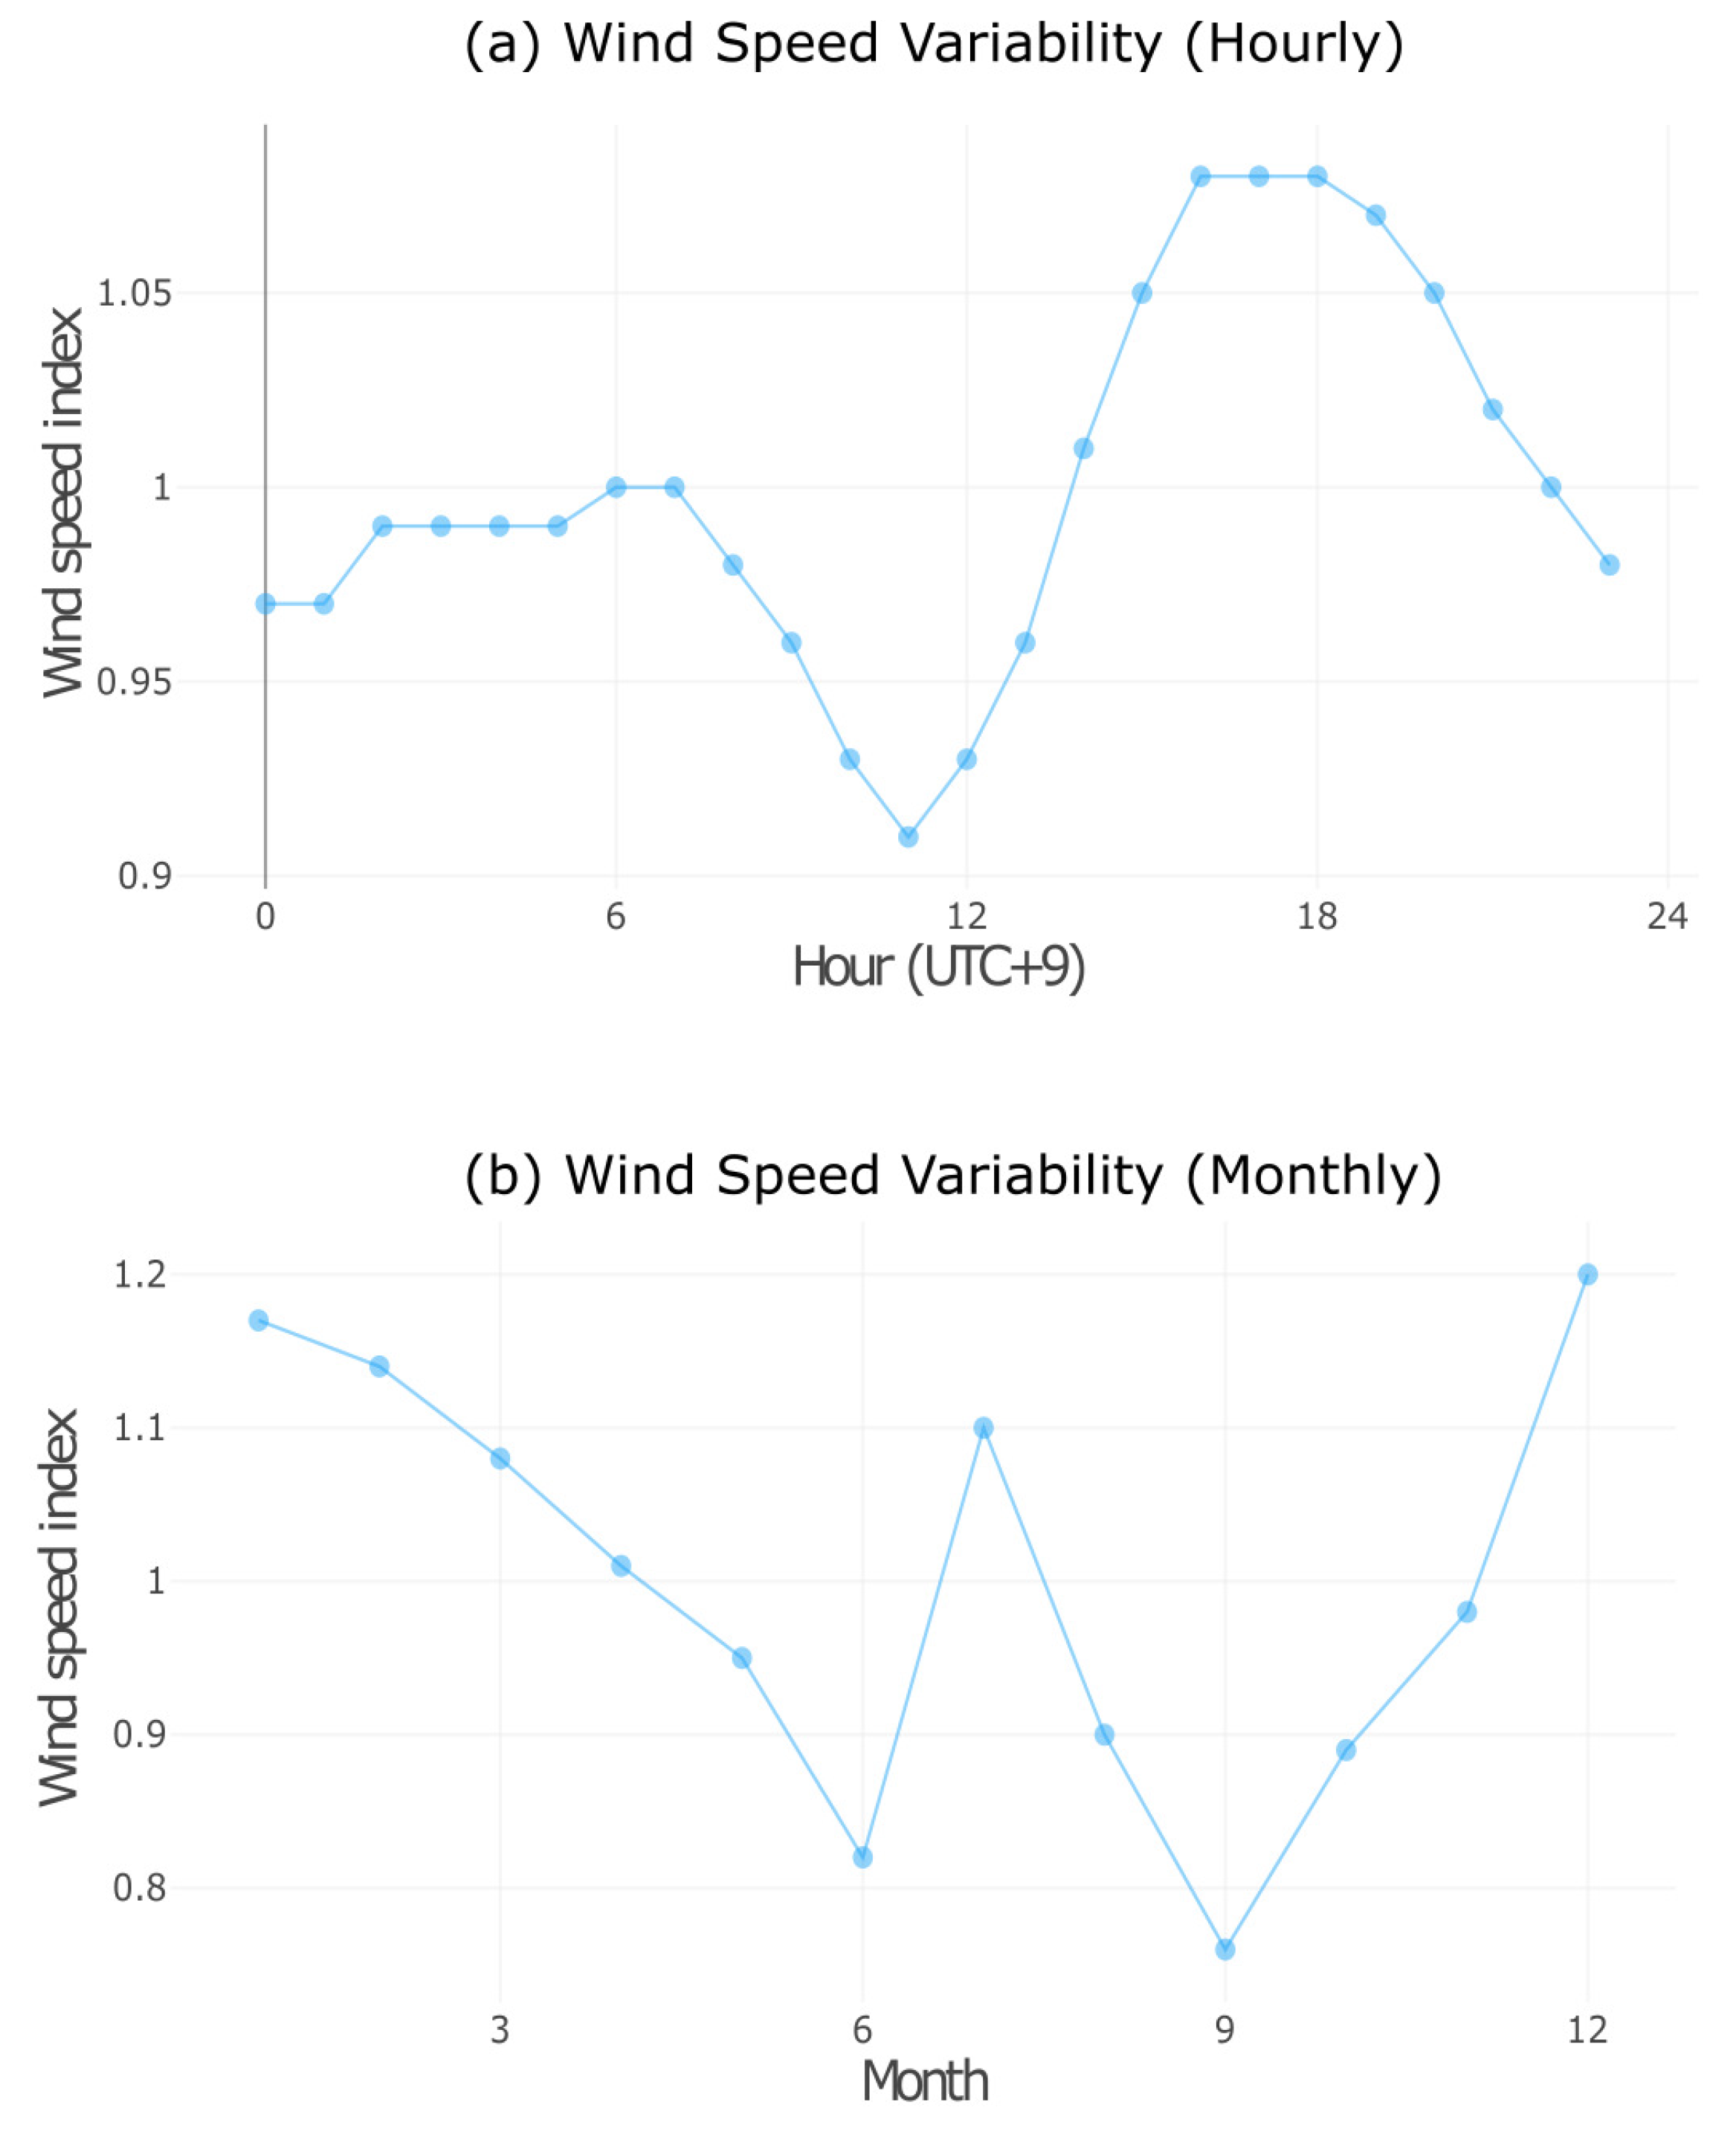
2.3. Real-Life Offshore Wind Farm

A 20-turbine offshore wind farm is considered. The distance between the turbines, whose rotor diameter is 134 m, is approximately 800 m, with 20 turbines arranged as depicted in Figure 4, which shows a Google Maps view of this real-life offshore wind farm project, and Figure 5 shows the mean wind speed at the site obtained from Global Wind Atlas [31]. This offshore wind farm is located at 35°28′55.6″ latitude and 126°18′31.8″ longitude. The depth at the site is around 10 m, while the distance from the southwest shore is approximately 12 km. Figure 6 shows the wind speed rose at the location, and gives details about wind speed at various directions.
The wind farm capacity is around 60 MW, each turbine being a 3 MW machine. The annual mean wind speed is 6.85 m/s at 100 m hub height at this location. The hourly wind speed index is around one most of the time, and it is shown in the wind speed variability curve in Figure 7a, obtained from the Global Wind Atlas. The monthly wind speed variability curve is shown in Figure 7b.

3. Wind Farm Controller

Aerodynamic interactions due to the wake effect make controlling wind farms a difficult task. The upstream turbine’s wake increases turbulence intensity while decreasing wind velocity. The downstream turbine power production is reduced as wind velocity slows, and turbine structural loading may increase as turbulence intensity rises [29]. Thus, wind farm controllers are designed to maximize the total wind farm power output by bringing down or redirecting the wake. WFSim allows the incorporation of wind farm control with a power production optimizer that permits the yaw angle and axial induction factor to be adjusted to optimize the output by ameliorating the wake effect.
The flowchart of the implementation of a dynamic wind farm controller is shown in Figure 8. In addition to ambient flow conditions and control mechanisms, the Wind Farm Layout block contains information on turbine position, turbine type, and so on. The details regarding wind direction, speed, and turbulence intensity are included in the Ambient Flow Condition block. The block Control Methods allows the wind farm control method, i.e., WRC, AIC, or a combination of the two, to be selected. Wake sub-models, wind direction probability information and an optimizer that optimizes the yaw angle, axial induction factor, or both are included in the Power Production Optimizer block. These optimized values are then forwarded to WFSim.
In Section 3.1, wake control strategies, i.e., AIC and WRC, are discussed. Section 3.2 discusses the power production optimizer, which optimizes the yaw misalignment angle or the axial induction factor in order to maximize the power production.

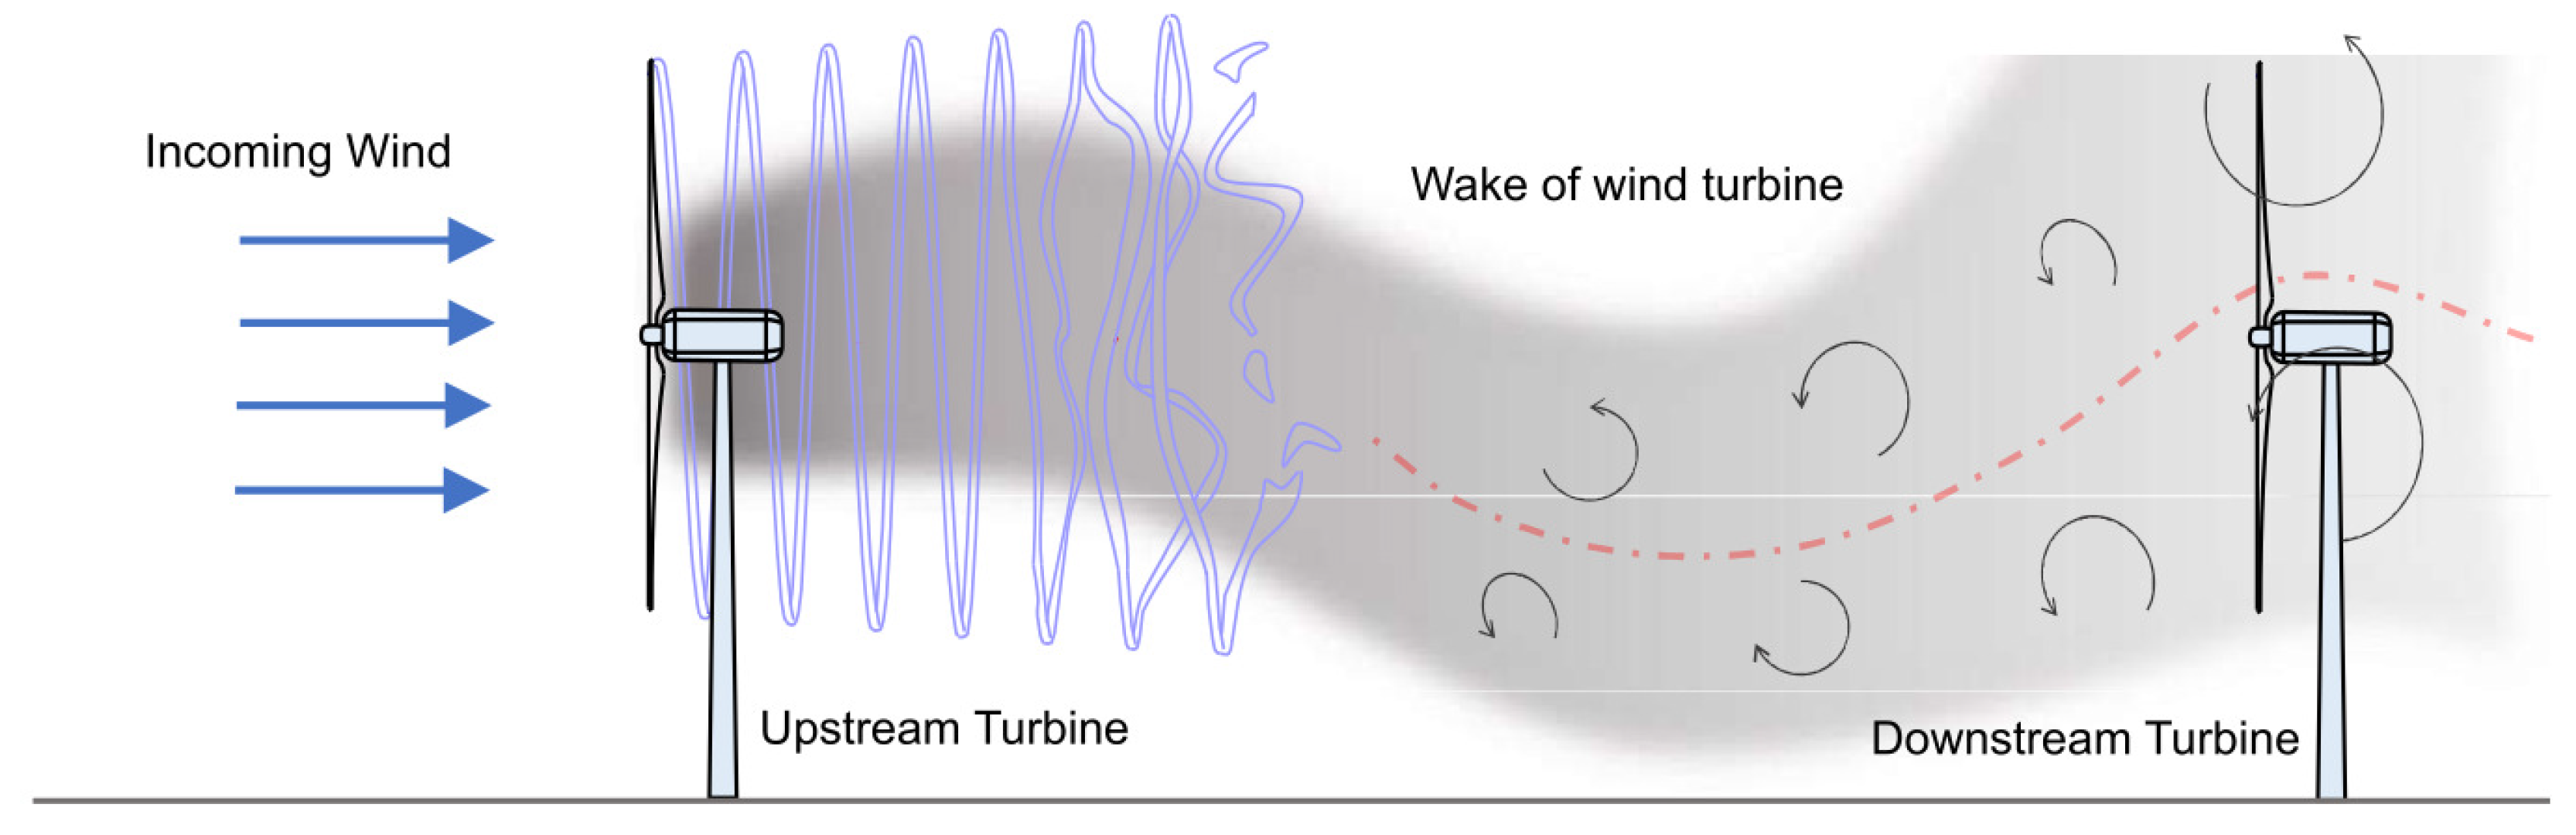
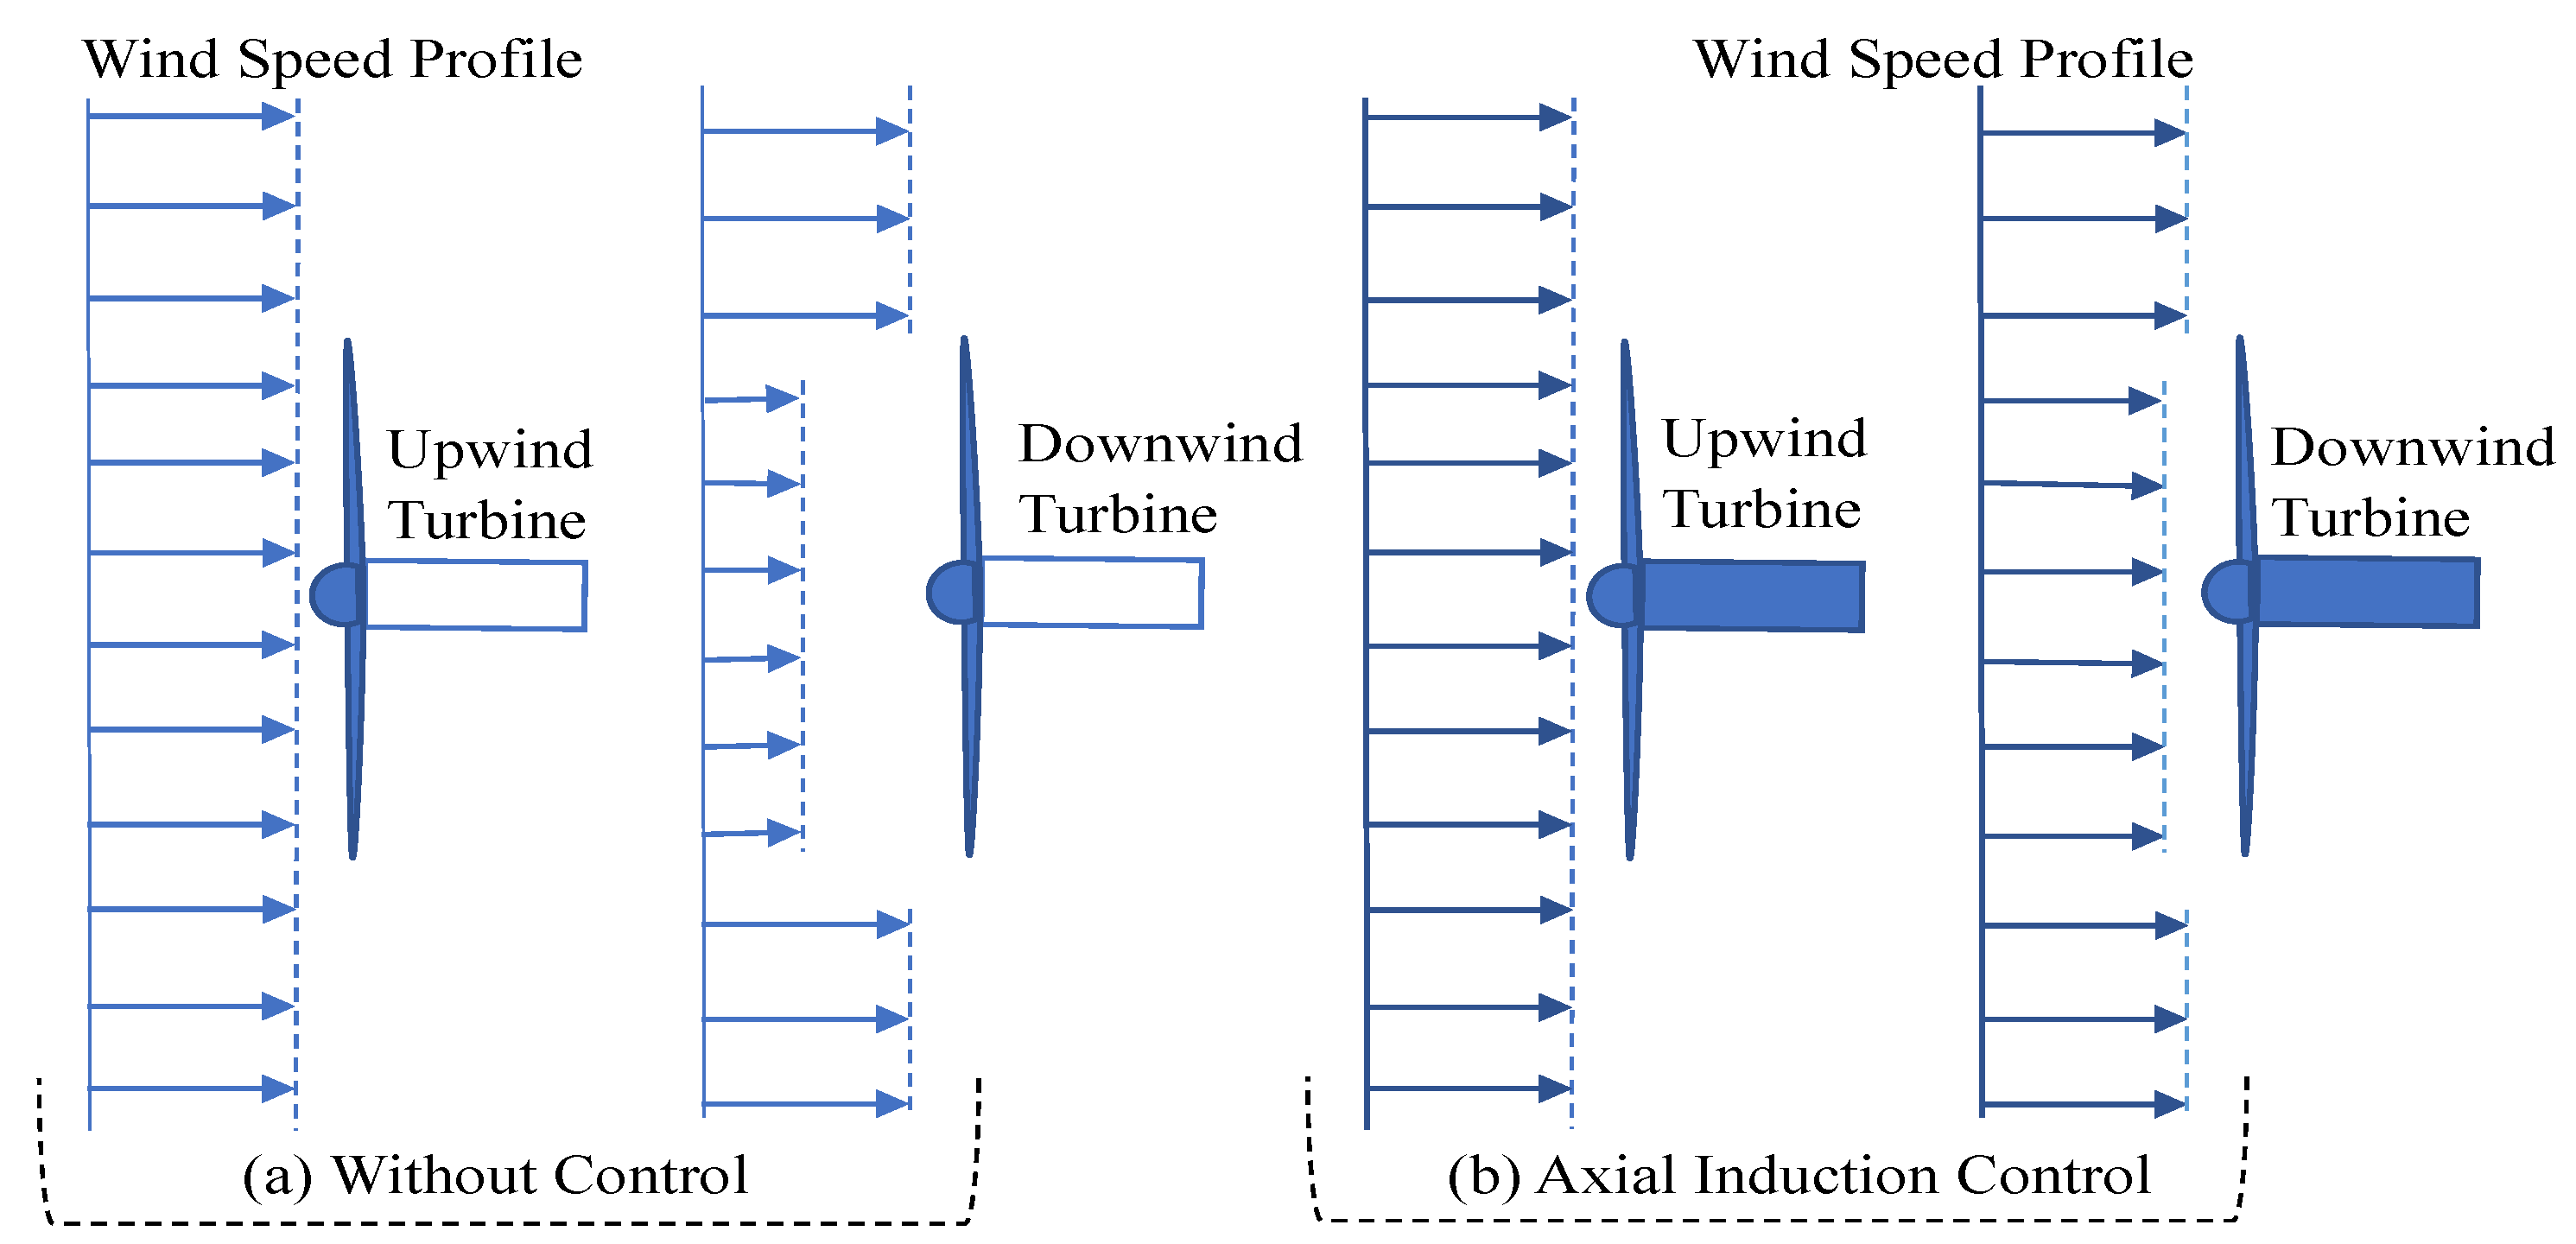
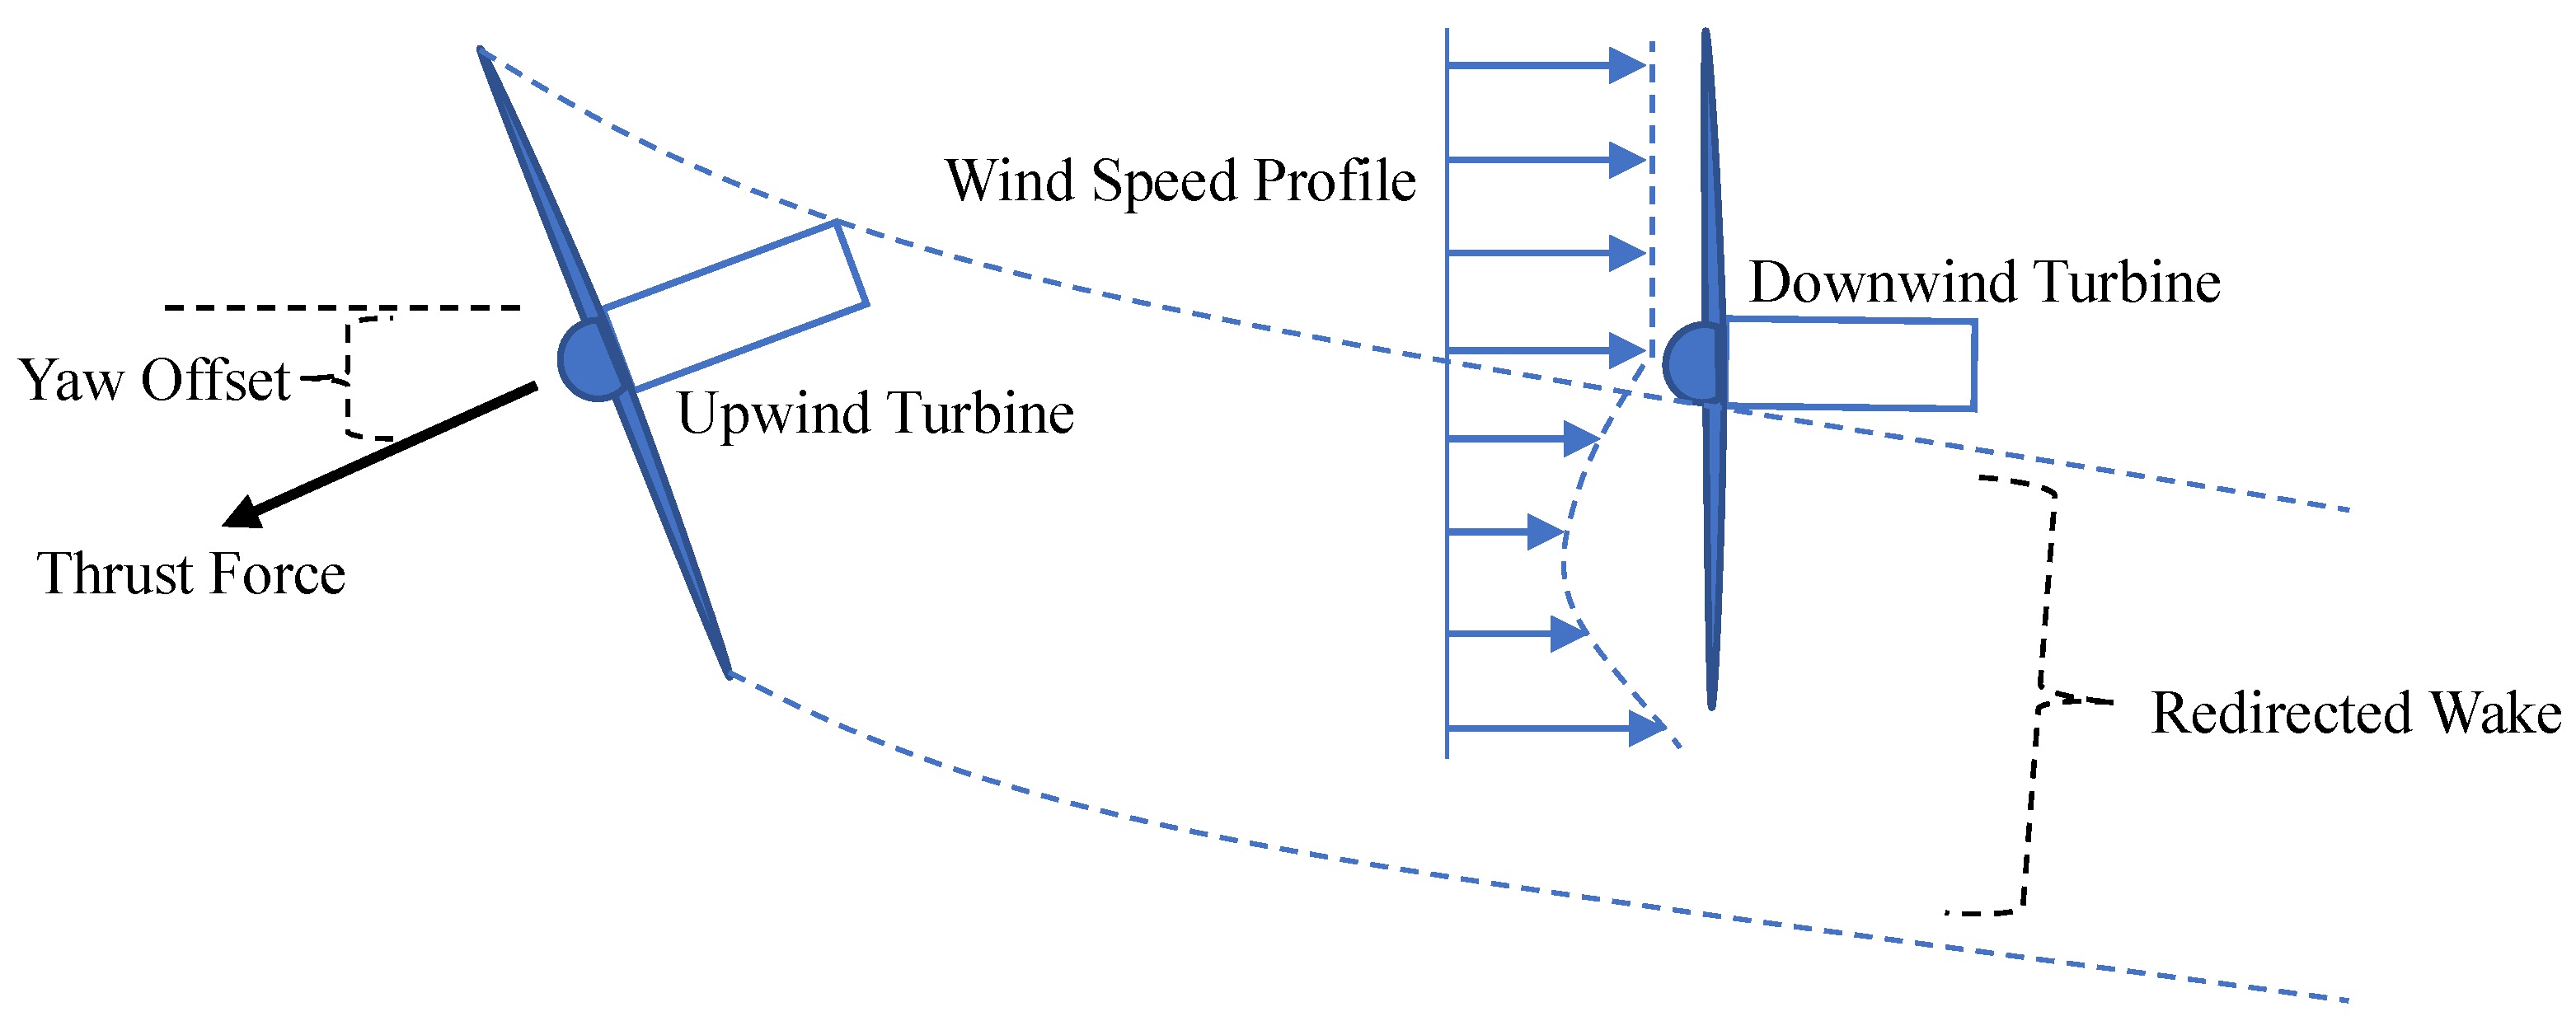
3.1. Wake Control Strategy

In wind farms, owing to the economic, logistic, and space limitation, it is not feasible to place turbines far enough from each other and this results in the various interactions between turbines. These interactions have a significant impact on downstream turbines in the wake, which affects the entire performance of the turbines, including their efficiency and structural loading. These wake interactions cause a velocity deficit, resulting in a drop in the downstream turbine power production.
The power loss is associated with spacing between turbines in the wind farm and some studies show a power reduction of up to 23% [32]. The power loss is more severe concerning the first downstream turbine that immediately follows the upstream turbine. Nearly the same effect can be observed for the remaining downstream turbines, but this effect is gradually reduced downstream [33]. This can be observed in Figure 9, which shows the normalized power along the rows of the Horns Rev wind farm in Denmark [34] as an example.
The wake also increases the fatigue loading on the downstream turbines, thereby potentially reducing the lifespan of the turbines [3]. To mitigate these effects to some degree, the following wind farm control strategies are employed: (i) AIC and (ii) WRC [18].

3.1.1. Axial Induction Control

The main purpose of AIC is to derate the turbine by pitching, tilting, or both [10]. This directly results in changes in the power production and a wake velocity deficit. The fractional reduction in wind speed between inflow and rotor is known as the axial induction factor [17]. When AIC is in use, the power generated by the upstream turbines can be reduced by modifying the axial induction factor a n , thereby increasing the power produced by the downstream turbine. In this research, the axial induction factor is controlled by varying the pitch and generator torque demand. Mathematically, thrust force [17] applied on the flow field f, is expressed as follows:
f = 1 2 ρ A C T ( β , λ ) U 2
where A is the swept area, ρ is the air density, C T is the thrust coefficient, λ is the tip speed ratio, β is the blade pitch, and U is the flow velocity. Assuming there is no wake recovery, the flow velocity in the wake is given by [17]:
U w a k e = U ( 1 2 a n )
where a n is linked to thrust coefficient C T through the following relationship:
a n = 1 2 ( 1 1 C T )
Figure 10 represents a schematic overview of the AIC strategy [18]. Wind turbines under normal operating conditions, i.e., without any wind farm control action, are shown in Figure 10a. The length of the arrows represents the magnitude of the wind speed, and it is demonstrated that the upstream turbine operates to extract the most power from the wind, causing the wind speed experienced by the downstream turbine to be weakened, as indicated by the small arrows. When AIC is activated, as shown in Figure 10b, the upstream turbine is derated, increasing the speed of the wind approaching the downstream turbine in comparison to normal operation. As a result, even though the power produced by the upstream turbine is reduced, the overall wind farm power production may increase.

3.1.2. Wake Redirection Control

The objective of the WRC strategy is to redirect the wake away from the downstream turbine. In the intentional yaw misalignment method, the transverse force created with the incoming wind redirects the wake away from the downstream turbine [10]. As a result, the downstream turbine may generate more power, and the overall power output of the wind farm could be raised.
Figure 11 illustrates a typical WRC strategy for a wind farm of two turbines [6]. The upstream turbine has a yaw offset such that the wake from the downstream turbine is redirected. The length of the arrow corresponds to the wind speed magnitude. The wake is redirected toward the yaw offset direction of the upstream turbine, affecting a portion of the downstream rotor. As depicted in the figure, the portion of the downstream turbine outside the wake experiences higher wind speed.

3.2. Power Production Optimizer

The power production optimizer uses the probability of occurrence of the wind direction by considering the wind direction range and standard deviation in the wind direction. The optimization algorithm considers wind speed, wind direction, turbulence intensity, velocity deficit, and dynamic atmospheric situations to improve the power output. When a wind farm is under greedy control strategy [6], i.e., under normal operating conditions, all the turbines operate to produce the maximum power, but this can result in a strong wake behind the upstream turbines. This wake eventually reduces the power production of the downstream turbine. An optimal selection of yaw angle or axial induction factor or both can boost the production of the downstream turbine. It is assumed that the overall wind farm power output is the sum of each turbine’s power output for wind farm production maximization, through optimization of the yaw angle or the axial induction factor. The objective function corresponding to the conventional optimization method that finds the optimal value of yaw misalignment or axial induction factor for maximizing wind farm power for a specified wind direction is given by the following equation [4]:
X o p t ( θ ) = argmax X n = 1 N T P n ( x 1 , x 2 , . . . . . . , x n , θ )
where P n is the power developed by each turbines and θ denotes the wind direction.
Owing to the unreliability of the wind direction measurement, another robust yaw angle optimization technique is considered in which the wind direction’s probability of occurrence is considered. So, here a probability density function ρ ( θ ) is considered and the corresponding objective function is given by the following equation.
X o p t ( ρ ( θ ) ) = argmax X 0 2 π ρ ( θ ) n = 1 N T P n ( x 1 , x 2 , . . . . . . , x n , θ ) d θ
where ρ ( θ ) denotes the probability density function.
This is a gradient-based method designed for continuous objective and constraint functions with continuous first derivatives; it looks for the minimum of constrained multi-variable function. The cost function is the whole wind farm power output in Equation (9) while the control variables, i.e., yaw angle and axial induction factor, are the ones altered to optimize the objective function. The lower and upper bounds of the optimization variables are the only constraints imposed. The lower and upper bounds of the yaw angle are 0° and 30°, respectively, and those of the axial induction are 0 and 1/3, respectively.

4. Simulation Results and Discussion

The WFSim is implemented using MATLAB. First, a virtual wind farm with two turbines is studied with 3D to 10D spacing between the turbines, and an increase in power is estimated when the WRC approach stated in Section 3.1.2 is applied for different spacing. Second, when the optimal WRC and AIC procedures described in Section 3.1 are utilized, a real-life offshore wind farm with 20 turbines is investigated.

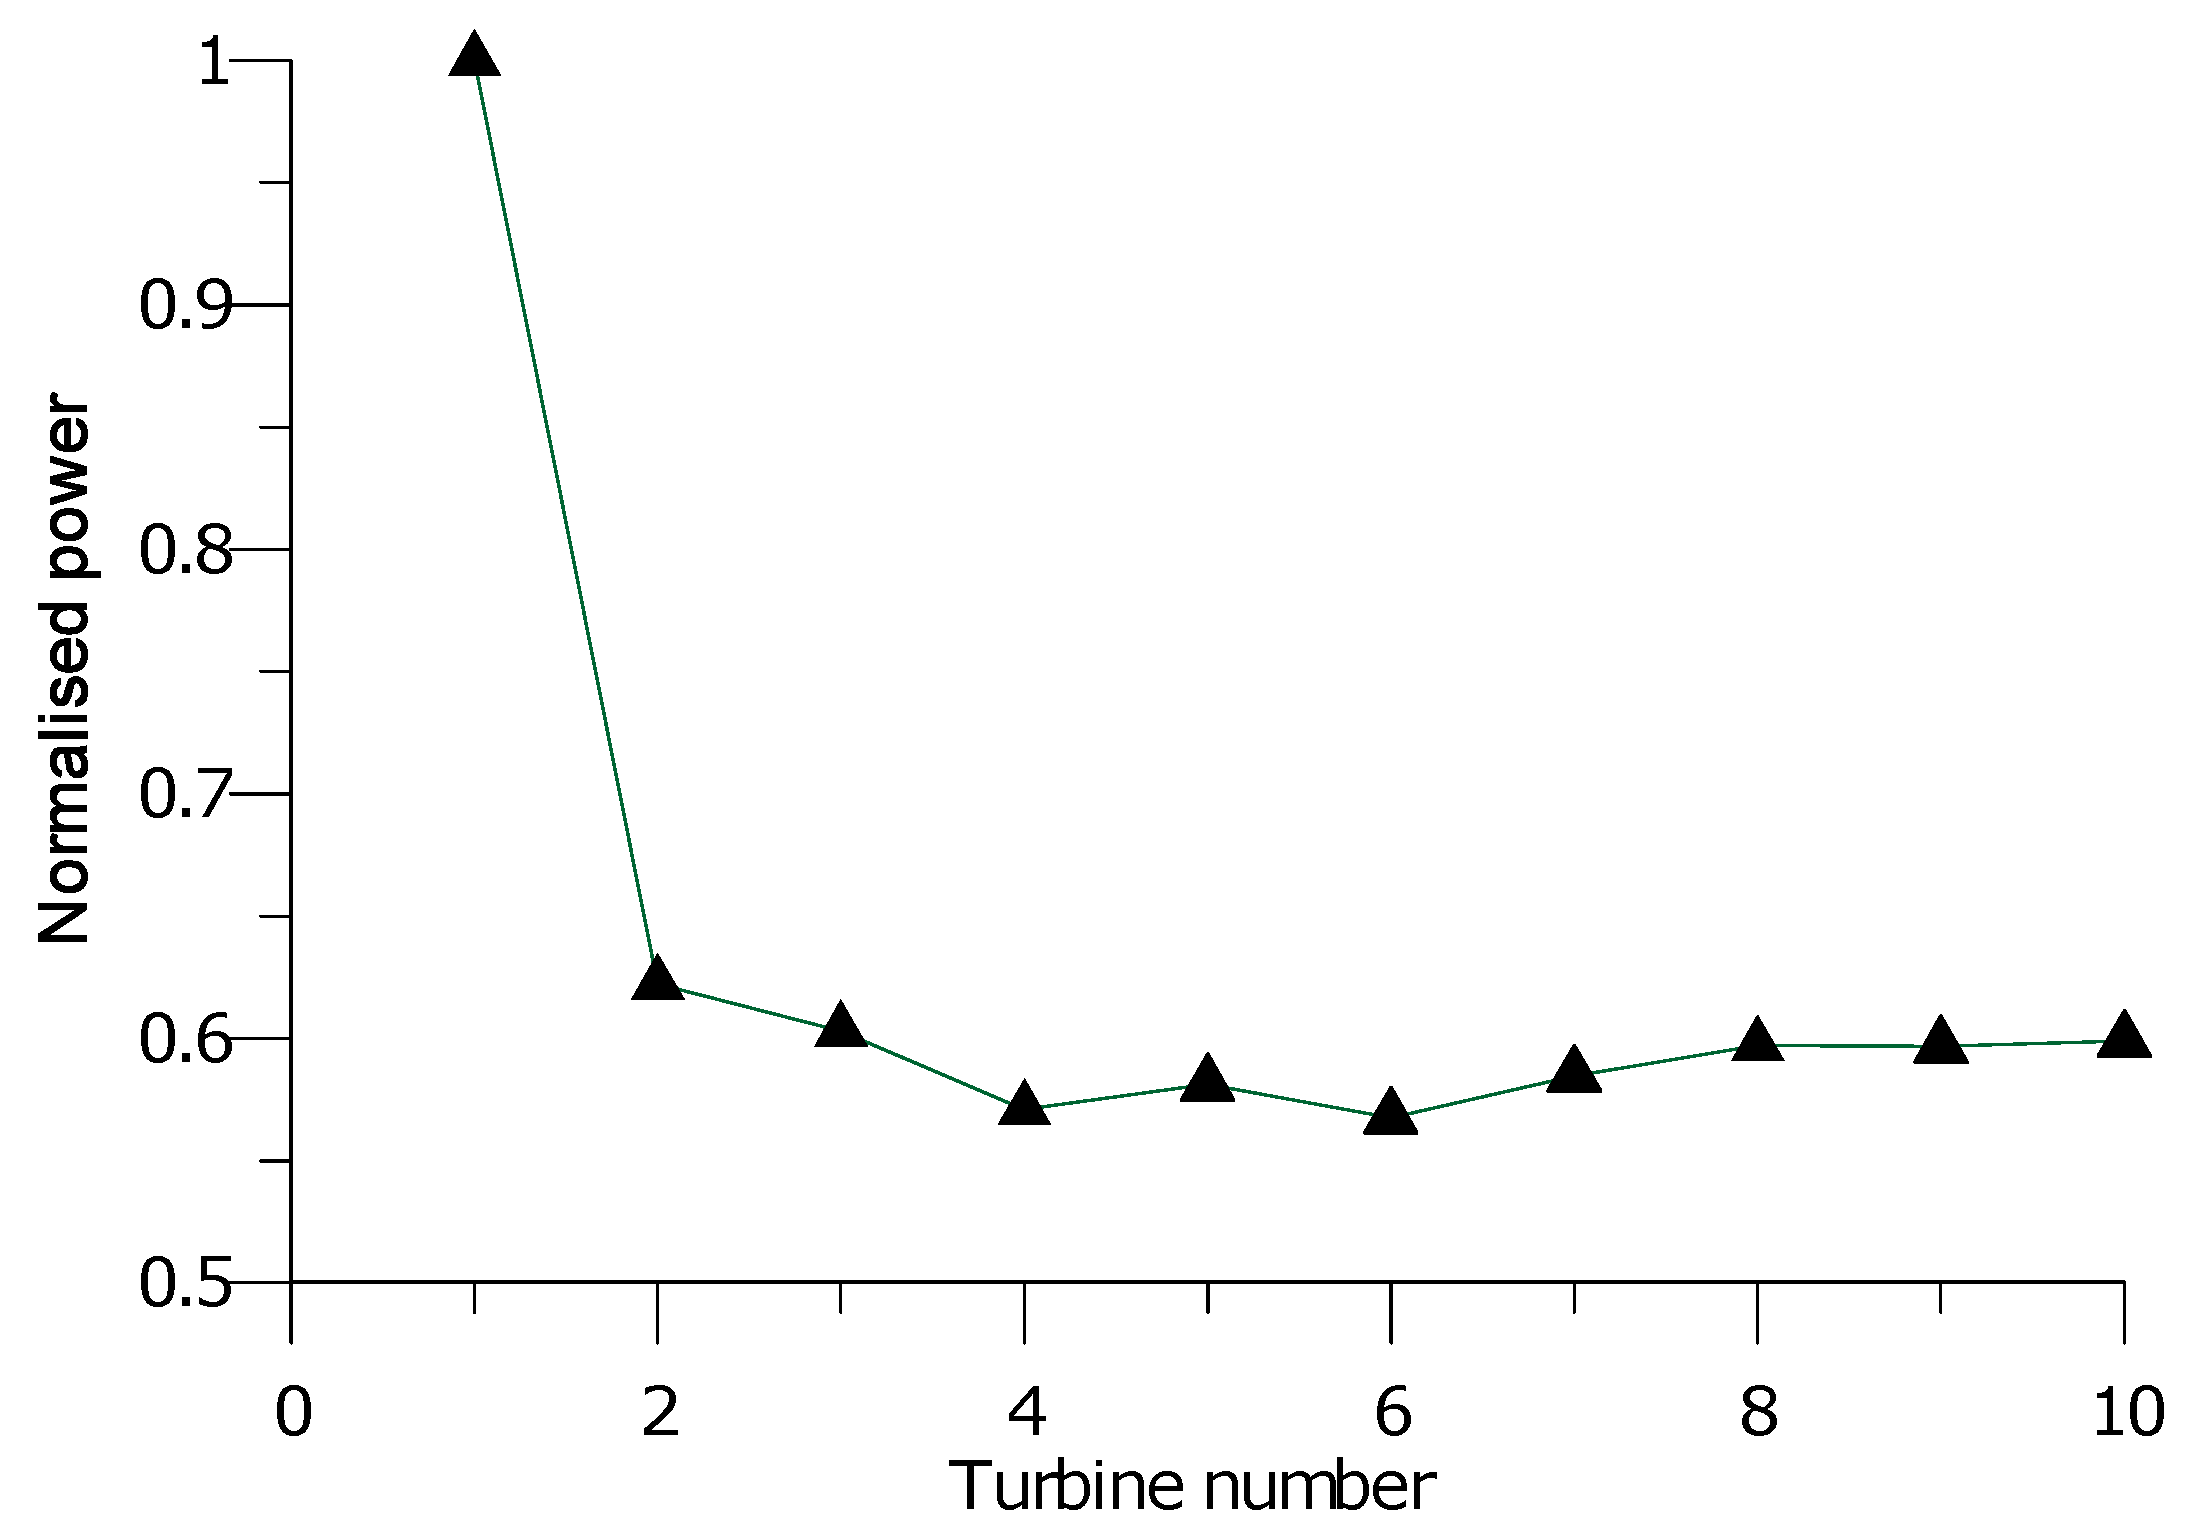
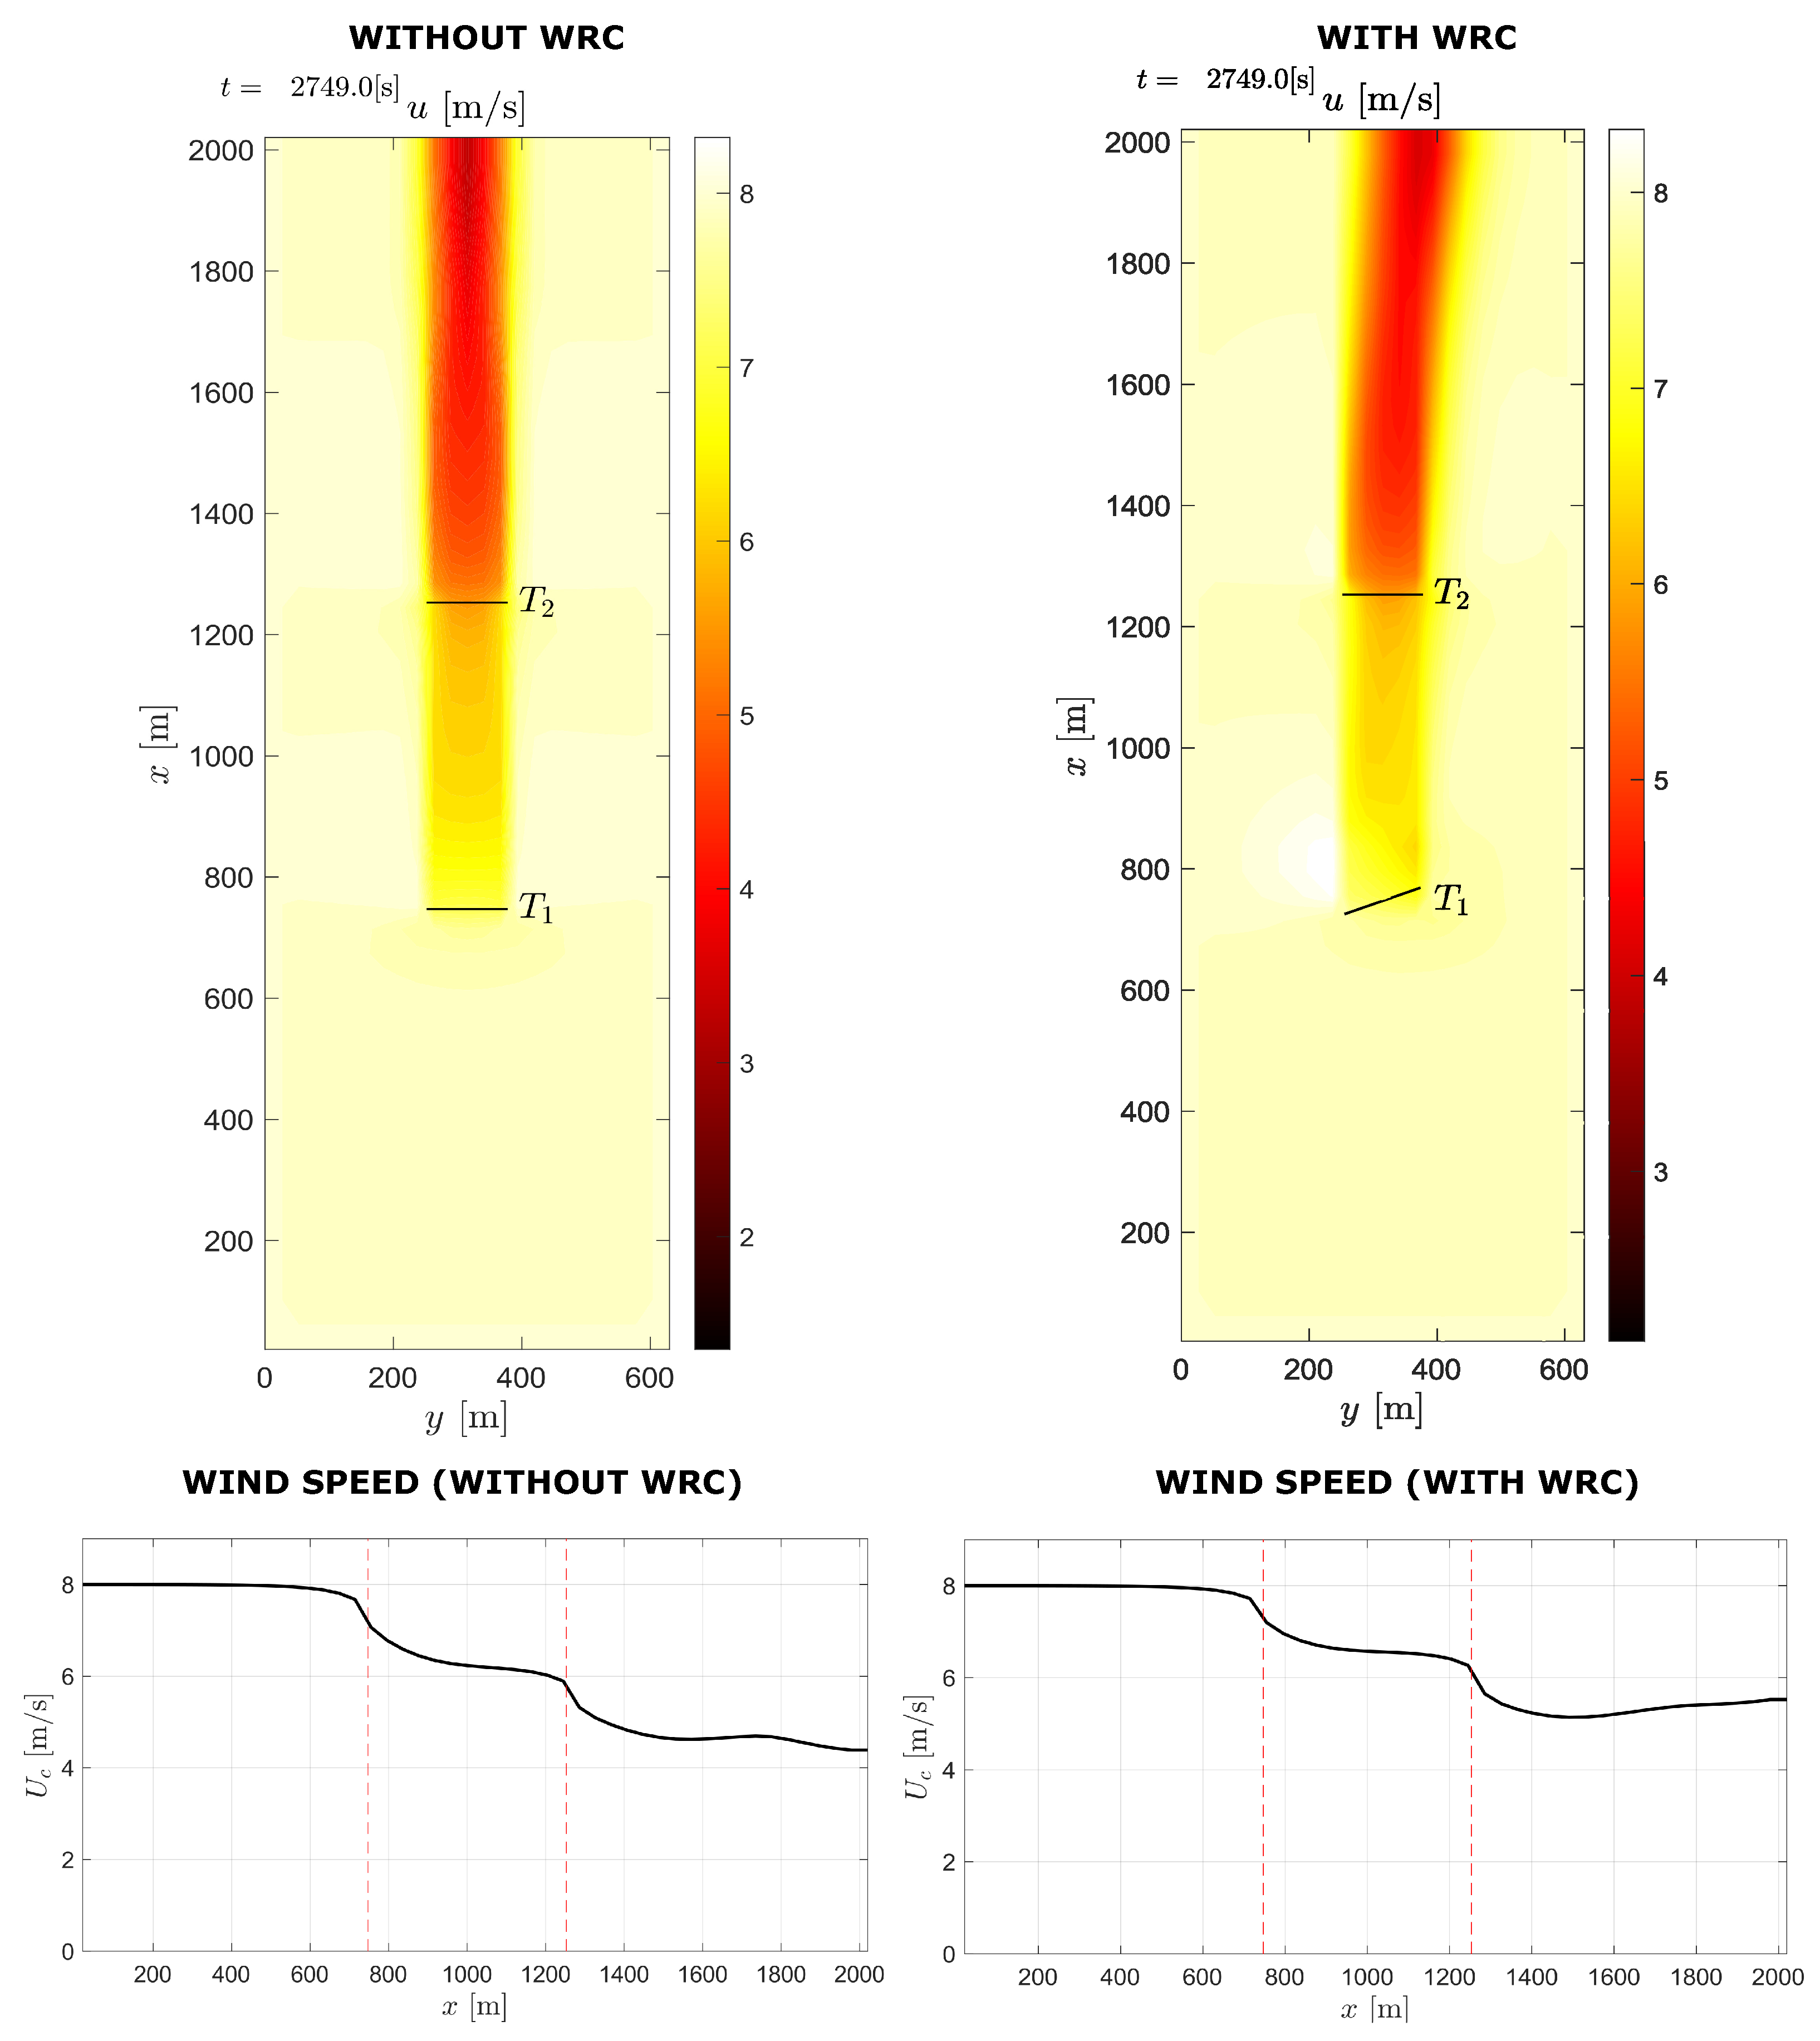
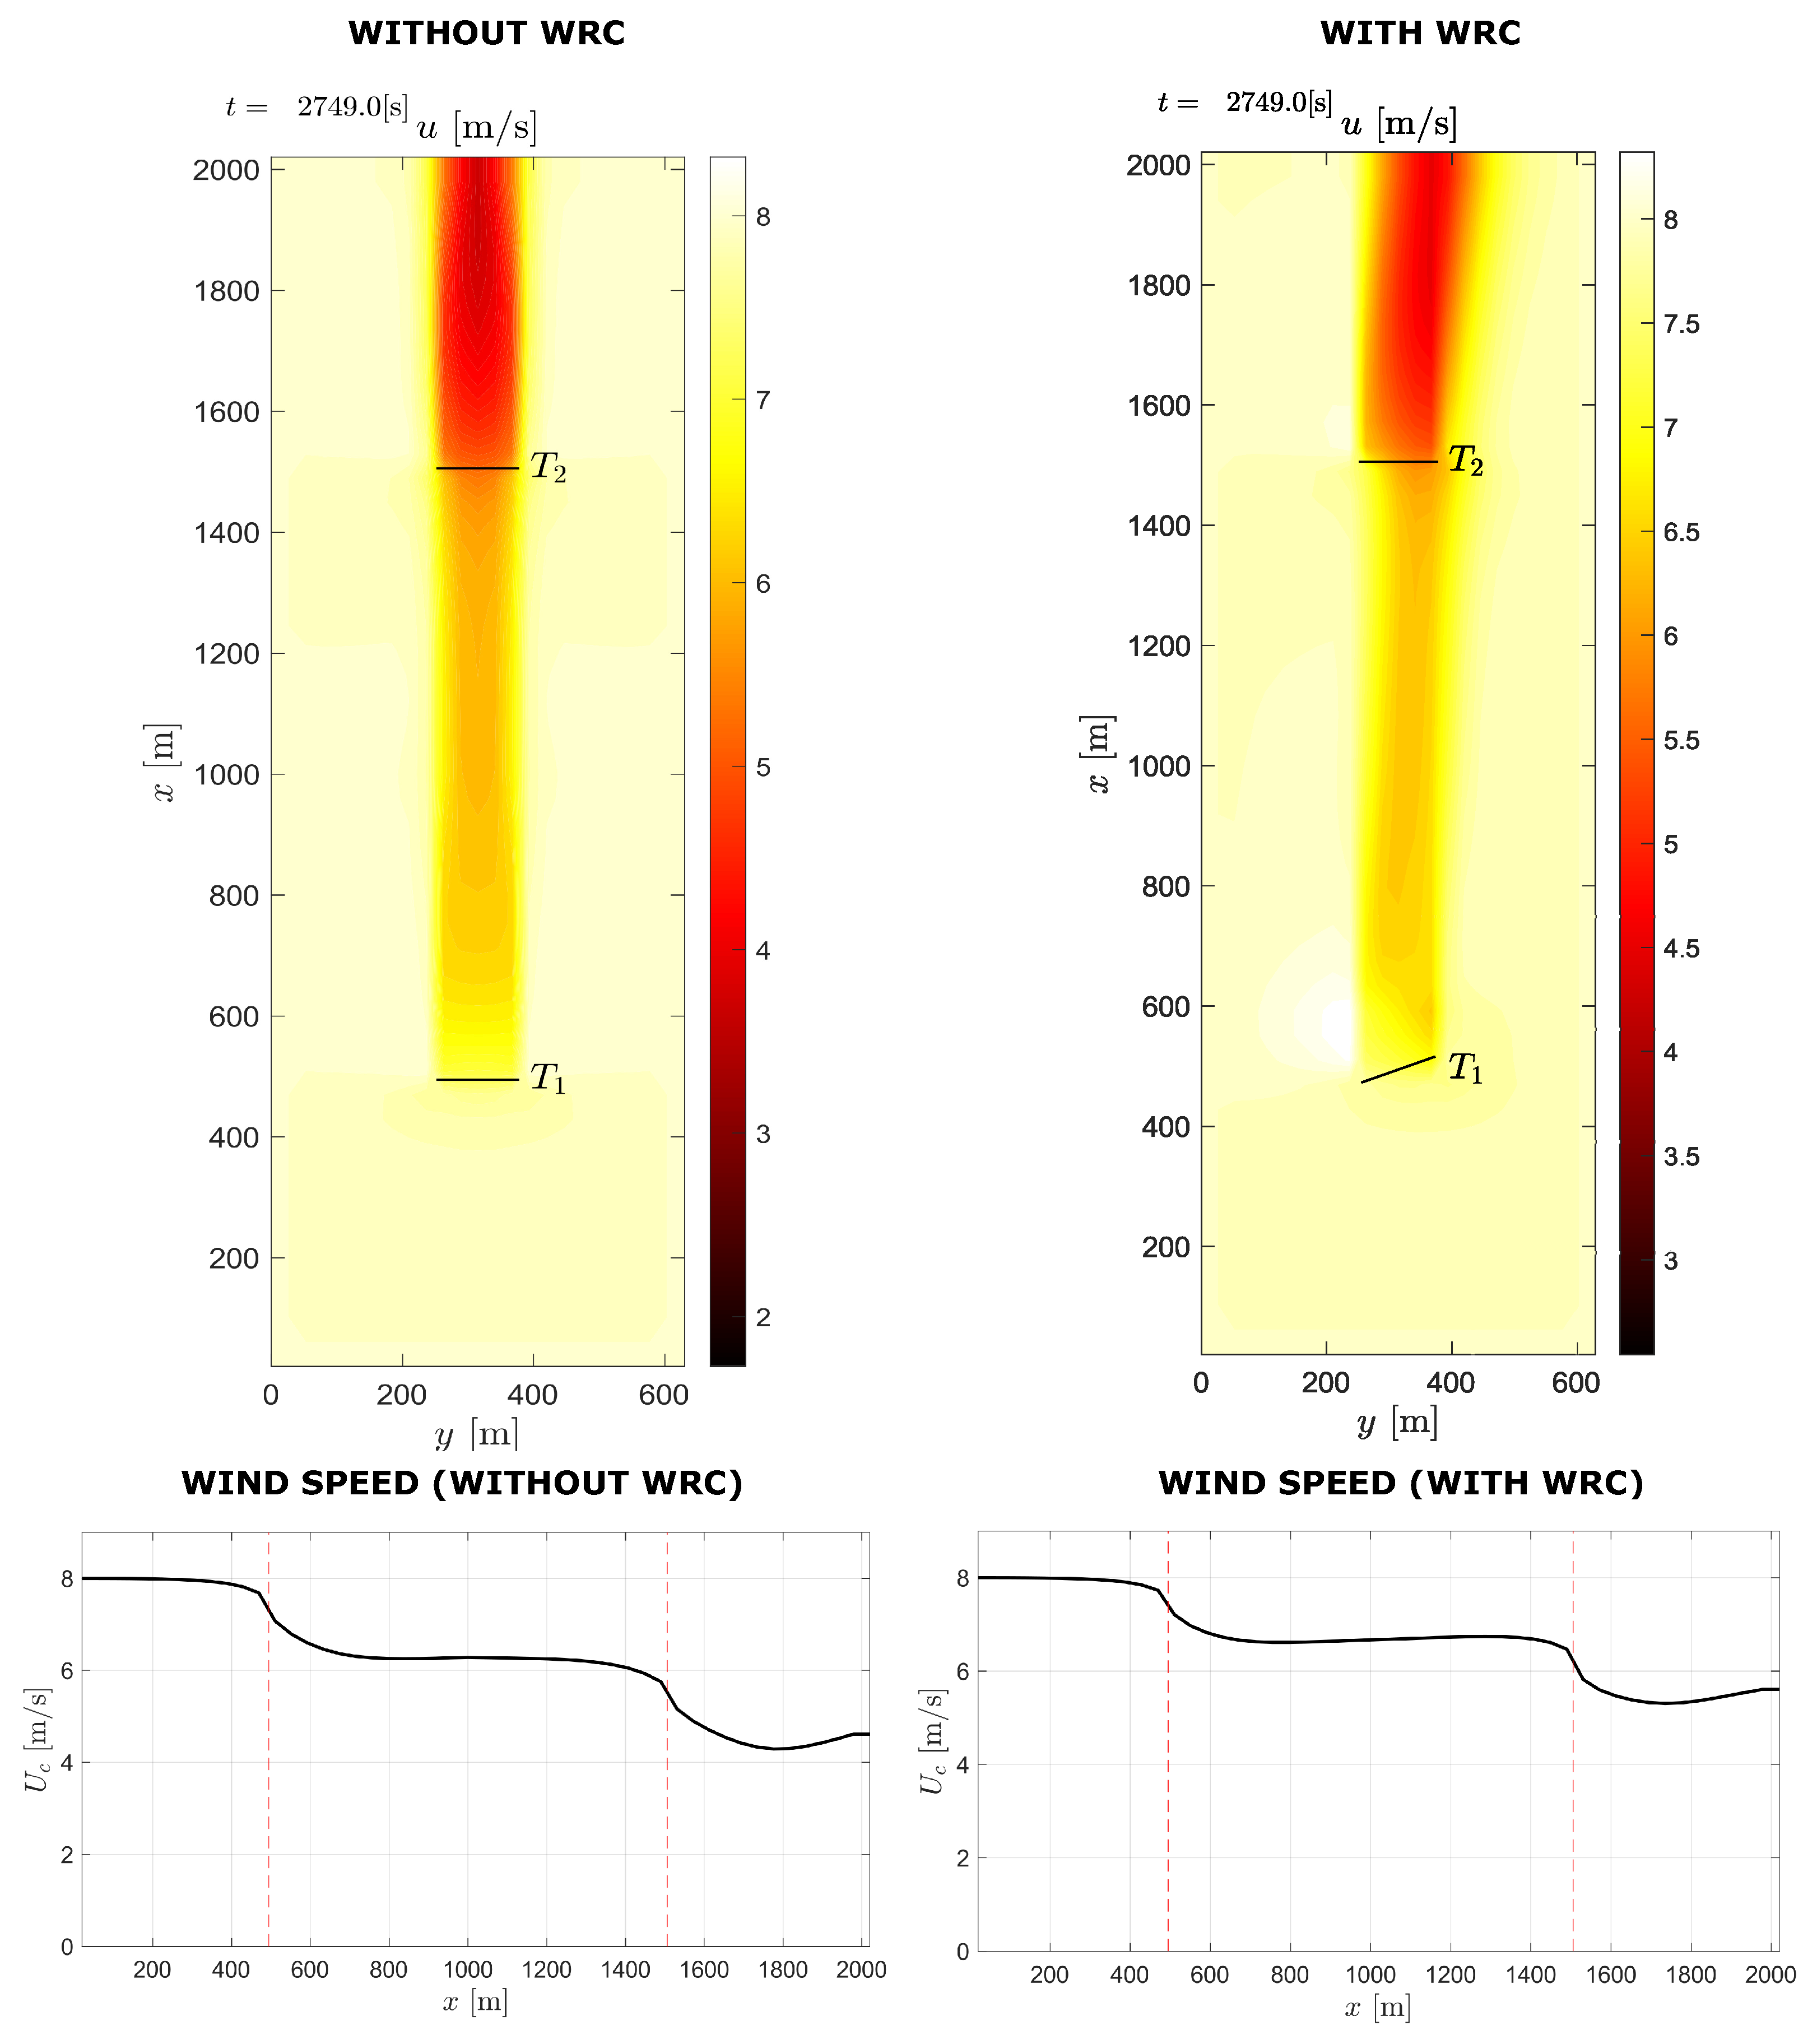
4.1. Two-Turbine Case

In this case, the wind farm of two turbines discussed in Section 2.2 is considered. The diameter of the wind turbine is 126.4 m and the simulation is performed at 8 m/s [26]. In this paper, the wind farm of two turbines is only developed to investigate the impact of varying the spacing between turbines on the wind farm power production with and without incorporating the WRC. The results are included in Table 1. When the spacing between the turbines is increased, the power production increases as expected. However, because of space constraints and other economic considerations, increasing the distance between turbines beyond a certain point is not feasible. The percentage gain in power can be improved while the WRC is in action.
In Figure 12, dynamic simulation results for two-turbine wind farm with 4D spacing under normal operating conditions and when the WRC strategy is used are compared. When WRC is used, the wind speed approaching the downstream turbine increases, as seen in the diagram. Figure 13 shows the flow field diagram and wind speed curve for the two-turbine wind farm with and without WRC for 8D spacing. According to the figure, the mean wind speed is reduced between the turbines because of the wake effect, and under WRC the mean wind speed is improved.

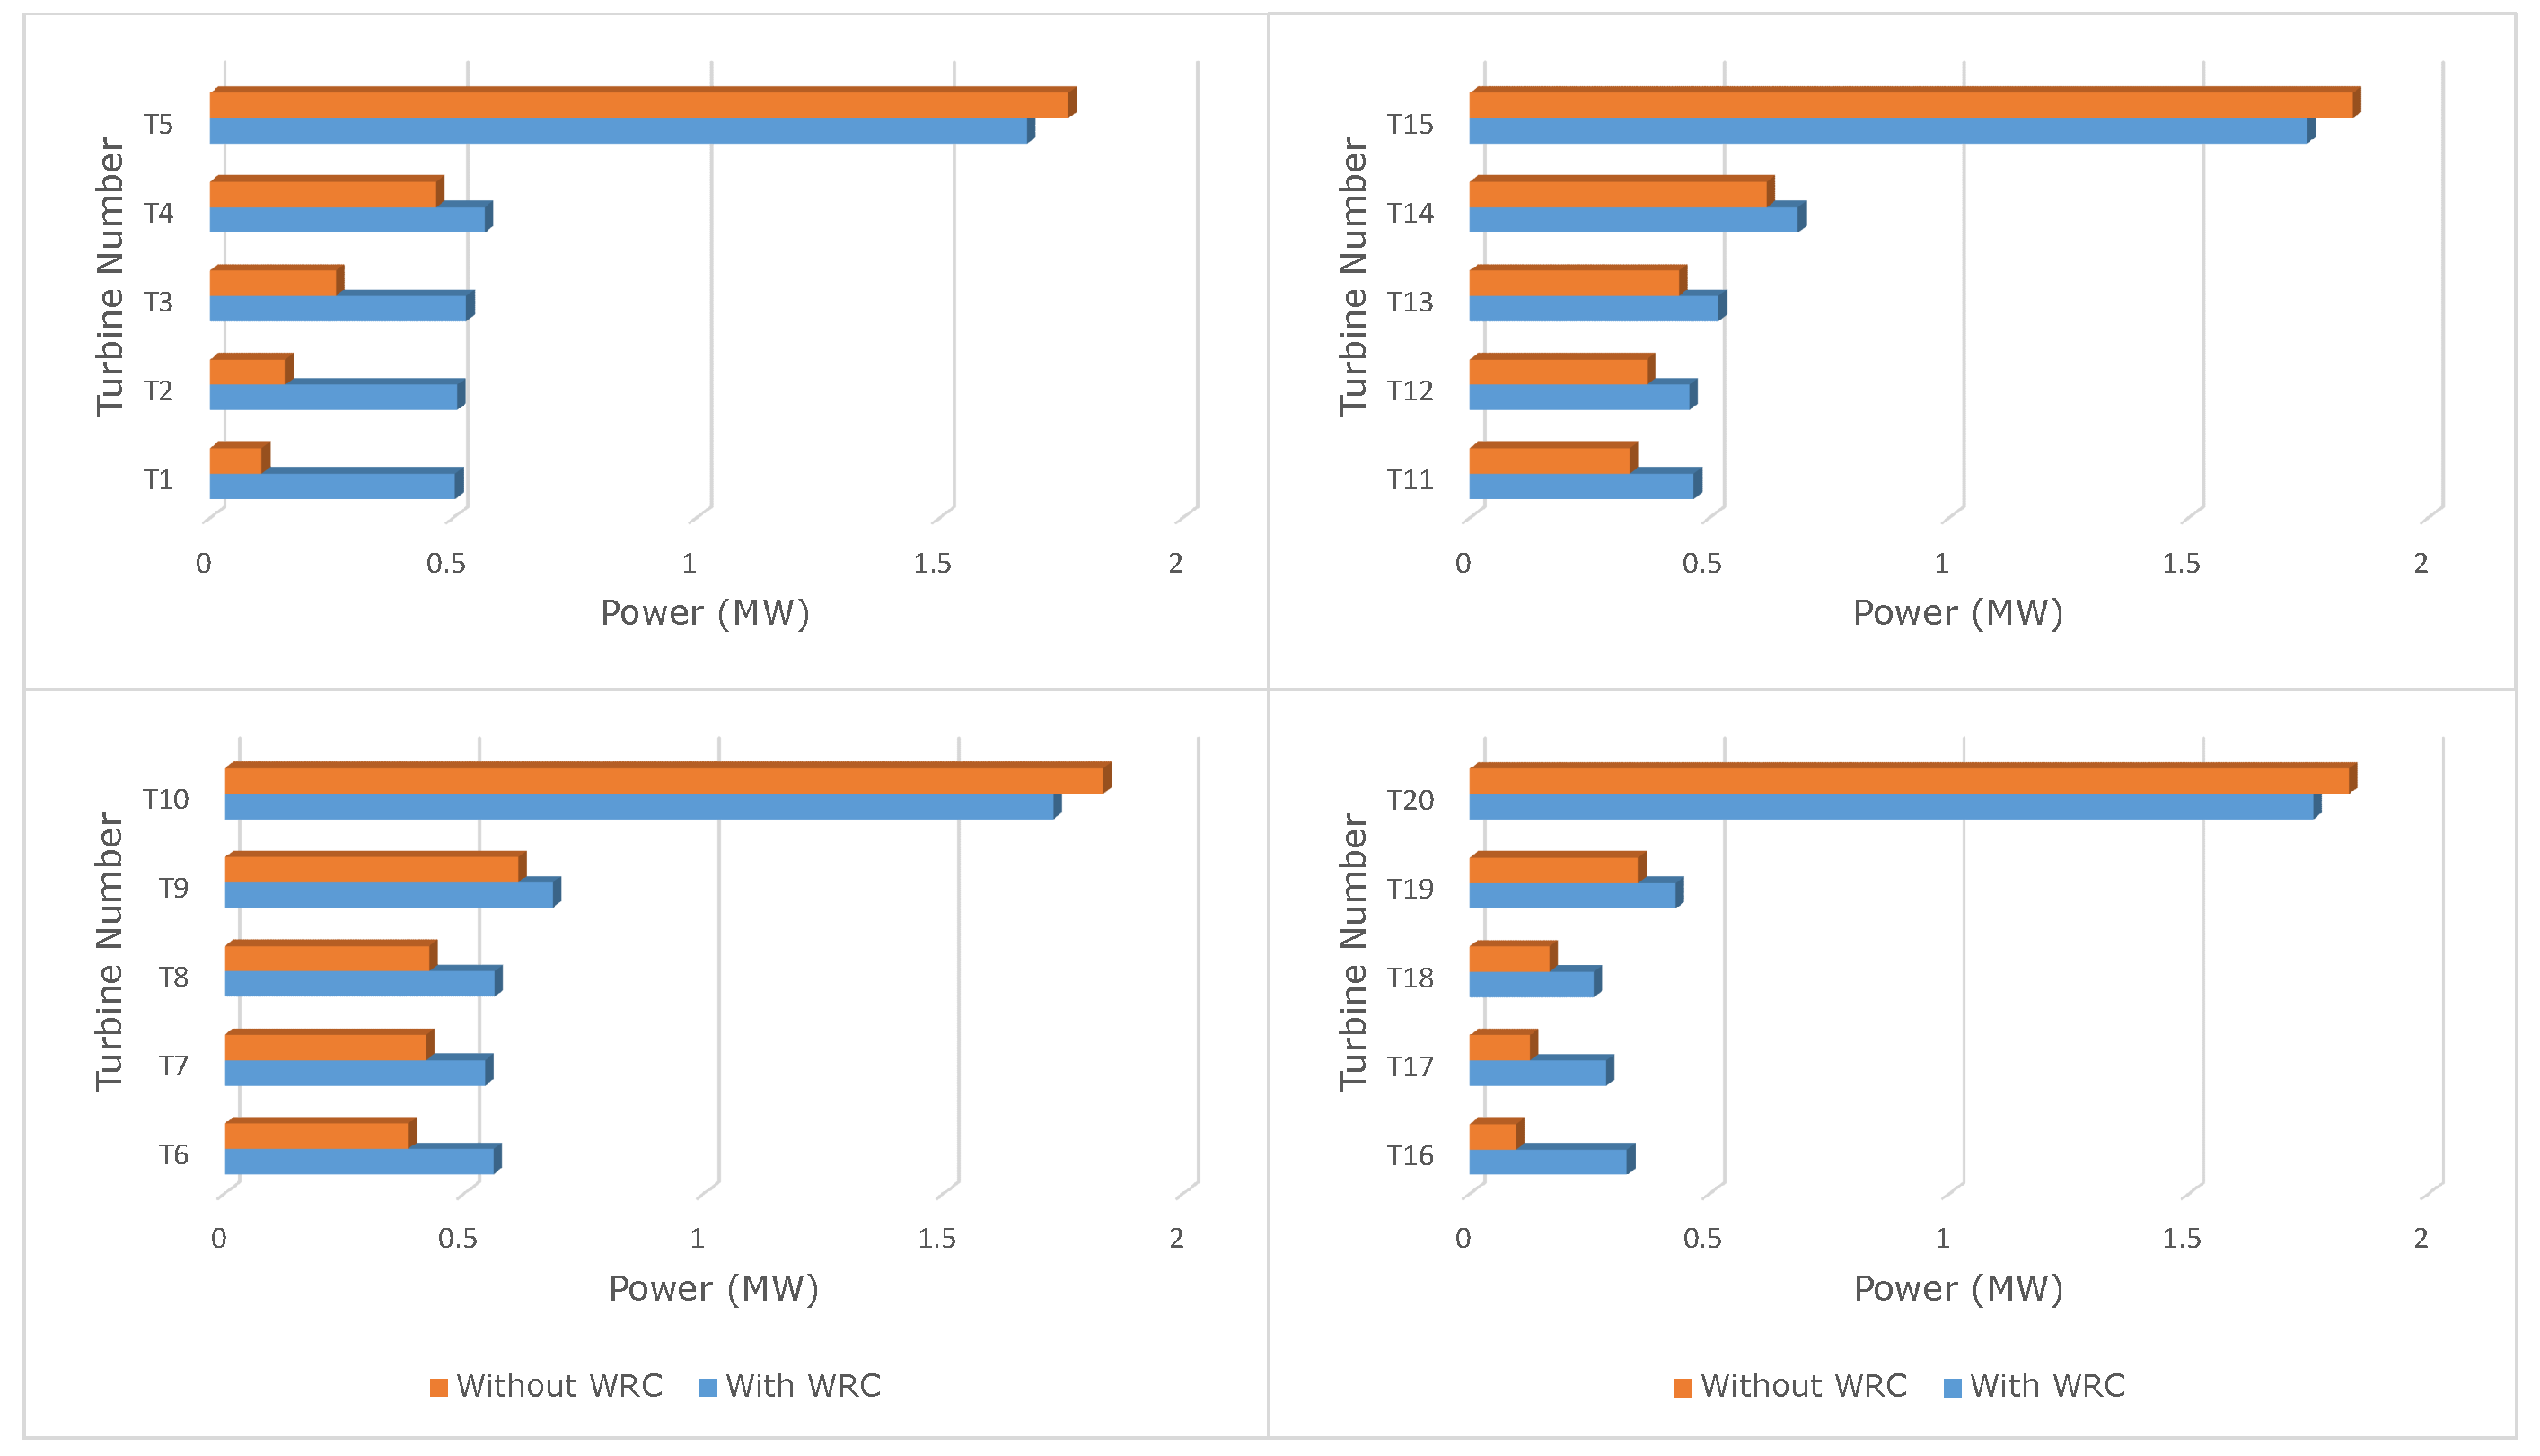
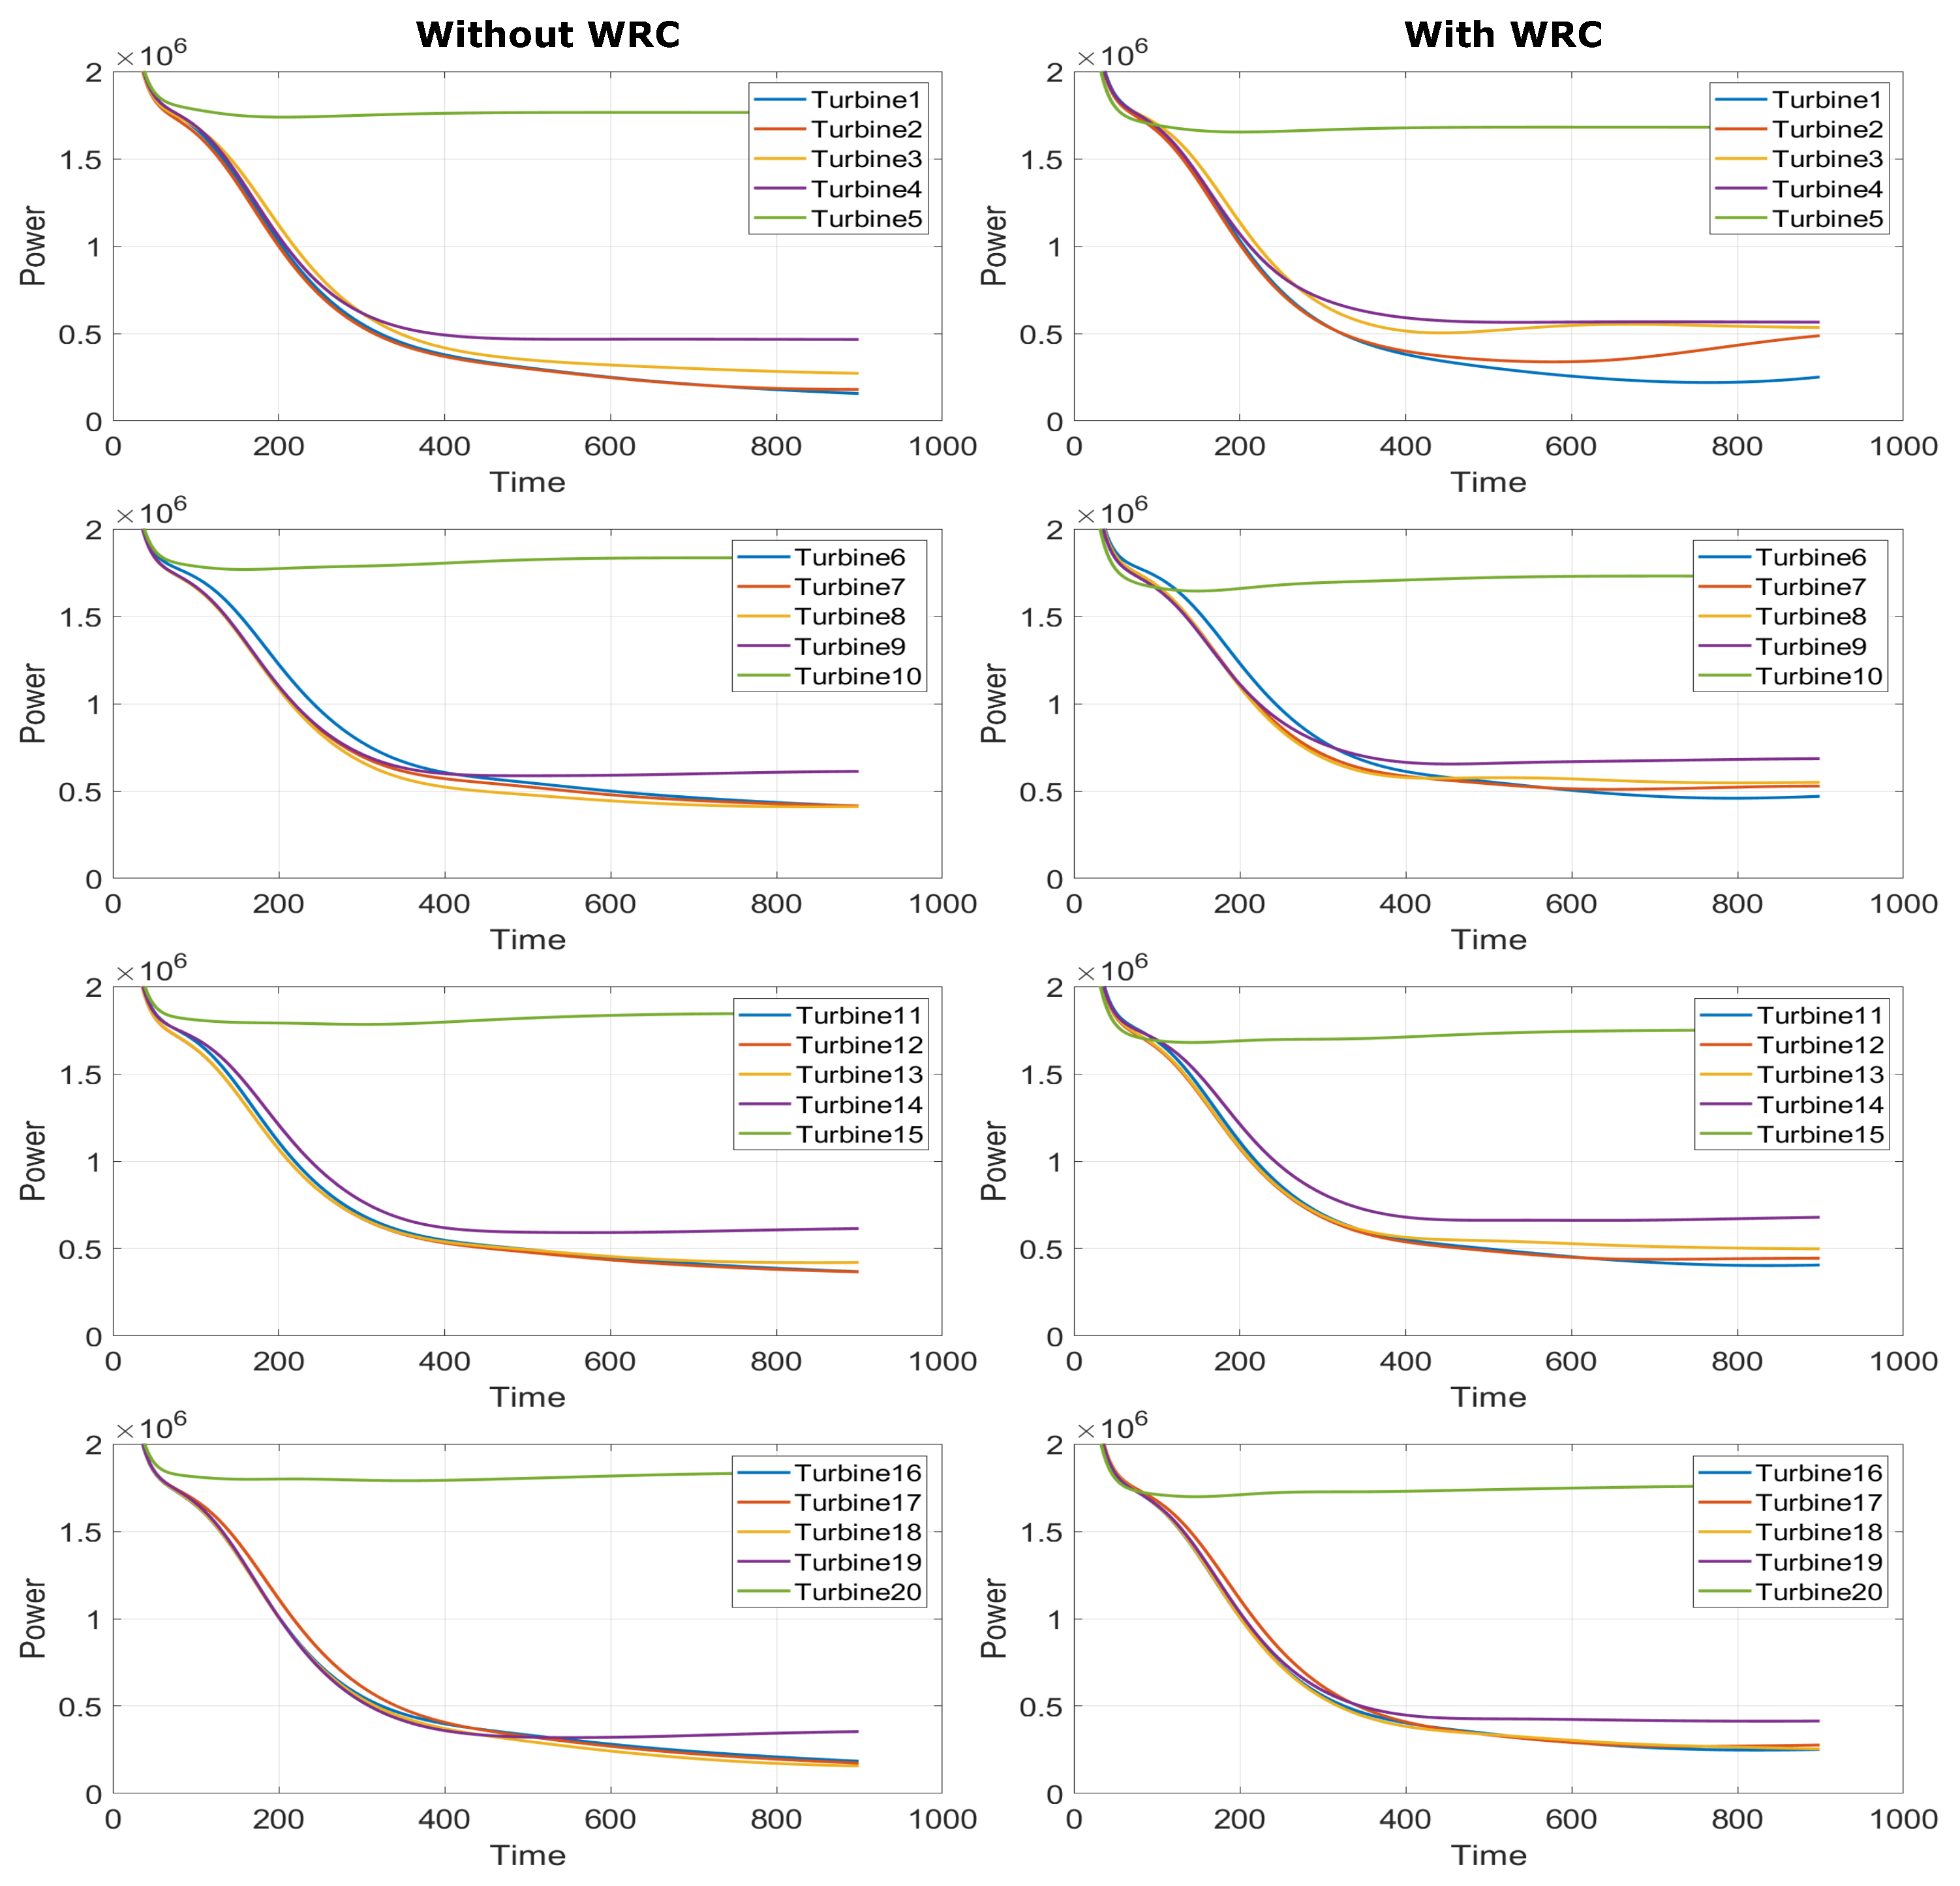
4.2. Offshore Wind Farm Case

A real-life offshore 20-turbine wind farm layout is designed in WFSim in Section 2.3 and it is assumed that the wind incident is perpendicular to the wind farm rows. In this paper, it is assumed that the wind direction stays intact. This wind farm configuration uses the AIC and WRC control methods discussed in Section 3. The lower and upper bounds of the yaw misalignment angle are 0° and 30°, respectively, while the lower and upper bounds of the axial induction factor are 0 and 1/3, respectively. Simulations are carried out and outcomes are tabulated for various mean wind speeds, i.e., 5, 6, 7, and 8 m/s, in Table 2.
From Table 2, it is inferred that the wind farm power output is improved by adopting WRC or by combining the WRC and AIC methods. In all scenarios in which wind speed is taken into account, the percentage increase in power output is around 17%. The power gain is not as noticeable when AIC is used. However, some studies [17] suggest that AIC could boost the power output on its own, and thus more research is needed.
The real-life wind farm flow field diagram is shown in Figure 14 for the optimized control methods in place. In the figure, the upstream turbines are T5, T10, T15 and T20. Without WRC, the wake effect on the downstream turbines is more severe as can be seen in the flow field figure. Meanwhile, the wake is steered away from the downstream turbines with WRC, resulting in improved overall performance.
In Figure 15, the corresponding power output from each turbine in the wind farm is presented when WRC is used in comparison to when WRC is not used. It is clear from the figure that the upstream turbine power has been reduced due to WRC; however, at the same time, considerable power improvement is observed by the downstream turbine as expected. Thus, the total wind farm power output production is increased.
Figure 16 shows the corresponding time response of power produced by individual turbines in the wind farm with and without WRC. The green curve represents the power generated by the upstream turbine, which sacrifices its power generation for the downstream turbines while WRC is in operation; that is, when WRC is employed, the power produced by the upstream turbine decreases, but the power produced by downstream turbines increases as shown in Figure 16.

5. Conclusions and Future Work

The wake effect is among the major concerns in wind farm control, because it influences the overall power production. To develop and test wind farm control strategies, developing an accurate dynamic wind farm model is essential to capture the varying conditions and wake effects occurring at wind farms. Such a dynamic wind farm model, i.e., WFSim, developed by Delft University of Technology, is reported in this paper. To reduce the wake effect, active wake control methods such as WRC and AIC are used. The goal of this work is to design a wind farm controller that incorporates WRC and AIC to maximize the wind farm power output. The wake effect on a virtual two-turbine wind farm and a real-life offshore wind farm is explored in this study using WRC, AIC, or both.
In the two-turbine wind farm, without and with WRC, the overall power production is compared for various distances between turbines. The overall power output by the virtual two-turbine wind farm demonstrates improvement in power when the WRC is in operation. It is also worth noting that the power output improves further when the spacing between the turbines increases from 3D to 10D.
In the real-life wind farm, WRC or AIC or both methods are also applied to reduce wake and thereby enhance the wind farm power output. In this paper, constant wind directions are assumed, but in the future, more realistic, varying wind directions will be considered. For determining the optimal value of the yaw angle or axial induction factor, a power production optimizer is used, which considers ambient wind conditions, wind farm layout, wake effect, wind direction probability of occurrence, and so on. When WRC or a combination of WRC and AIC is applied to the real-life wind farm model, the simulation results show an increase in power. The results show a 17% increase in power production.
An optimization-based wake redirection strategy tested on an operational wind farm in [16] has shown a power increment of 7–13% for site average wind speed and 28–47% for low wind speed. In this work, the percentage power increment is about 17% for the site average wind speed (6.85 m/s). It is also worth noting that when WRC is used, the power produced by upstream turbines is lowered, but the performance of the remaining downstream turbines improves, resulting in a rise in overall wind farm power production. As demonstrated in [17], AIC resulted in a less significant increase in power than WRC; that is, the result show that WRC is more effective than AIC.
In the future, all possible wind directions need to be considered to analyze the effectiveness of these control strategies more realistically. These control strategies may have a negative effect on structural loadings, which should be thoroughly investigated. The study carried out in [35] illustrates that the turbulence intensity and atmospheric stability conditions have a significant impact on wind farm power production, and these factors will also be taken into account. Moreover, the real-time adaptive optimization discussed in this paper will be improved further to be more suitable for larger wind farms. Finally, the real-time optimization algorithms will be validated using SOWFA followed by actual wind farm data that will be available towards the end of this ongoing project.

Author Contributions

Conceptualization, S.-h.H. and R.K.B.; methodology, S.-h.H.; software, R.K.B.; validation, S.-h.H. and R.K.B.; formal analysis, S.-h.H.; investigation, R.K.B. and S.-h.H.; resources, S.-h.H. and R.K.B.; data curation, R.K.B.; writing—original draft preparation, R.K.B. and S.-h.H.; writing—review and editing, R.K.B.; visualization, S.-h.H. and R.K.B.; supervision, S.-h.H.; project administration, S.-h.H.; funding acquisition, S.-h.H. All authors have read and agreed to the published version of the manuscript.

Funding

This work was partly supported by Korea Institute of Energy Technology Evaluation and Planning (KETEP) grant funded by the Korea government (MOTIE) (20203020020020, Feasibility Study on 40 years Life Wind Turbine and 20213030020230, Development of localized control system for wind power systems).

Institutional Review Board Statement

Not applicable.

Informed Consent Statement

Not applicable.

Data Availability Statement

The presented WFSim model’s MATLAB implementation is available at https://github.com/TUDelft-DataDrivenControl/WFSim (accessed on 7 May 2021). It is developed at Delft Center for Systems & Control, Data-Driven Control (TU Delft).

Conflicts of Interest

The authors declare no conflict of interest.

References

  1. Porté-Agel, F.; Bastankhah, M.; Shamsoddin, S. Wind-turbine and wind-farm flows: A review. Bound.-Layer Meteorol. 2020, 174, 1–59. [Google Scholar] [CrossRef] [PubMed] [Green Version]
  2. Scholbrock, A.K. Optimizing Wind Farm Control Strategies to Minimize Wake Loss Effects; University of Colorado at Boulder: Boulder, CO, USA, 2011. [Google Scholar]
  3. Sanderse, B. Aerodynamics of Wind Turbine Wakes-Literature Review; Technical Report; Energy Research Centre of the Netherlands: Amsterdam, The Netherlands, 2009. [Google Scholar]
  4. Rott, A.; Doekemeijer, B.; Seifert, J.K.; van Wingerden, J.W.; Kühn, M. Robust active wake control in consideration of wind direction variability and uncertainty. Wind Energy Sci. 2018, 3, 869–882. [Google Scholar] [CrossRef] [Green Version]
  5. Knudsen, T.; Bak, T.; Svenstrup, M. Survey of wind farm control—Power and fatigue optimization. Wind Energy 2015, 18, 1333–1351. [Google Scholar] [CrossRef]
  6. Kheirabadi, A.C.; Nagamune, R. A quantitative review of wind farm control with the objective of wind farm power maximization. J. Wind Eng. Ind. Aerodyn. 2019, 192, 45–73. [Google Scholar] [CrossRef]
  7. Kazda, J.; Mirzaei, M.; Cutululis, N.A. On the architecture of wind turbine control required for induction-based optimal wind farm control. In Proceedings of the 2018 Annual American Control Conference (ACC), Milwaukee, WI, USA, 27–29 June 2018; pp. 3074–3079. [Google Scholar]
  8. Kim, H.; Kim, K.; Paek, I. Model based open-loop wind farm control using active power for power increase and load reduction. Appl. Sci. 2017, 7, 1068. [Google Scholar] [CrossRef] [Green Version]
  9. Johnson, K.E.; Thomas, N. Wind farm control: Addressing the aerodynamic interaction among wind turbines. In Proceedings of the 2009 American Control Conference, St. Louis, MO, USA, 10–12 June 2009; pp. 2104–2109. [Google Scholar]
  10. Munters, W.; Meyers, J. Dynamic strategies for yaw and induction control of wind farms based on large-eddy simulation and optimization. Energies 2018, 11, 177. [Google Scholar] [CrossRef] [Green Version]
  11. Bastankhah, M.; Porté-Agel, F. Wind farm power optimization via yaw angle control: A wind tunnel study. J. Renew. Sustain. Energy 2019, 11, 023301. [Google Scholar] [CrossRef] [Green Version]
  12. Fleming, P.; King, J.; Dykes, K.; Simley, E.; Roadman, J.; Scholbrock, A.; Murphy, P.; Lundquist, J.K.; Moriarty, P.; Fleming, K.; et al. Initial results from a field campaign of wake steering applied at a commercial wind farm—Part 1. Wind Energy Sci. 2019, 4, 273–285. [Google Scholar] [CrossRef] [Green Version]
  13. Fleming, P.; King, J.; Simley, E.; Roadman, J.; Scholbrock, A.; Murphy, P.; Lundquist, J.K.; Moriarty, P.; Fleming, K.; van Dam, J.; et al. Continued results from a field campaign of wake steering applied at a commercial wind farm—Part 2. Wind Energy Sci. 2020, 5, 945–958. [Google Scholar] [CrossRef]
  14. Shin, J.; Baek, S.; Rhee, Y. Wind Farm Layout Optimization Using a Metamodel and EA/PSO Algorithm in Korea Offshore. Energies 2021, 14, 146. [Google Scholar] [CrossRef]
  15. Asaah, P.; Hao, L.; Ji, J. Optimal Placement of Wind Turbines in Wind Farm Layout Using Particle Swarm Optimization. J. Mod. Power Syst. Clean Energy 2021, 9, 367–375. [Google Scholar] [CrossRef]
  16. Howland, M.F.; Lele, S.K.; Dabiri, J.O. Wind farm power optimization through wake steering. Proc. Natl. Acad. Sci. USA 2019, 116, 14495–14500. [Google Scholar] [CrossRef] [PubMed] [Green Version]
  17. Annoni, J.; Gebraad, P.M.; Scholbrock, A.K.; Fleming, P.A.; Wingerden, J.W.V. Analysis of axial-induction-based wind plant control using an engineering and a high-order wind plant model. Wind Energy 2016, 19, 1135–1150. [Google Scholar] [CrossRef]
  18. Van der Hoek, D.; Kanev, S.; Allin, J.; Bieniek, D.; Mittelmeier, N. Effects of axial induction control on wind farm energy production-a field test. Renew. Energy 2019, 140, 994–1003. [Google Scholar] [CrossRef]
  19. Bartl, J.; Sætran, L. Experimental testing of axial induction based control strategies for wake control and wind farm optimization. J. Phys. Conf. Ser. 2016, 753, 032035. [Google Scholar] [CrossRef]
  20. Gebraad, P.M.; Fleming, P.A.; van Wingerden, J.W. Comparison of actuation methods for wake control in wind plants. In Proceedings of the 2015 American Control Conference (ACC), Chicago, IL, USA, 1–3 July 2015; pp. 1695–1701. [Google Scholar]
  21. Hulsman, P.; Andersen, S.J.; Göçmen, T. Optimizing wind farm control through wake steering using surrogate models based on high-fidelity simulations. Wind Energy Sci. 2020, 5, 309–329. [Google Scholar] [CrossRef] [Green Version]
  22. Archer, C.L.; Vasel-Be-Hagh, A. Wake steering via yaw control in multi-turbine wind farms: Recommendations based on large-eddy simulation. Sustain. Energy Technol. Assess. 2019, 33, 34–43. [Google Scholar] [CrossRef]
  23. van Dijk, M.T.; van Wingerden, J.W.; Ashuri, T.; Li, Y.; Rotea, M.A. Yaw-misalignment and its impact on wind turbine loads and wind farm power output. J. Phys. Conf. Ser. 2016, 753, 062013. [Google Scholar] [CrossRef] [Green Version]
  24. Qian, G.W.; Ishihara, T. Wind farm power maximization through wake steering with a new multiple wake model for prediction of turbulence intensity. Energy 2021, 220, 119680. [Google Scholar] [CrossRef]
  25. Fleming, P.; Annoni, J.; Shah, J.J.; Wang, L.; Ananthan, S.; Zhang, Z.; Hutchings, K.; Wang, P.; Chen, W.; Chen, L. Field test of wake steering at an offshore wind farm. Wind Energy Sci. 2017, 2, 229–239. [Google Scholar] [CrossRef] [Green Version]
  26. Boersma, S.; Doekemeijer, B.; Vali, M.; Meyers, J.; van Wingerden, J.W. A control-oriented dynamic wind farm model: WFSim. Wind Energy Sci. 2018, 3, 75–95. [Google Scholar] [CrossRef] [Green Version]
  27. Ramírez Castillo, S.A. Engineering Models Enhancement for Wind Farm Wake Simulation and Optimization. Graduation Thesis, Polytechnic University of Milan (Politecnico di Milano), Milan, Italy, 2019. [Google Scholar]
  28. Boersma, S.; Gebraad, P.; Vali, M.; Doekemeijer, B.; Van Wingerden, J. A control-oriented dynamic wind farm flow model: “WFSim”. J. Phys. Conf. Ser. 2016, 753, 032005. [Google Scholar] [CrossRef]
  29. Frederik, J. Dynamic Wind Farm Control Using the WFSim Flow Model. Master’s Thesis, Delft Center for Systems and Control (DCSC), Delft University of Technology, Delft, The Netherlands, 2017. [Google Scholar]
  30. Meyers, J.; Meneveau, C. Large eddy simulations of large wind-turbine arrays in the atmospheric boundary layer. In Proceedings of the 48th AIAA Aerospace Sciences Meeting Including the New Horizons Forum and Aerospace Exposition, Orlando, FL, USA, 4–7 January 2010; p. 827. [Google Scholar]
  31. Global Wind Atlas. Available online: https://globalwindatlas.info/ (accessed on 15 October 2021).
  32. Adaramola, M.; Krogstad, P.Å. Experimental investigation of wake effects on wind turbine performance. Renew. Energy 2011, 36, 2078–2086. [Google Scholar] [CrossRef]
  33. Barthelmie, R.; Hansen, K.; Frandsen, S.; Rathmann, O.; Schepers, J.; Schlez, W.; Phillips, J.; Rados, K.; Zervos, A.; Politis, E.; et al. Modelling and Measuring Flow and Wind Turbine Wakes in Large Wind Farms Offshore. In Renewable Energy; Routledge: London, UK, 2018; pp. 251–267. [Google Scholar]
  34. Méchali, M.; Barthelmie, R.; Frandsen, S.; Jensen, L.; Réthoré, P.E. Wake effects at Horns Rev and their influence on energy production. In European Wind Energy Conference and Exhibition; Citeseer: Princeton, NJ, USA, 2006; Volume 1, pp. 10–20. [Google Scholar]
  35. Barthelmie, R.; Churchfield, M.J.; Moriarty, P.J.; Lundquist, J.K.; Oxley, G.; Hahn, S.; Pryor, S. The role of atmospheric stability/turbulence on wakes at the Egmond aan Zee offshore wind farm. J. Phys. Conf. Ser. 2015, 625, 012002. [Google Scholar] [CrossRef]
Figure 1. Wake of wind turbine.
Applsci 12 04013 g001
Figure 2. Block diagram of wind farm simulator.
Applsci 12 04013 g002
Figure 3. Top view illustration of turbine showing yaw angle γ and inflow angle ϕ .
Applsci 12 04013 g003
Figure 4. Offshore wind farm: Google Maps site view.
Applsci 12 04013 g004
Figure 5. Global Wind Atlas: Mean wind speed at site.
Applsci 12 04013 g005
Figure 6. Global Wind Atlas: Wind Speed Rose at site.
Applsci 12 04013 g006
Figure 7. Global Wind Atlas: Wind speed variability.
Applsci 12 04013 g007
Figure 8. Flowchart of dynamic wind farm controller.
Applsci 12 04013 g008
Figure 9. Normalized power along Horns Rev wind farm row.
Applsci 12 04013 g009
Figure 10. Schematic representation of axial induction control strategy.
Applsci 12 04013 g010
Figure 11. Schematic representation of wake redirection control strategy.
Applsci 12 04013 g011
Figure 12. Two-turbine case with and without WRC for 4D spacing.
Applsci 12 04013 g012
Figure 13. Two-turbine case with and without WRC for 8D spacing.
Applsci 12 04013 g013
Figure 14. Flow field diagram from WFSim for real-life wind farm at 6 m/s mean wind speed.
Applsci 12 04013 g014
Figure 15. Power produced by individual turbine with and without WRC.
Applsci 12 04013 g015
Figure 16. Time response of power produced by individual turbine with and without WRC.
Applsci 12 04013 g016
Table 1. Wind farm power for 3D to 10D spacing between the turbines.
Control Method3D4D5D6D
Without WRC1.7507 MW1.7504 MW1.7591 MW1.7589 MW
With WRC1.7605 MW1.7737 MW1.7920 MW1.8259 MW
Percentage Increase0.56%1.33%1.87%3.81%
Control Method7D8D9D10D
Without WRC1.7711 MW1.7730 MW1.7873 MW1.7979 MW
With WRC1.8488 MW1.8856 MW1.9101 MW1.9539 MW
Percentage Increase4.39%6.35%6.87%8.68%
Table 2. Wind farm power at various wind speeds under various control methods.
Wind Speed—5 m/sFarm PowerWind Speed—6 m/sFarm Power
Without Control7.2927 MWWithout Control12.602 MW
With WRC8.5491 MWWith WRC14.805 MW
With WRC-AIC8.5195 MWWith WRC-AIC14.784 MW
With AIC7.2917 MWWith AIC12.600 MW
Percentage Increase *17.2281%Percentage Increase17.4813%
Wind Speed—7 m/sFarm PowerWind Speed—8 m/sFarm Power
Without Control20.011 MWWithout Control29.871 MW
With WRC23.475 MWWith WRC34.993 MW
With WRC-AIC23.462 MWWith WRC-AIC34.997 MW
With AIC20.007 MWWith AIC29.866 MW
Percentage Increase17.3104%Percentage Increase17.1470%
* Percentage increase is calculated between without control and with WRC.
Publisher’s Note: MDPI stays neutral with regard to jurisdictional claims in published maps and institutional affiliations.

