Article

Anti-Obesity Activities of Standardized Ecklonia stolonifera Extract in 3T3-L1 Preadipocytes and High-Fat-Diet-Fed ICR Mice

1
Department of Food Biotechnology and Environmental Science, Kangwon National University, Chuncheon 24341, Korea
2
Department of Food Science and Biotechnology, College of Life Science, CHA University, Seongnam 13488, Korea
3
Naturalway Co., Ltd., Pocheon 11160, Korea
*
Authors to whom correspondence should be addressed.
These authors contributed equally to this work.
Appl. Sci. 2022, 12(10), 5115; https://doi.org/10.3390/app12105115
Submission received: 25 April 2022 / Revised: 13 May 2022 / Accepted: 17 May 2022 / Published: 19 May 2022
(This article belongs to the Special Issue Bioactive Compounds and Emerging Technologies for Aquatic Food)

Abstract

:
The purpose of this study was to prepare a clinical trial test material (ESETM, test material of Ecklonia stolonifera extract) to develop a health functional food based on its anti-obesity effect. The anti-obesity effect of ESETM was evaluated in 3T3-L1 adipocytes and obese mice fed a high-fat diet (HFD) to confirm its nonclinical trial effect before application in clinical trial. Adipogenesis is a process of preadipocyte differentiation that causes an increase in the production of reactive oxygen species (ROS) and lipid accumulation. In vitro study results indicated that ESETM outstandingly inhibits the production of ROS and lipid accumulation during adipogenesis and lipogenesis. In vivo, ESETM-treated ICR mice had reduced HFD-induced weight change, food efficiency ratio, adipose tissue weight, liver weight and showed improved serum lipid profiles. Our results show that ESETM inhibits weight change by regulating the adipogenesis, lipogenesis, lipolysis, and thermogenesis pathways.

1. Introduction

Obesity is caused by the excessive accumulation of internal fat from an imbalance between the body’s energy intake and consumption. It can also act as a significant factor that increases the likelihood of chronic diseases, such as cardiovascular disease, type 2 diabetes, hyperlipidemia and high blood pressure [1]. Various obesity-related drugs have been developed to treat obesity, but these drugs can cause serious side effects [2,3]. Therefore, there is a need to develop anti-obesity materials using natural products with fewer or no side effects that can potentially be useful for treating obesity [4,5]. Adipocytes play an essential role in maintaining energy homeostasis and lipid metabolism. 3T3-L1, a pre-adipocyte, accumulates triglycerides, as it differentiates into an adipocyte by the action of various hormones and transcription factors. Preadipocyte differentiation, also known as adipogenesis, is regulated by essential transcription factors for adipogenesis, including CCAAT/enhancer-binding protein (C/EBPα) and peroxisome proliferator-activated receptor gamma (PPARγ). C/EBPα and PPARγ can activate adipocyte protein 2 (aP2), an adipose-specific gene [6,7,8]. The activation of late adipogenic factors is associated with triglyceride synthesis [9]. Sterol regulatory element-binding protein 1 (SREBP1) promotes the differentiation of preadipocytes into adipocytes. Additionally, it is an important transcription factor for enzymes that regulate triglyceride synthesis. Enzymes that synthesize triglycerides, such as lyso-phosphatidic acid acyltransferase theta (LPAATθ) and lipin 1, promote fat accumulation at the end of adipocyte differentiation [10,11,12].
The white adipose tissue (WAT) is the main energy store in mammals. Lipolysis is the hydrolysis of triglycerides stored in the WAT into diacylglycerols (DG), monoacylglycerols (MG), and glycerol. Each step releases one fatty acid molecule [13,14]. Phosphorylation of protein kinase A (PKA) leads to the activation of lipolytic enzymes and lipolysis [15]. It is known that adipose triglyceride lipase (ATGL), phosphorylated hormone-sensitive lipase (p-HSL), and monoacylglycerol lipase (MGL) are three types of lipases that fully hydrolyze triglycerides in lipolysis.
Regarding white adipose tissue and brown adipose tissue (BAT) in mammals, in comparison with the WAT, the BAT is enriched in mitochondria and has a characteristic protein termed as uncoupling protein 1 (UCP1). UCP1 can directly dissipate energy in the form of heat by oxidative uncoupling of fatty acids during adenosine triphosphate (ATP) synthesis. BAT promotes non-shivering thermogenesis through UCP1, thus playing a unique role in energy consumption. Therefore, BAT may be a valuable target for the prevention of obesity. In addition, WAT adipocytes exhibit a BAT phenotype when subjected to certain stimuli, a process called browning [16,17]. The prerequisite for browning is that the free fatty acids (FFAs) released during lipolysis are absorbed by cells that require energy; carnitine palmitoyltransferase 1 (CPT1) can transport FFAs to the mitochondrion, which is the site for fatty acid β-oxidation (FAO) to produce acetyl coenzyme a. FAO is necessary for the browning process induced by UCP1 [18,19].
Ecklonia stolonifera is an edible brown alga widely distributed in Korea and Japan. It belongs to the kelp family and is rich in many polyphenol compounds, mainly tannins [20]. Dieckol is a primary tannin compound found only in brown algae and is an indicator component of E. stolonifera extract (ESE). Recent studies have shown that ESE exhibits anti-obesity, antioxidant, anti-inflammatory, and antidiabetic activities [21,22]. Previous studies have also reported that ESE can inhibit fat accumulation by increasing lipolysis and WAT browning [23,24]. Therefore, in this study, a clinical trial test material (ESETM, test material of E. stolonifera extract) was prepared to develop a healthy functional food based on the anti-obesity effect of ESE. The anti-obesity effect of ESETM was evaluated in adipocytes and obese mouse model using ICR mice fed a HFD to confirm its nonclinical trial effect before application in clinical trial.

2. Materials and Methods

2.1. Materials and Reagents

ESE and ESETM were obtained from Naturalway Co., Ltd. (Pocheon, Korea). To prepare the ESE, Ecklonia stolonifera was immersed in 70% edible ethanol and subjected to circulation extraction at 70 °C for 9 h. The extract was concentrated under reduced pressure and ESE was obtained using a freeze dryer. ESETM was prepared by mixing 60% ESE and 40% excipients (crystalline cellulose, magnesium stearate, sodium carboxymethyl cellulose, and food coloring red) to obtain a 700 mg tablet test sample, which was then powdered again. The placebo test material (PTM) was made of crystalline cellulose instead of ESETM.
Among reagents used for 3T3-L1 cell culture and differentiation, dimethyl sulfoxide (DMSO) was purchased from Junsei Chemical (Tokyo, Japan) and insulin, dexamethasone (DEX), Oil Red O (ORO), isopropanol, nitroblue tetrazolium (NBT), and 3-isobutyl-1-methylxanthine (IBMX) were obtained from Sigma-Aldrich Co. (St. Louis, MO, USA). Bovine serum (BS), fetal bovine serum (FBS), penicillin-streptomycin (P/S), Dulbecco’s modified Eagle’s medium (DMEM), phosphate-buffered saline (PBS), and trypsin-ethylenediaminetetraacetic acid (EDTA) were supplied by Gibco (Gaithersburg, MD, USA). Antibodies targeting β-actin, PPARγ, C/EBPα, aP2, phosphorylated PKA, ATGL, phosphorylated HSL, MGL were purchased from Cell Signaling Technology (Beverly, MA, USA), and those targeting SREBP1, LPAATθ, lipin 1, UCP1, and CPT1 were procured from Santa Cruz Biotechnology (Dallas, TX, USA).

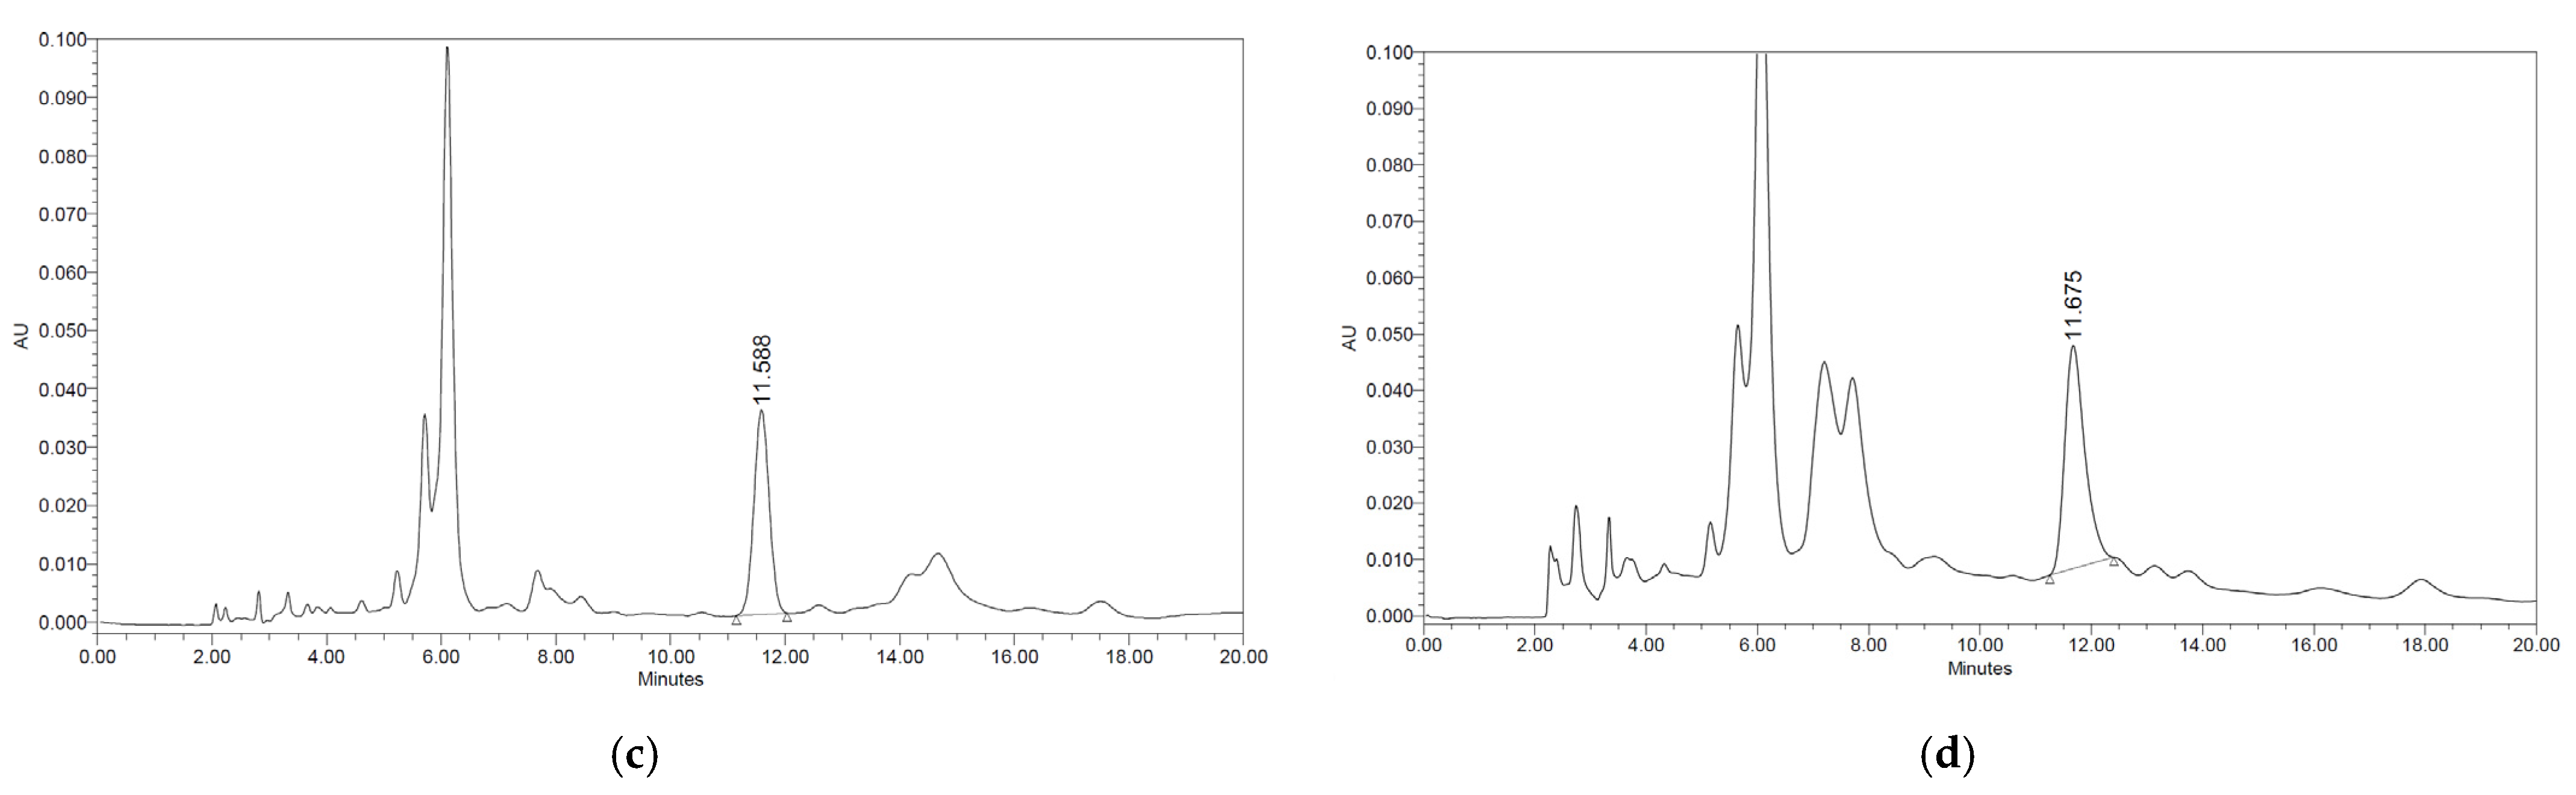
2.2. Quantitation of Dieckol in the Ecklonia stolonifera Extract by HPLC-PDA

Dieckol standard solutions were prepared in amounts of 3.13–100 μg/mL. The 250 mg ESE sample was dissolved in 50 mL of 70% ethanol (in water % v/v). All sample were filtered with a 0.45 μm syringe filter (Whatman, Maidstone, UK). For the HPLC analysis of Dieckol, the analysis method of Bang et al. [25] was modified, and the measurement was carried out. The instrument used for the analysis was a Waters 2695 Separation Module HPLC system equipped with a Waters 996 Photodiode Array Detector (Waters, Milford, MA, USA). The analysis column used capcell pak C18 (250 mm × 4.6 mm, 5 μm, Osaka soda, Osaka, Japan). The mobile phase is 0.1% formic acid (A) and acetonitrile (B) 0–15 min: A; 74%, B; 26%, 15–18 min: A; 0%, B; 100%, 18–20 min: A; 74%, B; 26% mobile phase conditions, the analysis time was 20 min, the detection wavelength was 254 nm, the column temperature was 25 °C, flow rate was 1 mL/min, and the injection volume was adjusted to 10 μL.

2.3. Animal Experiments

Four-week-old ICR mice (male) were obtained from DBL Co., Ltd. (Seoul, Korea), acclimatized to the environment for 1 week, and then used in the experiment. All groups, except the normal diet group, were fed a HFD (60% kcal fat; Research Diet, Inc., No. D12492, New Brunswick, NJ, USA), where 60% of the total calories were derived from fats to induce obesity. Experimental animals were randomly divided into the following groups: normal diet group (ND), HFD group, HFD group administered with Garcinia cambogia extract (HFD + GC 100; n = 5), HFD group administered with ESETM at an extract content of 49.5 mg kg−1 day−1 (HFD + ESETML 83; n = 5), HFD group administered with ESETM at an extract content of 90 mg kg−1 day−1 (HFD + ESETMM 150; n = 5), and HFD group treated with ESETM at an extract content of 150 mg kg−1 day−1 (HFD + ESETMH 250; n = 5). ESETM was homogenized, dissolved in distilled water, and orally administered for 7 weeks. Water intake and food intake were calculated once a week during the experiment. The weight of the experimental animals was measured once a week. Water and food were provided ad libitum.
The experimental environment was maintained at a temperature of 24 ± 5 °C and humidity of 55 ± 5%, and the day and night were adjusted in a 12 h cycle. The entire experiment was carried out with the approval of the Experimental Animal Steering Committee and the Animal Experimentation Ethics Committee of Kangwon National University (approval number KW-200810-1).

2.4. Biochemical Analysis

Blood samples were collected after the mice were anesthetized following 12 h of fasting. After the blood was clotted, the serum was separated by centrifugation at 4 °C and 12,000× g for 10 min. Before analysis, the serum was stored at −70 °C, and the blood lipid index of triglycerides, total cholesterol, low-density lipoprotein (LDL) cholesterol, high-density lipoprotein (HDL) cholesterol, and activities of aspartate transaminase (AST) and alanine transaminase (ALT) were analyzed by an automated chemistry analyzer.

2.5. Histological Analysis

After secondary fixation of the mouse adipose tissue in a new formalin fixative, it was paraffin-embedded using a general tissue treatment process. Paraffin-embedded adipose tissue was sliced to a thickness of 3 μm, attached to a glass slide, and then stained with hematoxylin and eosin (H&E). The sections were observed 3–4 times under 400× magnification. The area (size) of the adipocytes was measured using an image analysis device (i-Solution Lite) to obtain an average value.

2.6. Cell Culture

The mouse-derived 3T3-L1 cell line used to observe adipocyte differentiation after treatment with the test agent was purchased from the American Type Culture Collection (ATCC, CL-173, Manassas, VA, USA). Depending on the purpose of the experiment, 3T3-L1 whole adipocytes were seeded at a concentration of 5 × 10⁶ cells in a 48-well plate. After two days, 100% confluent preadipocytes in DMEM (89%) containing 10% BS and 1% P/S were induced to differentiation into adipocytes with DMEM containing adipocyte differentiation-inducing substances (1 μg/mL insulin, 1 μM DEX, 0.5 mM IBMX), 10% FBS, and 10% P/S.
During differentiation (day 0), adipocytes were treated with ESETM at 21, 42, 84, and 167 μg/mL such that the final concentrations of the extract in DMEM were 12.5, 25, 50, and 100 μg/mL, respectively. For adipocyte differentiation, each sample was treated in a medium containing 1 μg/mL insulin, 1% P/S, and 10% FBS continuously every 2 days after treatment with differentiation-inducing substances.

2.7. Cell Viability

The cytotoxicity of ESETM to adipocytes was evaluated using the XTT {2,3-bis(2-methoxy-4-nitro-5-sulfophenyl)-2H-tetrazolium-5-carboxanilide innersalt} assay kit (WelGene, Seoul, Korea). In brief, cells were seeded in a 96-well plate at a density of 2 × 10⁶ cells and cultured in DMEM (89%) containing BS (10%) and P/S (1%) until 100% confluence. Two days later, pre-adipocytes were treated with DMEM containing adipocyte differentiation-inducing agents (1 μg/mL insulin, 1 μM DEX, 0.5 mM IBMX), FBS (10%), and P/S (10%). Upon differentiation (day 0), adipocytes were treated with the test agent at concentrations of 21, 42, 84, and 167 μg/mL. On day 8 of differentiation, a working solution was prepared by mixing 1 mL of XTT reagent and 20 μL PMS reagent (N-methylphenazonium methyl sulfate). A pipette was used to dispense 200 μL of the working solution in each well of a 96-well plate, which was gently mixed and incubated in a CO2 incubator for 4 h. Cytotoxicity was calculated by subtracting the absorbance value at 690 nm from that reported at 450 nm using a microplate reader (Spectramax i3, Molecular Devices, Sunnyvale, CA, USA).

2.8. ORO Staining and NBT Assay

To measure the amount of fat accumulation in 3T3-L1 cells according to the differentiation process, the cells were treated with the test agent, and the culture solution was removed from 24-well plates after 8 days. Each well was treated with 500 μL of 10% formalin solution for 5 min. After incubation, the solution was removed, and the differentiated 3T3-L1 cells were treated with the same amount of formalin solution for at least 1 h. Formalin was then removed, and the cells were entirely dried by washing with 500 μL of a 60% isopropanol solution. The completely dried cells were thoroughly stained for the accumulated fat components with an ORO working solution (ORO:DDW = 6:4) prepared in advance, washed three times, and thoroughly dried. ORO combined with the fat component accumulated in the cell was eluted using 100% isopropanol, and the absorbance was measured at 490 nm. To measure the amount of reactive oxygen species (ROS) produced in differentiated adipocytes according to the differentiation process, the culture medium was first removed, and the cells were washed twice with sterile PBS (pH 7.4). The cells were then incubated with 200 μL of 0.2% NBT solution for 90 min in a CO2 incubator, and the dark blue formazan was eluted using a potassium hydroxide (KOH) solution (DMSO:1N KOH = 7:3). The sample was mixed with the same amount of distilled water and subjected to absorbance measurement at 570 nm.

2.9. Western Blot Analysis

Epididymal adipose tissue and 3T3-L1 adipocytes were homogenized with PRO-PREP protein extract and centrifuged at 12,000× g for 30 min at 4 °C to obtain a supernatant. The protein concentration was quantified using a BCA protein quantification kit (Bio-Rad, Hercules, CA, USA). After mixing proteins with 5× sample buffer, they were heated at 100 °C for 5 min and separated by 10% sodium dodecyl sulfate polyacrylamide gel electrophoresis at 100 V for 90 min. They were then transferred to a PVDF membrane (Merck Millipore, Billerica, MA, USA) using a semi-dry transfer system at 120 V for 60 min. Then, the membrane was blocked with 5% skim milk in 1× Tris-buffered saline containing Tween 20 (TBST) for 1 h and incubated overnight with primary antibodies at 4 °C. After overnight incubation, the primary antibody was washed 3 times with 1× TBST at 10 min intervals, the secondary antibody was reacted for 1 h, then washed 3 times with 1× TBST at 10 min intervals, and after developing with ECL reagent, it was exposed on the ChemiDocTM imaging system (Bio-Rad).

2.10. Statistical Analysis

The results are expressed as mean ± standard deviation (SD) and analyzed by analysis of variance (ANOVA) and Duncan’s multiple range tests. Statistical significance was set at p < 0.05.

3. Results

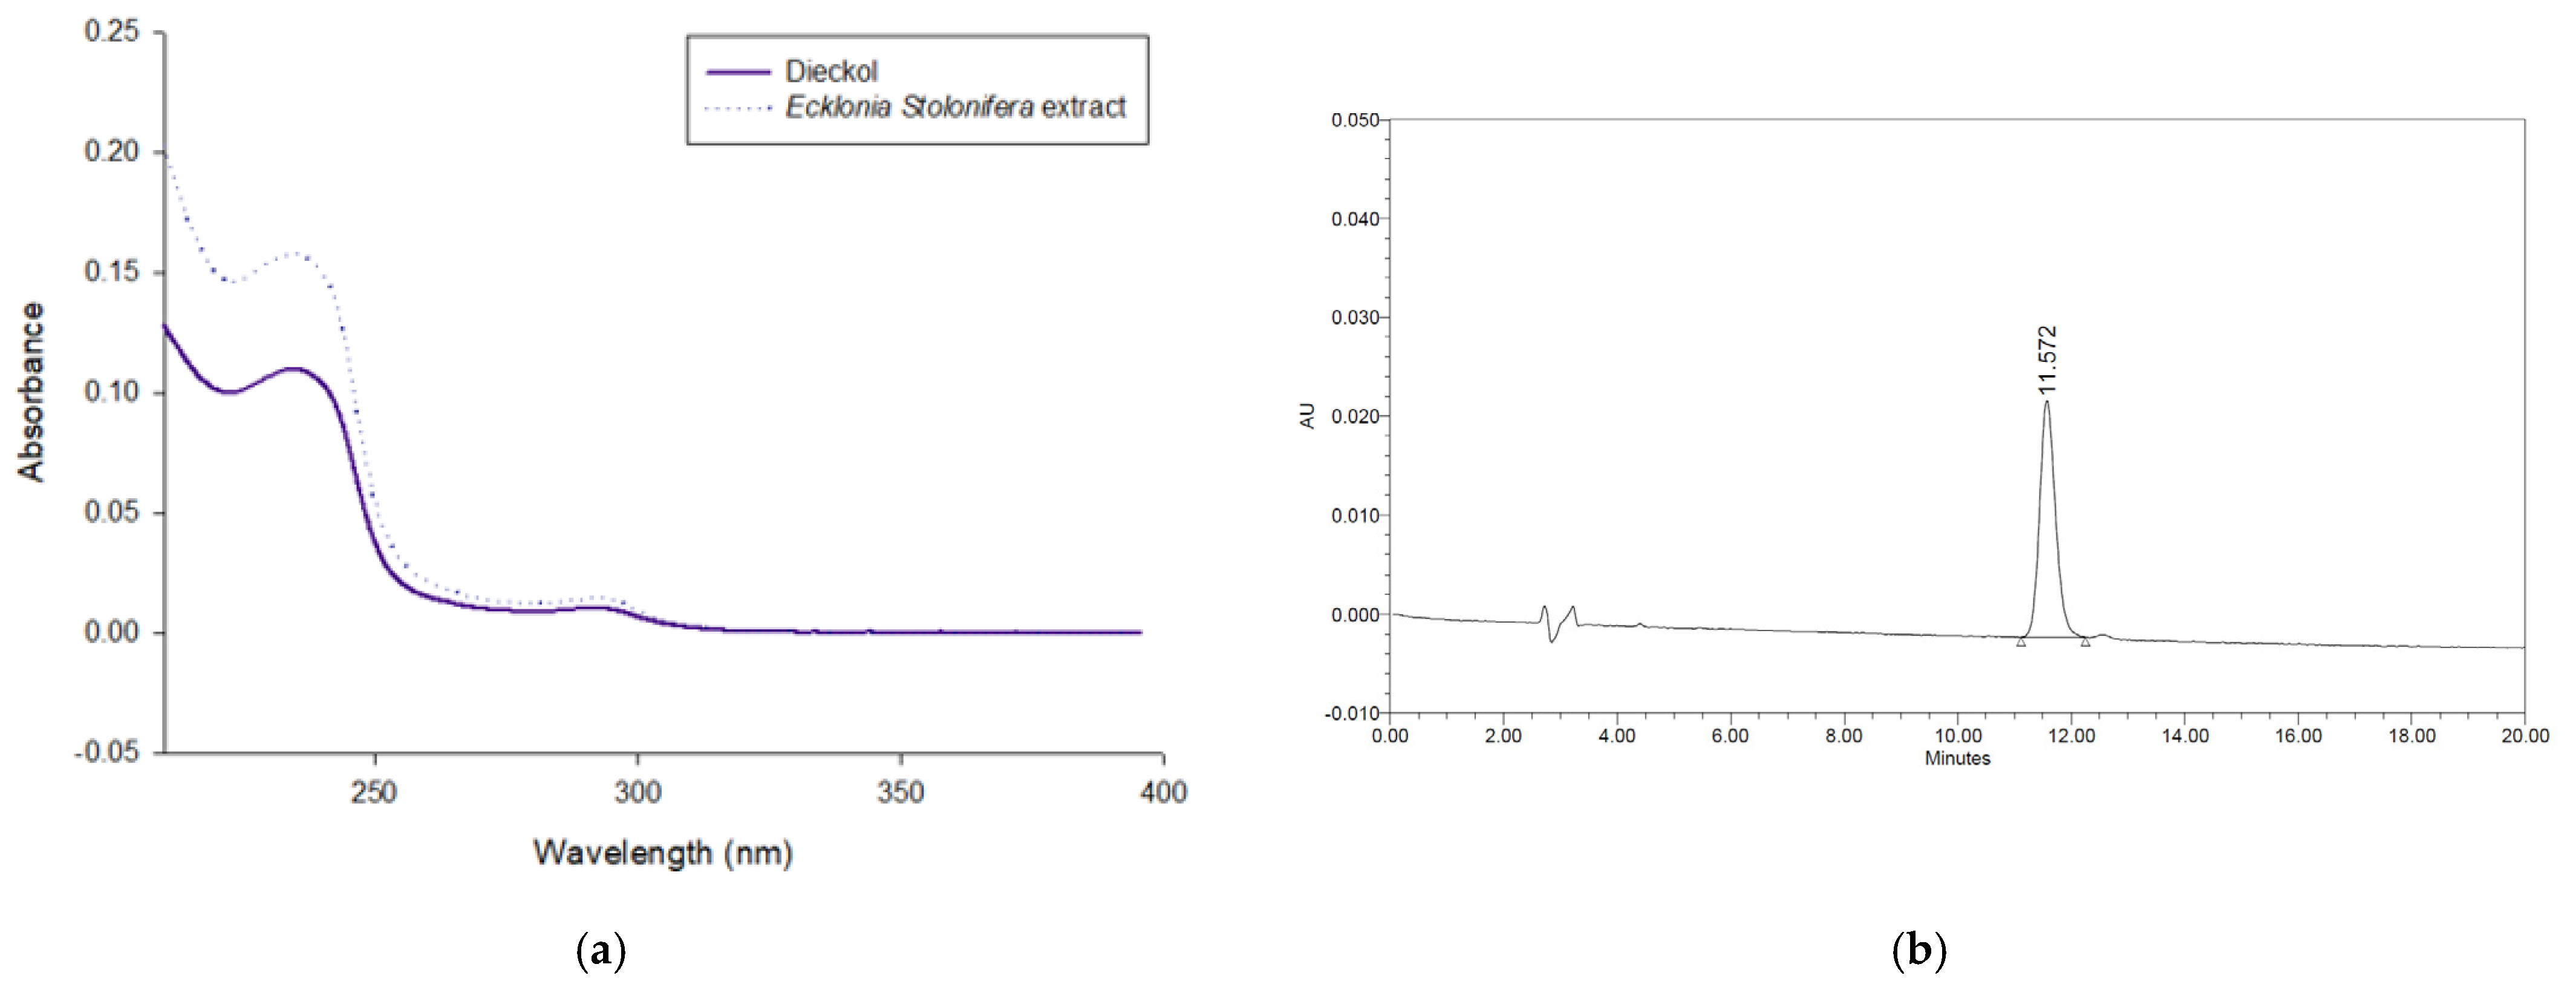
3.1. Amounts of Dieckol in the Ecklonia stolonifera Extract

A UV spectrum of the dieckol and ESE is shown in Figure 1a. As a result, by comparing the chromatograms of dieckol, ESE and ESETM, it was confirmed that the dieckol was separated without interference from other substances. The peak retention times of the dieckol, ESE and ESETM are identical (Figure 1b–d).
We constructed a calibration curve using diluted stock solutions of dieckol. The coefficient of determination (R2) was 0.999. Linearity over this range is sufficient to ensure accurate determination of dieckol in the sample. The precision of the HPLC method for assaying each standard was determined from triplicate measurements. The relative standard deviation (RSD) was <5.0%. The amounts of dieckol in the ESE and ESETM were determined as 27.42 ± 0.66 mg/g and 18.65 ± 0.52 mg/g (Table 1).

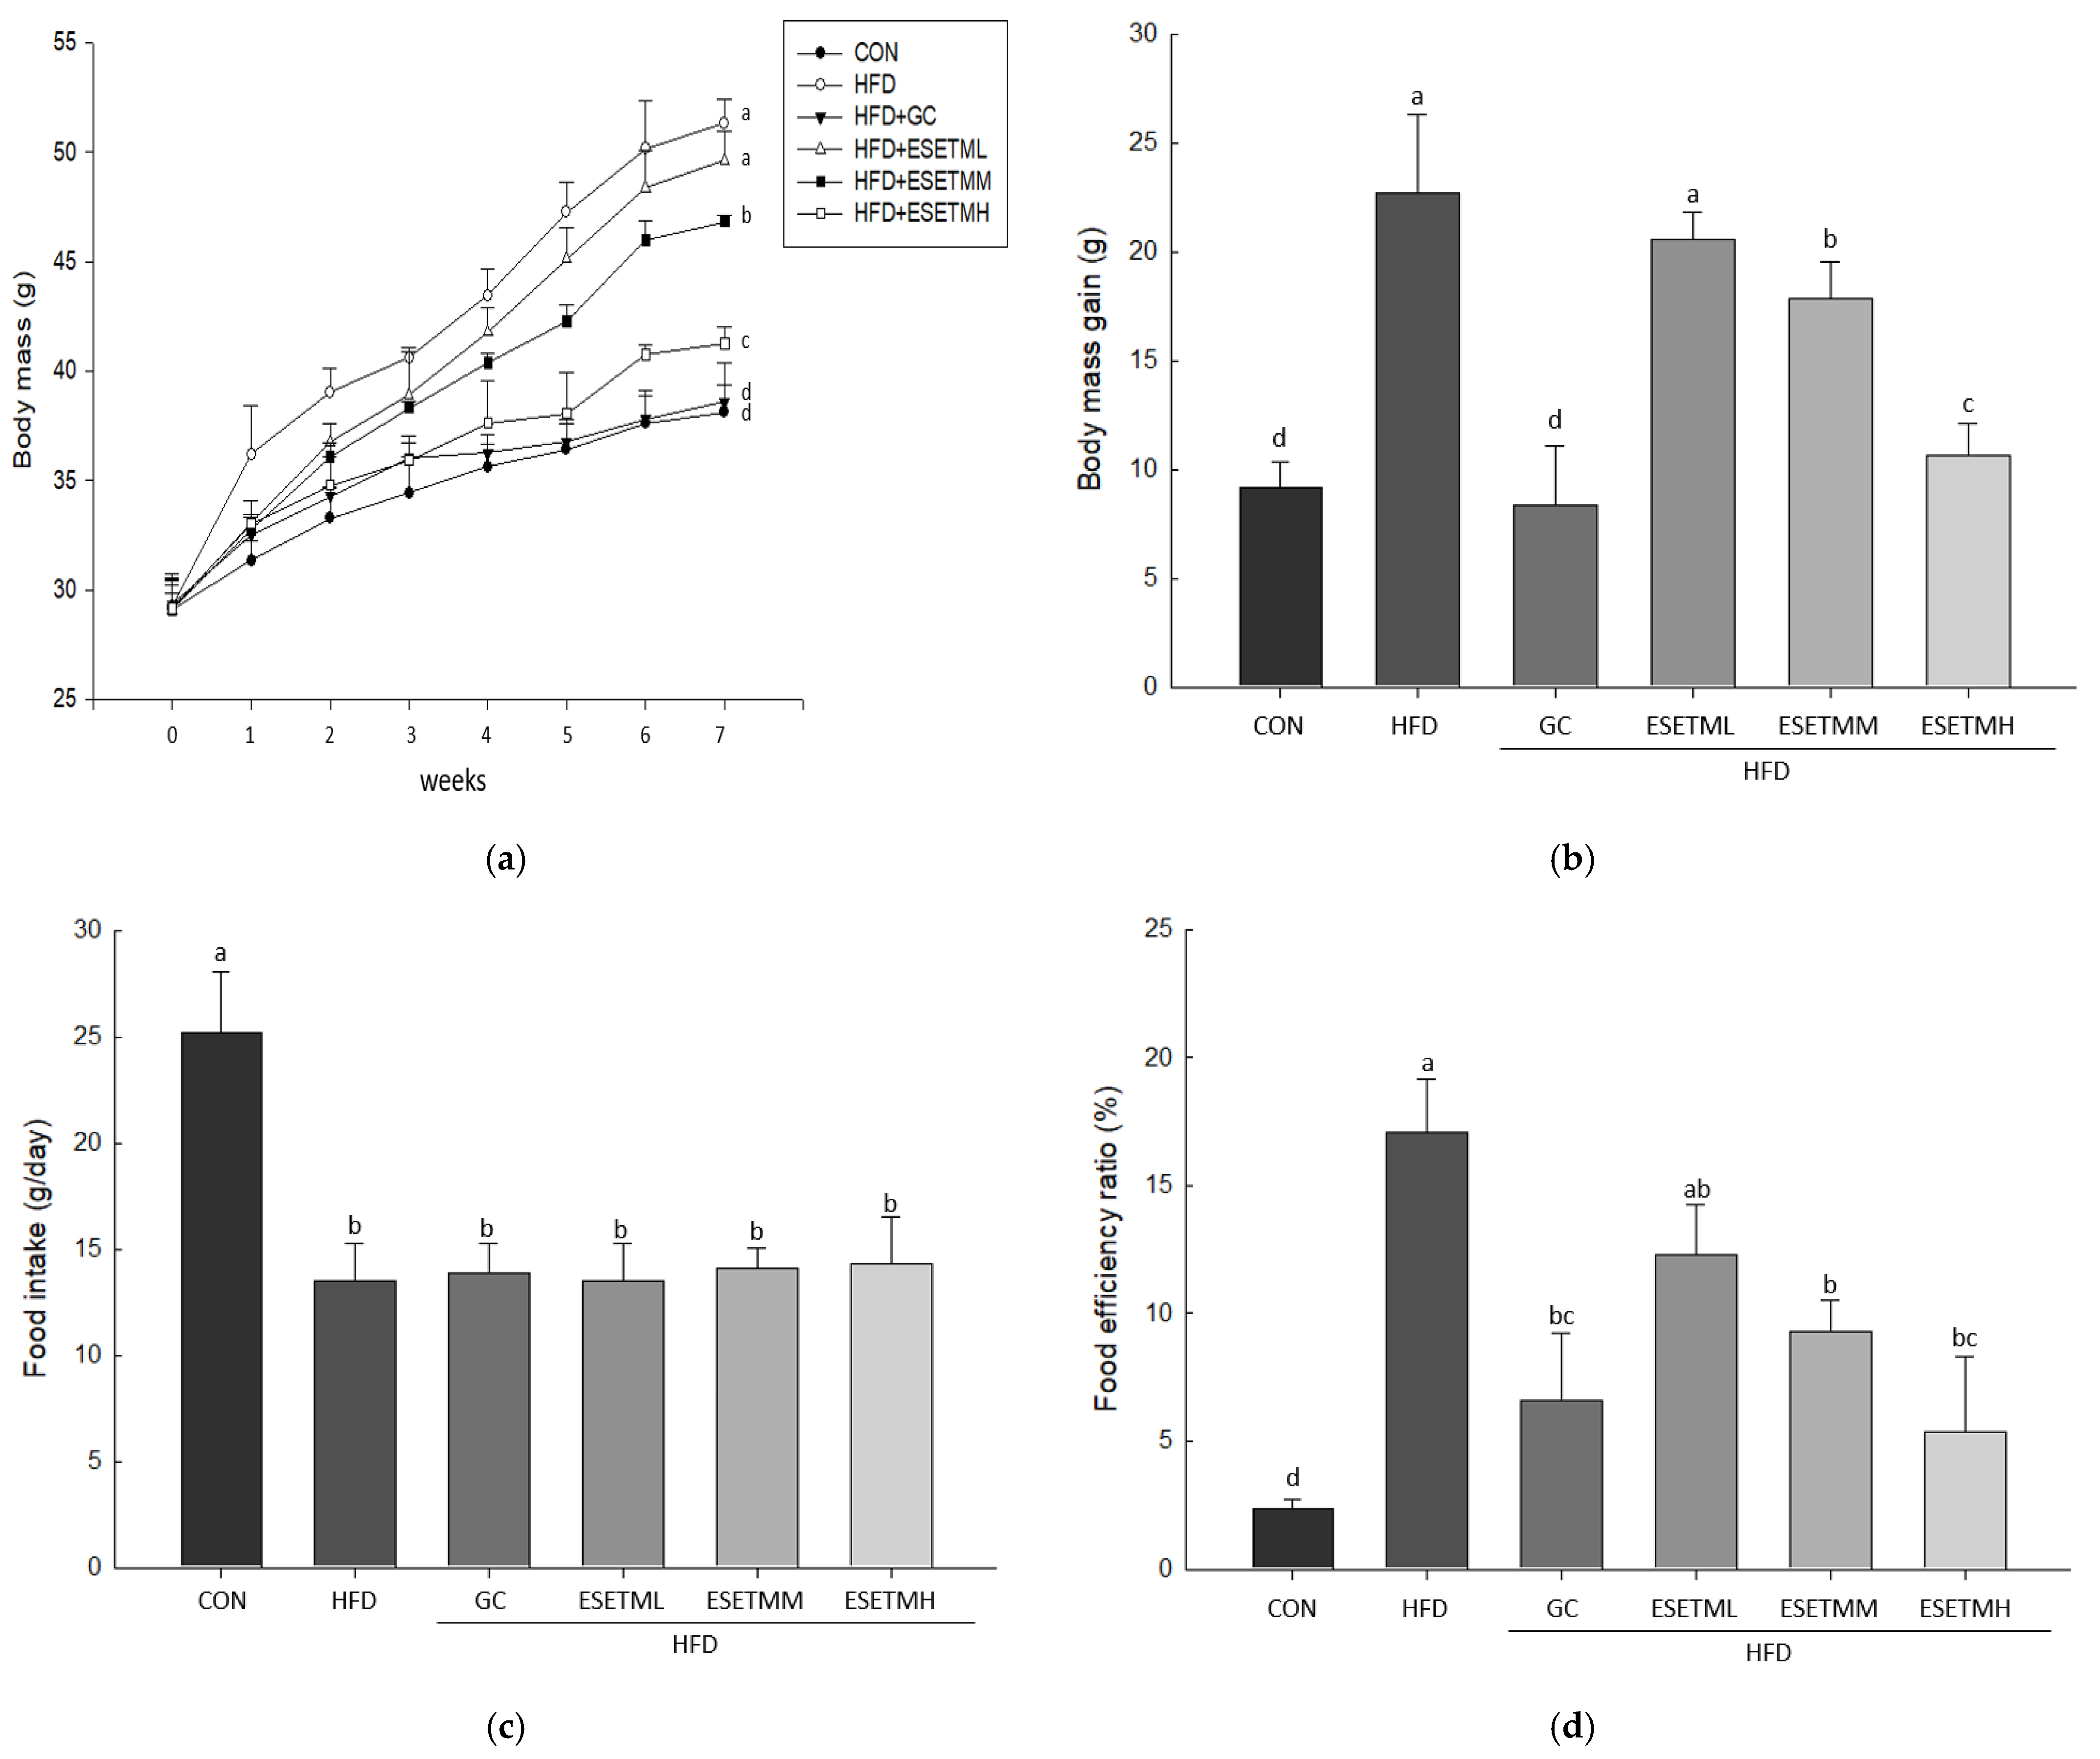
3.2. ESETM Prevents Development of Obesity in HFD-Fed Obese Mice

To determine the anti-obesity effect of ESETM in HFD-fed obese mice, we fed ICR mice with ND, HFD, or HFD supplemented with 83 mg kg−1 day−1 (HFD + ESETML), 150 mg kg−1 day−1 (HFD + ESETMM), or 250 mg kg−1 day−1 (HFD + ESETMH) ESETM or 100 mg kg−1 day−1 G. cambogia (HFD + GC) for 7 weeks. Although the groups did not differ significantly in initial body weight, the final body weight differed between the groups. Compared with the ND group, significant weight gain in the HFD group suggests that HFD-induced obesity. ESETM treatment significantly reduced the weight gain in a dose-dependent manner (Figure 2a,b). No significant differences were observed in food intake between the HFD group and ESETM- and GC-treated groups. In comparison with the HFD treatment group, the ESETM and GC treatment groups showed a decrease in the food efficiency ratio in a dose-dependent manner. These results suggest that ESETM and GC did not reduce food intake but reduced food efficiency (Figure 2c,d).
As shown in Table 2, we measured the weight of each organ by dissecting mice after 7 weeks of oral administration of test agents. The weights of the WAT and liver were significantly higher in the HFD group than in the ND group. However, ESETM-treated groups showed a concentration-dependent decrease in the weight of WAT and liver. There was no significant difference in the weight change in height. In addition, the weight of the spleen increased in the mouse group fed with only HFD but did not significantly differ between the control group and the groups treated with ESETM. Therefore, one may speculate that ESETM inhibits the accumulation of fats inside the organ.
AST and ALT levels were measured to investigate hepatotoxicity, and the triglyceride, total cholesterol, HDL, and LDL levels were determined to investigate the blood lipid concentrations. Serum AST and ALT activities, which are widely used as indicators of liver injury, were higher in the HFD group than in the ND group but reduced after oral ESETM treatment [26]. Furthermore, ESETM-treated HFD-fed mice had lower serum concentrations of triglycerides, total cholesterol, and LDL-cholesterol, and higher concentrations of HDL-cholesterol than those fed with HFD alone. The results show that ESETM also regulates blood cholesterol levels (Table 3).

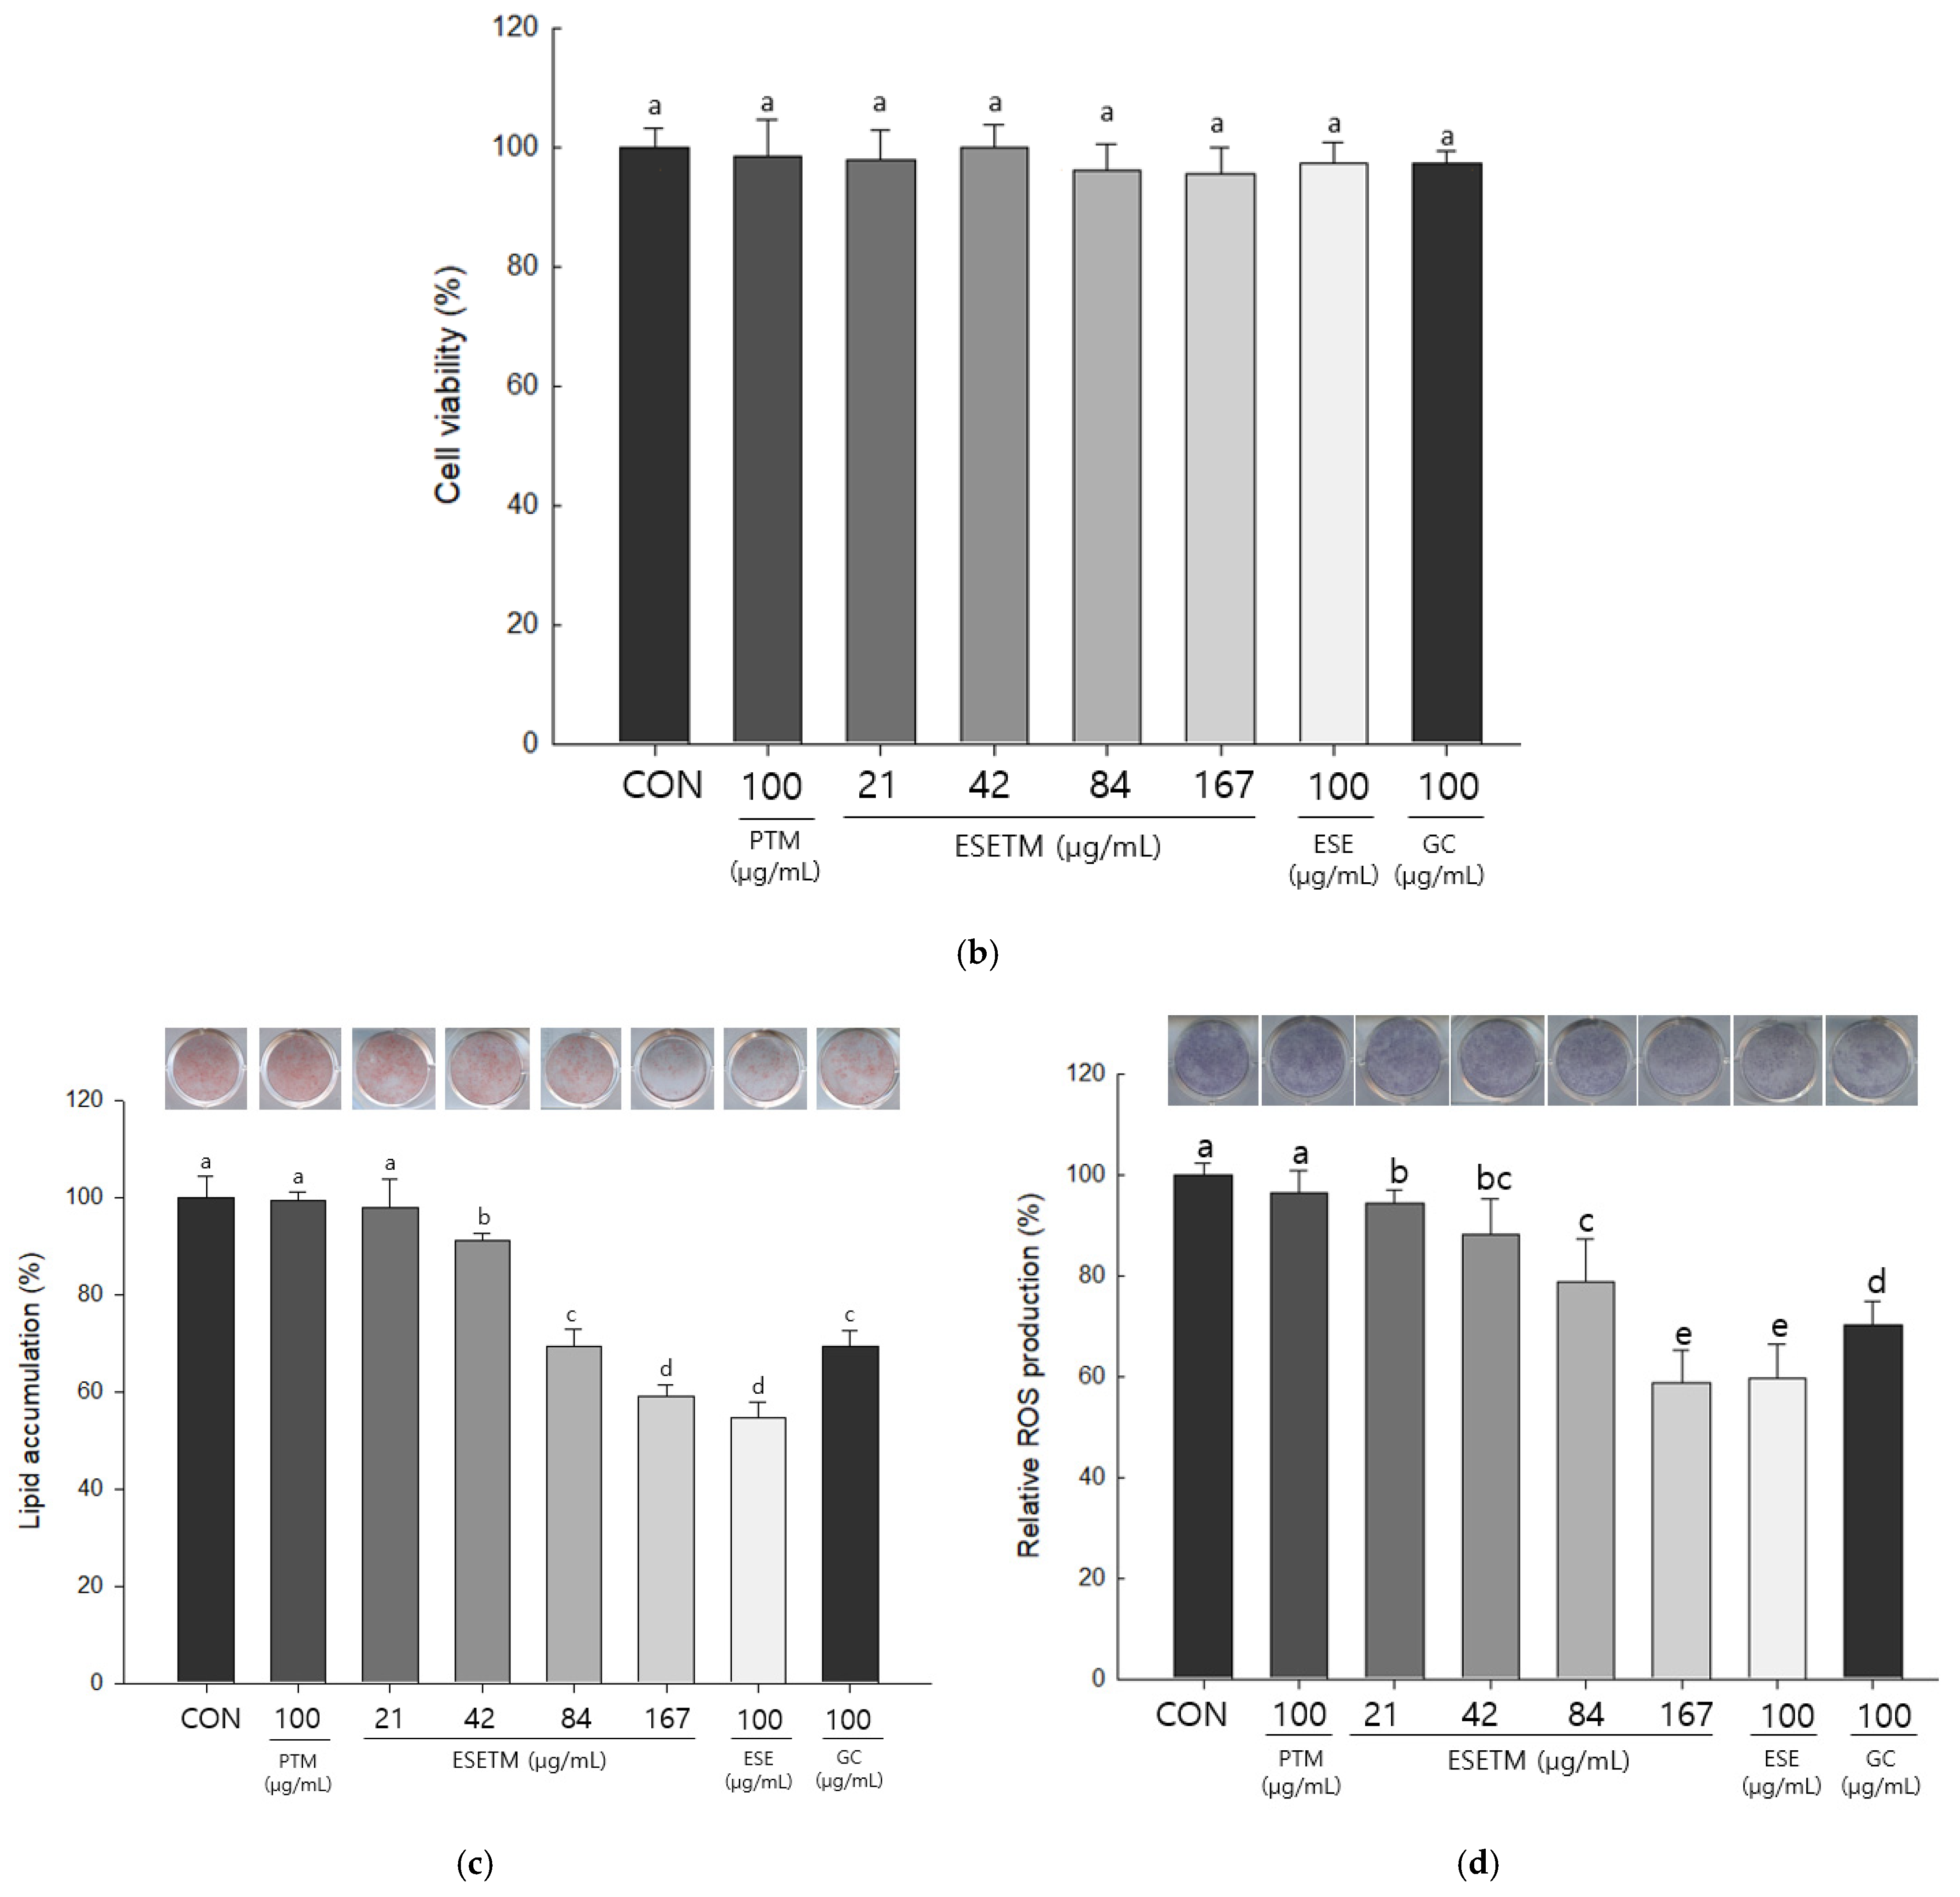
3.3. ESETM Inhibits Lipid Accumulation and ROS Production

To investigate the effect of ESETM on lipid accumulation, histological changes in the WAT were visualized using H&E staining and the adipocyte size in each group was measured. In comparison with the mice from the ND group, those fed with HFD had increased adipocyte size. In contrast, the mice administered ESETM showed a dose-dependent reduction in the adipocyte size, consistent with the reduction in the WAT weight, as compared to the mice fed with only HFD (Figure 3a). We first evaluated the cytotoxicity of PTM, ESE, ESETM, and GC on adipocytes. As shown in Figure 3b, no cytotoxicity was observed in any treatment group or at any tested concentration. The degree of lipid accumulation was measured by treatment with ORO, which stains only triglycerides in red. It was found that fat accumulation decreased in a concentration-dependent manner in the groups treated with ESETM at concentrations of 42, 84, and 167 µg/mL. Lipid accumulation was confirmed in ESETM and GC groups, and PTM treatment did not affect lipid accumulation (Figure 3c). In the NBT assay, the NBT solution reacts with the ROS accumulated in adipocytes to generate dark blue formazan, which is eluted to measure the amount of ROS produced in the cells. We measured the ROS produced during 3T3-L1 adipocyte differentiation and found a decrease in the ROS level after ESETM treatment in a concentration-dependent manner (Figure 3d).

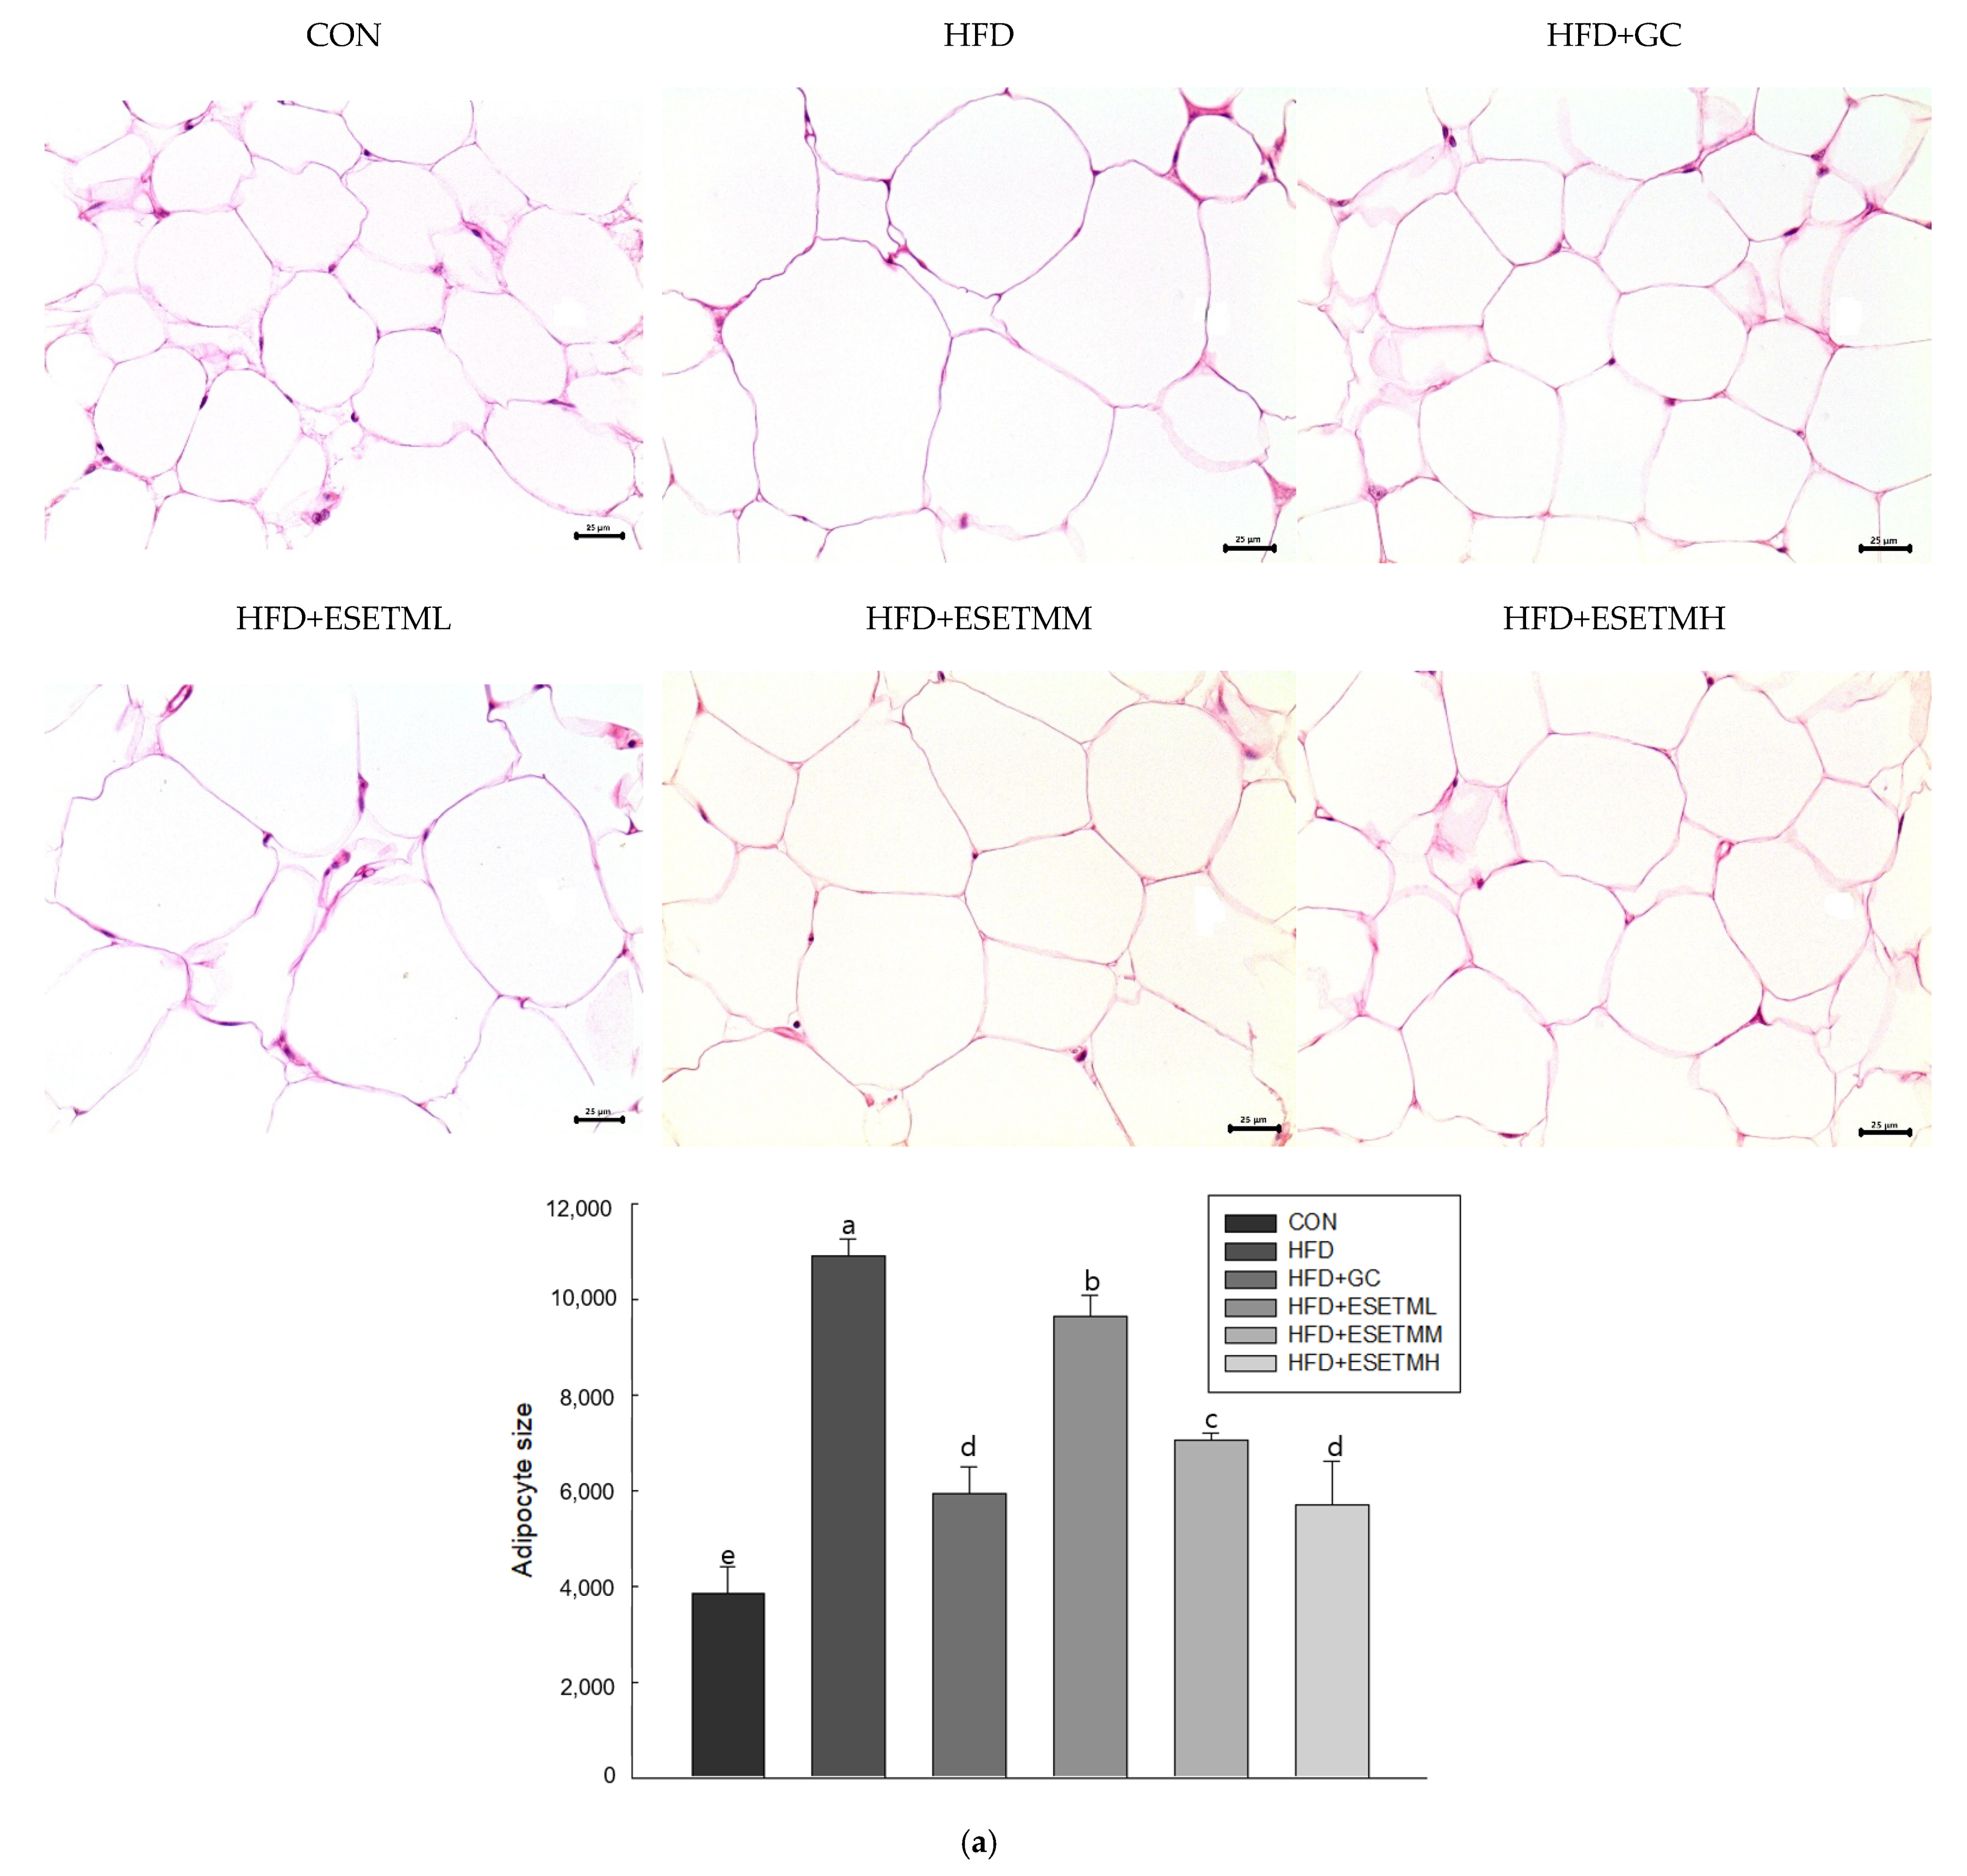
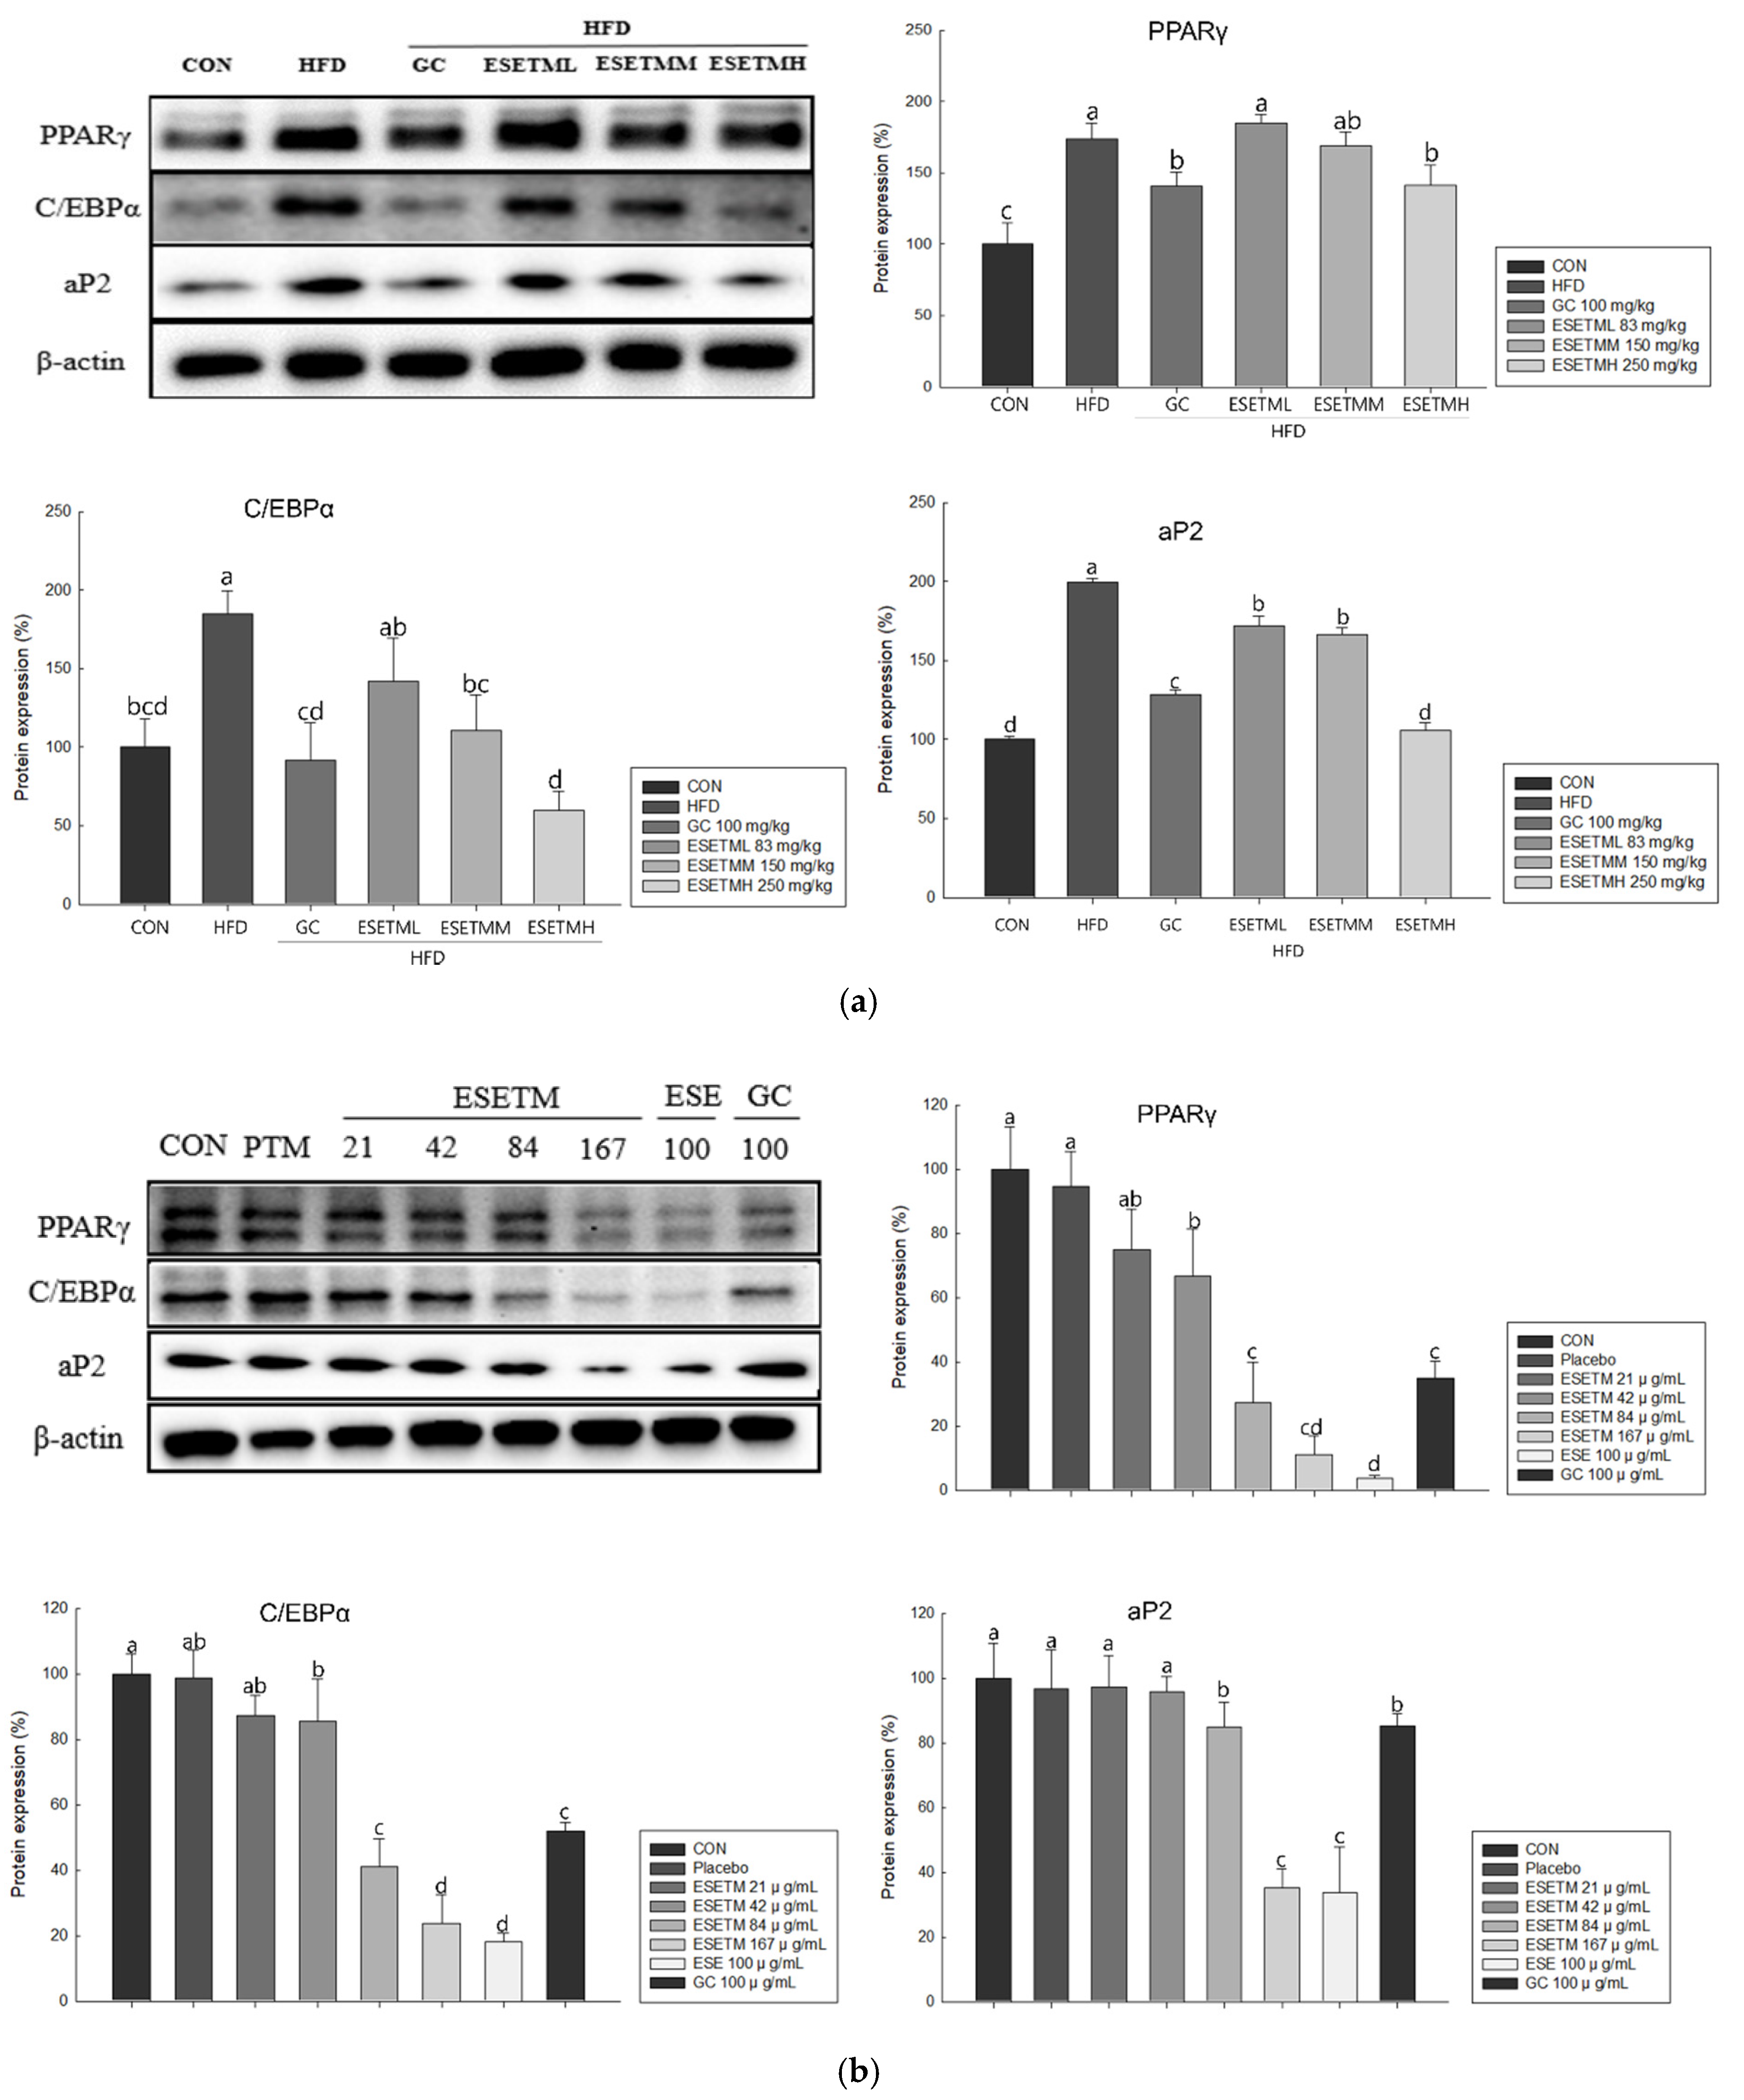
3.4. ESETM Reduces Adipogenesis in the WAT of HFD-Fed Obese Mice and Adipocytes

To determine the mechanism underlying the effect of ESETM on adipogenic differentiation, we measured levels of adipogenesis-related proteins (PPARγ, C/EBPα, and aP2) using Western blotting. As shown in Figure 4a, the expression levels of PPAR-γ, C/EBP-α, and aP2 were higher in HFD-fed mice than in the ND group. However, ESETM significantly inhibited the expression of these proteins in a dose-dependent manner. Similarly, in 3T3-L1 adipocytes, ESETM significantly inhibited the expression levels of these markers in a dose-dependent manner (Figure 4b). The results show that ESETM inhibits adipogenesis in WAT and adipocytes.

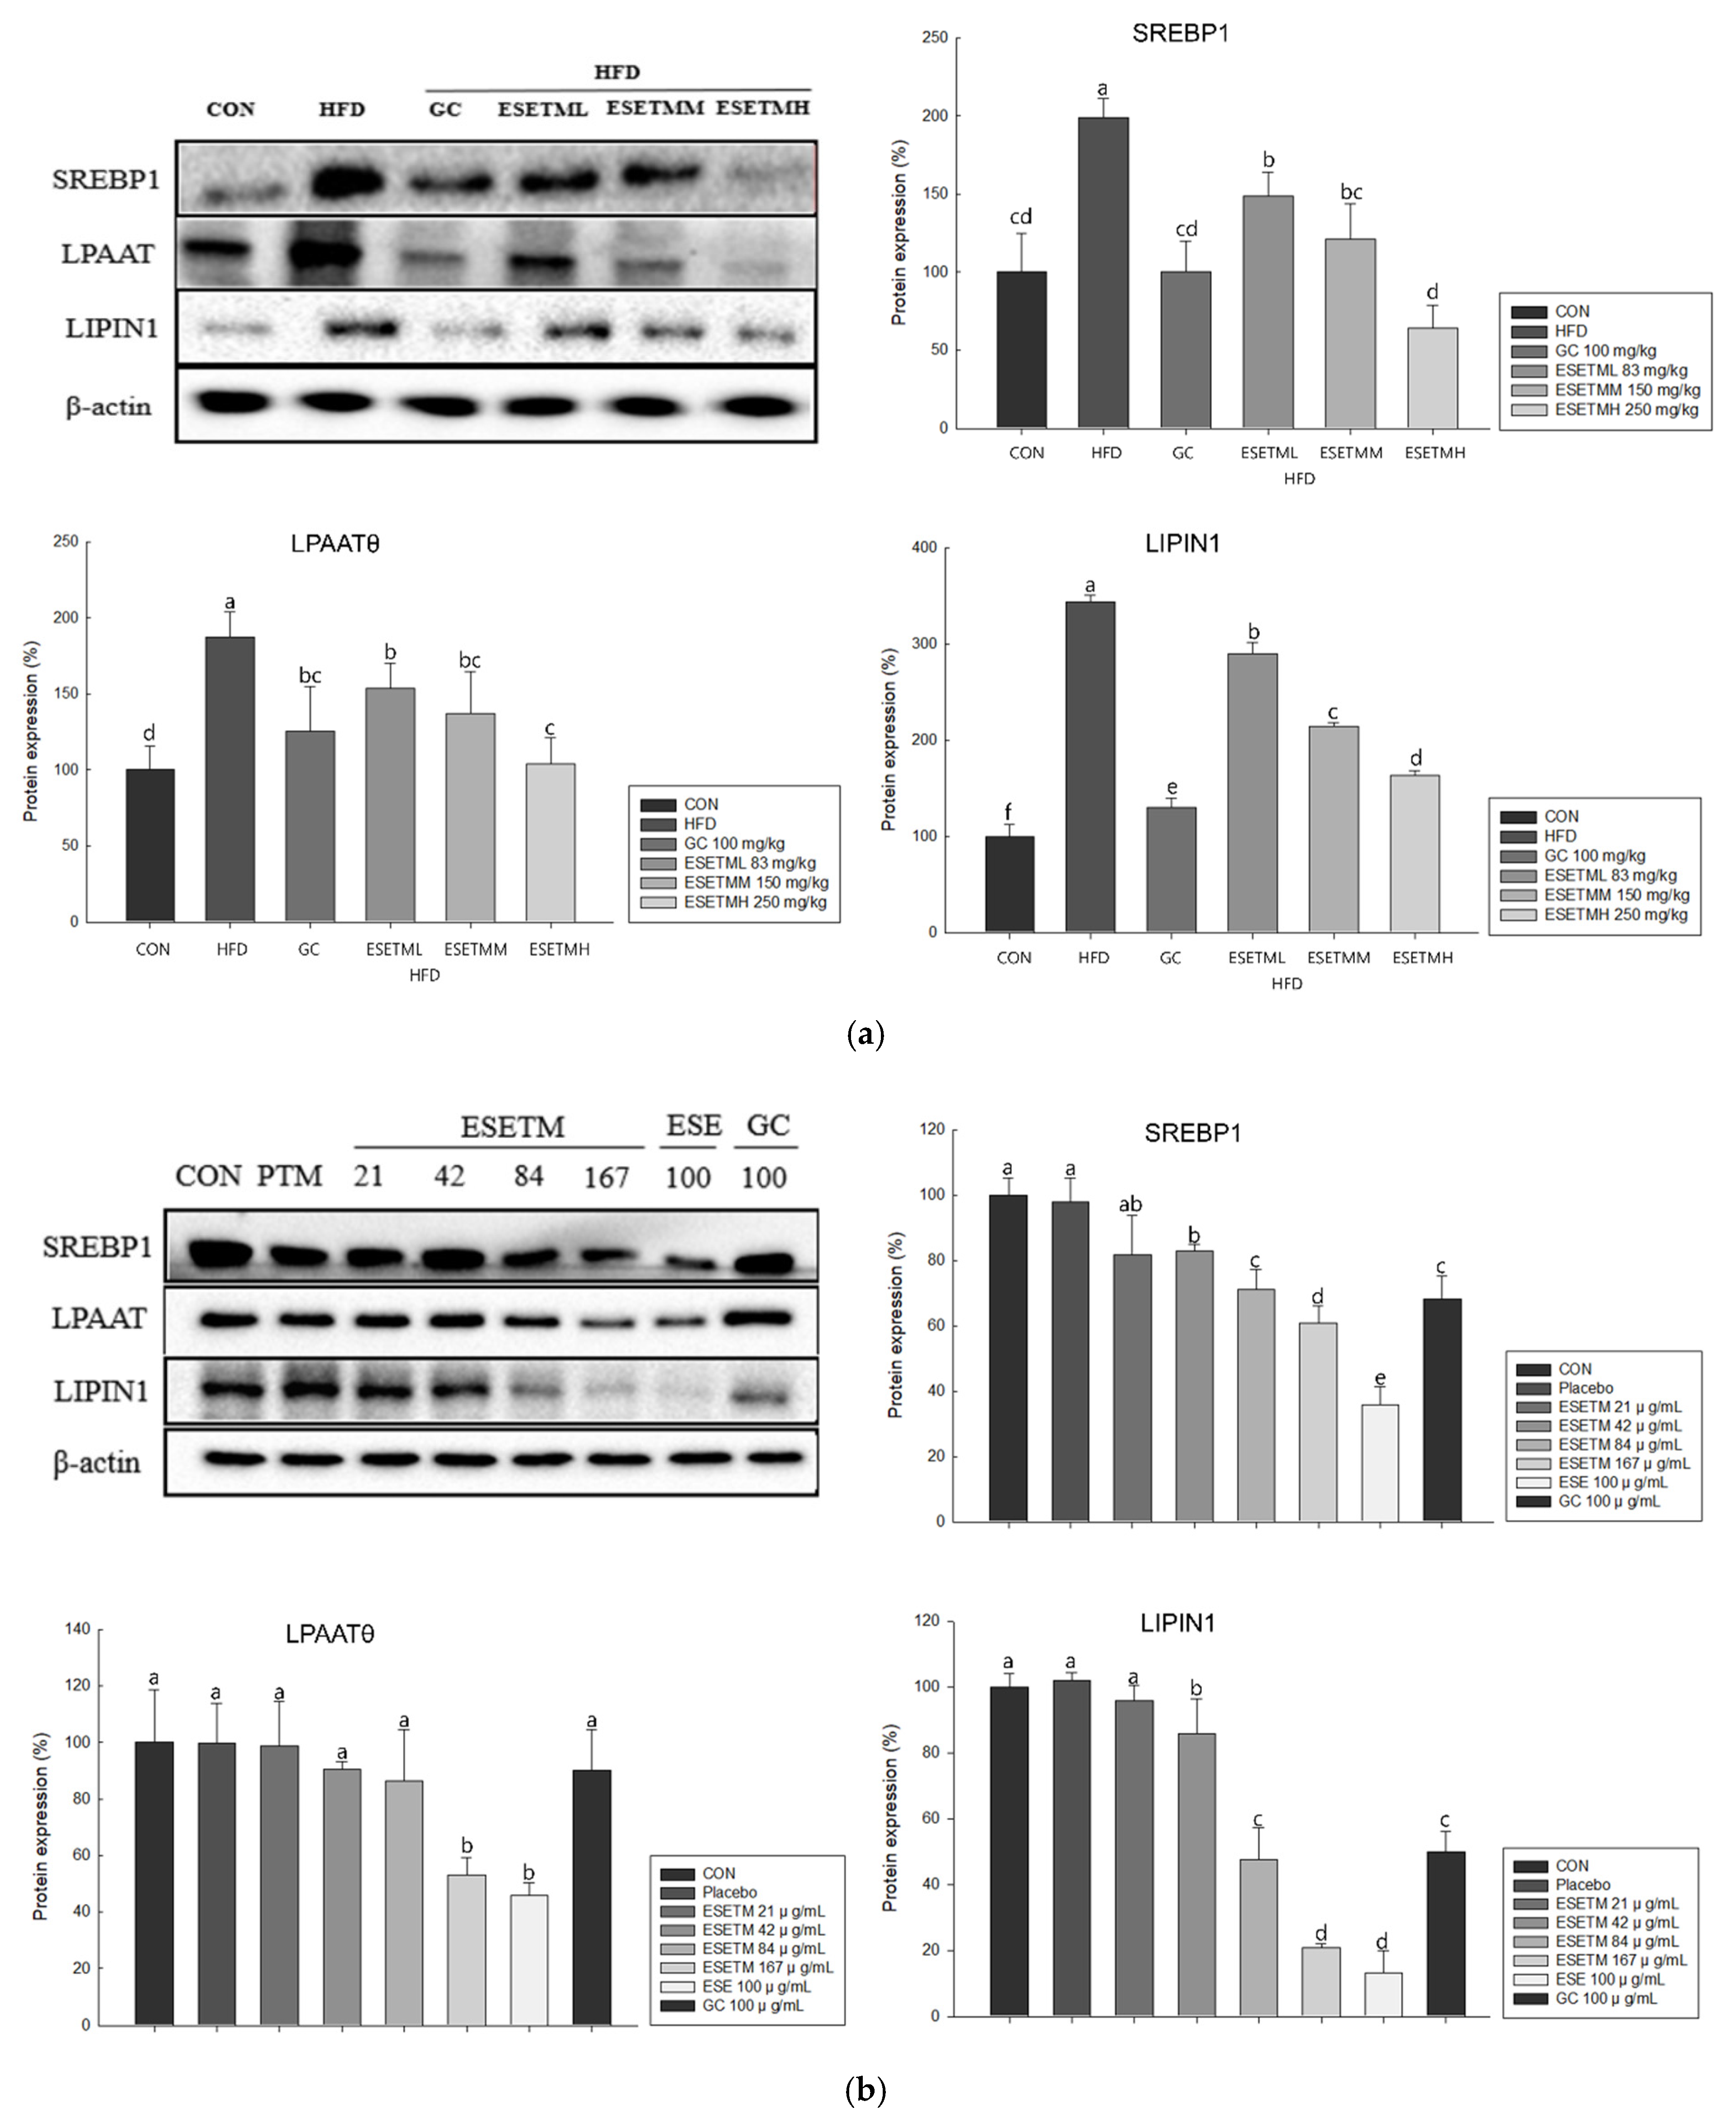
3.5. ESETM Reduces Lipogenesis in HFD-Fed Obese Mice and Adipocytes

We further investigated the effect of ESETM on lipogenesis. As shown in Figure 5a,b and consistent with the adipogenesis results, the WAT of the HFD group had higher expression levels of lipogenic proteins (SREBP1, LPAAT, and lipin1) than the WAT of the ND group; ESETM treatment reduced these elevated protein levels. Moreover, ESETM also significantly decreased the expression levels of these markers in 3T3-L1 adipocytes in a dose-dependent manner. Taken together, these results suggest that ESETM inhibits adipogenesis and lipogenesis in WAT and adipocytes.

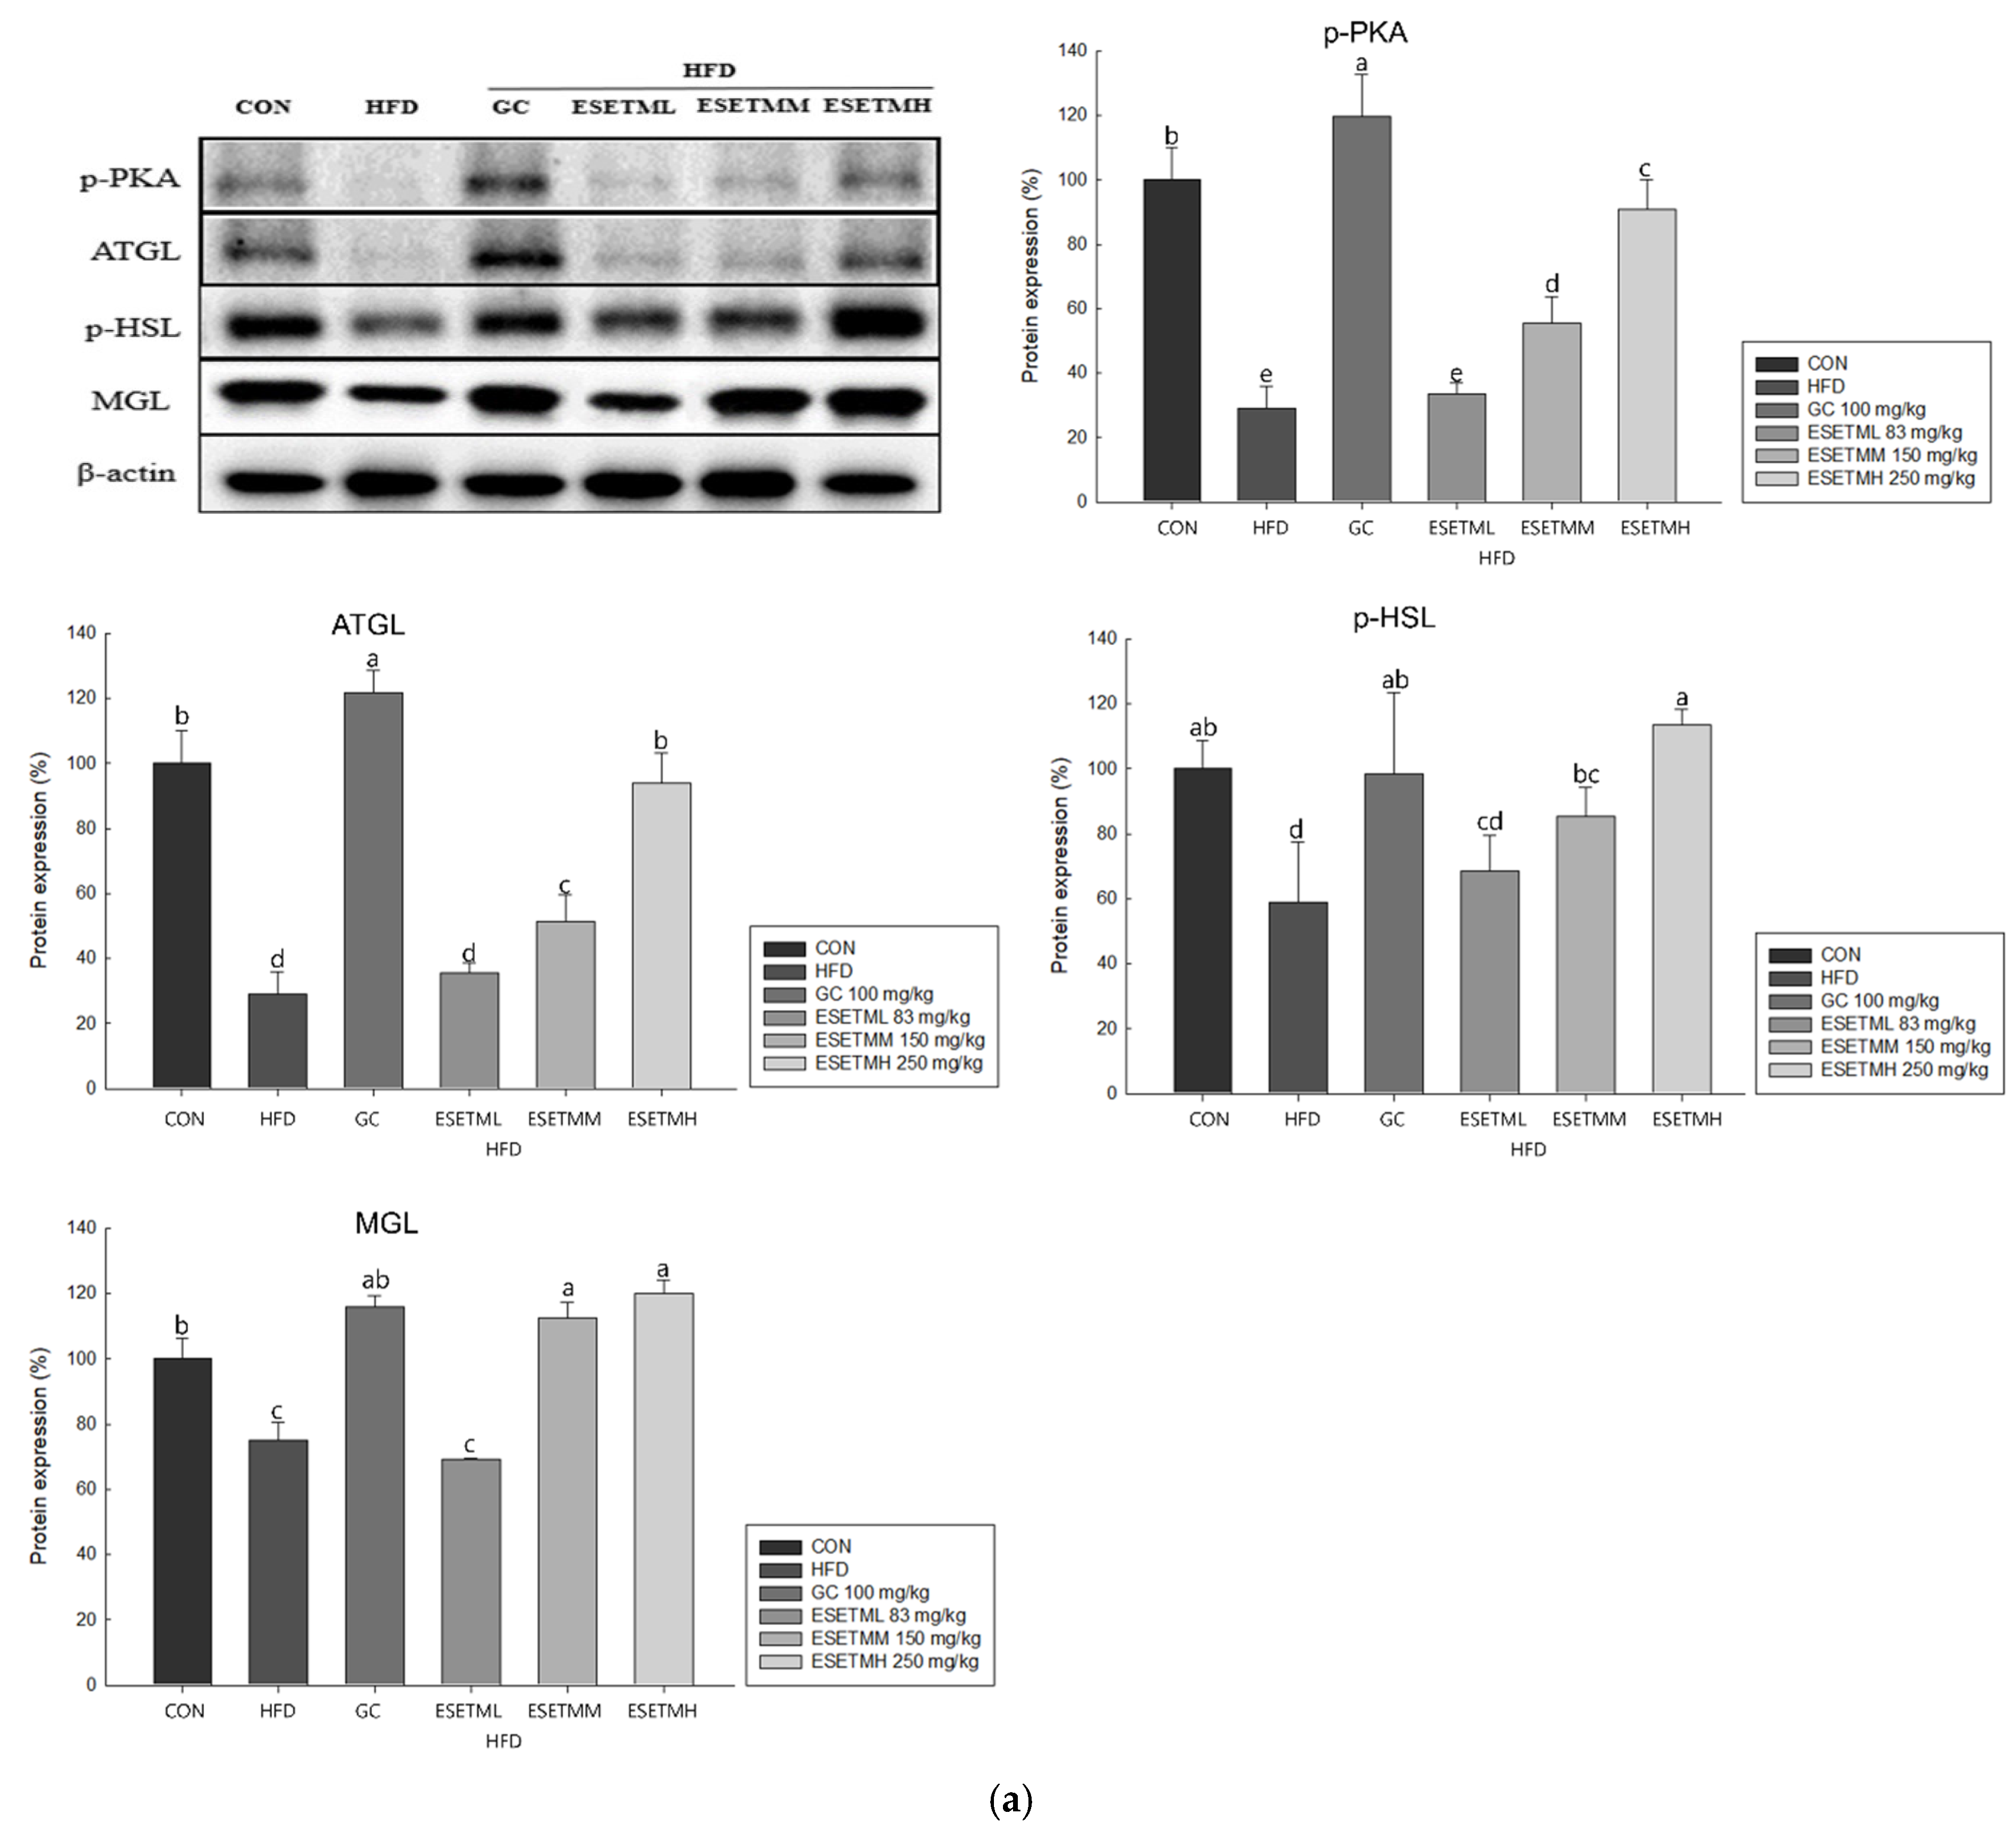
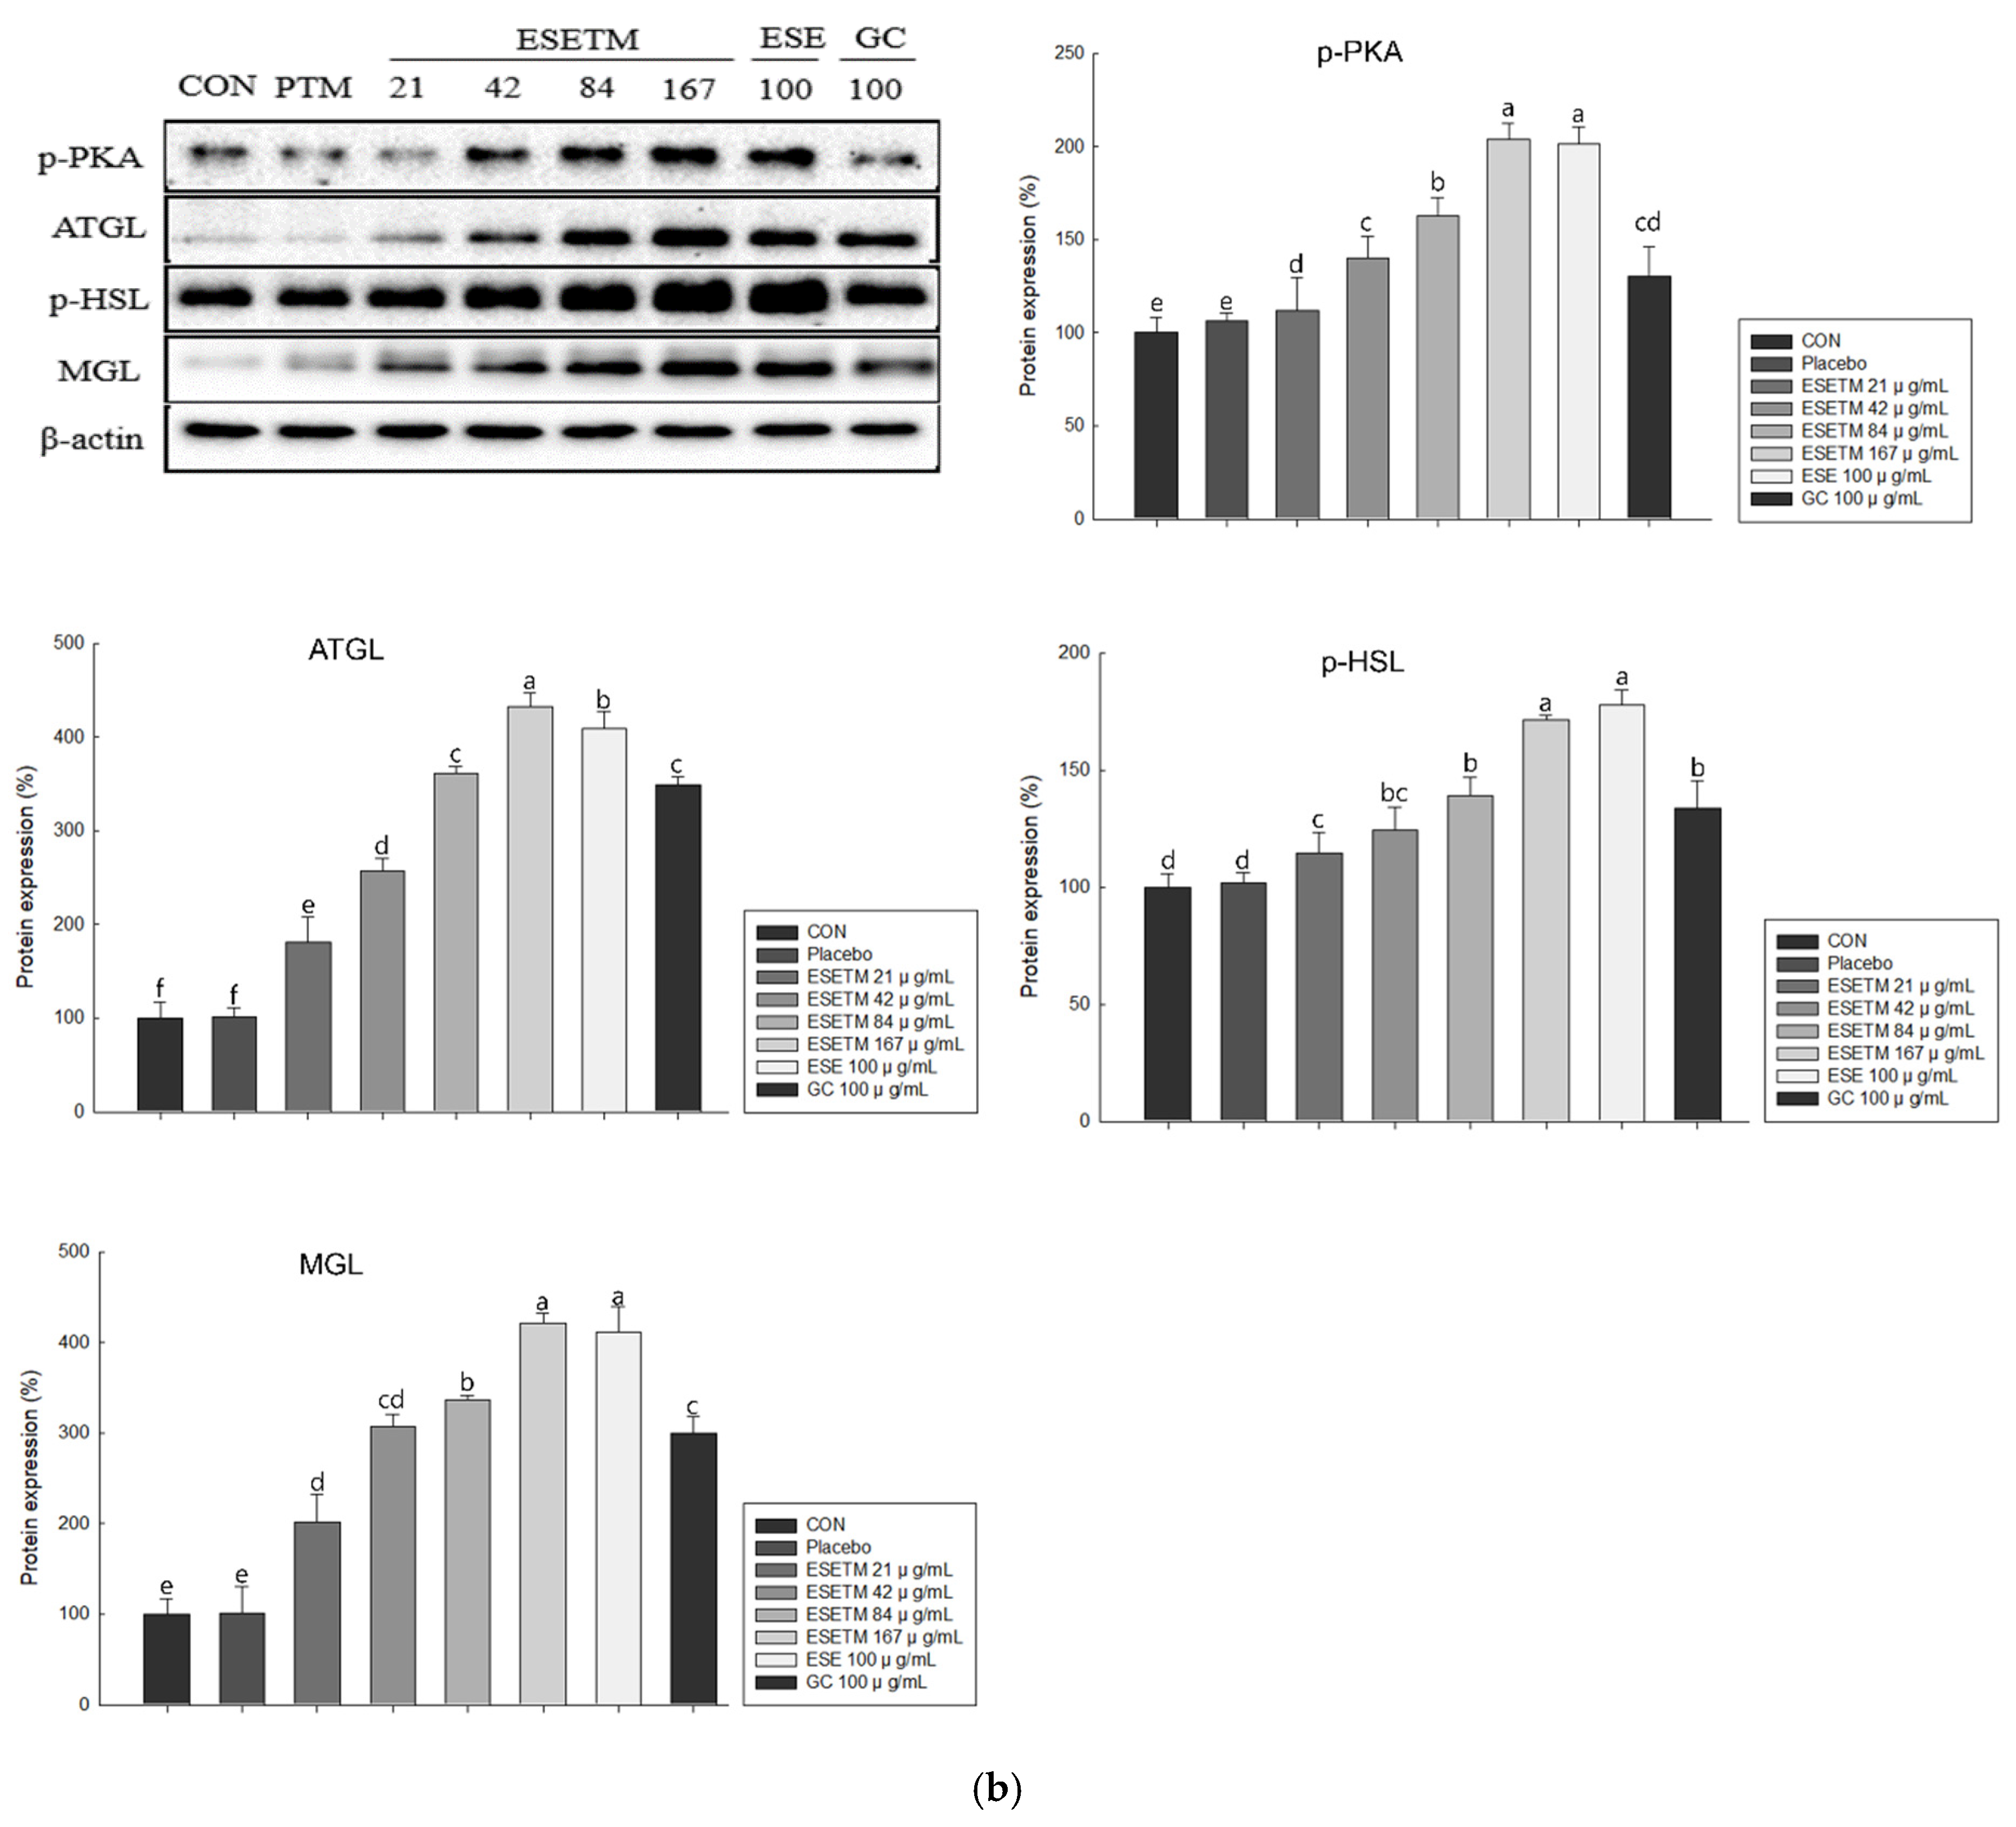
3.6. ESETM Stimulates Lipolysis in HFD-Fed Obese Mice and Adipocytes

PKA, ATGL, HSL, and MGL act as enzymes that break down triglycerides into fatty acids and glycerol. As PKA becomes phosphorylated and activated during lipolysis, ATGL decomposes triglyceride into diglyceride (DG), which is then decomposed by phosphorylated HSL into monoglyceride (MG). Finally, MGL decomposes MG into fatty acids and glycerol [27]. Therefore, we performed Western blot analysis to determine whether ESETM affects PKA phosphorylation and upregulates the expression of lipolytic enzymes to stimulate lipolysis. As shown in Figure 6a, ESETM administration significantly increased the p-PKA and the levels of lipolytic enzymes in the WAT in a dose-dependent manner. The protein expression of lipolytic enzymes (p-PKA, ATGL, p-HSL, and MGL) also increased in a dose-dependent manner in 3T3-L1 adipocytes treated with ESETM (Figure 6b). The results shows that ESETM promoted lipolysis in adipocytes by inducing the phosphorylation of PKA and increasing the expression of lipolytic enzymes.

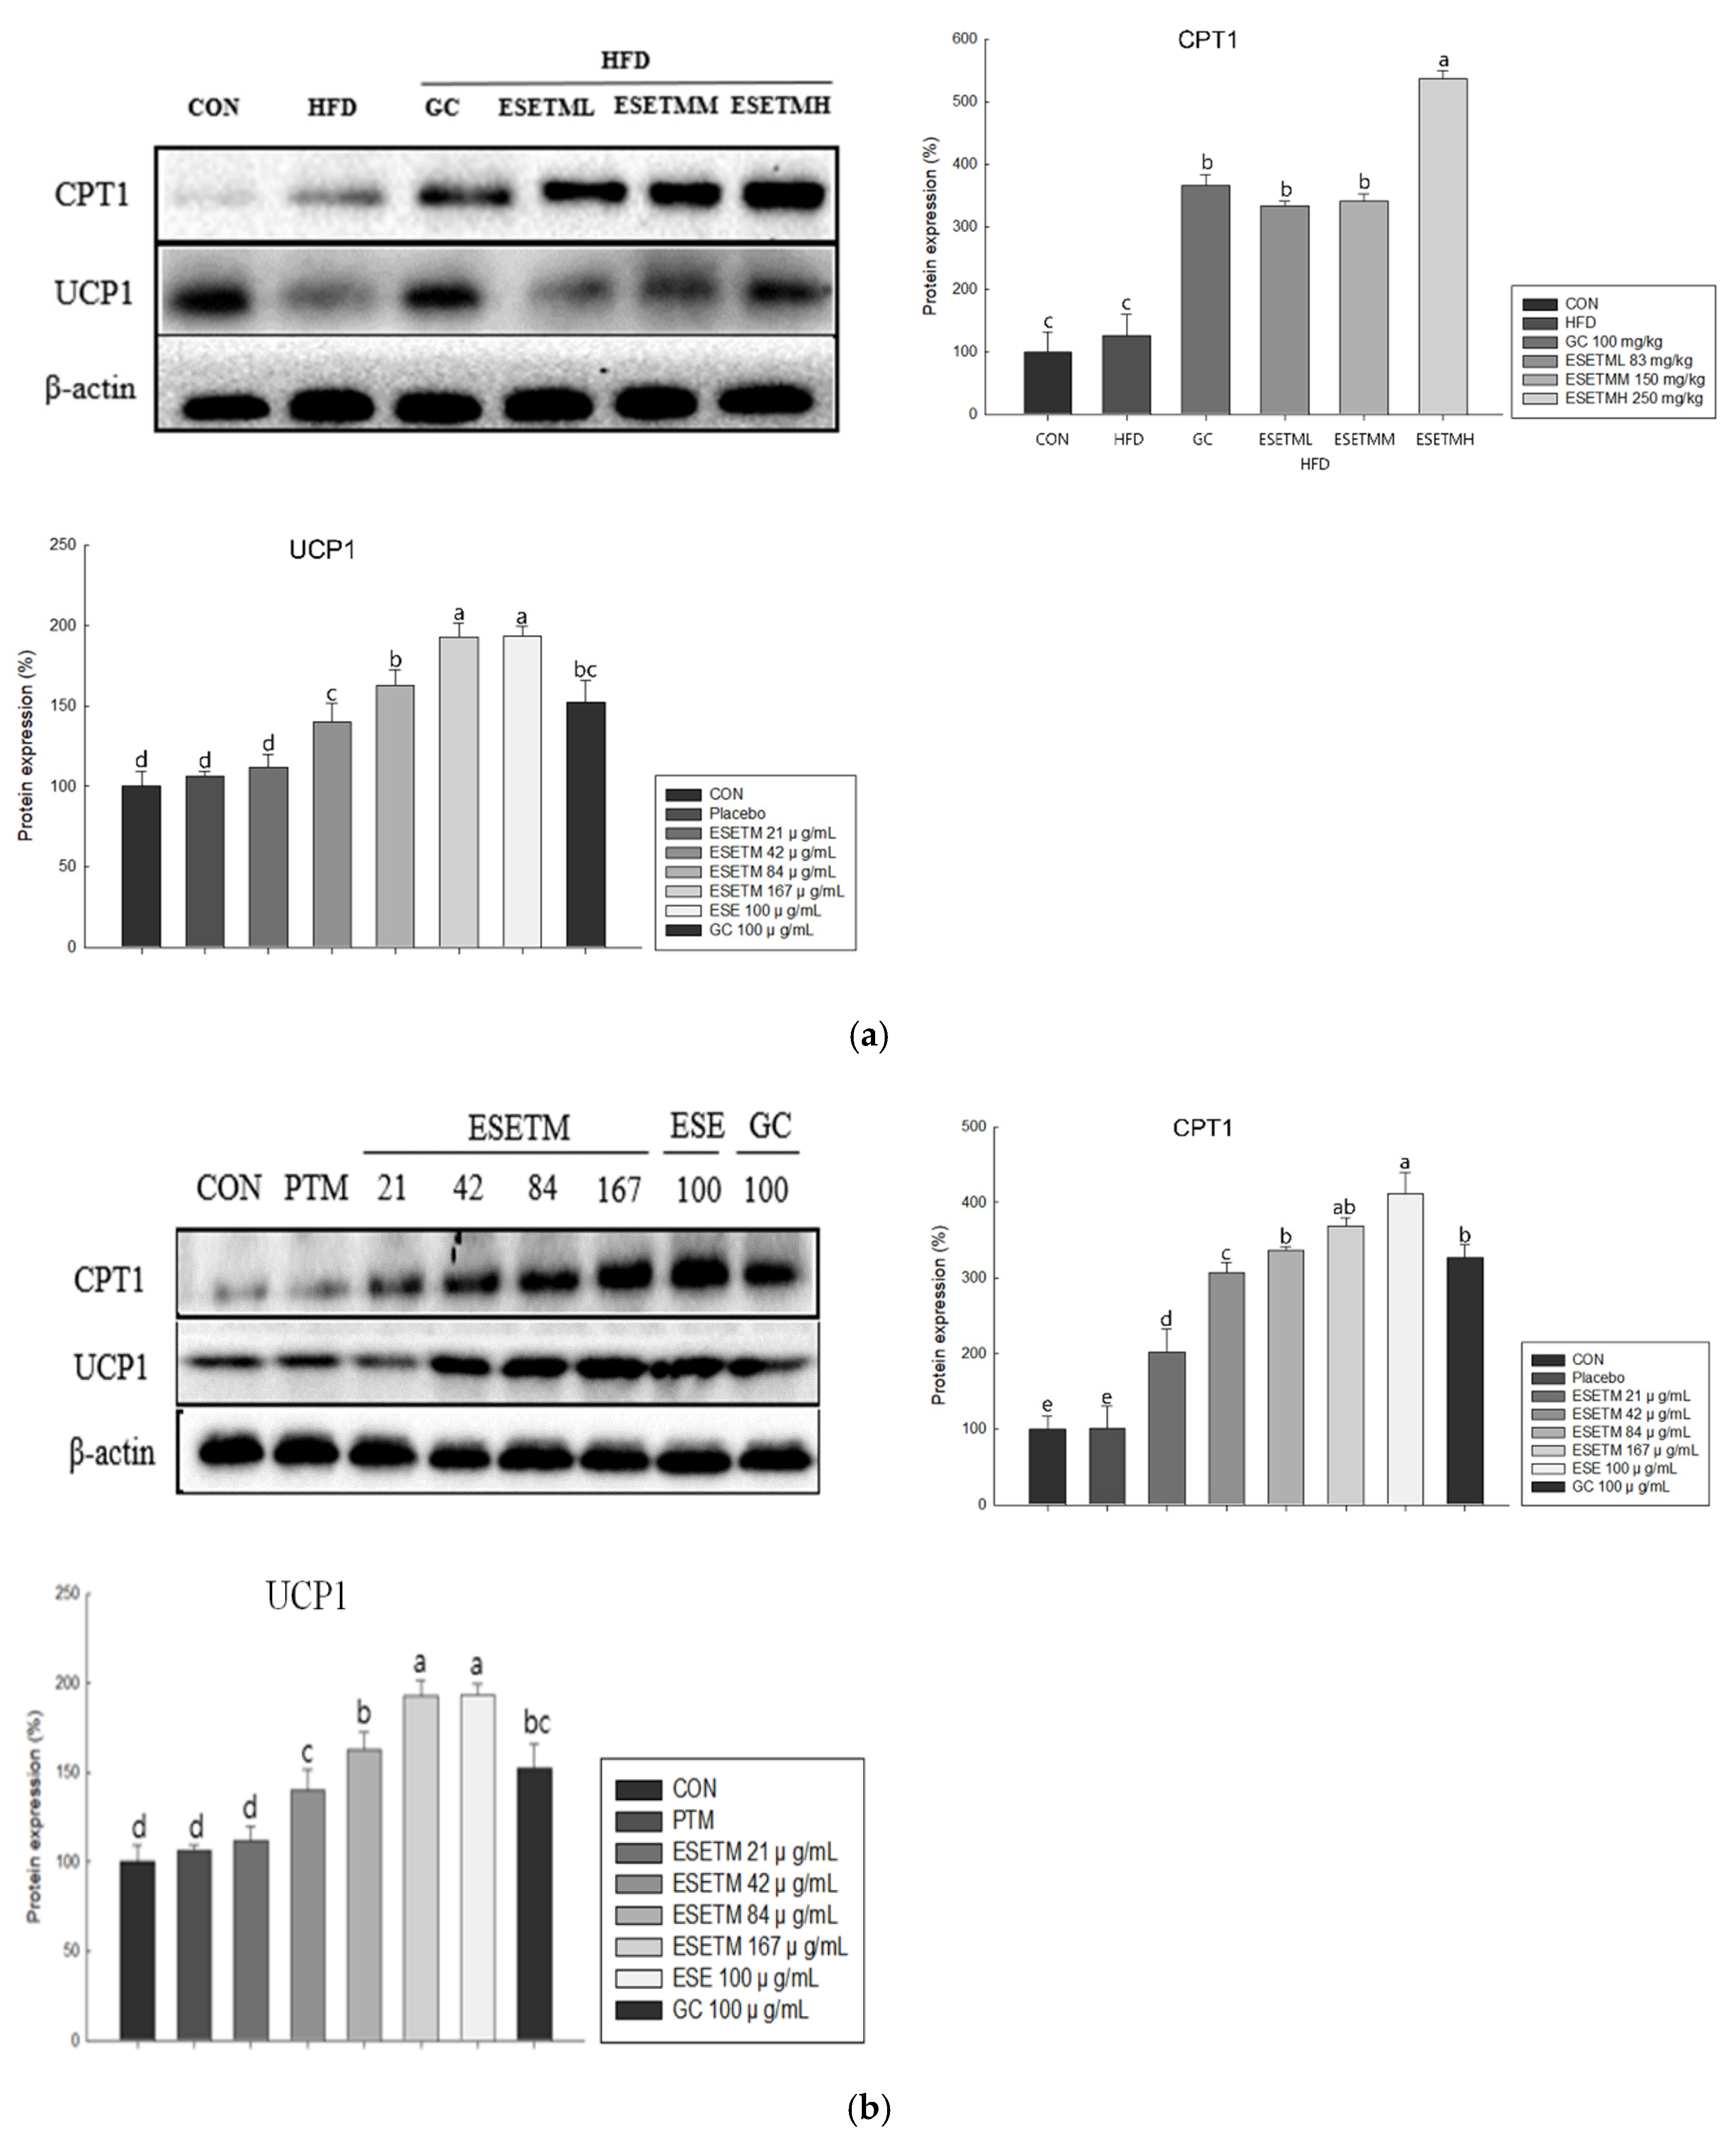
3.7. ESETM Promotes Thermogenesis Browning in HFD-Fed Obese Mice and Adipocytes

Fat browning is accompanied by increased FFA uptake by mitochondria. The BAT uses FFA released through lipolysis, for which the rate-limiting enzyme CPT1 in mitochondrial FAO is critical. The brown fat marker UCP1 is required for thermogenesis to separate respiration from energy production, leading to heat release [28,29]. Therefore, we measured the expression of the thermogenic proteins CPT1 and UPC1. As shown in Figure 7a, ESETM-administered mice showed higher CPT1 and UCP1 protein expression levels than HFD-fed mice. Furthermore, ESETM dose-dependently increased these protein expression levels in 3T3-L1 adipocytes (Figure 7b). Thus, ESETM promotes browning through the expression of CPT1 and UCP1 in the mitochondrion, resulting in more significant energy expenditure in the form of heat loss.

4. Discussion

Obesity is caused by an imbalance between energy intake and expenditure. Excess energy is stored in white adipose tissue in the form of triglycerides, and as cells grow and expand, excess fat accumulates [30]. A current research trend is using natural dietary compounds to treat and prevent obesity through fat browning and its associated lipid metabolism in energy expenditure [31]. The present study assessed whether ESETM could prevent obesity, inhibit fat accumulation, and upregulate proteins associated with lipolysis and browning pathways using high-fat-induced obese mice and 3T3 cells. Our findings will support ESETM as a novel anti-obesity agent with energy expenditure modulating properties. E. stolonifera, brown algae, is a natural functional raw material that can be used as a food material. Seaweeds are rich in various bioactive compounds, notably phlorotannin, which may have potential health benefits [32,33,34,35,36]. In 3T3-L1 adipocytes, E. stolonifera inhibits adipogenesis activity by downregulating C/EBPα and PPARγ expression and improving lipolysis and adipocyte browning [23,37]. However, the effects of clinical trial material made with ESE (ESETM) on adipocyte lipolysis and browning, on the other hand, have not been studied. Furthermore, more animal studies are required to assess the efficacy of ESETM as an anti-obesity agent. As a result, we investigated the anti-obesity effect of ESETM, using in vivo and in vitro models in this study.
Excessive consumption of a high-fat diet may result in weight gain secondary to WAT accumulation [38]. As expected, mice fed the high-fat diet became obese and had higher WAT than mice fed the control diet. However, giving ESETM to HFD-fed mice for seven weeks significantly improved weight gain and decreased adipocyte size in WAT. HFD-induced obesity was also associated with higher serum triglyceride and cholesterol concentrations. In the present study, ESETM decreased serum TG, TC, and LDL-C and increased HDL-C levels [39]. We also measured adipogenic protein expression in WAT for each group using Western blot analysis. ESETM reduced the expression of C/EBPα, PPARγ, and aP2 in HFD-fed mice, which are required for the late stages of preadipocyte differentiation. Furthermore, ESETM reduced the expression of the lipogenic proteins SREBP1, LPAATθ, and lipin1, which may reduce lipid synthesis. These proteins’ expression was also reduced to a similar extent after treatment of 3T3-L1 cells with ESETM. Thus, in vivo and in vitro data suggest that ESETM can prevent the development of HFD-induced obesity by regulating adipogenesis and the expression of adipogenesis factors.
Lipolysis is the hydrolysis of triglycerides stored in adipocytes. This hydrolysis process is activated by PKA and induces phosphorylation of HSL to release free fatty acids for oxidation in mitochondria. PKA can also induce lipolytic enzymes, such as ATGL, HSL, and MGL [40,41,42]. In this study, we prove that ESETM treatment increased the expression of p-PKA, ATGL, p-HSL, and MGL in HFD-fed mice.
Expressed in the inner mitochondrial membrane, UCP1 is a hallmark brown adipocyte protein responsible for the energy-expending phenotype of brown adipose tissue. Furthermore, increased UCP1 expression suggests that mitochondrial activity is critical for the browning effect, and its expression in WAT drives the development of brown adipose tissue-like features [43,44]. Western blot results showed that ESETM increased dose-dependent thermogenic gene expression (UCP1) in high-fat diet-fed mice in the present study. Furthermore, ESETM promoted the expression of CPT1, an enzyme that facilitates the transfer of free fatty acids into mitochondria, the rate-limiting enzyme for β-oxidation, and the expression of UCP1 and CPT1 also can promote fat browning. Similarly, ESETM also promoted the expression of these UCP1 and CPT1 in adipocytes. As a result, by increasing the expression of these proteins, ESETM may increase energy expenditure. These findings shows that ESETM may increase energy expenditure by upregulating the expression of thermogenesis and browning in HFD-fed obese mice.
We demonstrate that ESETM inhibits fat accumulation in the WAT by reduced adipogenesis and lipogenesis. Mover, we provide evidence that ESETM promotes lipolysis and β-oxidation, increases WAT browning, and promotes the loss of energy as heat. The findings show that the clinical trial material containing E. stolonifera extract exerts excellent effects on body fat improvement.

Author Contributions

Conceptualization, O.-H.L. and B.-Y.L.; Investigation, X.M., S.-J.L., H.J. and H.-J.O.; Writing—original draft preparation, X.H.; Writing—review and editing, S.-I.C.; Project administration, E.K. and J.K.; Supervision, O.-H.L. and B.-Y.L. All authors have read and agreed to the published version of the manuscript.

Funding

This research was a part of the project titled “Development and product commercialization of functional food ingredient approved by KFDA for body fat reduction using Ecklonia stolonifera extract (No. 20200362)”, funded by the Ministry of Oceans and Fisheries, Korea. the BK21 FOUR (Fostering Outstanding Universities for Research) (4299990913942) funded by the Ministry of Education (MOE, Korea) and National Research Foundation of Korea (NRF), and the Basic Science Research Program (NRF-2017R1D1A3B0602846915) through the National Research Foundation of Korea (NRF) funded by the Ministry of Education (MOE, Korea).

Institutional Review Board Statement

The entire experiment was carried out with the approval of the Experimental Animal Steering Committee and the Animal Experimentation Ethics Committee of Kangwon National University (Approval Number KW-200810-1).

Data Availability Statement

The data presented in this study are available within this article.

Conflicts of Interest

The authors declare no conflict of interest.

References

  1. Spiegelman, B.M.; Flier, J.S. Obesity and the regulation of energy balance. Cell 2001, 104, 531–543. [Google Scholar] [CrossRef] [Green Version]
  2. Ballinger, A.; Peikin, S.R. Orlistat: Its current status as an anti-obesity drug. Eur. J. Pharmacol. 2002, 440, 109–117. [Google Scholar] [CrossRef]
  3. Rodgers, R.J.; Tschop, M.H.; Wilding, J.P. Anti-obesity drugs: Past, present and future. Dis. Model. Mech. 2012, 5, 621–626. [Google Scholar] [CrossRef] [Green Version]
  4. Cheung, B.M.Y.; Cheung, T.T.; Samaranayake, N.R. Safe of antiobesity drugs. Ther. Adv. Drug. Saf. 2013, 4, 171–181. [Google Scholar] [CrossRef] [PubMed] [Green Version]
  5. Lee, T.K.; Lee, W.S.; Hwang, J.T.; Kwon, D.Y.; Surh, Y.J.; Park, O.J. Curcumin exerts antidifferentiation effect through AMPKalpha-PPAR -gamma in 3T3-L1 adipocytes and anti-proliferatory effect through AMPKalpha-COX-2 in cancer cells. J. Agric. Food Chem. 2009, 57, 305–310. [Google Scholar] [CrossRef] [PubMed]
  6. Rosen, E.D.; Spiegelman, B.M. Molecular regulation of adipogenesis. Annu. Rev. Cell Dev. Biol. 2000, 16, 145–171. [Google Scholar] [CrossRef]
  7. de Sa, P.M.; Richard, A.J.; Hang, H.; Stephens, J.M. Transcriptional regulation of adipogenesis. Compr. Physiol. 2017, 7, 635–674. [Google Scholar]
  8. Smith, U.; Kahn, B.B. Adipose tissue regulates insulin sensitivity: Role of adipogenesis, de novo lipogenesis and novel lipids. J. Intern. Med. 2016, 280, 465–475. [Google Scholar] [CrossRef] [Green Version]
  9. Gale, S.E.; Frolov, A.; Han, X.; Bickel, P.E.; Cao, L.; Bowcock, A.; Ory, D.S. A regulatory role for 1-acylglycerol-3-phosphate-O-acyltransferase 2 in adipocyte differentiation. J. Biol. Chem. 2006, 281, 11082–11089. [Google Scholar] [CrossRef] [Green Version]
  10. Chen, Y.; Rui, B.B.; Tang, L.Y.; Hu, C.M. Lipin family proteins-key regulators in lipid metabolism. Ann. Nutr. Metab. 2015, 66, 10–18. [Google Scholar] [CrossRef]
  11. Koh, Y.K.; Lee, M.Y.; Kim, J.W.; Kim, M.; Moon, J.S.; Lee, Y.J.; Kim, K.S. Lipin1 is a key factor for the maturation and maintenance of adipocytes in the regulatory network with CCAAT/enhancer-binding protein alpha and peroxisome proliferator-activated receptor gamma 2. J. Biol. Chem. 2008, 283, 34896–34906. [Google Scholar] [CrossRef] [PubMed] [Green Version]
  12. Takeuchi, K.; Reue, K. Biochemistry, physiology, and genetics of GPAT, AGPAT, and lipin enzymes in triglyceride synthesis. Am. J. Physiol. Endocrinol. Metab. 2009, 296, E1195–E1209. [Google Scholar] [CrossRef] [PubMed] [Green Version]
  13. Goodman, J.M. Demonstrated and inferred metabolism associated with cytosolic lipid droplets. J. Lipid Res. 2009, 50, 2148–2156. [Google Scholar] [CrossRef] [PubMed] [Green Version]
  14. Zechner, R.; Kienesberger, P.C.; Haemmerle, G.; Zimmermann, R.; Lass, A. Adipose triglyceride lipase and the lipolytic catabolism of cellular fat stores. J. Lipid Res. 2009, 50, 3–21. [Google Scholar] [CrossRef] [PubMed] [Green Version]
  15. Ji, Y.; Lee, J.H.; Han, J.S.; Kong, J.; Kim, J.B. Pka subunit balance plays a key role in lipolysis. FASEB J. 2017, 31, 770.15. [Google Scholar]
  16. Bartelt, A.; Heeren, J. Adipose tissue browning and metabolic health. Nat. Rev. Endocrinol. 2014, 10, 24–36. [Google Scholar] [CrossRef]
  17. LO, K.A.; Sun, L. Turning WAT into BAT: A review on regulators controlling the browning of white adipocytes. Biosci. Rep. 2013, 33, e00065. [Google Scholar] [CrossRef]
  18. Fedorenko, A.; Lishko, P.V.; Kirichok, Y. Mechanism of fatty-acid-dependent UCP1 uncoupling in brown fat mitochondria. Cell 2012, 151, 400–413. [Google Scholar] [CrossRef] [Green Version]
  19. Houten, S.M.; Violante, S.; Ventura, F.V.; Wanders, R.J. The biochemistry and physiology of mitochondrial fatty acid β-oxidation and its genetic disorders. Annu. Rev. Physiol. 2016, 78, 23–44. [Google Scholar] [CrossRef] [Green Version]
  20. Kang, H.S.; Kim, H.R.; Byun, D.S.; Son, B.W.; Nam, T.J.; Choi, J.S. Tyrosinase inhibitors isolated from the edible brown alga Ecklonia stolonifera. Arch. Pharm. Res. 2004, 27, 1226–1232. [Google Scholar] [CrossRef]
  21. Kim, A.R.; Shin, T.S.; Lee, M.S.; Park, J.Y.; Park, K.E.; Yoon, N.Y.; Kim, H.R. Isolation and identification of phlorotannins from Ecklonia stolonifera with antioxidant and anti-inflammatory properties. J. Agric. Food Chem. 2009, 57, 3483–3489. [Google Scholar] [CrossRef] [PubMed]
  22. Iwai, K. Antidiabetic and antioxidant effects of polyphenols in brown alga Ecklonia stolonifera in genetically diabetic KK-A y mice. Plant Foods Hum. Nutr. 2008, 63, 163. [Google Scholar] [CrossRef] [PubMed]
  23. Jin, H.; Lee, K.; Chei, S.; Oh, H.J.; Lee, K.P.; Lee, B.Y. Ecklonia stolonifera extract suppresses lipid accumulation by promoting lipolysis and adipose browning in high-fat diet-induced obese male mice. Cells 2020, 9, 871. [Google Scholar] [CrossRef] [Green Version]
  24. Jin, H.; Oh, H.J.; Kim, J.; Lee, K.P.; Han, X.; Lee, O.H.; Lee, B.Y. Effects of Ecklonia stolonifera extract on the obesity and skeletal muscle regeneration in high-fat diet-fed mice. J. Funct. Foods 2021, 82, 104511. [Google Scholar] [CrossRef]
  25. Bang, C.Y.; Byun, J.H.; Choi, H.K.; Choi, J.S.; Choung, S.Y. Protective effects of Ecklonia stolonifera extract on ethanol-induced fatty liver in rats. Biomol. Ther. 2016, 24, 650. [Google Scholar] [CrossRef] [PubMed] [Green Version]
  26. Goorden, S.M.; Buffart, T.E.; Bakker, A.; Buijs, M.M. Liver disorders in adults: Alt and ast. Ned. Tijdschr. Voor Geneeskd. 2013, 157, A6443. [Google Scholar]
  27. Bolsoni-Lopes, A.; Alonso-Vale, M.I.C. Lipolysis and lipases in white adipose tissue–An update. Arch. Endocrinol. Metab. 2015, 59, 335–342. [Google Scholar] [CrossRef] [Green Version]
  28. Garcia, R.A.; Roemmich, J.N.; Claycombe, K.J. Evaluation of markers of beige adipocytes in white adipose tissue of the mouse. Nutr. Metab. 2016, 13, 24. [Google Scholar] [CrossRef] [Green Version]
  29. Calderon-Dominguez, M.; Mir, J.F.; Fucho, R.; Weber, M.; Serra, D.; Herrero, L. Fatty acid metabolism and the basis of brown adipose tissue function. Adipocyte 2016, 5, 98–118. [Google Scholar] [CrossRef] [Green Version]
  30. Jo, J.; Gavrilova, O.; Pack, S.; Jou, W.; Mullen, S.; Sumner, A.E.; Periwal, V. Hypertrophy and/or hyperplasia: Dynamics of adipose tissue growth. PLoS Comput. Biol. 2009, 5, e1000324. [Google Scholar] [CrossRef]
  31. Chou, Y.C.; Ho, C.T.; Pan, M.H. Immature Citrus reticulata extract promotes browning of beige adipocytes in high-fat diet-induced C57BL/6 mice. J. Agric. Food Chem. 2018, 66, 9697–9703. [Google Scholar] [CrossRef] [PubMed]
  32. Balboa, E.M.; Conde, E.; Moure, A.; Falqué, E.; Domínguez, H. In vitro antioxidant properties of crude extracts and compounds from brown algae. Food Chem. 2013, 138, 1764–1785. [Google Scholar] [CrossRef]
  33. Hu, X.; Tao, N.; Wang, X.; Xiao, J.; Wang, M. Marine-derived bioactive compounds with anti-obesity effect: A review. J. Funct. Foods 2016, 21, 372–387. [Google Scholar] [CrossRef]
  34. Pangestuti, R.; Kim, S.K. Biological activities and health benefit effects of natural pigments derived from marine algae. J. Funct. Foods 2011, 3, 255–266. [Google Scholar] [CrossRef]
  35. Wan-Loy, C.; Siew-Moi, P. Marine algae as a potential source for anti-obesity agents. Mar. Drugs 2016, 14, 222. [Google Scholar] [CrossRef] [PubMed] [Green Version]
  36. Sharma, P.P.; Baskaran, V. Polysaccharide (laminaran and fucoidan), fucoxanthin and lipids as functional components from brown algae (Padina tetrastromatica) modulates adipogenesis and thermogenesis in diet-induced obesity in C57BL6 mice. Algal Res. 2021, 54, 102187. [Google Scholar] [CrossRef]
  37. Jung, H.A.; Jung, H.J.; Jeong, H.Y.; Kwon, H.J.; Ali, M.Y.; Choi, J.S. Phlorotannins isolated from the edible brown alga Ecklonia stolonifera exert anti-adipogenic activity on 3t3-l1 adipocytes by downregulating c/ebpalpha and ppargamma. Fitoterapia 2014, 92, 260–269. [Google Scholar] [CrossRef] [PubMed]
  38. Hariri, N.; Thibault, L. High-fat diet-induced obesity in animal models. Nutr. Res. Rev. 2010, 23, 270–299. [Google Scholar] [CrossRef] [PubMed] [Green Version]
  39. Kim, H.J.; Kim, J.H.; Noh, S.; Hur, H.J.; Sung, M.J.; Hwang, J.T.; Yoon, S.H. Metabolomic analysis of livers and serum from high-fat diet induced obese mice. J. Proteome Res. 2011, 10, 722–731. [Google Scholar] [CrossRef] [PubMed]
  40. Lazar, I.; Clement, E.; Attane, C.; Muller, C.; Nieto, L. A new role for extracellular vesicles: How small vesicles can feed tumors’ big appetite. J. Lipid Res. 2018, 59, 1793–1804. [Google Scholar] [CrossRef] [Green Version]
  41. Houten, S.M.; Wanders, R.J. A general introduction to the biochemistry of mitochondrial fatty acid β-oxidation. J. Inherit. Metab. Dis. 2010, 33, 469–477. [Google Scholar] [CrossRef] [PubMed] [Green Version]
  42. Seo, Y.J.; Jin, H.; Lee, K.; Song, J.H.; Chei, S.; Oh, H.J.; Oh, J.H.; Lee, B.Y. Cardamonin suppresses lipogenesis by activating protein kinase a-mediated browning of 3t3-l1 cells. Phytomed. Int. J. Phytother. Phytopharm. 2019, 65, 153064. [Google Scholar] [CrossRef] [PubMed]
  43. Feldmann, H.M.; Golozoubova, V.; Cannon, B.; Nedergaard, J. UCP1 ablation induces obesity and abolishes diet-induced thermogenesis in mice exempt from thermal stress by living at thermoneutrality. Cell Metab. 2009, 9, 203–209. [Google Scholar] [CrossRef] [PubMed] [Green Version]
  44. Maeda, H.; Hosokawa, M.; Sashima, T.; Funayama, K.; Miyashita, K. Fucoxanthin from edible seaweed, Undaria pinnatifida, shows antiobesity effect through UCP1 expression in white adipose tissues. Biochem. Biophys. Res. Commun. 2005, 332, 392–397. [Google Scholar] [CrossRef] [PubMed]
Figure 1. UV spectrums of dieckol (a); HPLC chromatogram of dieckol (b), ESE (c) and ESETM (d).
Applsci 12 05115 g001aApplsci 12 05115 g001b
Figure 2. Effects of ESETM supplementation for 7 weeks on body mass (a), body mass gain (b), daily food intake (c), and food efficiency ratio (d) in ICR mice fed high-fat diet (HFD). Data are shown as the means ± standard deviation (SD) (n = 5). Different lower case letters above columns indicate statistical differences at p < 0.05.
Applsci 12 05115 g002
Figure 3. Effects of ESETM supplementation for 7 weeks on adipocyte size (a) in ICR mice fed high-fat diet (HFD). Cell viability (b), lipid accumulation (c) and relative ROS production (d) from 3T3-L1 adipocytes treated with ESETM. Data are shown as the means ± standard deviation (SD) (n = 5). Different lower case letters above columns indicate statistical differences at p < 0.05.
Applsci 12 05115 g003aApplsci 12 05115 g003b
Figure 4. Effects of ESETM on adipogenic protein expression in ICR mice fed HFD after 7 weeks and adipocytes treated with ESETM. (a) Western blots of adipogenic proteins in WAT. (b) Western blots of adipogenic proteins in 3T3-L1 adipocytes. Data are shown as the means ± standard deviation (SD) (n = 5). Different lower case letters above columns indicate statistical differences at p < 0.05.
Applsci 12 05115 g004
Figure 5. Effects of ESETM lipogenic protein expression in ICR mice fed HFD after 7 weeks and adipocytes treated with ESETM. (a) Western blots of lipogenic proteins in WAT. (b) Western blots of lipogenic proteins in adipocytes. Data are shown as the means ± standard deviation (SD) (n = 5). Different lower case letters above columns indicate statistical differences at p < 0.05.
Applsci 12 05115 g005
Figure 6. Effects of ESETM on lipolytic enzymes expression in ICR mice fed HFD after 7 weeks and adipocytes treated with ESETM. (a) Western blots of lipolytic enzymes in WAT. (b) Western blots of lipolytic enzymes in adipocytes. Data are shown as the means ± standard deviation (SD) (n = 5). Different lower case letters above columns indicate statistical differences at p < 0.05.
Applsci 12 05115 g006aApplsci 12 05115 g006b
Figure 7. Effects of ESETM on thermogenesis and browning proteins expression in ICR mice fed HFD after 7 weeks and adipocytes treated with ESETM. (a) Western blots of thermogenesis and browning proteins in WAT. (b) Western blots of thermogenesis and browning proteins in adipocytes. Data are shown as the means ± standard deviation (SD) (n = 5). Different low case letters above columns indicate statistical differences at p < 0.05.
Applsci 12 05115 g007
Table 1. The regression data, precision and quantification of the ESE and ESETM.
CompoundRegression EquationR2Linear Range (μg/mL)RSD (%) (n = 3)Contents of Dieckol in ESE (mg/g)Contents of Dieckol in ESETM (mg/g)
Dieckoly = 4628.6x − 1764.60.9993.13–1000.34–2.3527.42 ± 0.6618.65 ± 0.52
The results are expressed as mean ± SD (n = 3).
Table 2. Oran weights in ICR mice with ESETM.
CONHFDHFD + GCHFD + ESETMLHFD + ESETMMHFD + ESETMH
WAT (mg)843.17 ± 86.08 e2867.67 ± 179.88 a1487.87 ± 134.10 d2332.87 ± 111.24 b1996.90 ± 211.67 c1563.60 ± 246.85 d
Liver (mg)1126.50 ± 63.01 e2229.33 ± 19.59 a1298.13 ± 9.97 d1732.47 ± 144.97 b1586.93 ± 97.93 c1292.70 ± 29.53 d
Kidney (mg)549.73 ± 1.16 a542.07 ± 71.05 a559.03 ± 17.76 a552.10 ± 38.06 a575.60 ± 33.08 a569.57 ± 21.29 a
Spleen (mg)123.50 ± 9.44 b151.70 ± 4.65 a122.80 ± 19.19 b121.60 ± 13.08 b125.43 ± 2.03 b123.80 ± 5.29 b
The results are expressed as mean ± SD (n = 5). Different lower case letters above columns indicate statistical differences among groups at p < 0.05 by one-way ANOVA.
Table 3. Effects of ESETM serum biochemical analysis in HFD-fed obese ICR mice.
CONHFDHFD + GCHFD + ESETMLHFD + ESETMMHFD + ESETMH
TG (mg/dL)55.33 ± 6.75 d137.90 ± 20.97 a74.92 ± 24.42 bc105.26 ± 16.57 b89.99 ± 10.07 b74.93 ± 8.92 bc
TC (mg/dL)157.73 ± 19.48 d211.67 ± 7.65 a191.10 ± 1.56 ab182.64 ± 18.51 b182.99 ± 12.16 b170.77 ± 9.49 bc
LDL-C (mg/dL)23.48 ± 3.10 b35.19 ± 1.78 a29.19 ± 1.53 ab29.87 ± 5.90 ab29.24 ± 4.07 ab25.34 ± 3.14 b
HDL-C (mg/dL)196.46 ± 2.42 a133.76 ± 11.94 c186.35 ± 10.78 ab179.29 ± 6.41 b180.56 ± 8.90 b184.45 ± 3.76 ab
AST (IU/L)75.52 ± 2.34 c118.49 ± 5.67 a78.50 ± 4.32 bcd89.58 ± 3.33 b83.99 ± 1.42 bc75.70 ± 6.31 b
ALT (IU/L)43.86 ± 2.75 c75.91 ± 15.39 a42.17 ± 7.41 c67.00 ± 6.43 ab59.86 ± 7.03 b54.73 ± 4.16 bc
The results are expressed as mean ± SD (n = 5). Different low case letters above columns indicate statistical differences among groups at p < 0.05 by one-way ANOVA. AST, aspartate aminotransferase; ALT, alanine aminotransferase; HDL-c, high-density lipoprotein cholesterol; LDL-c, low-density lipoprotein cholesterol; TC, total cholesterol; TG, triglyceride.
Publisher’s Note: MDPI stays neutral with regard to jurisdictional claims in published maps and institutional affiliations.

