
Indentation Hardness and Elastic Recovery of Some Hardwood Species

 , ,
, ,  ,
,  ,
,  and
and 
Abstract
:1. Introduction
2. Materials and Methods
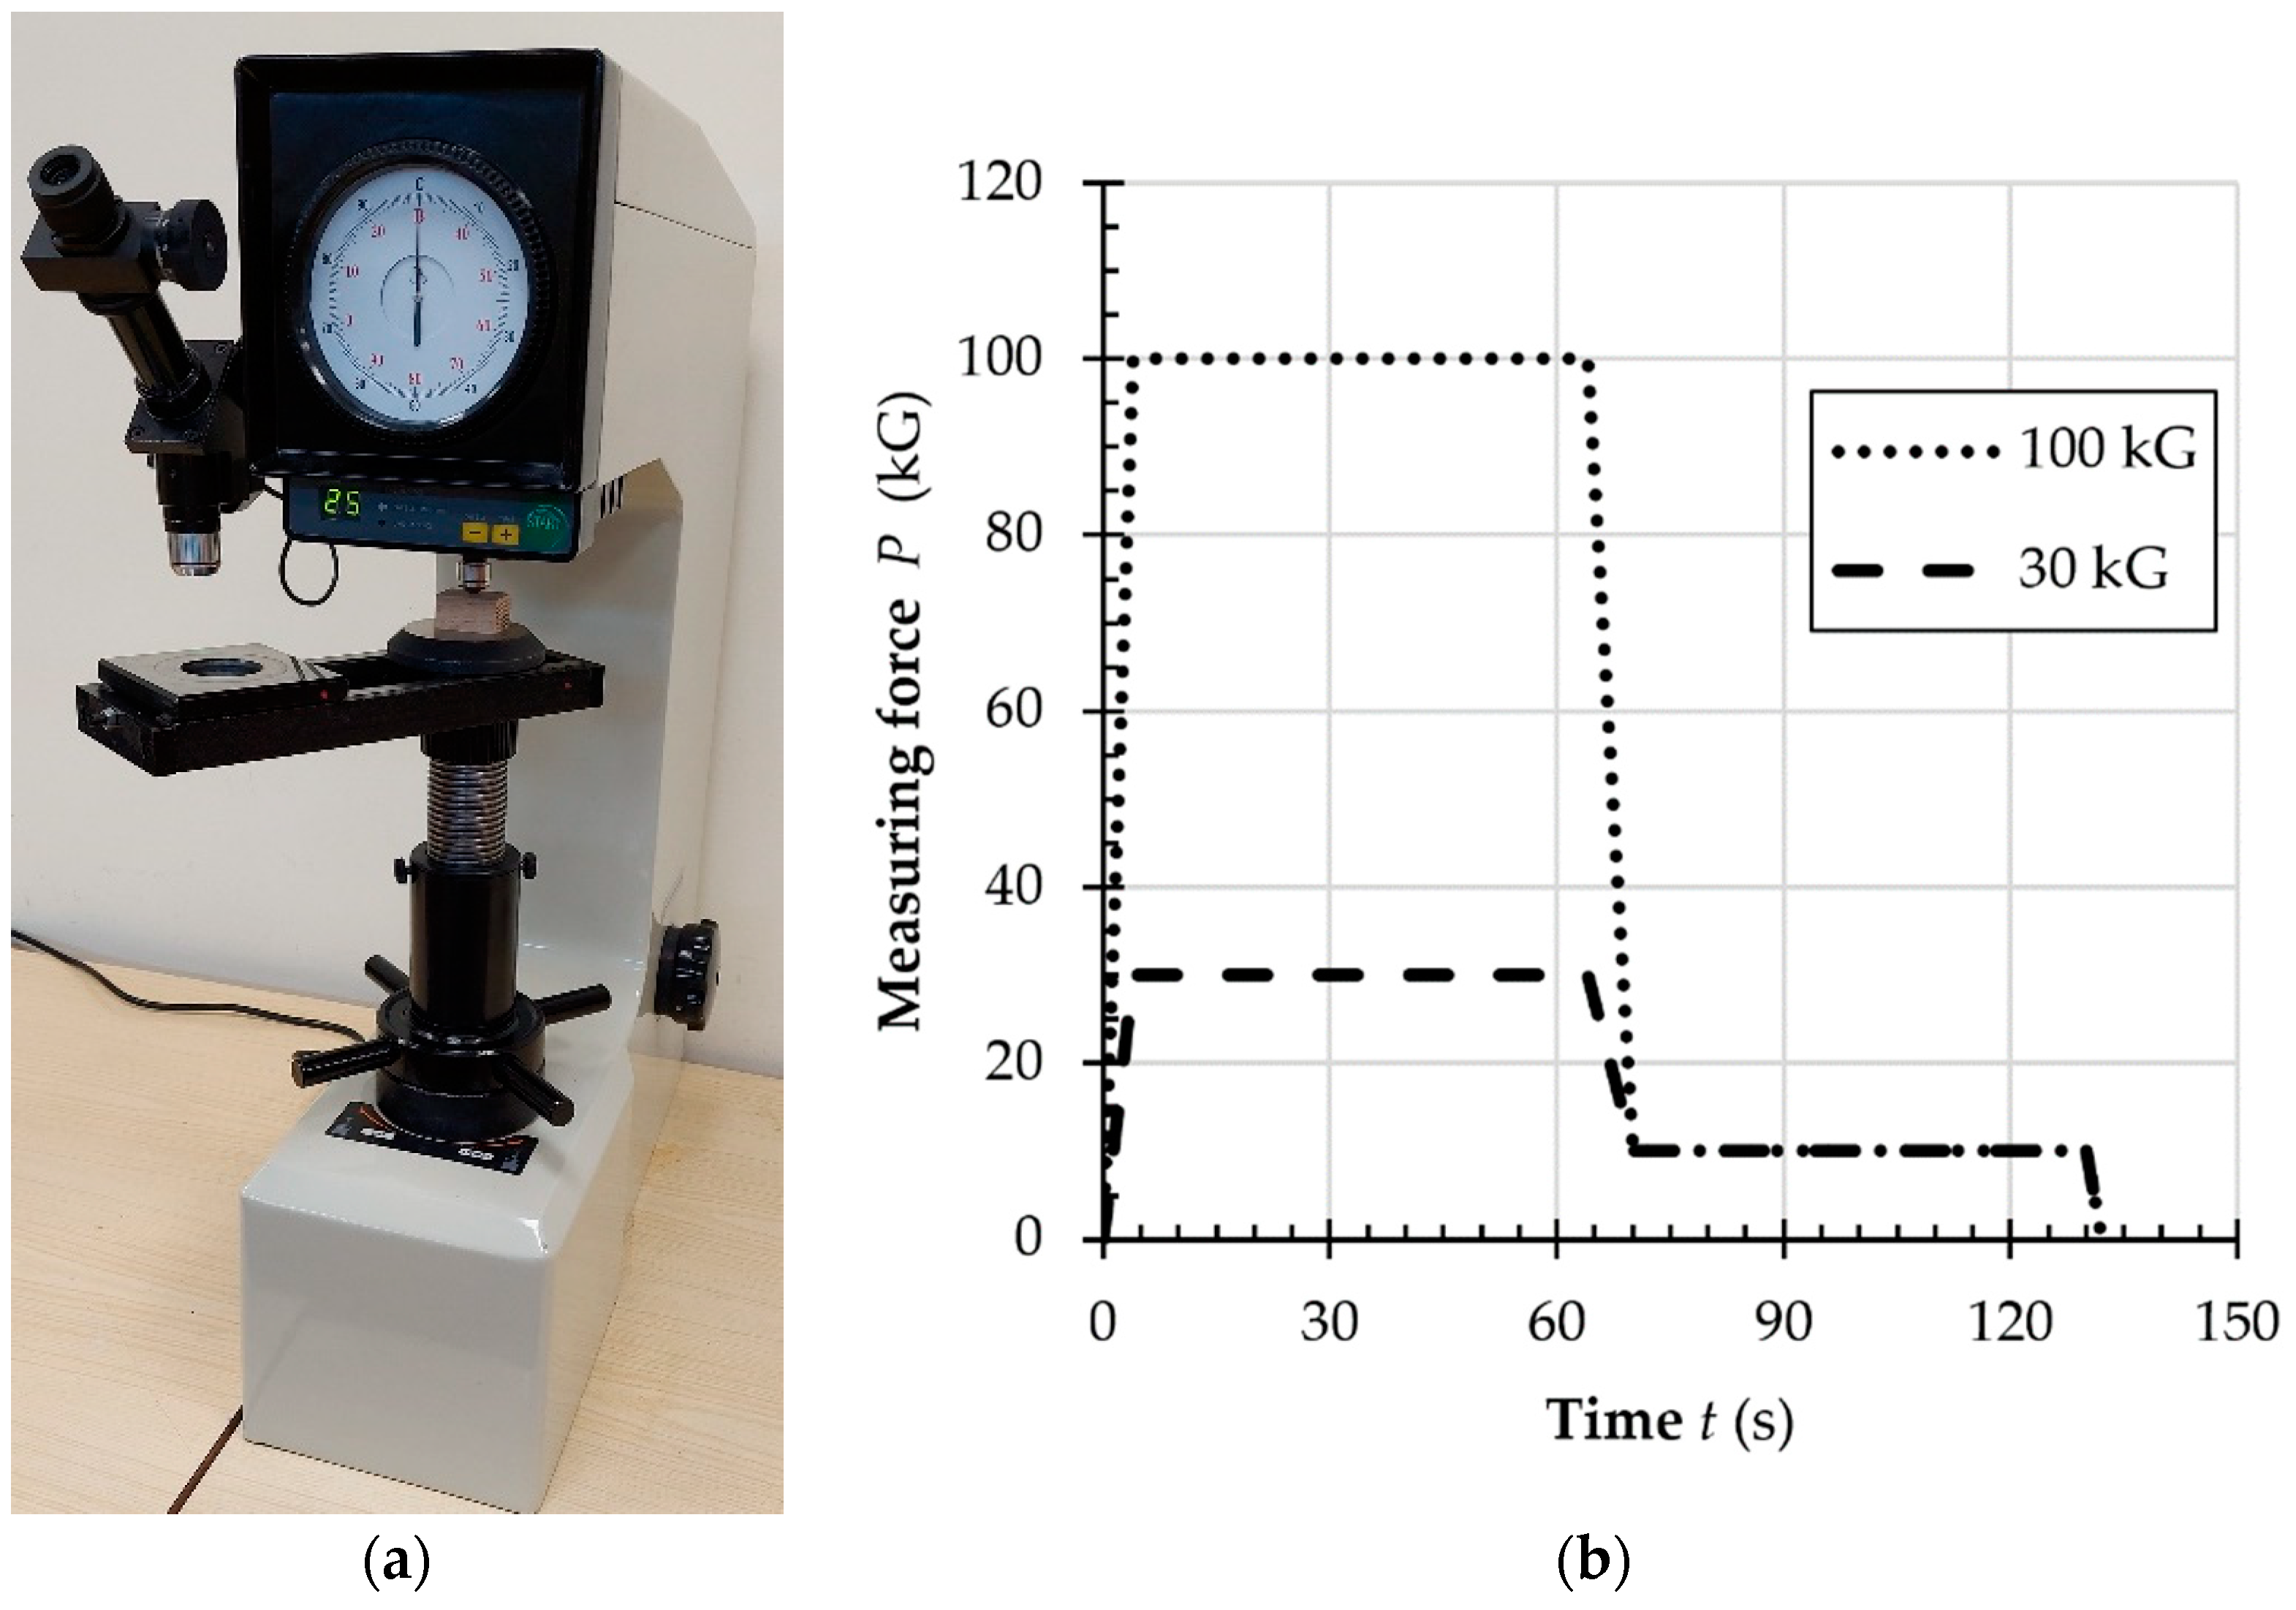
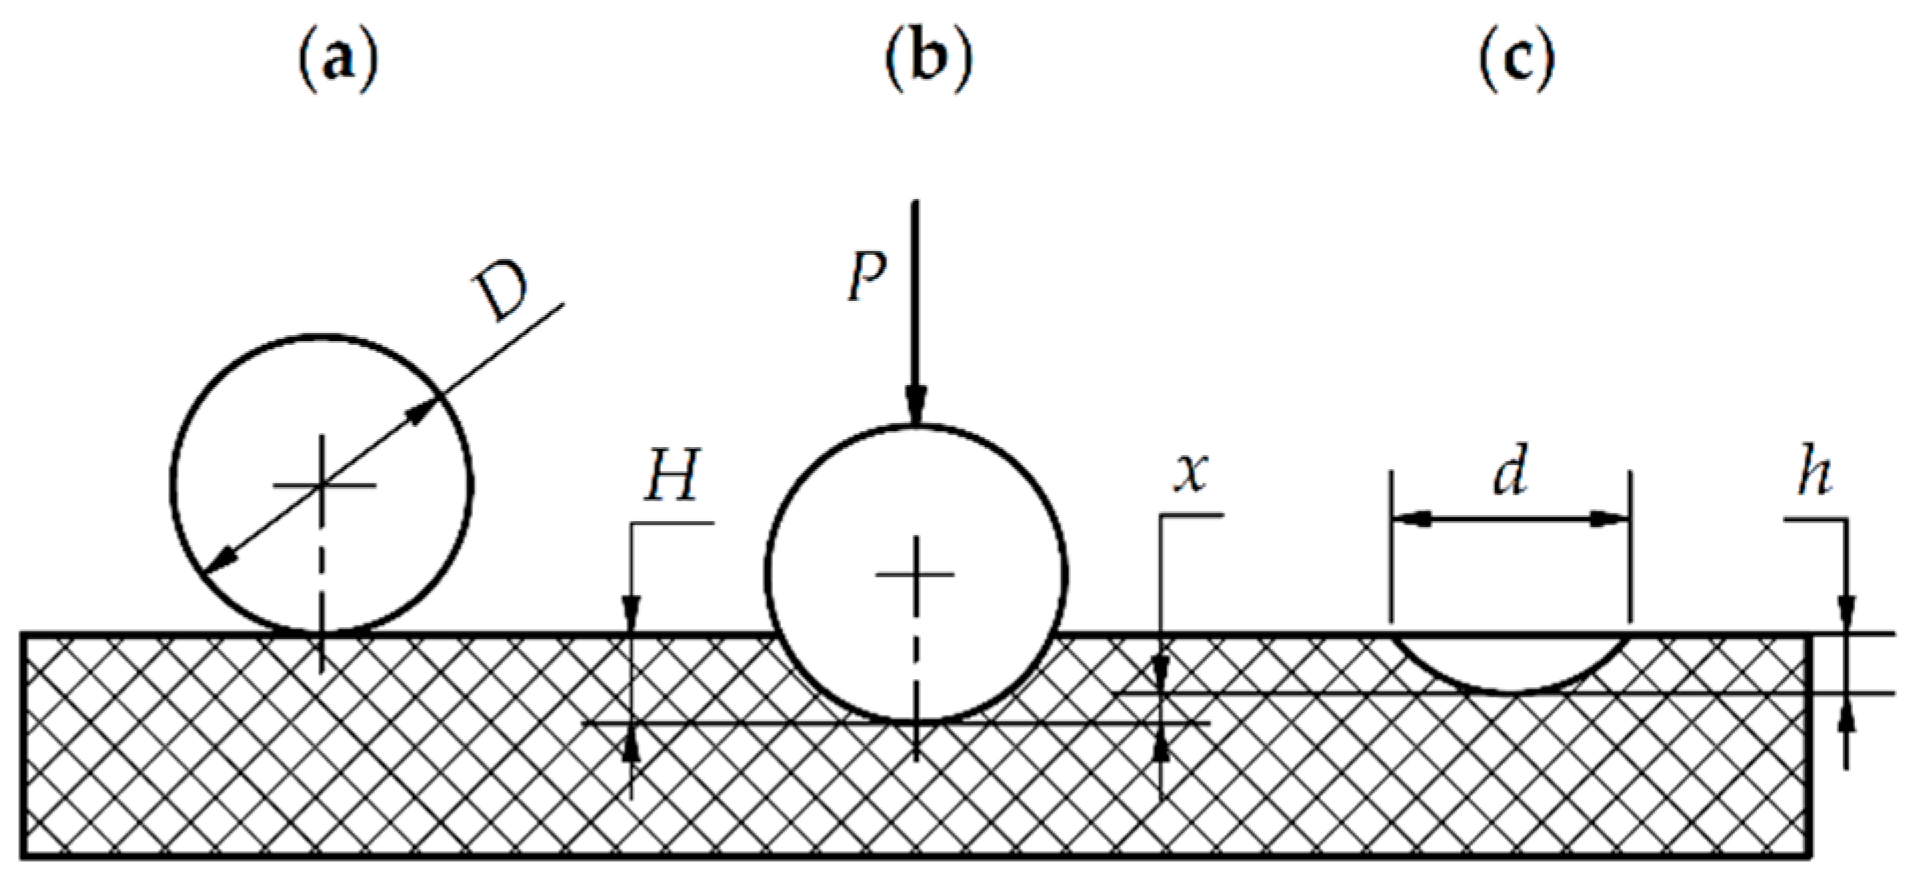
| • | Measuring ball diameter | D = 10 mm |
| • | Total force 1 | P30) |
| • | Total force 2 | P100) |
| • | Partial force | P1 = 10.0 kG (98.07 N) |
| • | Total load time | t = 125 s |
| • | Number of measurements for each material | n = 12 |
3. Results
4. Discussion
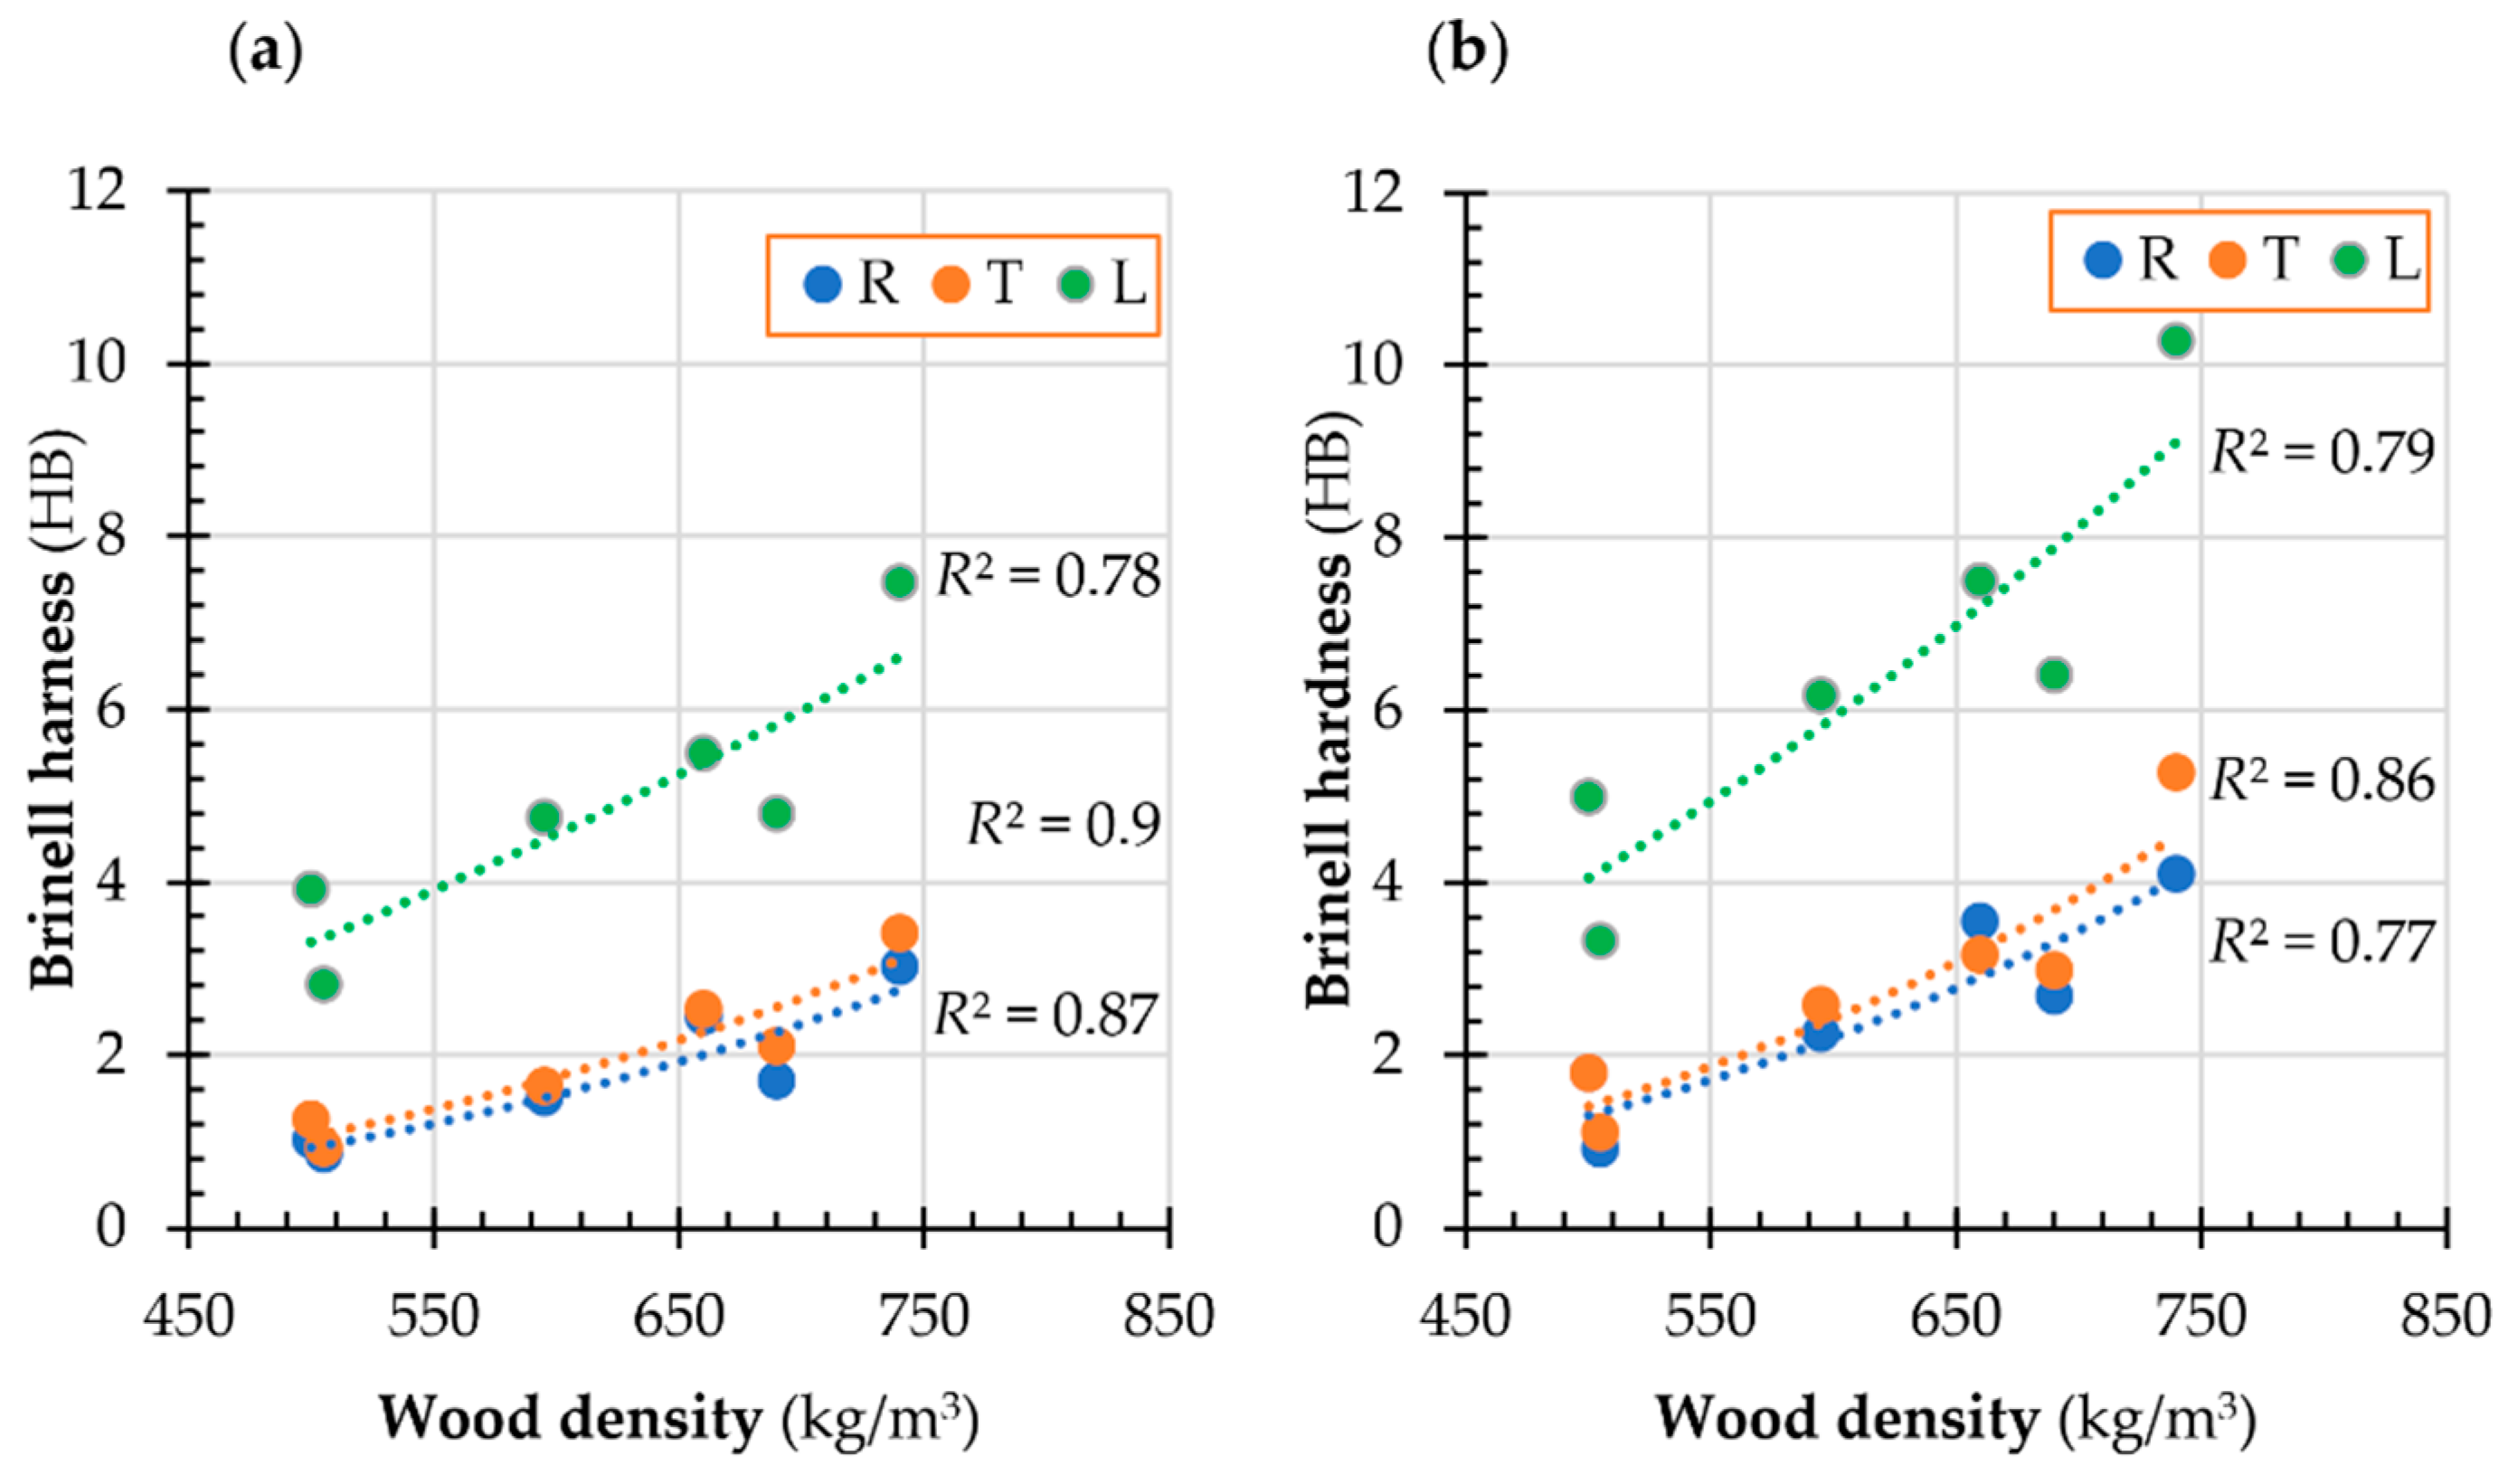
4.1. Hardness
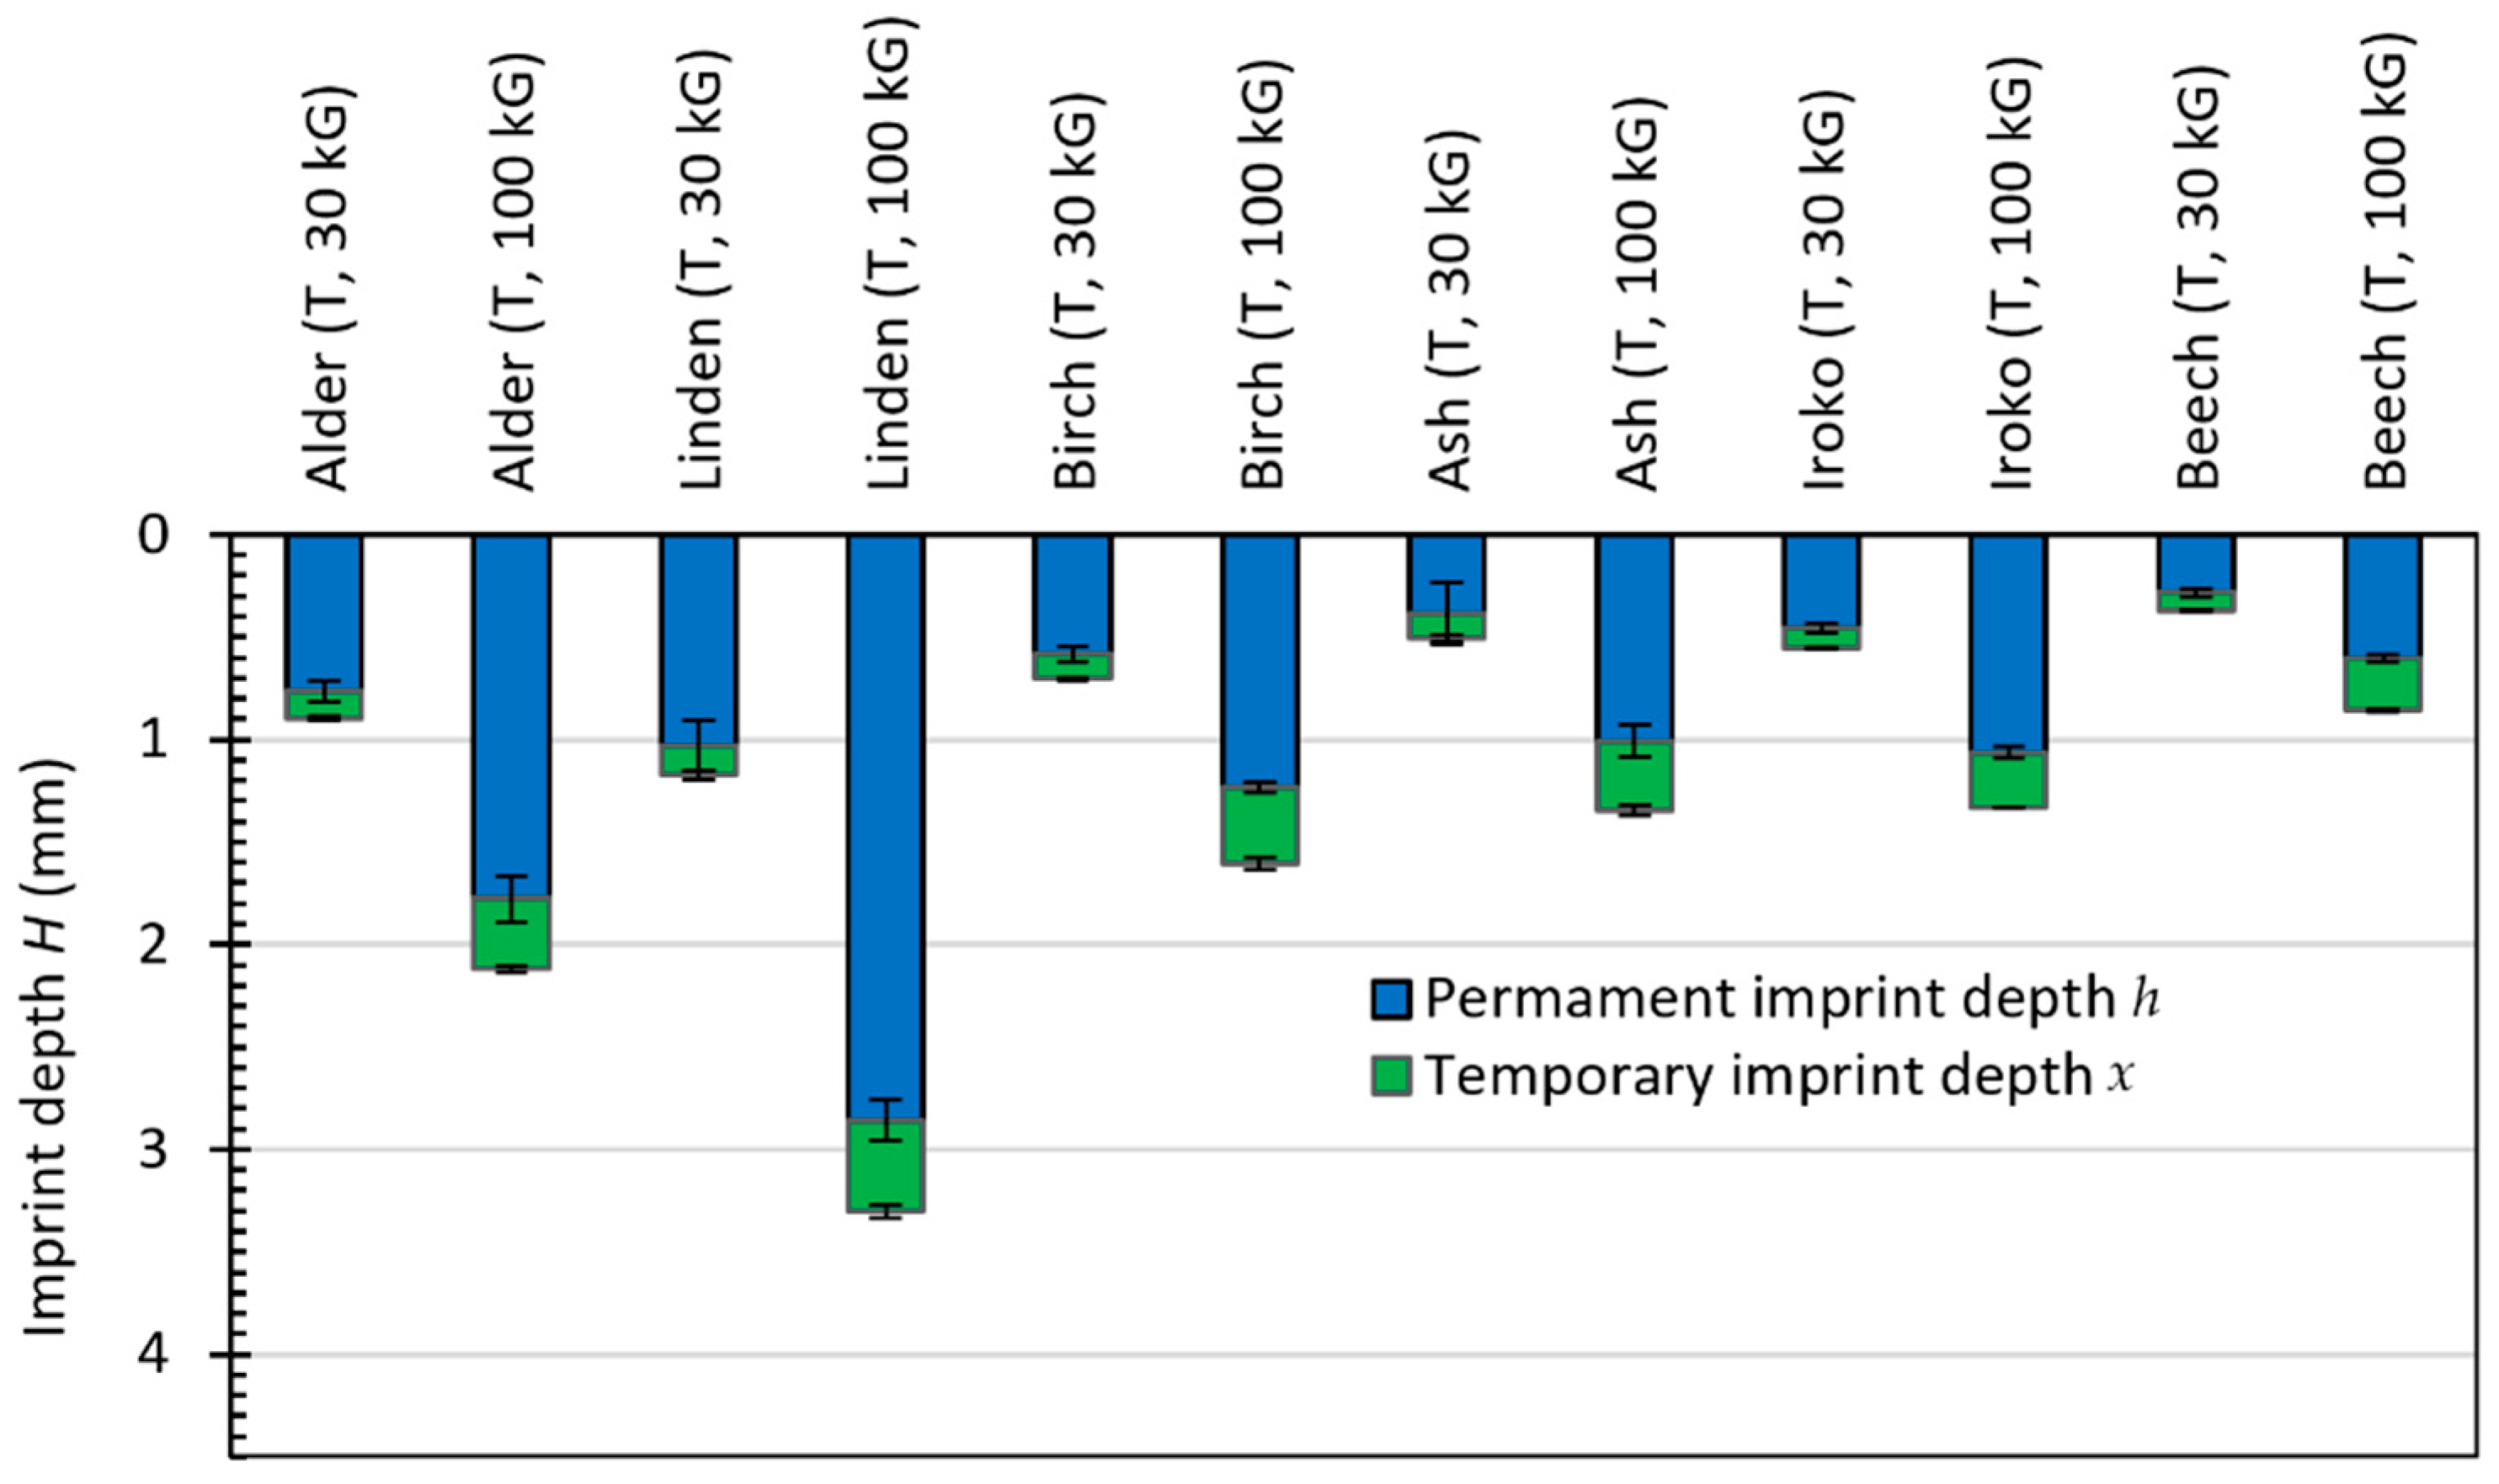
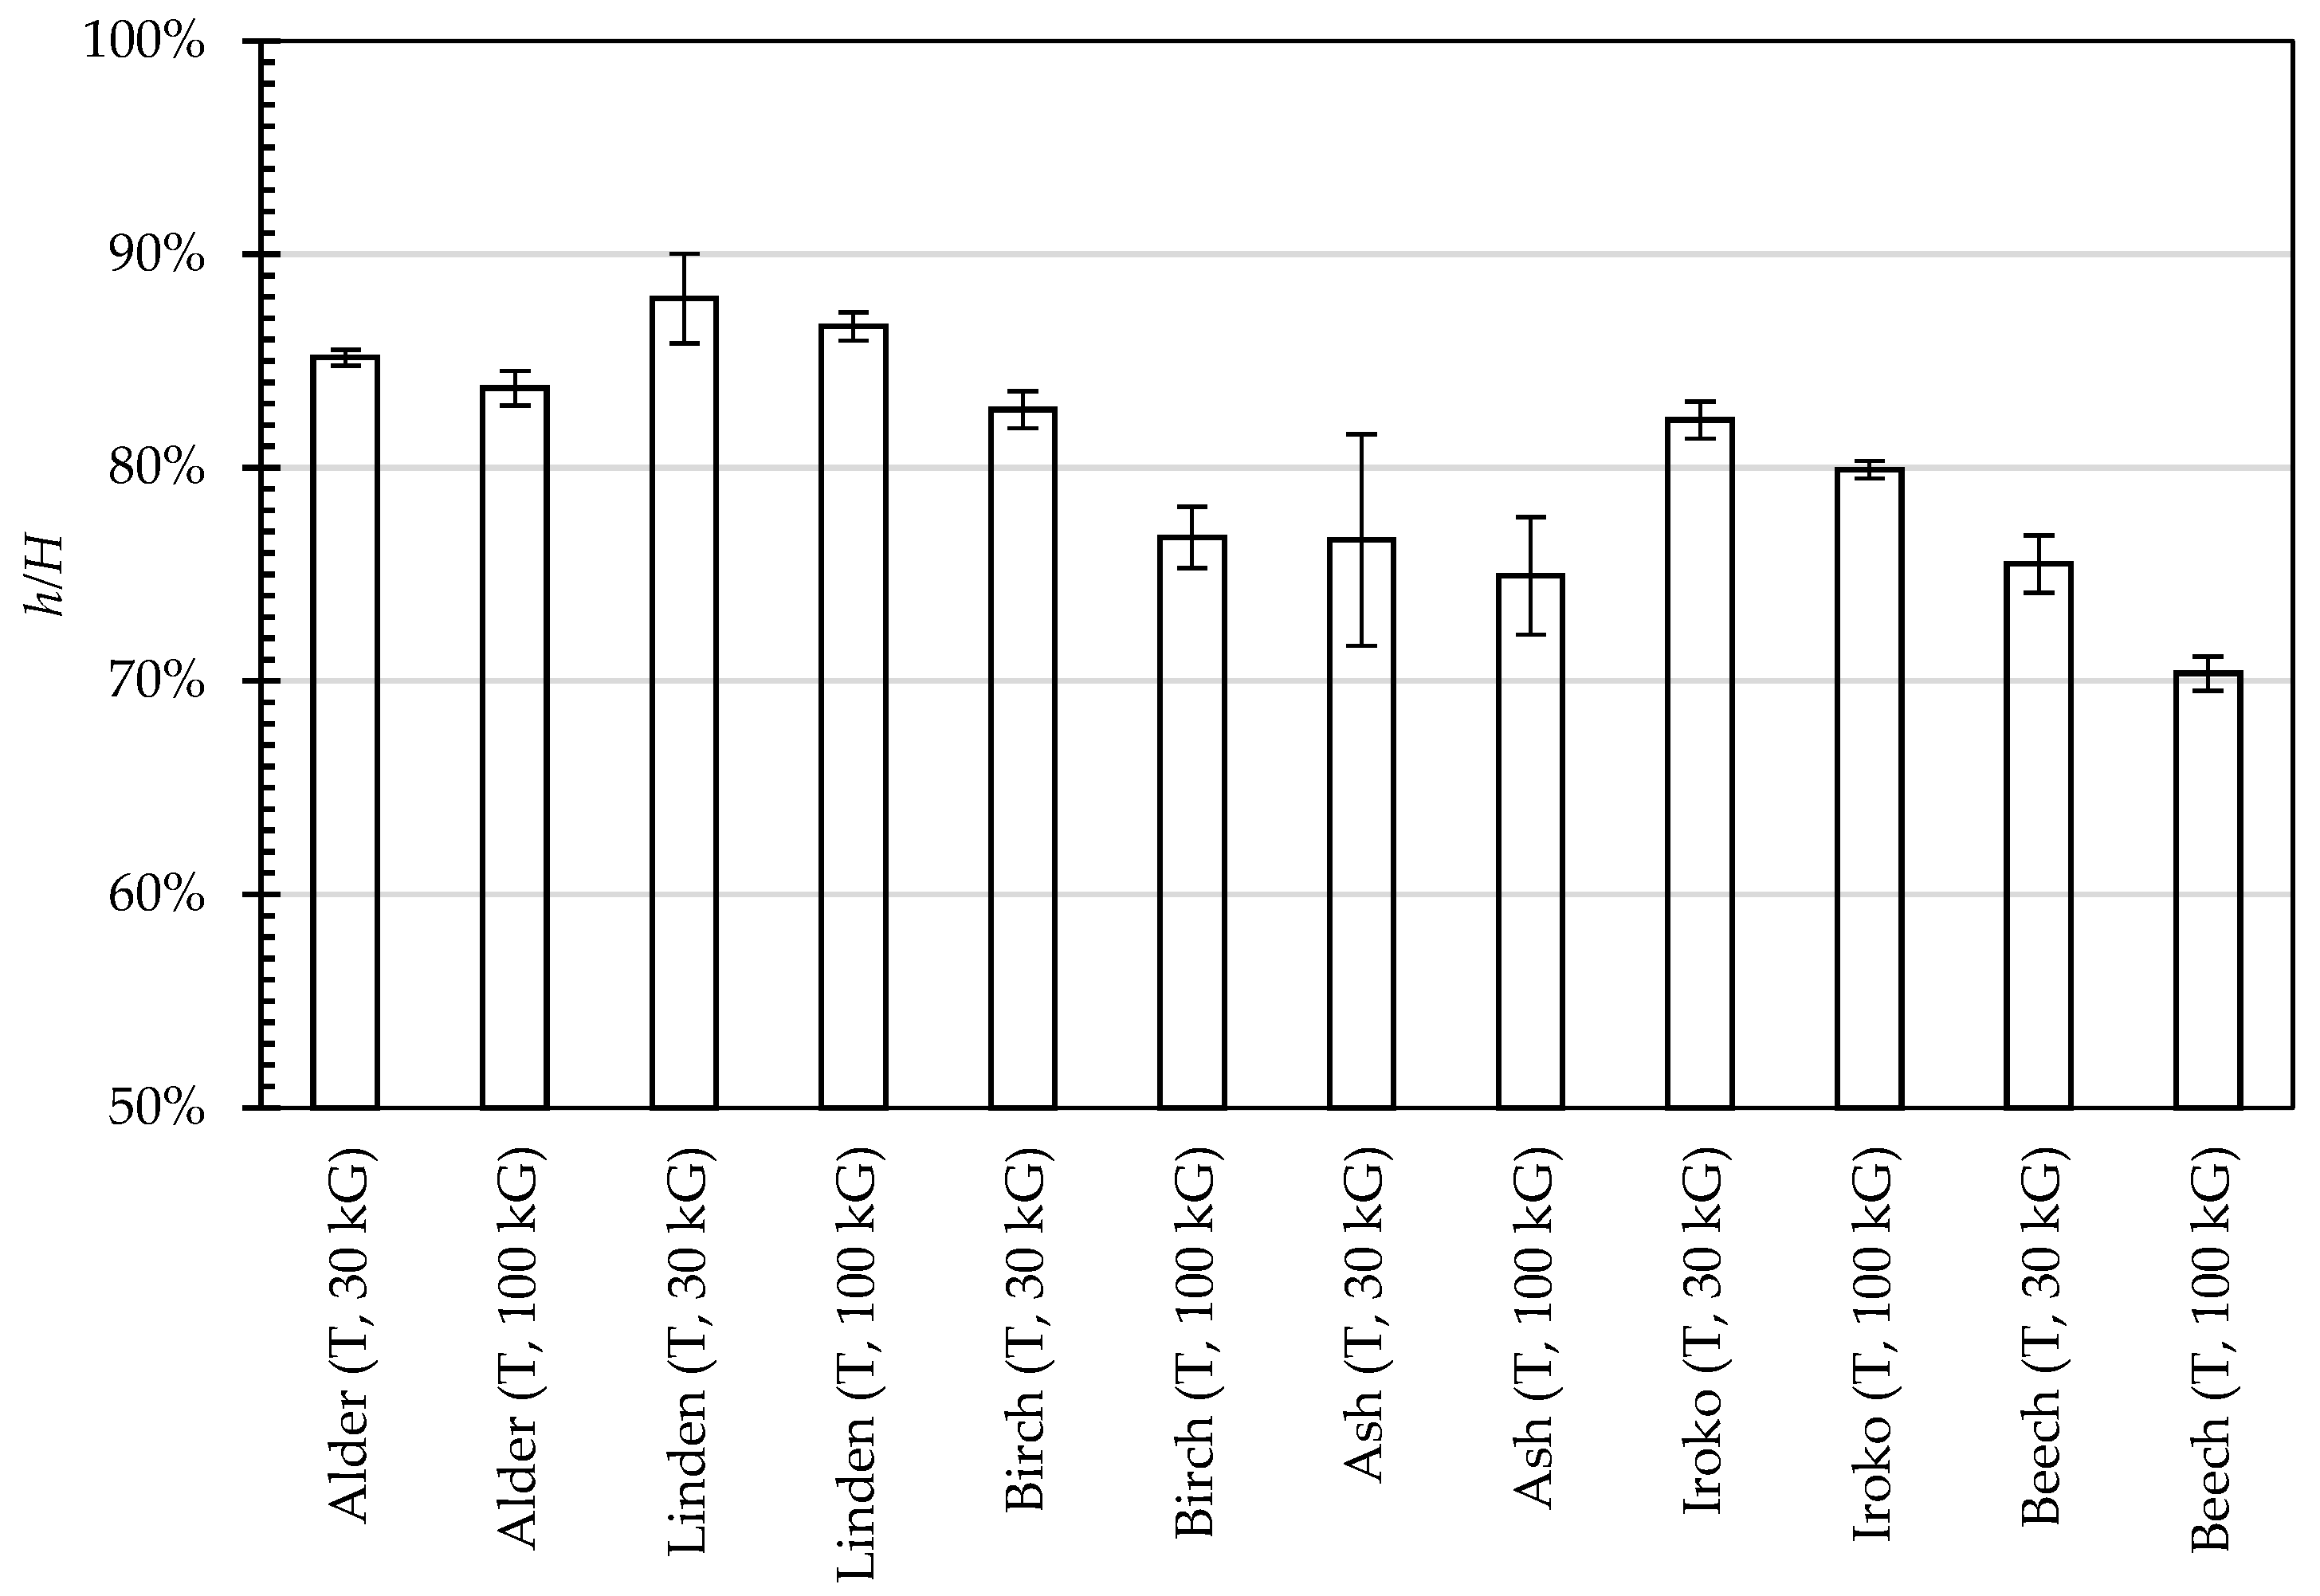
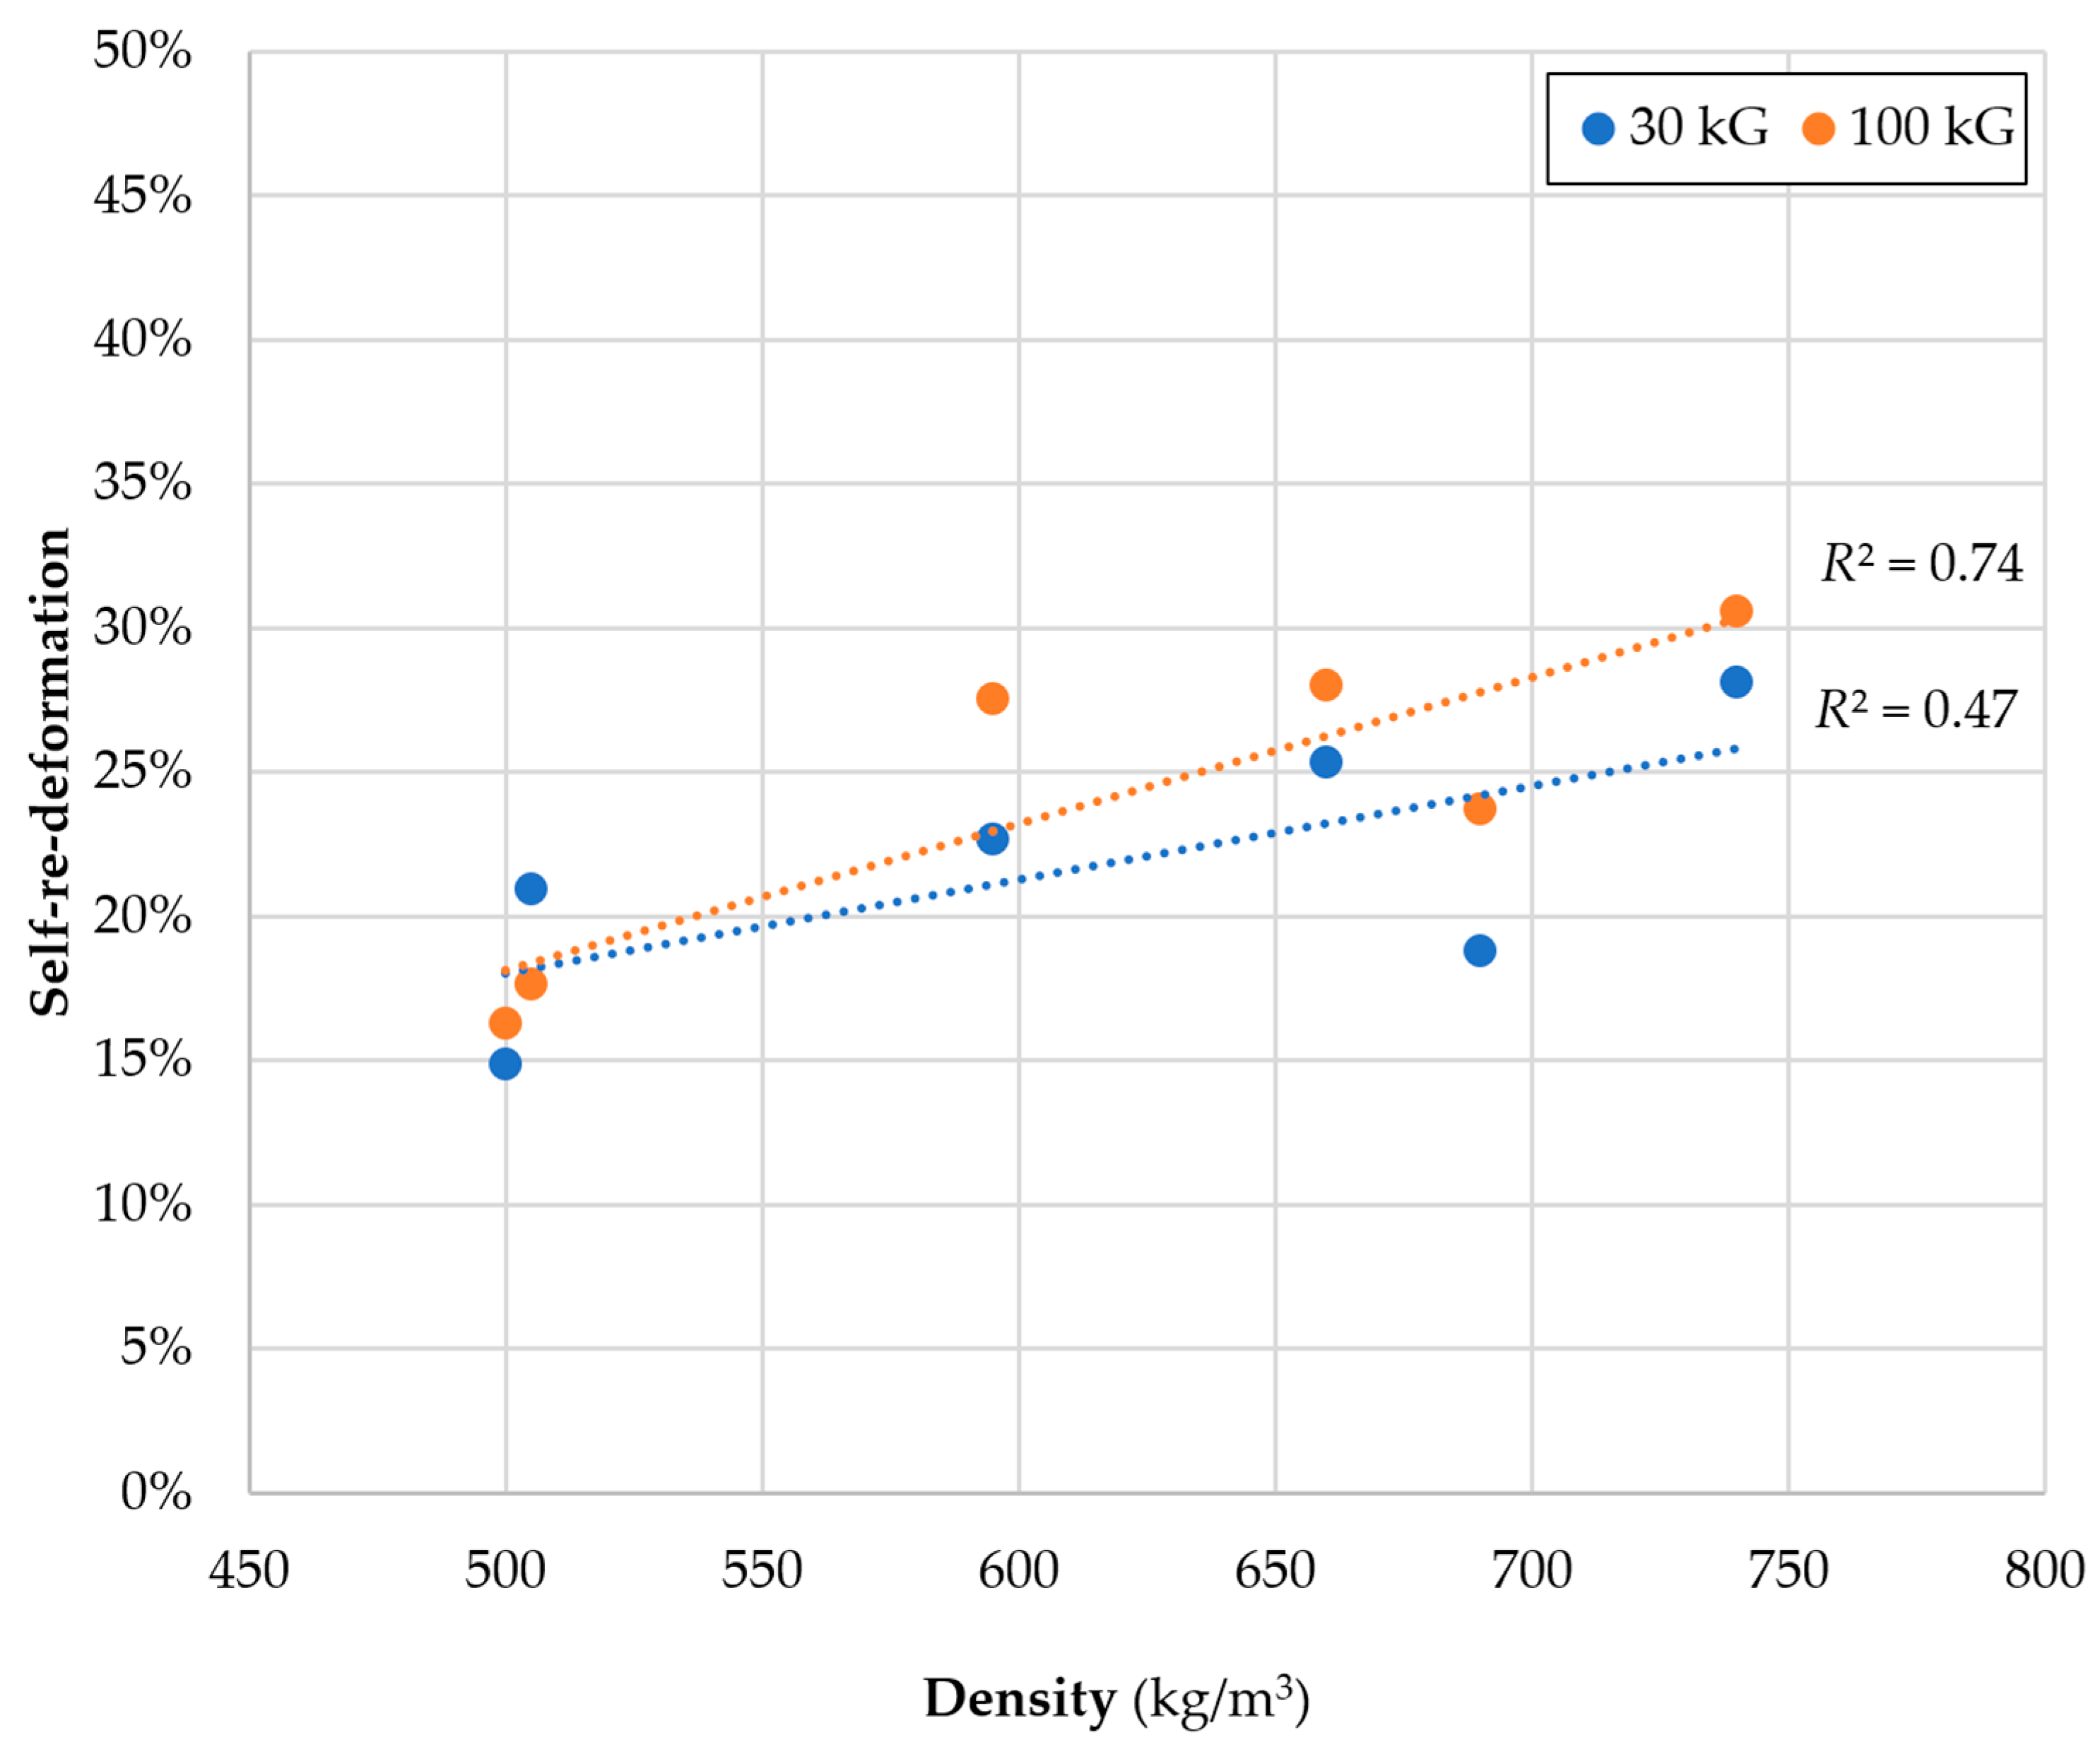
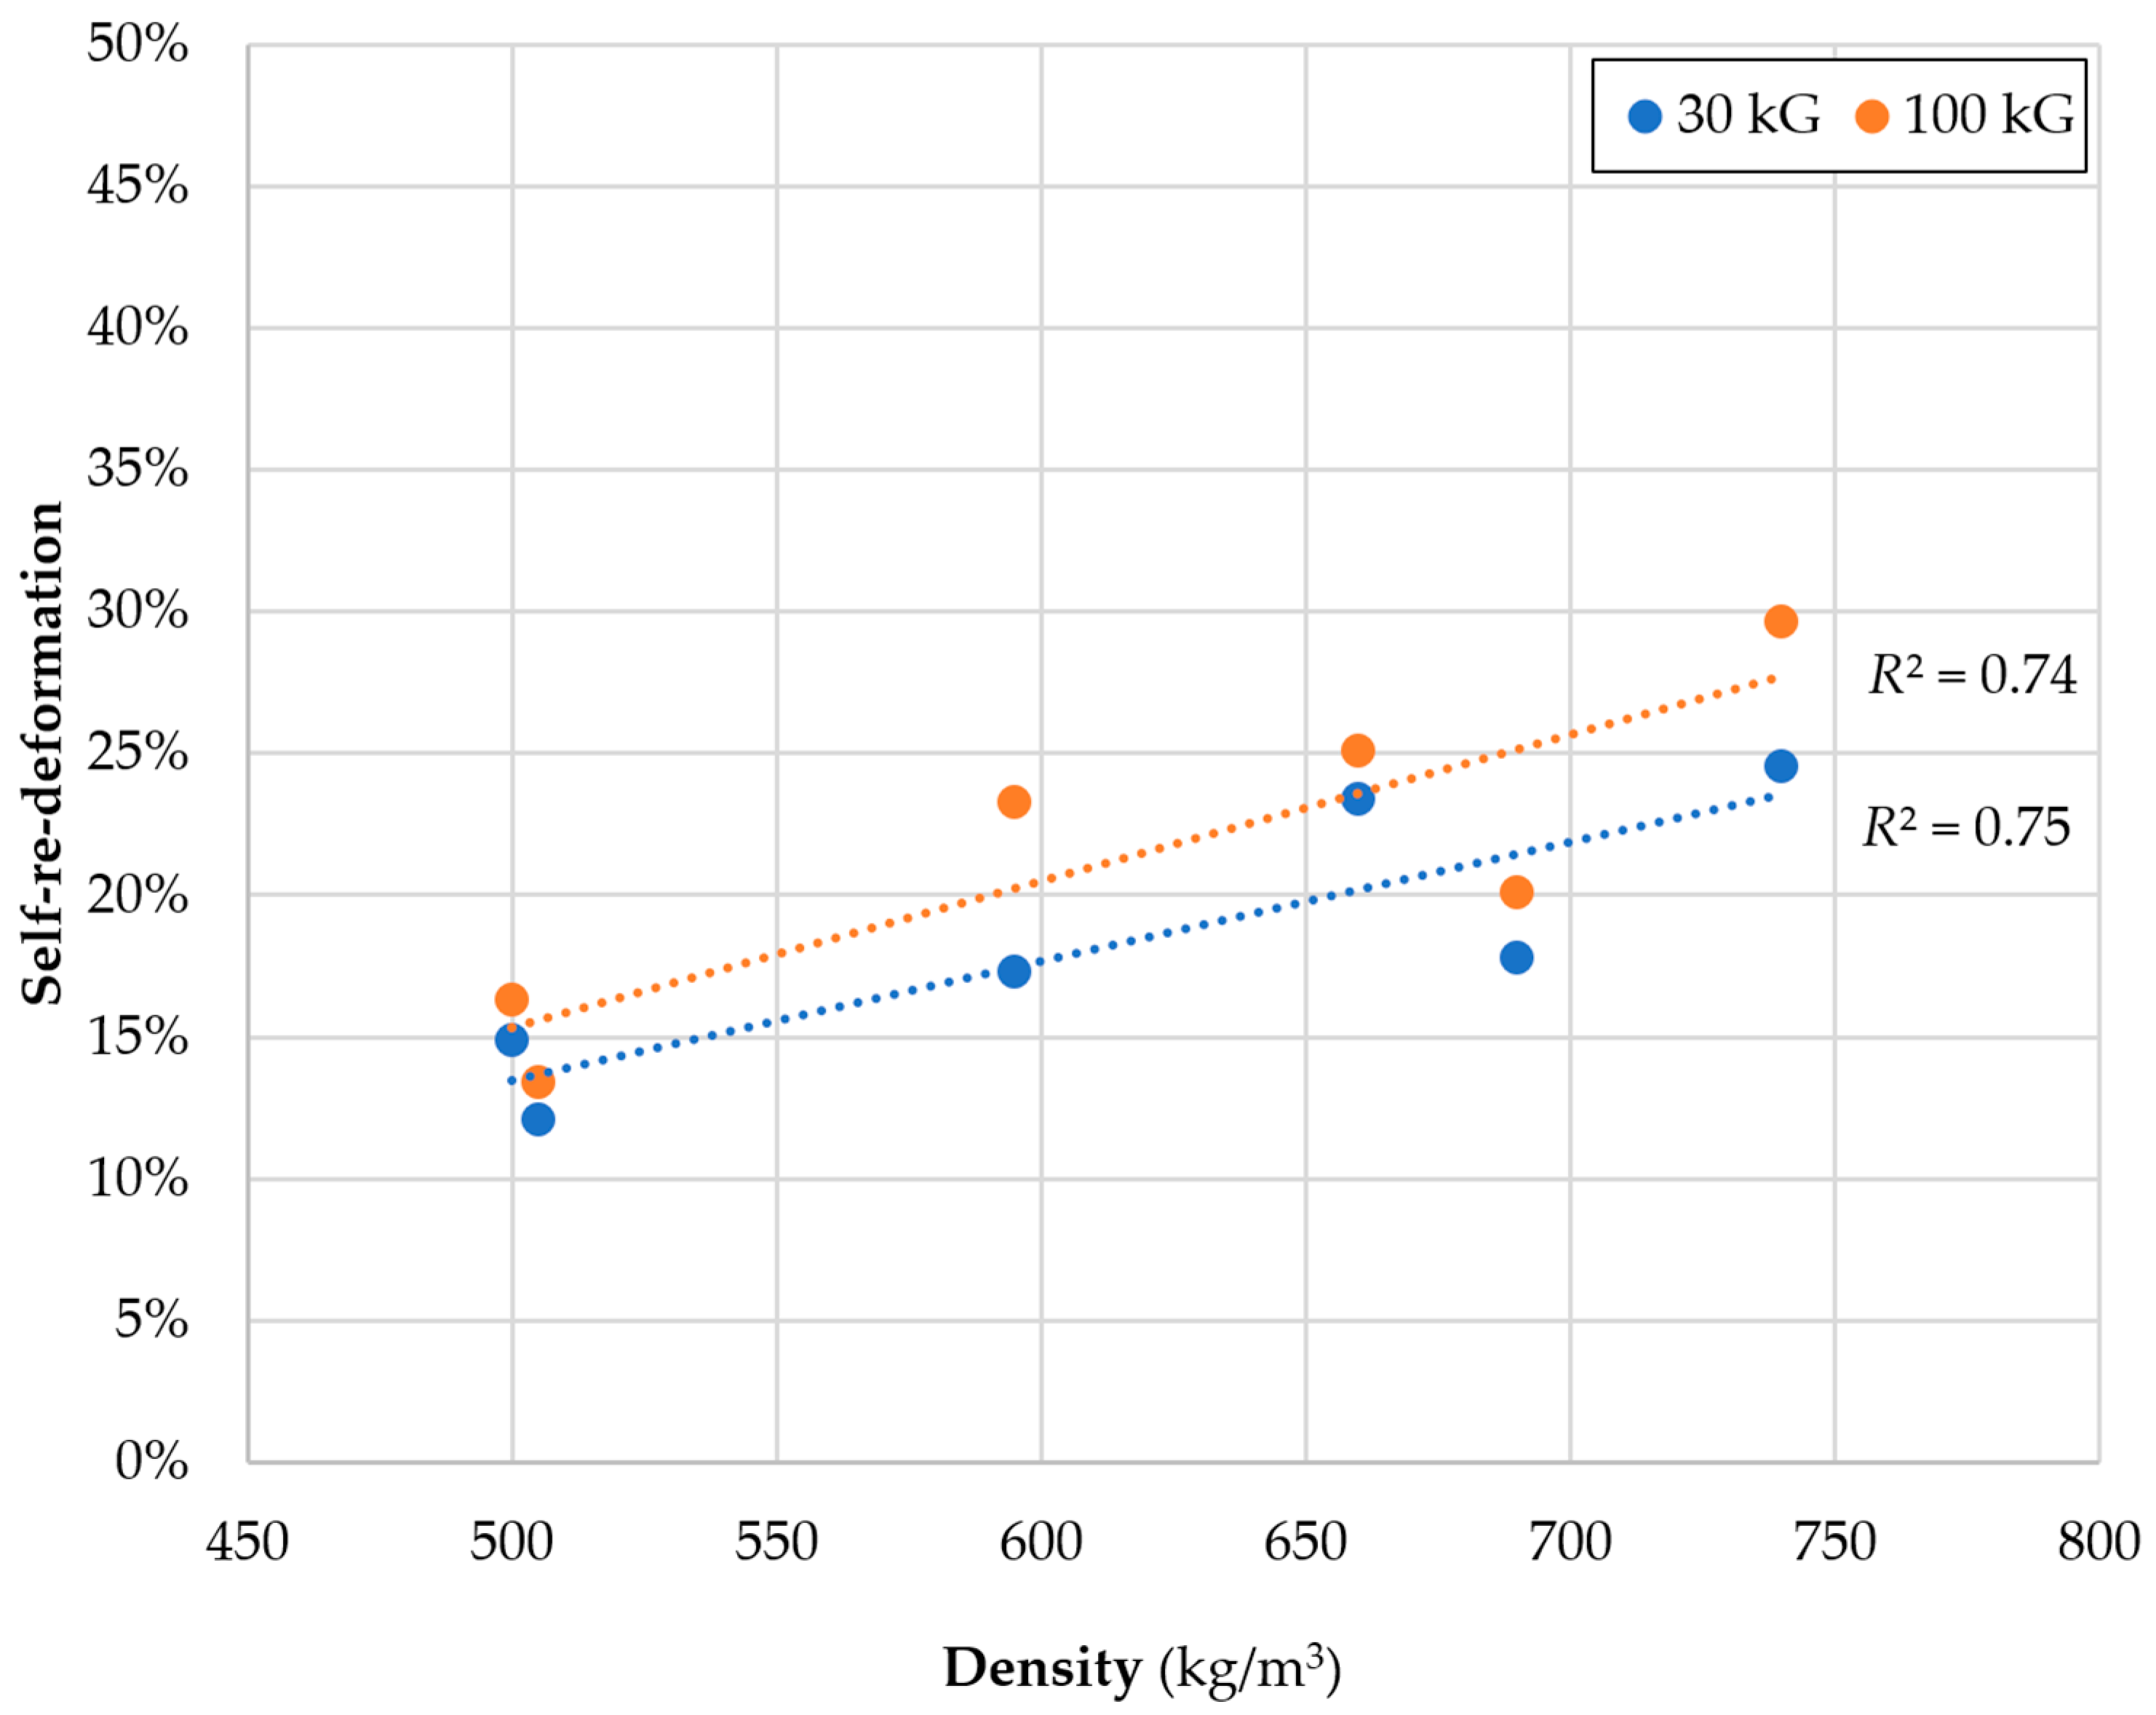
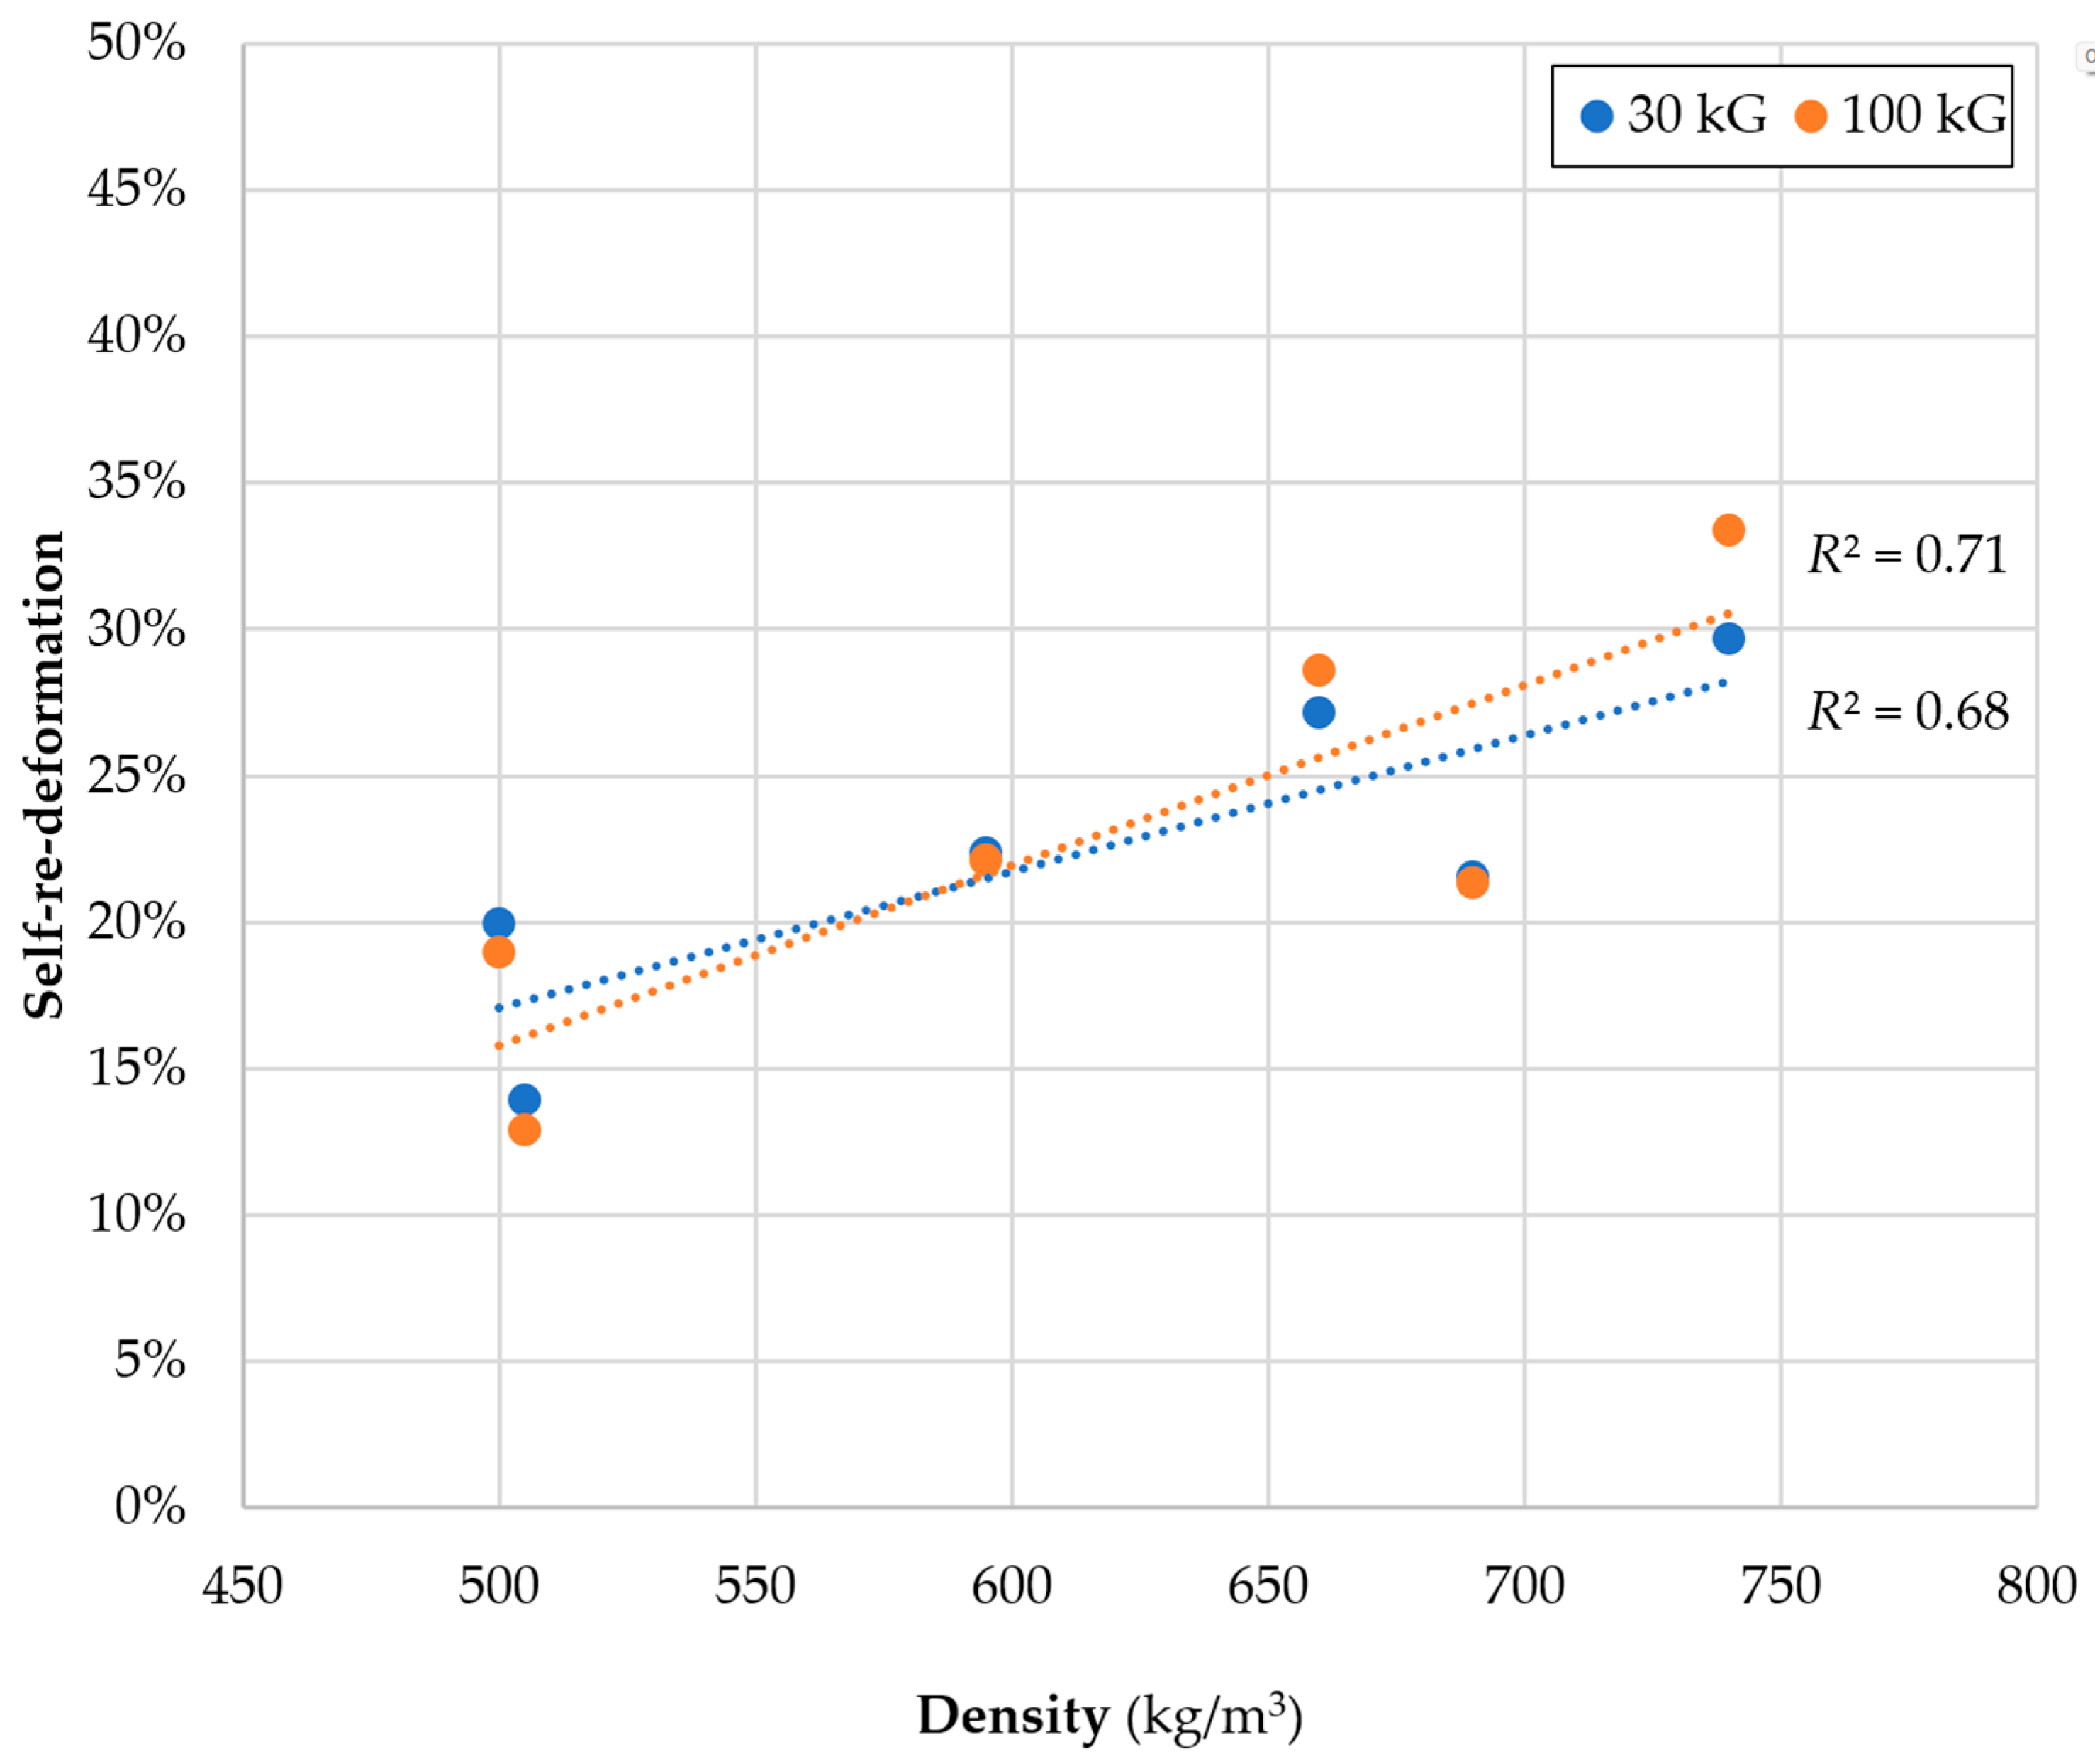
4.2. Self-Re-Deformation
5. Conclusions
- The greater the density of the wood, the highest Brinell hardness—and, at the same time, its tendency to self-re-deformation (self-shallowing of an imprint after the removal of the measuring force) is greater. The hardest tested wood species (beech) shows a share of the permanent imprint depth in the total imprint depth (h/H) only from 67 to 75%, while the wood with the lowest hardness (linden) from 82% to 88%. The self-re-deformation ability is thus linked to the wood density: the harder the wood, the smaller the share of the permanent imprint depth in the total imprint depth.
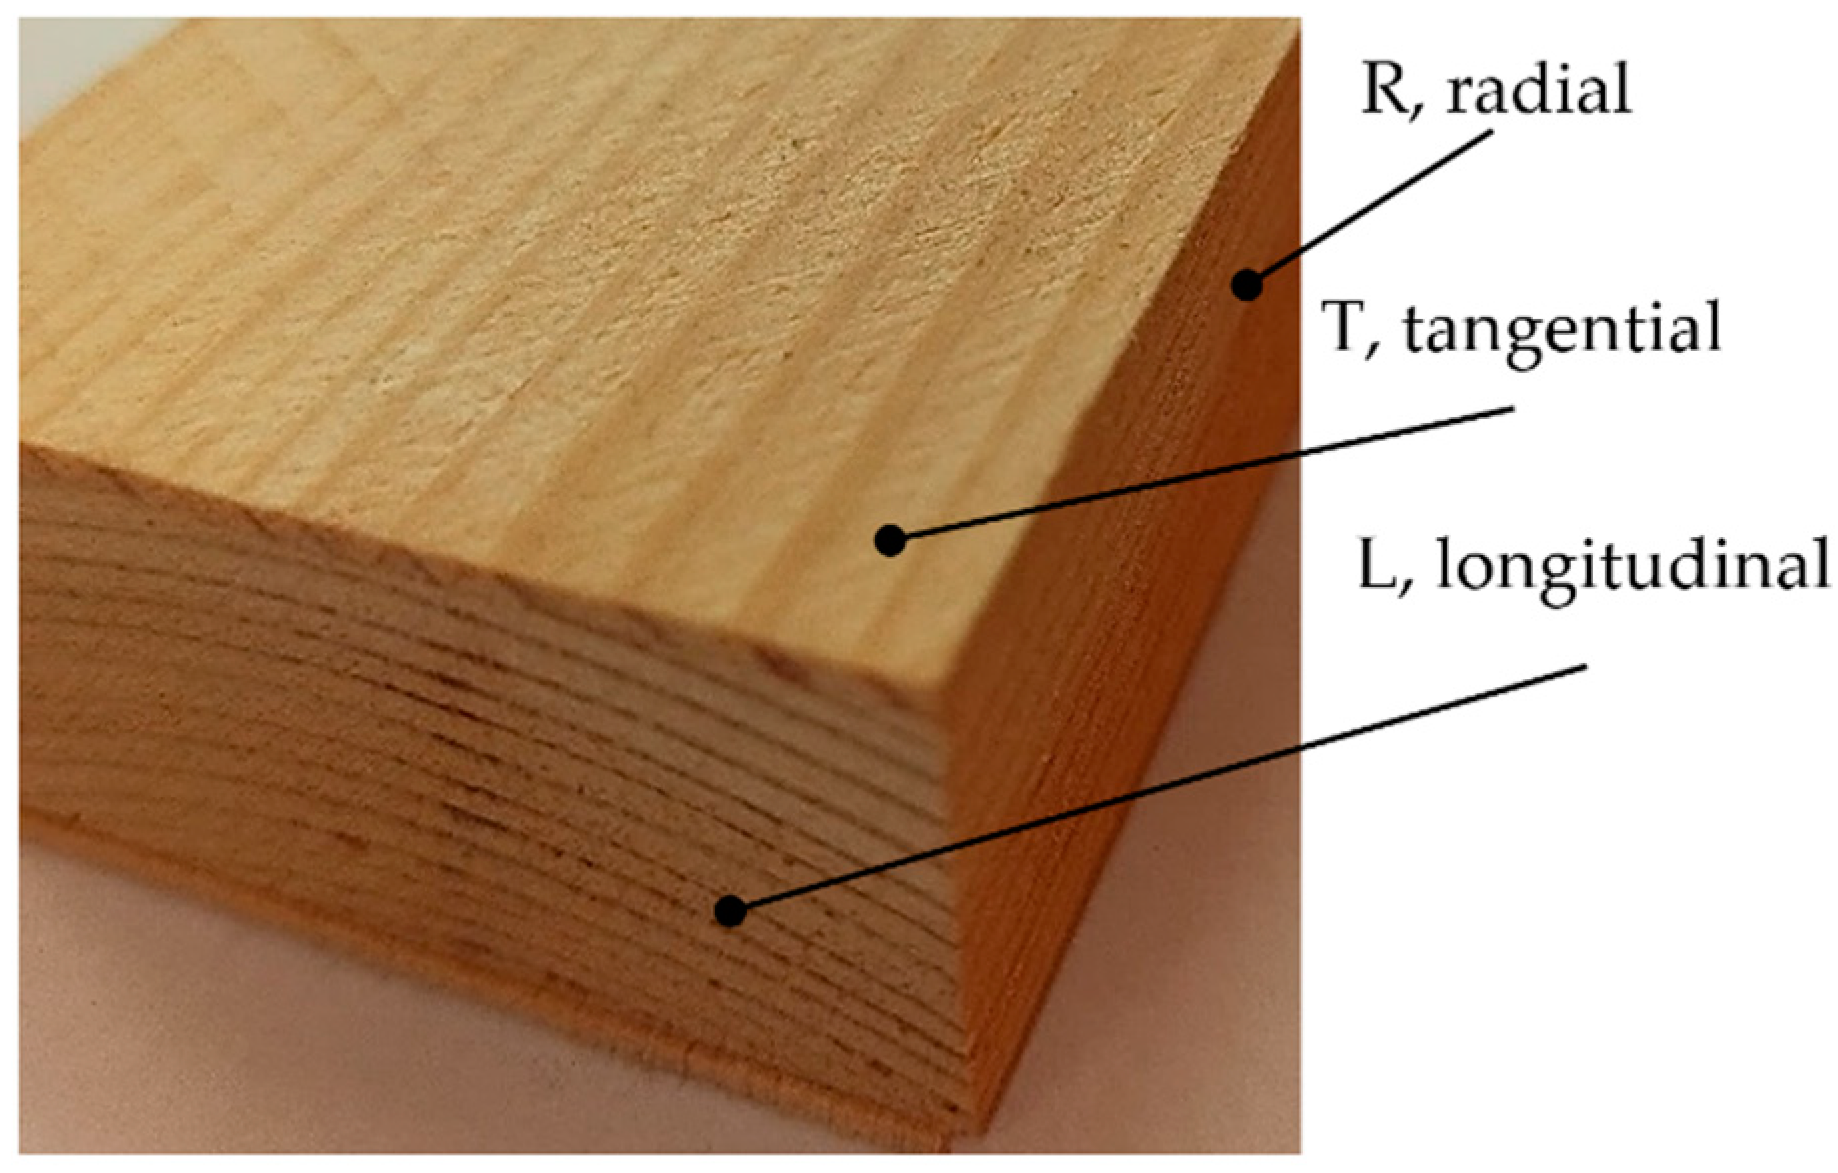
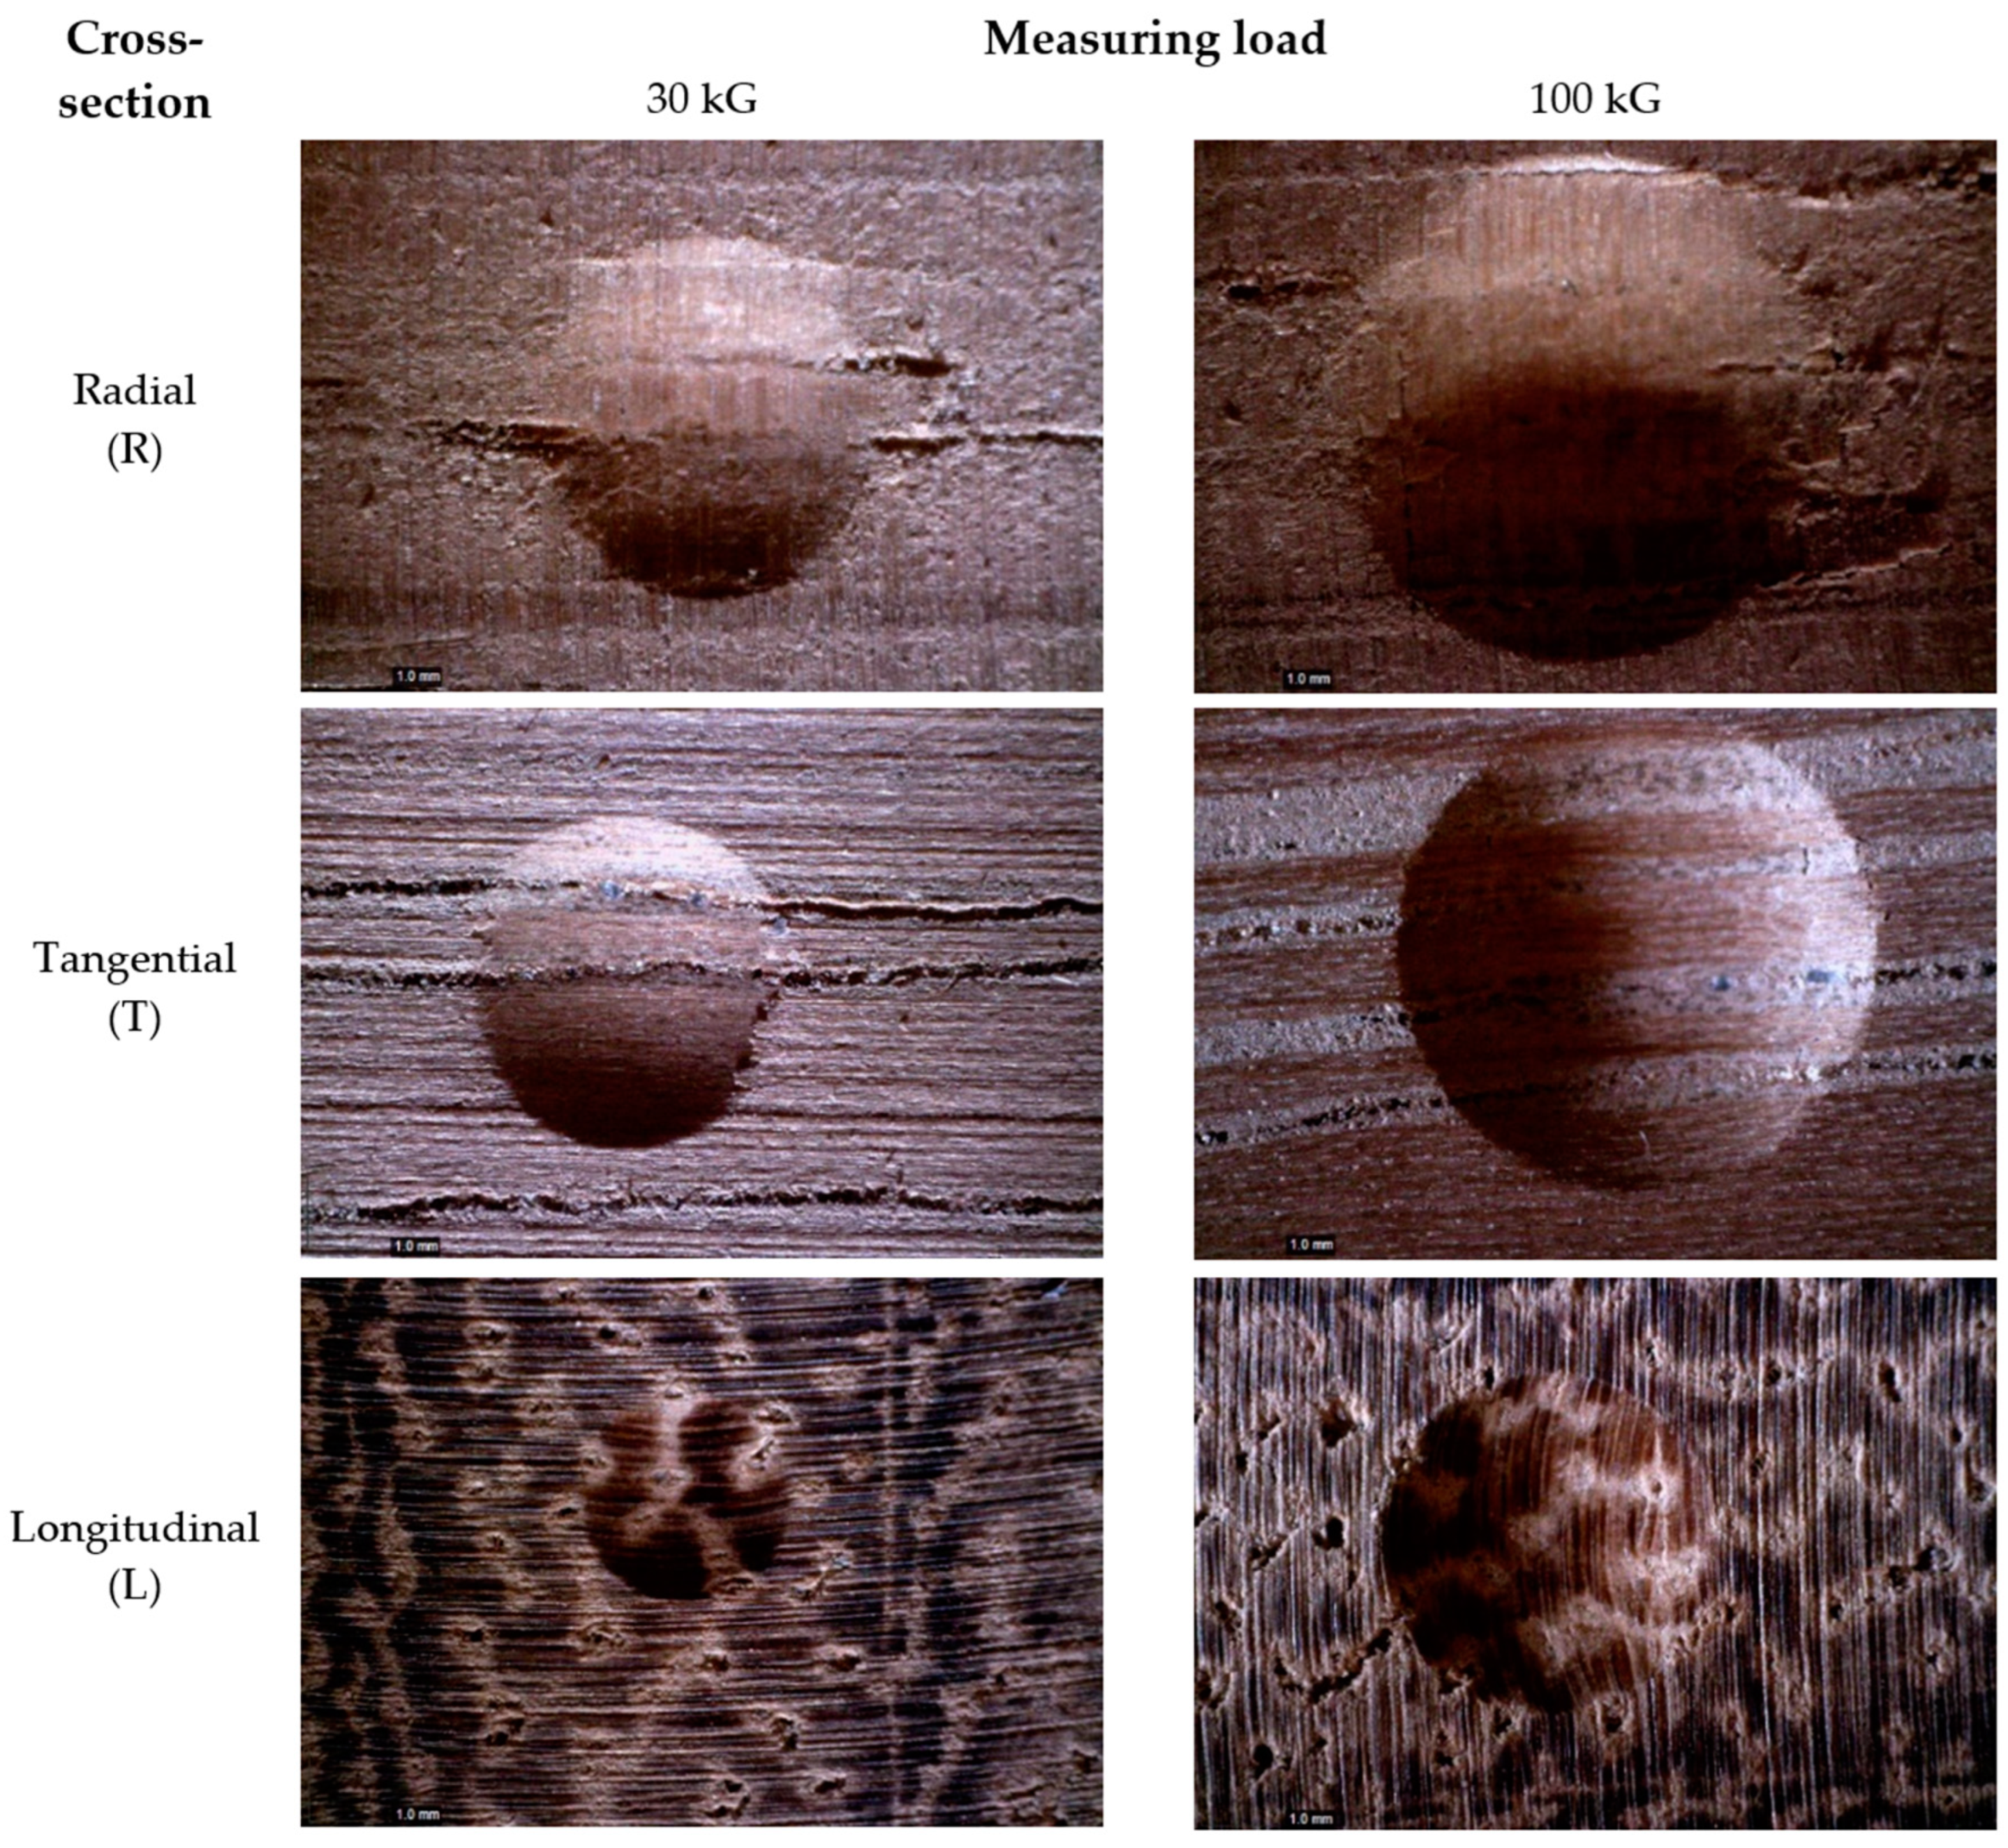
- The ability to self-re-deformation of all the tested wood species’ radial and tangential cross-sections (R and T) depends on the wood density and the measuring force used. In contrast, in the longitudinal cross-section (L), this ability only depends on the wood density (the self-re-deformation ability is independent of the measuring force used). This observation shows that the compaction of the cell structure during side compression is largely reversible (semi-destructive), while the longitudinal deformation of the cell structure (the buckling of cell walls and fracture of ends of the cells) is irreversible (destructive).
Author Contributions
Funding
Institutional Review Board Statement
Informed Consent Statement
Data Availability Statement
Conflicts of Interest
References
- Meyer, L.; Brischke, C.; Welzbacher, C.R. Dynamic and static hardness of wood: Method development and comparative studies. Int. Wood Prod. J. 2011, 2, 5–11. [Google Scholar] [CrossRef]
- Liu, M.; Lin, J.; Lu, C.; Tieu, K.; Zhou, K.; Koseki, T. Progress in Indentation Study of Materials via Both Experimental and Numerical Methods. Crystals 2017, 7, 258. [Google Scholar] [CrossRef]
- Broitman, E. Indentation Hardness Measurements at Macro-, Micro-, and Nanoscale: A Critical Overview. Tribol. Lett. 2017, 65, 23. [Google Scholar] [CrossRef] [Green Version]
- Vörös, Á.; Németh, R. The History of Wood Hardness Tests. IOP Conf. Ser. Earth Environ. Sci. 2020, 505, 012020. [Google Scholar] [CrossRef]
- EN 1534: Wood Flooring and Parquet—Determination of Resistance to Indentation—Test Method; European Committee for Standardization: Brussels, Belgium, 2020.
- Niemz, P.; Stübi, T. Investigations of hardness measurements on wood based materials using a new universal measurement system. In Symposium on Wood Machining, Properties of Wood and Wood Composites Related to Wood Machining; Stanzl-Tschegg, S.E., Reiterer, A., Eds.; Christian-Doppler-Laboratory for Fundamentals of Wood Machining Institute of Meteorology and Physics, University of Agricultural Sciences: Vienna, Austria, 2000; pp. 51–61. [Google Scholar]
- Lykidis, C.; Nikolakakos, M.; Sakellariou, E.; Birbilis, D. Assessment of a modification to the Brinell method for determining solid wood hardness. Mater. Struct. 2016, 49, 961–967. [Google Scholar] [CrossRef]
- Sydor, M.; Pinkowski, G.; Jasińska, A. The Brinell Method for Determining Hardness of Wood Flooring Materials. Forests 2020, 11, 878. [Google Scholar] [CrossRef]
- Kollmann, F.F.; Côté, W.A. Principles of Wood Science and Technology. I Solid Wood; Springer: Berlin/Heidelberg, Germany, 1968; ISBN 978-3-642-87930-2. [Google Scholar]
- Mörath, E. Studien Über die Hygroskopischen Eigenschaften und die Härte der Hölzer. Habilitation Dissertation, Mitteilungen der Holzforschungsstelle an der Technischen Hochschule Darmstadt, Darmstadt, Germany, 1932. [Google Scholar]
- Doyle, J.; Walker, J.C.F. Indentation hardness of wood. Wood Fiber Sci. 1985, 17, 369–376. [Google Scholar]
- Hill, R.; Storåkers, B.; Zdunek, A. A theoretical study of the Brinell hardness test. Proc. R. Soc. Lond. Math. Phys. Sci. 1989, 423, 301–330. [Google Scholar]
- Laskowska, A. Density profile and hardness of thermo-mechanically modified beech, oak and pine wood. Drew. Prace Nauk. Doniesienia Komun. 2020, 63, 26. [Google Scholar] [CrossRef]
- Salca, E.-A.; Hiziroglu, S. Evaluation of hardness and surface quality of different wood species as function of heat treatment. Mater. Des. 2014, 62, 416–423. [Google Scholar] [CrossRef]
- Zanuttini, R.; Negro, F.; Cremonini, C. Hardness and contact angle of thermo-treated poplar plywood for bio-building. IForest Biogeosci. For. 2021, 14, 274–277. [Google Scholar] [CrossRef]
- Sedlar, T.; Šefc, B.; Stojnić, S.; Jarc, A.; Perić, I.; Sinković, T. Hardness of thermally modified beech wood and hornbeam wood. Šumar. List 2019, 143, 433. [Google Scholar] [CrossRef]
- Sydor, M.; Wieloch, G. Construction Properties of Wood Taken into Consideration in Engenering Practice | Właściwości Konstrukcyjne Drewna Uwzględniane w Praktyce Inżynierskiej. Drewno 2009, 52, 63–73. [Google Scholar]
- Scharf, A.; Neyses, B.; Sandberg, D. Hardness of surface-densified wood. Part 1: Material or product property? Holzforschung 2022. [Google Scholar] [CrossRef]
- Mijajima, H. Relation of the Hardness Number to the Applied Load in the Static Ball Indentation Test of Wood. Nippon Rin Gakkai-Shi J. Jpn. For. Soc. 1935, 17, 794–801. [Google Scholar] [CrossRef]
- Koczan, G.; Karwat, Z.; Kozakiewicz, P. An attempt to unify the Brinell, Janka and Monnin hardness of wood on the basis of Meyer law. J. Wood Sci. 2021, 67, 7. [Google Scholar] [CrossRef]
- Tabor, D. The Hardness of Metals; Oxford Classic Texts in the Physical Sciences; Clarendon Press, Oxford University Press: Oxford, UK; New York, NY, USA, 2000; ISBN 978-0-19-850776-5. [Google Scholar]
- Gibson, L.J.; Ashby, M.F. Cellular Solids: Structure and Properties, 2nd ed.; Cambridge University Press: Cambridge, UK, 1997; ISBN 978-0-521-49911-8. [Google Scholar]
- Heräjärvi, H. Variation of basic density and Brinell hardness within mature Finnish Betula pendula and B. pubescens stems. Wood Fiber Sci. 2004, 36, 216–227. [Google Scholar]
- Rautkari, L.; Laine, K.; Kutnar, A.; Medved, S.; Hughes, M. Hardness and density profile of surface densified and thermally modified Scots pine in relation to degree of densification. J. Mater. Sci. 2013, 48, 2370–2375. [Google Scholar] [CrossRef]
- Ashby, M.F.; Jones, D.R.H. Engineering Materials 2: An Introduction to Microstructures, Processing and Design, 3rd ed.; Butterworth-Heinemann: Oxford, UK, 2006; ISBN 978-0-08-046863-1. [Google Scholar]
- Adusumalli, R.-B.; Raghavan, R.; Ghisleni, R.; Zimmermann, T.; Michler, J. Deformation and failure mechanism of secondary cell wall in Spruce late wood. Appl. Phys. A 2010, 100, 447–452. [Google Scholar] [CrossRef]
- Zauner, M.; Stampanoni, M.; Niemz, P. Failure and failure mechanisms of wood during longitudinal compression monitored by synchrotron micro-computed tomography. Holzforschung 2016, 70, 179–185. [Google Scholar] [CrossRef]
- Gibson, L.J. The hierarchical structure and mechanics of plant materials. J. R. Soc. Interface 2012, 9, 2749–2766. [Google Scholar] [CrossRef] [PubMed]
- Vural, M.; Ravichandran, G. Microstructural aspects and modeling of failure in naturally occurring porous composites. Mech. Mater. 2003, 35, 523–536. [Google Scholar] [CrossRef]
- Thibaut, B.; Gril, J.; Fournier, M. Mechanics of wood and trees: Some new highlights for an old story. Comptes Rendus Acad. Sci. Ser. IIB Mech. 2001, 329, 701–716. [Google Scholar] [CrossRef]
- Easterling, K.; Harrysson, R.; Gibson, L.; Ashby, M.F. On the mechanics of balsa and other woods. Proc. R. Soc. Lond. Math. Phys. Sci. 1982, 383, 31–41. [Google Scholar] [CrossRef]


| Species | Average Density (g/cm3) |
|---|---|
| Alder (Alnus glutinosa (L.) Gaertn) | 0.500 |
| Linden (Tilia europaea L) | 0.505 |
| Birch (Betula alba L.) | 0.595 |
| Ash (Fraxinus excelsior L.) | 0.660 |
| Iroko (Milicia excelsa (Welw.) CC Berg) | 0.690 |
| Beech (Fagus sylvatica L.) | 0.740 |
| Ratio | Equation | Wood Specie | |||||
|---|---|---|---|---|---|---|---|
| Alder | Ash | Beech | Birch | Iroko | Linden | ||
| Hardness depending on the measuring force value | HB(L. 100 kG)/HB(L. 30 kG) | 128% | 136% | 138% | 134% | 130% | 118% |
| HB(R. 100 kG)/HB(R. 30 kG) | 157% | 145% | 136% | 150% | 159% | 107% | |
| HB(T. 100 kG)/HB(T. 30 kG) | 143% | 125% | 155% | 157% | 142% | 119% | |
| Hardness depending on the cross-section | HB(R. 30 kG)/HB(L. 30 kG) | 26% | 45% | 41% | 31% | 36% | 30% |
| HB(R. 100 kG)/HB(L. 100 kG) | 32% | 47% | 40% | 35% | 44% | 28% | |
| HB(R. 30 kG)/HB(T. 30 kG) | 123% | 104% | 113% | 109% | 124% | 109% | |
| HB(R. 100 kG)/HB(T. 100 kG) | 104% | 89% | 129% | 114% | 111% | 122% | |
Publisher’s Note: MDPI stays neutral with regard to jurisdictional claims in published maps and institutional affiliations. |
© 2022 by the authors. Licensee MDPI, Basel, Switzerland. This article is an open access article distributed under the terms and conditions of the Creative Commons Attribution (CC BY) license (https://creativecommons.org/licenses/by/4.0/).
Share and Cite
Sydor, M.; Pinkowski, G.; Kučerka, M.; Kminiak, R.; Antov, P.; Rogoziński, T. Indentation Hardness and Elastic Recovery of Some Hardwood Species. Appl. Sci. 2022, 12, 5049. https://doi.org/10.3390/app12105049
Sydor M, Pinkowski G, Kučerka M, Kminiak R, Antov P, Rogoziński T. Indentation Hardness and Elastic Recovery of Some Hardwood Species. Applied Sciences. 2022; 12(10):5049. https://doi.org/10.3390/app12105049
Chicago/Turabian StyleSydor, Maciej, Grzegorz Pinkowski, Martin Kučerka, Richard Kminiak, Petar Antov, and Tomasz Rogoziński. 2022. "Indentation Hardness and Elastic Recovery of Some Hardwood Species" Applied Sciences 12, no. 10: 5049. https://doi.org/10.3390/app12105049
APA StyleSydor, M., Pinkowski, G., Kučerka, M., Kminiak, R., Antov, P., & Rogoziński, T. (2022). Indentation Hardness and Elastic Recovery of Some Hardwood Species. Applied Sciences, 12(10), 5049. https://doi.org/10.3390/app12105049