Article

Transcriptional Profiling of Hippocampus Identifies Network Alterations in Alzheimer’s Disease

1
Institute of Molecular Bioimaging and Physiology, National Research Council (IBFM-CNR), Via F. Cervi 93, Segrate, 20054 Milan, Italy
2
Department of Computer Science, Università degli Studi di Milano, Via Celoria 18, 20133 Milan, Italy
3
Istituti Clinici Scientifici Maugeri IRCCS, Institute of Bari, 70124 Bari, Italy
4
Unit of Data Sciences and Technology Innovation for Population Health, National Institute of Gastroenterology “Saverio de Bellis” Research Hospital, Castellana Grotte, 70013 Bari, Italy
5
Department of Physics, Università degli Studi di Milano-Bicocca, Piazza Della Scienza 3, 20126 Milan, Italy
*
Author to whom correspondence should be addressed.
Appl. Sci. 2022, 12(10), 5035; https://doi.org/10.3390/app12105035
Submission received: 5 April 2022 / Revised: 13 May 2022 / Accepted: 13 May 2022 / Published: 16 May 2022
(This article belongs to the Special Issue Recent Advances in Bioinformatics and Health Informatics)

Abstract

:
Alzheimer’s disease (AD) is a neurodegenerative disease characterized by rapid brain cell degeneration affecting different areas of the brain. Hippocampus is one of the earliest involved brain regions in the disease. Modern technologies based on high-throughput data have identified transcriptional profiling of several neurological diseases, including AD, for a better comprehension of genetic mechanisms of the disease. In this study, we investigated differentially expressed genes (DEGs) from six Gene Expression Omnibus (GEO) datasets of hippocampus of AD patients. The identified DEGs were submitted to Weighted correlation network analysis (WGCNA) and ClueGo to explore genes with a higher degree centrality and to comprehend their biological role. Subsequently, MCODE was used to identify subnetworks of interconnected DEGs. Our study found 40 down-regulated genes and 36 up-regulated genes as consensus DEGs. Analysis of the co-expression network revealed ACOT7, ATP8A2, CDC42, GAD1, GOT1, INA, NCALD, and WWTR1 to be genes with a higher degree centrality. ClueGO revealed the pathways that were mainly enriched, such as clathrin coat assembly, synaptic vesicle endocytosis, and DNA damage response signal transduction by p53 class mediator. In addition, we found a subnetwork of 12 interconnected genes (AMPH, CA10, CALY, NEFL, SNAP25, SNAP91, SNCB, STMN2, SV2B, SYN2, SYT1, and SYT13). Only CA10 and CALY are targets of known drugs while the others could be potential novel drug targets.

1. Introduction

First described by German neuropathologist Alois Alzheimer in 1906, Alzheimer’s disease (AD) is an age-associated neurodegenerative disease characterized by progressive memory loss and deterioration of cognitive functions that ultimately leads to dementia [1,2].
Symptoms usually begin with progressive memory loss and then develop in other cognitive domains such as language, visuospatial skills, motor skills, and daily living activities [3]. Since AD usually has a silent onset, most patients with AD are already in an advanced stage by the time of diagnosis [4].
AD is a complex disease resulting from the interaction of genetic and environmental factors [5]. The primary pathogenesis of AD is known to be related to the accumulation of amyloid plaques and neurofibrillary tangles (NFTs), which are aggregates of β-amyloid (Aβ) and hyperphosphorylated Tau protein [6]. Hence, the gradual intraneuronal accumulation of neurofibrillary tangles, the extracellular deposition of Aβ protein in the form of senile plaques, and massive neuronal death represent important neuropathological features of AD [6].
All these processes involve variations in the expression and regulation of numerous genes and genetic factors are estimated to attribute up to 79% of the risk of AD [7]. Mutations in genes that increase Aβ generation and aggregation, such as amyloid precursor protein (APP), presenilin 1 (PSEN1), and presenilin 2 (PSEN2), are considered to be the genetic causes of familial AD [8].
The identification of candidate genes could considerably increase our understanding of the biological mechanisms involved in the pathogenesis of AD and these could be used as diagnostic and predictive biomarkers.
AD affects various specific and vulnerable brain areas, and hippocampus is one of the first to be affected [9]. Hippocampus is a brain structure belonging to the limbic system embedded deep in the temporal lobe that plays a fundamental role in learning and memory processes. Some studies suggest that impaired neurogenesis in adult hippocampus could play a role in the onset of AD [9].
It has been shown that genes associated with neuronal loss, glial activation, and lipid metabolism increase with age [10]. However, in AD these genes are prematurely expressed along with genes related to protein folding and cell adhesion [10].
In recent years, bioinformatics analysis has been widely applied to molecular biology experiments revealing key pathways and pharmacological targets of complex diseases [11]. Therefore, the analysis of multiple high-throughput datasets of AD patients may be an optimal strategy [11,12,13].
A first model of AD progression was suggested by Blalock et al. [14] considering the biomarkers found in their study. Alterations in axons activate localized oligodendrocytes that secrete growth factor promoting adjacent neurons. In turn, these generate an up-regulation of tumor-suppressor-mediated protein aggregation and axon–myelin interactions along myelinated axons [14].
Previous studies evaluated several functional regions of human brains, such as entorhinal cortex, hippocampus, middle temporal gyrus, posterior cingulate cortex, superior frontal gyrus, and primary visual cortex. Each region is characterized by specific properties and gene expression changes [15,16].
Interspecies analyses to reveal alterations in AD brains were performed from human brain tissues and a transgenic mouse model. The study showed that genes implicated in insulin signaling and AD were altered in both tissues [17].
A similar study to investigate shared molecular mechanisms between AD and diabetes was conducted by Lee and Lee [18]. They found five common genes dysregulated in both diseases and disease-specific tissue in the brain and pancreas [18].
Our study, which is based on a computational approach, aims at the identification of novel AD biomarkers for diagnosis and treatment. We analyzed gene expression profiles of AD patients from several public datasets and obtained a consensus list of differentially expressed genes (DEGs) between AD and control samples. We investigated known drugs that interact with consensus DEGs using three different drug databases. Further, we investigated DEG interactions and their biological role using protein–protein interactions (PPIs), the co-expression network, and enrichment analysis.

2. Materials and Methods
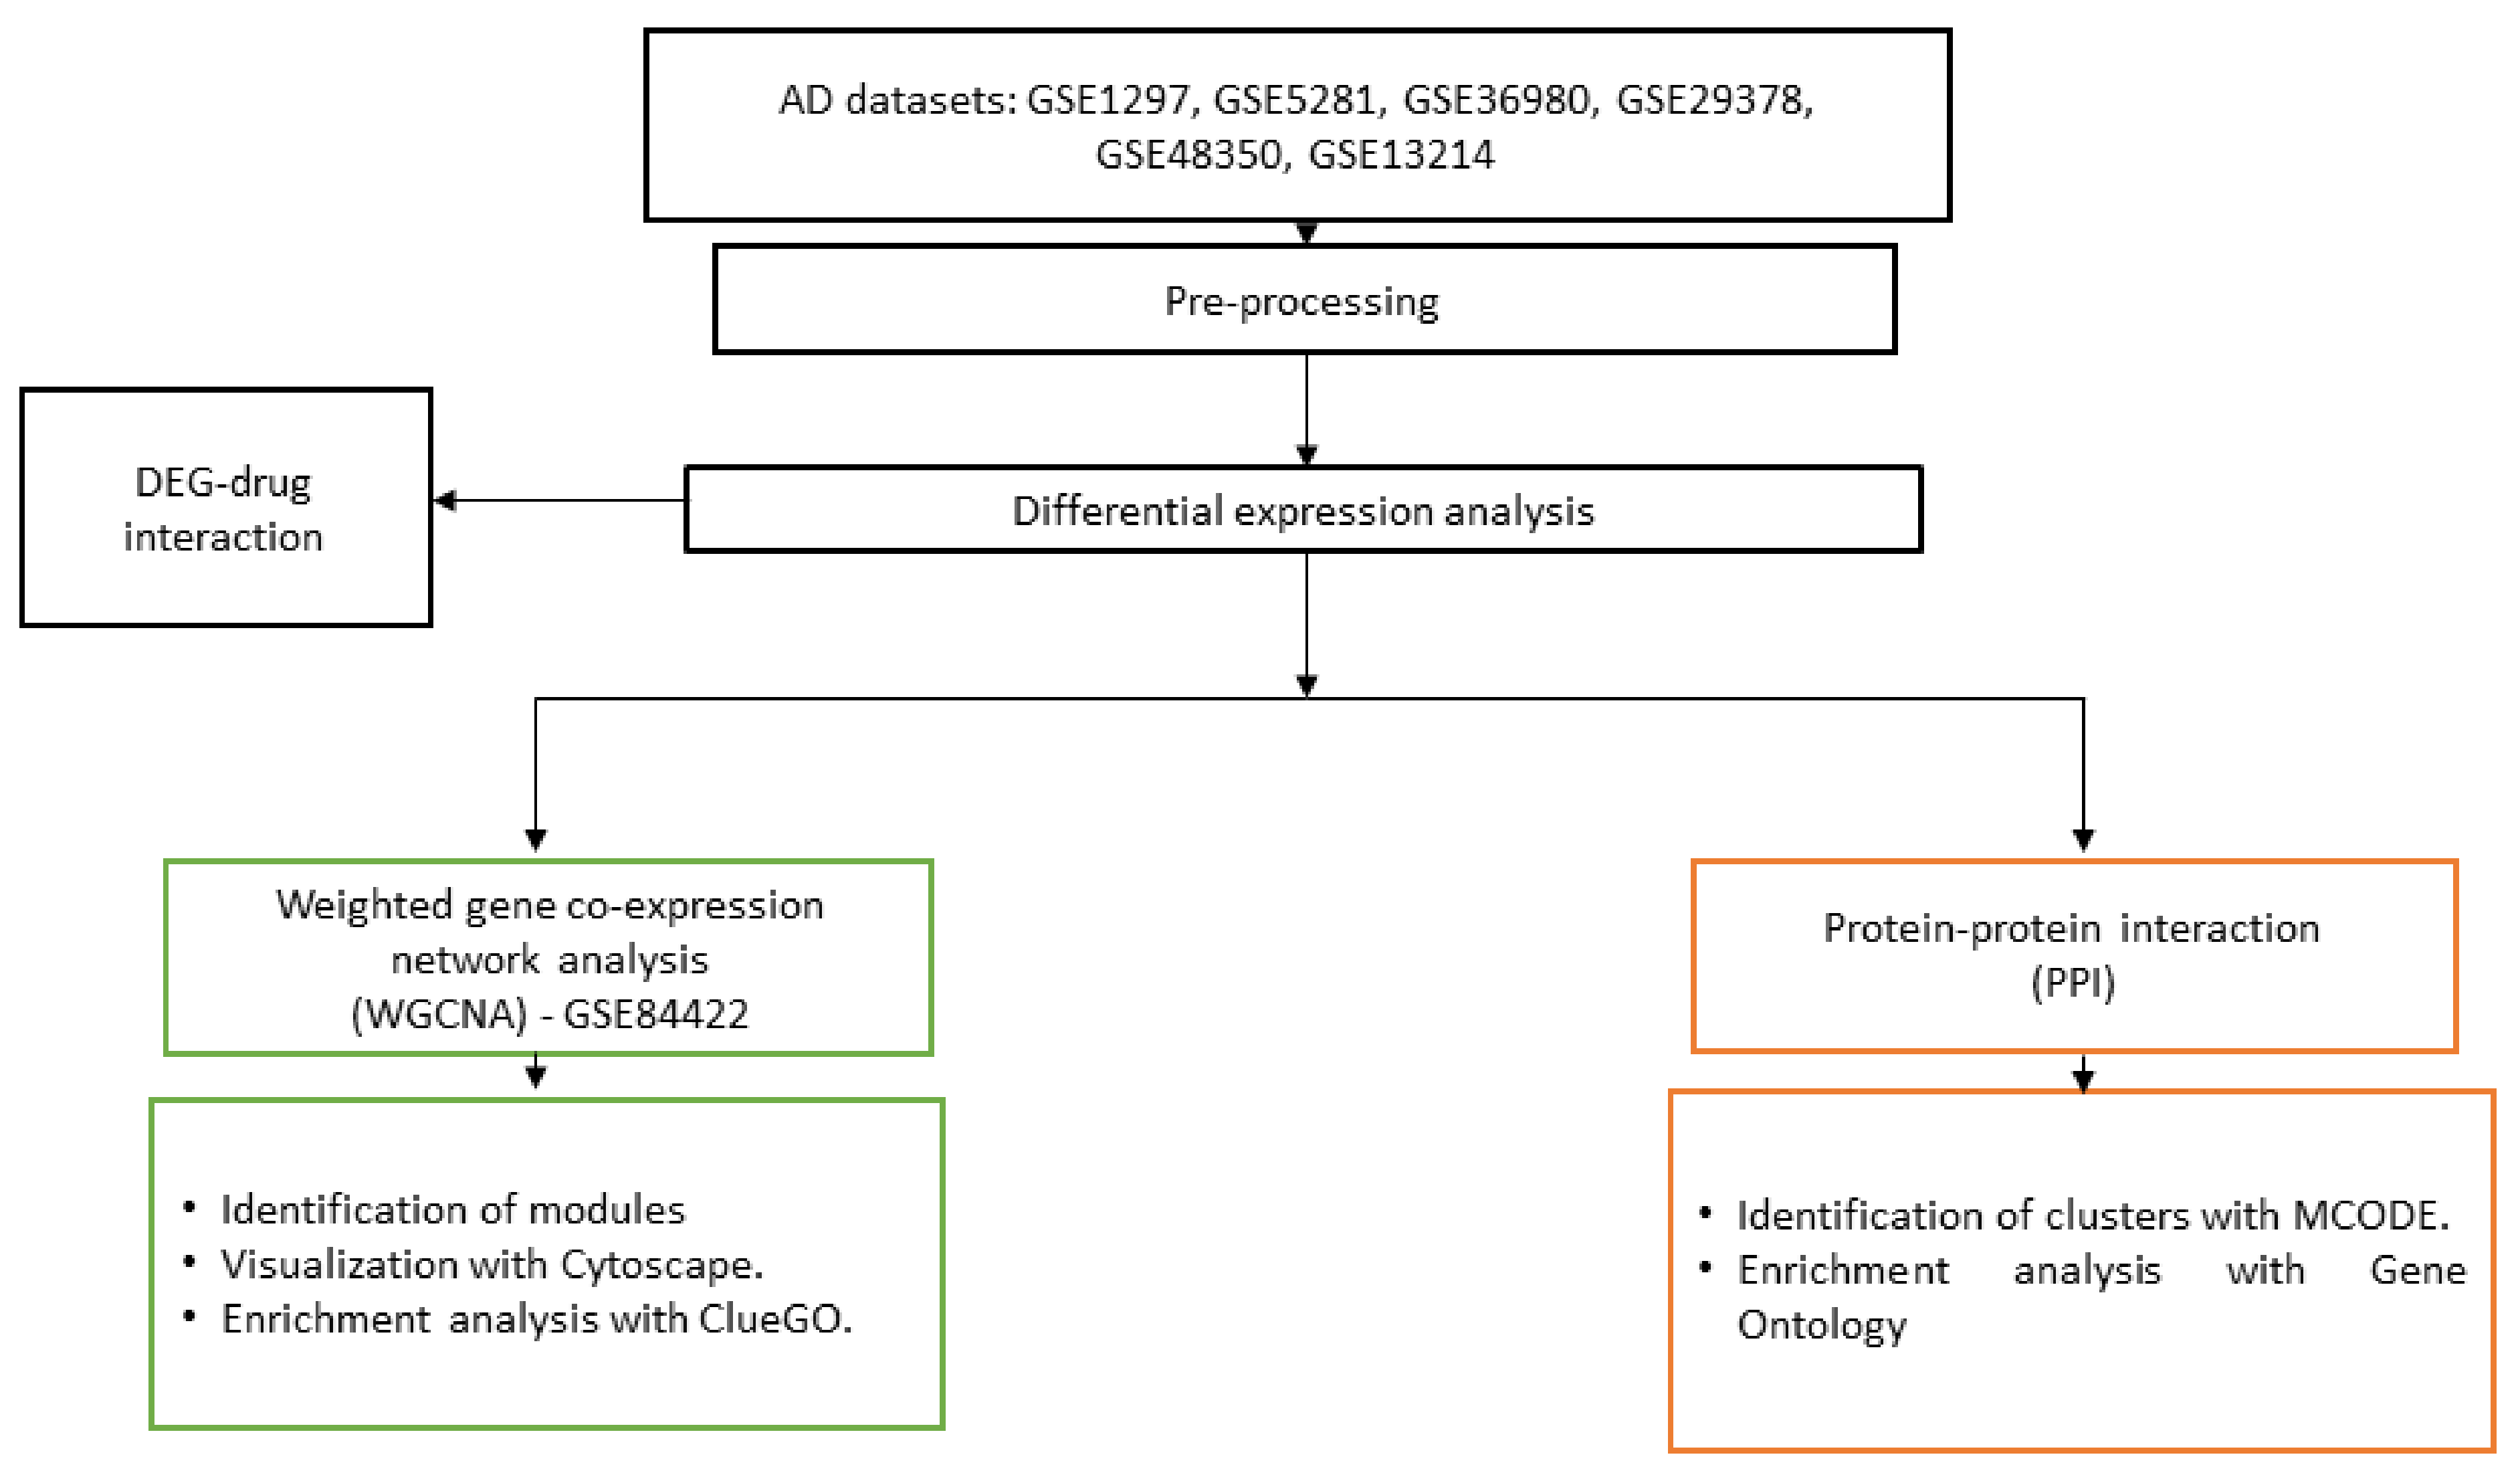
2.1. Datasets

Six datasets (GSE1297, GSE5281, GSE36980, GSE29378, GSE48350, and GSE13214) were downloaded from the Gene Expression Omnibus (GEO), derived from the Affymetrix Human Genome U133A Array, the Affymetrix Human Genome U133 Plus 2.0 Array, the Affymetrix Human Gene 1.0 ST Array, the Illumina HumanHT-12 V3.0 expression beadchip, the Affymetrix Human Genome U133 Plus 2.0 Array, and Homo sapiens 4.8K 02-01 amplified cDNA, respectively. For all datasets, the gene expression levels of hippocampus of AD patients were analyzed as this is particularly vulnerable to damage in the early stages of AD [9].
We generated for each GEO dataset a boxplot showing the distribution of genes for each sample after log transformation. Median-centered values were considered as indicators of normalized data. Thus, we verified that the GEO datasets had previously been normalized, as described in the works of the original datasets [12,13,14,15,16,17].
The computational approach is illustrated in Figure 1. A consensus list of DEGs among the 6 GEO datasets was investigated. Further, we performed a study to comprehend their biological role, including PPI, co-expression network, and Gene Ontology analyses.

2.2. Differential Expression Analysis

The raw data of the GEO datasets were processed through GEO2R, which compares gene expression levels between AD and control subjects [19]. The differential expression analysis was performed considering GEO datasets separately with the limma package. We used as the cut-off a p-value < 0.05 and |logFC| > 1 for GSE1297 and an adjusted p-value (false discovery rate) < 0.05 and |logFC| > 1 for the other datasets. Probe ID mapping was performed with GEO2R.
We considered DEGs found in at least two datasets for further analyses.

2.3. Differentially Expressed Gene–Drug Interactions

We investigated whether DEGs are associated with known drugs. We used three drug databases: DGIdb [20], DrugCentral [21], and The Drug Repurposing Hub [22]. DEGs found in at least two GEO datasets were submitted to the drug databases. We selected drug–gene interactions that are present in at least two drug databases.

2.4. Co-Expression Network

Weighted correlation network analysis (WGCNA) [23] was used to create a network of co-expressed genes considering expression levels of DEGs in an independent dataset, GSE84422. We used GSE84422 as this dataset was not used in the previous analyses and contains gene expression levels of AD samples derived from hippocampus.
A correlation matrix was calculated by measuring Pearson’s correlations among all DEG pairs. Furthermore, the genes were clustered into modules [23]. The modules are defined as groups of genes that are strongly interconnected with the genes of the same module and poorly connected with genes of other modules.
To visualize the modules obtained with WGCNA, we used Cytoscape [24]. In addition, for each gene in the network we calculated the degree centrality, defined as the number of edges that own a node, using the R-package igraph.

2.5. Protein–Protein Interaction

The study of interacting proteins can help us understand their biological role. In particular, for complex idiopathic diseases, such as AD, PPI networks are useful to comprehend the biological mechanism of the disease [25,26]. To evaluate the relationships among DEGs in AD, we built a PPI using STRING v11.0 with an average confidence interaction score of 0.4 to reduce the number of inconsistent PPIs [27]. The results obtained with STRING were submitted to Cytoscape using the MCODE plugin to reveal the interconnected regions (degree cut-off, 2; node score cut-off, 0.2; kappa score, 2; maximum depth, 100) [28].

2.6. Pathway and Gene Ontology Analysis

The genes associated with modules obtained with WGCNA were analyzed with ClueGO v2.5.8/CluePedia v1.5.8 [29]. ClueGO integrates Gene Ontology (GO) and pathway analysis to obtain a functional enrichment analysis. We set as the p-value p ≤ 0.01. The genes identified by MCODE were analyzed with GO for biological processes.

3. Results

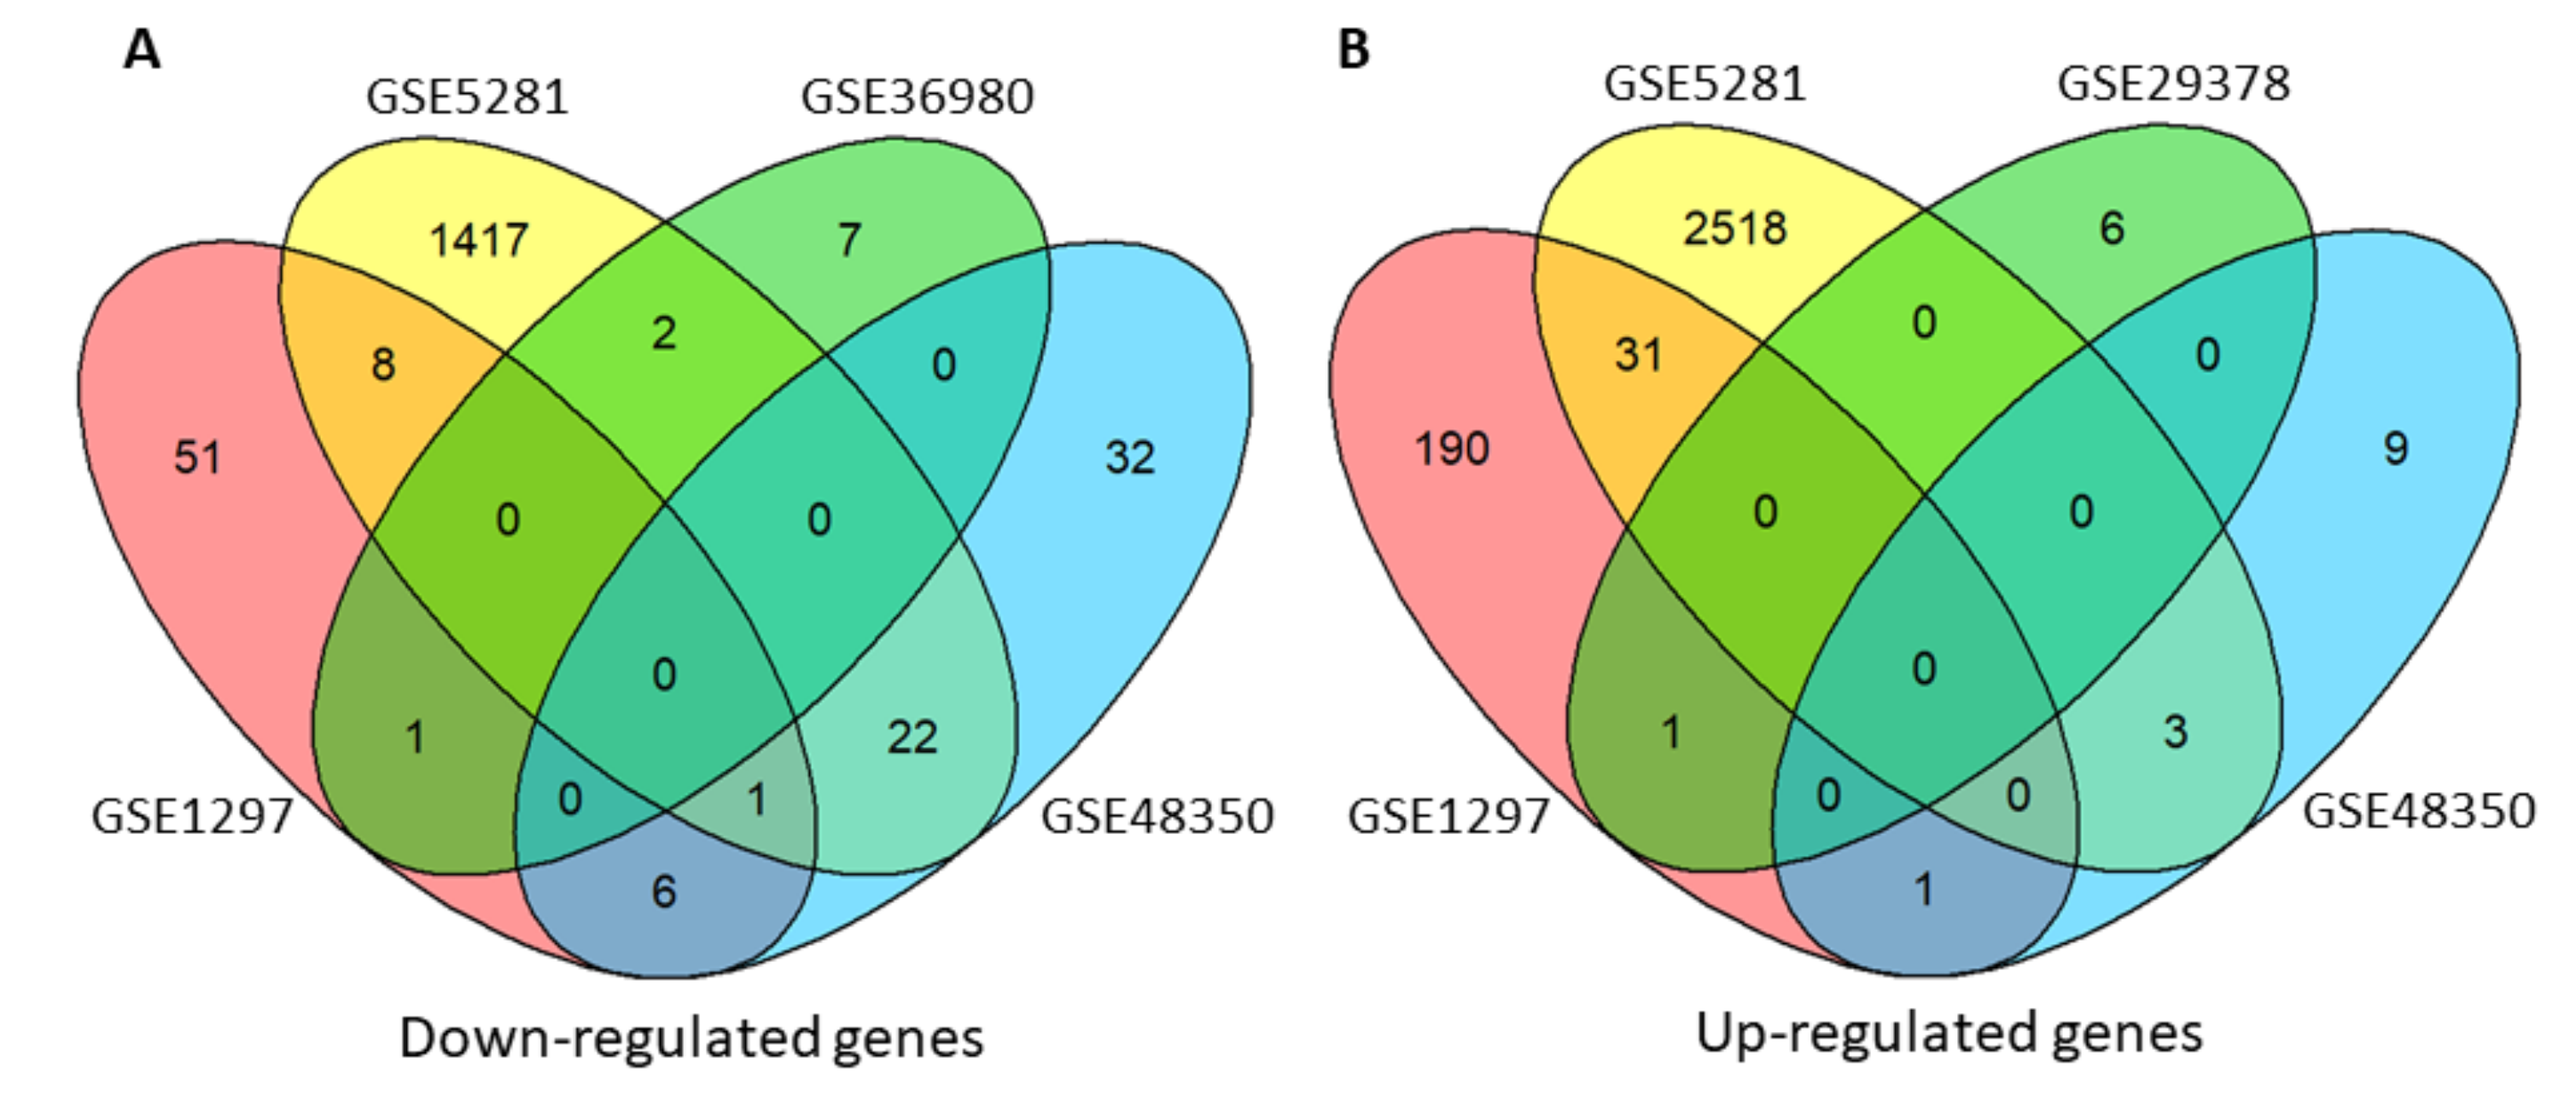
3.1. Differentially Expressed Genes

By performing a differential expression analysis, we obtained 67 down-regulated genes and 223 up-regulated genes in GSE1297. A total of 4002 DEGs (1450 down-regulated genes and 2552 up-regulated genes) were found in GSE5281. We found only 10 down-regulated genes in GSE36980 and 7 up-regulated genes in GSE29378. A total of 61 down-regulated genes and 13 up-regulated genes were found in GSE48350. No DEGs were obtained in GSE13214.
We found 40 down-regulated genes and 36 up-regulated genes as common DEGs in at least two GEO datasets. The Venn diagram in Figure 2 shows common DEGs among the GEO datasets.

3.2. Drugs Interact with Differentially Expressed Genes in AD

We submitted the list of 76 DEGs to DGIdb, DrugCentral, and The Drug Repurposing Hub. We selected the drugs that interact with our DEGs in at least two of the drug databases.
DGIdb and DrugCentral revealed several drugs that have as targets two down-regulated genes: GOT1 and MET1. GOT1 is a target of aspartic acid and MET is a target of crizotinib, erlotinib, cabozantinib, gefitinib, pazopanib, and afatinib. In addition, the results from DGIdb and DrugCentral show that two up-regulated genes, COMT and PTAFR, act on common drugs in the two drug databases. Opicapone, tolcapone, and entacapone interact with COMT, and rupatadine interacts with PTAFR.
DGIdb and The Drug Repurposing Hub showed nine down-regulated genes (CA10, CACNG2, CALY, CKMT1A, GAD1, GLS2, GOT1, MAP4, and MET) interacting with known drugs. CA10 interacts with zonisamide, CACNG2 with gabapentin, CALY with apomorfina, clozapina, and trifluoperazine, CKMT1A with creatin, GAD1 and GLS2 with glutamic acid, GOT1 with aspartic acid, cysteine, and glutamic acid, and MAP4 with docetaxel and paclitaxel. MET is a target of alectinib, altiratinib, AMG-208, AMG-337, amuvatinib, BMS-777607, BMS-817378, cabozantinib, crizotinib, foretinib, golvatinib, JNJ-38877605, MGCD-265, MK-2461, MK-8033, PF-04217903, PHA-665752, savolitinib, and tivantinib. In addition, three up-regulated genes (COMT, PRKG1, and PTAFR) are targets of different drugs. COMT interacts with entacapone, nialamide, opicapone, tolcapone, and 2-metossiestradiolo, PRKG1 is a target of GSK-690693, and PTAFR is a target of apafant, foropafant, and rupatadina.
DrugCentral and The Drug Repurposing Hub revealed several drugs acting on two down-regulated genes (GOT1 and MET). GOT1 is a target of aspartic acid; MET is a target of cabozantinib, and crizotinib. In addition, we found two up-regulated genes: COMT interacts with entacapone, opicapone, and tolcapone; PTAFR interacts with rupatadine.
Table 1 and Table 2 show the list of down-regulated and up-regulated genes that are targets of known drugs in at least two drug databases.
Overall, we obtained 34 drugs that interact with nine genes for down-regulated genes, and nine drugs that interact with three genes for up-regulated genes.

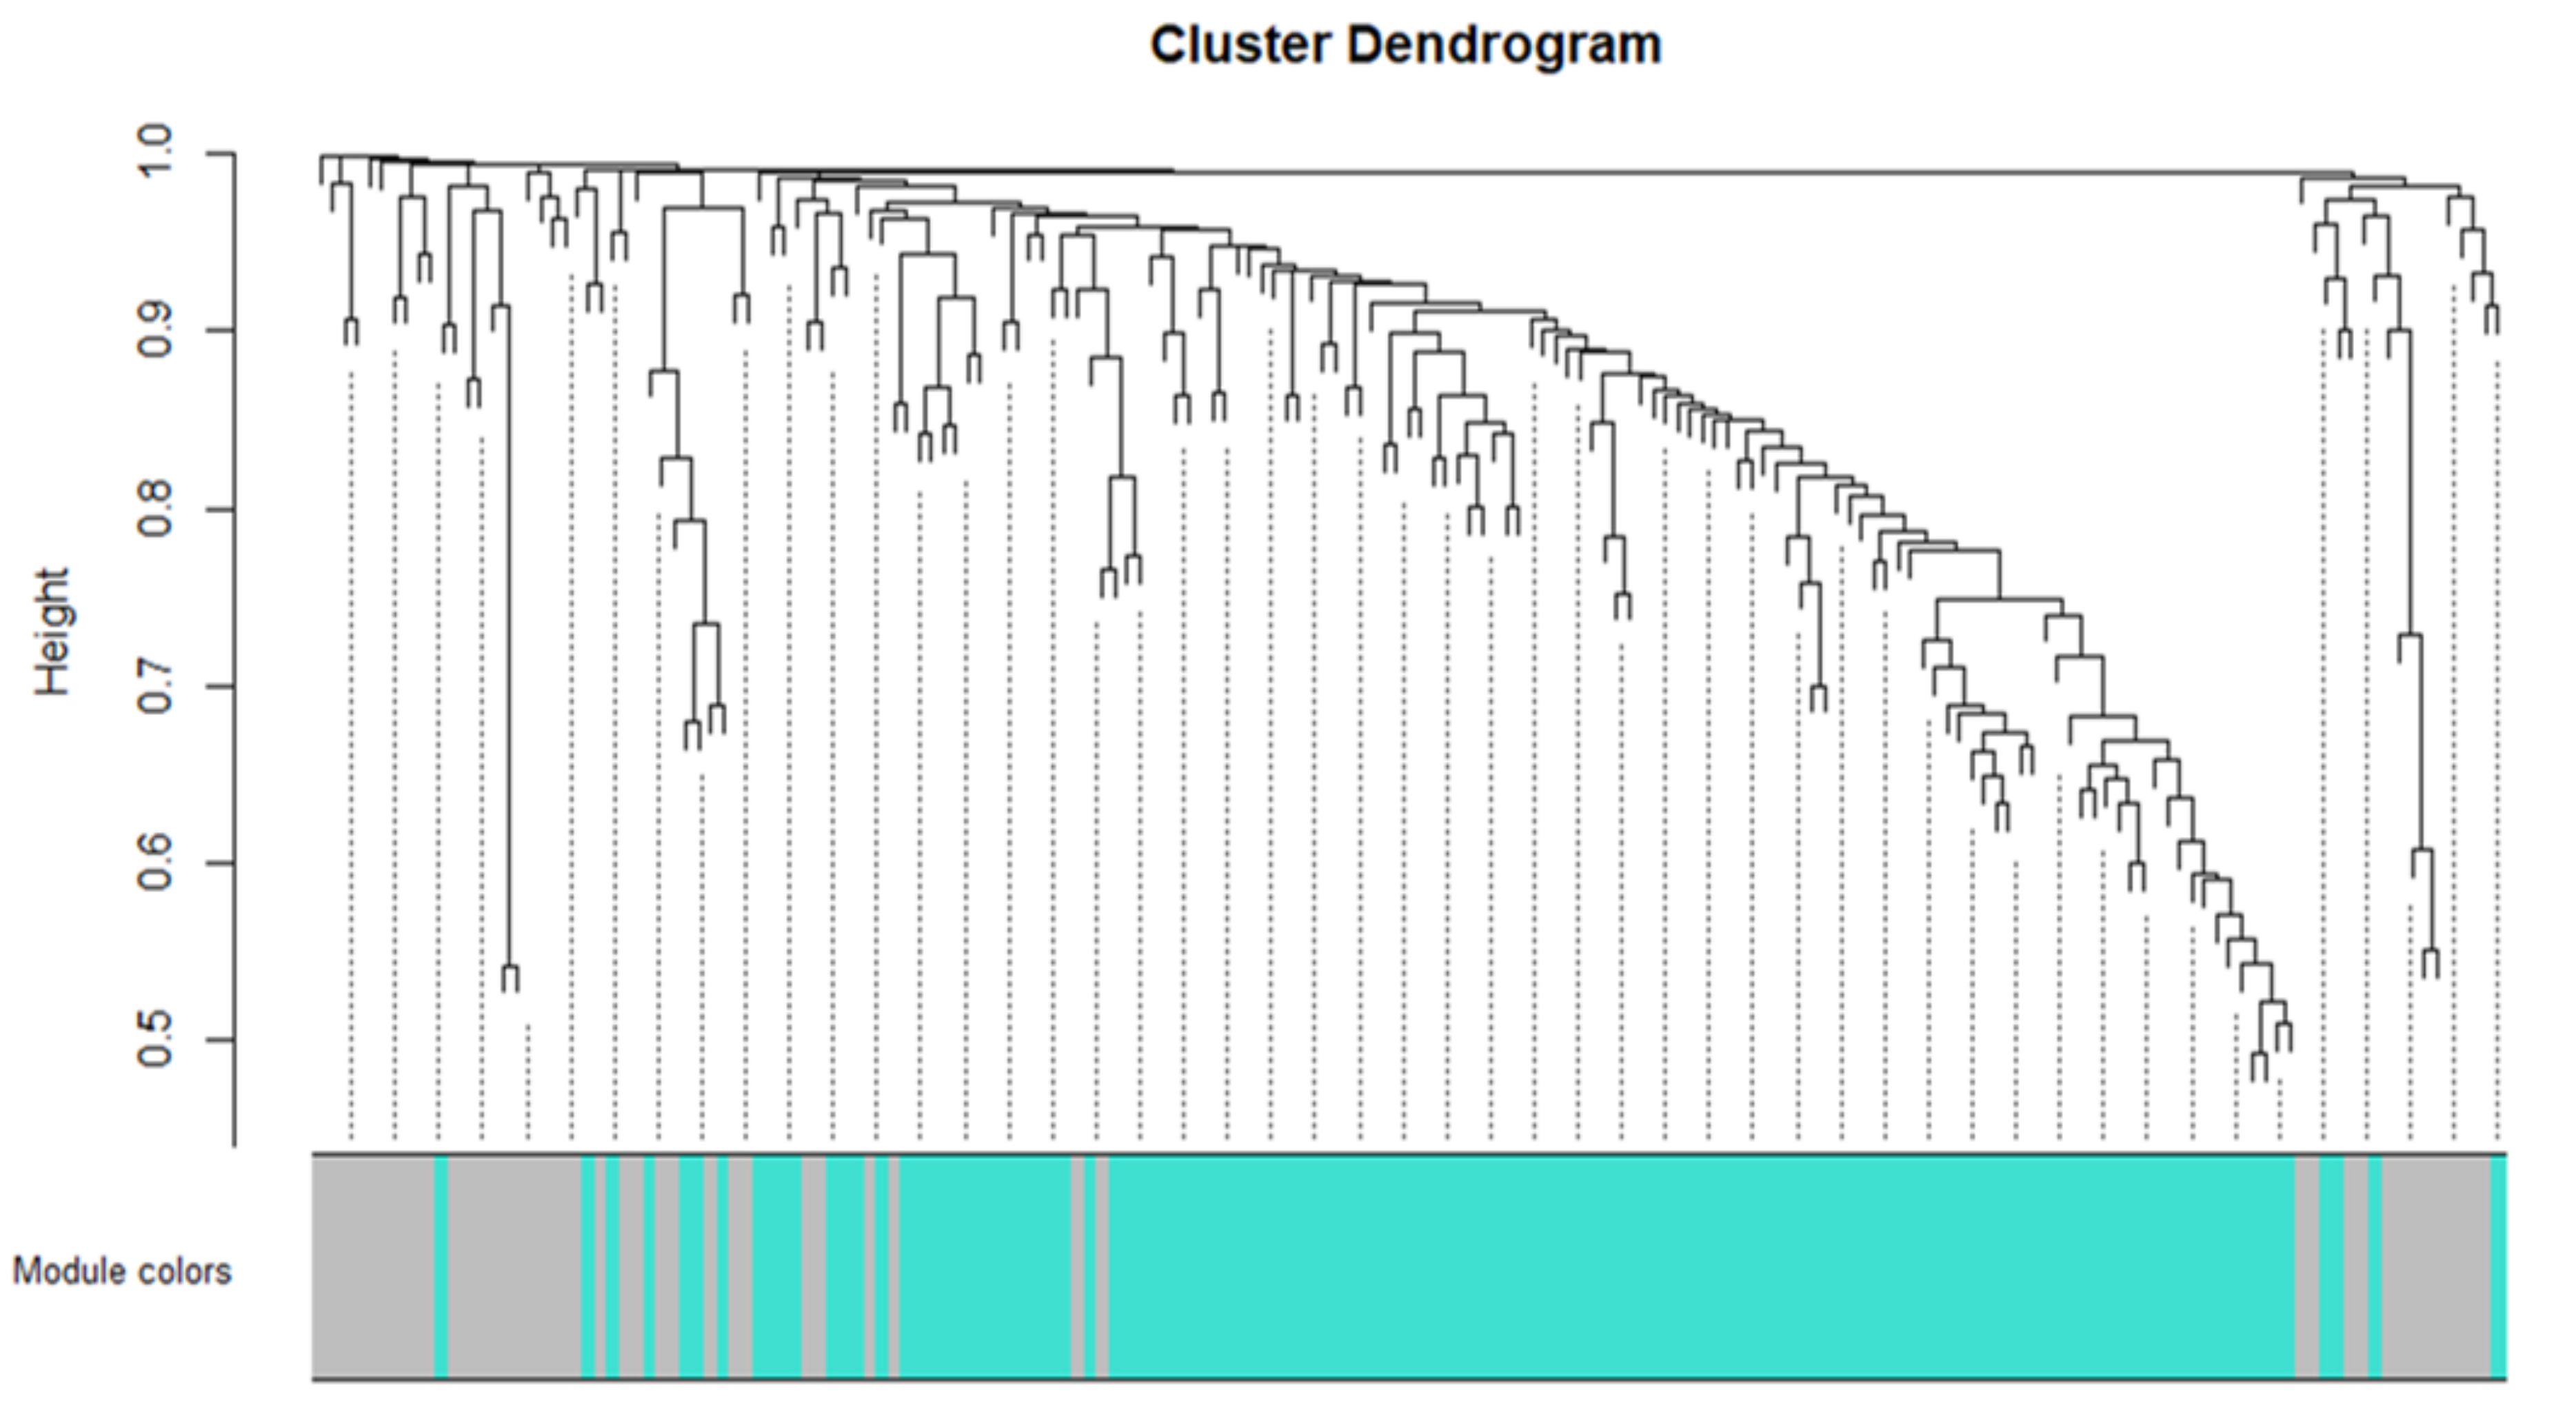
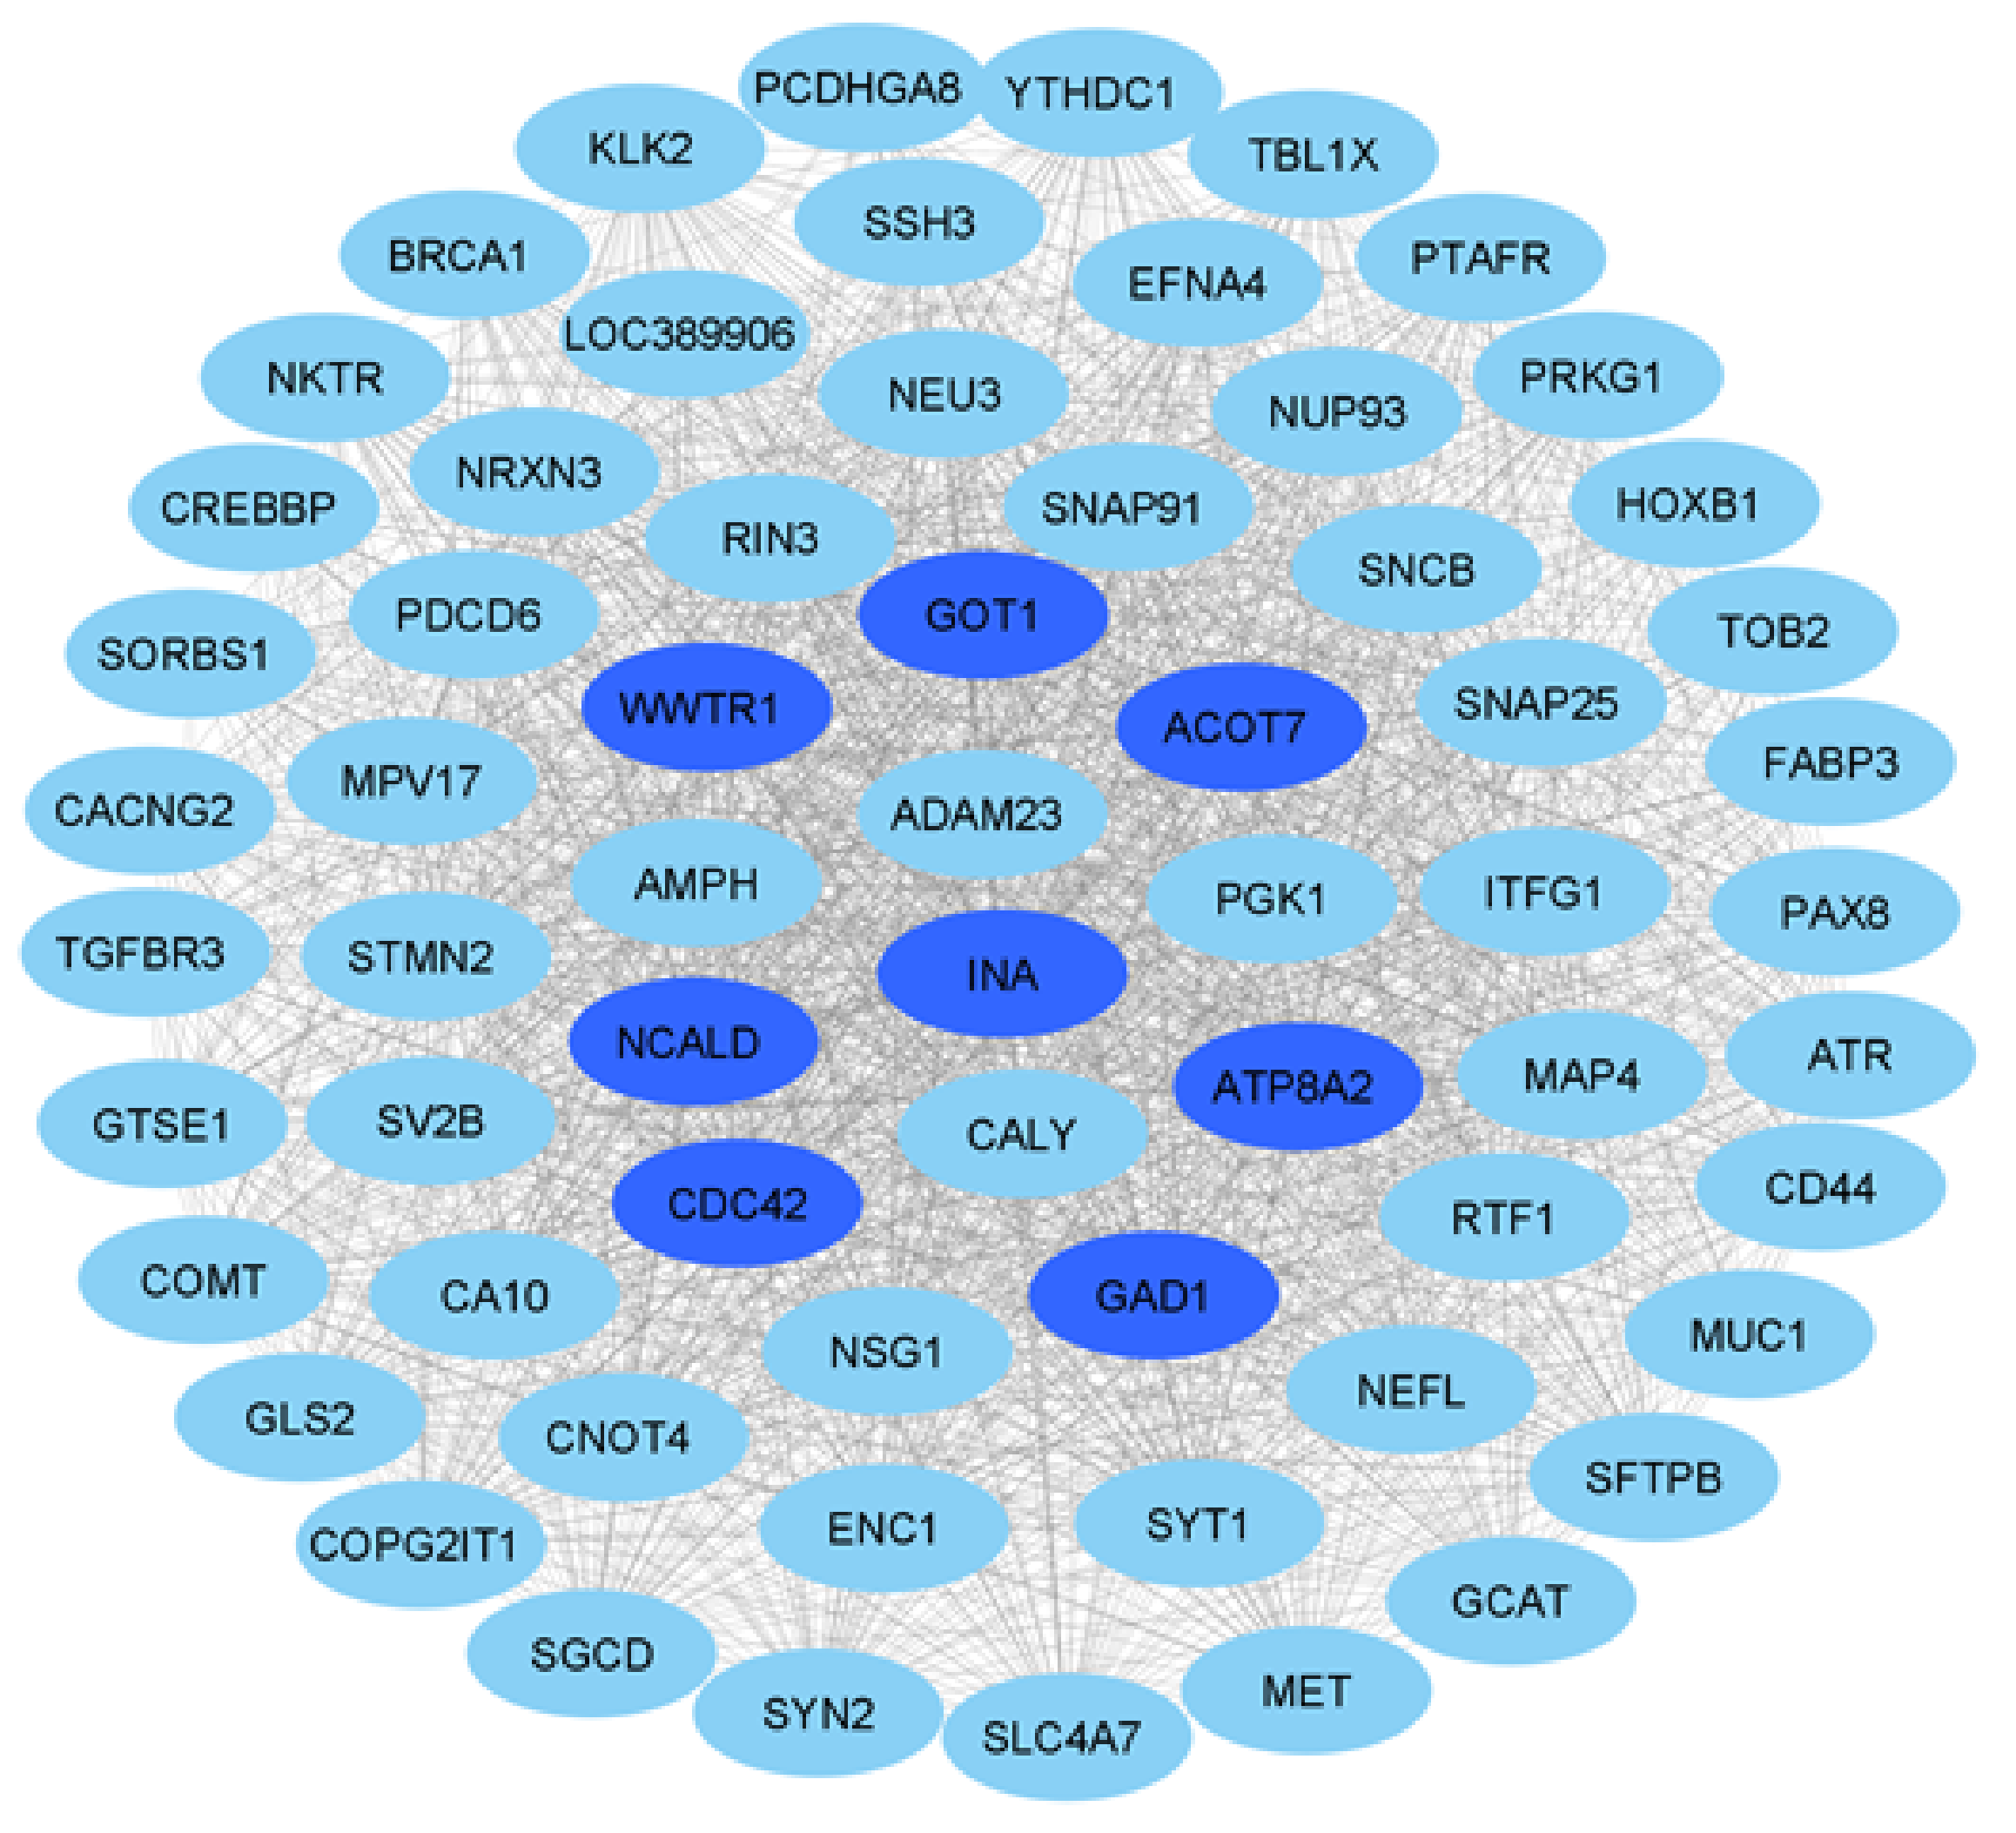
3.3. Network Construction and Module Detection

WGCNA was used to determine the expression levels of 76 differentially expressed genes in an independent dataset (GSE84422) containing 18 AD samples. A total of 5 out of 76 genes were not present in GSE84422. A total of 71 gene symbols were converted to probes obtaining 179 probes and used as an input for WGCNA.
WGCNA found a module of 131 probes related to 64 genes (Figure 3).
Then, we used Cytoscape to visualize the module obtained with WGCNA, obtaining a network of 64 genes and 1760 edges. ACOT7, ATP8A2, CDC42, GAD1, GOT1, INA, NCALD, and WWTR1 were the genes with the highest degree centrality. Figure 4 shows the co-expression network.

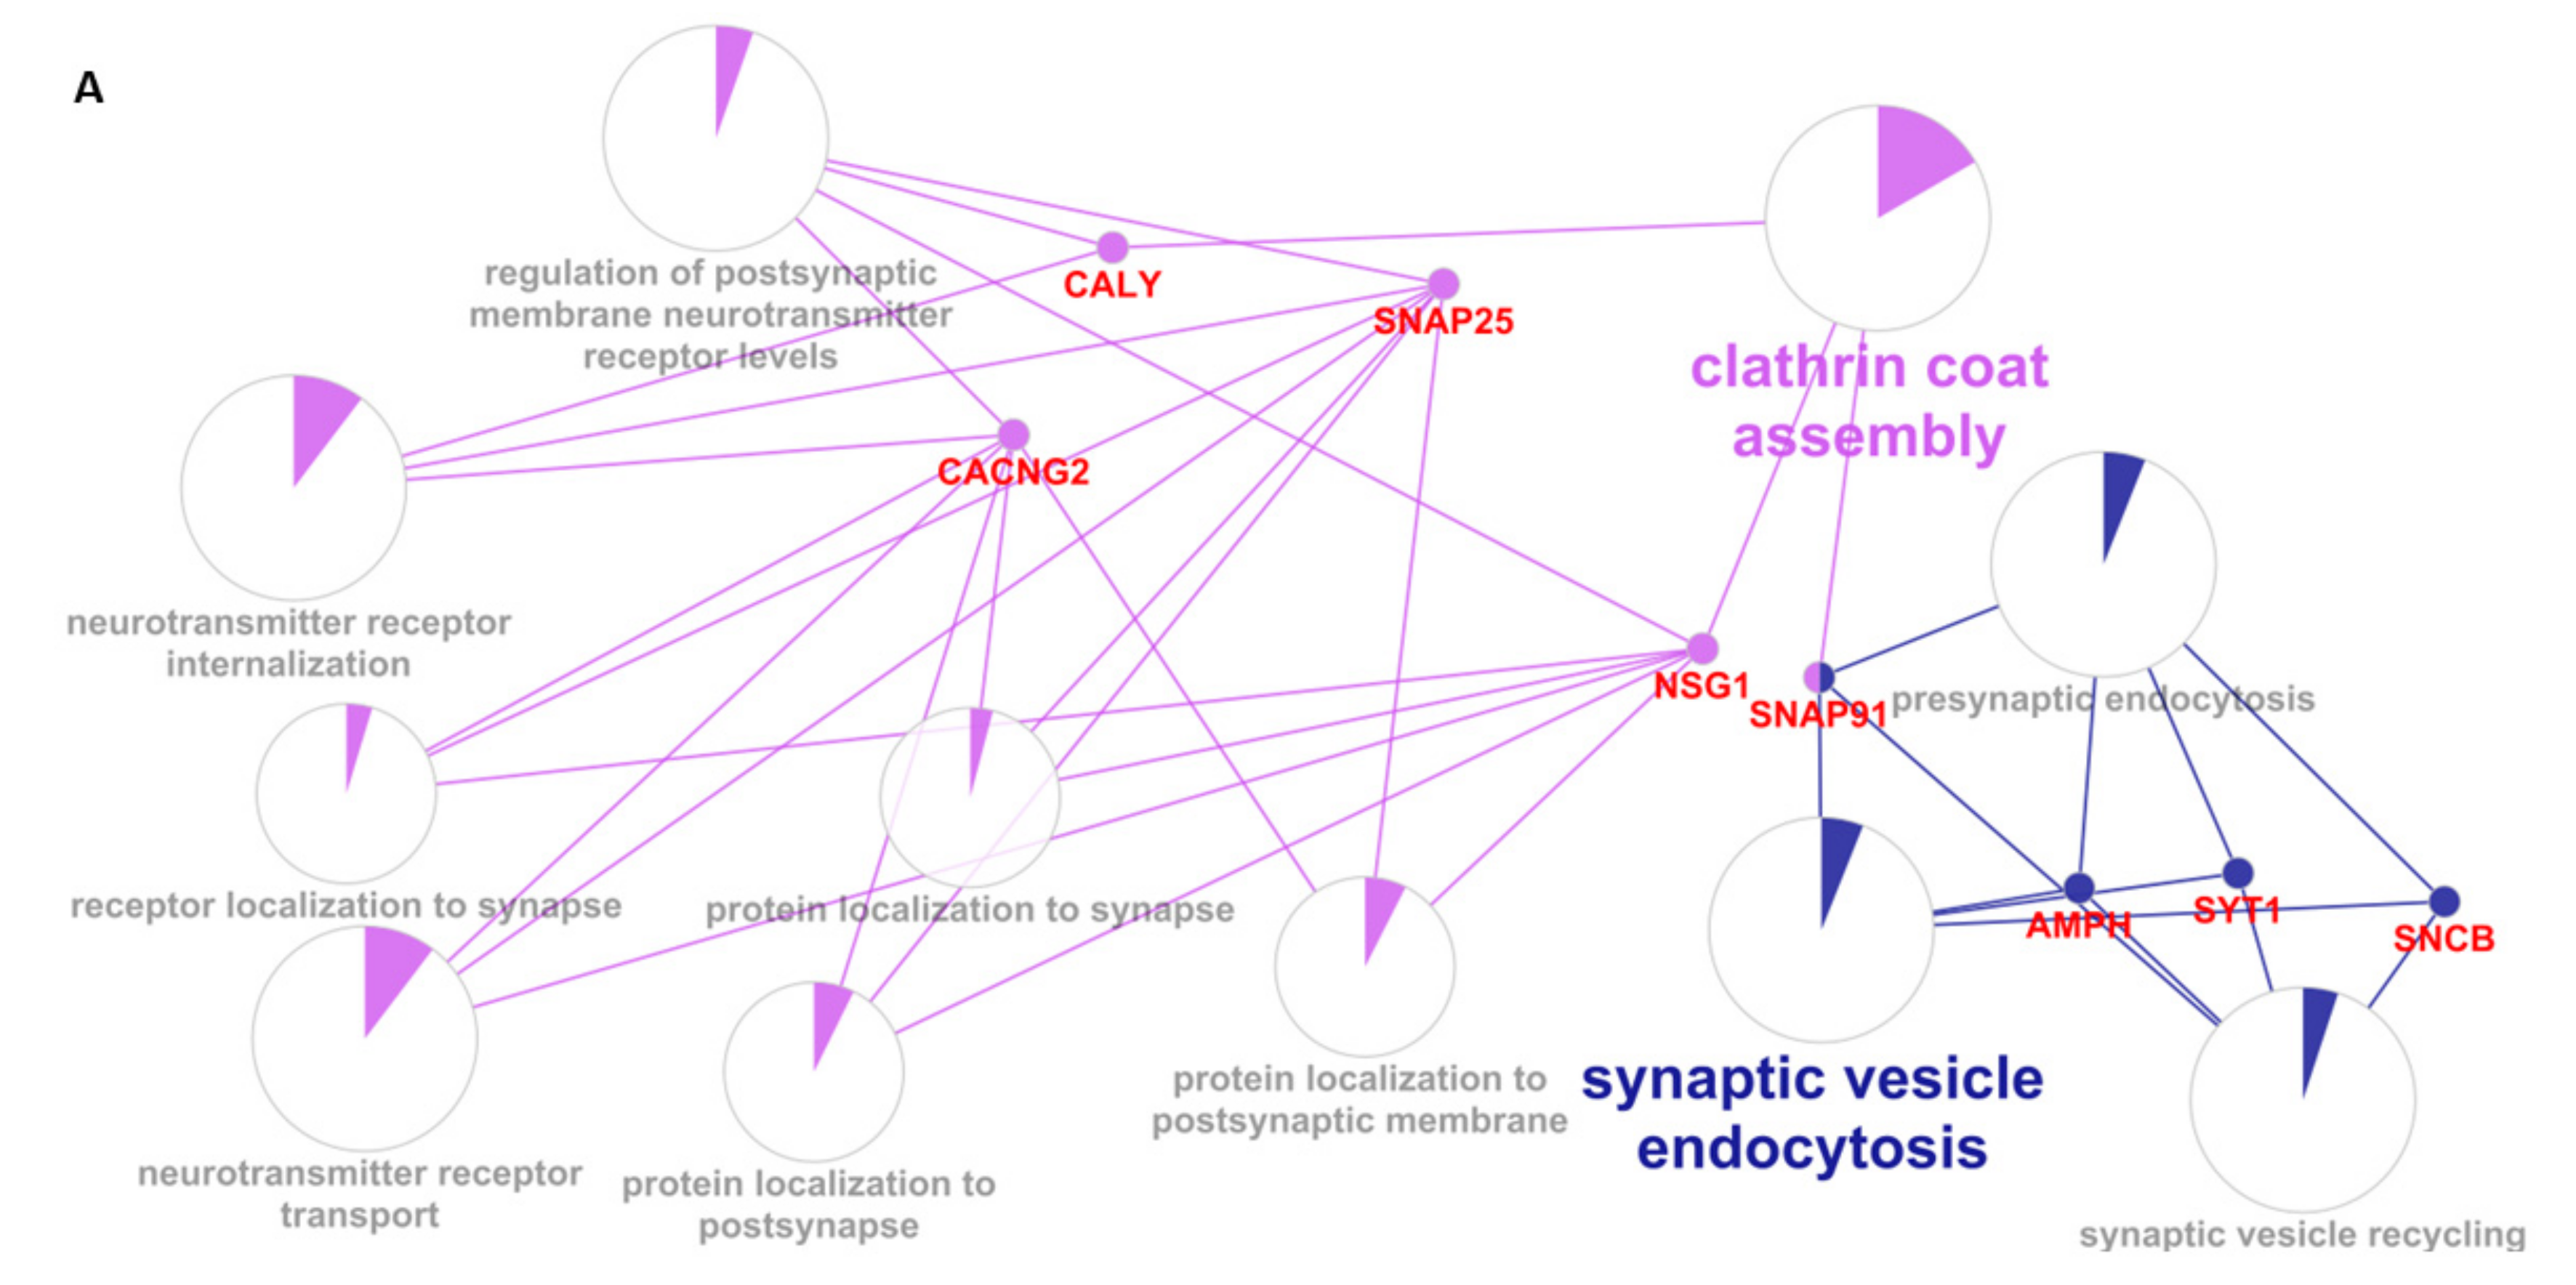
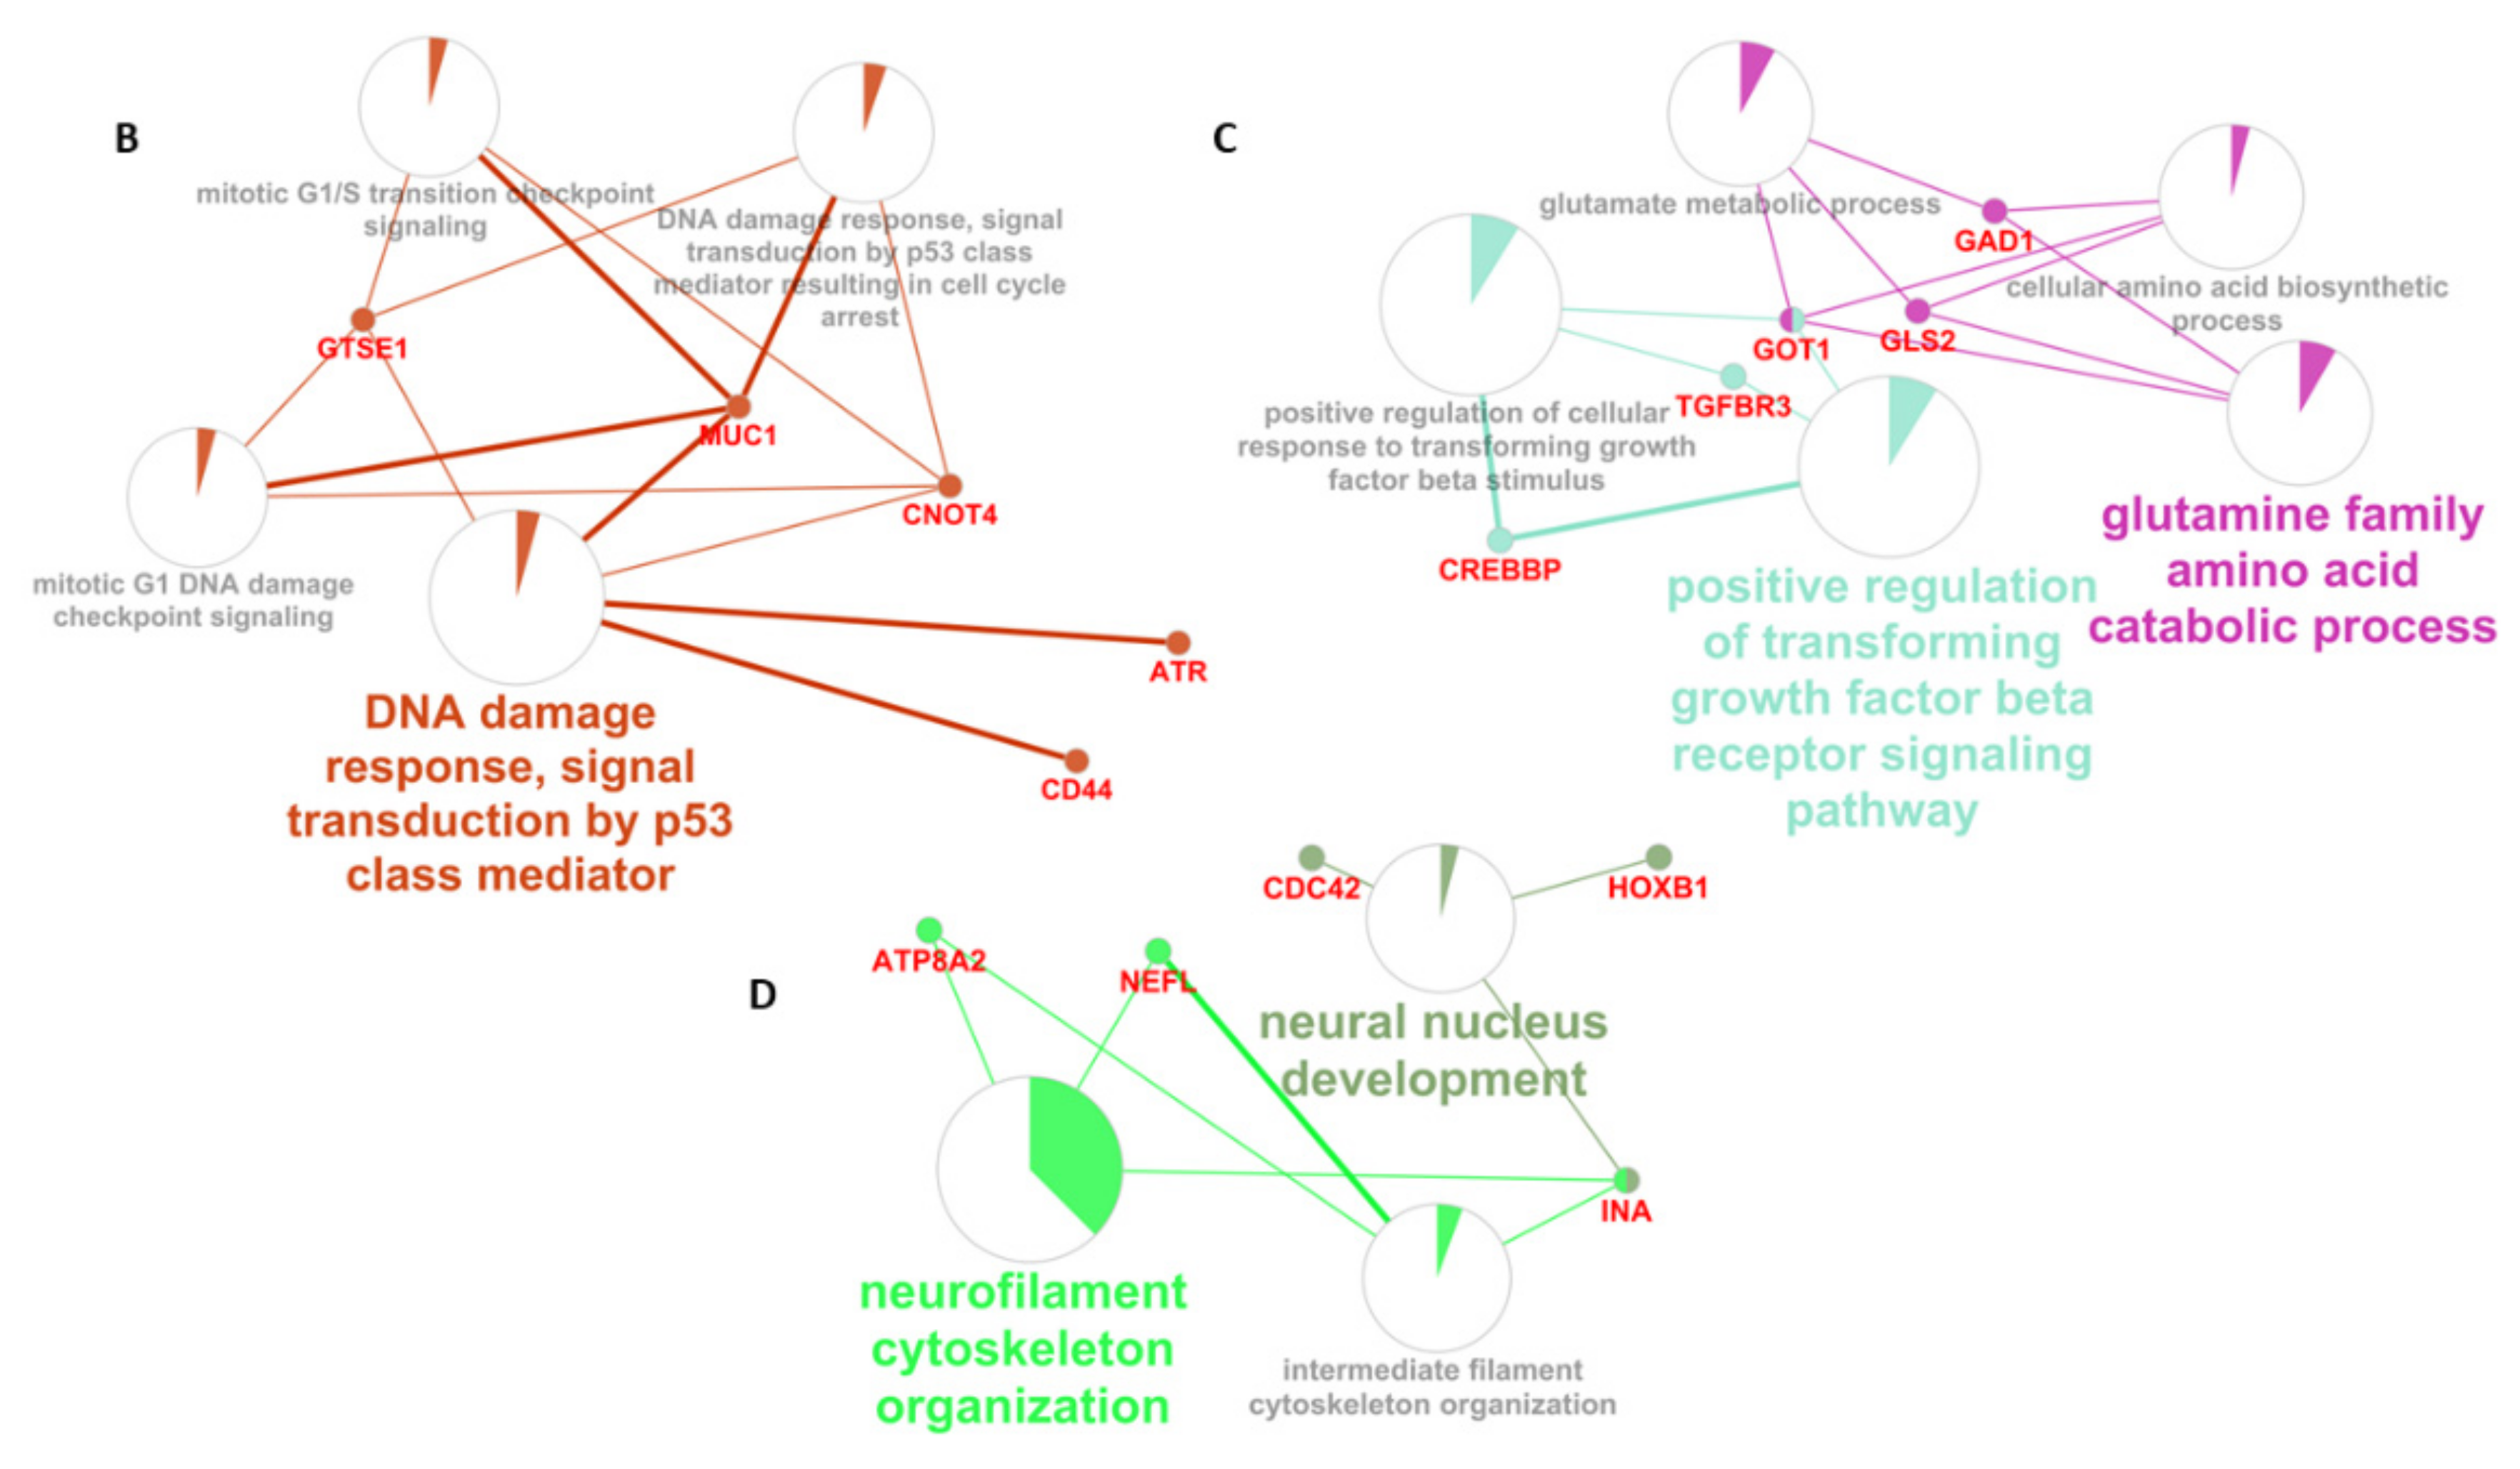
3.4. Enrichment Analysis

The 64 genes obtained with WGCNA were submitted to ClueGo for GO and pathway analysis. As shown in Figure 5A–D, the 64 genes are mainly enriched by the clathrin coat assembly, synaptic vesicle endocytosis, DNA damage response signal transduction by p53 class mediator, positive regulation of transforming growth factor beta receptor signaling pathway, glutamine family amino acid catabolic process, and neural nucleus development.

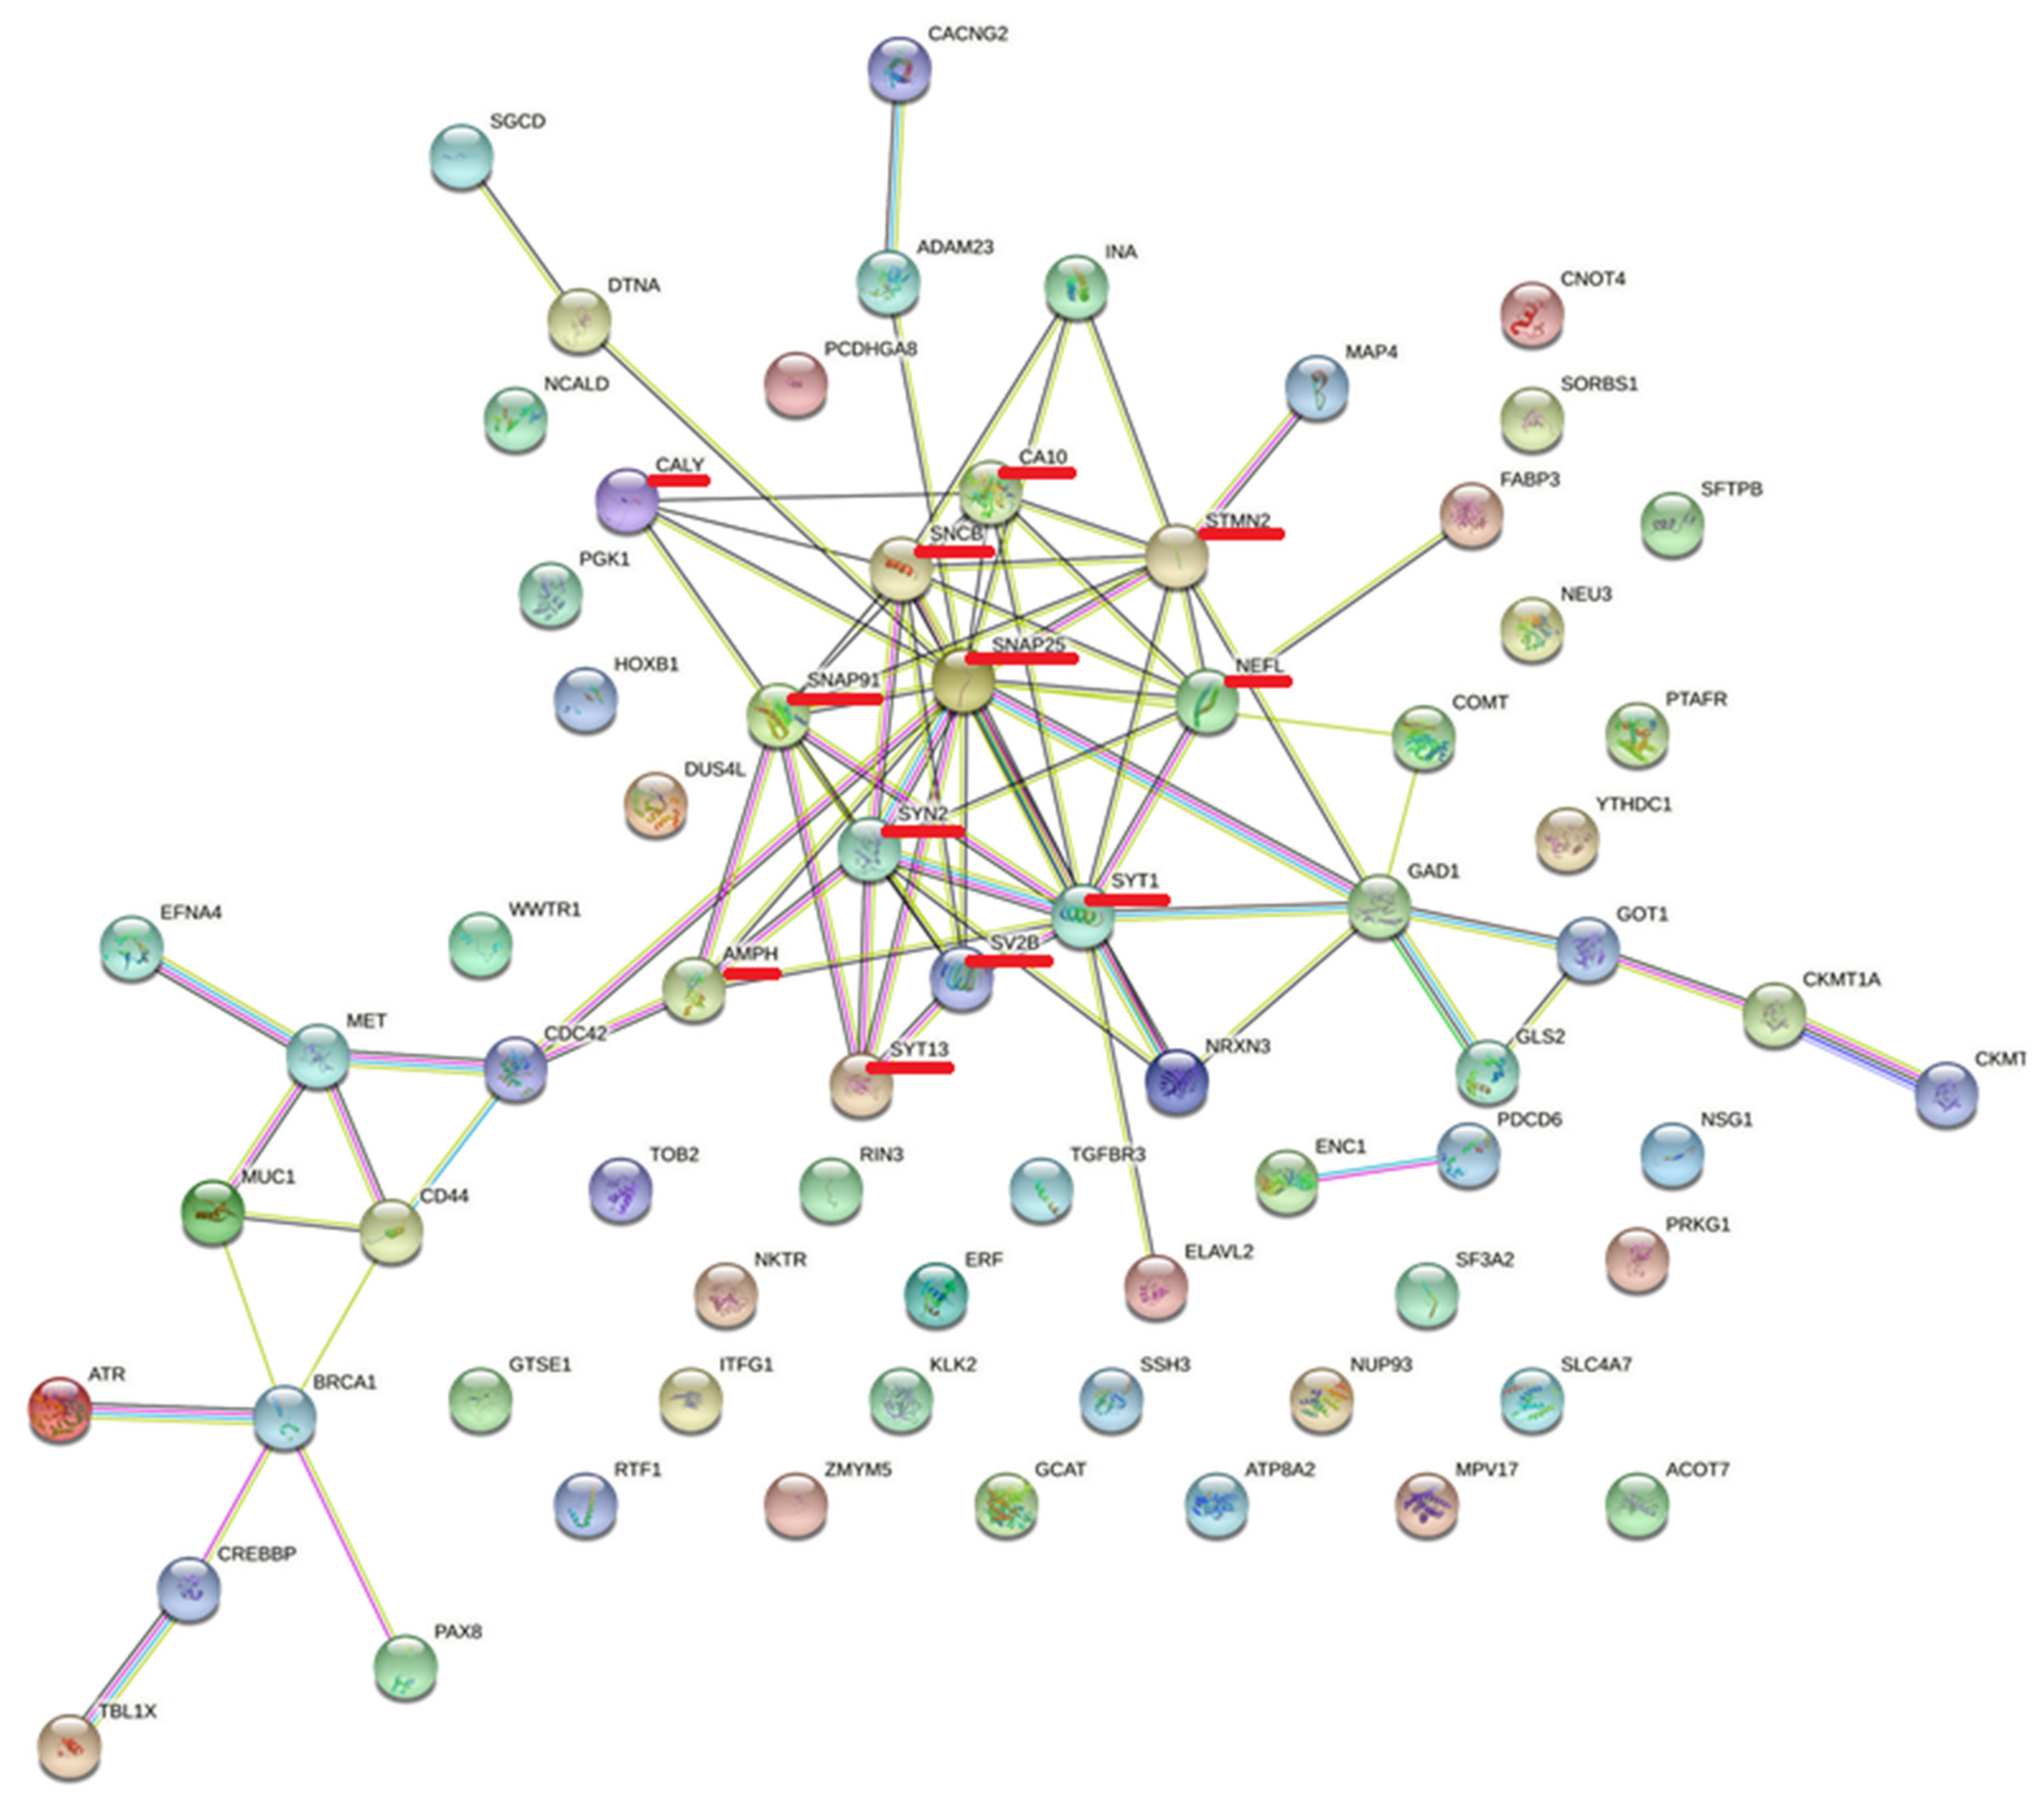
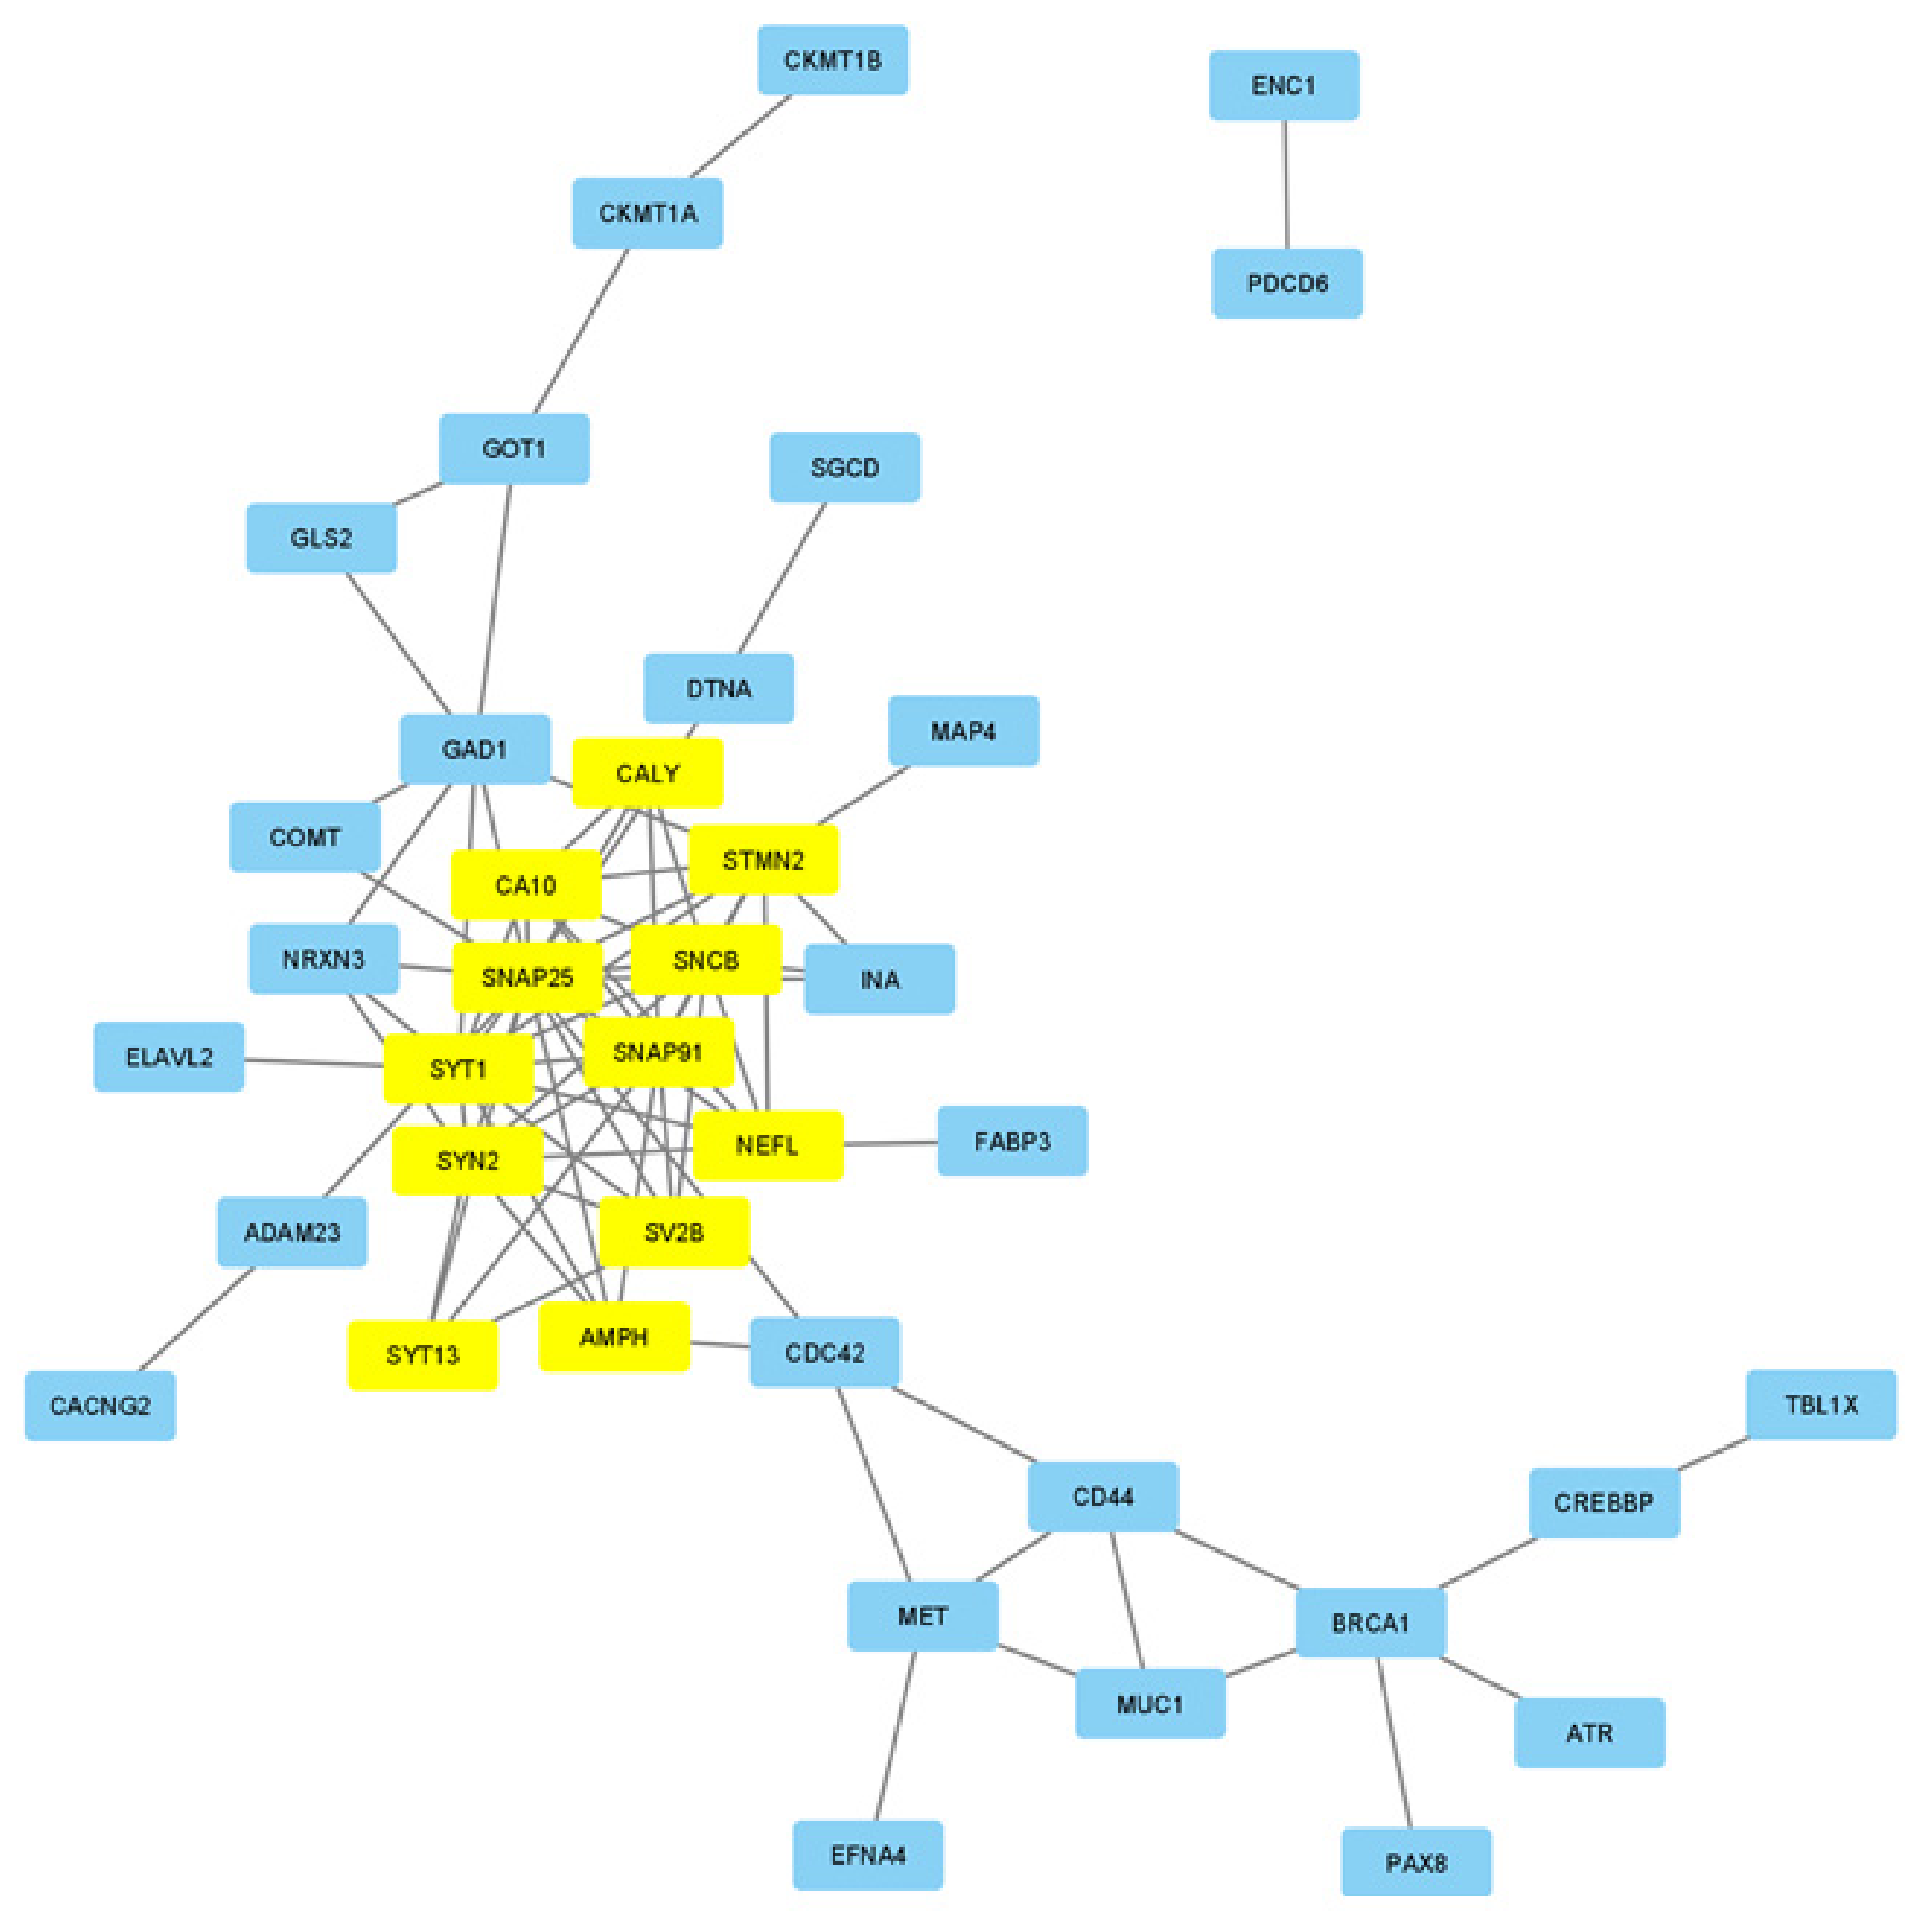
3.5. Protein–Protein Interactions

We further explored the protein–protein interactions of 76 consensus DEGs using STRING and the network found was visualized with Cytoscape (Figure 6). We obtained a network of 39 nodes and 81 edges.
The MCODE plugin of Cytoscape was used to identify interconnected regions of the network identified with STRING and we obtained a cluster of 12 genes (AMPH, CA10, CALY, NEFL, SNAP25, SNAP91, SNCB, STMN2, SV2B, SYN2, SYT1, and SYT13) and 42 edges (Figure 7).
The 12 genes obtained with MCODE were analyzed with GO to study their biological processes (Table 3). Biological processes found include neurotransmitter internalization and secretion, synapse processes, and calcium-ion-regulated exocytosis. The genes mainly involved in these processes are SNAP25, SNAP 91, SYN2, and SYT1.
The 64 genes of the module obtained with WCGNA and the 12 genes present in the cluster found with MCODE have in common 11 genes (AMPH, CA10, CALY, NEFL, SNAP25, SNAP91, SNCB, STMN2, SV2B, SYN2, and SYT1). We also verified whether the 64 genes present in the module obtained with WGCNA are also targets of known drugs and found that the AD down-regulated genes CA10, CACNG2, CALY, GAD1, GLS2, GOT1, MAP4, and MET interact with known drugs. GOT1 and GAD1 are also genes with a higher degree centrality. We also found that 2 out of 12 genes present in the MCODE cluster are also targets of known drugs (CA10 and CALY).
All three upregulated genes (COMT, PRKG1, and PTAFR) that are targets of known drugs are present in the WGCNA module. No up-regulated gene present in the MCODE cluster is a target of known drugs.

4. Discussion

Computational analyses based on high-throughput technologies such as microarray and Next-Generation Sequencing (NGS) have grown rapidly in recent years. Nevertheless, few analyses have been performed on AD, and those often involved a single dataset and only a few samples [30].
Our study used six open public GEO datasets containing gene expression levels of AD samples from hippocampus and normal samples and a hypothesis-based research design. We performed a differential expression analysis for each dataset comparing gene expression data on AD vs. healthy samples. Then, we generated a list of consensus DEGs found in at least two GEO datasets, obtaining 76 DEGs (40 down-regulated genes and 36 up-regulated genes). We verified whether the 76 DEGs are targets of known drugs in at least two of three drug databases (DGIdb, DrugCentral, and The Drug Repurposing Hub). Overall, we found that 9 out of the 40 down-regulated genes interact with 34 known drugs and 3 out of the 36 up-regulated genes interact with 9 drugs.
In particular, we found that the down-regulated gene MET is the gene with the highest number of interacting drugs. Among the drugs, we found Crizotinib, Gefitinib, and Pazopanib.
Crizotinib, an anticancer drug inhibitor of the receptor tyrosine kinase, acts on the down-regulated MET gene. It has been observed to be a potent inhibitor of SHIP2 [31]. Inosito 5′-phosphatase 2 containing the SH2 domain of SHIP2 is a lipid phosphatase that produces fosfatidilinositolo-3,4-bisfosfato from fosfatidilinositolo-3,4,5-trifosfato and is involved in many neurodegenerative diseases [31]. A recent study showed that SHIP2 inhibition decreased β-amyloid-induced tau hyperphosphorylation and reduced memory impairment in a transgenic mouse model of AD [32]. This indicates that SHIP2 may be a promising target for AD.
Gefitinib, an epidermal growth factor receptor (EGFR) inhibitor approved for the treatment of cancer, also acts on the MET gene. It was recently identified as a potential lead compound for β-secretasi (BACE-1), a potential target for the treatment of AD [33].
Another drug that acts on the MET gene is Pazopanib, whose role has been examined in mouse models that express mutant human tau P301L (TauP301L) or the precursor protein of triple mutant amyloid (3x-AβPP) [34]. Pazopanib can cross the blood–brain barrier without detectable peripheral side effects and reduces the expression of p-tau in TauP301L mice [26]. Pazopanib achieves a brain concentration sufficient for the inhibition of various tyrosine kinases, including vascular endothelial growth factor receptors (VEGFRs) [34]. Furthermore, pazopanib does not alter β-amyloid or astrocyte levels in 3x-AβPP mice, but modulates some inflammatory markers (IP-10, MIP-1α, MIP1β, and RANTES) [34]. All this suggests that Pazopanib may be involved in the clearance of p-tau and in the modulation of astrocytic activity in taupathies.
Interestingly, for up-regulated genes, we found COMT as a gene with more interacting drugs. Among the drugs, we found tolcapone and entacapone. Tolcapone and entacapone act on the up-regulated gene COMT. They are used with levodopa for the symptomatic treatment of Parkinson’s disease. In a previous study, tolcapone and entacapone were studied for their potential ability to inhibit hexapeptide derived from tau [35]. It was found that tolcapone and entacapone show antiplatelet properties against β-amyloid and α-synuclein. Tolcapone showed a better inhibition of aggregation of the tau-derived hexapeptide and could be used for the treatment of AD due to its greater penetration into the central nervous system compared with entacapone [35].
Then, we built a network of co-expressed genes using WGCNA on an independent GEO dataset. The network was constructed considering gene expression levels of 76 DEGs. We obtained a module of 64 genes with ACOT7, ATP8A2, CDC42, GAD1, GOT1, INA, NCALD, and WWTR1 as the genes with a higher degree centrality. A previous study identified CDC42 as one of the genes associated with AD that, along with other genes, is able to predict AD and cardiovascular disease in blood samples [26].
The 64 genes are mainly enriched in the clathrin coat assembly, synaptic vesicle endocytosis, and DNA damage response signal transduction by p53 class mediator pathways.
There is a correlation between clathrin coat assembly and Aβ protein. The extracellular deposition of Aβ protein is one of the most important neuropathological features of AD. APP is the gene that produces Aβ after it is internalized by clathrin-mediated endocytosis. Thus, an increase in extracellular amyloid deposition reflects an increase in the production of Aβ [36]. In addition, alterations in endocytosis can lead to the over-production of Aβ protein [37].
We further investigated the protein functional network that involves the 76 consensus DEGs. We found a network of 39 interacting proteins consisting of 81 interactions. Among them, MCODE identified AMPH, CA10, CALY, NEFL, SNAP25, SNAP91, SNCB, STMN2, SV2B, SYN2, SYT1, and SYT13 as a cluster of interconnected genes. AMPH, CA10, CALY, NEFL, SNAP25, SNAP91, SNCB, STMN2, SV2B, SYN2, and SYT1 are common genes between the WGCNA module and the 12 genes found with MCODE.
AMPH encodes a protein modulator of endocytosis in synapses [38]. AMPH knockout mice showed a reduced turnover of synaptic vesicle and cognitive deficits [39]. In addition, a reduced expression of AMPH was reported in AD brain regions [40].
The protein encoded by CA10 is involved in brain development and the central nervous system [41]. Moreover, a bioinformatics study revealed 15 genes, including CA10, to be hub genes and able to predict the occurrence of AD [42].
CALY regulates different aspects of the endosomal and synaptic processes. It is needed for endocytosis, degradation, and synaptic plasticity. CALY could be an interesting drug target for neurological diseases such as AD and schizophrenia [43].
Previous studies revealed that elevated levels of NEEFL are a known indicator of early neuronal injury and axonal damage in preclinical AD [44].
SNAP25 is a well-established biomarker of functional synapses as it is a component of the SNARE complex that regulates synaptic communication via synaptic vesicles [45]. In a previous study, elevated levels of SNAP25 were present in cerebrospinal fluid (CSF) of AD patients, suggesting it as a biomarker for early diagnosis [46].
We also found another synaptosome-associated protein, SNAP91. SNAP91 regulates synaptic vesicle transport, and its dysregulation could damage synaptic transmission [47]. SNAP91 is involved in several neurodegenerative diseases, such Parkinson’s disease and AD, where low levels of SNAP91 have been found [48,49].
SNCB encodes a protein involved in neuronal plasticity. High levels of SNCB were observed in AD in CSF and plasma [50].
STMN2 belongs to the stathmin family and plays a role in microtubule dynamics. Microtubules are involved in axonal signaling transduction and neuronal growth [51]. However, there is not a clear association between STMN2 and AD.
Previous studies found a decrease in SV2B and SYN2 in AD patients [52,53].
SYT1 and SYT13 are components of a synaptotagmin family with a role in neurotransmitter release. High levels of SYT1 were found in CSF of AD patients.
The down-regulated genes CA10 and CALY are targeted by known drugs. CA10 interacts with zonisamide, and CALY with apomorfina, clozapina, and trifluoperazine. The up-regulated genes COMT, PRKG1, and PTAFR present in the WGCNA module are targets of known drugs. No known drug acts on genes present in the MCODE module.
Several works suggested that the primary pathological hallmarks of AD are Aβ plaques and NFTs. Additional changes could occur in the brain of AD patients as secondary responses. However, we could not determine whether the alterations found in our study are directly linked to the primary or secondary AD changes. Further analyses considering the clinical relevance of each AD sample should be performed to well characterize our findings [54,55].
The gene alterations found in our hypothesis-based research study are limited by the small number of samples utilized in our approach. Although our results are mostly consistent with the literature, future studies should test our gene network to demonstrate its efficacy.

5. Conclusions

In conclusion, our study identified 76 DEGs in AD that regulate several de-regulated pathways. We identified several genes with a higher degree centrality (ACOT7, ATP8A2, CDC42, GAD1, GOT1, INA, NCALD, and WWTR1). In addition, MCODE revealed 12 interconnected genes (AMPH, CA10, CALY, NEFL, SNAP25, SNAP91, SNCB, STMN2, SV2B, SYN2, SYT1, and SYT13) that could play a crucial role in AD. Further studies should investigate how the alteration of these genes may be linked to the evolution of AD.

Author Contributions

Conceptualization, C.C. and V.Q.; methodology, C.C., S.D. and V.Q.; writing—original draft preparation, C.C., P.B., R.Z., I.C., R.S. and M.F.; writing—review and editing, C.C.; supervision, C.C.; project administration, C.C.; funding acquisition, D.P. All authors have read and agreed to the published version of the manuscript.

Funding

This research received no external funding.

Institutional Review Board Statement

Not applicable.

Informed Consent Statement

Not applicable.

Data Availability Statement

Data supporting the reported results can be found at: https://www.ncbi.nlm.nih.gov/geo/ (accessed on 15 October 2021).

Conflicts of Interest

The authors declare no conflict of interest.

References

  1. Ma, G.; Liu, M.; Du, K.; Zhong, X.; Gong, S.; Jiao, L.; Wei, M. Differential Expression of mRNAs in the Brain Tissues of Patients with Alzheimer’s Disease Based on GEO Expression Profile and Its Clinical Significance. BioMed Res. Int. 2019, 2019, 8179145. [Google Scholar] [CrossRef] [PubMed] [Green Version]
  2. Kumar, A.; Singh, A.; Ekavali. A review on Alzheimer’s disease pathophysiology and its management: An update. Pharmacol. Rep. 2015, 67, 195–203. [Google Scholar] [CrossRef] [PubMed]
  3. Zhao, C.; Huang, W.J.; Feng, F.; Zhou, B.; Yao, H.X.; Guo, Y.E.; Wang, P.; Wang, L.; Shu, N.; Zhang, X. Abnormal characterization of dynamic functional con-nectivity in Alzheimer’s disease. Neural. Regen. Res. 2022, 17, 2014–2021. [Google Scholar] [PubMed]
  4. Boeve, B.F.; Boxer, A.L.; Kumfor, F.; Pijnenburg, Y.; Rohrer, J.D. Advances and controversies in frontotemporal dementia: Diagnosis, biomarkers, and therapeutic considerations. Lancet Neurol. 2022, 21, 258–272. [Google Scholar] [CrossRef]
  5. Selkoe, D.J. Alzheimer’s disease: Genes, proteins, and therapy. Physiol. Rev. 2001, 81, 741–766. [Google Scholar] [CrossRef]
  6. Golde, T.E.; Eckman, C.B.; Younkin, S.G. Biochemical detection of Abeta isoforms: Implications for pathogenesis, diagnosis, and treatment of Alzheimer’s disease. Biochim. Biophys. Acta 2000, 1502, 172–187. [Google Scholar] [CrossRef] [Green Version]
  7. Lacour, A.; Espinosa, A.; Louwersheimer, E.; Heilmann-Heimbach, S.; Hernández, I.; Wolfsgruber, S.; Fernández, V.; Wagner, H.; Rosende-Roca, M.; Mauleón, A.; et al. Genome-wide significant risk factors for Alzheimer’s disease: Role in progression to dementia due to Alzheimer’s disease among subjects with mild cognitive impairment. Mol. Psychiatry 2016, 22, 153–160. [Google Scholar] [CrossRef] [Green Version]
  8. Lanoiselée, H.M.; Nicolas, G.; Wallon, D.; Rovelet-Lecrux, A.; Lacour, M.; Rousseau, S.; Richard, A.-C.; Pasquier, F.; Rollin-Sillaire, A.; Martinaud, O.; et al. APP, PSEN1, and PSEN2 mu-tations in early-onset Alzheimer disease: A genetic screening study of familial and sporadic cases. PLoS Med. 2017, 14, e1002270. [Google Scholar] [CrossRef] [Green Version]
  9. Sukjamnong, S.; Thongkorn, S.; Kanlayaprasit, S.; Saeliw, T.; Hussem, K.; Warayanon, W.; Hu, V.W.; Tencomnao, T.; Sarachana, T. Prenatal exposure to bisphenol A alters the transcriptome-interactome profiles of genes associated with Alzheimer’s disease in the offspring hippocampus. Sci. Rep. 2020, 10, 9487. [Google Scholar] [CrossRef]
  10. Podtelezhnikov, A.A.; Tanis, K.Q.; Nebozhyn, M.; Ray, W.J.; Stone, D.J.; Loboda, A.P. Molecular Insights into the Pathogenesis of Alzheimer’s Disease and Its Relationship to Normal Aging. PLoS ONE 2011, 6, e29610. [Google Scholar] [CrossRef] [Green Version]
  11. Kwok, M.K.; Lin, S.L.; Schooling, C.M. Re-thinking Alzheimer’s disease therapeutic targets using gene-based tests. eBioMedicine 2018, 37, 461–470. [Google Scholar] [CrossRef] [PubMed] [Green Version]
  12. Miller, J.A.; Woltjer, R.L.; Goodenbour, J.M.; Horvath, S.; Geschwind, D.H. Genes and pathways underlying regional and cell type changes in Alzheimer’s disease. Genome Med. 2013, 5, 48. [Google Scholar] [CrossRef] [PubMed] [Green Version]
  13. Silva, A.R.T.; Grinberg, L.T.; Farfel, J.M.; Diniz, B.S.; Lima, L.A.; Silva, P.J.S.; Ferretti, R.E.L.; Rocha, R.M.; Filho, W.J.; Carraro, D.M.; et al. Transcriptional Alterations Related to Neuropathology and Clinical Manifestation of Alzheimer’s Disease. PLoS ONE 2012, 7, e48751. [Google Scholar] [CrossRef] [PubMed] [Green Version]
  14. Blalock, E.M.; Geddes, J.W.; Chen, K.C.; Porter, N.M.; Markesbery, W.R.; Landfield, P.W. Incipient Alzheimer’s disease: Microarray correlation analyses reveal major transcriptional and tumor suppressor responses. Proc. Natl. Acad. Sci. USA 2004, 101, 2173–2178. [Google Scholar] [CrossRef] [Green Version]
  15. Liang, W.S.; Dunckley, T.; Beach, T.G.; Grover, A.; Mastroeni, D.; Ramsey, K.; Caselli, R.J.; Kukull, W.A.; McKeel, D.; Morris, J.C.; et al. Altered neuronal gene expression in brain regions differentially affected by Alzheimer’s disease: A reference data set. Physiol. Genom. 2008, 33, 240–256. [Google Scholar] [CrossRef] [Green Version]
  16. Berchtold, N.C.; Coleman, P.D.; Cribbs, D.H.; Rogers, J.; Gillen, D.L.; Cotman, C.W. Synaptic genes are extensively downregulated across multiple brain regions in normal human aging and Alzheimer’s disease. Neurobiol. Aging 2012, 34, 1653–1661. [Google Scholar] [CrossRef] [Green Version]
  17. Hokama, M.; Oka, S.; Leon, J.; Ninomiya, T.; Honda, H.; Sasaki, K.; Iwaki, T.; Ohara, T.; Sasaki, T.; LaFerla, F.M.; et al. Altered Expression of Diabetes-Related Genes in Alzheimer’s Disease Brains: The Hisayama Study. Cereb. Cortex 2013, 24, 2476–2488. [Google Scholar] [CrossRef]
  18. Lee, T.; Lee, H. Shared Blood Transcriptomic Signatures between Alzheimer’s Disease and Diabetes Mellitus. Biomedicines 2021, 9, 34. [Google Scholar] [CrossRef]
  19. Davis, S.; Meltzer, P.S. GEOquery: A bridge between the Gene Expression Omnibus (GEO) and BioConductor. Bioinformatics 2007, 23, 1846–1847. [Google Scholar] [CrossRef] [Green Version]
  20. Freshour, S.L.; Kiwala, S.; Cotto, K.C.; Coffman, A.C.; McMichael, J.F.; Song, J.J.; Griffith, M.; Griffith, O.L.; Wagner, A.H. Integration of the Drug-Gene Interaction Database (DGIdb 4.0) with open crowdsource efforts. Nucleic Acids Res. 2021, 49, D1144–D1151. [Google Scholar] [CrossRef]
  21. Avram, S.; Bologa, C.G.; Holmes, J.; Bocci, G.; Wilson, T.B.; Nguyen, D.T.; Curpan, R.; Halip, L.; Bora, A.; Yang, J.J.; et al. DrugCentral 2021 supports drug discovery and repo-sitioning. Nucleic Acids Res. 2021, 49, D1160–D1169. [Google Scholar] [CrossRef] [PubMed]
  22. Corsello, S.; Bittker, J.A.; Liu, Z.; Gould, J.; McCarren, P.; Hirschman, J.E.; Johnston, S.E.; Vrcic, A.; Wong, B.; Khan, M.; et al. The Drug Repurposing Hub: A next-generation drug library and information resource. Nat. Med. 2017, 23, 405–408. [Google Scholar] [CrossRef] [PubMed] [Green Version]
  23. Langfelder, P.; Horvath, S. WGCNA: An R package for weighted correlation network analysis. BMC Bioinform. 2008, 9, 559. [Google Scholar] [CrossRef] [PubMed] [Green Version]
  24. Shannon, P.; Markiel, A.; Ozier, O.; Baliga, N.S.; Wang, J.T.; Ramage, D.; Amin, N.; Schwikowski, B.; Ideker, T. Cytoscape: A software environment for integrated models of Biomolecular Interaction Networks. Genome Res. 2003, 13, 2498–2504. [Google Scholar] [CrossRef]
  25. Cava, C.; Bertoli, G.; Castiglioni, I. A protein interaction map identifies existing drugs targeting SARS-CoV-2. BMC Pharmacol Toxicol. 2020, 21, 65. [Google Scholar] [CrossRef]
  26. Lee, T.; Lee, H.; Initiative, T.A.D.N. Identification of Disease-Related Genes That Are Common between Alzheimer’s and Cardiovascular Disease Using Blood Genome-Wide Transcriptome Analysis. Biomedicines 2021, 9, 1525. [Google Scholar] [CrossRef]
  27. Szklarczyk, D.; Gable, A.L.; Nastou, K.C.; Lyon, D.; Kirsch, R.; Pyysalo, S.; Doncheva, N.T.; Legeay, M.; Fang, T.; Bork, P.; et al. The STRING database in 2021: Customizable pro-tein-protein networks, and functional characterization of user-uploaded gene/measurement sets. Nucleic Acids Res. 2021, 49, D605–D612. [Google Scholar] [CrossRef]
  28. Bader, G.D.; Hogue, C.W.V. An automated method for finding molecular complexes in large protein interaction networks. BMC Bioinform. 2003, 4, 2–27. [Google Scholar] [CrossRef] [Green Version]
  29. Bindea, G.; Mlecnik, B.; Hackl, H.; Charoentong, P.; Tosolini, M.; Kirilovsky, A.; Fridman, W.-H.; Pagès, F.; Trajanoski, Z.; Galon, J. ClueGO: A Cytoscape plug-in to decipher functionally grouped gene ontology and pathway annotation networks. Bioinformatics 2009, 25, 1091–1093. [Google Scholar] [CrossRef] [Green Version]
  30. Yu, W.; Yu, W.; Yang, Y.; Lü, Y. Exploring the Key Genes and Identification of Potential Diagnosis Biomarkers in Alzheimer’s Disease Using Bioinformatics Analysis. Front. Aging Neurosci. 2021, 13, 602781. [Google Scholar] [CrossRef]
  31. Cui, J.J.; Tran-Dubé, M.; Shen, H.; Nambu, M.; Kung, P.P.; Pairish, M.; Jia, L.; Meng, J.; Funk, L.; Botrous, I.; et al. Structure based drug design of crizotinib (PF-02341066), a potent and selective dual inhibitor of mesenchymal-epithelial transition factor (c-MET) kinase and anaplastic lymphoma kinase (ALK). J. Med. Chem. 2011, 54, 6342–6363. [Google Scholar] [CrossRef] [PubMed]
  32. Lim, J.; Kim, S.K.; Choi, S.Y.; Kim, D.H.; Gadhe, C.G.; Lee, H.N.; Kim, H.-J.; Kim, J.; Cho, S.J.; Hwang, H.; et al. Identification of crizotinib derivatives as potent SHIP2 inhibitors for the treatment of Alzheimer’s disease. Eur. J. Med. Chem. 2018, 157, 405–422. [Google Scholar] [CrossRef] [PubMed]
  33. Niu, M.; Hu, J.; Wu, S.; Xiaoe, Z.; Xu, H.; Zhang, Y.; Zhang, J.; Yang, Y. Structural bioinformatics-based identification of EGFR inhibitor gefitinib as a putative lead compound for BACE. Chem. Biol. Drug Des. 2014, 83, 81–88. [Google Scholar] [CrossRef]
  34. Javidnia, M.; Hebron, M.L.; Xin, Y.; Kinney, N.G.; Moussa, C.E.-H. Pazopanib Reduces Phosphorylated Tau Levels and Alters Astrocytes in a Mouse Model of Tauopathy. J. Alzheimer’s Dis. 2017, 60, 461–481. [Google Scholar] [CrossRef] [PubMed] [Green Version]
  35. Mohamed, T.; Hoang, T.; Jelokhani-Niaraki, M.; Rao, P.P. Tau-derived-hexapeptide 306VQIVYK311 aggregation inhibitors: Ni-trocatechol moiety as a pharmacophore in drug design. ACS Chem. Neurosci. 2013, 4, 1559–1570. [Google Scholar] [CrossRef] [PubMed] [Green Version]
  36. Alsaqati, M.; Thomas, R.S.; Kidd, E.J. Proteins Involved in Endocytosis Are Upregulated by Ageing in the Normal Human Brain: Implications for the Development of Alzheimer’s Disease. J. Gerontol. Ser. A 2017, 73, 289–298. [Google Scholar] [CrossRef] [PubMed] [Green Version]
  37. Tate, B.A.; Mathews, P.M. Targeting the Role of the Endosome in the Pathophysiology of Alzheimer’s Disease: A Strategy for Treatment. Sci. Aging Knowl. Environ. 2006, 2006, re2. [Google Scholar] [CrossRef] [Green Version]
  38. Wu, Y.; Matsui, H.; Tomizawa, K. Amphiphysin I and regulation of synaptic vesicle endocytosis. Acta Med. Okayama 2009, 63, 305–323. [Google Scholar]
  39. Di Paolo, G.; Sankaranarayanan, S.; Wenk, M.R.; Daniell, L.; Perucco, E.; Caldarone, B.J.; Flavell, R.; Picciotto, M.R.; Ryan, T.A.; Cremona, O.; et al. Decreased synaptic vesicle recycling efficiency and cognitive deficits in amphiphysin 1 knockout mice. Neuron 2022, 33, 789–804. [Google Scholar] [CrossRef] [Green Version]
  40. De Jesús-Cortés, H.J.; Nogueras-Ortiz, C.J.; Gearing, M.; Arnold, S.E.; Vega, I.E. Amphiphysin-1 protein level changes associated with tau-mediated neurodegeneration. Neuroreport 2012, 23, 942–946. [Google Scholar] [CrossRef] [Green Version]
  41. Tao, B.; Ling, Y.; Zhang, Y.; Li, S.; Zhou, P.; Wang, X.; Li, B.; Jun, Z.; Zhang, W.; Xu, C.; et al. CA 10 and CA 11 negatively regulate neuronal activity-dependent growth of gliomas. Mol. Oncol. 2019, 13, 1018–1032. [Google Scholar] [CrossRef] [PubMed] [Green Version]
  42. Zou, D.; Li, R.; Huang, X.; Chen, G.; Liu, Y.; Meng, Y.; Wang, Y.; Wu, Y.; Mao, Y. Identification of molecular correlations of RBM8A with autophagy in Alzheimer’s disease. Aging 2019, 11, 11673–11685. [Google Scholar] [CrossRef] [PubMed]
  43. Muthusamy, N.; Chen, Y.-J.; Yin, D.-M.; Mei, L.; Bergson, C. Complementary roles of the neuron-enriched endosomal proteins NEEP21 and calcyon in neuronal vesicle trafficking. J. Neurochem. 2014, 132, 20–31. [Google Scholar] [CrossRef] [PubMed]
  44. Khalil, M.; Teunissen, C.E.; Otto, M.; Piehl, F.; Sormani, M.P.; Gattringer, T.; Barro, C.; Kappos, L.; Comabella, M.; Fazekas, F.; et al. Neurofilaments as biomarkers in neurological dis-orders. Nat. Rev. Neurol. 2018, 14, 577–589. [Google Scholar] [CrossRef]
  45. Jahn, R.; Südhof, T.C. Membrane Fusion and Exocytosis. Annu. Rev. Biochem. 1999, 68, 863–911. [Google Scholar] [CrossRef]
  46. Brinkmalm, A.; Brinkmalm, G.; Honer, W.G.; Frölich, L.; Hausner, L.; Minthon, L.; Hansson, O.; Wallin, A.; Zetterberg, H.; Blennow, K.; et al. SNAP-25 is a promising novel cerebrospinal fluid biomarker for synapse degeneration in Alzheimer’s disease. Mol. Neurodegener. 2014, 9, 53. [Google Scholar] [CrossRef] [Green Version]
  47. Akila Parvathy Dharshini, S.; Taguchi, Y.H.; Michael Gromiha, M. Exploring the selective vulnerability in Alzheimer disease using tissue specific variant analysis. Genomics 2019, 111, 936–949. [Google Scholar] [CrossRef]
  48. Al Yemni, E.; Monies, D.; Alkhairallah, T.; Bohlega, S.; Abouelhoda, M.; Magrashi, A.; Mustafa, A.; AlAbdulaziz, B.; Alhamed, M.; Baz, B.; et al. Integrated Analysis of Whole Exome Sequencing and Copy Number Evaluation in Parkinson’s Disease. Sci. Rep. 2019, 9, 3344. [Google Scholar] [CrossRef] [Green Version]
  49. Cao, Y.; Xiao, Y.; Ravid, R.; Guan, Z.-Z. Changed Clathrin Regulatory Proteins in the Brains of Alzheimer’s Disease Patients and Animal Models. J. Alzheimer’s Dis. 2010, 22, 329–342. [Google Scholar] [CrossRef]
  50. Oeckl, P.; Halbgebauer, S.; Anderl-Straub, S.; Von Arnim, C.A.F.; Diehl-Schmid, J.; Froelich, L.; Grimmer, T.; Hausner, L.; Denk, J.; Jahn, H.; et al. Targeted Mass Spectrometry Suggests Beta-Synuclein as Synaptic Blood Marker in Alzheimer’s Disease. J. Proteome Res. 2020, 19, 1310–1318. [Google Scholar] [CrossRef]
  51. Prudencio, M.; Humphrey, J.; Pickles, S.; Brown, A.-L.; Hill, S.E.; Kachergus, J.M.; Shi, J.; Heckman, M.G.; Spiegel, M.R.; Cook, C.; et al. Truncated stathmin-2 is a marker of TDP-43 pathology in frontotemporal dementia. J. Clin. Investig. 2020, 130, 6080–6092. [Google Scholar] [CrossRef] [PubMed]
  52. Nie, L.; Xia, J.; Li, H.; Zhang, Z.; Yang, Y.; Huang, X.; He, Z.; Liu, J.; Yang, X. Ginsenoside Rg1 Ameliorates Behavioral Abnormalities and Modulates the Hippocampal Proteomic Change in Triple Transgenic Mice of Alzheimer’s Disease. Oxidative Med. Cell. Longev. 2017, 2017, 6473506. [Google Scholar] [CrossRef] [PubMed] [Green Version]
  53. Nishioka, H.; Tooi, N.; Isobe, T.; Nakatsuji, N.; Aiba, K. BMS-708163 and Nilotinib restore synaptic dysfunction in human embryonic stem cell-derived Alzheimer’s disease models. Sci. Rep. 2016, 6, 33427. [Google Scholar] [CrossRef] [PubMed] [Green Version]
  54. De Ture, M.A.; Dickson, D.W. The neuropathological diagnosis of Alzheimer’s disease. Mol. Neurodegener. 2019, 14, 32. [Google Scholar] [CrossRef] [PubMed] [Green Version]
  55. Avila, J.; Perry, G. A Multilevel View of the Development of Alzheimer’s Disease. Neuroscience 2020, 457, 283–293. [Google Scholar] [CrossRef]
Figure 1. Computational workflow.
Applsci 12 05035 g001
Figure 2. Venn diagram analysis of differentially expressed genes: (A) down-regulated genes; (B) up-regulated genes.
Applsci 12 05035 g002
Figure 3. Hierarchical cluster dendrogram and gene module identified by weighted correlation network analysis (WGCNA). Gray genes are not included in any module.
Applsci 12 05035 g003
Figure 4. Co-expression network obtained with weighted correlation network analysis (WGCNA) and visualized with Cytoscape. Dark blue nodes correspond to the genes with a higher degree centrality. Grey colored edges indicate the gene interactions.
Applsci 12 05035 g004
Figure 5. Pathway analysis using ClueGo from 64 genes obtained with WGCNA. Nodes represent GO terms and the node size represents the term’s enrichment significance. (A) Clathrin coat assembly and synaptic vesicle endocytosis; (B) DNA damage response signal transduction by p53 class mediator; (C) positive regulation of transforming growth factor beta receptor signaling pathway and glutamine family amino acid catabolic process; (D) neurofilament cytoskeleton organization and neural nucleus development.
Applsci 12 05035 g005aApplsci 12 05035 g005b
Figure 6. Protein–protein interactions of 76 consensus differentially expressed genes in Alzheimer’s disease. Twelve genes identified with MCODE are highlighted.
Applsci 12 05035 g006
Figure 7. Interconnected regions using MCODE from the network obtained with STRING.
Applsci 12 05035 g007
Table 1. Down-regulated genes and their interactions with known drugs in at least two of three drug databases (DGIdb, DrugCentral, and The Drug Repurposing Hub).
Down-Regulated GenesDrugs
CA10(1) ZONISAMIDE
CACNG2(1) GABAPENTIN
CALY(1) APOMORPHINE
(2) CLOZAPINE
(3) TRIFLUOPERAZINE
CKMT1A(1) CREATINE
GAD1(1) GLUTAMIC ACID
GLS2(1) GLUTAMIC ACID
GOT1(1) ASPARTIC ACID
(2) CYSTEINE
(3) GLUTAMIC ACID
MAP4(1) DOCETAXEL
(2) PACLITAXEL
MET(1) CRIZOTINIB
(2) ERLOTINIB
(3) CABOZANTINIB
(4) GEFITINIB
(5) PAZOPANIB
(6) AFATINIB
(7) ALECTINIB
(8) ALTIRATINIB
(9) AMG-208
(10) AMG-337
(11) AMUVATINIB
(12) BMS-777607
(13) BMS-817378
(14) FORETINIB
(15) GOLVATINIB
(16) JNJ-38877605
(17) MGCD-265
(18) MK-2461
(19) MK-8033
(20) PF-04217903
(21) PHA-665752
(22) SAVOLITINIB
(23) TIVANTINIB
Table 2. Up-regulated genes and their interactions with known drugs in at least two of three drug databases (DGIdb, DrugCentral, and The Drug Repurposing Hub).
Up-Regulated GenesDrugs
COMT(1) OPICAPONE
(2) TOLCAPONE
(3) ENTACAPONE
(4) NIALAMIDE
(5) 2-METHOXYESTRADIOL
PRKG1(1) GSK-690693
PTAFR(1) RUPATADINE
(2) APAFANT
(3) FOROPAFANT
Table 3. Gene Ontology analysis of the 12 genes obtained with MCODE.
GO: Biological Processes# Tot GenesGenes Obtained with MCODEFDR
neurotransmitter receptor internalization9CALY
SNAP25
0.0111
clathrin coat assembly18CALY
SNAP91
0.0329
synaptic vesicle endocytosis52SNCB
AMPH
SYT1
SNAP91
0.0000933
calcium-ion-regulated exocytosis43SYT1
SYT13
SYN2
0.00221
neurotransmitter secretion81SYT1
SYN2
SNAP25
0.00997
organelle localization475NEFL
SYT1
SYN2
SNAP25
SNAP91
0.00405
#: number.
Publisher’s Note: MDPI stays neutral with regard to jurisdictional claims in published maps and institutional affiliations.

