Article

Time-of-Flight Secondary Ion Mass Spectrometry Analyses of Self-Assembled Monolayers of Octadecyltrimethoxysilane on SiO2 Substrate

by
Heng-Yong Nie
1,2,* and
Hamid-Reza Jahangiri-Famenini
3
1
Surface Science Western, The University of Western Ontario, London, ON N6G 0J3, Canada
2
Department of Physics and Astronomy, The University of Western Ontario, London, ON N6A 3K7, Canada
3
Canada Graphene, Aurora, ON L4G 7P9, Canada
*
Author to whom correspondence should be addressed.
Appl. Sci. 2022, 12(10), 4932; https://doi.org/10.3390/app12104932
Submission received: 22 April 2022 / Revised: 10 May 2022 / Accepted: 10 May 2022 / Published: 13 May 2022
(This article belongs to the Special Issue Self-Assembled Monolayers (SAMs) and Their Applications)

Abstract

:
The self-assembled monolayers (SAMs) of organosilanes formed on an oxide substrate are thought to have a polymerized –Si–O–Si– network due to the homocondensation of silanols of hydrolyzed silane headgroups, which is the most significant difference in the SAMs of organosilanes in comparison with those of alkanethoils and organophsosphonic acids. In order to explore the interface chemistry of organosilane SAMs, surface-sensitive time-of-flight secondary ion mass spectrometry (ToF-SIMS) was used to compare ion fragmentation differences between the SAMs of octadecyltrimethoxysilane (OTMS) formed on a SiO2 substrate and free OTMS molecules, as well as oxide substrate. The ability of ToF-SIMS to verify the hydrolysis of the methoxy groups of OTMS molecules and to assess the polymerized –Si–O–Si– network in their SAMs was demonstrated, which shows that ToF-SIMS provides unique information to help us understand the interface chemistry of OTMS SAMs formed on oxides.

1. Introduction

The self-assembled monolayers (SAMs) of organic molecules on a substrate usually refer to a single layer of the molecules, in which their headgroups are anchored to the substrate and the molecular chains are aligned in an orderly manner [1,2,3,4]. Derivatizing a substrate with SAMs of organic molecules with tailored end groups is an effective approach to controlling the surface properties of a substrate because it only requires minimal amounts of chemicals to totally alter the surface properties of the substrate. SAMs have aroused enormous interest in interdisciplinary research areas as diversified as the molecular engineering of surfaces [5,6], materials science [7,8] and organic electronics [8,9,10,11,12,13].
SAM formation normally requires that the molecules have strong interactions with the substrate on which the monolayer is supported so that they can be anchored to the substrate covalently and eventually form close-packed monolayers via van der Waals forces between the molecular chains. For example, one of the most studied SAM systems is alkanethiols on coinage metals with an S–metal bond formation [2]. Another type of molecule used for SAM formation on oxide surface is organosilanes [3,13,14,15,16,17], among which octadecyltrimethoxysilane (OTMS) is a popular one. The methoxy groups in OTMS headgroups, denoted as –Si(OCH3)3, are hydrolyzed and the silanols (–Si(OH)3) are (1) anchored to the oxide surface via the condensation reaction and (2) polymerized between silanols themselves via homocondensation to form a –Si–O–Si– network, which is responsible for SAM formation [18,19]. More recently, the SAMs of organophosphonic acids, especially octadecylphosphonic acid (OPA or ODPA), formed on oxides have also been explored [2,20,21,22]. In this system, the phosphonic headgroups are anchored to an oxide substrate via the condensation reaction. However, when solvents having a dielectric constant of ~4 are used to deliver OPA molecules onto a substrate, H-bonding OPA SAMs can be formed, for example, on a Si wafer [23].
The most frequently used technique to characterize the SAMs of molecules terminated by an alkyl group are contact angles (CAs) and Fourier transform infrared (FTIR) spectroscopy [1]. These SAMs with complete coverage tend to have fixed water CAs, which is due to the surface energy largely determined by the terminating methyl groups. Water CAs are simple in concept, yet extremely useful in assessing the surface chemistry of methyl-terminated SAMs. For example, for SAMs of OTMS, static water CAs are 105°–113° [14,15,16], which can be used as a reference to gauge the quality of one’s own SAMs. FTIR provides crystallinity information on the methylene chains via IR absorption peaks for the methylene stretching modes [1,13,24]. It also provides information on headgroup–substrate interactions [19,25]. Another technique used for SAMs is atomic force microscopy (AFM) for evaluating their coverage of the monolayer and measuring their thickness when they are not made complete coverage [13,17,23].
Time-of-flight secondary ion mass spectrometry (ToF-SIMS) [26] is especially powerful in revealing the chemical information of a surface [27,28,29]. In this technique, a pulsed (primary) ion beam (e.g., Bi3+) is used to bombard the surface of a sample to generate (secondary) ions from the topmost monolayer (1–3 nm). The secondary ions are extracted, mass separated and detected in parallel, providing a powerful approach to understanding surface chemistry. The probing depth makes ToF-SIMS extremely surface sensitive and useful for exploring the interface chemistry of SAMs because their thickness is commonly around 2 nm [1,2,3,4]. The generation of ions in ToF-SIMS may include molecular information, which depends on how the molecules are attached to a substrate. The superior chemicals selectivity of ToF-SIMS provides a unique opportunity to explore the interface chemistry of SAMs. ToF-SIMS has been widely applied to studying alkanethiol SAMs on coinage metals [30,31,32] and organophosphonic acid SAMs on oxides [33,34,35].
On the other hand, applications of ToF-SIMS in studying organosilane SAMs on oxides are mainly used to study the surface chemistry of SAMs [36]. ToF-SIMS studies focused on the interface chemistry of organosilane SAMs on oxides are rather scarce [37]. In this article, the usefulness of ToF-SIMS in probing the interface chemistry of octadecyltrimethoxysilane (OTMS) SAMs formed on a SiO2 substrate is demonstrated via comparisons of ion fragmentation patterns of free organosilane molecules, their SAMs on a SiO2 substrate and the substrate itself. Our ToF-SIMS analyses aim at providing unique information on understanding the interface chemistry of OTMS SAMs.

2. Materials and Methods

OTMS (90%) was purchased from Fisher Scientific Company (Fair Lawn, NJ, USA) and used as received. The chemical (liquid) was used to prepare a 3 mM OTMS solution in trichloroethylene. A Si wafer with a 300 µm thermally grown SiO2 was used as the substrate for the preparation of OTMS SAMs. The Si wafer is referred to as a SiO2 substrate in this article. The SiO2 substrates were cleaned ultrasonically with acetone for 15 min, followed by UV/ozone treatment for 40 min. The cleaned SiO2 substrates were immediately immersed in the OTMS solution for 1 h. The SiO2 substrates were dry when they were removed from the solution, which was a sign of the formation of OTMS SAMs. These OTMS SAM-covered SiO2 substrates were NH4OH vapor annealed for ~10 h, followed by a deionized water rinse for 30 s and cleaning ultrasonically in acetone for 15 min [13]. In order to achieve partial coverage OTMS SAMs for AFM imaging to measure the thickness of the SAMs, a diluted OTMS solution was spin coated at 3000 rpm onto a UV/ozone-treated SiO2 substrate and a freshly cleaved mica substrate.
Static water CAs on the OTMS SAMs formed on SiO2 substrates were measured using a Drop Shape Analyzer (DSA30E, KRÜSS GmbH, Hamburg, Germany). For comparison purposes, CAs were also measured on a SiO2 substrate cleaned ultrasonically in methanol for 15 min. CAs were measured using 2 µL deionized water droplets as the probing liquid over 5–10 areas for each sample.
The dynamic force mode of an AFM (XE-100, Park Systems, Suwon, South Korea) was used to image the surface morphology of OTMS SAMs. The AFM sensing system contained a silicon cantilever (NSC15, MikroMasch, Sofia, Bulgaria) with a tip attached to one side of its free end, while the other side was irradiated by a laser beam, which was reflected to a position-sensitive photodetector to measure the interaction between the tip and the sample surface. The cantilever used in this study had a nominal spring constant of 40 N/m, resonant frequency of 325 kHz and tip radius of 10 nm. In the dynamic force mode, the cantilever is vibrated via a piezoelectric device driven by a sinewave voltage at a frequency slightly lower than its resonant frequency. The amplitude of the cantilever in free space was ~25 nm [38], which decreased when the tip approached the sample surface due to the interactive force between the tip and the sample surface. A reduced amplitude was used as the feedback parameter to allow the tip to trace the contour of the sample surface, thus constructing the surface morphology. AFM images were collected at 256 × 256 pixels in air (relative humidity ~50%) at room temperature.
Pure OTMS molecules, a UV/ozone-treated SiO2 substrate and the OTMS SAMs were investigated using ToF-SIMS (TOF SIMS IV, ION-TOF GmbH, Münster, Germany), in which a pulsed (~1 ns) 25 keV Bi3+ primary ion beam was used to bombard the sample surface to generate (secondary) ions from the surface. The secondary ions were extracted by an electric field and they arrived at the detector with different flight times that are a function of mass to charge ratio (m/z) after they flew through a reflectron-type tube. The intensities of ions against their flight time make up a secondary ion mass spectrum, where the m/z was calibrated using carbon, hydrocarbons and other known species. A low-energy electron beam was then flooded over the sample surface for charge compensation, which completes the 100 μs cycle for bombarding the sample surface with one shot of the primary ion beam. The pressure of the analysis chamber of the ToF-SIMS instrument was approximately 10−7 mbar. Secondary ion mass spectra were collected at 128 × 128 pixels over a rastered area of 500 µm × 500 µm with one shot of the pulsed primary ion beam per pixel, which was repeated 25 times for data collection. Negative ion mass spectra were calibrated using CH, C4H, SiO2 and Si2O5H. Positive ion mass spectra were calibrated using CH3+, C3H5+ and SiOH+. The mass resolutions for C2H, C4H, CH3+ and C4H7+ were 3600, 5000, 4000 and 6000, respectively.

3. Results

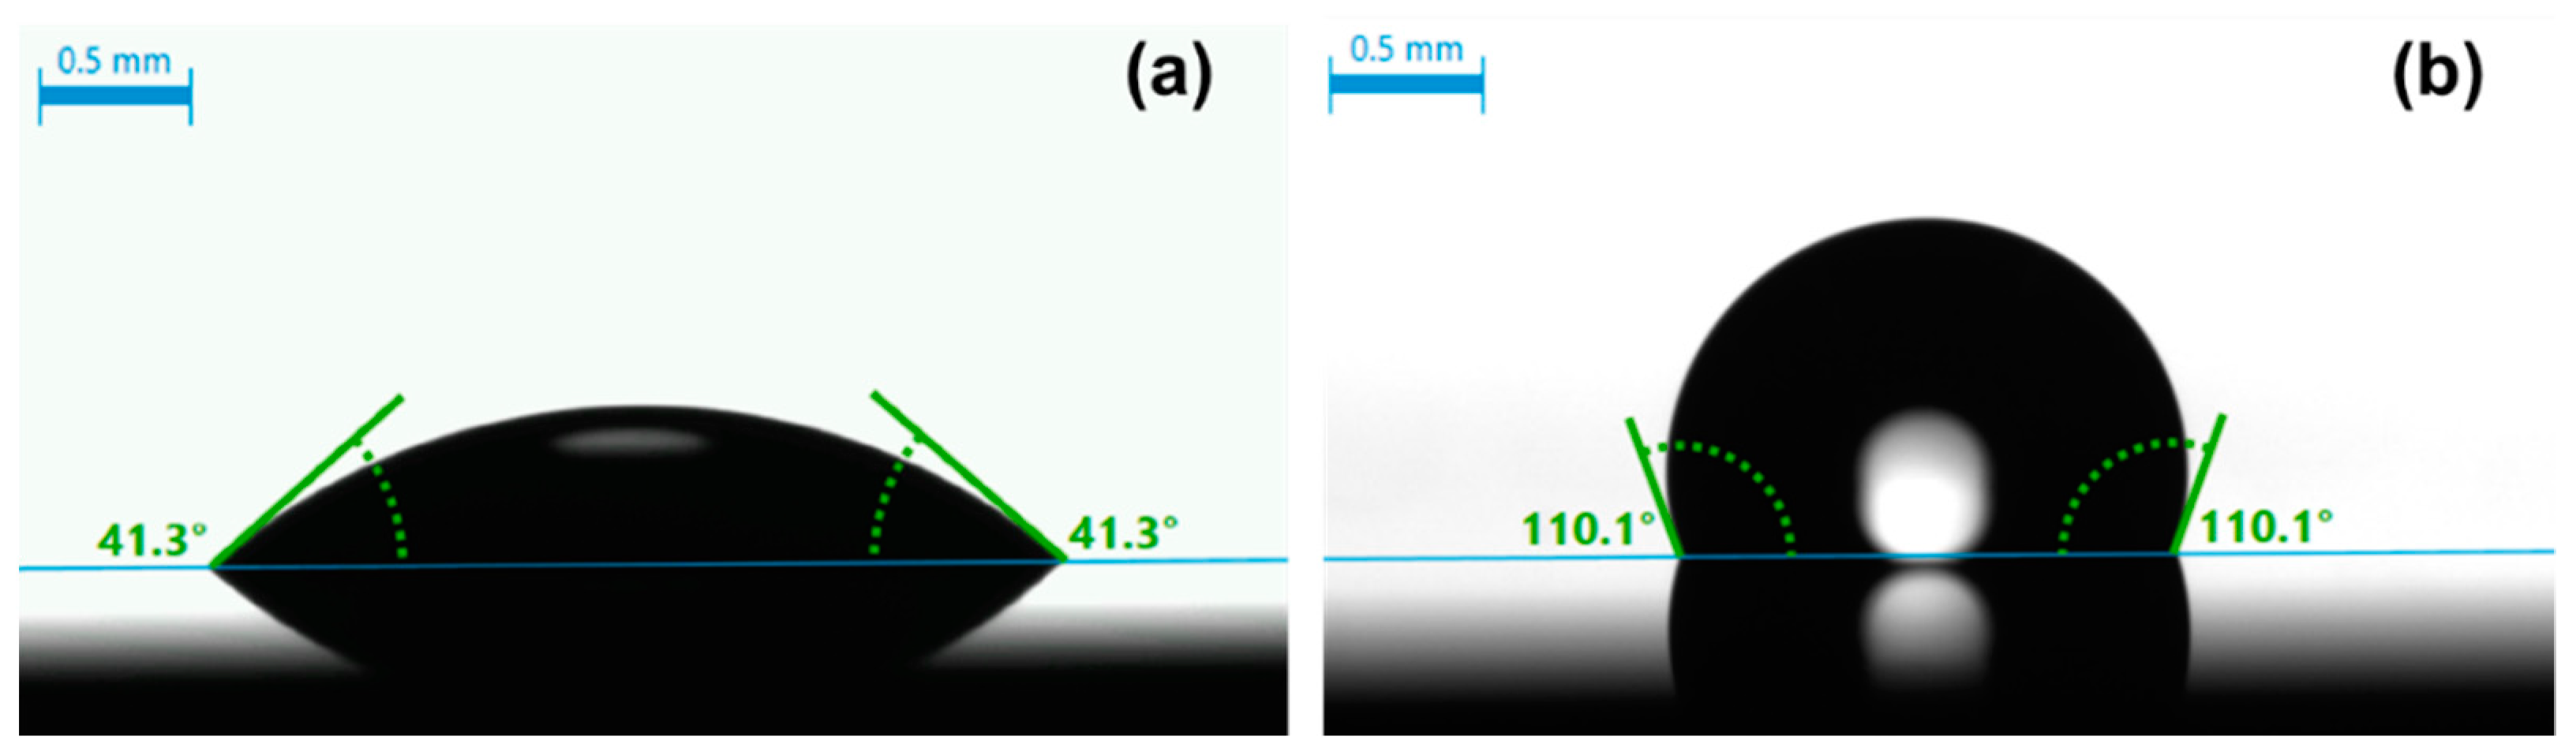
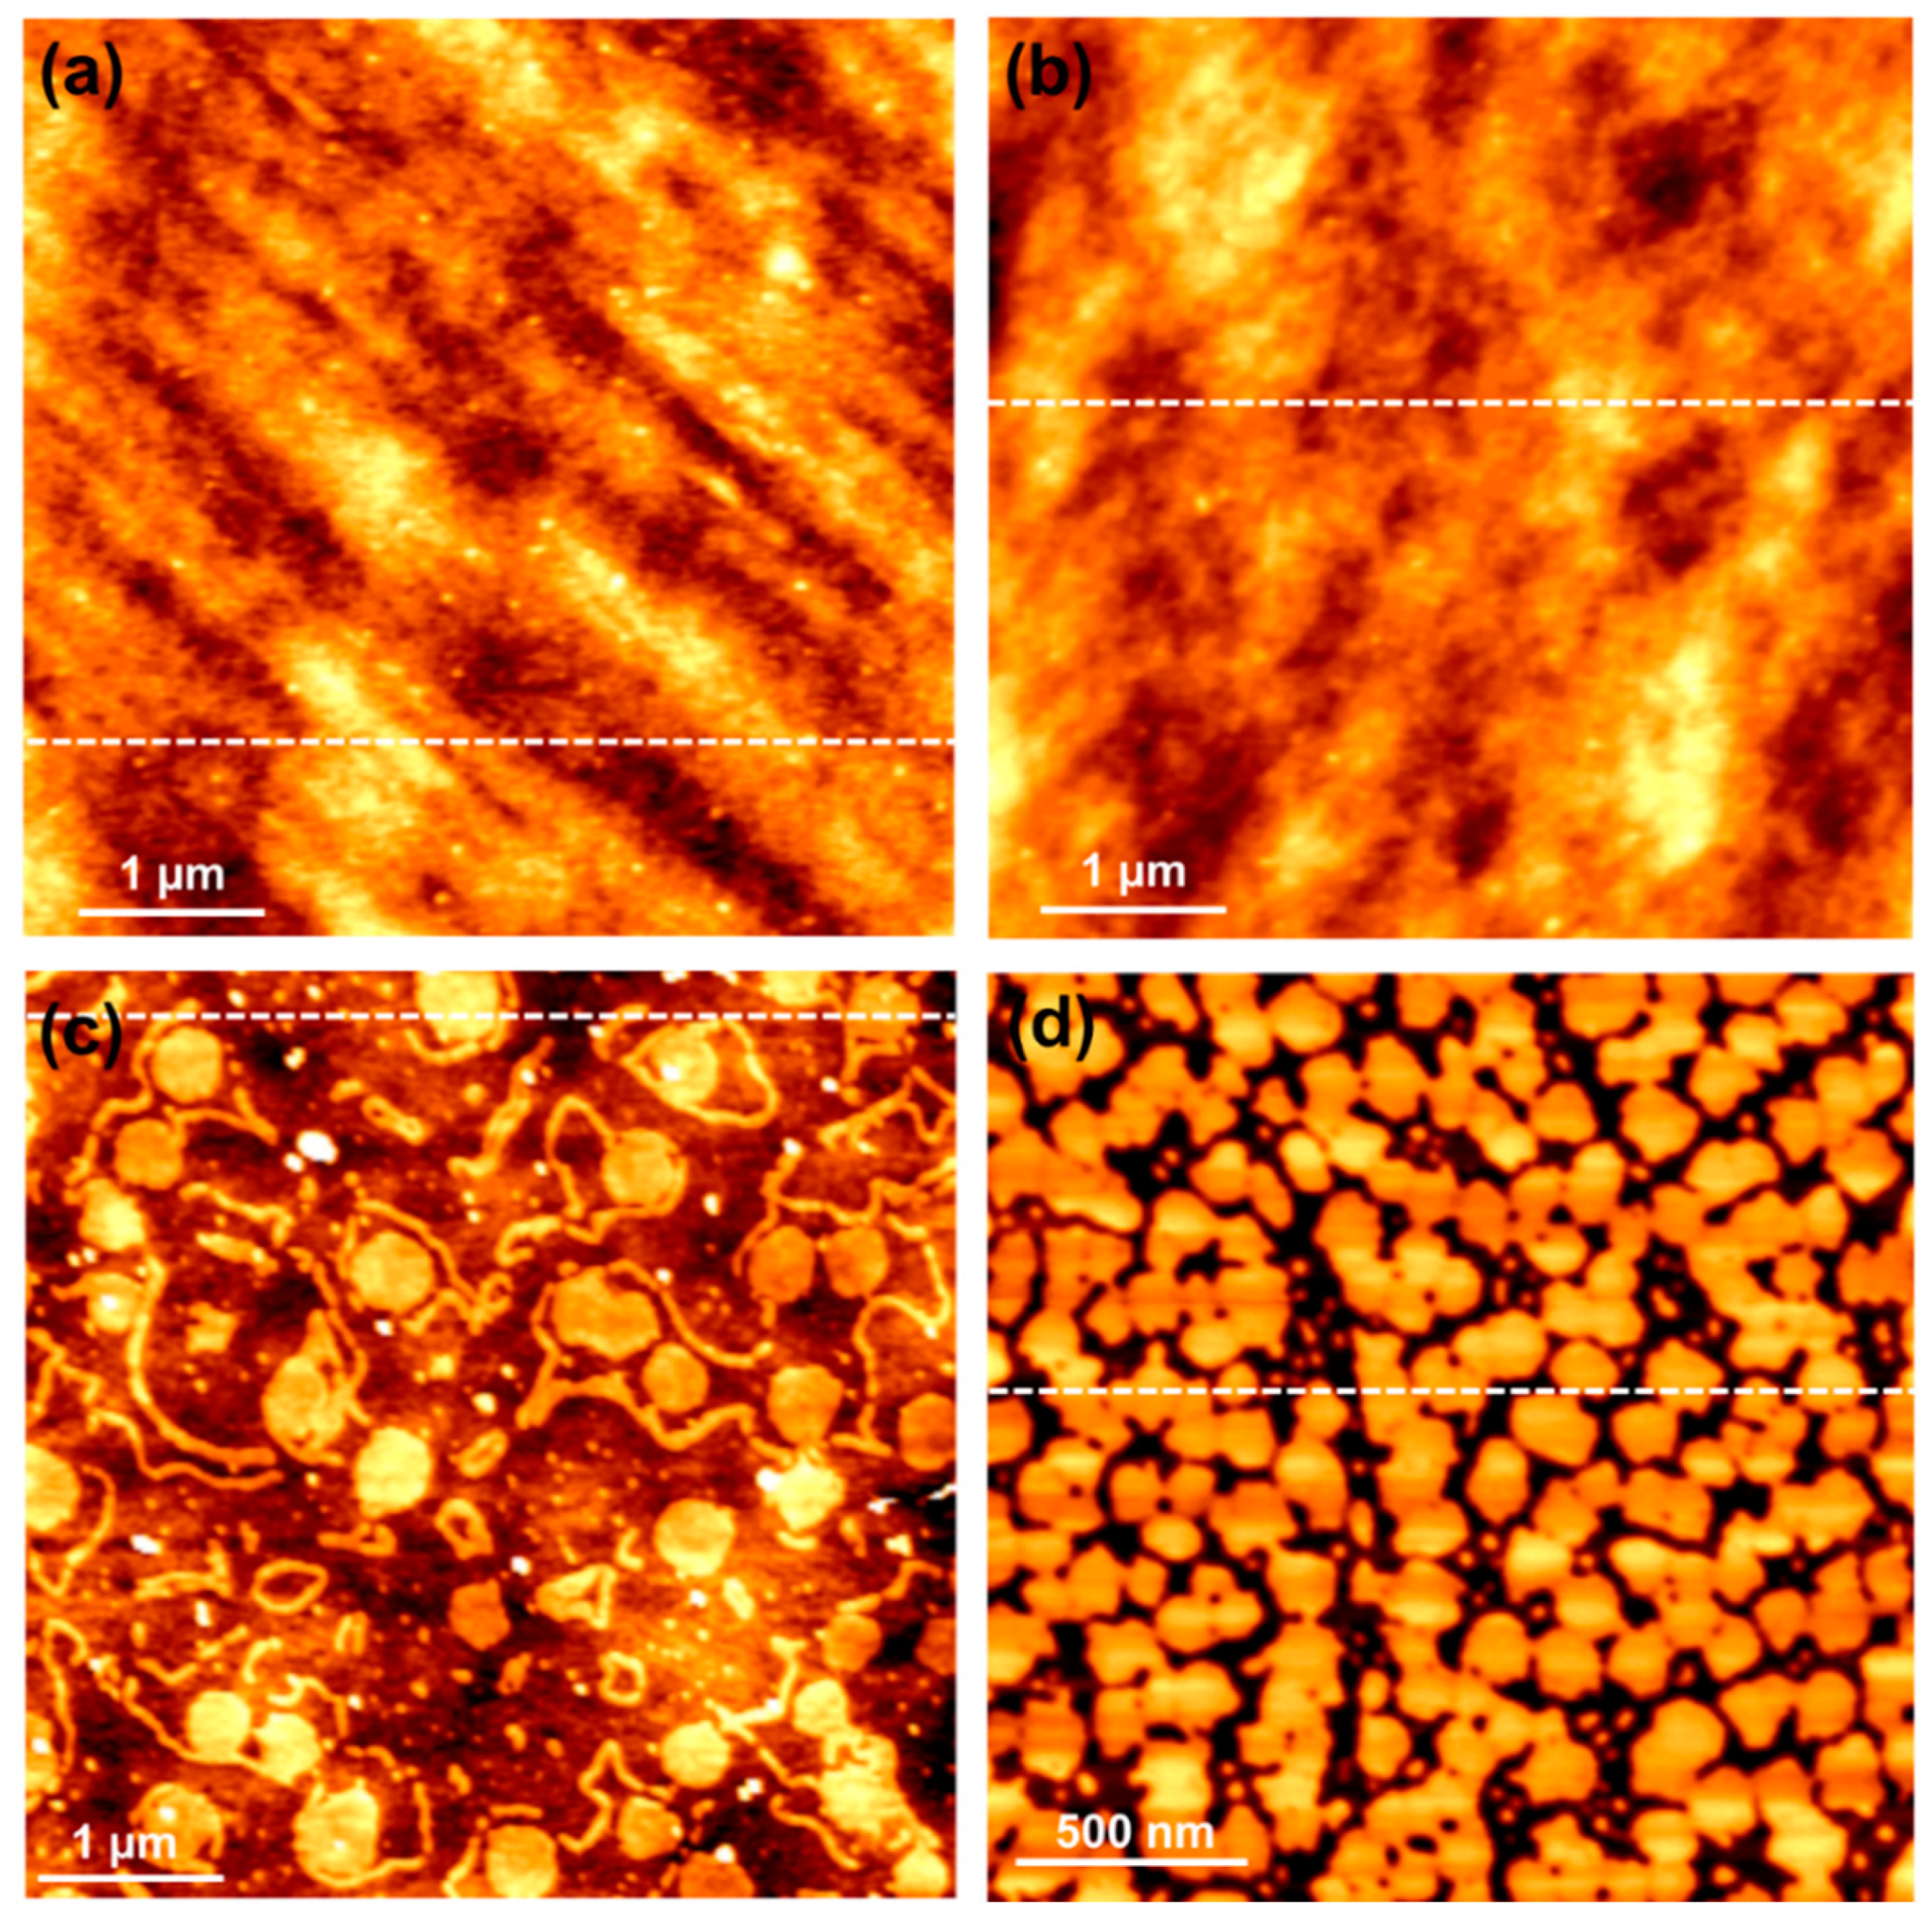
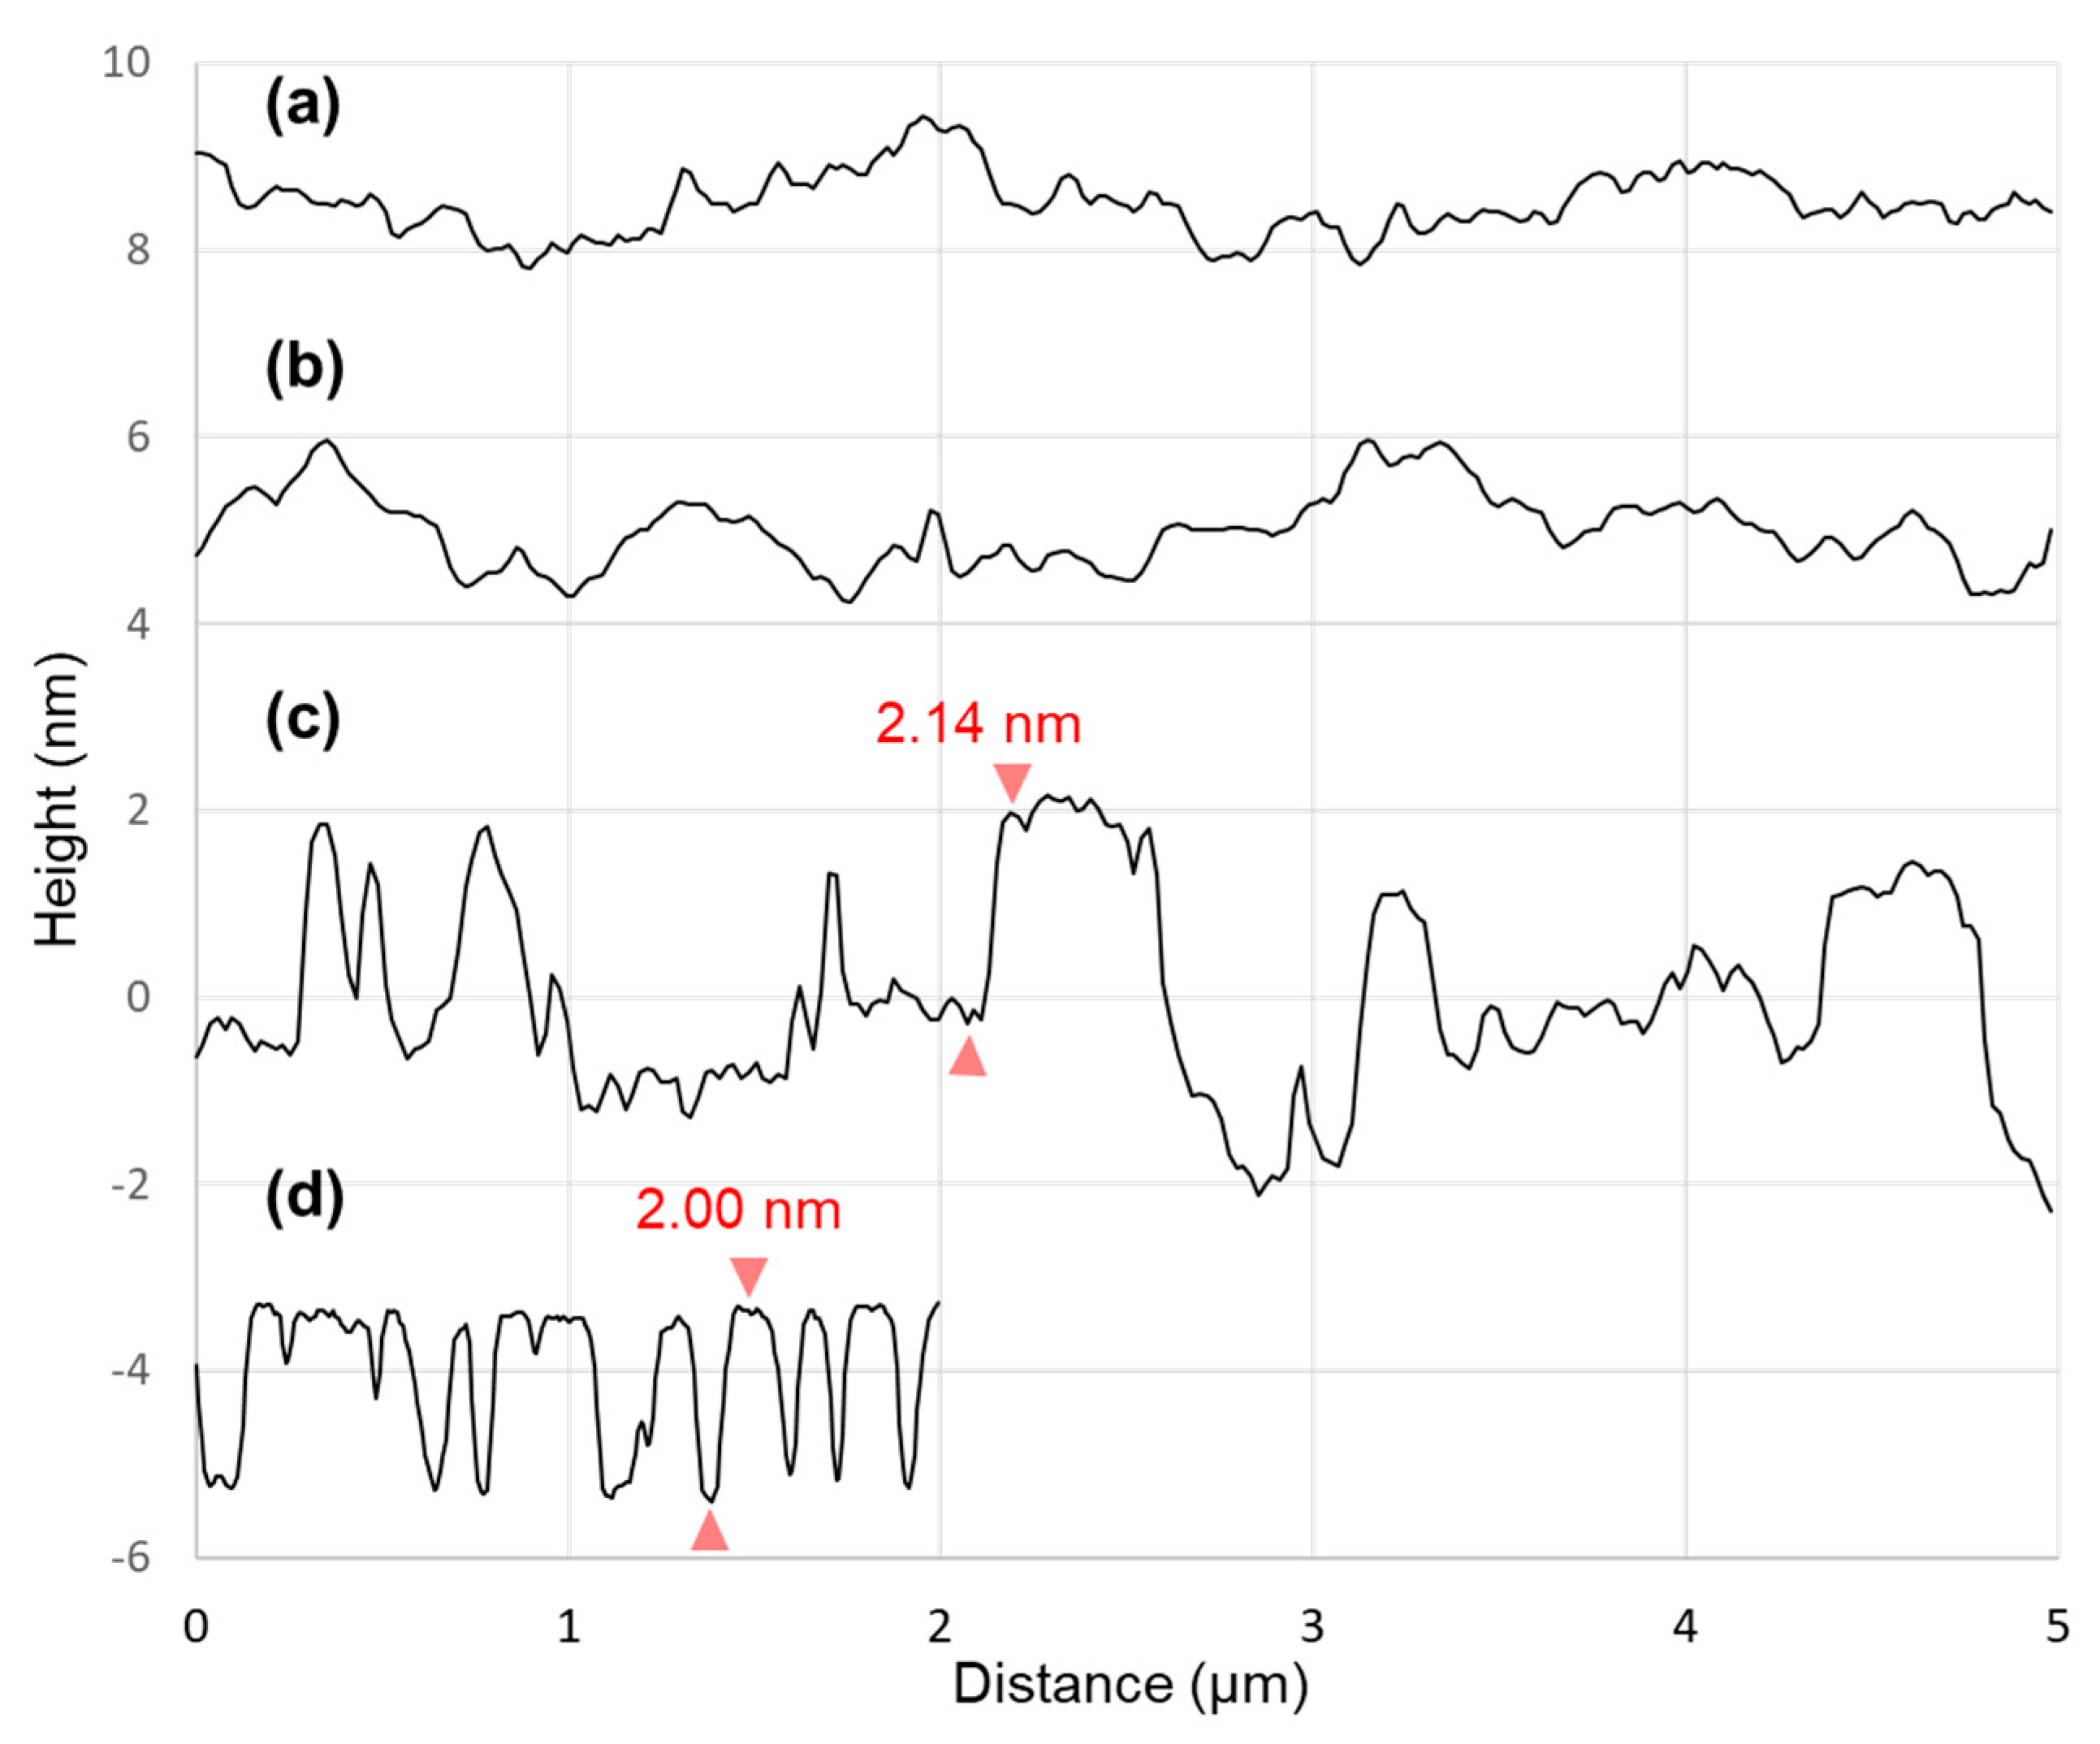
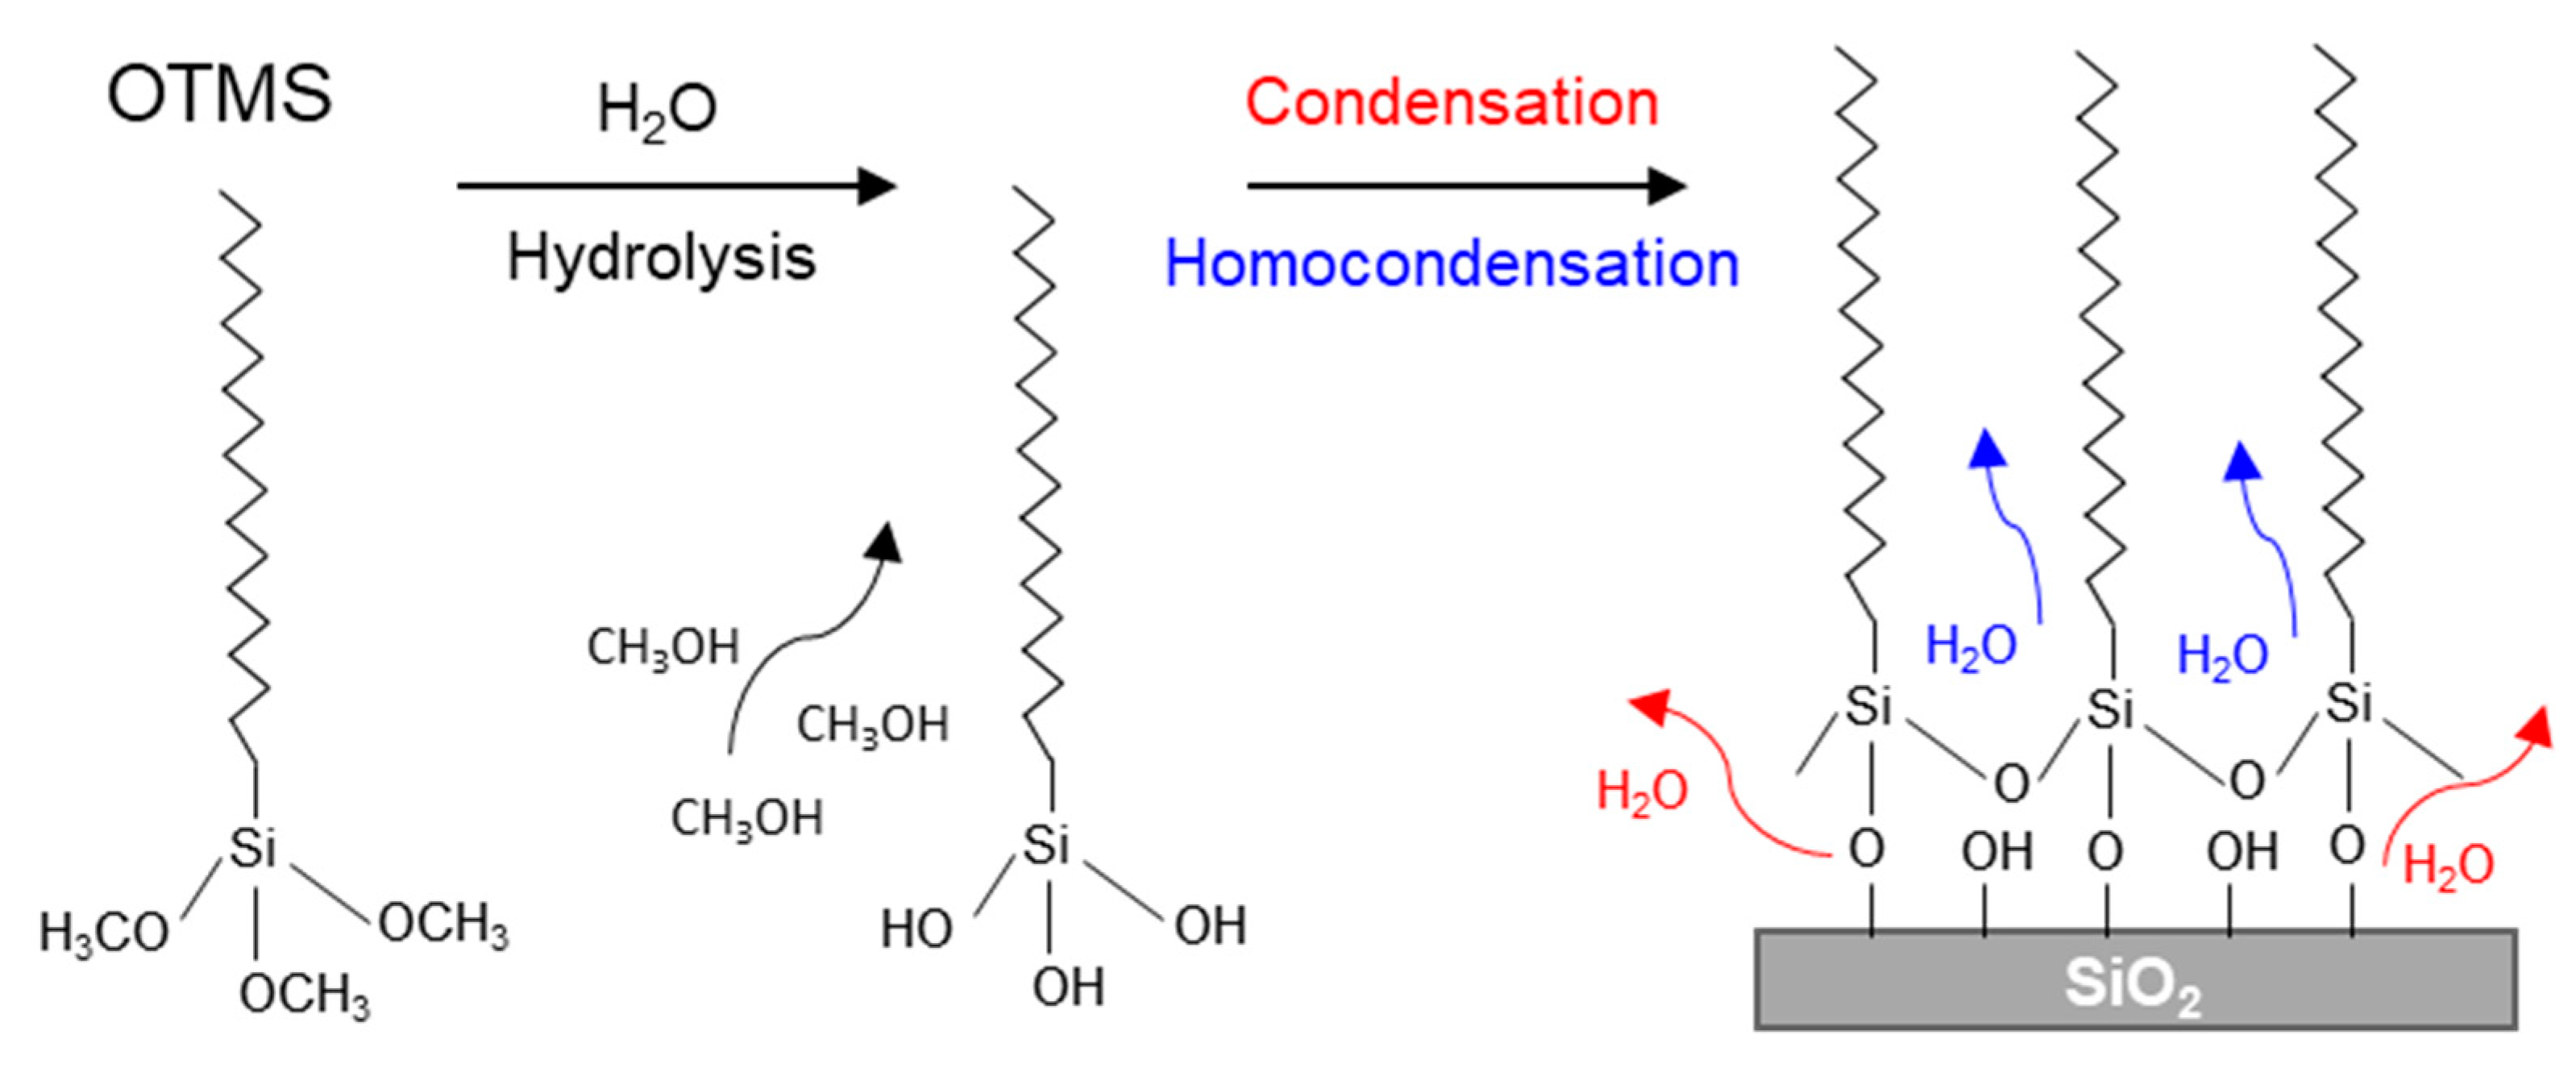
3.1. Formation of OTMS SAMs Verified by Water CAs and AFM Imaging

Figure 1a is an optical image of a water droplet placed on a bare SiO2 substrate ultrasonically cleaned in methanol for 15 min, showing a CA of 41°. Depending on the cleanness of the surface, CAs of 40–50° were commonly observed. This level of water CAs indicates that organic contaminants are still present on the solvent-cleaned substrate because water should spread on the surface of a SiO2 substrate that is free from contamination. In fact, there is always a layer of hydrocarbons absorbed on almost any type of surface, which are referred to as adventitious hydrocarbons [39,40,41]. We confirmed that for a SiO2 substrate subjected to a UV/ozone treatment for 30–40 min, water completely spread on the surface; that is, no contact angle was measurable. This is a proof that organic contaminants, including adventitious hydrocarbons, were largely removed from the substrate, rendering the surface dominated by hydroxy groups. This surface-cleaning procedure (or other wet etching ones [42,43]) is required to achieve high-quality organosilane SAMs on oxides.
As shown in Figure 1b, hydrophobicity was achieved on OTMS SAMs formed on a SiO2 substrate that was sequentially cleaned by methanol and UV/ozone treatment. The water droplet in Figure 1b shows a CA of 110°. The average CA obtained over 10 spots on the OTMS SAM sample is 110 ± 1°. CAs are an excellent measure of the coverage and the crystallinity (or conformation) of the molecular chains of SAMs for alkylsilanes. More specifically, any exposure of the hydrophilic SiO2 substrate (i.e., less than complete coverage of SAMs) will decrease the number of water CAs. A perfect OTMS SAM should have its surface terminated by methyl groups. Any exposure of the methylene chains in SAMs will be regarded as defective, which will in principle decrease water CAs. Therefore, the seemingly simple CA measurement is indeed sensitive to the surface chemistry of alkylsilane SAMs. There are plenty of CA data for OTMS SAMs on various oxides, which range from 105° to 113° [13,14,15,16]. The CAs obtained verified the formation of high-quality OTMS SAMs on the SiO2 substrate; i.e., there was complete coverage and closely packed molecular chains with their methyl groups pointing outward.
In order to understand the surface morphology of the OTMS SAMs formed on the SiO2 substrate, AFM was used to study the SiO2 substrate and the OTMS SAMs formed on said substrate. Figure 2 shows four AFM topographic images in false color scales; that is, brighter colors represent greater height values. The scan area for AFM images in Figure 2a–c is 5 µm × 5 µm, while that for Figure 2d is 2 µm × 2 µm. The broken lines inserted in the images indicate a scan line to be isolated to show a profile for each image, which are shown in Figure 3. Figure 2a shows the surface morphology for the bare SiO2 substrate. When the surface of the SiO2 substrate is derivatized by OTMS SAMs, as shown in Figure 2b, there are no significant differences in morphology between the two samples. This is a reflection that the surface is completely covered by a monolayer of OTMS so that the morphology of the underlying SiO2 substrate is replicated. This result was confirmed on OTMS SAMs formed on multiple SiO2 substrates. The average surface roughness values for the images in Figure 2a,b were 0.29 and 0.37 nm, respectively. This difference in roughness is likely due to the inhomogeneity of the morphology of the SiO2 substrate captured in a scan area of 5 µm × 5 µm.
AFM is useful in visualizing the coverage of SAMs. However, for SAMs with complete coverage, AFM is not capable of measuring their thickness because AFM relies on measuring the height difference between the monolayer and the substrate. It is thus necessary for both the SAMs and the substrate to be present within the scanned area, where there must be openings in the monolayer or the monolayer must be composed of islands. In order to take advantage of AFM, island-like OTMS SAMs were prepared on a UV/ozone-treated SiO2 substrate via spin coating, which are shown in Figure 2c. One can clearly see the circular islands of OTMS SAMs and the underlying corrugated SiO2 substrate. In order to avoid, as much as possible, the impact of the corrugated SiO2 substrate on the estimation of the thickness of the OTMS SAMs, the step height differences close to the edge of the monolayer islands were measured. These islands are 2.12 ± 0.14 nm thick and 300–600 nm across. Fiber-like features can also be observed in Figure 2c, whose height is similar to that of the islands. For comparison purposes, OTMS SAMs were also spin coated on a freshly cleaved mica substrate, which is atomically flat. As shown in Figure 2d, closely connected island-like features were detected that are 120–180 nm across. The thickness estimated from the AFM image is 2.01 ± 0.06 nm. The difference in OTMS SAM thickness between the SiO2 substrate and the cleaved mica substrate may be attributable to their surface roughness, i.e., corrugated vs. atomically flat. The thickness estimated from these OTMS SAMs agrees with those reported [13,14,15,17].
Shown in Figure 3 are profiles isolated from each of the four AFM images in Figure 2. The surfaces of the bare SiO2 substrate (Figure 3a) and the complete coverage OTMS SAMs (Figure 3b) show corrugations of 1–2 nm. Figure 3c shows a profile across islands of OTMS SAMs formed on the UV/ozone-treated SiO2 substrate. The profile clearly shows that the SAM islands ride on the corrugated underlying SiO2 substrate. For example, as indicated in Figure 3c, an island of OTMS SAMs has a thickness of 2.14 nm. In contrast, there is no convolution from the substrate roughness because of the atomically flat nature of the cleaved mica substrate. An island of OTMS SAMs with a thickness of 2.00 nm is indicated in Figure 3d.

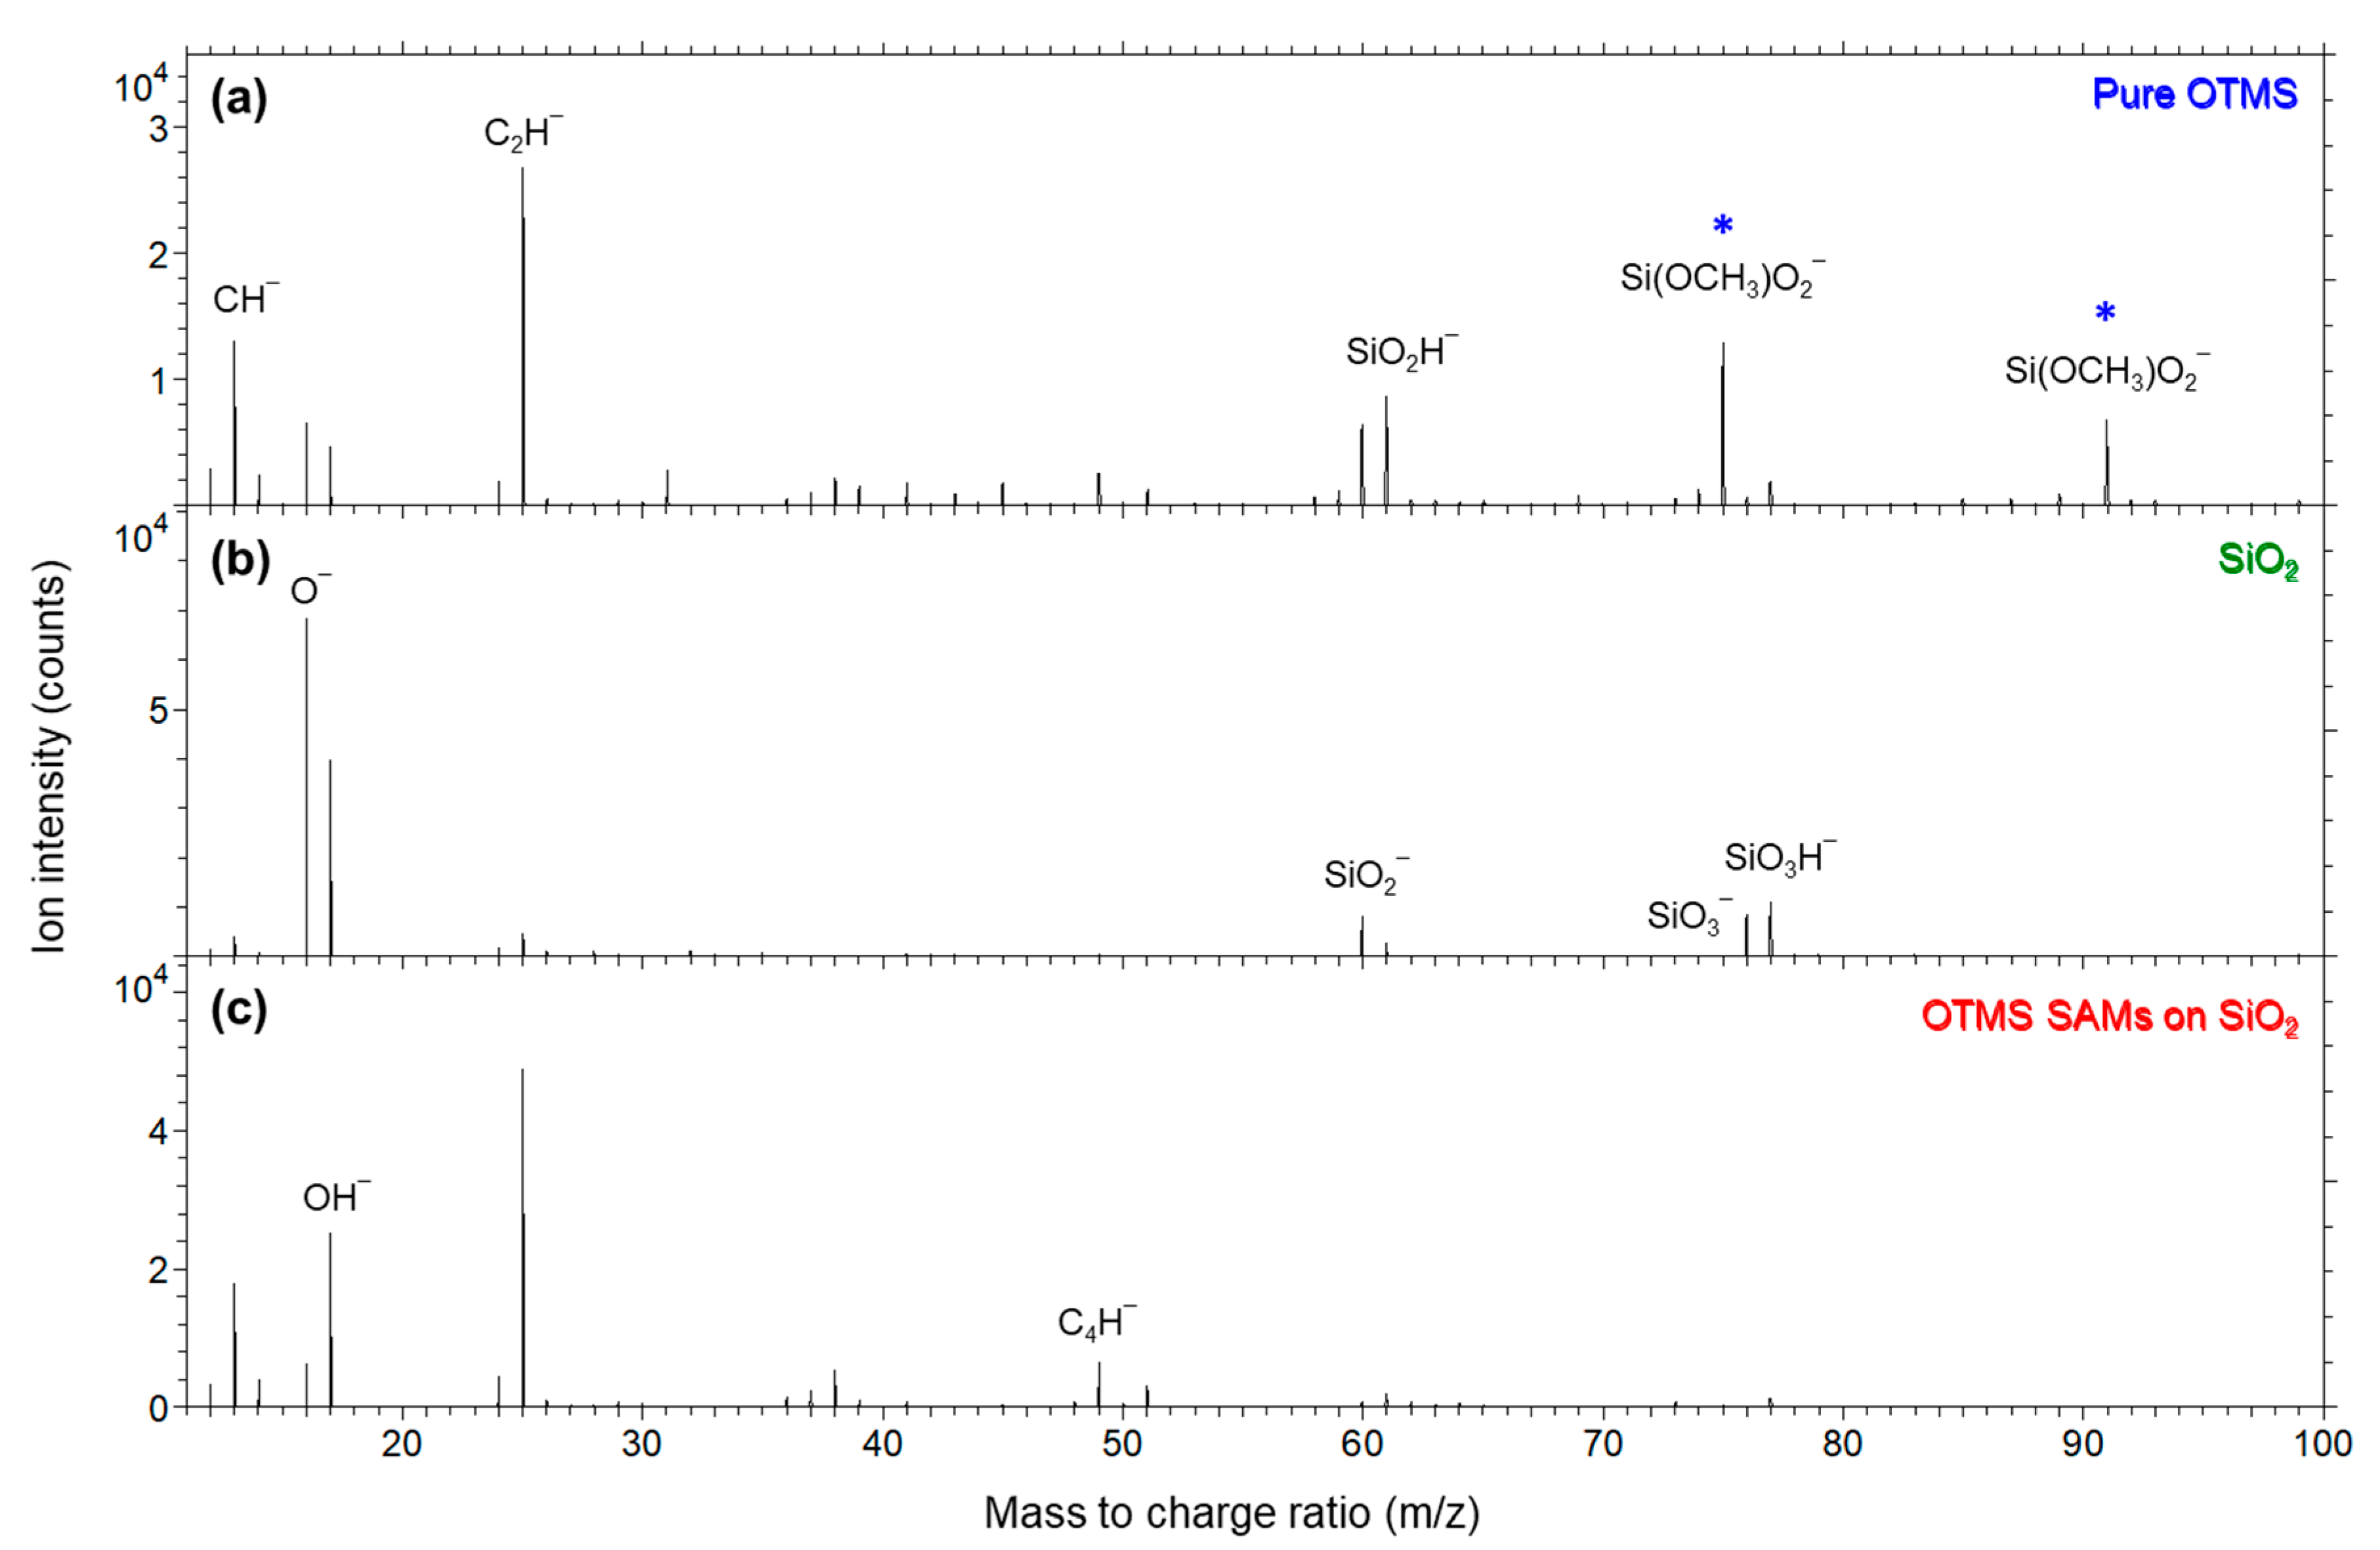
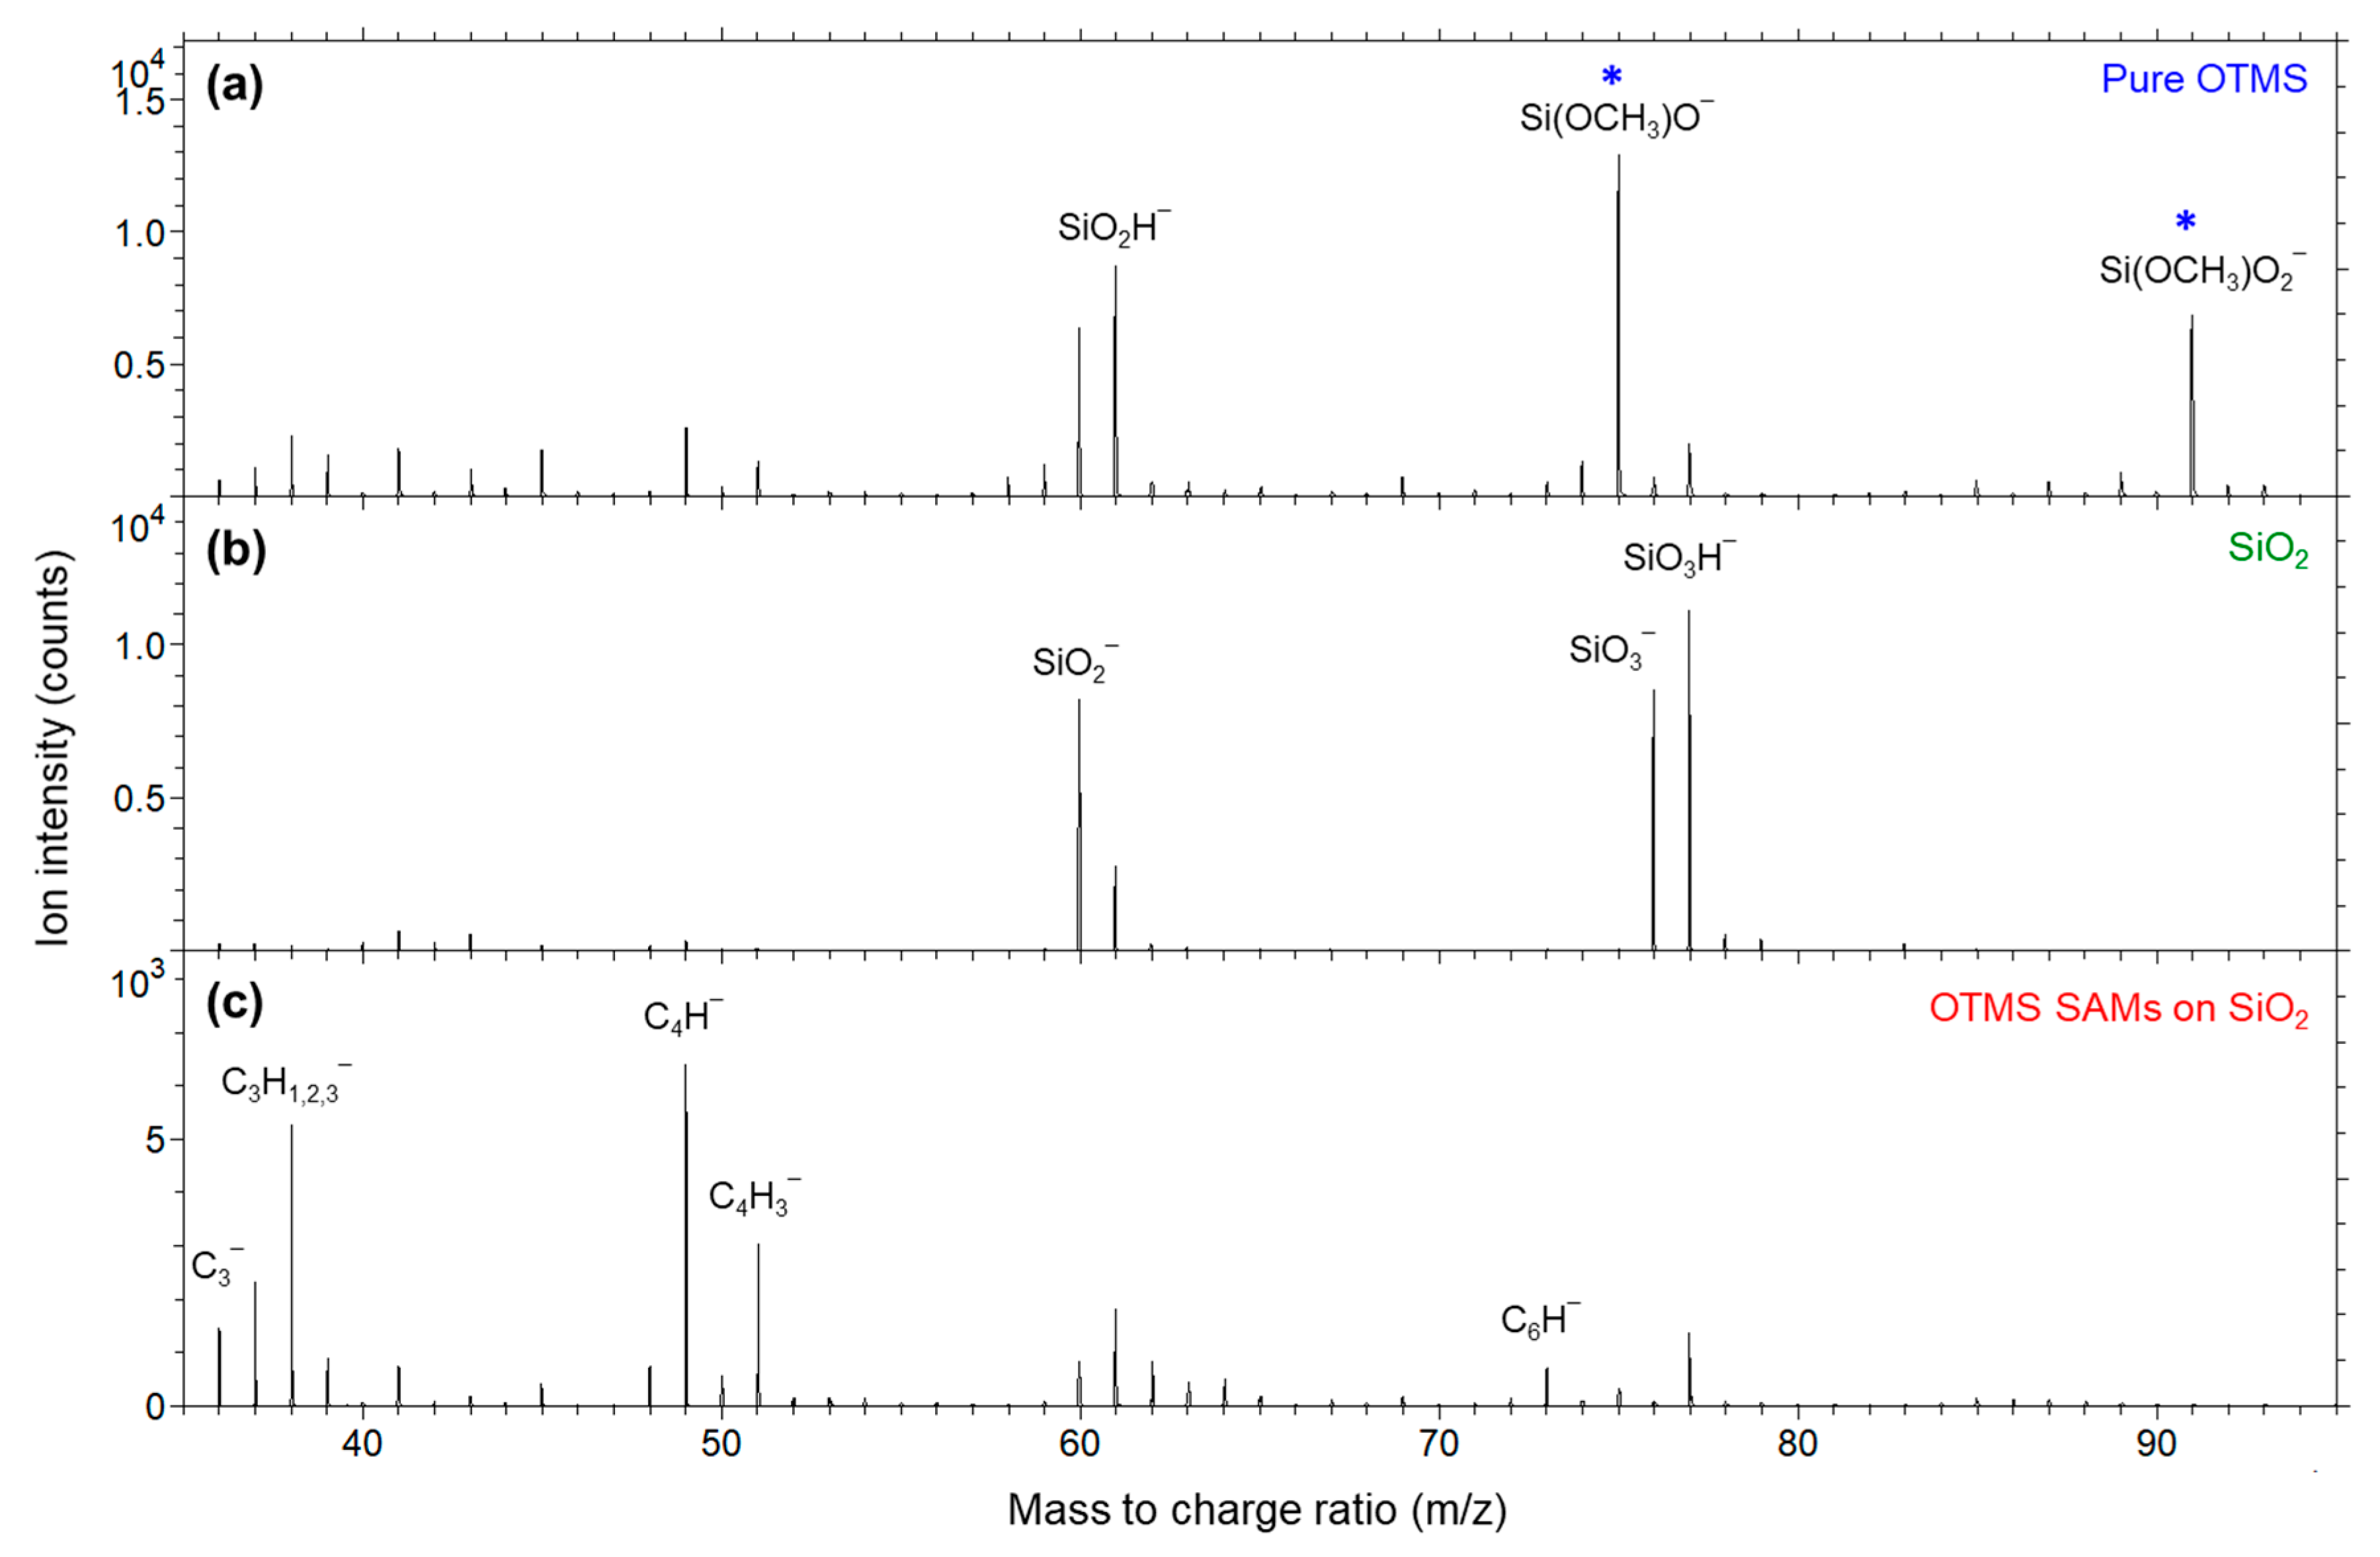
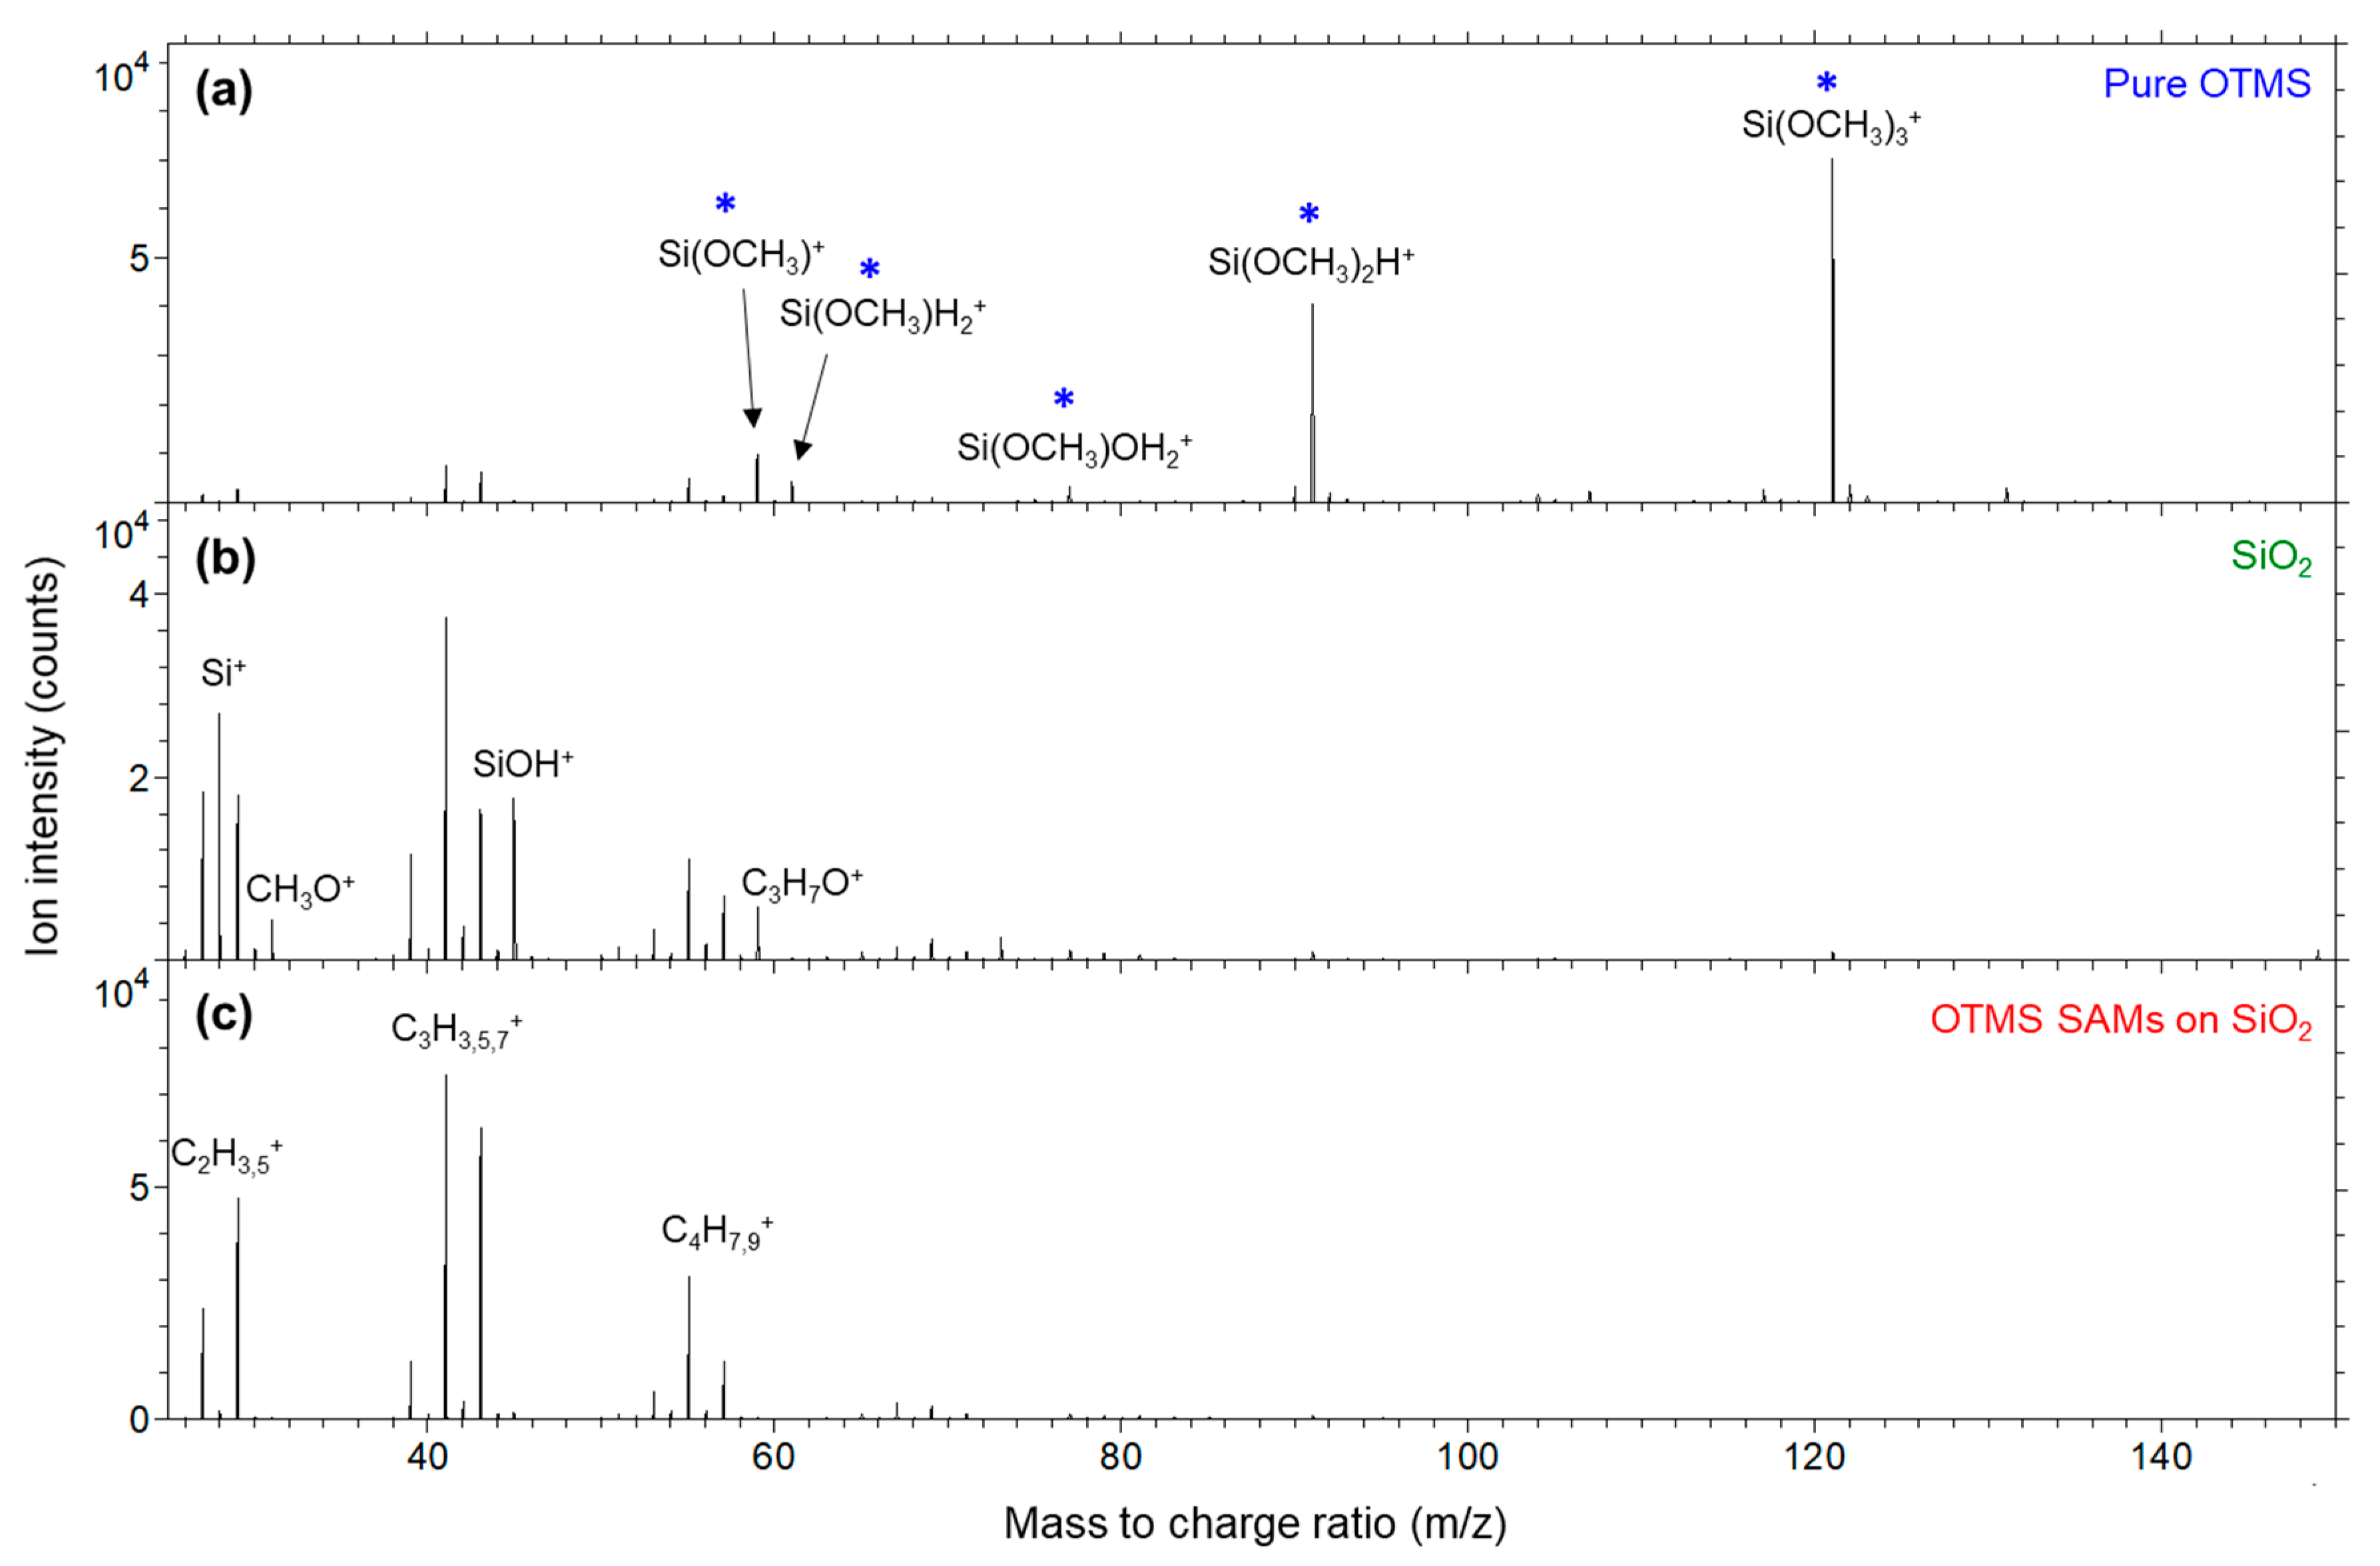
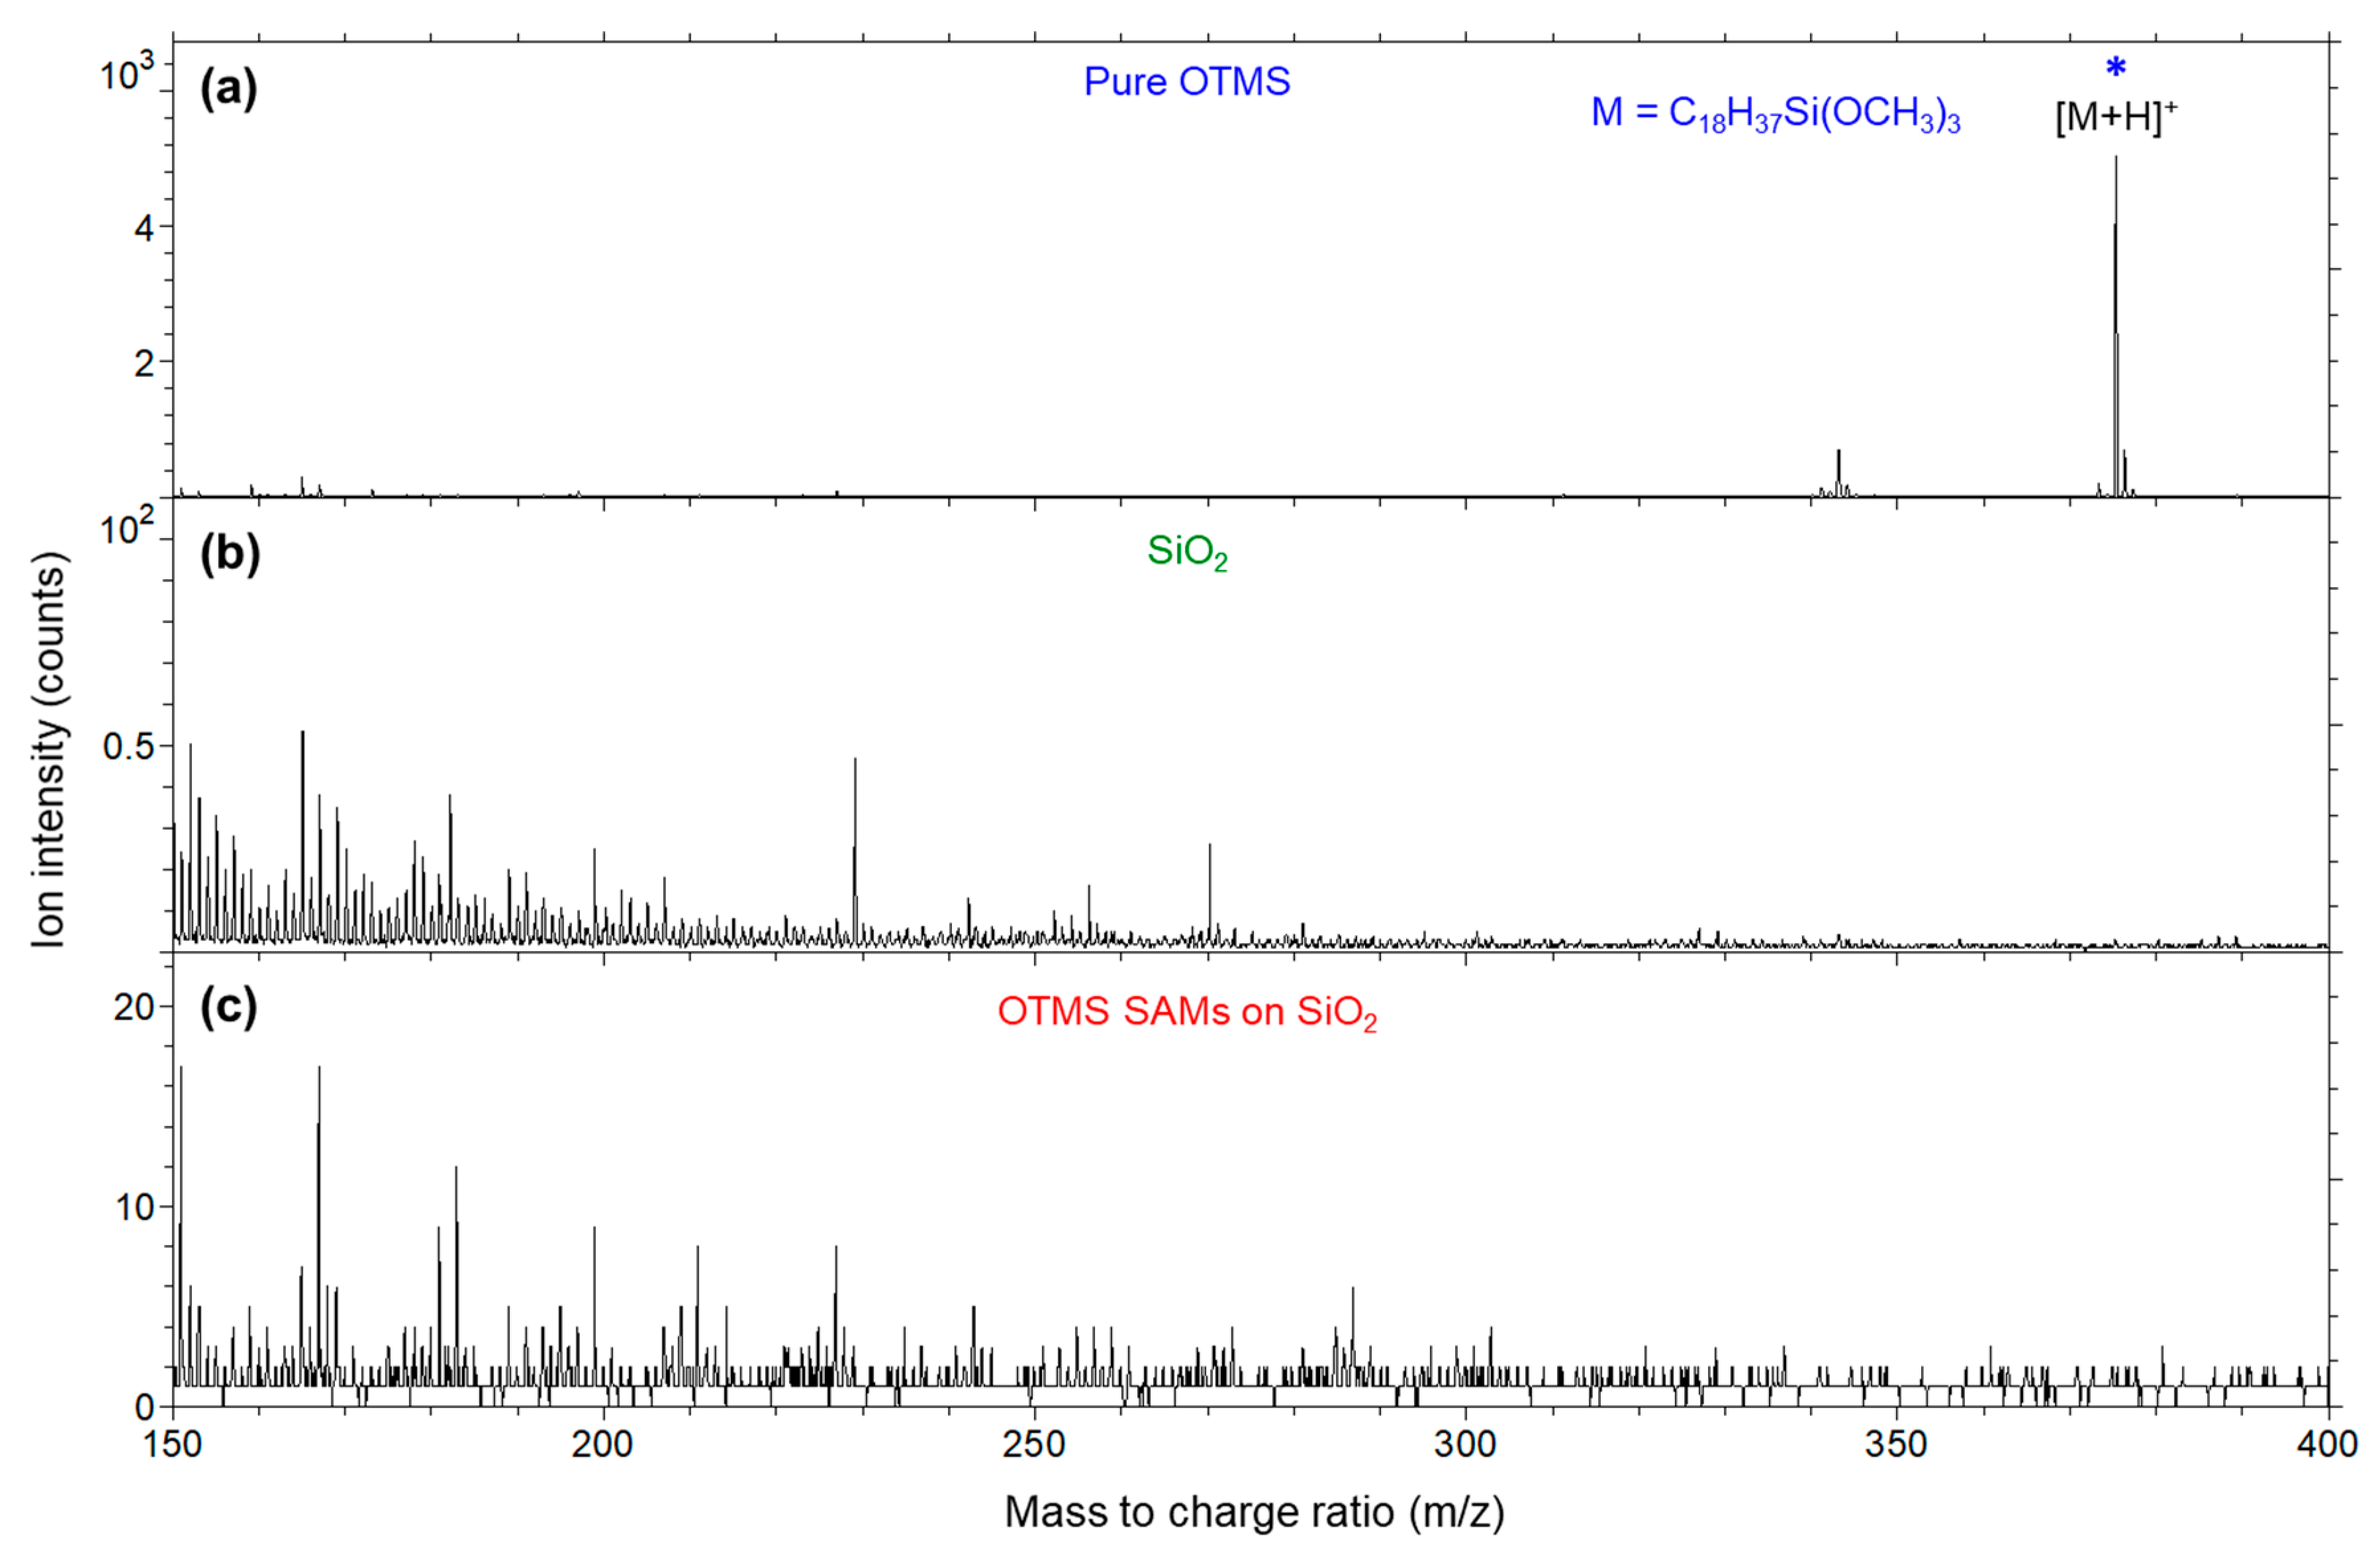
3.2. ToF-SIMS Analyses of OTMS Molecules and OTMS SAMs

The results of the CA and AFM analyses verified the formation of good-quality OPA SAMs with complete coverage on the SiO2 substrate. In this section, we concentrate on using ToF-SIMS to explore the interface chemistry of OTMS SAMs formed on a SiO2 substrate. Condensation reactions between the hydrolyzed OTMS molecules and the SiO2 substrate and among OTMS molecules themselves (homocondensation) are responsible for the robust OTMS SAMs formed on oxides. Therefore, pure OTMS molecules, which are molecules with methoxy groups free from being hydrolyzed and condensed, will be used as a reference. Since the interface involves Si–O bonding from both the substrate and the SAMs, a bare SiO2 substrate, which was cleaned ultrasonically in methanol and treated by UV/ozone, will also be analyzed.
Shown in Figure 4a–c are negative secondary ion mass spectra in m/z 11–100 for pure OTMS molecules placed on a biaxially oriented polypropylene (BOPP) film, a bare SiO2 substrate treated by UV/ozone and complete coverage OTMS SAMs formed on such a SiO2 substrate, respectively. As shown in Figure 4a, the pure OTMS molecules are characterized by two ions Si(OCH3)O (nominal m/z 75) and Si(OCH3)O2 (91), which are associated with the OTMS molecular headgroups –Si(OCH3)3. In this article, ions associated with the headgroup, –Si(OCH3)3, are marked by a star in ion mass spectra for clarity.
The m/z range of 11–100 was selected to illustrate the distribution of intensities of ions relative to that of the most abundant ion of C2H (25) in Figure 4a,c as well as O (16) in Figure 4b. The dominant C2H‾ is due to the methylene chains of the OTMS molecules, whether they are free molecules (Figure 4a) or in their SAMs (Figure 4c). For the same reason, the intensity of CH (13) is also relatively strong. By contrast, as shown in Figure 4b, the SiO2 substrate is dominated by O and silicon oxide ions, such as SiO2 (60), SiO3 (76) and SiO3H (77). The rather weak C2H and CH signals detected on the SiO2 substrate are due to the ubiquitous adventitious hydrocarbons, which exist on almost any surface [39,40,41]. Because the higher m/z ions in Figure 4c are much weaker than C2H and their comparison with those in Figure 4a,b will lead to insight into the interface chemistry of the SAMs, the spectra of the three samples are replotted in m/z range 35–95 in Figure 5 to analyze these ions among the three samples.
Figure 5a shows four strong ions of SiO2, SiO2H, Si(OCH3)O and Si(OCH3)O2 (91), in which the latter two contain a methoxy group. These ions are all associated with the OTMS headgroup, –Si(OCH3)3. The detection of these two methoxy-containing ions indicates that the OTMS headgroups (–Si(OCH3)3) remains intact in vacuum. Figure 5b shows abundant SiO2, SiO3 and SiO3H, which are major ions for silicon oxide. The spectrum of the OTMS SAMs on the SiO2 substrate, as shown in Figure 5c, is quite different from the pure OTMS molecules and the bare SiO2 substrate. First of all, relatively strong ions C2H2 (38), C4H (49), C4H3 (51) and C6H (73) are detected from the SAMs. These hydrocarbon ions are due to the alkyl groups of the OTMS molecules, the same as discussed for C2H‾ in Figure 4a,c. These ions are slightly stronger for OTMS SAMs (Figure 5c) than for the pure OTMS molecules (Figure 5a). This difference can be readily explained by that ToF-SIMS only probes the surface topmost 1–3 nm so that the alkyl groups in OTMS SAMs are all probed, while the surface of the sample of pure OTMS molecules has both headgroups and alkyl groups, which makes the probed volume contain more headgroups –Si(OCH3)3.
By comparing the spectra in Figure 5a,c, it is clear that the two methoxy-containing ions Si(OCH3)O and Si(OCH3)O2 were not present in the OTMS SAMs, confirming that the methoxy groups were no longer present in the OTMS SAMs. This is proof that the methoxy groups OCH3 in OTMS headgroups –Si(OCH3)3 are hydrolyzed to become silanols –Si(OH)3 and methanol CH3OH that evaporates, followed by condensation reaction between some of the OH groups in the silanols and the OH groups of the SiO2 substrate that anchors the OTMS molecules to the substrate via Si–O–Si linkages [19]. It is also believed that some of the OH groups of the silonols of the hydrolyzed OTMS molecules go through a condensation reaction among themselves (homocondensation) to polymerize the molecular headgroups [1,18,19]. This explains why organosilanes make robust SAMs on oxides.
Although SiO2 and SiO2H (61) are detected for all three samples (Figure 5), their intensities relative to other ions provide useful information in two aspects. The first one is that these two ions are less abundant than hydrocarbon ions (e.g., C2H2, C4H and C4H3) for the OTMS SAMs (Figure 5c), but their abundance relationship is reversed for the pure OTMS molecules (Figure 5a). This is due to the fact that Si–O linkages are below the alkyl groups in OTMS SAMs, while in the case of the pure OTMS molecules (placed on a BOPP film), the surface is mainly composed of the molecular headgroups, –Si(OCH3)3. The second aspect is that the relationship between the SiO2 and SiO2H‾ intensities is different between the SiO2 substrate and the OTMS either in their pure molecules or SAMs. For the SiO2 substrate, the intensity ratio between SiO2 and SiO2H is greater than 1 (Figure 5b), while for the pure OTMS molecules (Figure 5a) and the OTMS SAMs (Figure 5c), their SiO2 and SiO2H intensity ratios are less than 1. A possible interpretation for the observed intensity ratio SiO2/SiO2H < 1 for OTMS is that the abundant hydrogen species generated (from the alkyl groups) in the primary ion bombardment process are combined, in the space above the sample surface, with SiO2 species to form SiO2H. Regardless of the explanation, the experimental observation of the relationship between the intensities of SiO2 and SiO2H may serve as a ToF-SIMS criterion to differentiate between silicon oxide and organosilanes.
Another important group of ions for understanding the interface chemistry of OTMS SAMs on SiO2 substrate are SiO3 and SiO3H, which are characteristic of silicon oxide (Figure 5b). There are few SiO3 signals detected for both the pure OTMS molecules (Figure 5a) and the OTMS SAMs (Figure 5c), while their SiO3H intensities are greatly reduced in comparison with those for the SiO2 substrate (Figure 5b).
Figure 6 shows the negative secondary ion mass spectra for the three samples from m/z 100 to 400. As shown in Figure 6a, for the pure OTMS molecules, an abundant pseudo-molecular ion [M–CH3] (359) was detected, where M = C18H37Si(OCH3)3 represents the molecular formula of OTMS and the methyl group removed is from one of the three methoxy groups. Though much weaker in intensity in comparison to [M–CH3], a deprotonated molecular ion [M–H] (373) was also detected. Also shown in Figure 6a are two OTMS molecular headgroup-related ions, Si(OCH3)2OH (107) and Si(OCH3)3 (121).
As shown in Figure 6b, the SiO2 substrate sample’s spectrum is characterized by silicon oxide cluster ions, Si2O4 (120), Si2O4H (121), Si2O5H (137), Si3O7H (197), Si4O9H (257) and Si5O11H (317), with Si2O5H being the most abundant and Si3O7H (197) being the second most. When zoomed in (not shown), the nominal m/z values for Si(OCH3)3 (Figure 6a) and Si2O4H (Figure 6b) are both 121, but their exact m/z values are 121.033 and 120.941, respectively, and they are two totally separated peaks in the spectrum of Figure 6a. At m/z 137, it is also confirmed that the intensity of Si2O5H is extremely weak for the pure OTMS molecules (Figure 6a). Instead, there is a stronger ion Si(OCH3)3O, which is related to the OTMS molecular headgroup, –Si(OCH3)3, and whose exact m/z value is 137.028, while that of Si2O5H is 136.937.
It is clear that ions from the pure OTMS molecules (Figure 6a) are not detected from the OTMS SAMs (Figure 6c). As discussed before (for the two lower mass ions associated with the OTMS headgroups, –Si(OCH3)3 shown in Figure 5a), this is a reflection that the methoxy groups no longer exist in the OTMS SAMs due to their hydrolysis and condensation/homocondensation reaction. The higher mass silicon oxide cluster ions (i.e., Si2O5H, Si3O7H, Si4O9H and Si5O11H‾) shown in Figure 6b, which are characteristic of the SiO2 substrate, are not detected from the pure OTMS molecules (Figure 6a). This observation suggests that the methoxy groups in the pure OTMS molecules are intact, thus preventing the formation of –Si–O–Si– network.
It is clear that Si2O5H, Si3O7H, Si4O9H and Si5O11H are much stronger for the SiO2 substrate (Figure 6b) than for the OTMS SAMs (Figure 6c). This can be explained by the fact that the presence of the OTMS SAMs (whose thickness is ~2 nm) reduces the generation of these ions (because of the 1–3 nm probing depth of ToF-SIMS). The fact that the ratios of the intensities of Si3O7H, Si4O9H and Si5O11H relative to that of Si2O5H are similar for both samples suggests that either these ions from the OTMS SAMs also originate from their underlying SiO2 substrate or the –Si–O–Si– network of the OTMS SAMs has a similar ion fragmentation pattern as the SiO2 substrate for these four ions, or a mixture of both.
On the other hand, it is interesting to note that the OTMS SAMs on a SiO2 substrate (Figure 6c) show other silicon oxide ions that are rather weak from the bare SiO2 substrate (Figure 6b), which are Si2O4H, Si3O5H (165) and Si3O6H (181). Therefore, it is plausible that these are mainly, if not solely, associated with the –Si–O–Si– network resulting from the polymerization of the silanols generated from the hydrolyzation of the methoxy groups of the OTMS molecules.
Shown in Figure 7 are the positive secondary ion mass spectra (m/z 20–150) for the three samples. The spectrum of the pure OTMS molecules (Figure 7a) is dominated by Si(OCH3)3+ (121) and Si(OCH3)2H+ (91). These two ions are much more abundant than hydrocarbon ions, CxHy+, such as C3H5+ (41), C3H7+ (43) and C4H7+ (55). Other three less abundant ions shown in Figure 7a are Si(OCH3)+ (59), Si(OCH3)H2+ (61) and Si(OCH3)OH2+ (77). It is clear that the positive ion mass spectra of the pure OTMS molecules are dominated by ions fragmented from their headgroups, –Si(OCH3)3.
As shown in Figure 7b, the bare SiO2 substrate, which was UV/ozone treated, shows abundant Si+ and SiOH+ signals. The hydrocarbon ions C2H3+ (27), C2H5+, (29), C3H5+, C3H7+ and C4H7+ detected on the SiO2 substrate are due to residual hydrocarbons or adventitious hydrocarbons on the oxide surface. Also detected on the SiO2 substrate are CH3O+ (31) and C3H7O+ (59), which are apparently introduced by the UV/ozone treatment because their intensities increased in comparison to a pristine SiO2 substrate (not shown) prior to the UV/ozone treatment. Si(OCH3)+ from the pure OTMS molecules and C3H7O+ from the bare SiO2 substrate have the same nominal m/z 59, while their exact m/z values are 58.995 and 59.050, making them well separated. It is confirmed that neither of these two ions was detected from the OTMS SAMs (Figure 7c).
Figure 7c shows that the spectrum of the OTMS SAMs is dominated by the hydrocarbon ions C2H3+, C2H5+, C3H5+, C3H7+ and C4H7+, which is due to the alkyl groups of the OTMS SAMs. These alkyl groups are also responsible for the drastically reduced intensities of Si+ and SiOH+ in comparison with those of the bare SiO2 substrate (Figure 7b). The ions associated with the headgroups, –Si(OCH3)3, of the pure OTMS molecules (Figure 7a) disappear in the spectrum of the OTMS SAMs (Figure 7c). These experimental observations, as already discussed for the negative ion spectra, confirm the formation of OTMS SAMs on the SiO2 substrate.
Figure 8 shows positive secondary positive ion mass spectra from m/z 150 to 400 for the three samples. Figure 8a shows the protonated molecular ion [M + H]+ at m/z 375 for the pure OTMS molecules, which was not detected in the OTMS SAMs (Figure 8c). As shown in Figure 8b,c, the spectra for the other two samples show very weak ions that are not identified. Therefore, the positive ion mass spectrum for the OTMS SAMs shows it is characterized by hydrocarbon ions, which is due to the alkyl groups. The information about the interface is the lack of OTMS headgroup-related ions. Therefore, the positive ion mass spectra for OTMS SAMs are less informative than their negative counterparts, in which, as discussed before, the –Si–O–Si– network was probed via higher-mass silicon oxide cluster ions.

4. Discussion

Shown in Figure 9 is an illustration of (1) an OTMS molecule, (2) the conversion of its three methoxy groups to three hydroxyl groups and the release of three methanol molecules via hydrolysis, and (3) the condensation reaction between silanols (Si–OH) and the hydroxyl groups of the SiO2 substrate to anchor the molecules to the substrate, as well as the homocondensation reaction [19,44] between silanols to polymerize the molecules to form the –Si–O–Si– network. The condensation and homocondensation reactions result in the formation of water molecules, which evaporate. The closely packed methylene chains terminated with the methyl groups of the OTMS SAMs provide hydrophobicity, which is responsible for the large water CAs observed (Figure 1b).
As shown in Figure 9, the OTMS SAMs are characterized by the polymerization of silanols, which are responsible for the SAMs of organosilanes. In contrast, for the other two types of SAMs of alkanethiols and organophosphonic acids, there is no cross linking between the molecular headgroups. This distinctive difference was revealed by ToF-SIMS, thanks to its extremely high surface sensitivity and superb chemical selectivity. For example, for alkanethiol SAMs formed on gold, ions associated with both the alkanethiol molecule (whose molecular formula is represented by M) and gold were detected, including Au2M and [Au2M2-H]+ [30], M2Au+ [31] and [M-H + Au2] [32]. Even though alkanethiol molecules are covalently bonded to the substrate via the Au-S linkage [2], the detection of molecular or pseudomolecular ions by ToF-SIMS is attributed to the lack of cross linking of the molecular headgroups themselves. In the case of OPA SAMs, protonated and deprotonated molecular ions were detected [33,34]. The phosphonic acid headgroups can form mono-, bi- and tridentate linkages to the substrate via the condensation reaction [45,46], but there is no homocondensation reaction between the phosphonic acid headgroups with hydroxyl groups [44]. This is regarded as the reason for the fragmentation of protonated and deprotonated OPA molecular ions from their SAMs that are covalently bonded to the substrate [33,34]. In special cases, OPA molecules can even form SAMs that are weakly attached to the substrate via H-bonding when a solvent having a dielectric constant of ~4 is used [23]. In this case, the OPA molecules in their SAMs are confirmed to have the same ion fragmentation pattern as that of free OPA molecules [34].
Our ToF-SIMS results on free OTMS molecules (denoted as M) showed the presence of molecular or pseudomolecular ions, such as [M + H]+ (Figure 8), [M-H] and [M-CH3] (Figure 6). This is proof that the methoxy groups of the free OTMS molecules used for ToF-SIMS analysis (in vacuum) were not hydrolyzed. In contrast, for OTMS SAMs formed on a SiO2 substrate, no molecular or pseudomolecular ions were detectable, which confirms that the three methoxy groups for each molecule were hydrolyzed. Moreover, ToF-SIMS did not detect any ions with the alkyl group (C18H37) bonded with Si or SiOn (n = 1–3). This experimental observation reveals the most significant difference between organosilane SAMs and organophophonic acid SAMs in their ion fragmentation; that is, if the molecules are polymerized across their headgroups, there will be no generation of ions bonded to the headgroup. Otherwise, regardless of the fact that the molecules are covalently bonded to the substrate, molecular and/or pseudomolecular ions would be generated by ToF-SIMS.
Only organosilane molecules are capable of the homocondensation reaction [46], leading to –Si–O–Si– polymerization in addition to a condensation reaction for a portion of their silanols that will be anchored to the SiO2 substrate [18,19]. Our ToF-SIMS results verified that the –Si–O–Si– network eliminates the formation of ions with the alkyl group bonded to either Si or SiOn. A plausible explanation for this is that the –Si–O–Si– network is strong enough so that alkyl groups are fragmented before the network can be fragmented. As a result, both hydrocarbon ions (Figure 4c, Figure 5c and Figure 7c) and silicon oxide clusters (Figure 7c) were detected. If all silanols were anchored to the substrate (i.e., without the formation of the cross-linked –Si–O–Si– network), ions with an alkyl group bonded to Si or SiOn would be observed, perhaps more or less similar to that of the OPA SAMs case [33,34].
FTIR spectroscopy has also been used to study both anchoring and polymerized Si–O bonding at the interface of organosilane SAMs on silicon oxide substrates [25,47]. Molecular simulations have been carried out to understand the interplay between the anchoring Si–O bonding and the polymerized –Si–O–Si– network, as well as its impact on the orderliness of SAMs [37,48,49]. Differentiating between these two scenarios is not straightforward for organosilane SAMs formed on silicon oxide. ToF-SIMS is considered capable of providing unique information about the interface chemistry of organosilane SAMs in that the ion fragmentation patterns may be different. This leads to a ToF-SIMS analytical approach that not only detects diagnostic ions, but also identifies a lack of them if the system has a reference to compare with. Future work includes experiments on OTMS SAMs formed on non-silicon oxides so that the silicon oxide cluster ions SinO2n + 1H‾ (n = 2–5) serve as markers for the polymerized –Si–O–Si– network, while ions containing Si, O and the constituent element of the substrate can be regarded as the anchoring bond. This will thus provide opportunities for gaining more specific information towards a better understanding of the condensation and homecondensation reactions of silanols of the hydrolyzed OTMS molecules, as well as the development of more ToF-SIMS analytical approaches to explore the interface chemistry of organosilane SAMs.

5. Conclusions

ToF-SIMS was used to explore the interface chemistry of octadecyltrimethoxysilane (OTMS; molecular formula M = CH3(CH2)17Si(OCH3)3) self-assembled monolayers (SAMs) formed on a thermally grown SiO2 layer on a Si wafer via the comparison of differences in ion fragmentation between SAMs and free OTMS molecules. Molecular and pseudomolecular ions, such as [M–H], [M–CH3] and [M + H]+, were detected for the free OTMS molecules, whose ion mass spectra were dominated by various negative and positive ions associated with the silane headgroup, –Si(OCH3O)3, including Si(OCH3)O, Si(OCH3)O2, Si(OCH3)2OH, Si(OCH3)3, Si(OCH3)2H+ and Si(OCH3)3+. In contrast, for the OTMS SAMs, no ions associated with –Si(OCH3O)3 were detected, showing that methoxy groups no longer exist when OTMS molecules form SAMs, verifying that they are completely hydrolyzed. For free OTMS molecules, there were few to no silicon oxide cluster ions (SinO2n + 1H (n = 2–5)) detected. In contrast, these ions were detected on the OTMS SAMs, which ought to serve as a marker for the –Si–O–Si– network at the interface. Because these oxide cluster ions are characteristic of the bare SiO2 substrate, future work on investigating OTMS SAMs formed on non-silicon oxide will confirm to what extent the underlying SiO2 substrate contributes to the detected cluster silicon oxide ions. It is worth noting that there are three ions (Si2O3H, Si2O4H and Si3O6H) whose intensities are much stronger relative to that of Si2O5H (the most abundant silicon oxide cluster ion) for the OTMS SAMs than for the bare SiO2 substrate. Our results thus demonstrated that ToF-SIMS is able to provide unique information to improve our understanding of the interface chemistry of organosilane SAMs.

Author Contributions

Conceptualization, H.-Y.N. and H.-R.J.-F.; methodology, H.-Y.N.; formal analysis, H.-Y.N.; investigation, H.-Y.N.; resources, H.-Y.N. and H.-R.J.-F.; data curation, H.-Y.N.; writing—original draft preparation, H.-Y.N.; writing—review and editing, H.-Y.N. and H.-R.J.-F. All authors have read and agreed to the published version of the manuscript.

Funding

This research received no external funding.

Institutional Review Board Statement

Not applicable.

Informed Consent Statement

Not Applicable.

Data Availability Statement

Not applicable.

Conflicts of Interest

The authors declare no conflict of interest.

References

  1. Ulman, A. Formation and structure of self-assembled monolayers. Chem. Rev. 1996, 96, 1533–1554. [Google Scholar] [CrossRef] [PubMed]
  2. Love, J.C.; Estroff, L.A.; Kriebel, J.K.; Nuzzo, R.G.; Whitesides, G.M. Self-assembled monolayers of thiolates on metals as a form of nanotechnology. Chem. Rev. 2005, 105, 1103–1170. [Google Scholar] [CrossRef] [PubMed]
  3. Sagiv, J. Organized monolayers by adsorption. 1. Formation and structure of oleophobic mixed monolayers on solid surfaces. J. Am. Chem. Soc. 1980, 102, 92–98. [Google Scholar] [CrossRef]
  4. Schwartz, D.K. Mechanisms and kinetics of self-assembled monolayer formation. Annu. Rev. Phys. Chem. 2001, 52, 107–137. [Google Scholar] [CrossRef]
  5. Qian, L.M.; Tain, F.; Xiao, X.D. Tribological properties of self-assembled monolayers and their substrates under various humid environments. Tribol. Lett. 2003, 15, 169–176. [Google Scholar] [CrossRef]
  6. Khaskhoussi, A.; Calabrese, L.; Proverbio, E. Superhydrophobic self-assembled silane monolayers on hierarchical 6082 auminum alloy for anti-corrosion Applications. Appl. Sci. 2020, 10, 2656. [Google Scholar] [CrossRef] [Green Version]
  7. Turchanin, A. Graphene Growth by Conversion of Aromatic Self-Assembled Monolayers. Ann. Phys. 2017, 529, 1700168. [Google Scholar] [CrossRef] [Green Version]
  8. Xu, B.; Hung, S.-W.; Hu, A.Q.; Shao, C.; Guo, R.L.; Choi, J.H.; Kodama, T.; Chen, F.-R.; Shiomi, J. Scalable monolayer-functionalized nanointerface for thermal conductivity enhancement in copper/diamond composite. Carbon 2021, 175, 299–306. [Google Scholar] [CrossRef]
  9. Zschieschang, U.; Yamamoto, T.; Takimiya, K.; Kuwabara, H.; Ikeda, M.; Sekitani, T.; Someya, T.; Klauk, H. Organic electronics on banknotes. Adv. Mater. 2011, 23, 654–658. [Google Scholar] [CrossRef]
  10. Ojima, T.; Koto, M.; Itoh, M.; Imamura, T. Control of field-effect transistor threshold voltages by insertion of self-assembled monolayers. J. Appl. Phys. 2013, 113, 034501. [Google Scholar] [CrossRef]
  11. Singh, M.; Kaur, N.; Comin, E. The role of self-assembled monolayers in electronic devices. J. Mater. Chem. C 2020, 8, 3938–3955. [Google Scholar] [CrossRef]
  12. Kim, S.J.; Yoo, H.C. Self-assembled monolayers: Versatile uses in electronic devices from gate dielectrics, dopants, and biosensing linkers. Micromachines 2021, 12, 565. [Google Scholar] [CrossRef] [PubMed]
  13. Ito, Y.; Virkar, A.A.; Mannsfeld, S.; Oh, J.H.; Toney, M.; Locklin, J.; Bao, Z.N. Crystalline ultrasmooth self-assembled monolayers of alkylsilanes for organic field-effect transistors. J. Am. Chem. Soc. 2009, 131, 9396–9404. [Google Scholar] [CrossRef] [PubMed]
  14. Hild, R.; David, C.; Müller, H.U.; Völkel, B.; Kayser, D.R.; Grunze, M. Formation and characterization of self-assembled monolayers of octadecyltrimethoxysilane on chromium: Application in Low-Energy Electron Lithography. Langmuir 1998, 14, 342–346. [Google Scholar] [CrossRef]
  15. Wang, M.J.; Liechti, K.M.; Wang, Q.; White, J.M. Self-assembled silane monolayers: Fabrication with nanoscale uniformity. Langmuir 2005, 21, 1848–1857. [Google Scholar] [CrossRef]
  16. Zheng, W.; Chiang, C.-Y.; Underwood, I. Microchannel-flowed-plasma modification of octadecyltrichlorosilane self-assembled-monolayers for liquid crystal alignment. Thin Solid Film. 2013, 545, 371–374. [Google Scholar] [CrossRef]
  17. Sugimura, H.; Hanji, T.; Hayashi, K.; Takai, O. Surface modification of an organosilane self-assembled monolayer on silicon substrates using atomic force microscopy: Scanning probe electrochemistry toward nanolithography. Ultramicroscopy 2002, 91, 221–226. [Google Scholar] [CrossRef]
  18. Britt, D.W.; Hlady, V. Separating octadecyltrimethoxysilane hydrolysis and condensation at the air/water interface through addition of methyl stearate. J. Phys. Chem. B 1999, 103, 2749–2754. [Google Scholar] [CrossRef] [Green Version]
  19. Issa, A.A.; Luyt, A.S. Kinetics of alkoxysilanes and organoalkoxysilanes polymerization: A review. Polymers 2019, 11, 537. [Google Scholar] [CrossRef] [Green Version]
  20. Hanson, E.L.; Schwartz, J.; Nickel, B.; Koch, N.; Danisman, M.F. Bonding self-assembled, compact organophosphonate monolayers to the native oxide surface of silicon. J. Am. Chem. Soc. 2003, 125, 16074–16080. [Google Scholar] [CrossRef]
  21. Hashemi, F.S.M.; Prasittichai, C.; Bent, S.F. A New resist for area selective atomic and molecular layer deposition on metal–dielectric patterns. J. Phys. Chem. C 2014, 118, 10957–10962. [Google Scholar] [CrossRef]
  22. Bobb-Semple, D.; Nardi, K.L.; Draeger, N.; Hausmann, D.M.; Bent, S.F. Area-selective atomic layer deposition assisted by self-assembled monolayers: A comparison of Cu, Co, W. and Ru. Chem. Mater. 2019, 31, 1635–1645. [Google Scholar] [CrossRef]
  23. Nie, H.-Y.; Walzak, M.J.; McIntyre, N.S. Delivering octadecylphosphonic acid self-assembled monolayers onto a Si wafer and other oxide surfaces. J. Phys. Chem. B 2006, 110, 21101–21108. [Google Scholar] [CrossRef] [PubMed]
  24. Wu, L.; Cai, L.; Liu, A.Q.; Wang, W.; Yuan, Y.H.; Li, Z.X. Self-assembled monolayers of perfluoroalkylsilane on plasma-hydroxylated silicon substrates. Appl. Surf. Sci. 2015, 349, 683–694. [Google Scholar] [CrossRef]
  25. Tian, R.H.; Seitz, O.; Li, M.; Hu, W.C.; Chabal, Y.J.; Gao, J.M. Infrared characterization of interfacial Si-O bond formation on silanized flat SiO2/Si surfaces. Langmuir 2010, 26, 4563–4566. [Google Scholar] [CrossRef] [PubMed]
  26. Benninghoven, A. Chemical analysis of inorganic and organic surfaces and thin films by static time-of-flight secondary ion mass spectrometry (TOF-SIMS). Angew. Chem. Int. Ed. Engl. 1994, 33, 1023–1043. [Google Scholar] [CrossRef]
  27. Fletcher, J.S.; Lockyer, N.P.; Vaidyanathan, S.; Vickerman, J.C. TOF-SIMS 3D bio-molecular imaging of xenopus laevis oocytes using buckminsterfullerene (C60) primary ions. Anal. Chem. 2007, 79, 2199–2206. [Google Scholar] [CrossRef]
  28. Vickerman, J.C.; Winograd, N. SIMS—A precursor and partner to contemporary mass spectrometry. Int. J. Mass Spectrom. 2015, 377, 568–579. [Google Scholar] [CrossRef]
  29. Massonnet, P.; Heeren, R.M.A. A concise tutorial review of TOF-SIMS based molecular and cellular imaging. J. Anal. At. Spectrom. 2019, 34, 2217–2228. [Google Scholar] [CrossRef]
  30. Wolf, K.V.; Cole, D.A.; Bernasek, S.L. High-resolution TOF-SIMS study of varying chain length self-assembled monolayer surfaces. Anal. Chem. 2002, 74, 5009–5016. [Google Scholar] [CrossRef]
  31. Houssiau, L.; Bertrand, P. TOF–SIMS study of alkanethiol adsorption and ordering on gold. Appl. Surf. Sci. 2001, 175, 399–406. [Google Scholar] [CrossRef]
  32. Tencer, M.; Olivieri, A.; Tezel, B.; Nie, H.-Y.; Berini, P. Chip-scale electrochemical differentiation of SAM-coated gold features using a probe array. J. Electrochem. Soc. 2012, 159, J77–J82. [Google Scholar] [CrossRef] [Green Version]
  33. Dubey, M.; Weidner, T.; Gamble, L.J.; Castner, D.G. Structure and order of phosphonic acid-based self-assembled monolayers on Si(100). Langmuir 2010, 26, 14747–14754. [Google Scholar] [CrossRef] [PubMed] [Green Version]
  34. Nie, H.-Y. Revealing different bonding modes of self-assembled octadecylphosphonic acid monolayers on oxides by time-of-flight secondary ion mass spectrometry: Silicon vs aluminum. Anal. Chem. 2010, 82, 3371–3376. [Google Scholar] [CrossRef]
  35. Raghu, S.N.V.; Killian, M.S. Wetting behavior of zirconia nanotubes. RSC Adv. 2021, 11, 29585–29589. [Google Scholar] [CrossRef]
  36. Roberson, S.V.; Fahey, A.J.; Sehgal, A.; Karim, A. Multifunctional ToF-SIMS: Combinatorial mapping of gradient energy substrates. Appl. Surf. Sci. 2002, 200, 150–164. [Google Scholar] [CrossRef]
  37. Killian, M.S.; Seiler, S.; Wagener, V.; Hahn, R.; Ebensperger, C.; Meyer, B.; Schmuki, P. Interface chemistry and molecular bonding of functional ethoxysilane-based self-assembled monolayers on magnesium surfaces. ACS Appl. Mater. Interfaces 2015, 7, 9006–9014. [Google Scholar] [CrossRef] [PubMed]
  38. Nie, H.-Y.; McIntyre, N.S. Unstable amplitude and noisy image induced by tip contamination in dynamic force mode atomic force microscopy. Rev. Sci. Instrum. 2007, 78, 023701. [Google Scholar] [CrossRef]
  39. Sherman, R.; Whitlock, W. The removal of hydrocarbons and silicone grease stains from silicon wafers. J. Vac. Sci. Technol. 1990, 8, 563–567. [Google Scholar] [CrossRef]
  40. Cushman, C.V.; Zakel, J.; Sturgell, B.S.; Major, G.I.; Lunt, B.M.; Brüner, P.; Grehl, T.; Smith, N.J.; Linford, M.R. Time-of-flight secondary ion mass spectrometry of wet and dry chemically treated display glass surfaces. J. Am. Ceram. Soc. 2017, 100, 4770–4784. [Google Scholar] [CrossRef]
  41. Hurst, J.M.; Li, L.; Liu, H.T. Adventitious hydrocarbons and the graphite-water interface. Carbon 2018, 134, 464–469. [Google Scholar] [CrossRef]
  42. Kern, W. The evolution of silicon wafer cleaning technology. J. Electrochem. Soc. 1990, 137, 1887–1892. [Google Scholar] [CrossRef]
  43. Saga, K.; Hattori, T. Identification and removal of trace organic contamination on silicon wafers stared in plastic boxes. J. Electrochem. Soc. 1996, 143, 3279–3284. [Google Scholar] [CrossRef]
  44. Kyriakou, N.; Pizzoccaro-Zilamy, M.-A.; Nijmeijer, A.; Luiten-Olieman, M.; Winnubst, L. Hyd rolytic stability of PEG-grafted γ-alumina membranes: Alkoxysilane vs phosphonic acid linking groups. Microporous Mesoporous Mater. 2020, 307, 110516. [Google Scholar] [CrossRef]
  45. Gouzman, I.; Dubey, M.; Carolus, M.D.; Schwartz, J.; Bernasek, S.L. Monolayer vs. multilayer self-assembled alkylphosphonate films: X-ray photoelectron spectroscopy studies. Surf. Sci. 2006, 600, 773–781. [Google Scholar] [CrossRef]
  46. Luschtinetz, R.; Seifert, G.; Jaehne, E.; Adler, H.J.P. Infrared spectra of alkylphosphonic acid bound to aluminium surfaces. Macromol. Symp. 2007, 254, 248–253. [Google Scholar] [CrossRef]
  47. Tripp, C.P.; Hair, M.L. Direct observation of the surface bonds between self-assembled monolayers of octadecyltrichlorosilane and silica surfaces: A low-frequency IR study at the solid/lLiquid interface. Langmuir 1995, 11, 1215–1219. [Google Scholar] [CrossRef]
  48. Yamamoto, H.; Watanabe, T.; Ohdomari, I. A molecular simulation study of an organosilane self-assembled monolayer/SiO2 substrate interface. J. Chem. Phys. 2008, 128, 164710. [Google Scholar] [CrossRef]
  49. Roscioni, O.M.; Muccioli, L.; Mityashin, A.; Cornil, J.; Zannoni, C. Structural characterization of alkylsilane and fluoroalkylsilane self-assembled monolayers on SiO2 by molecular dynamics simulations. J. Phys. Chem. C 2016, 120, 14652–14662. [Google Scholar] [CrossRef]
Figure 1. Optical images showing a static water contact angle on a bare SiO2 substrate ultrasonically cleaned in methanol (a) and on OTMS SAMs formed on a SiO2 substrate subjected to UV/ozone treatment (b).
Applsci 12 04932 g001
Figure 2. AFM topographic images for a bare SiO2 substrate (a); OTMS SAMs with complete coverage prepared on a UV/ozone-treated SiO2 substrate (b); OTMS SAMs with partial coverage formed on a UV/ozone-treated SiO2 substrate (c); a freshly cleaved mica substrate (d). The broken line shown in each image indicates where a profile is isolated (and shown in Figure 3). The scan areas for (ad) are 5 µm × 5 µm and 2 µm × 2 µm, respectively. The heights for (ad) are 2.88, 3.02, 18.41 and 2.07 nm, respectively.
Applsci 12 04932 g002
Figure 3. Profiles (with offsets for clarity) isolated from the AFM images in Figure 2 for a bare SiO2 substrate (a); full-coverage OTMS SAMs prepared on a UV/ozone-treated SiO2 substrate (b); islands of OTMS SAMs formed on a UV/ozone-treated SiO2 substrate (c); a cleaved mica (d).
Applsci 12 04932 g003
Figure 4. Negative secondary ion mass spectra (m/z 11–100) for (a) pure OTMS molecules (placed on a polypropylene film); (b) a UV/ozone-treated SiO2 substrate; (c) OTMS SAMs prepared on a UV/ozone-treated SiO2 substrate. Ions indicated by a star (*) are associated with the OTMS headgroup, –Si(OCH3)3.
Applsci 12 04932 g004
Figure 5. Negative secondary ion mass spectra (m/z 35–95) for (a) pure OTMS (placed on a polypropylene film), (b) a UV/ozone-treated SiO2 substrate and (c) OTMS SAMs prepared on a UV/ozone-treated SiO2 substrate. Ions indicated by a star (*) are associated with the OTMS headgroup, –Si(OCH3)3.
Applsci 12 04932 g005
Figure 6. Negative secondary ion mass spectra (m/z 100–400) for (a) pure OTMS (placed on a polypropylene film); (b) a UV/ozone-treated SiO2 substrate; (c) OTMS SAMs prepared on a UV/ozone treated SiO2 substrate. Ions indicated by a star (*) are associated with the OTMS headgroup, –Si(OCH3)3.
Applsci 12 04932 g006
Figure 7. Positive secondary ion mass spectra (m/z 25–150) for (a) pure OTMS (placed on a polypropylene film); (b) a UV/ozone-treated SiO2 substrate; (c) OTMS SAMs prepared on a UV/ozone-treated SiO2 substrate. Ions indicated by a star are (*) associated with the OTMS headgroup, –Si(OCH3)3.
Applsci 12 04932 g007
Figure 8. Positive secondary ion mass spectra (m/z 150–400) for (a) pure OTMS (placed on a polypropylene film); (b) a UV/ozone-treated SiO2 surface; (c) OTMS SAMs prepared on a UV/ozone-treated SiO2 substrate. Ions indicated by a star (*) are associated with the OTMS headgroup, –Si(OCH3)3.
Applsci 12 04932 g008
Figure 9. An illustration showing an OTMS molecule and the hydrolysis of its methoxy groups, resulting in the formation of silanols (Si–OH) and the evaportation of methanol molecules. An OTMS monolayer is formed on a SiO2 substrate via the condensation reaction between silanols and hydroxyl groups from the substrate to anchor the molecule to the substrate and homocondensation reaction between silanols to establish the polymerized –Si–O–Si– network.
Applsci 12 04932 g009
Publisher’s Note: MDPI stays neutral with regard to jurisdictional claims in published maps and institutional affiliations.

