Article

Identification of Seasonal Honey Based on Quantitative Detection of Typical Pollen DNA

1
Department of Life Science, College of Fusion Science, Kyonggi University, 154-42, Gwanggyosan-ro, Yeongtong-gu, Suwon-si 16227, Gyeonggi-do, Korea
2
Parasitic and Honey Bee Disease Laboratory, Bacterial Disease Division, Animal and Plant Quarantine Agency, Gimcheon-si 39660, Gyeongsangbuk-do, Korea
3
Faculty of Biotechnology, Thai Nguyen University of Sciences, Tan Thinh Ward, Thai Nguyen 250000, Vietnam
*
Authors to whom correspondence should be addressed.
Appl. Sci. 2022, 12(10), 4846; https://doi.org/10.3390/app12104846
Submission received: 16 April 2022 / Revised: 29 April 2022 / Accepted: 6 May 2022 / Published: 11 May 2022
(This article belongs to the Section Agricultural Science and Technology)

Abstract

:
Monofloral honey is produced from the nectar of a single predominant botanical species in a particular season and has certain unique properties. Valuable monofloral honey produced in a particular season with unique properties is often targeted for adulteration. Herein, a method for the identification of monofloral honey and determination of its production season was developed. Major nectar plants, including Prunus sp., Robinia pseudoacacia, Castanea sp., and Kalopanax sp., were selected to evaluate the honey produced between April and July in South Korea. Results showed that the highest amount of DNA from each plant was detected in the corresponding flowering season. The pollens tended to accumulate in the honeycomb after the flowering season. The accumulations result in an increase in the diversity of pollen detected in honey. Additionally, DNA quantity of each plant decreased in the samples as the number of plant DNA types increased from May to July. Moreover, the authenticity of the commercial monofloral honey samples showed only cherry blossom honey was found authentic, which exhibited the expected high amount of Prunus sp. DNA. This molecular tool is expected to be useful in verifying the origin of monofloral honey and its production season.

1. Introduction

Honey has been widely consumed as a safe product by humans owing to its appreciable taste and health benefits; however, it has been targeted for economic fraud [1]. In general, monofloral honey is produced from the nectar of single predominant botanical species [2,3,4]. Some monofloral honeys are expensive because of their unique and medicinal properties, and it is conveniently targeted for adulteration by incorrect labeling or mixing with other cheaper honey samples [5,6,7,8]. Honey adulteration involves tricking consumers, leading to unfair competition in the market share [9].
Pollen that remains in honey has been used as an indicator of the floral origin of honey as well as the harvest season. The melissopalynology method was used to identify botanical species based on pollen morphology observed using light microscopy [10,11,12]. However, this low-cost method must be conducted by a botanical specialist and is time-consuming to observe and distinguish all the pollens by microscopy [13]. In addition, the reference data for species identification using pollen is scarce [14]. Therefore, an alternative method based on molecular detection was developed to authenticate the botanical origin of honey [15,16,17]. The method was performed using specific primer for PCR amplification and the reference sequences from databank for species identification. Consequently, detection of specific plant species based on the DNA that is isolated from the pollen in honey is considered as a reliable method for the accurate determination of honey’s origin. In addition, several samples can be analyzed in one PCR performance by a molecular technician. Therefore, time spent for species identification in collected pollens can be saved. Several methods have been developed to improve DNA isolation from pollen in honey, such as breaking the cell wall of collected pollens by ultrasonication or vortexing with glass beads and followed by DNA isolation using Nucleospin, DNeasy, Wizard, or CTAB method [18,19].
In South Korea, beekeeping has important contribution to the national economy. The number of honey bee colony was 1,756,993, and annual value of honey product was estimated with around USD 535 million in 2013 [20,21]. The number of colonies increased to 2,697,842 in 2020 and the value of beekeeping industry was estimated with approximately USD 5.5 billion [21,22]. Around 555 honey plant species were identified in the country, of which cherry blossom (Prunus sp.), false acacia (Robinia pseudoacacia), chestnut (Castanea sp.), and aralia (Kalopanax sp.) flower were identified to bloom within two weeks and majorly provide nectar and pollen to honey bees to produce corresponding monofloral honey in April to July, respectively [23,24,25]. Therefore, the monofloral honey of the four plant species are popular in the country, in which false acacia honey accounts for 70% of honey production in the country annually [23,24].
In the present study, we attempted to develop a method to authenticate the origin of monofloral honey and the season during which it was produced. The quantity of DNA in the natural honey samples was determined and compared to identify the major source of nectar in each sample.

2. Materials and Methods

2.1. Selection of Major Nectar Plants

The predominant seasonal nectar plants in South Korea were selected for their quantitative detection in the honey samples collected between April and July [25]. These plants species included Prunus sp., Robinia pseudoacacia, Castanea sp., and Kalopanax sp., and these plants have flowering period within April, May, June, and July, respectively [25].

2.2. Honey Samples

Five natural honey samples were collected from five different colonies from the same apiary of Kyonggi University (Suwon, Korea) every month from April to July. In total, 20 samples were collected and used for the quantitative analysis of targeted plants. Honey samples of each target plant were collected at the end of flowering season by spinning honey comb in a honey extractor for 5 min (Table 1). Four commercial monofloral honey samples obtained from Prunus sp., Robinia pseudoacacia, Castanea sp., and Kalopanax sp. were also used for analysis (Supplementary Material Table S1).

2.3. DNA Extraction

Pollen was collected from the honey samples for DNA isolation according to the previously described methods [19,26]. Honey samples (10 mL of each) were collected in conical tubes, and distilled water (20 mL) was added to each tube. The mixtures were vortexed for 30 s. More water was added, and the volume was adjusted to 45 mL. After incubating and stirring at 40 °C for 10 min, the pollen was collected by centrifugation at 11,000× g for 10 min, and the supernatant was discarded. DNA was isolated using DNeasy Plant Mini Kit (QIAGEN). The pellet with the pollen was suspended in a lysis buffer (400 µL) and transferred to a 1.5 mL microcentrifuge tube (Eppendorf). Nine glass beads were added, and the solution was vortexed for 1 min. The solution was transferred to a new 1.5 mL microcentrifuge tube. After adding 4 µL RNase A and briefly vortexing, the solution was incubated at 65 °C for 10 min. The following steps for DNA purification were performed according to the manufacturer’s instructions. Finally, 80 µL of the DNA solution was acquired from each honey sample.

2.4. Primer Design and Standard DNA Construction

Primers were designed for the detection of chloroplast DNA from the target plants. Chloroplast DNA fragments with National Center for Biotechnology Information (NCBI) accession No.: KU985054 (Prunus sp.), KJ468102 (Robinia pseudoacacia), MH998384 (Castanea sp.), and AY393733 (Kalopanax sp.) were retrieved from GenBank and used for sequence similarity searching using the Basic Local Alignment Search Tool (BLAST) [27]. Sequences of the targeted and closely related plants with high similarity were selected for subsequent alignment using Clustal X version 2.0 [28] to design specific primers for each target plant. The four detection primer pairs have been listed in Table 2. Standard DNA fragments of each target plant were amplified directly from the plant samples and inserted into the pBlueXcm plasmid [29] to construct recombinant plasmids.

2.5. Polymerase Chain Reaction

PCR for amplification of the standard DNA obtained from the plant samples was performed under the following conditions: 95 °C for 5 min, 35 cycles at 95 °C for 30 s, 54 °C for 30 s, 72 °C for 30 s, and 72 °C for 7 min. AccuPower® PCR PreMix (BIONEER, Daejeon, Korea) and a conventional PCR machine were used.
Quantitative PCR for specific detection of the nectar plant from the honey samples was conducted using a UF-150 GENECHECKER® PCR machine (Genesystem Co., Ltd., Daejeon, Korea) and 2× Detect Master Mix reagent with fluorescent dye (SYBR green; Genesystem Co., Ltd.). The PCR conditions were as follows: 95 °C for 30 s, 50 cycles at 95 °C for 4 s, and at annealing temperature for 4 s and 72 °C for 4 s. The annealing temperature of each primer pair has been listed in Table 2.

2.6. Standard Curves for DNA Copy Number Estimation

Recombinant DNA sample of each targeted plant was serially diluted to 10 folds from 2.91 × 10⁸ to 2.91 (Prunus sp.), 2.83 × 10⁸ to 2.83 (Robinia pseudoacacia), 2.84 × 10⁸ to 2.84 (Castanea sp.), and 2.72 × 10⁸ to 2.72 (Kalopanax sp.) copies/µL, and 1 µL of each concentration was used for PCR. PCR was performed independently in triplicate. Standard curves for the detection of each target were established based on the relationship between the log10 of the initial DNA copy number and corresponding cycle threshold (Ct) of the amplification.

3. Results

3.1. Standard Linear Regression Curves and Limit of Detection

A minimum number of initial DNA copy of each target for stable amplification was determined. For instance, 29.1, 2.83, 28.4, and 27.2 copies of recombinant DNA samples of Prunus sp., R. pseudoacacia, Castanea sp., and Kalopanax sp. were observed, respectively.
The standard linear regression curves representing the relationship between the initial DNA copy number and Ct value were procured based on the amplification using serial dilutions of each recombinant DNA sample. For instance, y = −3.6341x + 45.049, R2 = 0.996 (Prunus sp.); y = −2.9661x + 37.786, R2 = 0.997 (R. pseudoacacia); y = −4.3563x + 52.247, R2 = 0.9934 (Castanea sp.), and y = −3.5549x + 43.6, R2 = 0.9939 (Kalopanax sp.) were observed, where x and y are the log10 of the initial DNA copy number and the corresponding Ct value of the amplification. Linear regression curves were used to calculate the copy number of the DNA samples.

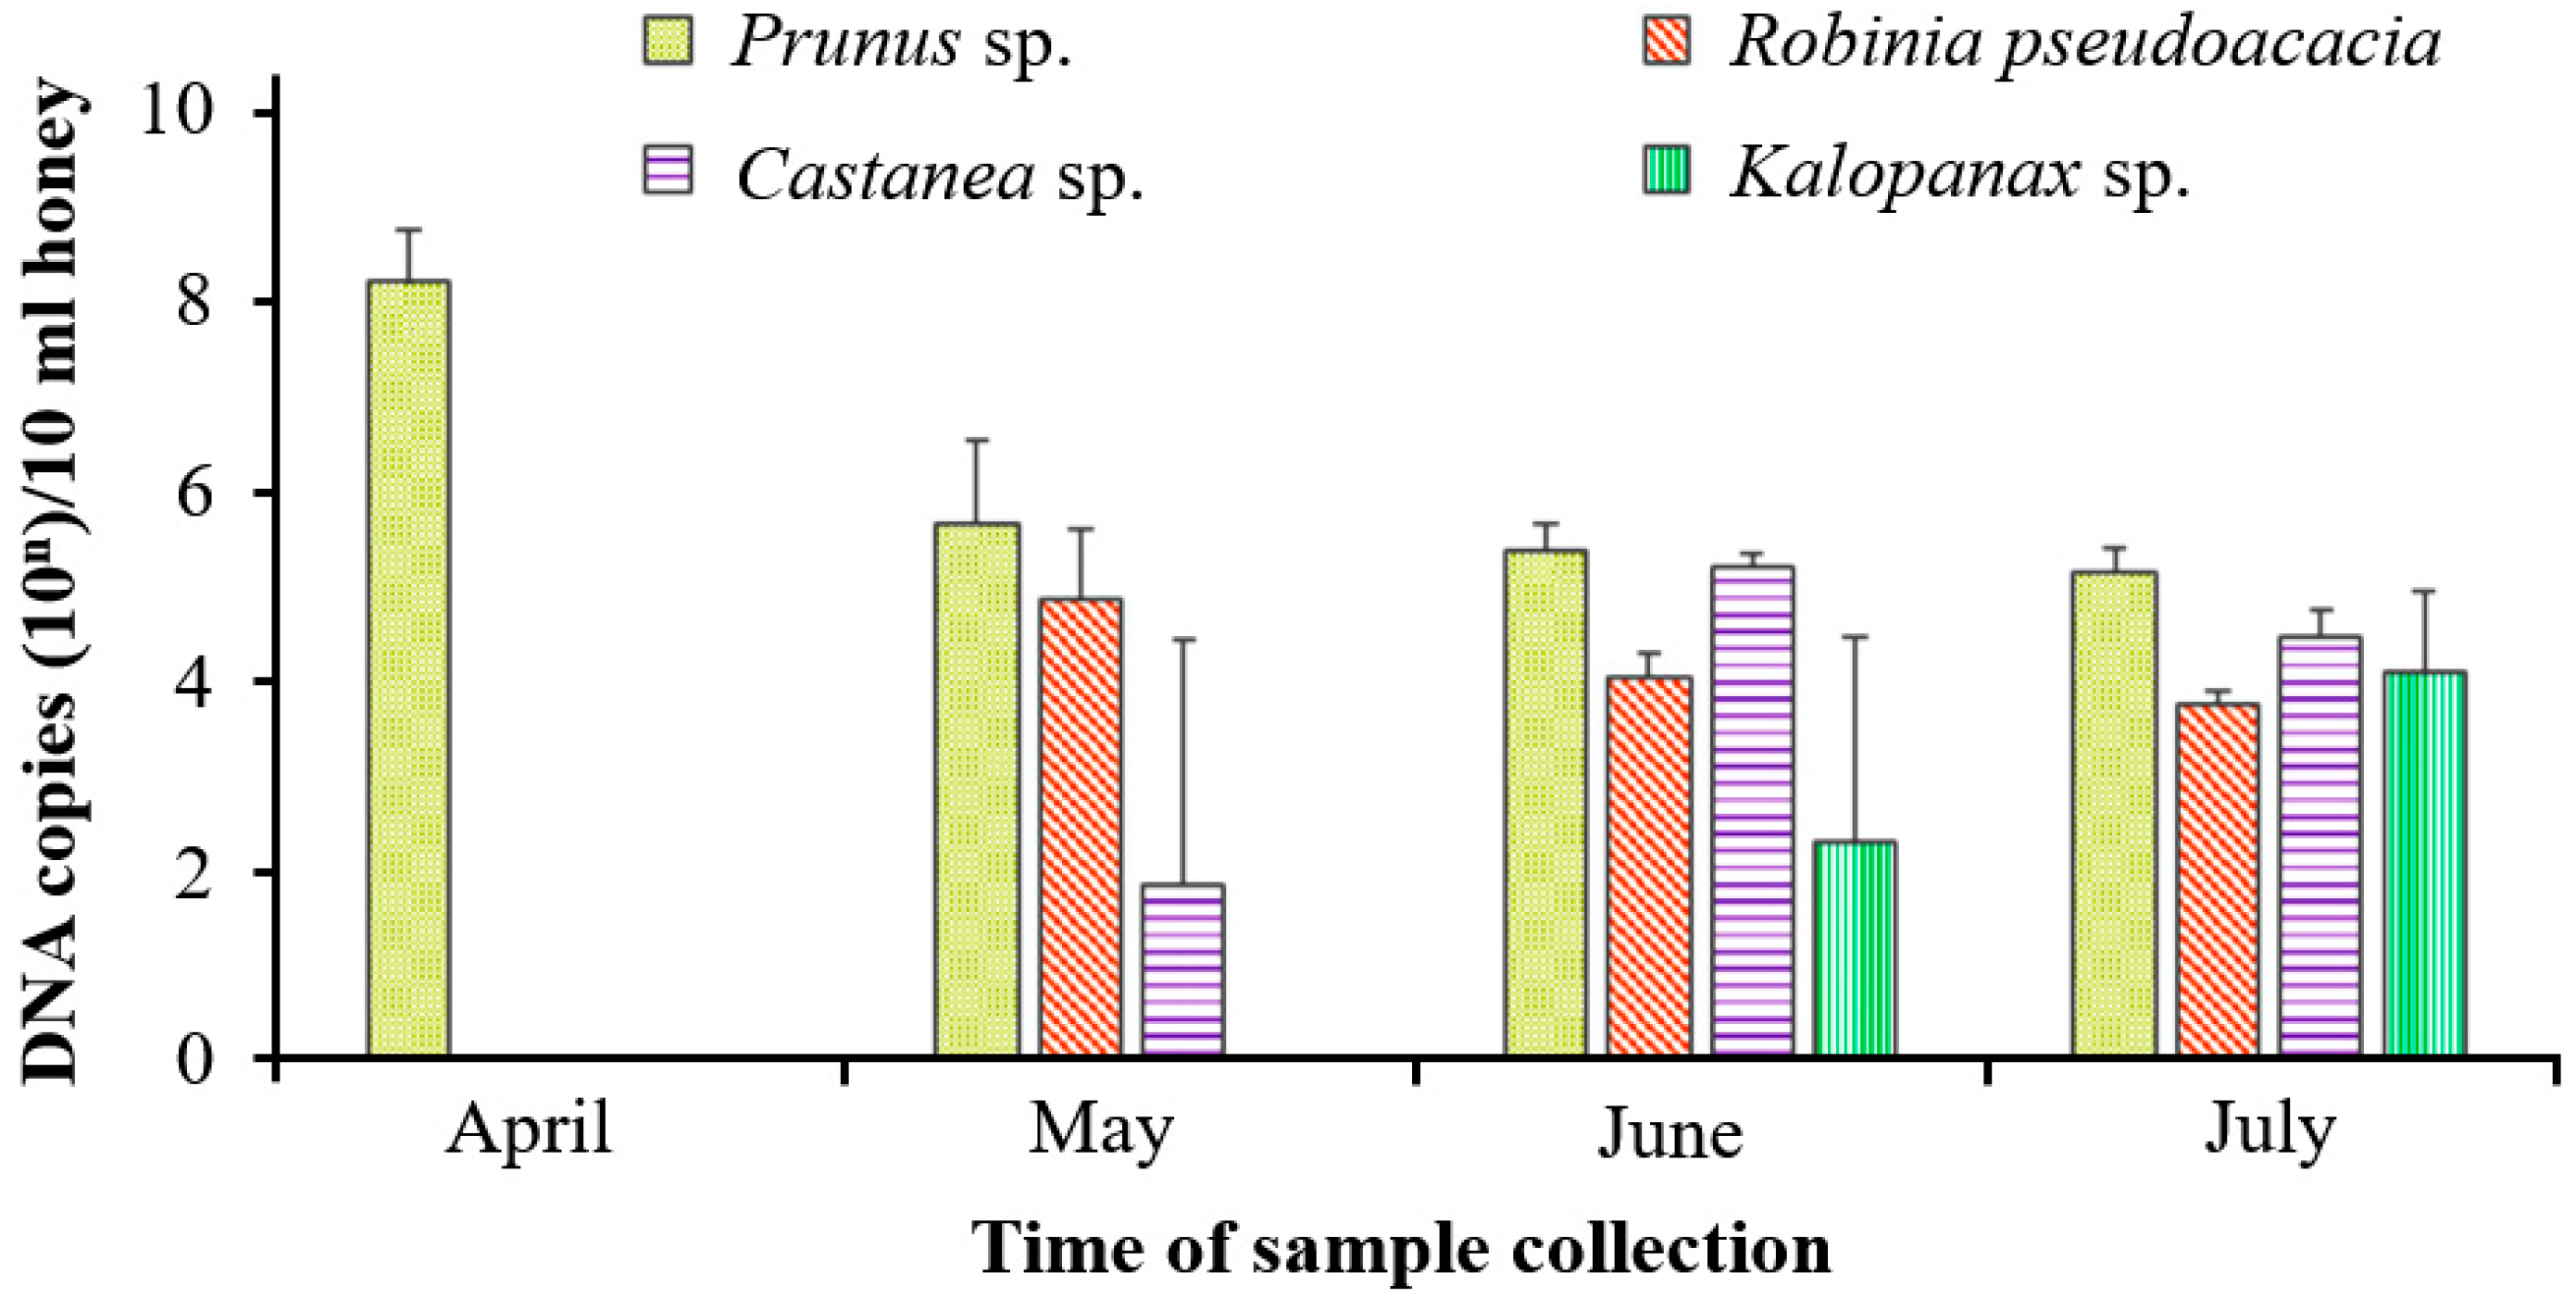
3.2. Quantification of the Target Pollen DNA in Natural Honey Samples

PCR-based analysis revealed that the honey samples collected on 22 April contained pollen exclusively from Prunus sp., and Robinia pseudoacacia pollens were detected in the honey sample collected in May. Pollens of Castanea and Kalopanax plants were mainly detected in honey produced in June and July, respectively (Table 3). The average DNA copy number calculated for 10 mL honey samples collected from April to July for Prunus spp. decreased from 1.73 × 10⁸ to 1.47 × 10⁵, while for R. pseudoacacia, it decreased from 7.67 × 10⁴ to 5.83 × 10³ from May to July. For Castanea sp., the DNA copy numbers were detected at the end of May, that is, 7.33 × 101 copies; subsequently, the copy number reached its peak at the end of June, that is, 1.61 × 10⁵ copies. Finally, it decreased to 3.03 × 10⁴ copies at the end of July. For Kalopanax sp., the DNA copy numbers were detected at the end of June, that is, 2.13 × 10² copies were observed, which increased to 1.32 × 10⁴ copies at the end of July (Figure 1).

3.3. Detection of the Targeted Pollen DNA in Commercial Honey Samples

Pollen DNA corresponding to the four targeted plants was detected in the four monofloral honey samples. Cherry blossom honey samples contained Prunus sp. and R. pseudoacacia pollens, while four targeted plants were seen in false acacia and aralia honey samples. Chestnut honey samples contained pollens corresponding to three (Robinia pseudoacacia, Castanea sp., and Kalopanax sp.) out of the four targeted plants (Figure 2).
The quantity of plant DNA was calculated for each sample. Cherry blossom honey sample exhibited the highest amount of Prunus sp. DNA (1.39 × 10⁵ copies/10 mL honey) and a low amount of R. pseudoacacia DNA (1.07 × 10² copies/10 mL honey). Therefore, this honey sample was verified as cherry blossom monofloral honey with a major amount of Prunus pollen, and this honey was probably produced in late April when the R. pseudoacacia was at its early stage of flowering (Figure 2).
In false acacia honey (R. pseudoacacia), the highest amount of Kalopanax sp. DNA (1.65 × 10⁶ copies/10 mL honey) was detected, and lower amounts of Castanea sp. DNA (5.99 × 10⁵ copies/10 mL honey), R. pseudoacacia DNA (6.09 × 10⁴ copies/10 mL honey), and Prunus sp. DNA (3.53 × 10³ copies/10 mL honey) were observed. Similar DNA composition was observed in chestnut honey sample (Castanea sp.). Therefore, the two honey samples were possibly mislabeled. In aralia (Kalopanax sp.) honey sample, Castanea sp. DNA was prominent, and the lowest amount of Kalopanax sp. DNA was observed (Figure 2).

4. Discussion

The Prunus plants mainly provide honeybees with nectar and pollen after the critical winter season in South Korea. Consequently, a high quantity of Prunus pollen was accumulated in the honey sample collected in April (Figure 1). Therefore, the identification of cherry blossom (Prunus sp.) honey based on quantification of its pollen was easier compared to that of the other honey samples collected from May to July owing to the diverse sources of pollen accumulated in the honeycomb in these months (Figure 1). Such accumulation could lead to little pollen collection in the following months [30,31]. In addition, honeybees tend to consume the newly stored pollens [32]. Therefore, the older accumulated pollens could be remained in the hive for a long time. These accumulation leads to the difficulty of monofloral honey identification by melissopalynology method.
Although the pollen spectrum of each specific monofloral honey sample is different, which ranges from 15% in lavender honey to >45% in chestnut honey [33,34,35,36], such pollen deposition makes the identification of dominant pollen present in the honey difficult and influences the accurate identification of botanical origin of honey based on the total collected pollens [37,38]. Therefore, pollen-based parameters are not sufficient to accurately identify monofloral honey samples. A combination of pollen determination with other techniques is necessary [39], such as analysis of specific protein patterns [12], mineral content, physicochemical parameters [40], or aroma compounds by dynamic headspace extraction and gas chromatography-mass spectrometry [41]. Furthermore, identification of total pollen DNA in combination with bacterial and fungal taxa using DNA metabarcoding and metagenomic differentiation could be helpful [42,43].
The presence of plant species detected in the collected samples confirmed that the flowering periods of the four target plants were consistent with those proposed by Ryu and Jang 2007 [25], and the presence of a plant species in the honey sample that has a different flowering season could be a simple and rapid method for identification of adulterated monofloral honey, such as the presence of Kalopanax sp. (blooming in July) in the false acacia honey (R. pseudoacacia, blooming in May). However, the honey produced in June and July contain the pollens of diverse species due to the accumulation of pollens. Therefore, the standard index of pollen spectrum and other physicochemical parameters of these monofloral honeys should be determined in further study.
DNA markers was used as one of the important methods for identification of the valuable manuka monofloral honey [44]. However, detection of pollen DNA of a single plant species was not sufficient to determine the monofloral due to the stored pollens present in honeycomb after the flowering season or adulteration by mixing targeted pollen with pure honey [39]. Therefore, multiplex qPCR using primers targeting on major nectar plants that typically bloom in successive months in a particular region could be helpful to identify the time of honey production and monofloral honey.

5. Conclusions

A molecular method was developed for identifying the change of pollen DNA from major nectar plants belonging to Prunus, Robinia, Castanea, and Kalopanax in honey samples collected from April to July in South Korea. Quantitative-analysis-based identification of pollens from plants with different blooming times in honey samples collected in successive months was useful to determine the approximate time of production of honeys. Additionally, the study revealed that the pollens accumulate in the honeycomb after the flowering season. Such accumulations result in an increase in the diversity of pollen detected in honey, which makes it difficult to determine its dominant pollen source. Therefore, the determination of monofloral honey relying only on the quantity of a single target pollen is not sufficient. The results of this study suggest that molecular detection of the seasonal nectar plants in successive months could be helpful to confirm the geographical origin of honey and to improve the accuracy of monofloral honey identification by confirming the presence or absence of plant with majorly seasonal nectar source.

Supplementary Materials

The following supporting information can be downloaded at: https://www.mdpi.com/article/10.3390/app12104846/s1, Table S1: Commercial monofloral honeys used for analysis of targeted plant species.

Author Contributions

Conceptualization, A.-T.T. and B.Y.; methodology, A.-T.T.; validation, A.-T.T., Y.S.C. and M.-S.Y.; formal analysis, A.-T.T.; data curation, A.-T.T.; writing—original draft preparation, A.-T.T.; writing—review and editing, A.-T.T. and Y.S.C.; supervision, B.Y.; project administration, B.Y.; funding acquisition, B.Y. and Y.S.C. All authors have read and agreed to the published version of the manuscript.

Funding

This research was funded by the Animal and Plant Quarantine Agency in the Republic of Korea, grant number B-1543081-2019-21-03.

Institutional Review Board Statement

Not applicable.

Informed Consent Statement

Not applicable.

Data Availability Statement

The data presented in this study can be requested from the corresponding authors.

Conflicts of Interest

The authors declare no conflict of interest.

References

  1. García, N.L. The Current Situation on the International Honey Market. Bee World 2018, 95, 89–94. [Google Scholar] [CrossRef]
  2. Andrade, P.B.; Amaral, M.T.; Isabel, P.; Carvalho, J.C.M.F.; Seabra, R.M.; da Cunha, A.P. Physicochemical attributes and pollen spectrum of Portuguese heather honeys. Food Chem. 1999, 66, 503–510. [Google Scholar] [CrossRef] [Green Version]
  3. Manzanares, A.B.; García, Z.H.; Galdón, B.R.; Rodríguez-Rodríguez, E.M.; Romero, C.D. Physicochemical characteristics and pollen spectrum of monofloral honeys from Tenerife, Spain. Food Chem. 2017, 228, 441–446. [Google Scholar] [CrossRef]
  4. Corvucci, F.; Nobili, L.; Mellucci, D.; Grillenzoni, F.V. The discrimination of honey origin using melissopalynology and Raman spectroscopy techniques coupled with multivariate analysis. Food Chem. 2015, 169, 297–304. [Google Scholar] [CrossRef]
  5. El-Senduny, F.F.; Hegazi, N.M.; Elghani, G.E.A.; Farag, M.A. Manuka honey, a unique mono-floral honey. A comprehensive review of its bioactives, metabolism, action mechanisms, and therapeutic merits. Food Biosci. 2021, 42, 101038. [Google Scholar] [CrossRef]
  6. Ahmed, S.; Othman, N.H. Review of the medicinal effects of tualang honey and a comparison with manuka honey. Malays. J. Med. Sci. 2013, 20, 6–13. [Google Scholar]
  7. Yaghoobi, R.; Kazerouni, A.; Kazerouni, O. Evidence for clinical use of honey in wound healing as an anti-bacterial, anti-inflammatory, anti-oxidant and anti-viral agent: A review. Jundishapur. J. Nat. Pharm. Prod. 2013, 8, 100–104. [Google Scholar] [CrossRef] [Green Version]
  8. Ronsisvalle, S.; Lissandrello, E.; Fuochi, V.; Petronio, P.G.; Straquadanio, C.; Crascì, L.; Panico, A.; Milito, M.; Cova, A.M.; Tempera, G.; et al. Antioxidant and antimicrobial properties of Casteanea sativa Miller chestnut honey produced on Mount Etna (Sicily). Nat. Prod. Res. 2019, 33, 843–850. [Google Scholar] [CrossRef]
  9. Bogdanov, S.; Martin, P. Honey authenticity. Mitteilungen aus Lebensmitteluntersuchung und Hygiene 2002, 93, 232–254. [Google Scholar]
  10. Hailu, D.; Belay, A. Melissopalynology and antioxidant properties used to differentiate Schefflera abyssinica and polyfloral honey. PLoS ONE 2020, 15, e0240868. [Google Scholar] [CrossRef]
  11. Bobi, O.; Mãrghita, L.A.; Dezmirean, D.S.; Bãrnuiu, L.I.; Mãrgãoan, R.; Bogdan Gherman, B.; Bonta, V. The Importance of melissopalynology in addition to physical-chemical analysis on botanical authenticity testing of monofloral honey. Bull. UASVM Anim. Sci. Biotechnol. 2013, 70, 24–30. [Google Scholar]
  12. Mureșan, C.I.; Cornea-Cipcigan, M.; Suharoschi, R.; Erler, S.; Mărgăoan, R. Honey botanical origin and honey-specific protein pattern: Characterization of some European honeys. LWT 2022, 154, 112883. [Google Scholar] [CrossRef]
  13. Olivieri, C.; Marota, I.; Rollo, F.; Luciani, S. Tracking plant, fungal, and bacterial DNA in honey specimens. J. Forensic Sci. 2012, 57, 222–227. [Google Scholar] [CrossRef] [PubMed]
  14. Bagella, S.; Satta, A.; Floris, I.; Caria, M.C.; Rossetti, I.; Podani, J. Effects of plant community composition and flowering phenology on honeybee foraging in Mediterranean sylvo-pastoral systems. Appl. Veg. Sci. 2013, 16, 689–697. [Google Scholar] [CrossRef]
  15. Bruni, I.; Galimberti, A.; Caridi, L.; Scaccabarozzi, D.; De Mattia, F.; Casiraghi, M.; Labra, M. A DNA barcoding approach to identify plant species in multiflower honey. Food Chem. 2015, 170, 308–315. [Google Scholar] [CrossRef]
  16. Puścion-Jakubik, A.; Borawska, M.H.; Socha, K. Modern Methods for Assessing the Quality of Bee Honey and Botanical Origin Identification. Foods 2020, 9, 1028. [Google Scholar] [CrossRef]
  17. Soares, S.; Grazina, L.; Costa, J.; Amaral, J.S.; Maria, B.P.P.; Oliveira, M.B.P.P.; Mafra, I. Botanical authentication of lavender (Lavandula spp.) honey by a novel DNA-barcoding approach coupled to high resolution melting analysis. Food Control 2018, 86, 367–373. [Google Scholar] [CrossRef] [Green Version]
  18. Manivanan, P.; Rajagopalan, S.M.; Subbarayalu, M. Studies on authentication of true source of honey using pollen DNA barcoding. J. Entomol. Zool. Stud. 2018, 6, 255–261. [Google Scholar]
  19. Soares, S.; Amaral, J.S.; Oliveira, M.B.P.P.; Mafra, I. Improving DNA isolation from honey for the botanical origin identification. Food Control 2015, 48, 130–136. [Google Scholar] [CrossRef] [Green Version]
  20. Kohsaka, R.; Park, M.S.; Uchiyama, Y. Beekeeping and honey production in Japan and South Korea: Past and present. J. Ethn. Foods 2017, 4, 72–79. [Google Scholar] [CrossRef]
  21. Korean Beekeeping Association. Statistical Survey of Korean Beekeeping Industry. Available online: https://korapis.or.kr/jsp/sub3-1_01.jsp (accessed on 29 April 2022).
  22. Truong, A.-T.; Yoo, M.S.; Yun, B.R.; Kang, J.E.; Noh, J.; Hwang, T.J.; Seo, S.K.; Yoon, S.S.; Cho, Y.S. Prevalence and pathogen detection of Varroa and Tropilaelaps mites in Apis mellifera (Hymenoptera, Apidae) apiaries in South Korea. J. Apic. Res. 2022. [Google Scholar] [CrossRef]
  23. Kim, Y.K.; Kim, M.S.; Nam, J.I.; Song, J.H.; Kim, S.H. Analysis on floral nectar characteristics among the selected black locust (Robinia spp.) individuals. J. Apic. Res. 2021. [Google Scholar] [CrossRef]
  24. Jung, C.; Cho, S.K. Relationship between honey bee population and honey production in Korea: A historical trend analysis. Korean J. Apic. 2015, 30, 7–12. [Google Scholar]
  25. Ryu, J.; Jang, J. Major Nectar Plant for Beekeeping in Korea; Fuzzycom Media: Daegu, Korea, 2007. [Google Scholar]
  26. Kamo, T.; Kusumoto, Y.; Tokuoka, Y.; Okubo, S.; Hayakawa, H.; Yoshiyama, M.; Kimura, K.; Konuma, A. A DNA barcoding method for identifying and quantifying the composition of pollen species collected by European honeybees, Apis mellifera (Hymenoptera: Apidae). Appl. Entomol. Zool. 2018, 53, 353–361. [Google Scholar] [CrossRef] [Green Version]
  27. Johnson, M.; Zaretskaya, I.; Raytselis, Y.; Merezhuk, Y.; McGinnis, S.; Madden, T.L. NCBI BLAST: A better web interface. Nucleic Acids Res. 2008, 36, W5–W9. [Google Scholar] [CrossRef]
  28. Larkin, M.A.; Blackshields, G.; Brown, N.P.; Chenna, R.; McGettigan, P.A.; McWilliam, H.; Valentin, F.; Wallace, I.M.; Wilm, A.; Lopez, R.; et al. Clustal W and Clustal X version 2.0. Bioinformatics 2007, 23, 2947–2948. [Google Scholar] [CrossRef] [Green Version]
  29. Holton, T.A.; Graham, M.W. A simple and efficient method for direct cloning of PCR products using ddT-tailed vectors. Nucleic Acids Res. 1991, 19, 1156. [Google Scholar] [CrossRef] [Green Version]
  30. Pires, J.; Estevinho, M.L.; Feas, X.; Cantalapiedra, J.; Iglesias, A. Pollen spectrum and physico-chemical attributes of heather (Erica sp.) honeys of north Portugal. J. Sci. Food Agric. 2009, 89, 1862–1870. [Google Scholar] [CrossRef] [Green Version]
  31. Soares, S.; Amaral, J.S.; Oliveira, M.B.P.P.; Mafra, I. A comprehensive review on the main honey authentication issues: Production and origin. Compr. Rev. Food Sci. Food Saf. 2017, 16, 1072–1100. [Google Scholar] [CrossRef] [Green Version]
  32. Carroll, M.J.; Brown, N.; Goodall, C.; Downs, A.M.; Sheenan, T.H.; Anderson, K.E. Honey bees preferentially consume freshly-stored pollen. PLoS ONE 2017, 12, e0175933. [Google Scholar] [CrossRef] [Green Version]
  33. Bouseta, A.; Scheirman, V.; Collin, S. Flavor and free amino acid composition of lavender and eucalyptus honeys. J. Food Sci. 1996, 61, 683–687. [Google Scholar] [CrossRef]
  34. Gomes, T.; Feás, X.; Iglesias, A.; Estevinho, L.M. Study of organic honey from the northeast of Portugal. Molecules 2011, 16, 5374–5386. [Google Scholar] [CrossRef] [PubMed]
  35. Gune, M.E.; Şahin, S.; Demir, C.; Borum, E.; Tosunoglu, A. Determination of phenolic compounds profile in chestnut and floral honeys and their antioxidant and antimicrobial activities. J. Food Biochem. 2016, 41, e12345. [Google Scholar] [CrossRef]
  36. Louveaux, J.; Maurizio, A.; Vorwohl, G. Methods of melissopalynology. Bee World 1978, 59, 139–157. [Google Scholar] [CrossRef]
  37. Milla, L.; Schmidt-Lebuhn, A.; Bovill, J.; Encinas-Viso, F. Monitoring of honey bee floral resources with pollen DNA metabarcoding as a complementary tool to vegetation surveys. Ecol. Solut. Evid. 2022, 3, e12120. [Google Scholar] [CrossRef]
  38. Utzeri, V.J.; Ribani, A.; Schiavo, G.; Bertolini, F.; Bovo, S.; Fontanesi, L. Application of next generation semiconductor based sequencing to detect the botanical composition of monofloral, polyfloral and honeydew honey. Food Control 2018, 86, 342–349. [Google Scholar] [CrossRef]
  39. Chin, N.L.; Sowndhararajan, K. A Review on Analytical Methods for Honey Classification, Identification and Authentication. In Honey Analysis—New Advances and Challenges; de Alencar Arnaut de Toledo, V., Chambó, E.D., Eds.; IntechOpen: London, UK, 2020. [Google Scholar]
  40. Voyslavov, T.; Mladenova, E.; Balkanska, R. A new approach for determination of the botanical origin of monofloral bee honey, combining mineral content, physicochemical parameters, and self-organizing maps. Molecules 2021, 26, 7219. [Google Scholar] [CrossRef]
  41. Bianchi, F.; Careri, M.; Musci, M. Volatile norisoprenoids as markers of botanical origin of Sardinian strawberry-tree (Arbutus unedo L.) honey: Characterization of aroma compounds by dynamic headspace extraction and gas chromatography-mass spectrometry. Food Chem. 2005, 89, 527–532. [Google Scholar] [CrossRef]
  42. Prosser, S.W.J.; Hebert, P.D.N. Rapid identification of the botanical and entomological sources of honey using DNA metabarcoding. Food Chem. 2017, 214, 183–191. [Google Scholar] [CrossRef]
  43. Wirta, H.; Abrego, N.; Miller, K.; Roslin, T.; Vesterinen, E. DNA traces the origin of honey by identifying plants, bacteria and fungi. Sci. Rep. 2021, 11, 4798. [Google Scholar] [CrossRef]
  44. McDonald, C.M.; Keeling, S.E.; Brewer, M.J.; Hathaway, S.C. Using chemical and DNA marker analysis to authenticate a high-value food, manuka honey. NPJ Sci. Food 2018, 2, 9. [Google Scholar] [CrossRef] [PubMed]
Figure 1. Quantity of pollen DNA of the targeted plants in the honey samples. The quantity of DNA of each targeted plant is the average number of DNA copies calculated from five samples collected each month (mean + standard deviation).
Applsci 12 04846 g001
Figure 2. Quantitative detection of pollen DNA of four targeted plants in commercial honey samples. The quantity of DNA corresponding to Prunus sp., R. pseudoacacia, Castanea sp., and Kalopanax sp. was calculated from the monofloral honey samples of cherry blossom, false acacia, chestnut, and aralia, respectively, purchased in Korea. The result was calculated from triplicate PCRs (mean + standard deviation).
Applsci 12 04846 g002
Table 1. Natural honey samples collected for identification of the nectar source.
No.Collection DateNumber of SamplesExpected Major Nectar Plant
122 April 20195Prunus sp.
230 May 20195Robinia pseudoacacia
330 June 20195Castanea sp.
430 July 20195Kalopanax sp.
Table 2. Primers used for detection of seasonal nectar plants.
No.PrimerSequence
(5′-3′)
Annealing (°C)Target PlantTarget GeneAmplicon Size (bp)Reference
1Pruchlo-FGGTGTACTCTTTCTTCGAGT53Prunus sp.ndhF-rpl32205This study
Pruchlo-RGAAGTTGATAAAATACAATAC
2Acasia-FGTGGTGGAACAAAATATCTAGA58Robinia pseudoacaciarpoC2299
Acasia-RAACGATTTGTTACCGAGCTT
3Castanea-FCCATGGACCGTATTCTTCG61Castanea sp.atpI286
Castanea-RAGAGGGCAATATGAAATTATG
4Kalopana-FACGAAAGAATCGAATATCGA57Kalopanax sp.trnL-trnF435
Kalopana-RGCGAGTTTCAGTATGAATAATT
Table 3. Detection of the seasonal nectar plants from the honey samples.
Target PlantTime of Sample Collection
AprilMayJuneJuly
1 *2345123451234512345
Prunus sp.++++++++++++++++++++
Robinia pseudoacacia+++++++++++++++
Castanea sp.++++++++++++
Kalopanax sp.+++++++
* Numbers 1–5 indicate the five different honey samples collected each month. (+) and (−) indicate presence and absence, respectively.
Publisher’s Note: MDPI stays neutral with regard to jurisdictional claims in published maps and institutional affiliations.

