1. Introduction
Quality healthcare is a basic human right, but one which fails to be provided adequately worldwide. The economic, environmental, and social development of this world and the subsequent lifestyle changes have led to a drastic increase in chronic diseases such as heart illness, cancer, and diabetes. This now symbolizes the greatest threat to human health. Apart from that, each time an infectious disease breaks out, the hospitals are flooded with people. Developing countries of Asia like Pakistan lack an efficient healthcare infrastructure and thus are gravely affected in such situations [
1].
The evolution of Artificial Intelligence (AI) has also contributed massively to classifying and predicting the health status of patients based on their physiological parameters. These parameters may be extracted through different sensors that measure biological signals [
2]. Furthermore, computational intelligence on health data enables us to foresee and predict the possibility of heart diseases. The Internet of Things (IoT) has further revolutionized the IT sector and has had a direct effect on the medical sector. It has allowed researchers to develop mobile health monitoring devices that record vital health parameters on a configured basis. Such systems allow medical providers to remotely monitor their patients and oversee their treatment. The IoT technology has eliminated geographical distances and constraints between doctors and patients. It has also allowed the providence of state-of-art medical services to patients who are located in remote areas and are generally deprived of such luxuries.
Remote health monitoring is the primary concern of today’s time. Health specialists and researchers are always looking for a modernized system that not only enables the monitoring of the vitals but also makes precise diagnoses and suggestions about the users’ health considering all the previous and present medical conditions of the patient. With the advancement in medical technology, it is now possible not only to monitor the patients but also to enable communication between them and the doctors. In today’s world, the most commonly used remote patient monitoring devices are Bluetooth-enabled glucometers, manometers, spirometers, and weight scales [
3]. These devices wirelessly send data to the cloud via a mobile application. This enables the doctors to monitor their patients’ condition and make suggestions accordingly. One must be thankful to modern technology for the innovations that have made data exchange and processing fast and secure.
AI and IoT have taken the healthcare industry by storm, providing state-of-the-art care even to people located in far-flung areas. Machine Learning (ML) techniques are revolutionizing the digital healthcare sector. AI plays a vital role in IoT-based remote patient monitoring systems for disease diagnosis and prevention. In order to maintain the health of cardiovascular patients, it is of utmost importance that their diseases are diagnosed as soon as possible. Moreover, in the IoT environment, large amounts of data are generated by sensors. This data has invaluable healthcare information and hence it is important to analyze it for improvement in medical technologies. In this regard, AI & ML technology would be extremely useful for performing data analytics, classification, and predicting healthcare conditions based on this data.
Based on the urgent needs of remote patient monitoring and its benefits, we have developed and implemented a smart remote monitoring system based on IoT. The system uses different wearable sensors to record and send data to the edge device, which uses edge computing to locally make decisions using ML techniques. The proposed system is a technology used to monitor a patient’s vitals i.e., oxygen saturation, body temperature, and heart rate from a remote location. The IoT node will generate large amounts of data regularly and from a variety of patients, therefore, AI & ML technologies are used for performing data analytics, classification, and predicting healthcare conditions at the edge. ML techniques acquire statistics from the raw data and derive insights about the patient’s health condition. The system offers a wearable device in the form of a smartwatch (which can be always worn by a patient). The device is small, easy to use, and flexible. For smart inference of the patient’s health status on edge, the ML model is trained at the cloud level and this model then executes on the edge device. The edge device uses this prediction model to predict the patients’ health status based upon the readings. The sensor data as well as the ML predictions are sent to the cloud over the internet for archival purposes. The system offers a web application that gives access to patients’ vitals, personal and medical information to the doctor, along with the prediction from the ML model. The device comprises of both hardware and software components that are utilized to keep track of patients vital and health status.
The key contribution of the paper are highlighted below:
Development of an Internet of Medical Things (IoMT) based wearable healthcare device for continuous health monitoring of patients.
Integration of edge computing for low latency real-time anomaly detection using local ML inference on health vitals, as well as, pushing critical notifications to doctors and caretakers in case of an emergency.
A web-based GUI for live data visualization along with ML classification results on the authenticated doctor and patient profiles.
2. Related Work
Cardiovascular diseases (CVD) represent the major causes of death in Asia and Europe, the mortality rate is higher among women and patients with a low socioeconomic status. Therefore, there is an urgent need for a solution that will periodically monitor patients’ vital parameters and provide treatment plans based on medical data and health status. In this section, different surveyed papers are discussed to assess the performance of digital healthcare systems already developed and how they contribute to healthcare IoT.
One paper [
4] highlights the importance of healthcare monitoring systems for cardiovascular disease and the need of sharing the bioinformatics of patients living in rural areas with medical professionals. This is extremely important since residents of far-off areas are alienated from the urban population or face scarcity of medical resources. This paper discusses the implementation and design of a wearable electrocardiogram (ECG) monitor, interfaced with Arduino. The system architecture includes bio-sensing modules, a cloud (Google firebase) to store the real-time data of patients, and the web interface for medical professionals to view the data and offer timely diagnosis and treatment of any incurring cardiovascular disease. The major outcome of this study is the design of an IoT-based, low-cost, portable, and complete real-time ECG acquisition, transmission, storage, and visualization system. This real-time data can be visualized by medical professionals for offering a diagnosis of cardiac diseases. In addition to that, the data is also fed to a diagnostic application with a graphical user interface (GUI). The main drawback of this system is that there may be latency and network connectivity issues, especially in rural areas. To address this critical problem, our system has an edge-based architecture that performs local anomaly detection based on ML to deal with emergencies.
A similar approach has been taken in [
5] in which the authors highlight the importance of ECG signals of cardiovascular patients. They present an IoT-based health monitoring system that uses a statistical model, the Hidden Markov Model, to observe the underlying characteristics of ECG signals recorded via a sensor. This scheme aims to facilitate improved monitoring and timely intervention for CVD patients thereby enhancing medical services for such patients. The system implementation employs a patient path estimator, patient table, and alert management schemes within the hospital to facilitate the localization and timely intervention for the treatment of CVD patients. ECG signal is classified based on amplitude R peaks, and the time between each RR peak. These altogether are used for the detection of common and important rhythm disorder peaks. Based on comparison data of 50 normal patients and 50 CVD patients, the thresholds of ΔRR > 150 ms and t period >60 ms are set, resultantly offering a high positive prediction of CVD. The drawback is that this paper lacks the implementation of smarter technology powered by AI and ML. Hence, many improvements are still needed for refining the accuracy of the diagnostic model.
In [
2], the researchers are of the view that the evolution in ML technologies has made it possible for early disease detection and diagnosis. This is especially useful in cases of chronic illnesses, particularly heart diseases. This paper proposes a custom machine learning algorithm for the prediction of the possibility of heart disease in the next ten years. They have named their algorithm as Hard Voting (HV) classifier. HV has been made with the well-known classifiers: Logistic Regression, Random Forest, Multilayer Perceptron, and Gaussian Naïve Bayes classifiers. The meta-classifier takes multiple risk factors (e.g., age, sex, smoking, systolic blood pressure, etc.) as inputs. The four classifiers are used, and the best prediction is considered by taking a vote. The authors used a publicly available dataset on Kaggle which comprises 3751 patients’ data. The authors used RobustScaler to scale the data to eliminate any outliers. The dataset was divided into two parts of ratio 80–20% for training and testing purposes. The design of this meta-classifier algorithm was successful and it achieved an accuracy of 88.42% on the test with a precision value of 1.0. This paper focuses mainly on the development of the ML model and not on any IoT-based ECG monitoring system. The authors have not applied their model to real-time data of patients. In our proposed architecture, not only multiple vitals are acquired, but also ML techniques are used for the prediction of the health condition of real-time patients.
In [
6], the researchers address the issue of remote monitoring by proposing a system that is based on IoT and machine learning techniques. It implements an IoT-based sensor network, particularly a pulse sensor, interfaced with Arduino. This system also employs ML classification techniques on the data recorded for heart illness classification. The algorithms tested in this study are the Decision Tree algorithm, Random Backwoods classifier, and Support Vector Machine (SVM). The authors collected sample data of 40 patients and trained the aforementioned algorithms. It was observed that SVM shows higher accuracy in terms of the exactness of identifying a heart illness (an accuracy of 86%). The proposed hardware, as well as software system, helps patients to predict heart disease in early stages. This system does provide benefits to CVD patients, but a diagnosis based only on pulse readings cannot give the whole picture of the patient’s health. Multiple sensors need to be added to improve the performance of the ML model. Thus, in our proposed system, we used multiple vital signs’ sensors to monitor the health of the chronic patient.
Article [
7] proposes yet another smart data analytics infrastructure for e-healthcare applications, using federated learning on local Edge computing devices. The significance of introducing federated learning in the system architecture, lies in the data privacy and security of the sensitive medical data collected through wearable devices. The paper offers a comprehensive description of the proposed framework, which comprises three modules: Cloud module, Edge module, and Application module. However, the authors do not clearly mention the system’s implementation. The main highlight of this study was to identify federated learning on the edge for e-health system architectures to guarantee quality (fast response time) and security (data security) of service.
CAMISA is an AI-powered solution for remote monitoring of COVID-19 patients proposed in [
8]. The authors have designed a Wireless Sensor Network (WSN) system in the form of a smart shirt and nebulizer which is integrated with multiple sensors to obtain physiological parameters of a patient. The system measures the pulse, SpO2 level, temperature, and breathing rate of a patient. In case any of these parameters exceed their threshold values, alerts are generated that share the live location of the patient with the hospital so that the patient can be timely rushed to intensive care. In addition to this, the authors have also implemented the model of a neural network to predict the possibility of coronavirus in a user. The Artificial Neural Network (ANN) model takes input 20 parameters like the presence of cold, fever, or cough i.e., different symptoms experienced during coronavirus infection. The health monitoring app obtains these input parameters from a user in form of a questionnaire and estimates whether the patient has COVID-19 or not. The app also visualizes the sensory data from the system using the Thingspeak IoT platform. This system is useful for real-time monitoring of COVID-19 patients remotely to assist the hospitals in controlling the spread of the virus.
In [
9], the authors have leveraged Internet of Medical Things (IoMT) technology to develop and test multiple in-home quality of life applications. They have utilized several edge-compatible hardware for developing deep learning applications that will enable a smart COVID-19 management system in users’ homes. These applications are optimized for edge-based inferences that can run either on smartphones or Web-based clients. The computing framework collects data from multiple streams including sensory data, camera & video feed, as well as thermal images. The authors present an implementation of multiple deep learning applications that are trained using a cluster of GPUs. These applications are then tested for providing insight into their feasibility. The tested applications include cough sound analysis from smartphones, analysis of drowsiness in a user, detection of face mask, ECG signal classification, emotional analysis for determination of physiological states, fever detection using thermal images, and emotion detection using EEG signal. The training and validation accuracies for each of these are presented in the paper showing promising results. Their framework also incorporates alert generations for in-home management and healthcare providence especially for the elderly.
The monitoring technologies used by the majority of the system architectures rely on physiological sensing hardware devices, however, in our literature review there were certain other techniques being performed by commercial businesses which are important to mention. An Israel-based startup “Binah.ai” is approaching remote health monitoring in an innovative way by integrating facial technology with it [
10]. Their solution offers to monitor the vital parameters which include heart rate, heart rate variability (HRV), oxygen saturation, and many others. Thus, removing the need for wearables and other dedicated hardware devices. Researchers and healthcare practitioners can utilize such AI-powered software solutions to monitor the treatment progress of a patient by measuring the changes in facial expressions using computer vision algorithms and facial technology. However, the validity and practicality of such solutions remain in question.
3. Proposed Methodology
The proposed solution is based on the Internet of Medical Things (IoMT) and AI. The IoT part is concerned with developing the wireless sensor network of medical devices and sending the data through the internet to the cloud. The standard sensors (MAX30102-Maxim Integrated and MLX90614-Melexis Semiconductor Solutions) will be used to monitor the body vitals, and these sensors will send data to the edge where edge computing will be performed to make decisions locally using ML inference. In addition to this, the vitals’ data and the ML prediction will also be uploaded to the cloud for archival purposes. The proposed system would be useful for the patients, caregivers, and the hospitals to manage the non-COVID patients at home. Doctors can send the patients’ medical advice remotely except to those who are critical, need real-time monitoring, require special care, and specialized medical equipment. Further, many of the non-COVID patients are reluctant to visit hospitals owing to the chances of catching this virus due to many pandemic cases in the hospitals. The proposed system would be useful for such cohorts as well as for the people who are not patients but are considerate about their well-being and fitness. As compared to conventional healthcare, which is only limited to hospitals, the new paradigm of remotely monitoring the patients by exploiting the latest technologies such as IoT and AI is the future of health care and can help us to leverage these technologies and maximize their benefits in the context of remote health care.
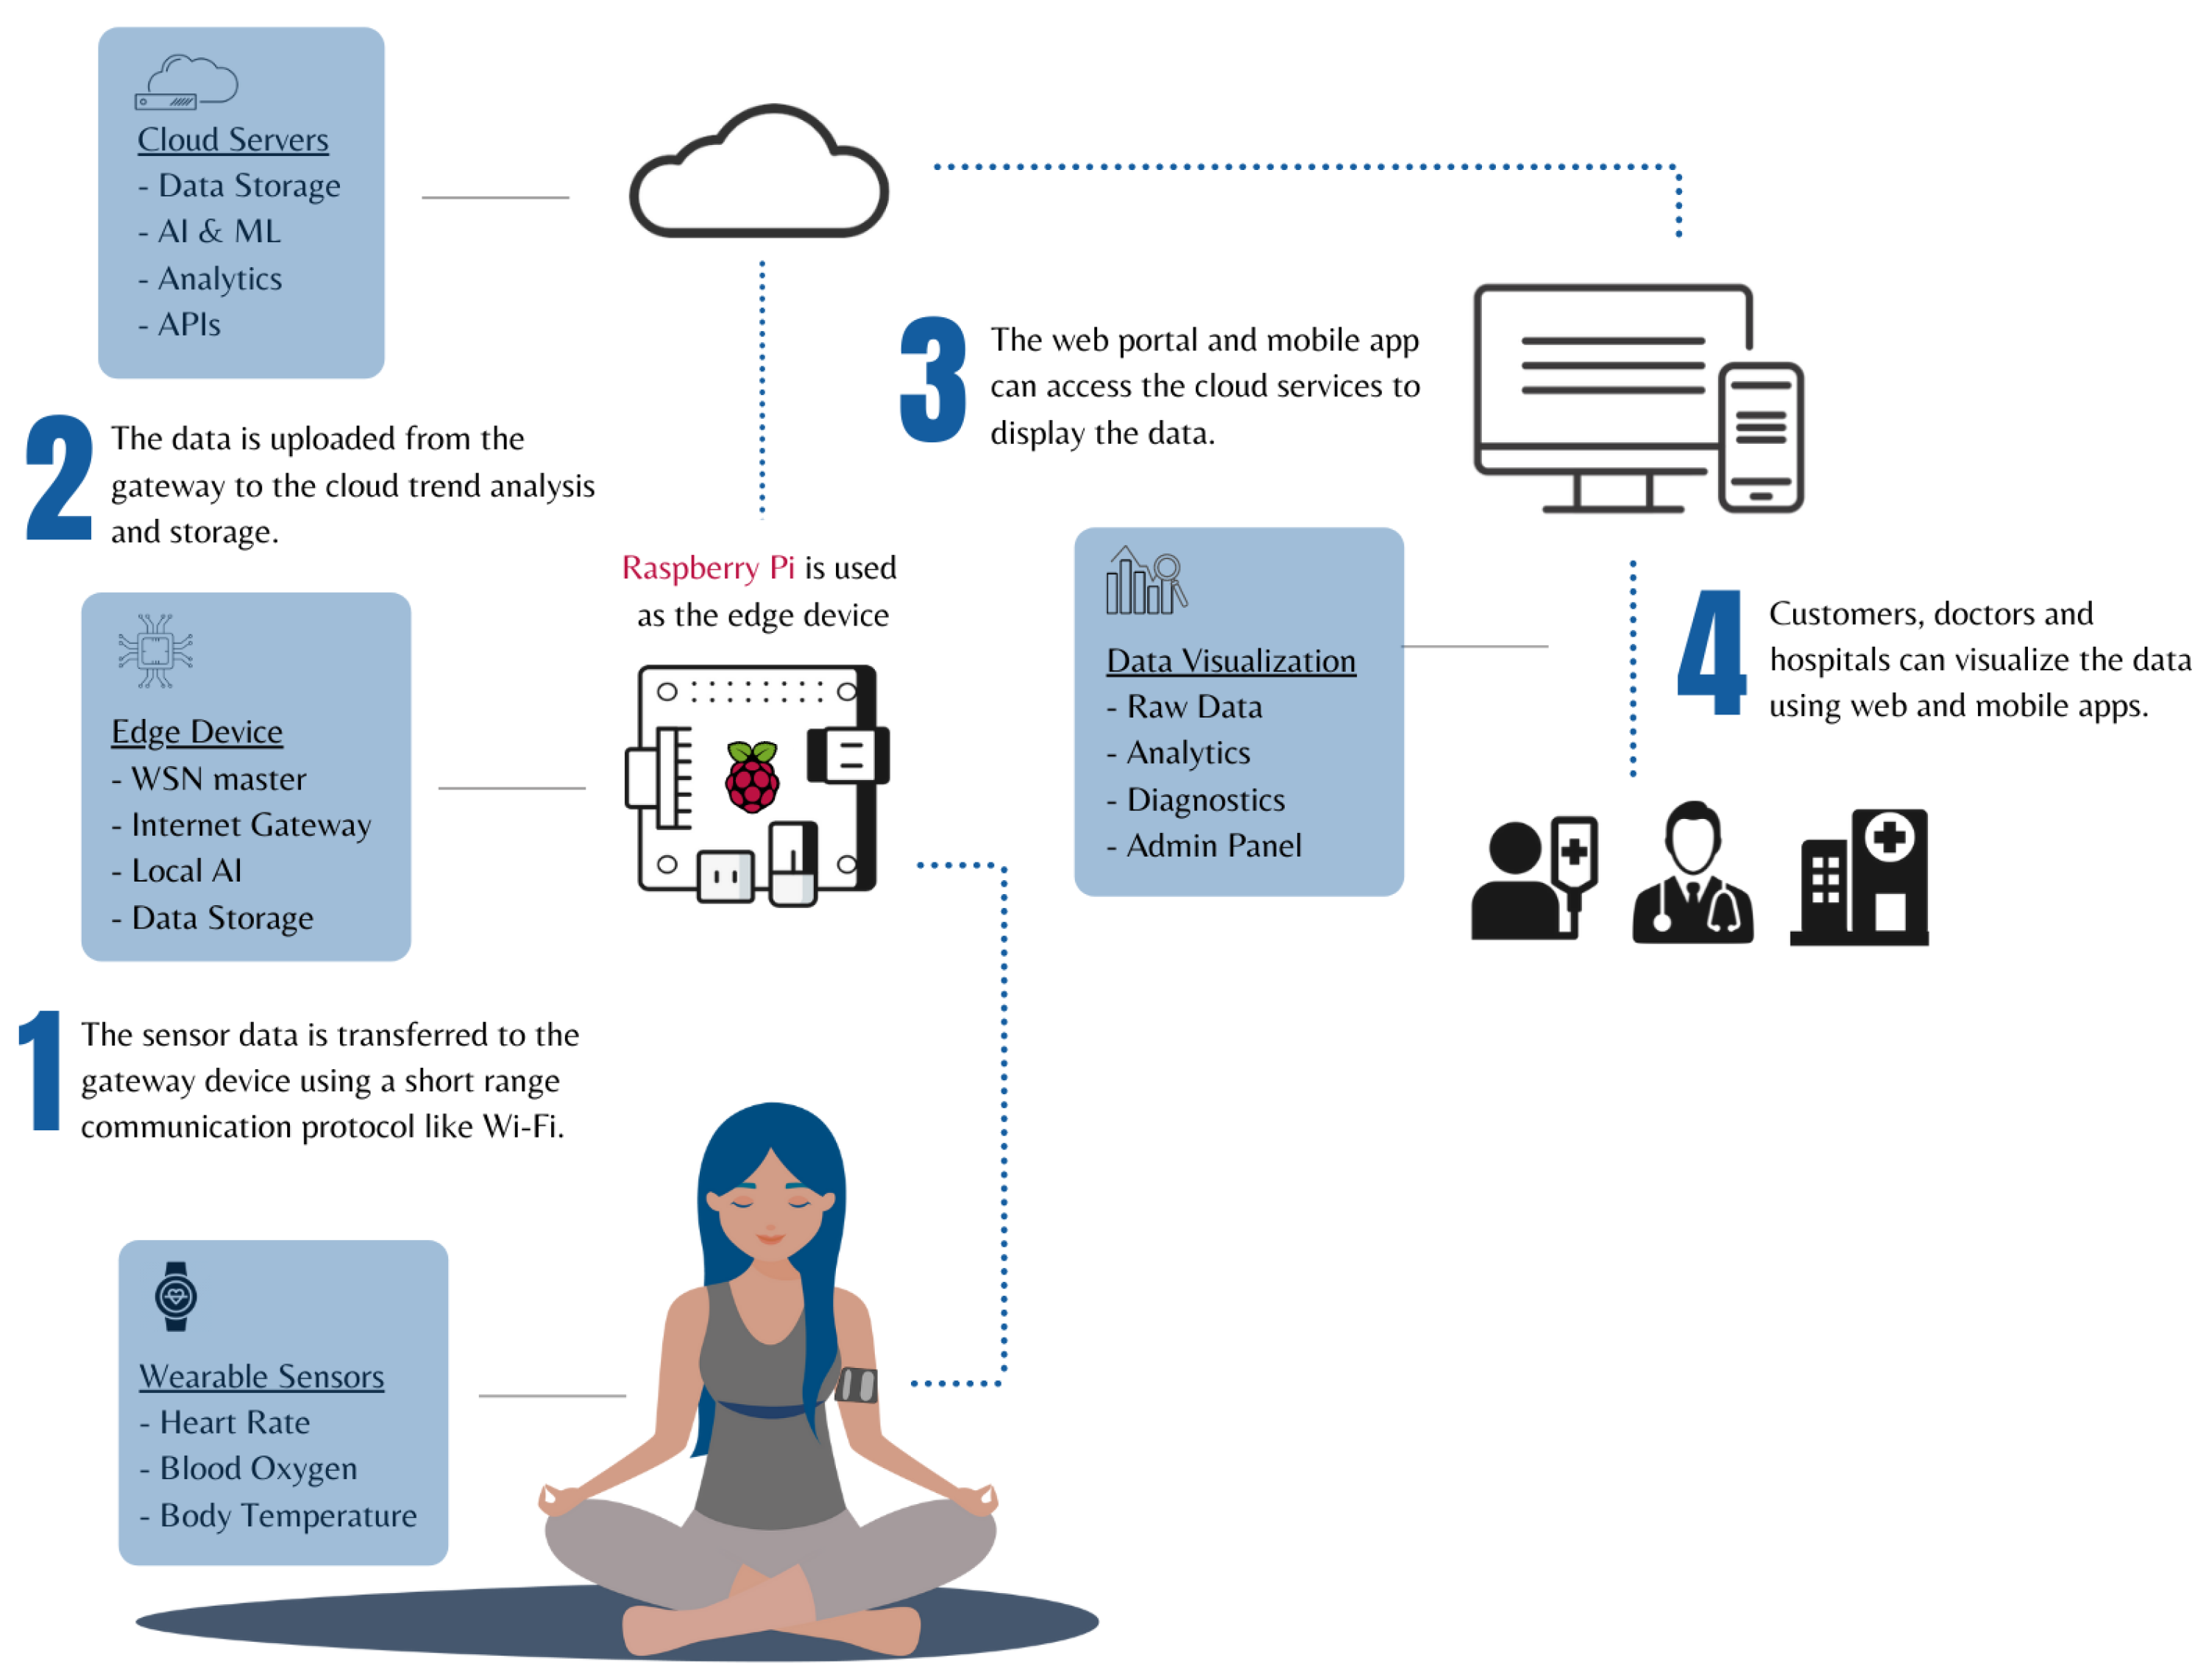
The proposed system architecture (
Figure 1) is described in detail hereafter. There is a network of sensors that are going to measure body vitals. These sensors will be employing Wi-Fi communication technology to transfer the data to the edge node. The edge node will include a local processing unit for analog to digital conversion, pre-processing methods, and data aggregation in a local data storage. It will furthermore run local decision making based on ML and in case it detects any abnormality in the patient’s vitals it will notify the patient, the caregivers, and the doctor. Hence, the alert will be triggered from the edge device. The edge node will transfer pre-processed data to the cloud’s database, where the heavier tasks would be implemented such as training ML algorithms since it has maximum computation ability. After training, the model is downloaded by the edge device using Amazon Web Services (AWS) where it can start prediction on real-time data. This architecture was designed to decrease the latency in response time if an abnormality in the vitals is detected. The predictions or the results would be transferred over to the website server, where authenticated users (patients & doctors) can login to view the results and trends derived from the sensor’s data.
4. Design and Implementation
The design and implementation process of the proposed architecture is further divided into two parts:
- 1.
Hardware development (IoT node design, edge device)
- 2.
Software development (health state prediction module)
4.1. Hardware Development
The hardware design is based on IoMT, also known as healthcare IoT, that administers the physiological factors affecting a patient’s health. A working prototype is developed for this IoT node i.e., the wearable body sensor network. All the sensors are interfaced with ESP32 [
11] which is a Wi-Fi-enabled microcontroller. The developed hardware enables the system to collect and transfer vital signs’ data to the edge device. The vital signs to be measured with this design are heart rate, blood oxygen saturation (SpO
2), and body temperature. These sensed parameters are sent to the edge computing device (Raspberry Pi [
12]) through Wi-Fi by using the standard Message Queuing Telemetry Transport (MQTT) protocol that operates on TCP/IP. The following text describes the different stages of hardware development.
4.1.1. Sensor Descriptions
The hardware prototype was developed while keeping in mind that the use case of this study is remote monitoring of cardiovascular patients. This means that the IoMT prototype was integrated with sensors that monitor the baseline parameters needed to ensure the good health of a cardiac patient. These vital parameters include heart rate, blood oxygen saturation, body temperature, and electrocardiogram (ECG) signal. This section highlights the brief working description of the sensors used for the hardware development:
- 1.
MAX30102–Heart rate & blood oxygen saturation sensor:
Heart rate and SpO
2 are among the key vital parameters which are used to determine the health of a cardiac patient. The MAX30102 sensor [
13] is a pulse oximeter
Figure 2 which measures these vitals. This sensor uses IR and red LED to get the Photoplethysmogram (PPG) signal which is used to measure the blood oxygen saturation. Contrarily, the sensor utilizes the IR to check for beats for heart rate monitoring. This device’s small size makes it ideal for integration in wearable devices.
- 2.
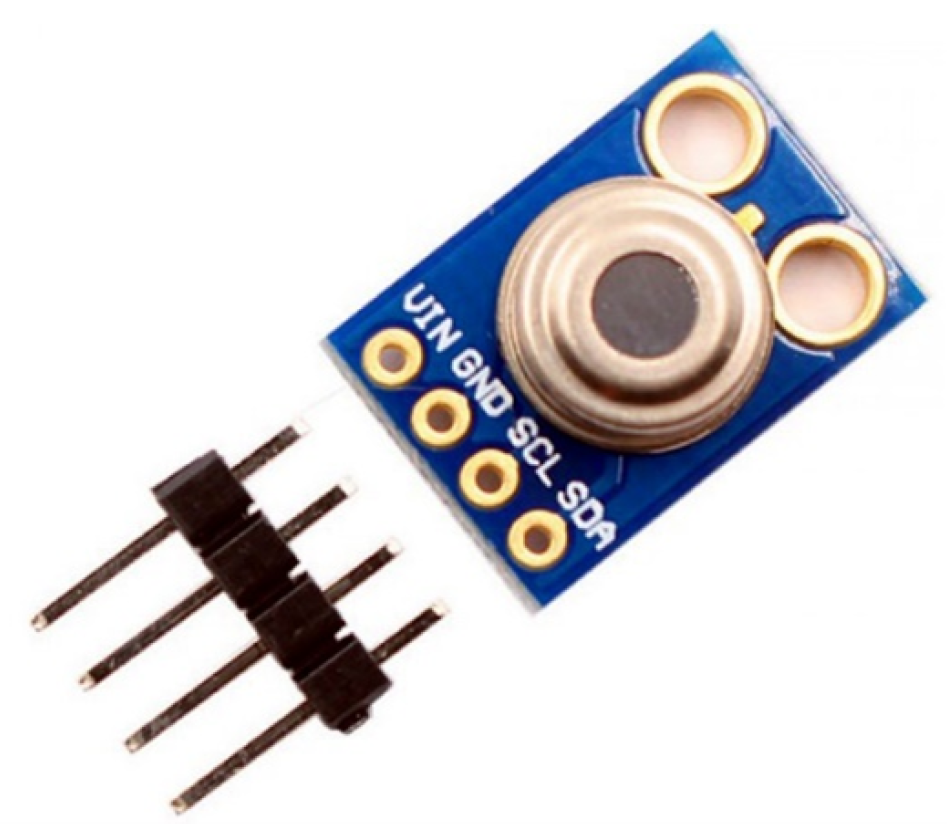
MLX90614-Non contact IR Temperature Sensor:
This sensor [
14] is an Infra-Red based, noninvasive thermometer. It can perform at a measurement resolution of 0.02. The non-contact attribute makes it suitable for hassle free wearable health solutions. Since this sensor is IR-based
Figure 3, it gives much faster results than the conventional contact-based sensors.
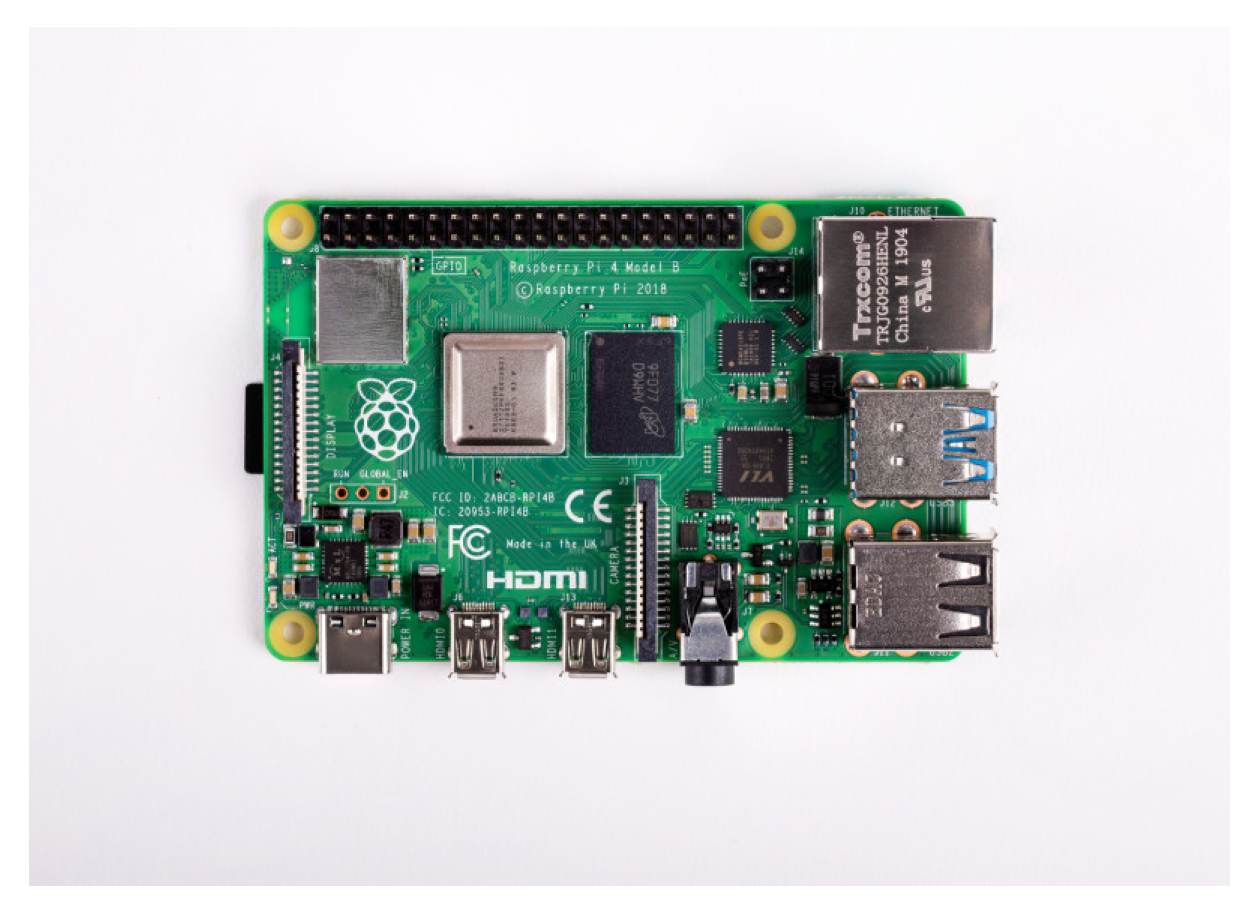
4.1.2. Edge Device
The objective of integrating an edge device in the system architecture is for central data localization, pre-processing of the sensor data, and performing local decision making powered by ML to reduce latency in health predictive analysis on the patients, thus improving quality of service. The implementation of the edge module was achieved by integrating Raspberry Pi 4
Figure 4) into the system framework. The pre-trained global machine learning model was downloaded on the raspberry pi using AWS IoT Greengrass to offer real-time inference at the edge. The procedural description of the edge computing tasks is given below:
- 1.
Data packets from the wearable sensors are received at the edge, and parsed into JSON format.
- 2.
The data is then cleaned simultaneously to eliminate error values.
- 3.
After pre-processing procedures, the data is fed to the local inference downloaded through AWS IoT Greengrass periodically, for real-time anomaly detection in the patient’s vitals.
- 4.
The data along with inference results is then pushed to AWS as well as to the web application for storage and further analysis.
It is important to highlight that, this implementation achieved a good response time in case an anomaly in the patient’s vitals was identified. The critical notification to the concerned caretaker was generated immediately, however, the exact response time was not quantified in this study.
4.1.3. Sensor Results & Prototype Design
A recently published study investigates the accuracy of MAX30102 and MLX90614 and compares them to industry-standard devices. After rigorous testing and comparisons, the research concluded that these sensors offer almost 99% accuracy for SpO
2 measurements and 98% for heart-rate measurements. On the other hand, the non-contact-based IR thermometer has an accuracy of 99.62% in measuring body temperature. This high accuracy in measurements of these key vital parameters of the human body makes them suitable candidates for this architecture [
15].
Contrarily, the AD8232 sensor (ECG sensor by SparkFun) which was to be used to extract the ECG signal of the patient did not perform as expected. It was observed that there was a high rate of error in the values obtained by this sensor. The signal received from this sensor is highly erroneous, noisy, and unstable. After failed attempts of applying various filters to get the required ECG signal, the sensor’s performance was deemed unsuitable for the application.
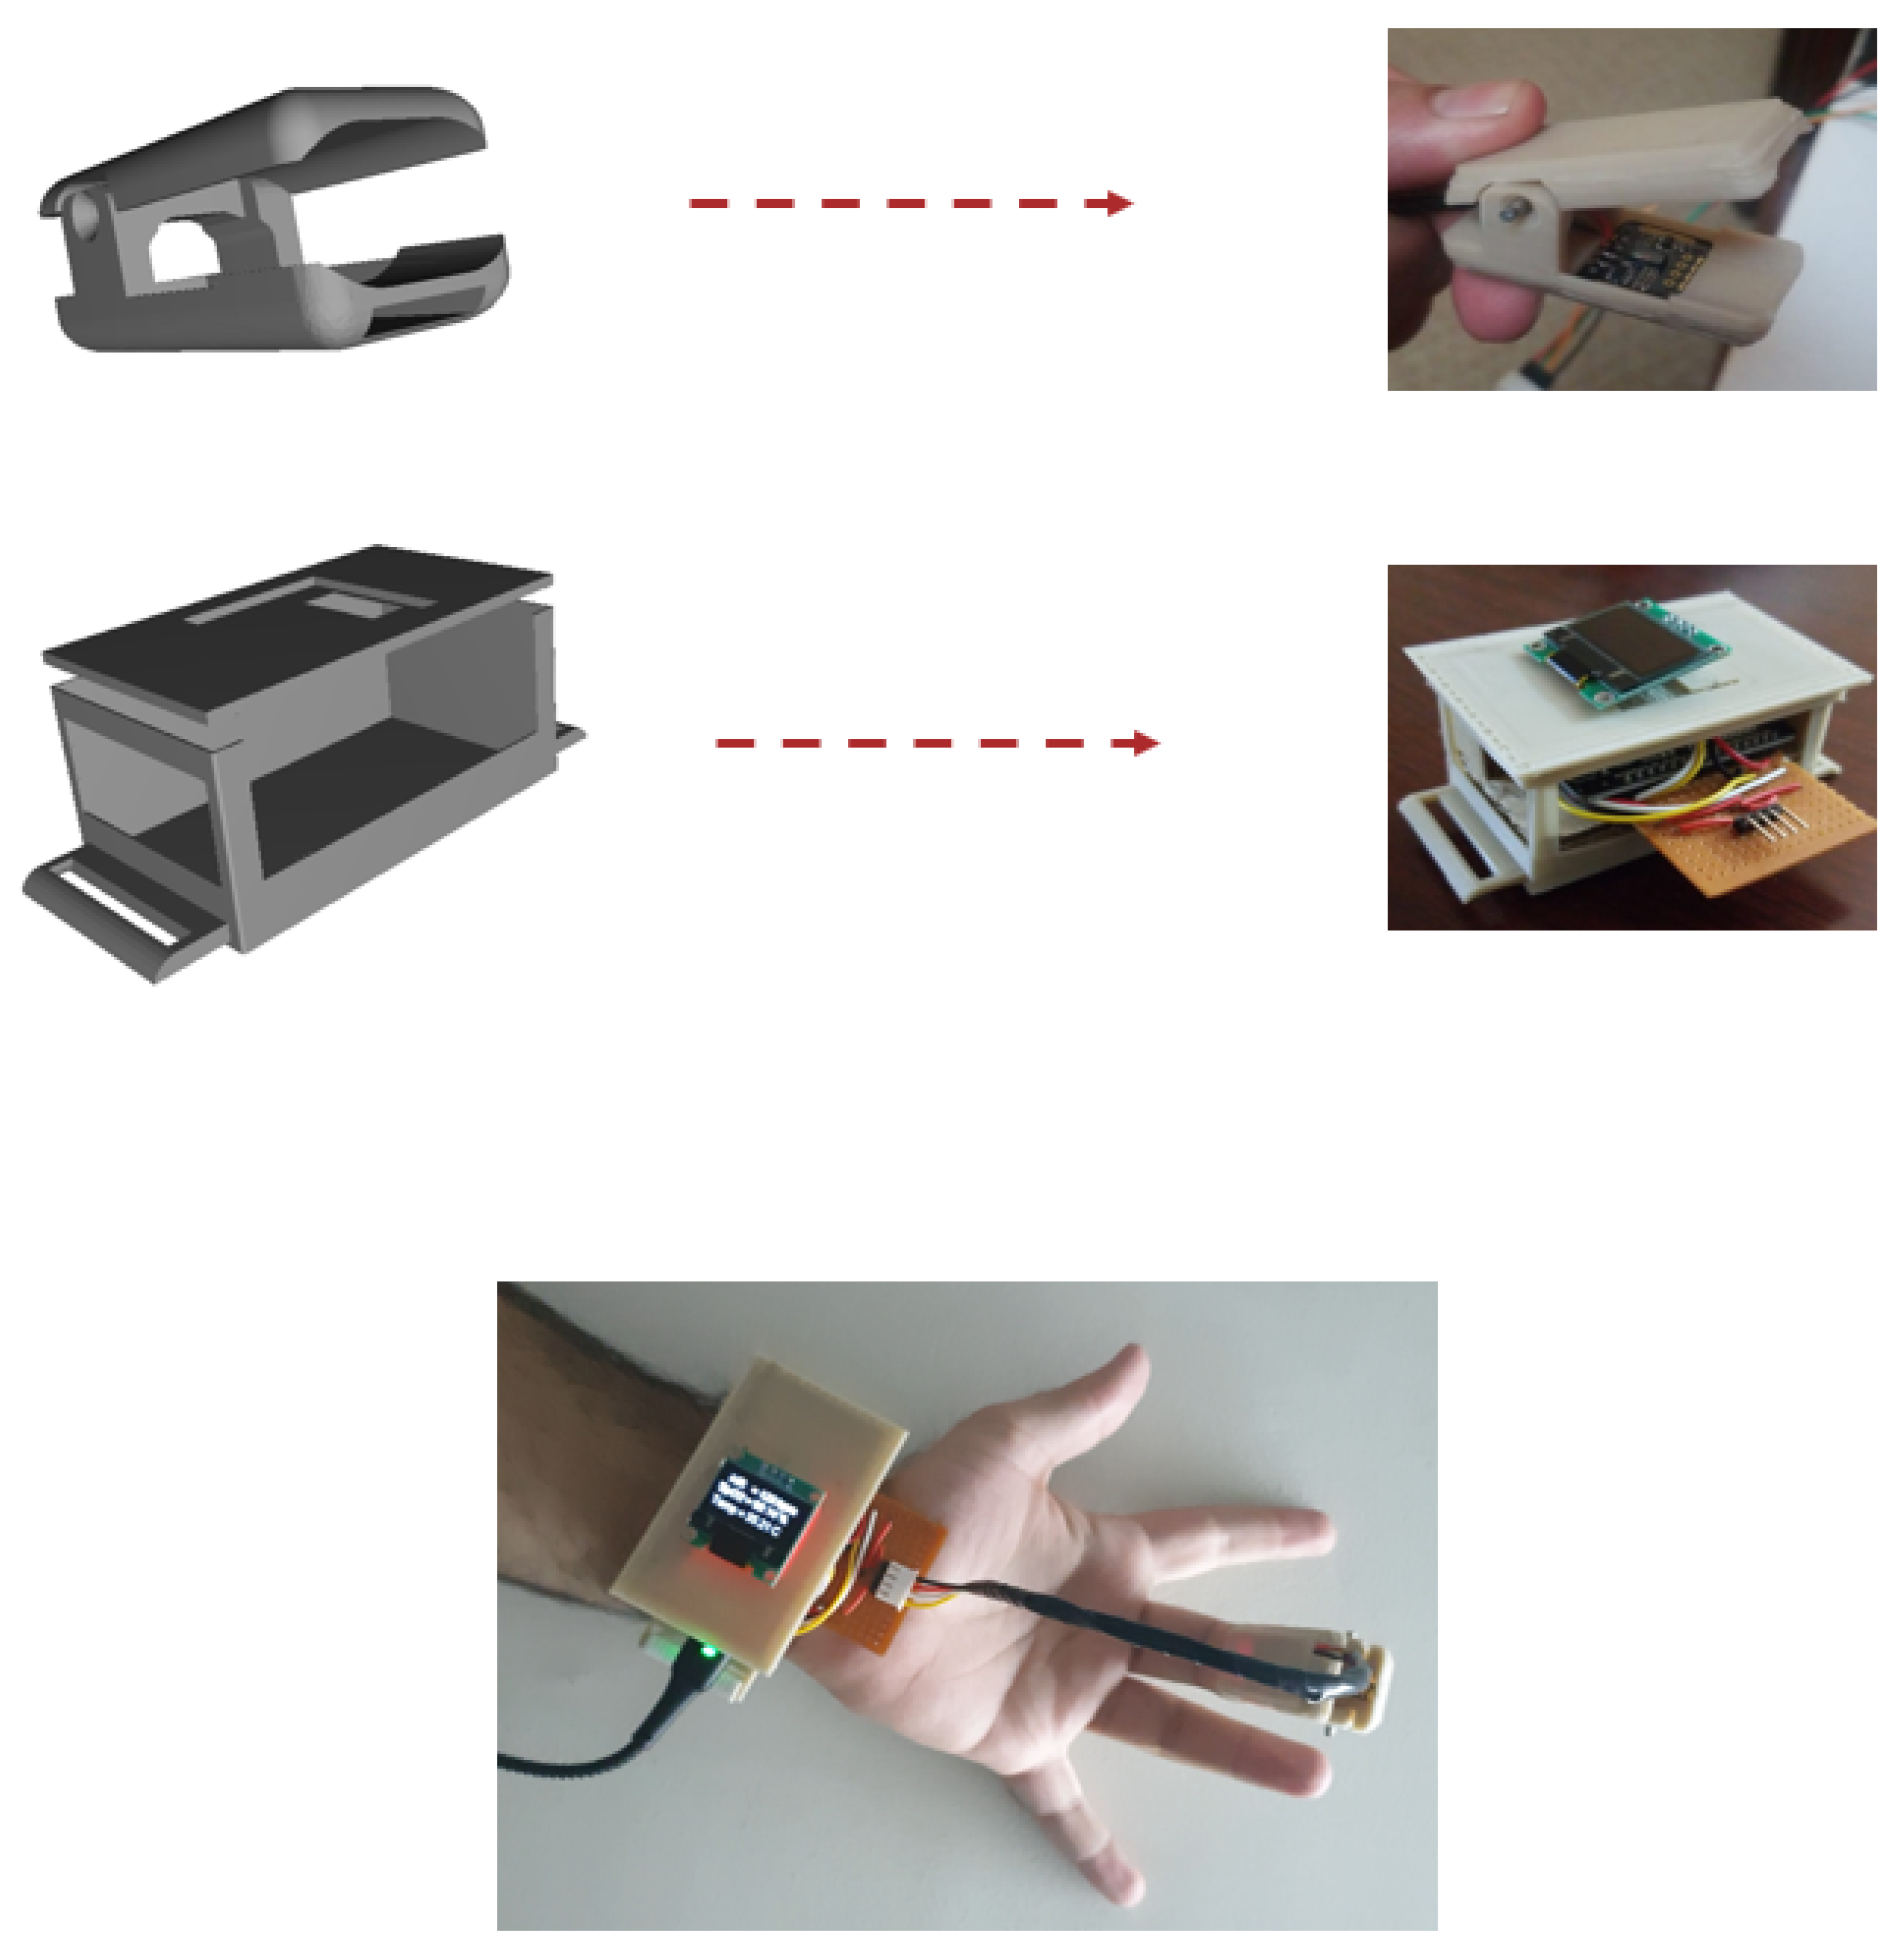
For the design of the wireless sensor network, 3D models were developed for the enclosure of the biosensors to ensure ease of wearability. For the MAX30102, a 3D finger oximeter model was designed. For the MLX90614, ESP32, and displays, a wristwatch design was developed. The models were 3D printed and integrated as shown in
Figure 5. It is important to mention that this developed device was powered through a Lithium-Ion 720 mAh battery, which had an approximated battery life of around 10 h of continuous use.
4.2. Software Development
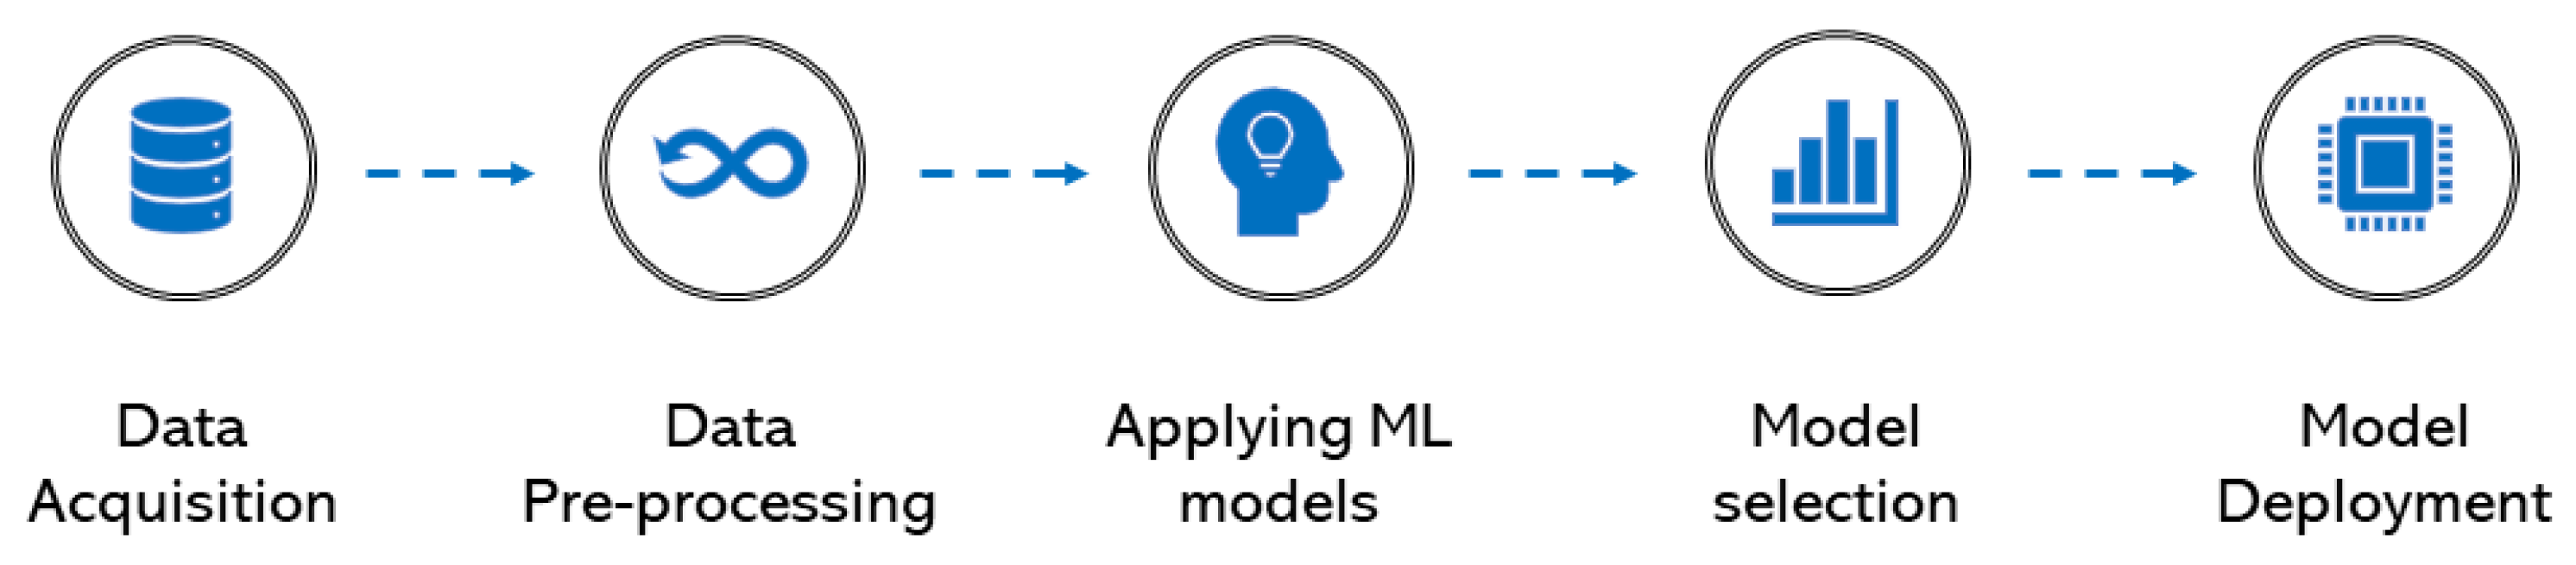
The novelty of IoT-based remote monitoring is the fact that modern technologies like AI and ML can be employed on patients’ data for smarter decision-making. In addition to this, the concept of edge computing is integral to healthcare solutions since it solves many latency-related problems that traditional cloud-based frameworks face. This means that performing data analytics on the edge brings computing resources closer to the user and allows for a faster response time in emergency situations. The development of the health status prediction module was done in a systematic and step-wise order which is depicted graphically in
Figure 6. Each step of this process is explained further in detail in this section.
4.2.1. Data Acquisition
The first step was to acquire relevant vitals’ data to train the ML model for cardiovascular disease prediction. After many surveys of the datasets available online, the required data was acquired from the MIMIC-III clinical database [
16]. MIMIC-III is a very large healthcare database that is freely available on the internet for researchers and students. It contains de-identified data of over 40,000 ICU patients and includes extensive information about their stay including readings of vital signs. The database is also hosted on the Amazon Web Services (AWS) cloud from where it can be accessed through Amazon S3 without having to download, copy, or pay to store it.
4.2.2. Data Pre-Processing
This part of the implementation was further divided into steps to ensure a clean dataset ready for ML training. These steps are further described below:
- 1.
Local Instance Creation
SQL language is used to query relational databases for extracting relevant information. AWS provides its own query service known as Athena which is also based on standard SQL. As the database was already hosted on the AWS cloud, Athena was used to query the database and create a local instance of the required dataset. The local dataset had the required data of the three physiological parameters namely heart rate (BPM), body temperature (°C), and blood oxygen saturation (SpO2). From the Athena console, the dataset was downloaded as a comma-separated (.csv) file.
- 2.
Data Cleaning
The local dataset was then further processed and cleaned so that it would be ready to feed for the training of an ML model. It was made sure that there were no null values in any row (masking) and the precision of the data points was uniform throughout. This step was achieved using python’s data analysis library, pandas. Data cleaning was an important measure because null values and non-uniform data points adversely affect the accuracy of any ML algorithm [
17].
- 3.
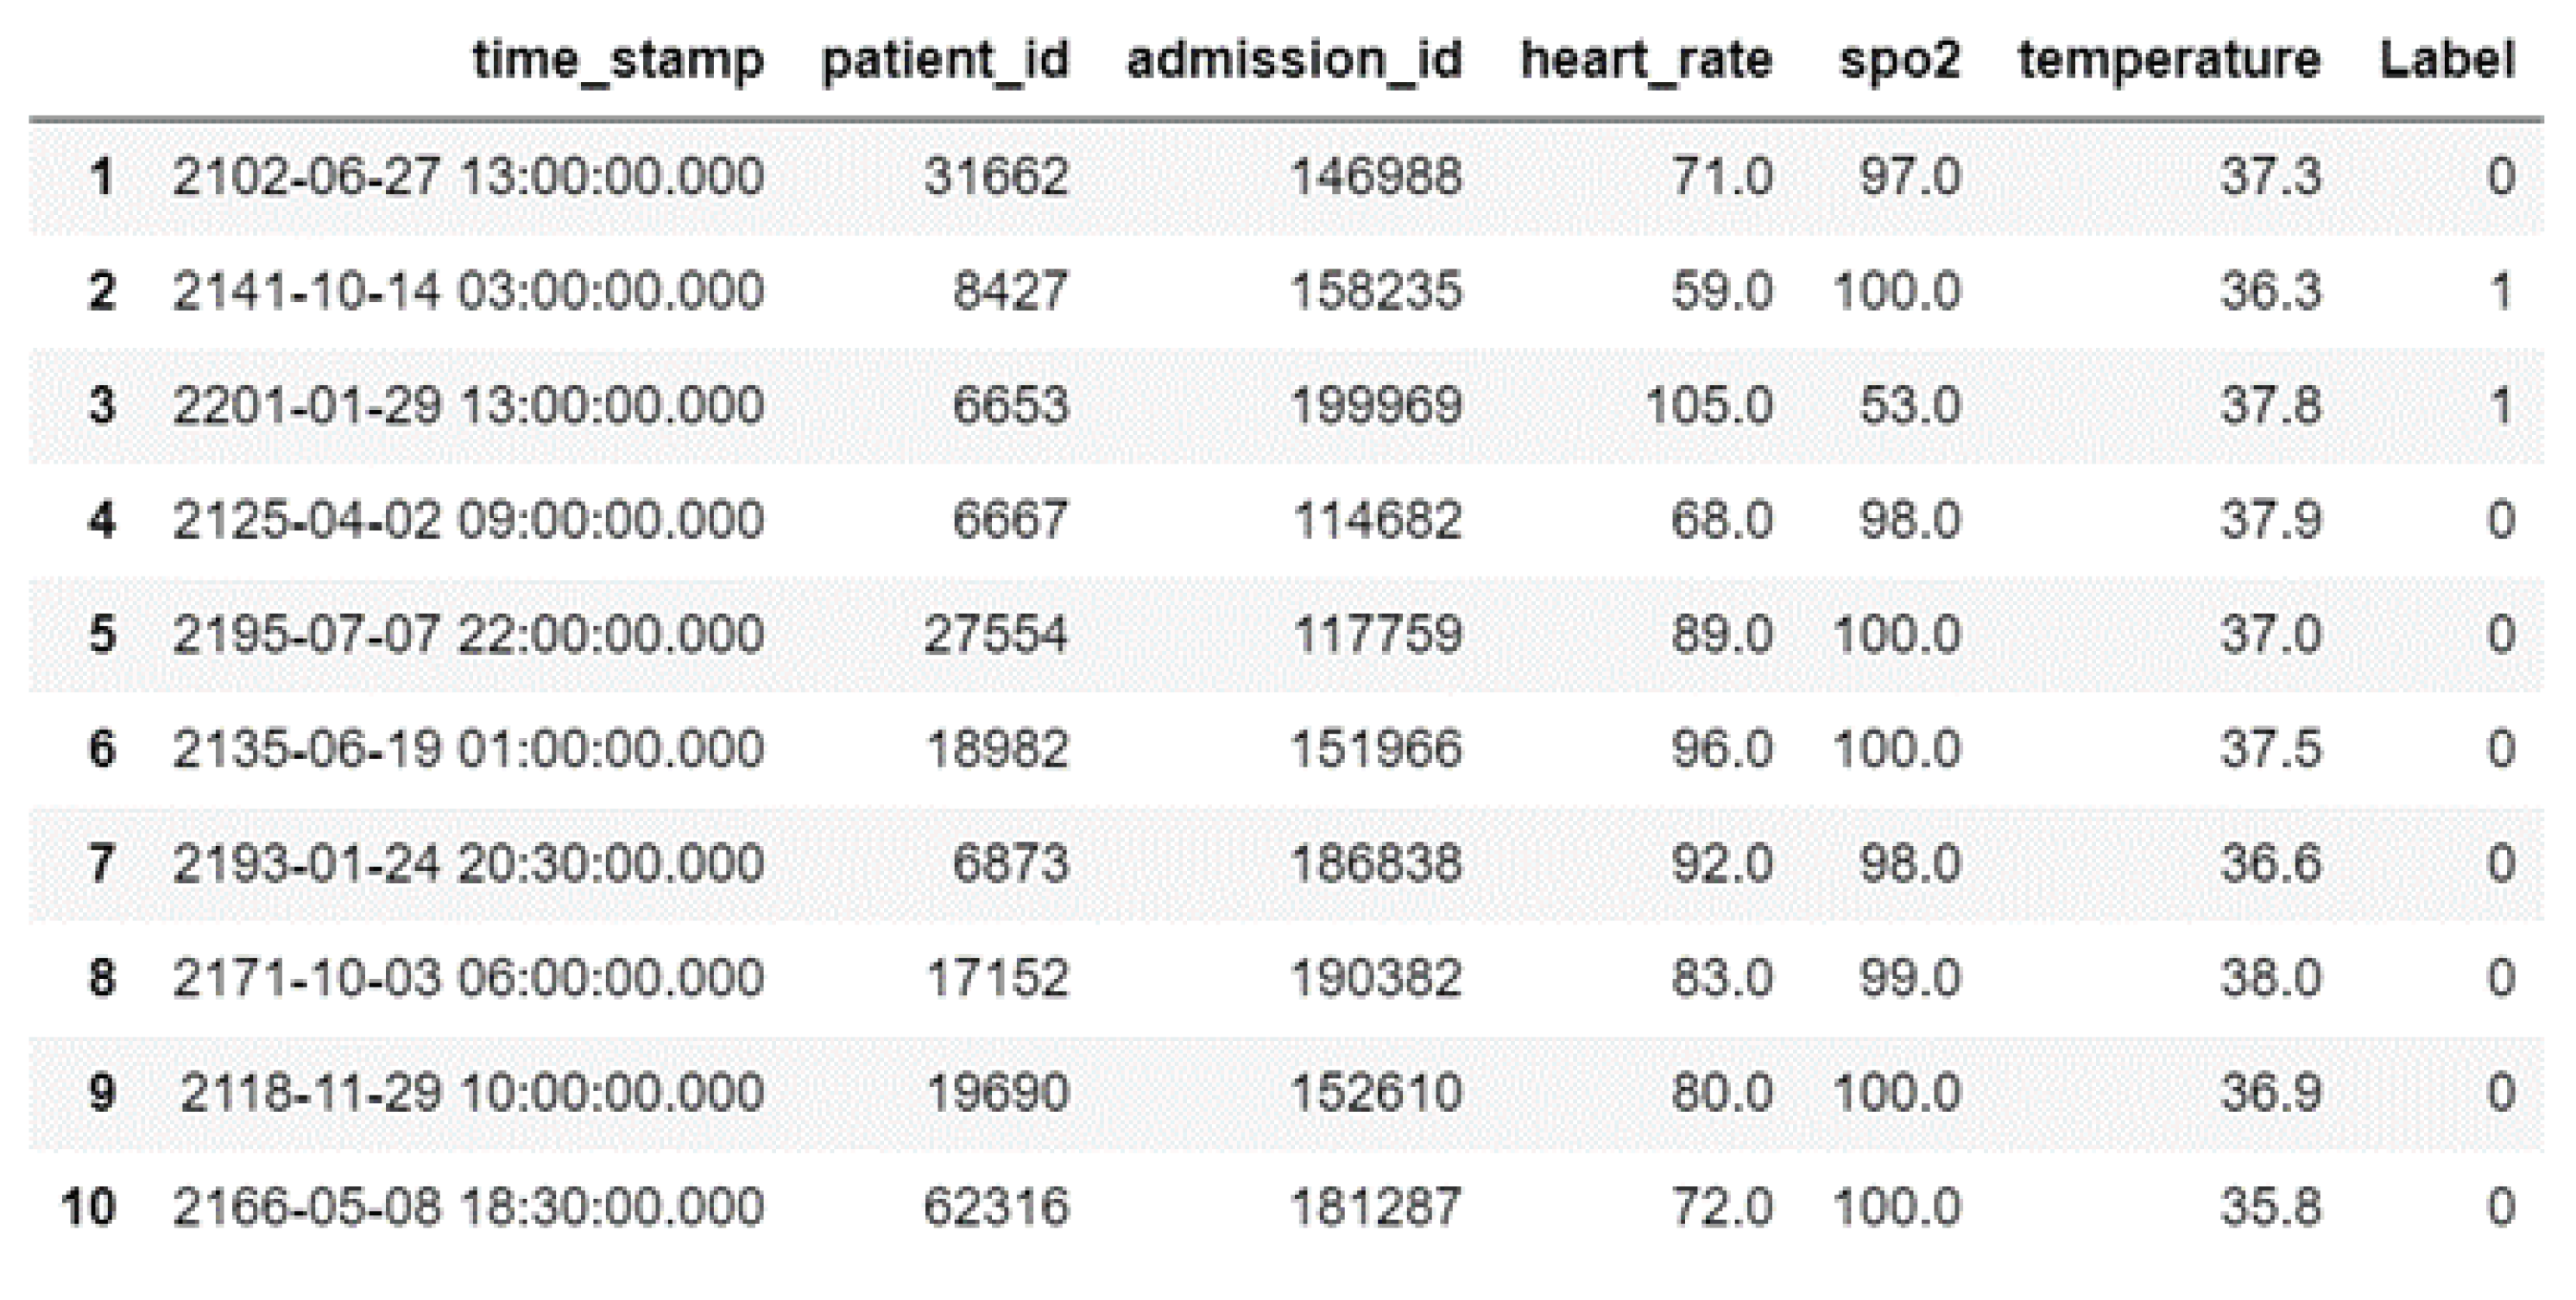
Data Labelling
The problem of developing a module for healthcare prediction was modeled as a binary one. Under this binary model, the predicted values fell under two classes namely ‘Healthy’ or ‘Un-healthy’, based on the three vital parameters. The MIMIC-III database had no data which could be uniformly used as the target class for the ML model. Hence, the dataset had to be labeled automatically so that it can be used for training purposes. For data labeling, the powerful numeric computing environment MATLAB was used. The data was labeled according to the medically accepted normal human body ranges of vital parameters which can be found on different websites and scholarly articles. A patient’s vitals were labeled as ‘Unhealthy’ if they fell out of range of normal body functioning. The ranges are mentioned henceforth:
- (a)
Body Temperature: 36.5 °C to 37.3 °C [
18]
- (b)
Heart Rate: 60 to 100 beats per minute [
18]
- (c)
Blood Oxygen Saturation: 95% or higher [
19]
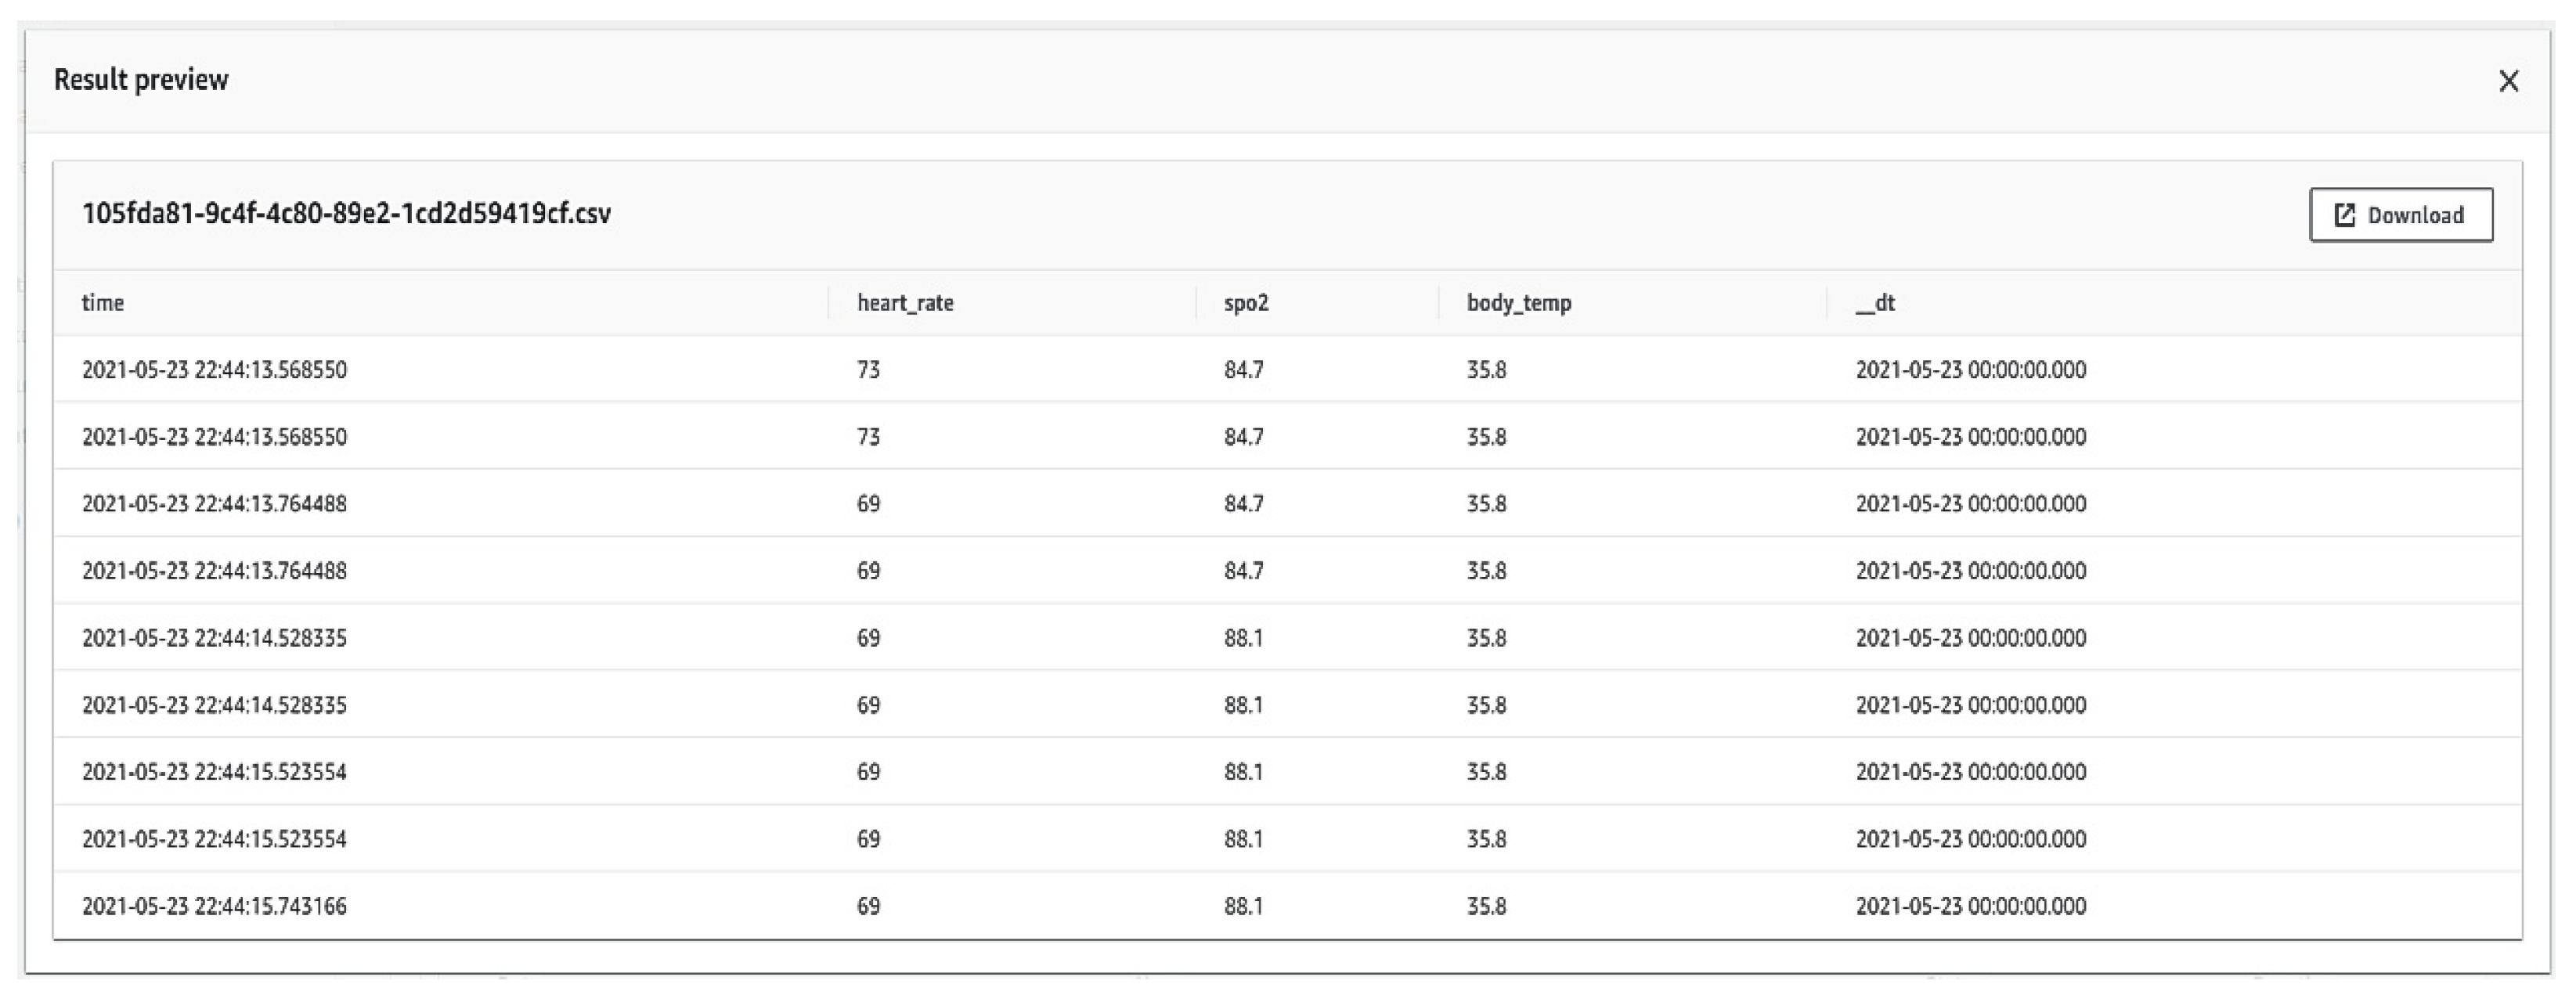
After labeling, the dataset was in the required format with de-identified time-stamps as seen in
Figure 7 where a ‘0’ label specified ‘Healthy’ while ‘1’ specified ‘Un-healthy’.
- 4.
Data Splitting
Traditionally, to employ machine learning algorithms, the datasets are randomly split into two parts: training and test sets. The data is assigned randomly to any of the two sets, but according to a particular ratio. The widely accepted train-test split ratio is 80:20 where the training set contains 80% of the data and the test set contains 20% of the data. The purpose of this split is to evaluate the ML model and check its accuracy against the test set. The model is trained solely on training data and then its performance is tested on the test set to gain insight into the validity of the model. For this purpose, we split the dataset into randomized 80:20 training and test sets using python.
4.2.3. Applying Machine Learning Models
The health status prediction module employs machine learning algorithms. A total of 9 different algorithms were tested to find the model that works best. As this was a binary classification problem, some traditional algorithms were tried out first, then the analysis moved to much more powerful classifiers. Finally, a comparative analysis of these algorithms is performed to select the best model for deployment at the edge.
4.2.4. Model Selection
After performing a detailed comparative analysis, the results of which are discussed in the next section, the ML model was finalized which would be deployed at the edge. The final model was an optimized K-Nearest Neighbors algorithm with an accuracy of 96.26%. The comparative analysis is discussed in the next section.
4.2.5. Model Deployment
After selecting and optimizing the KNNs model, the next step was to deploy the model at the edge for real-time prediction and monitoring of patients. For this purpose, AWS services like SageMaker and IoT analytics were used. The model was trained on the AWS cloud and then a light version suitable for edge computing was downloaded on the Raspberry Pi to provide inference and predictions of health status on real-time data. This data, including the ML inference, is sent to google Firebase for real-time depiction on the website. It can be viewed by the doctor as well as the patients themselves.
5. Results and Discussion
In this section, the results of the comparative analysis are presented in detail and the features of the developed web application are also discussed.
5.1. Comparative Analysis of ML Models
A detailed comparative analysis of the applied models was performed to select a final machine learning module. A list of algorithms that were part of this analysis are listed below:
- 1.
Linear Regression
- 2.
Logisic Regression
- 3.
Naive Bayes
- 4.
K-Nearest Neighbours (KNNs)
- 5.
Support Vector Machines (SVM)
- 6.
Decision Trees
- 7.
Random Forest
- 8.
Bagging
- 9.
Neural Networks
The investigation included comparing model accuracies, errors, machine learning metrics, and computational times. The details of this analysis are described below:
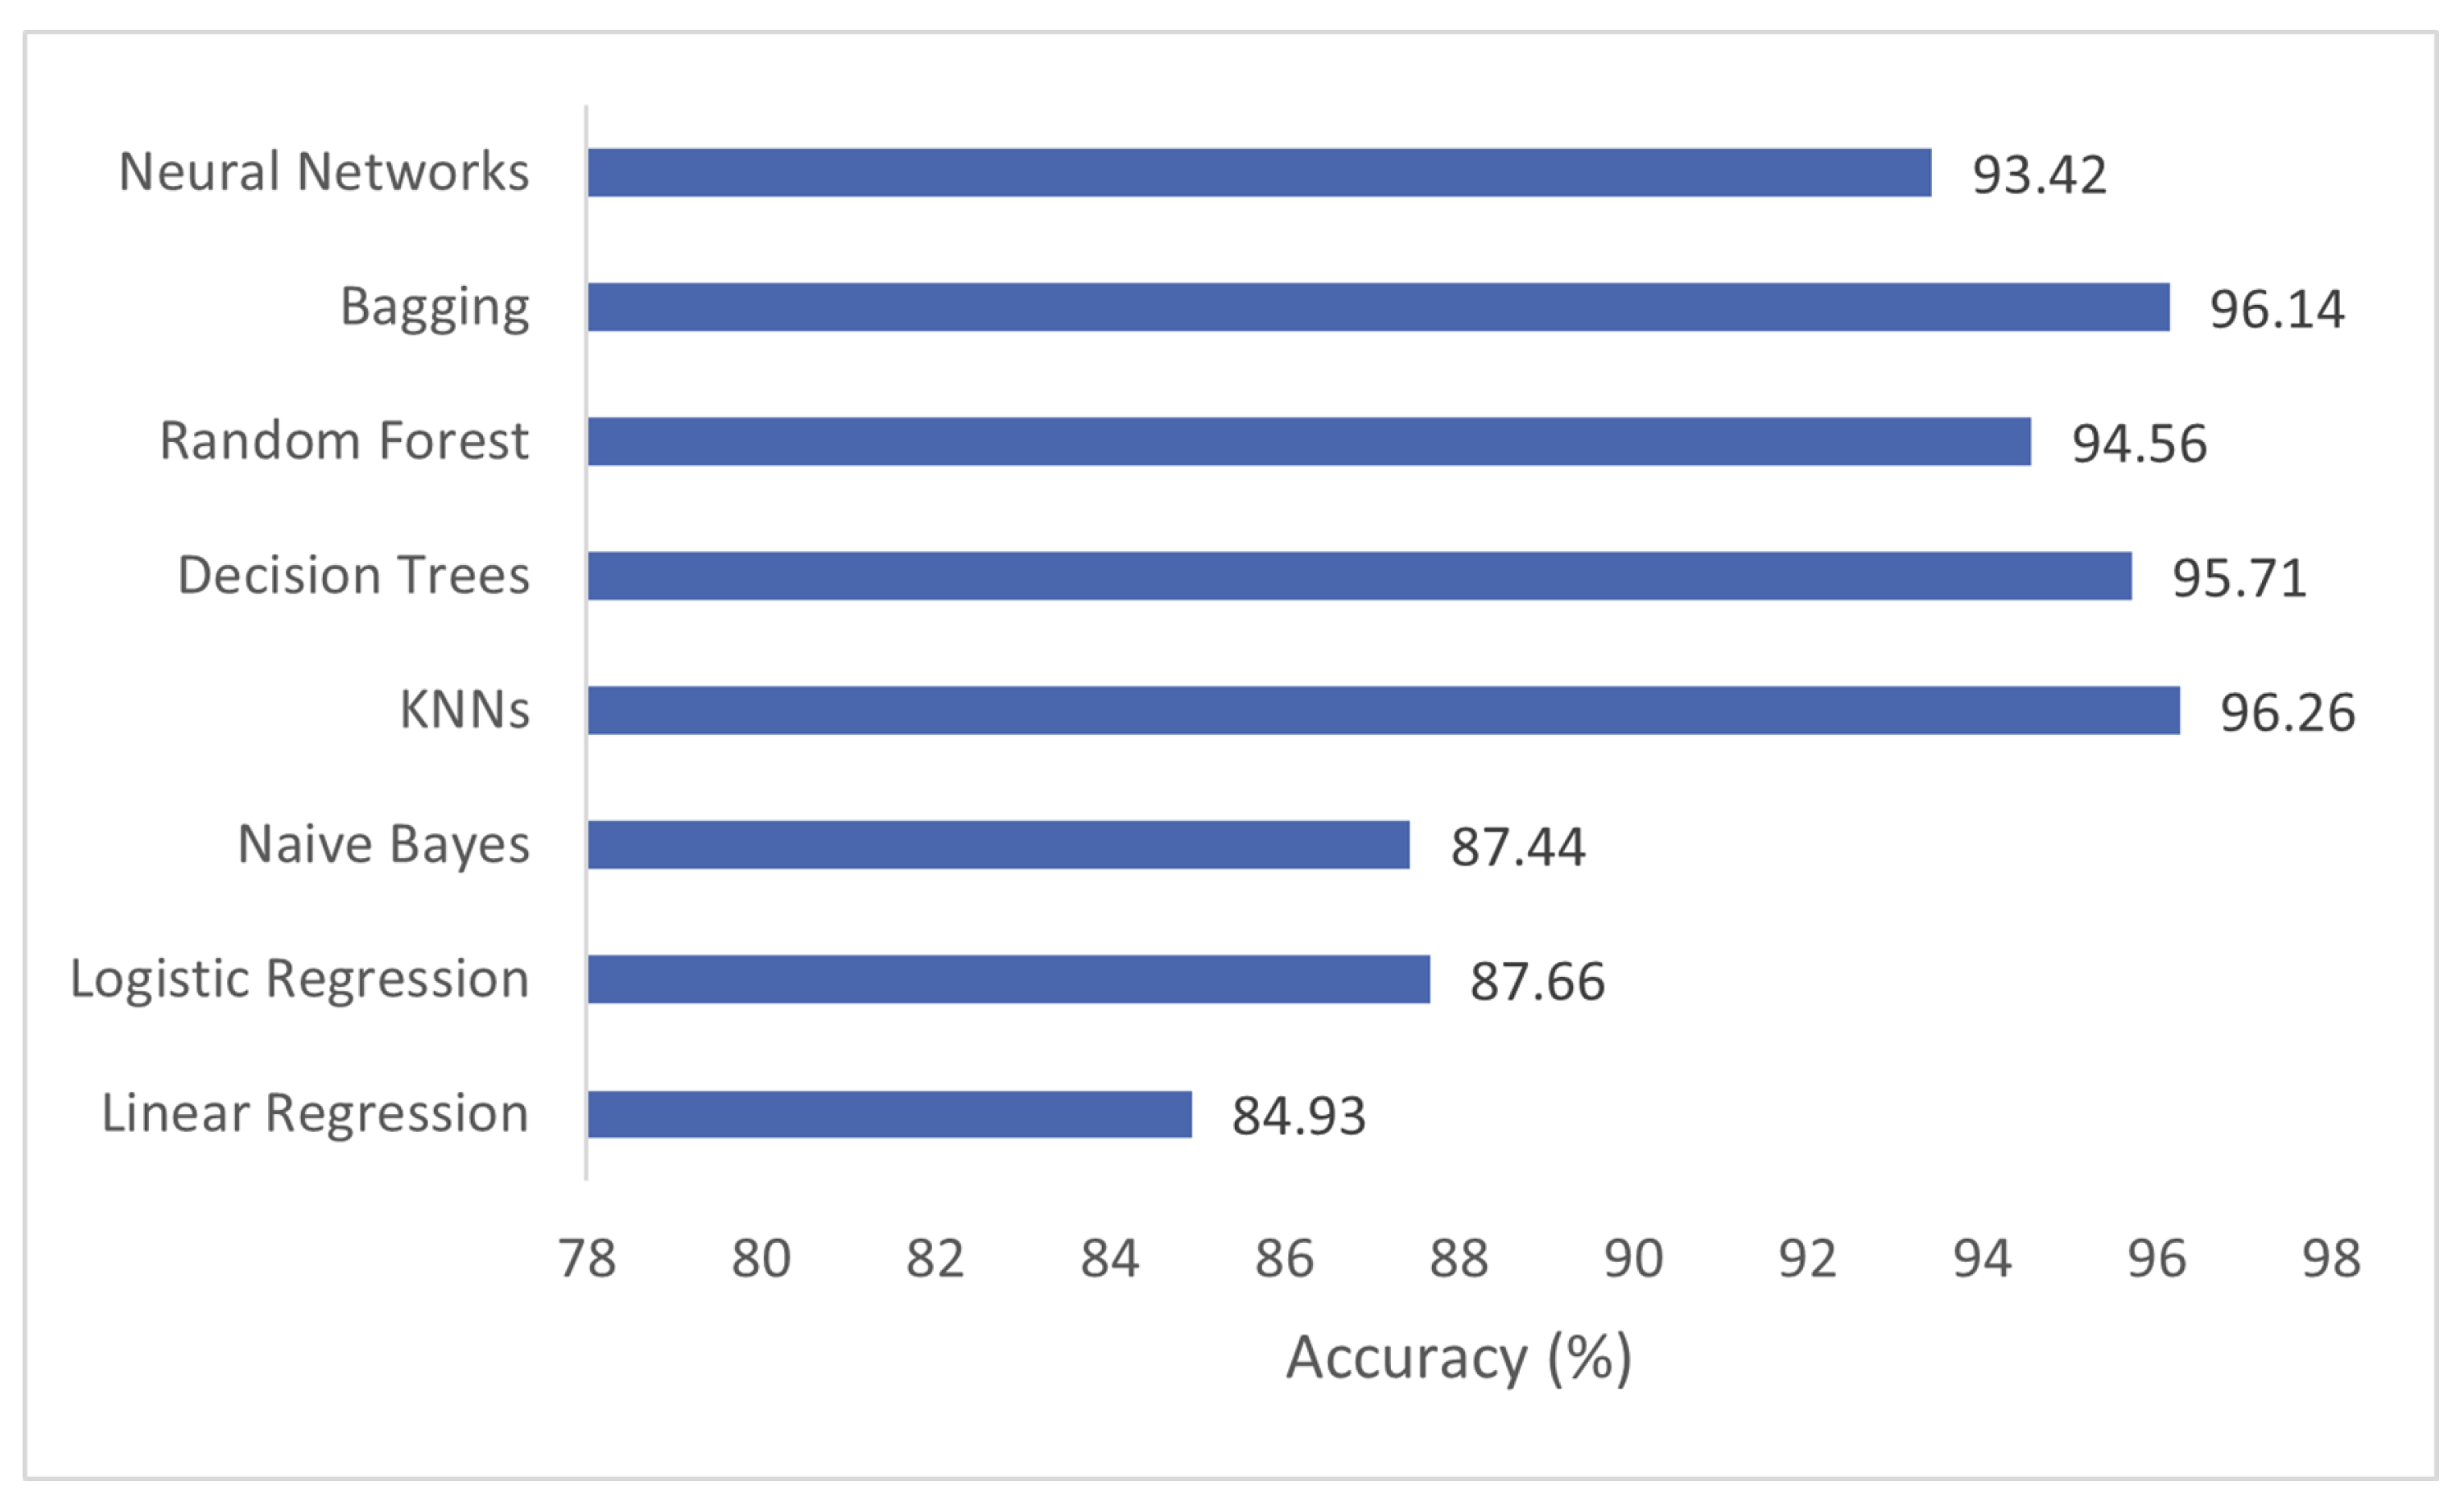
5.1.1. Accuracy
The different applied models achieved varying accuracies on the test data which are pictorially depicted in
Figure 8. Accuracy-wise, KNNs perform the best on the test data. It is clear from this figure that the traditional classifiers like linear regression, logistic regression, and Naïve Bayes do not perform as well on the dataset as do the other models. Due to this reason, these 3 algorithms were discarded from further analysis. The more detailed analysis focused on the performance of the remaining 5 algorithms that achieved an accuracy above 90%.
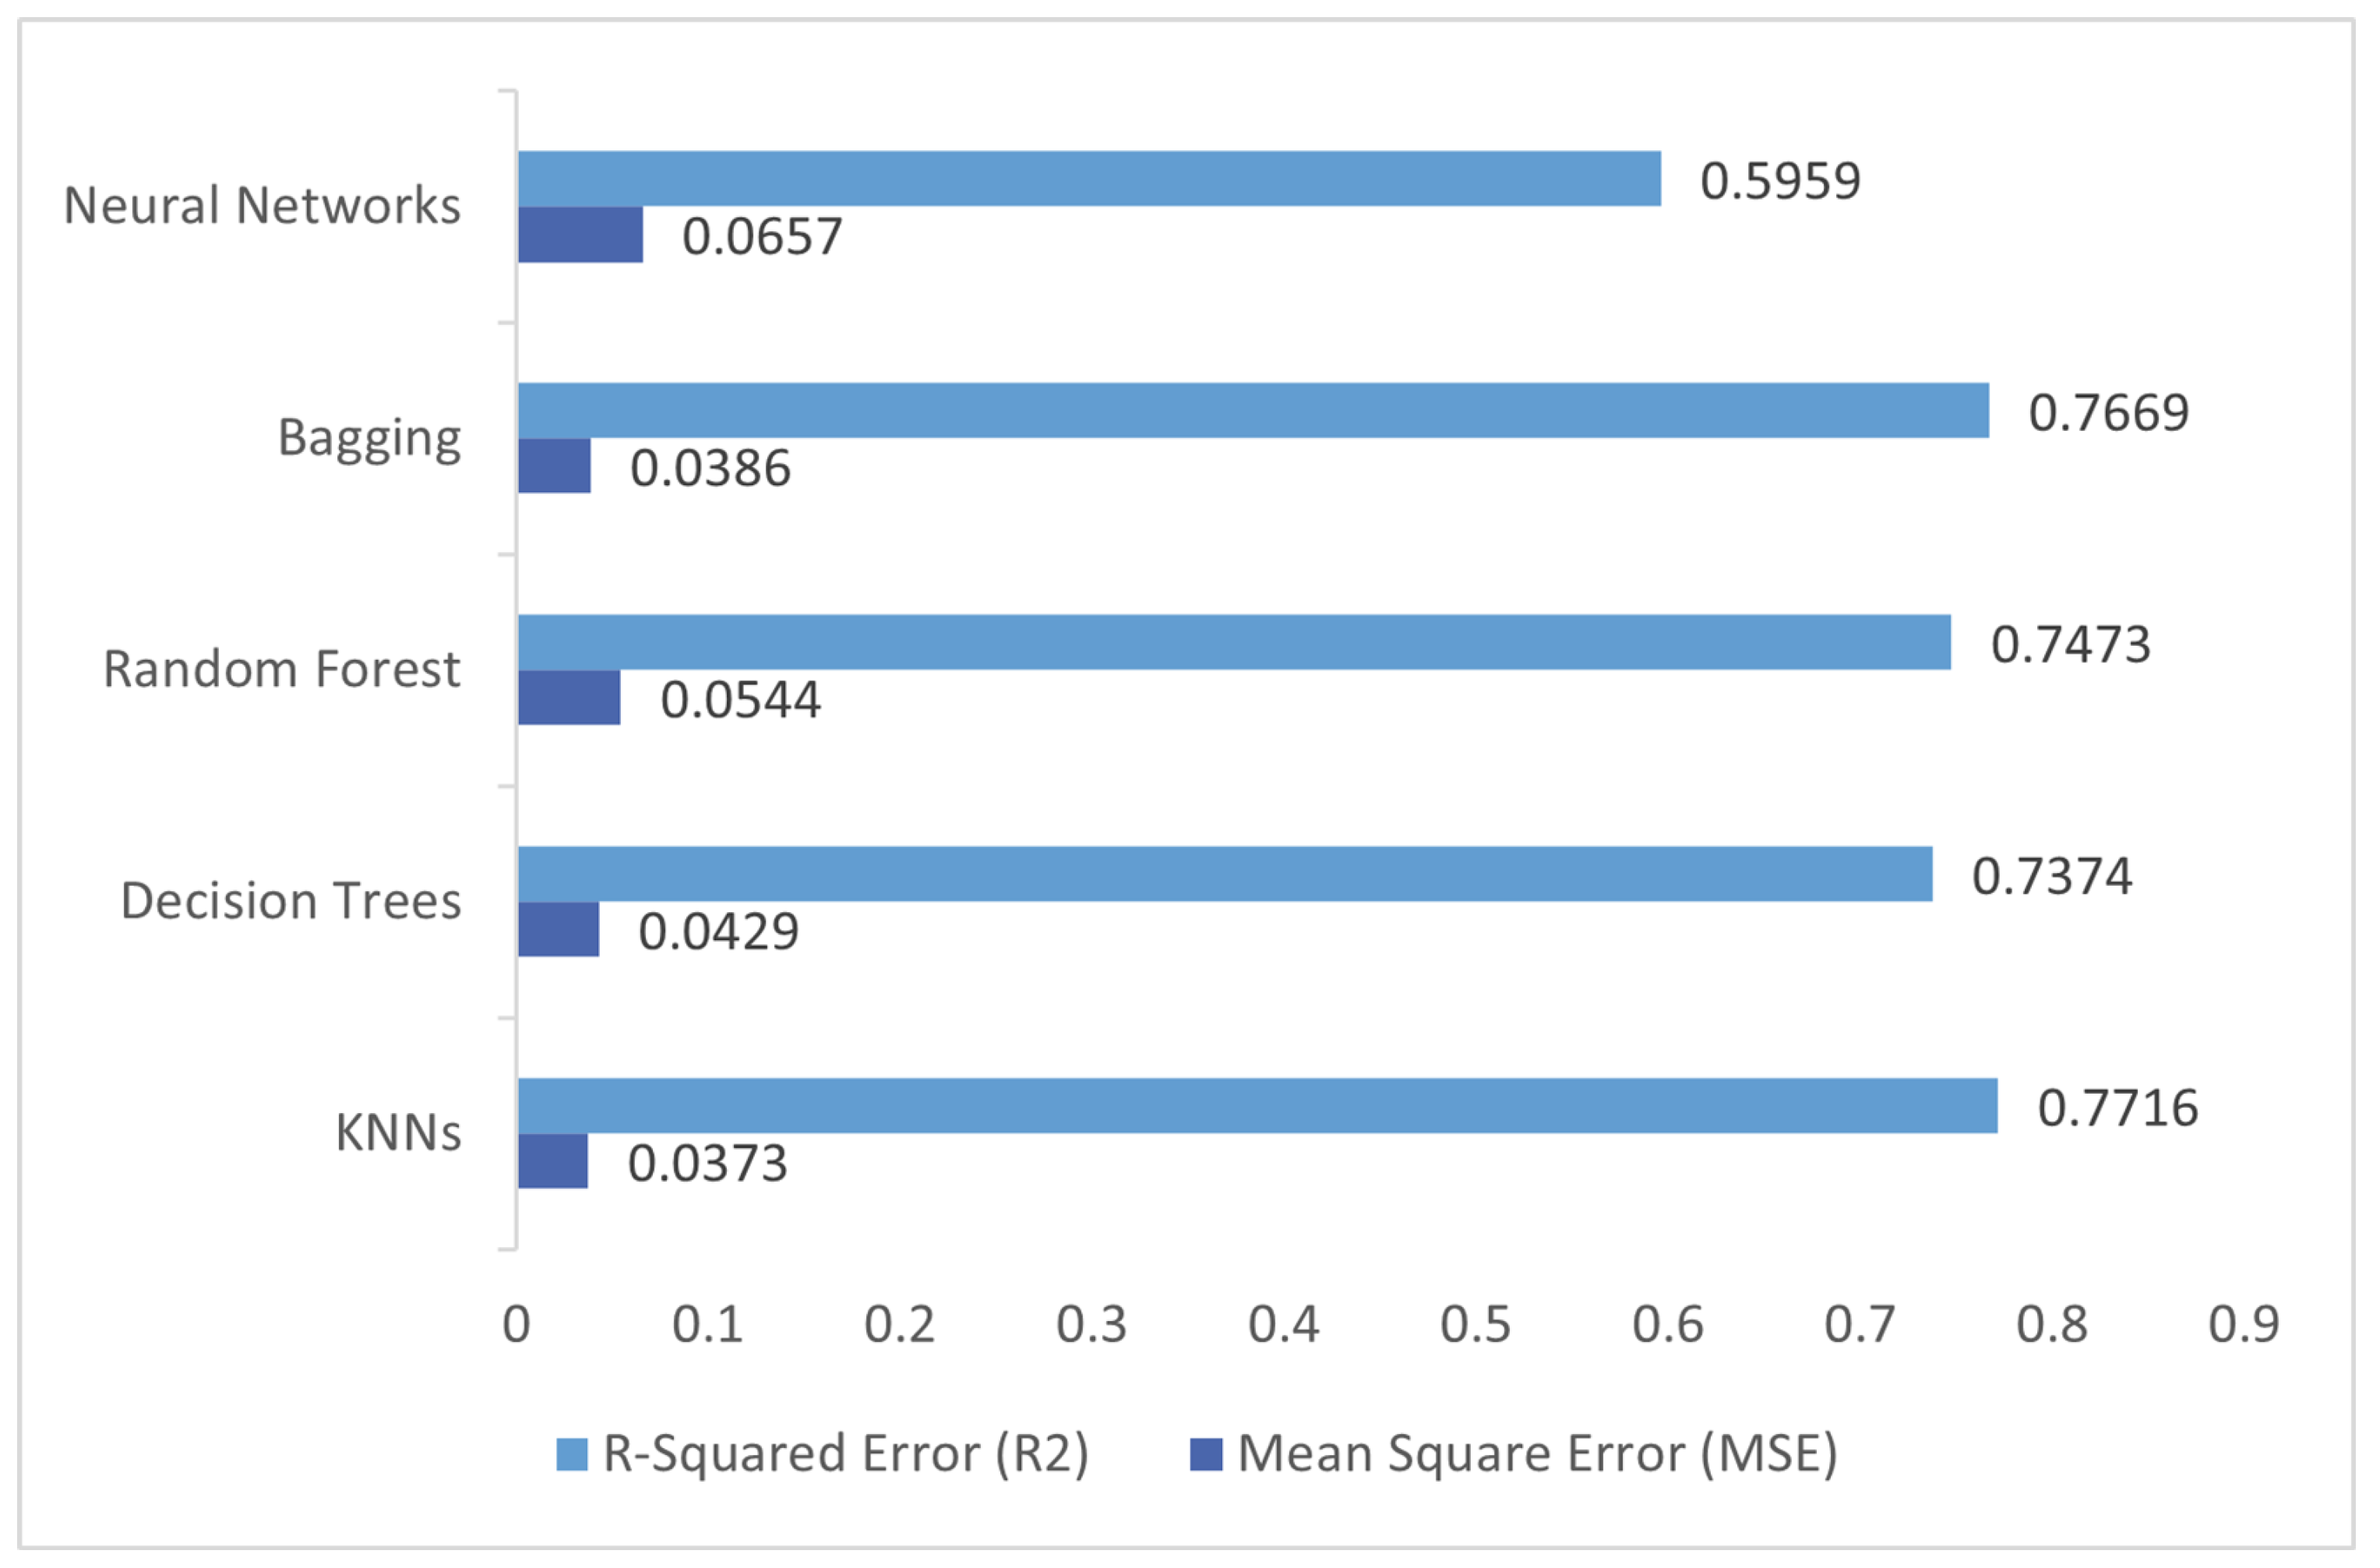
5.1.2. Errors
Mean Square Error (MSE) and the R-squared error were considered for the comparative analysis which will evaluate the performance of the models. These are well-accepted ML performance metrics and can provide great insight into how well a model is performing. These errors paint a similar picture of the ML models as does accuracy. A comparative overview of our model errors is depicted in
Figure 9. From the figure, it can be clearly seen that the performance of KNNs is the best while that of the Neural Networks is the worst among these algorithms. Although bagging is also a strong competitor with acceptable performance, close to that of KNNs.
5.1.3. Machine Learning Metrics
Different performance metrics are used to evaluate different Machine Learning Algorithms. For this purpose, precision, recall and F1 scores of ML models are important in evaluating these models.
- 1.
Precision: Precision is a measure of the ratio between the True Positives and all the Positives.
- 2.
Recall: The recall is the measure of an ML model correctly identifying True Positives.
- 3.
F1 score: 1. F1-score acts as a trade-off between precision and recall. More accurately, it is the harmonic mean of precision and recall.
Figure 10 shows the values of these performance metrics of the applied models: Again, according to these performance metrics, it is seen that KNNs performs the best while Neural Networks performs the worst. Random Forest also seems to have exceptional metric scores.
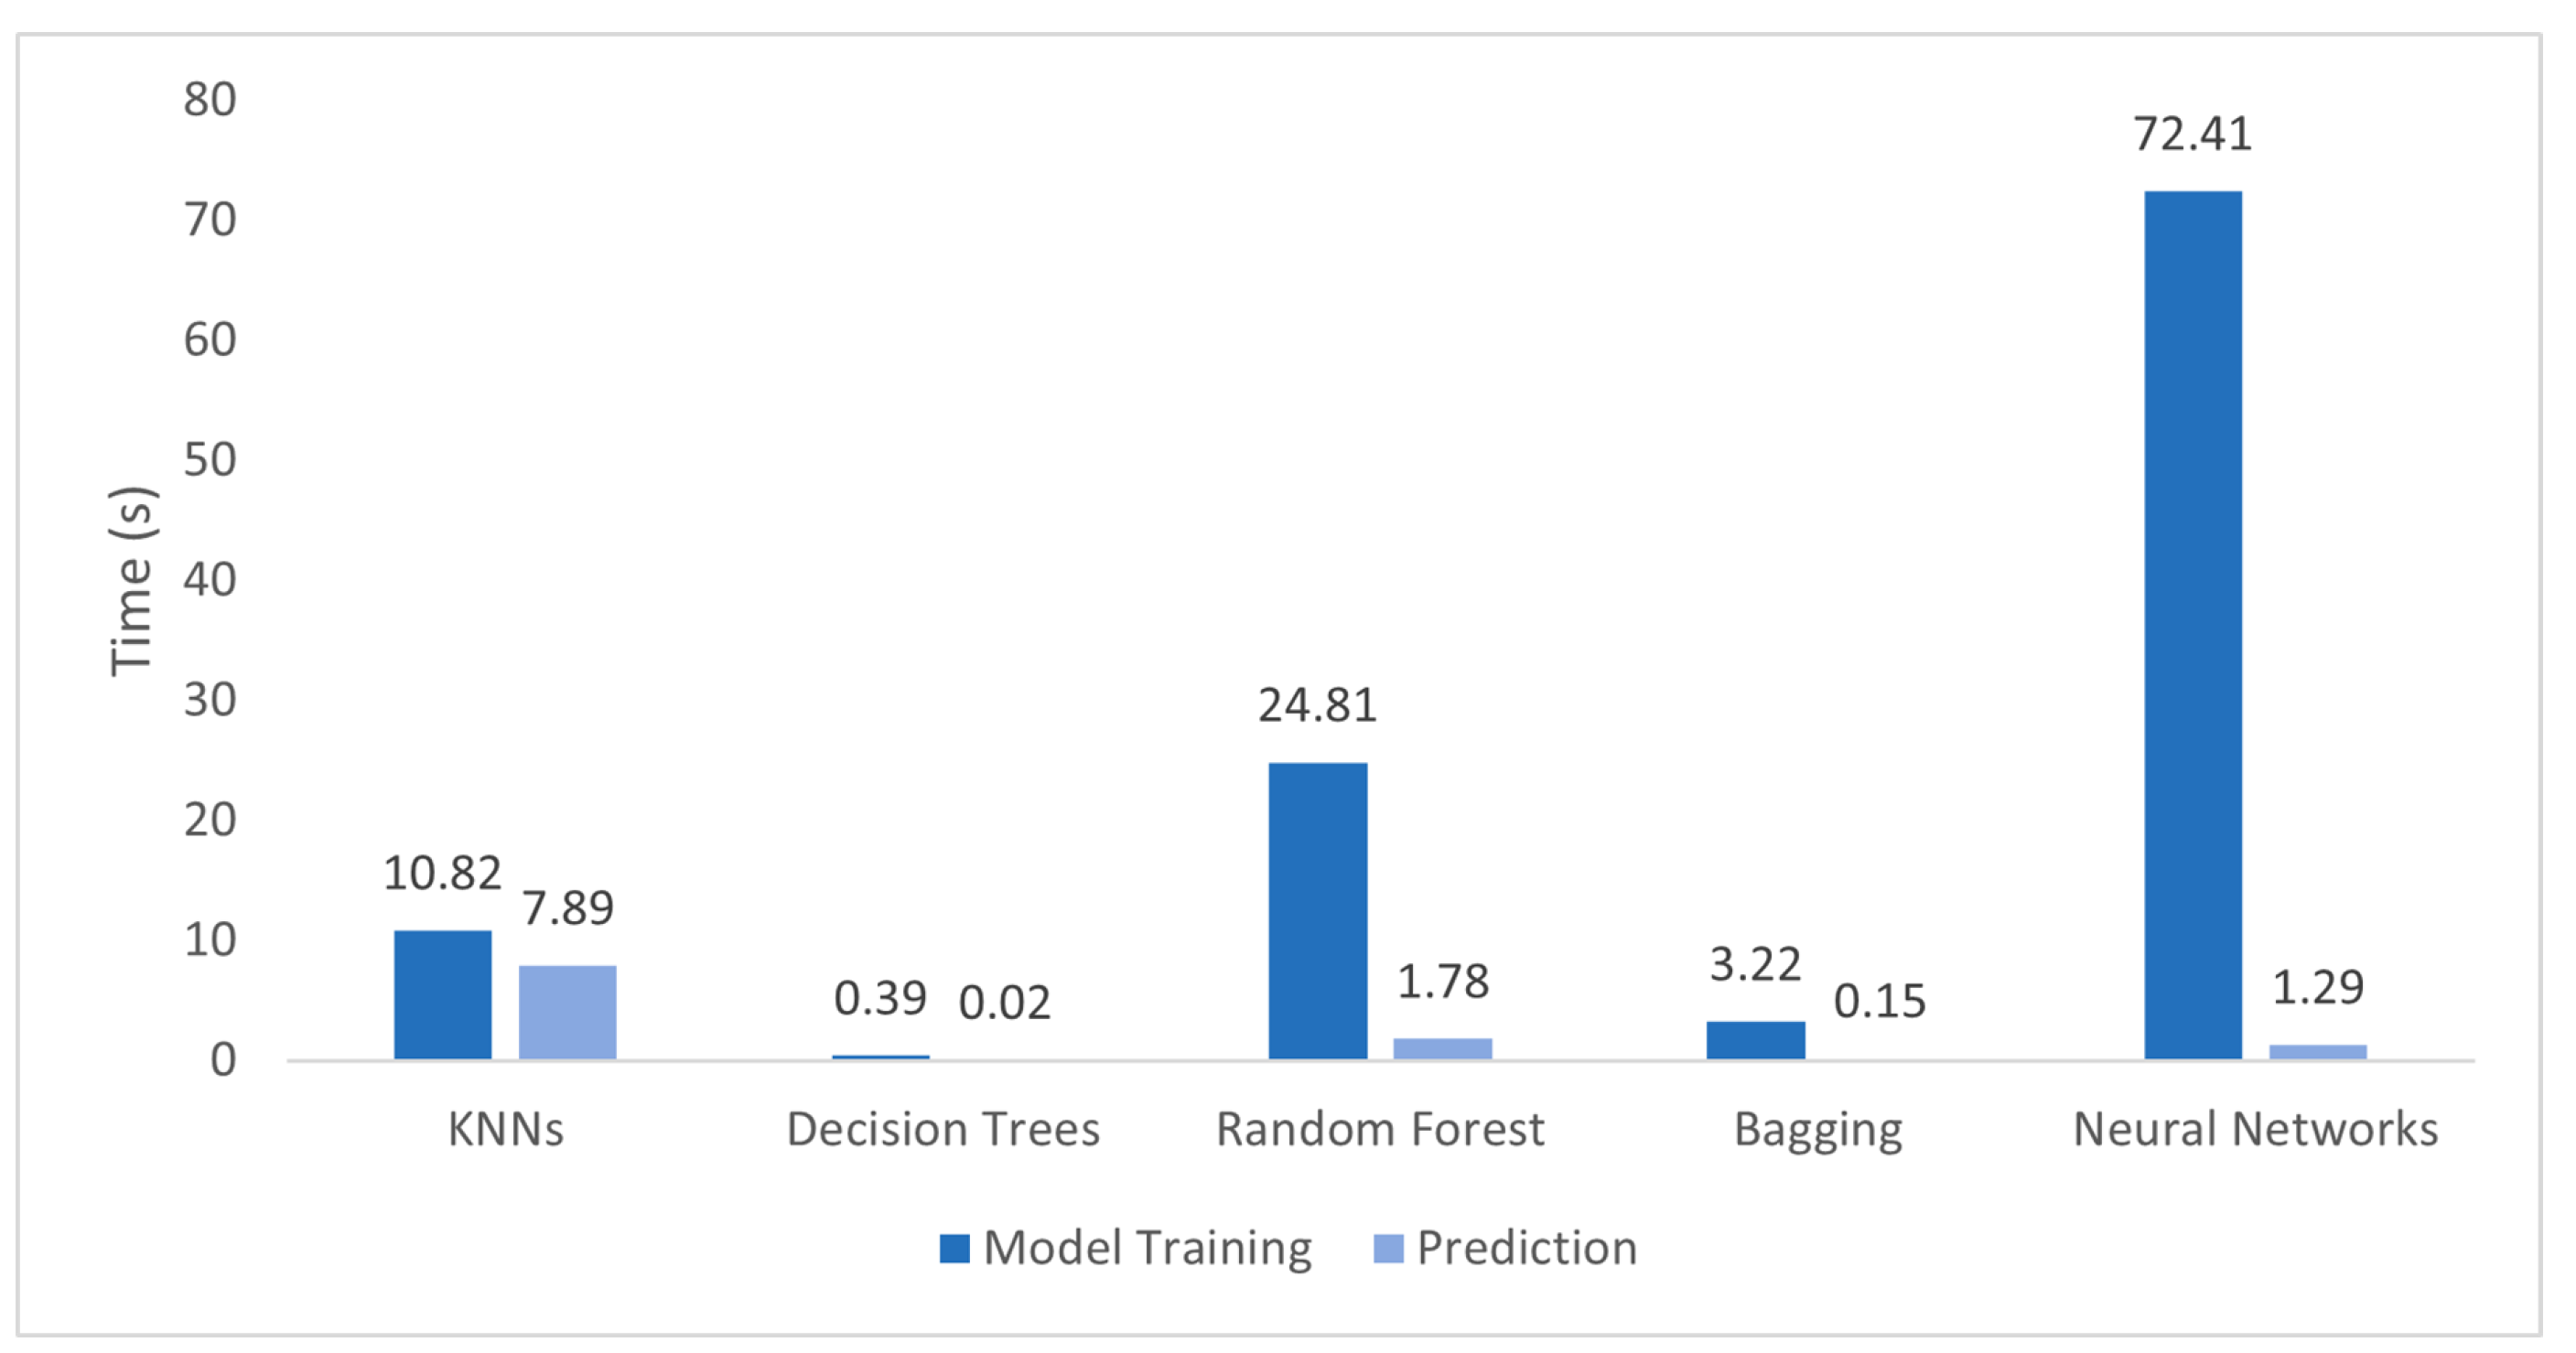
5.1.4. Computational Times
The performance analysis of these models seems incomplete without discussing the number of computational resources required. Especially in IoT-based solutions where edge computing is being employed i.e., ML models are performing inference on real-time data on the edge device, it becomes even more important to consider latency and resources needed. The comparison of computational times of these models (training and prediction) is shown in
Figure 11. The Neural Networks distinctively take a large amount of time for training, while Random Forest also does not perform quite well comparatively. The best performance, in this case, is that of Decision Trees.
5.2. ML Model Selection
Based on the comparative analysis performed in the last section, conclusions are drawn. From the analysis, the KNNs model performed the best on the test set in terms of accuracy, errors, and other performance metrics. It did not have the best results for computational time, but it was decided that it was a fair trade-off considering the exceptional performance of the model. The model does not need to be trained frequently, and the prediction time of the model is acceptable. Hence, the KNNs model was selected and optimized for deployment at the edge, the process of which was described previously. Due to COVID-19 restrictions in the country, the developed model could not be tested on actual cardiac patients. However, the prototype was tested by the authors in real-time and the sensed parameters were successfully published on the AWS cloud as seen in
Figure 12 and the website.
5.3. Web Portal
The web application was made alongside the hardware for effective visualization of the data for both the patient and the doctor and to develop some sort of communication channel between the two. The application was focused on providing access to the patient’s information that the doctor otherwise could not have had access to in remote conditions. The purpose of the website is to make the sharing of information between the patient and the doctor easy and convenient and to provide additional necessary information along with the real-time display of physical and physiological parameters and prediction from the machine learning model for improved and timely diagnosis.
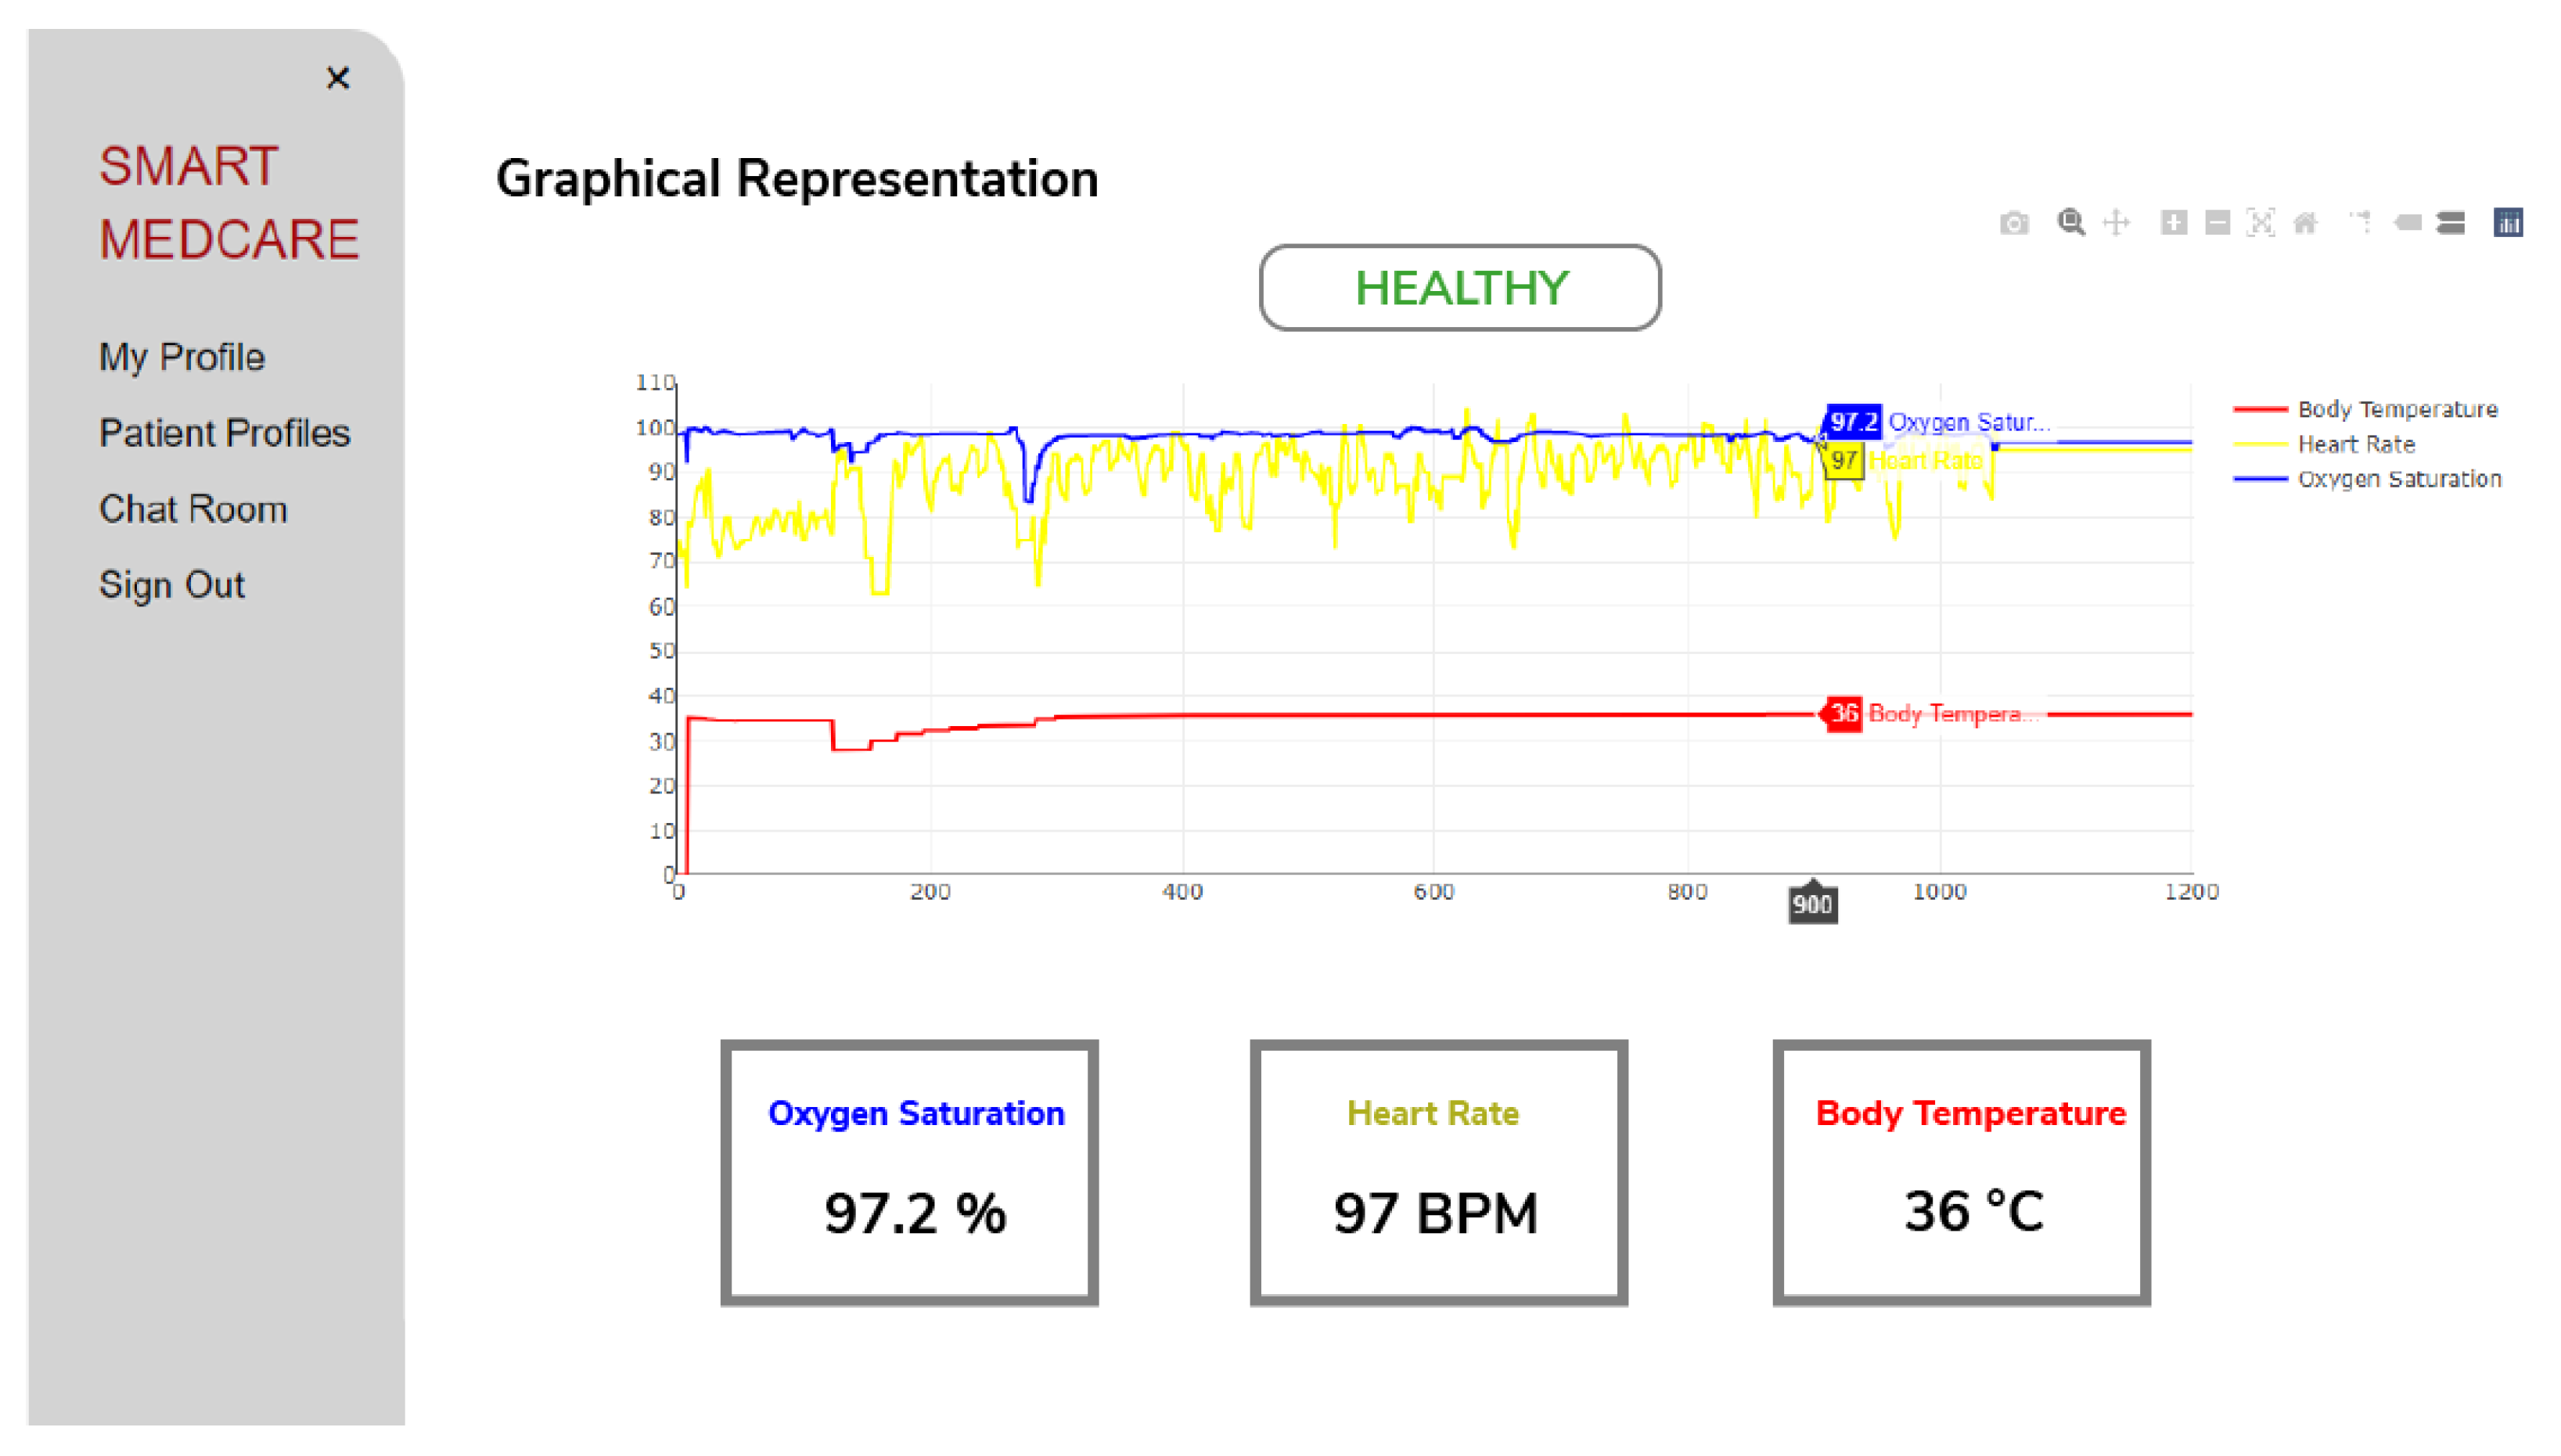
The application offers a variety of features including data security, alert notifications, multiple interfaces, and real-time data display. The real-time data is displayed in a graphical representation which can be seen in
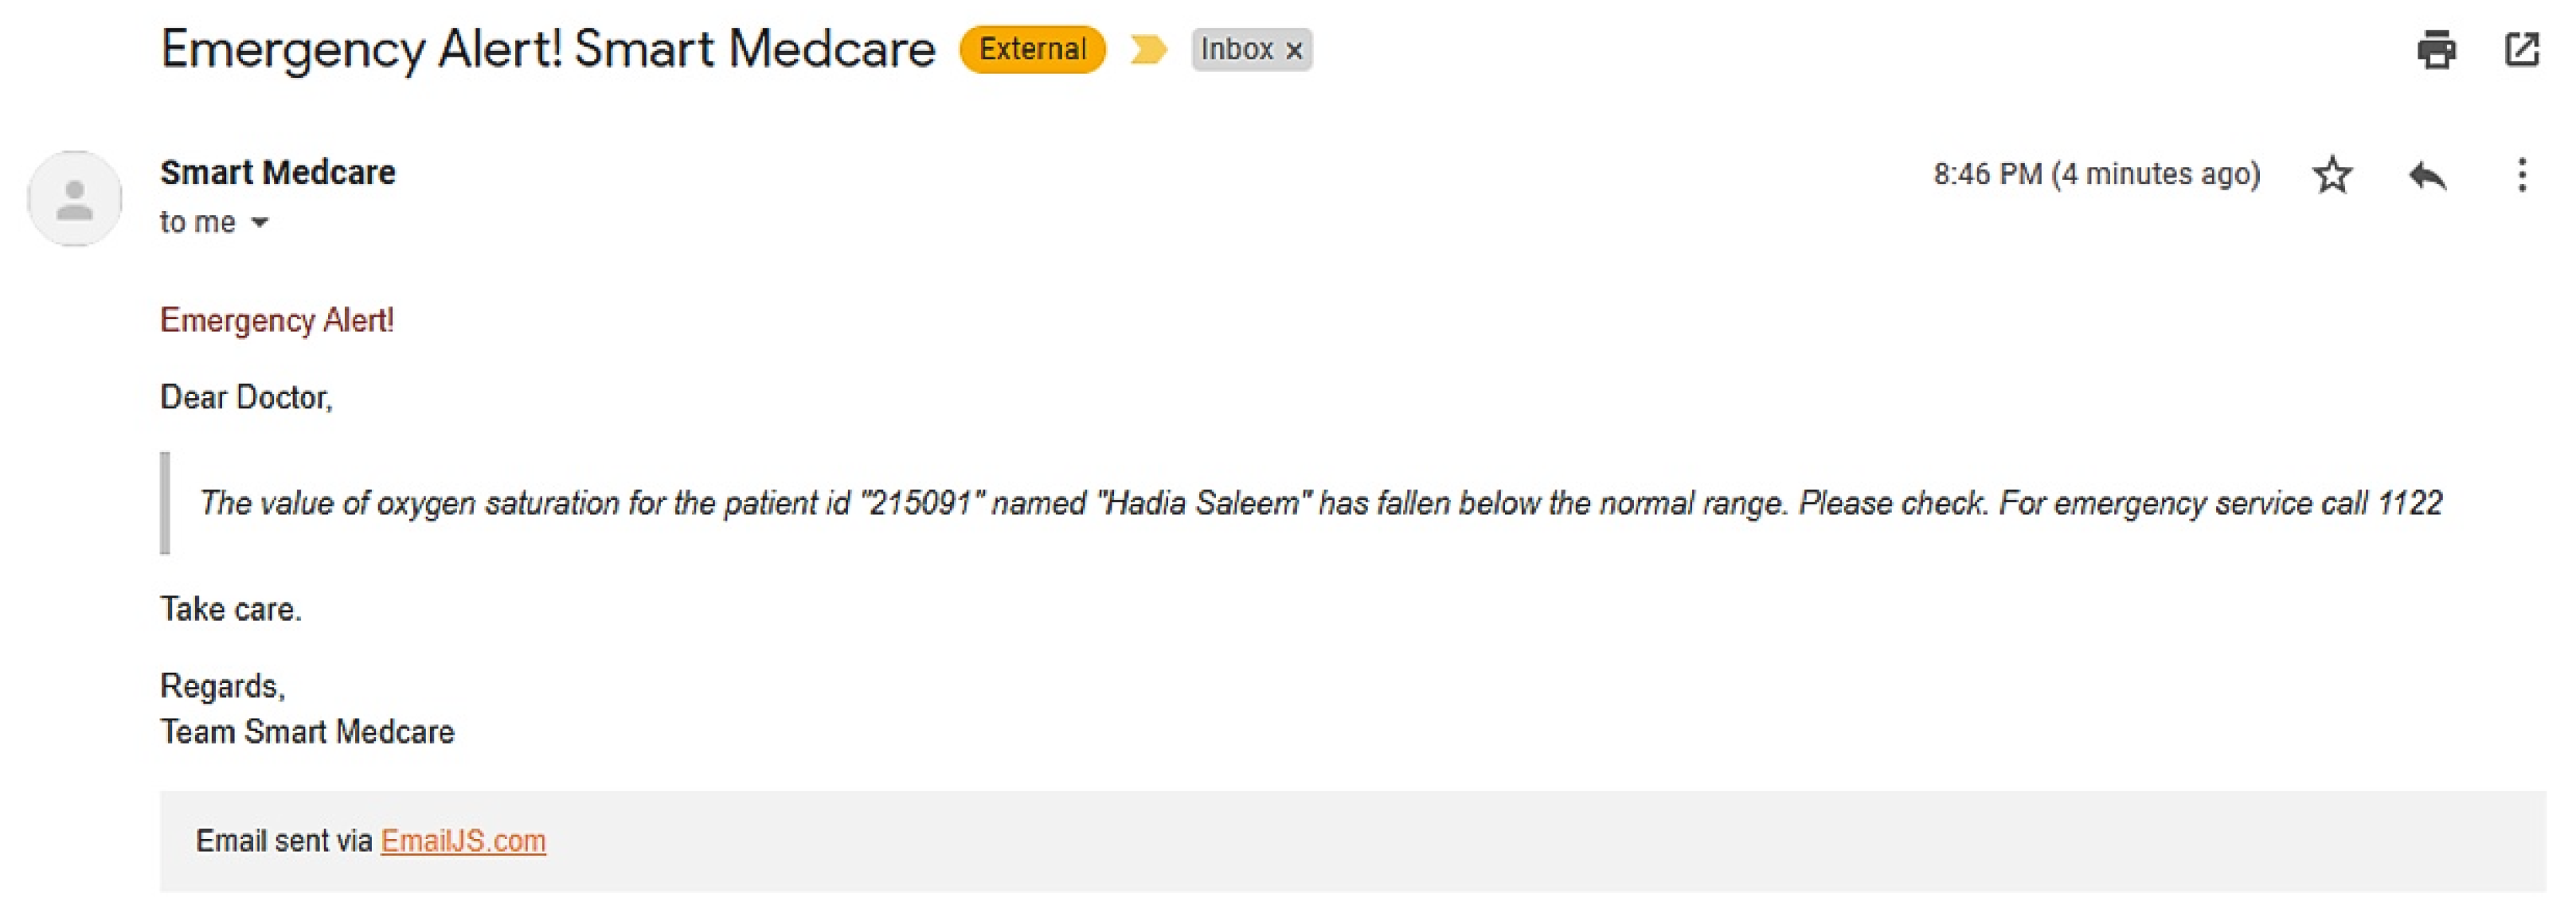
Figure 13. An alert is generated if the patient vitals fall out of range or the ML model predicts an anomaly. The notification can be seen on the website while simultaneously an alert e-mail is generated and sent to the relevant persons. The e-mail is shown in
Figure 14. The process of registration is easy, and the ID and password are assigned after the availability of the smart watch. The website uses the data from both real-time and static databases to display personal information, diagnosis remarks and vitals to the user.
6. Conclusions and Future Work
In this paper, an IoT-based prototype was developed, and ML and AI techniques were applied to the system. The IoT device enables smart monitoring of human vitals including oxygen saturation, heart rate, and body temperature. Real-time ML inference is enabled at the edge to provide critical notifications to patients, along with the concerned doctors or caretakers in case the patient’s vitals exhibit an anomaly. Moreover, the system is interfaced with a live web graphical user interface for doctors as well as patients, for management or monitoring purposes. This friendly user interface securely records the real-time patient’s data, and effectively manages it in a secure database. The appointed doctor can easily view the recorded as well as the live information (which also includes the ML inference results) and give their analysis accordingly.
The system offers several features in terms of both hardware and software. The system consists of a wearable prototype that is lightweight & compact, can be worn for a long period, can monitor a patient’s vitals in real-time without causing discomfort to the patient. The system uses edge computing techniques to make quick and reliable decisions locally. This feature improves the latency and detects any anomalous situation. The best hardware feature of the device is its portability. The device is wireless and hence it can be easily moved from one place to another. The patient and guardian can monitor the patient’s vital even from a remote location.
The developed system can be proved as a necessity to the medical sector especially in today’s time when people rely highly on technology and want a smart solution to their daily life problems. The proposed system not only saves them from their daily checkups but also provides a solution to the medical staff by reducing the burden on them and handling the patients remotely. This prototype can be used as an addition in medical camps and areas where developed hospitals are a scarcity. As compared to conventional healthcare, which is only limited to hospitals, the new paradigm of remotely monitoring the patients by exploiting the latest technologies such as IoT and AI is the future of health care and can help us to leverage these technologies and maximize their benefits.
More sensors i.e., measured vitals, can be added like an electrocardiogram, blood pressure, or respiration rate as the future work of this project. Especially in the present state of COVID, more decision-making features can be added to the project to detect the possibility of COVID. Since the model is basic, it can be used in integration with other parameters to develop for some designated disease. The AI part of the system can be improved to offer trend analysis on the user’s data. Since, medical is a very vast field and different ailments can have similar symptoms, therefore a model with very high precision and accuracy will be required. The prototype in addition to the model and the portal can be used as a primary registration step at hospitals as it will save medical staff time in collecting the information and measuring the vitals. Hence, it will be a good addition for automating the registry system in the hospitals. Moreover, the project can be developed into a remote clinic where the patients can choose between a continuous monitoring or consulting facility. In addition, the project can be commercialized, more units can be developed and deployed at some private or public hospital for the initial testing and if they are successful more units can be implemented and deployed. Therefore, the developed prototype is flexible and can find part of a beneficial component in many applications.
Author Contributions
Z.A.: Conceptualization, Methodology, Investigation, Writing-Original Draft, Review & Editing; R.M.: Conceptualization, Methodology, Validation, Investigation, Writing-Original Draft, Writing-Review & Editing, Visualization, Supervision, project administration; A.R.: Conceptualization, Validation, Data-curation, Investigation, Writing-Original Draft, Review & Editing, Visualization; S.M.H.Z.: Software, Validation, Data Curation, Writing-Original Draft, Writing-Review & Editing, Visualization, project administration; H.S.: Methodology, Software, Validation, Investigation, Writing-Original Draft; S.M.: Data-curation, Methodology, Validation, Investigation, Writing-Review & Editing, Visualization; A.S.: Investigation, Methodology, Writing-Review & Editing, validation, Visualization; E.D.P.: Investigation, Methodology, Writing-Review & Editing, validation, Visualization; I.M.: Investigation, Methodology, Writing-Review & Editing, validation, Visualization. All authors have read and agreed to the published version of the manuscript.
Funding
This project is supported by the Erasmus+ program of the European Commission through the ’Capacity Building for Digital Health Monitoring and Care Systems in Asia (DigiHealth-Asia)’ under grant agreement number 619193-EPP-1-2020-BE-EPPKA2-CBHE-JP.
Institutional Review Board Statement
Not applicable since the study does not involve any clinical trials.
Informed Consent Statement
The validation and testing of the developed Machine Learning model was done by authors on themselves, therefore Informed consent was not necessary in this study.
Data Availability Statement
The data may be requested by reaching out to authors through email.
Acknowledgments
The research and development of this work is conducted in IoT Lab, NUST-SEECS, Islamabad, Pakistan.
Conflicts of Interest
The authors declare no conflict of interest.
References
- Khalid, A.; Ali, S. COVID-19 and its Challenges for the Healthcare System in Pakistan. Asian Bioeth. Rev. 2020, 12, 551–564. [Google Scholar] [CrossRef] [PubMed]
- Bin Habib, A.Z.S.; Tasnim, T. An Ensemble Hard Voting Model for Cardiovascular Disease Prediction. In Proceedings of the 2020 2nd International Conference on Sustainable Technologies for Industry 4.0 (STI), Dhaka, Bangladesh, 19–20 December 2020; pp. 1–6. [Google Scholar] [CrossRef]
- Scott, J. The Benefits of Remote Patient Monitoring Are Wide Ranging. HealthTech 2021. Available online: https://ramaonhealthcare.com/the-benefits-of-remote-patient-monitoring-are-wide-ranging/ (accessed on 28 July 2021).
- Varshney, H.; Allahloh, A.S.; Sarfraz, M. IoT Based eHealth Management System Using Arduino and Google Cloud Firestore. In Proceedings of the 2019 International Conference on Electrical, Electronics and Computer Engineering (UPCON), Aligarh, India, 8–10 November 2019; pp. 1–6. [Google Scholar] [CrossRef]
- Neyja, M.; Mumtaz, S.; Huq, K.M.S.; Busari, S.A.; Rodriguez, J.; Zhou, Z. An IoT-Based E-Health Monitoring System Using ECG Signal. In Proceedings of the GLOBECOM 2017–2017 IEEE Global Communications Conference, Singapore, 4–8 December 2017; pp. 1–6. [Google Scholar] [CrossRef]
- Pandey, H.; Prabha, S. Smart Health Monitoring System using IOT and Machine Learning Techniques. In Proceedings of the 2020 Sixth International Conference on Bio Signals, Images, and Instrumentation (ICBSII), Chennai, India, 27–28 February 2020; pp. 1–4. [Google Scholar] [CrossRef]
- Hakak, S.; Ray, S.; Khan, W.Z.; Scheme, E. A Framework for Edge-Assisted Healthcare Data Analytics using Federated Learning. In Proceedings of the 2020 IEEE International Conference on Big Data (Big Data), Atlanta, GA, USA, 10–13 December 2020; pp. 3423–3427. [Google Scholar] [CrossRef]
- Bhanuteja, G.; Kandi, K.A.; Srinidhi, K.; Dikshitha, R.; Kumar, A. CAMISA: An AI Solution for COVID-19. In Proceedings of the 2021 International Conference on Design Innovations for 3Cs Compute Communicate Control (ICDI3C), Bangalore, India, 10–11 June 2021; pp. 216–222. [Google Scholar] [CrossRef]
- Rahman, M.A.; Hossain, M.S. An Internet-of-Medical-Things-Enabled Edge Computing Framework for Tackling COVID-19. IEEE Internet Things J. 2021, 8, 15847–15854. [Google Scholar] [CrossRef]
- Binah.ai. The New Way to Extract Health Data is Software-Based. Healthcare. Available online: https://www.binah.ai/ (accessed on 15 November 2021).
- ESP32. Available online: https://www.espressif.com/en/products/socs/esp32 (accessed on 5 August 2021).
- Raspberry Pi 4. Available online: https://datasheets.raspberrypi.org/rpi4/raspberry-pi-4-datasheet.pdf (accessed on 5 August 2021).
- Maxim Integrated Products. MAX30102, High-Sensitivity Pulse Oximeter and Heart-Rate Sensor for Wearable Health. Available online: https://www.maximintegrated.com/en/products/interface/sensor-interface/MAX30102.html (accessed on 1 June 2021).
- Melexis. MLX90614, Digital Plug & Play Infrared Thermometer in a TO-can. Available online: https://www.melexis.com/en/product/MLX90614/Digital-Plug-Play-Infrared-Thermometer-TO (accessed on 5 August 2021).
- Suprayitno, E.A.; Marlianto, M.R.; Mauliana, M.I. Measurement device for detecting oxygen saturation in blood, heart rate, and temperature of human body. J. Phys. Conf. Ser. 2019, 1402, 033110. [Google Scholar] [CrossRef]
- Johnson, A.; Tom Pollard, R.M. MIMIC-III Clinical Database (Version 1.4). PhysioNet 2016, 10, C2XW26. [Google Scholar] [CrossRef]
- Kumar, N. Data Wrangling: Removing Null Values from Dataset in Python using Pandas Library. Prof. Point 2019. Available online: http://theprofessionalspoint.blogspot.com/2019/03/data-wrangling-removing-null-values.html (accessed on 28 July 2021).
- MedlinePlus. Vital Signs. In Medical Encyclopedia. Available online: https://medlineplus.gov/ency/article/002341.htm (accessed on 1 May 2021).
- MDH. Oxygen Levels, Pulse Oximeters, and COVID-19. Available online: https://www.health.state.mn.us/diseases/coronavirus/pulseoximeter.html (accessed on 25 April 2021).
| Publisher’s Note: MDPI stays neutral with regard to jurisdictional claims in published maps and institutional affiliations. |
© 2022 by the authors. Licensee MDPI, Basel, Switzerland. This article is an open access article distributed under the terms and conditions of the Creative Commons Attribution (CC BY) license (https://creativecommons.org/licenses/by/4.0/).


 ,
, 


