Article

Spatiotemporal Deformation of Existing Pipeline Due to New Shield Tunnelling Parallel Beneath Considering Construction Process

1
Liaoning Key Laboratory of Marine Environmental Bridge and Tunnel Engineering, Dalian Maritime University, Dalian 116026, China
2
Key Laboratory for Urban Underground Engineering of Ministry of Education, Beijing Jiaotong University, Beijing 100044, China
3
Nanchang Rail Transit Group Co., Ltd., Nanchang 330100, China
*
Author to whom correspondence should be addressed.
Appl. Sci. 2022, 12(1), 500; https://doi.org/10.3390/app12010500
Submission received: 8 December 2021 / Revised: 30 December 2021 / Accepted: 2 January 2022 / Published: 5 January 2022
(This article belongs to the Special Issue Deep Rock Mass Engineering: Excavation, Monitoring, and Control)

Abstract

:
In this paper, we study the effects of the shield tunnel construction on the deformation of an existing pipeline parallel to and above the new shield tunnel. We propose an analytical solution to predict the spatiotemporal deformation of the existing pipeline and consider different force patterns of the shield tunnelling, i.e., ground volume loss, support pressure, frictional force, and torsional force. The proposed method is validated by the monitoring data of Subway Line 3 of Nanchang and provides a reasonable estimation of the pipeline’s deformation. The parametric analyses are performed to study the influences on the pipeline’s deformation. The main advantage of our paper is that the spatiotemporal characteristics of the existing pipeline’s deformation are analysed, providing longitudinal deformation curve (LDC), deformation development curve (DDC), and grouting reinforcement curve (GRC). Compared with the perpendicular undercrossing project, both LDC and DDC have the same profiles and maximum values and move forward as a whole with the shield tunnel advance. Thus, the spatiotemporal deformation of the overall pipeline can be extrapolated from the deformation of two known points on the pipeline. The spatiotemporal characteristic curves combined with LDC, DDC, and GRC can suggest feasible, effective, and economical construction and grouting schemes to control the pipeline’s deformation after the deformation control standards have been determined.

1. Introduction

The shield method was widely used to build tunnels in densely urban areas due to its fast construction speed and high safety. As more and more shield tunnels are built, some new tunnels will be inevitably excavated beneath some existing pipelines. To ensure the safety and serviceability of the existing pipelines, some researchers have systematically studied the mechanical behaviours of existing pipelines. The researchers commonly used field measurements [1,2,3,4,5], laboratory test methods [6,7,8], numerical simulations [9,10,11], and analytical methods.
The analytical method is convenient and straightforward to study the tunnel-soil-pipeline interaction (TSPI). The main analytical method consists of the elastic continuum approach [12,13,14,15] and the subgrade reaction analysis [16,17,18,19,20,21]. In these methods, the existing pipelines are regarded as equivalent beams resting on elastic foundation models (Winkler model, Pasternak model, Kerr model). These foundation models consist of closely spaced linear springs and shear layers to model the TSPI. A series of springs provide subgrade reaction forces to prevent the existing pipeline from deforming. The subgrade reaction forces depend on the tunnelling-induced ground movements that are significant for predicting the existing pipeline’s deformation.
The empirical and analytical methods have been commonly employed to estimate the tunnelling-induced ground movements. Peck [22] proposed an empirical solution to represent the tunnelling-induced ground deformation trough. Based on Peck’s solution, relative researchers have proposed modified solutions, considering the influences of ground conditions and buried depths. Compared with the empirical solution, the analytical solution has a rigorous framework. Mindlin’s solution [23], virtual image method [24], and complex variable solution [25] are commonly used to predict the ground movements. These analytical methods have inspired further investigations about tunnelling-induced ground movements [26,27,28,29,30,31]. Li et al. [32,33] proposed analytical solutions of ground movements due to curved shield tunnelling.
Most previous studies have focused on the final deformation of ground and existing pipelines, regardless of the deformation in the construction process with spatiotemporal characteristics. As a result, the analytical predictions cannot be used during tunnel construction to suggest appropriate measures to control the structural deformation. Moreover, the applied forces of the shield machine to the surrounding soil are also frequently ignored in analytical methods. The tunnel construction process, applied forces, and backfill grouting should be considered to analyse the spatiotemporal deformation of existing pipelines.
This paper aims to analyse the spatiotemporal characteristics of an existing pipeline’ deformation using the virtual image method, Mindlin’s solution, and subgrade reaction analysis. The virtual image method and Mindlin’s solution calculate the ground deformation induced by the ground volume loss, the supporting pressure at tunnel face, the frictional force of shield shell, and the torsional force of cutter head. Subsequently, the subgrade reaction analysis calculates the deformation of existing pipelines. The spatiotemporal deformation considers the shield tunnel construction and grouting processes. Moreover, the mechanical behaviour of the existing pipelines due to the shield tunnelling parallel beneath in Nanchang subway Line 3 is investigated to validate our proposed method. The influences of the shield tunnel construction factors on the existing pipeline’s deformation are carried out. Besides, we provide the longitudinal deformation curve (LDC), deformation development curve (DDC), and grouting reinforcement curve (GRC). The spatiotemporal characteristic curves combined with LDC, DDC, and GRC can give feasible, effective, and economical construction and grouting schemes to control the deformation. Figure 1 shows the flow chart of this paper to express a clear research framework.

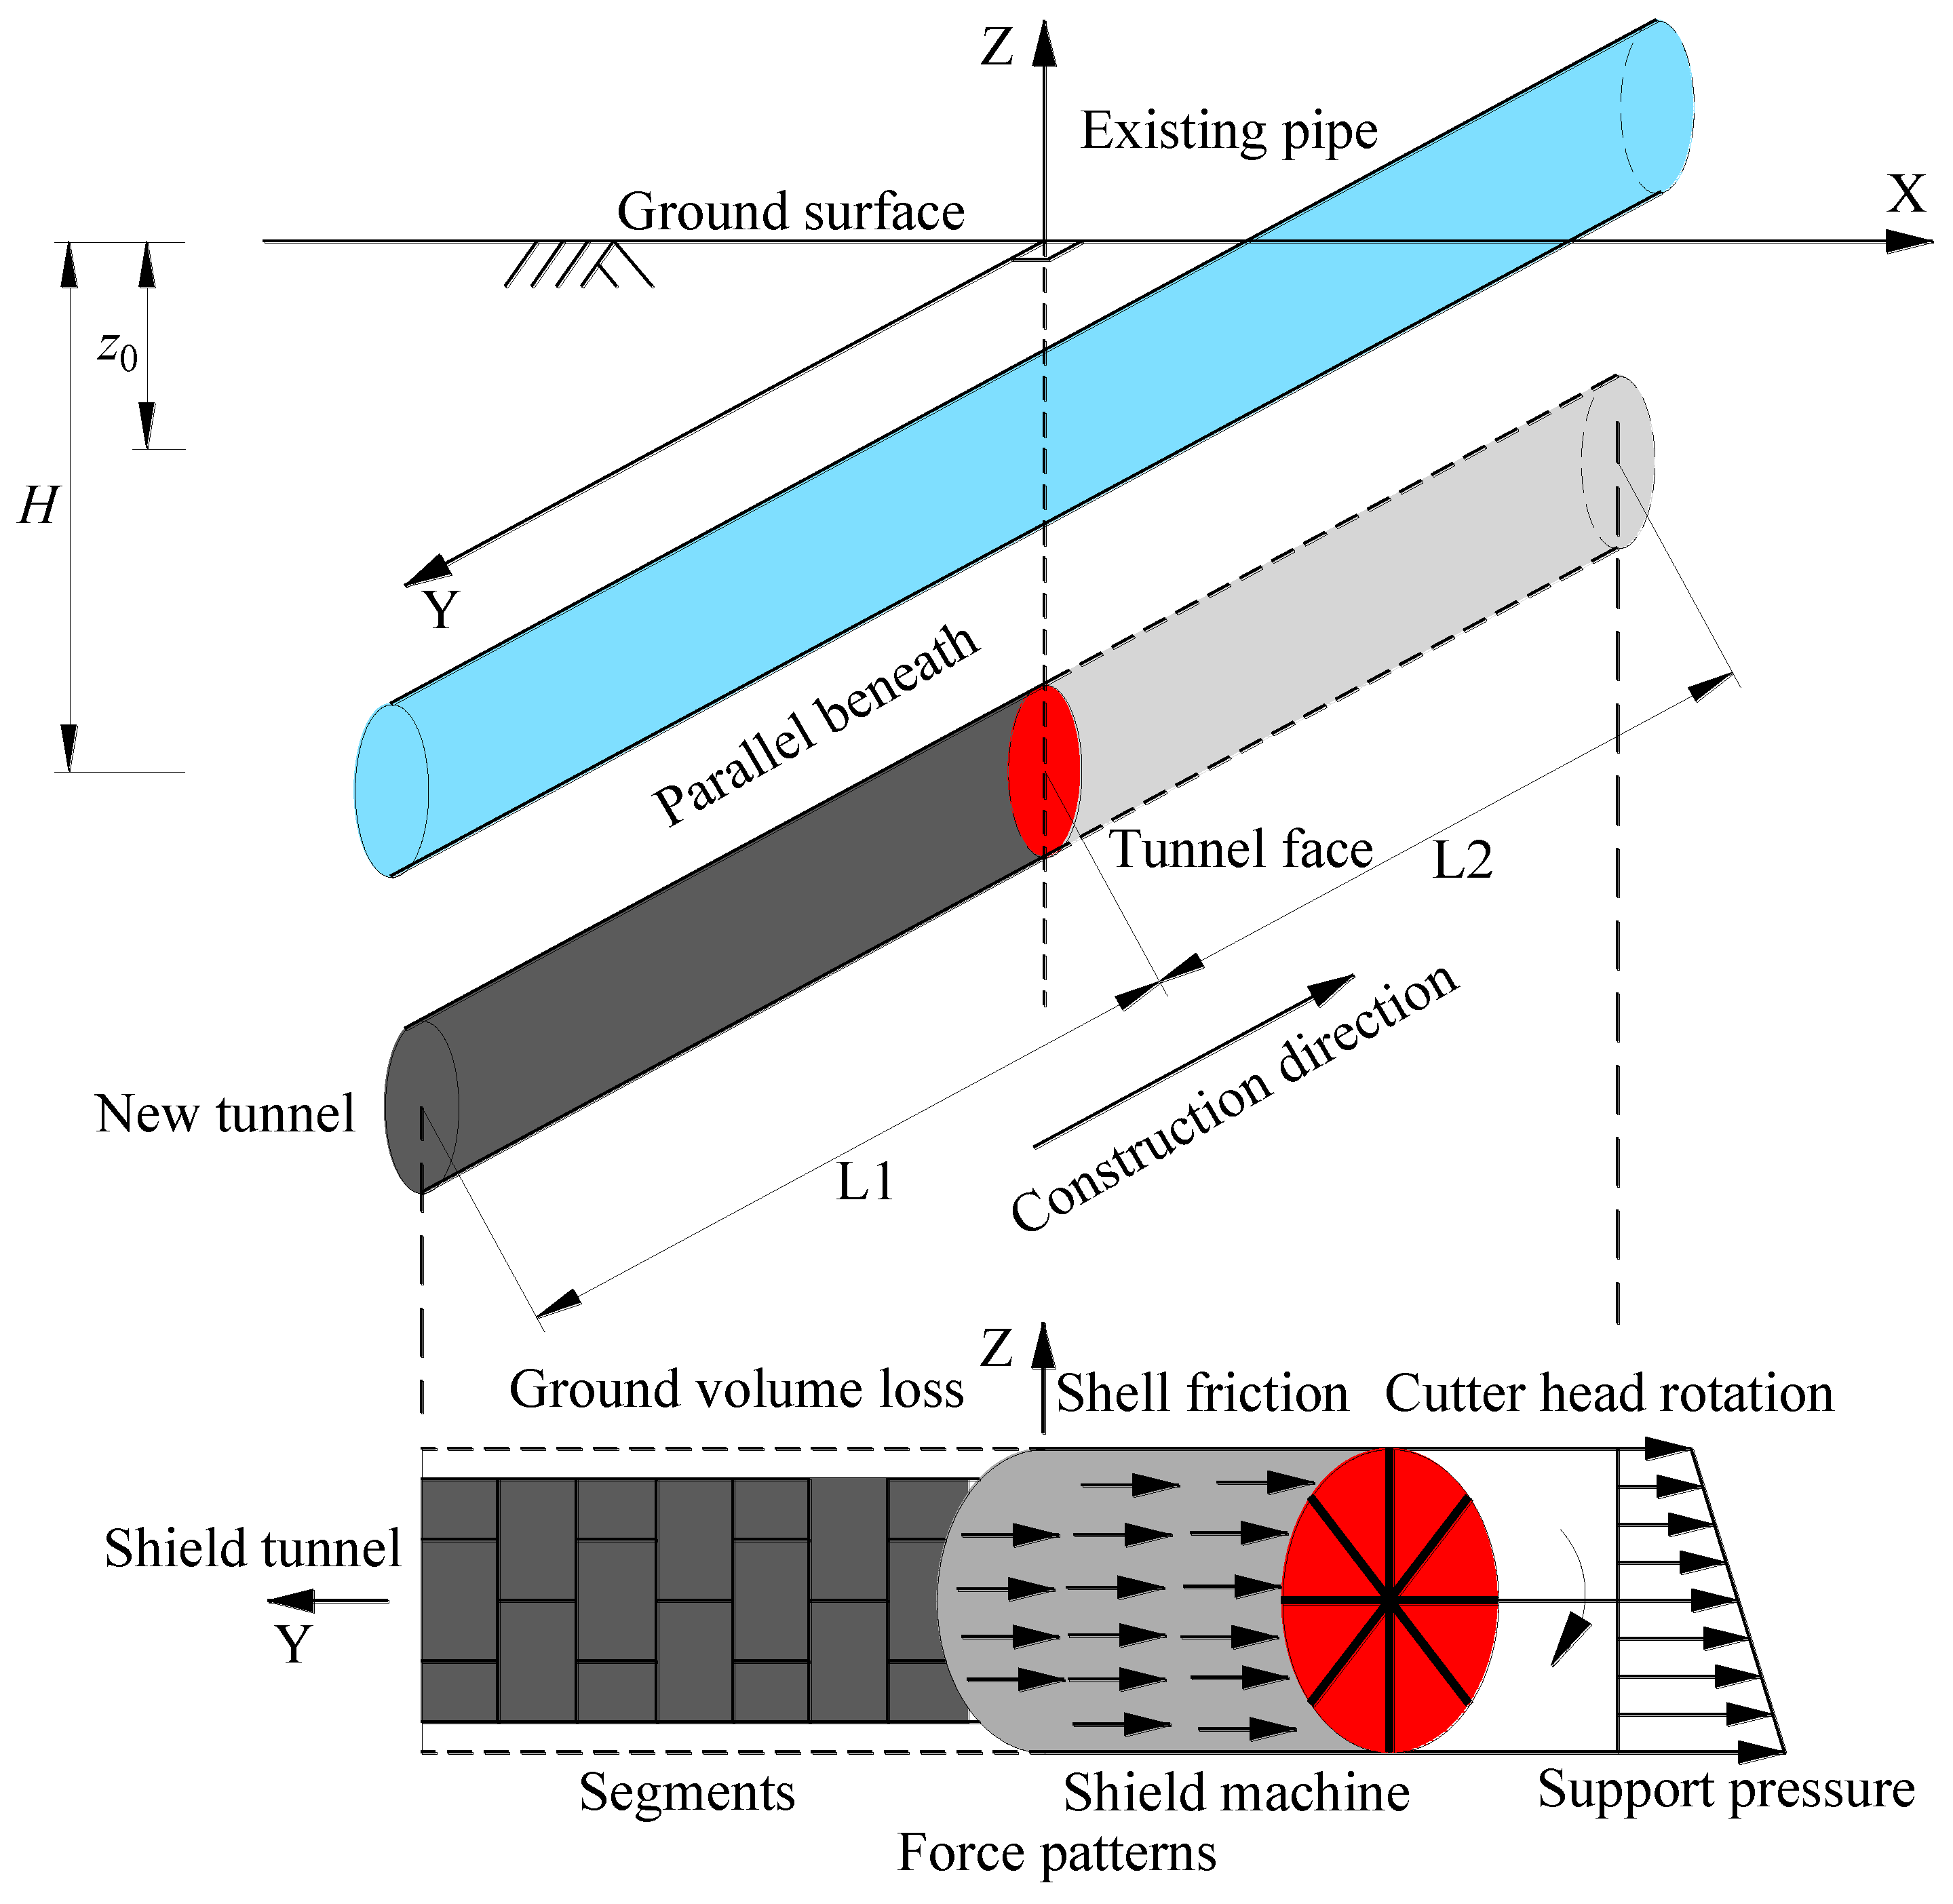
2. Tunnel-Soil-Pipeline Interaction

Figure 2 briefly illustrates the interaction between the shield tunnel, the soil, and the existing pipeline. The spatiotemporal deformation of the ground and the existing pipeline is related to the force patterns during the shield tunnel construction. All the force patterns can be categorised as ground volume loss, support pressure at the tunnel face, the frictional force of the shield shell, and the torsional force of the cutter head.
We utilise the virtual image method, Mindlin’s solution, and subgrade reaction analysis to predict the existing pipeline’s deformation considering the spatiotemporal characteristics of shield tunnel construction. The virtual image method calculates the free-field ground movements induced by ground volume loss. Mindlin’s solution calculates the free-field ground movements mainly induced by the support pressure at the tunnel face, the frictional force of the shield shell, and the torsional force of the cutter head. The subgrade reaction analysis is adopted to estimate the deformation of the existing pipeline, in which the free-field ground movements are regarded as the additional pressure acting on the existing pipeline.

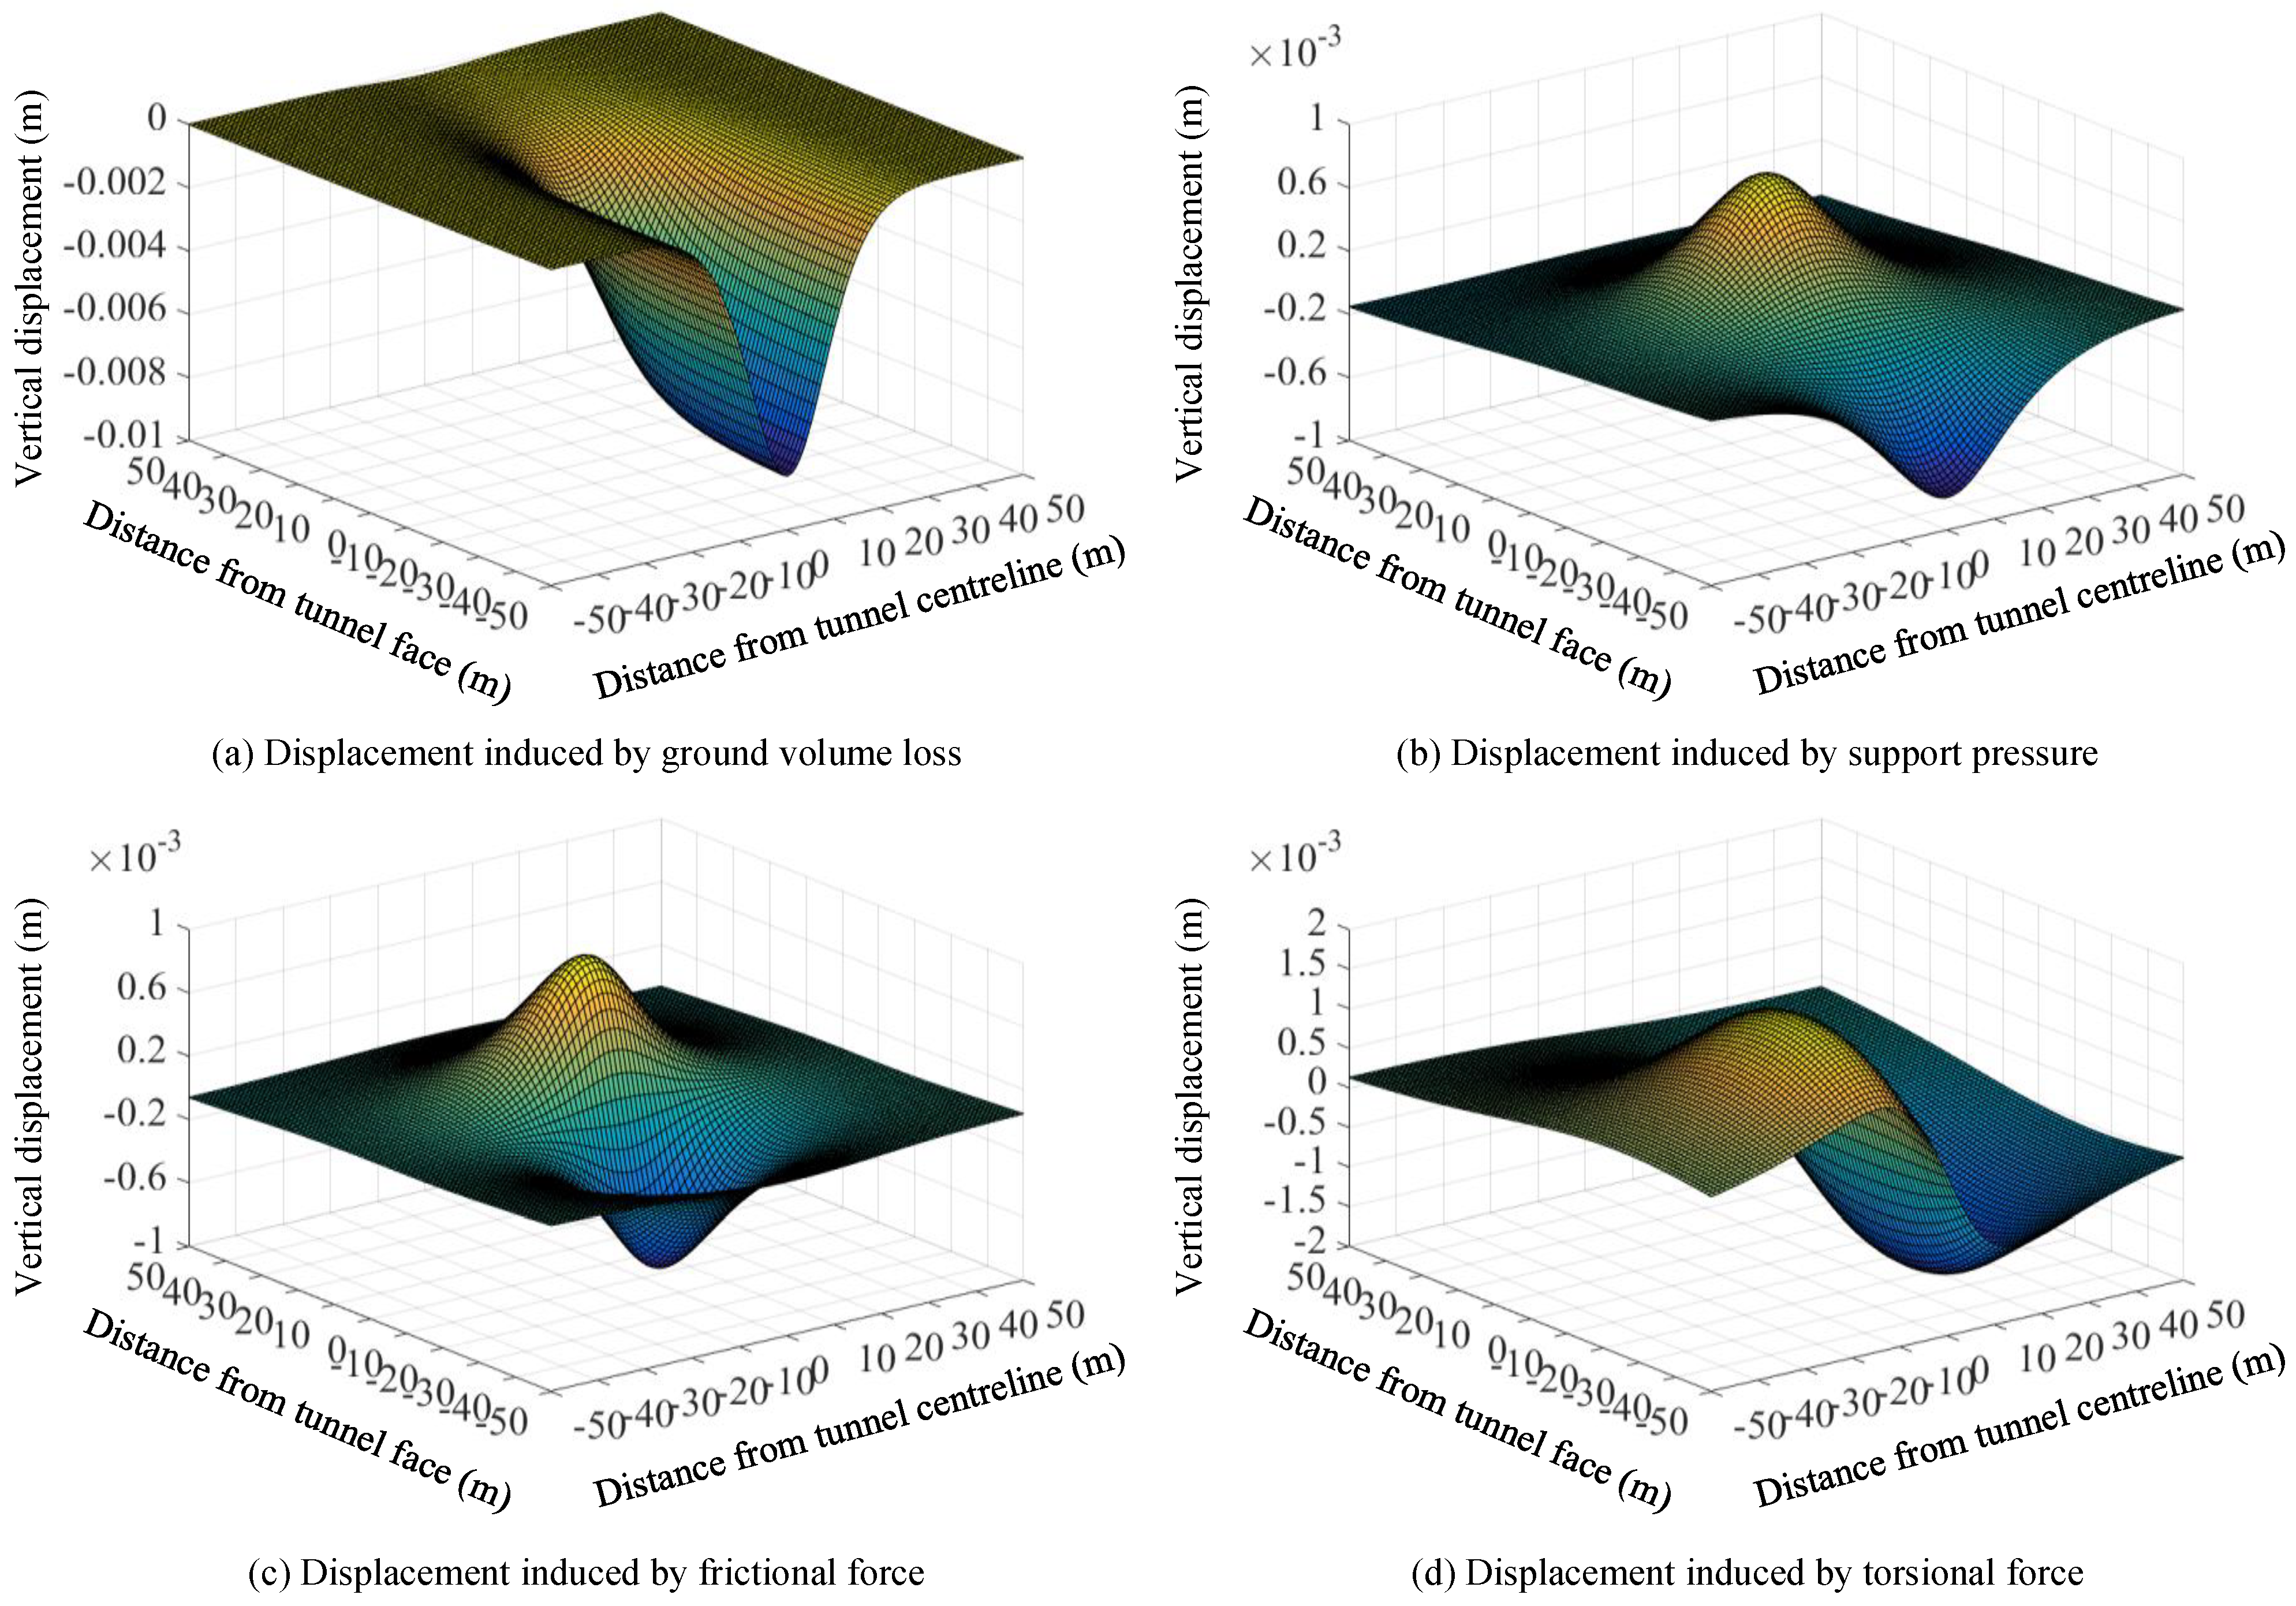
2.1. Free-Field Movements Induced by Ground Volume Loss

Sagaseta [24] proposed the virtual image method to predict the displacements and stress fields due to a point sink in the elastic half-space. Based on the cavity expansion/contraction theory and superposition method, the closed-form solutions of the displacement and stress related to the ground volume loss are given by Jin, et al. [34]:
u x = V x 4 π [ 1 R 1 3 + 3 4 μ R 2 3 6 z ( z + H ) R 2 5 ]
u y = V y 4 π [ 1 R 1 3 + 3 4 μ R 2 3 6 z ( z + H ) R 2 5 ]
u z = V 4 π [ z H R 1 3 + 2 z R 2 3 ( 3 4 μ ) ( z + H ) R 2 3 6 z ( z + H ) 2 R 2 5 ]
where ux, uy, and uz are the three-dimensional displacement components; μ is the Poisson’s ratio; H is the distance between the ground surface and point sink; V is the ground volume loss; the parameters R1 and R2 are expressed as:
R 1 = x 2 + y 2 + ( z H ) 2
R 2 = x 2 + y 2 + ( z + H ) 2
The ground volume loss should be integrated along the direction of tunnel construction shown in Figure 2 to analyse the spatiotemporal characteristic of ground movements. According to Equations (1)–(3), the three-dimensional ground movements can be given by integrating the Green functions along the direction of tunnel construction from L1 to L2:
u x V = L 1 L 2 u g ( x , z ) f x ( x , y η , z ) d η
u y V = L 1 L 2 u g ( x , z ) f y ( x , y η , z ) d η
u z V = L 1 L 2 u g ( x , z ) f z ( x , y η , z ) d η
where L1 and L2 are the distance from the intersection point O (Figure 2) to the launching shaft of the new tunnel and the shield tunnel face, respectively; u(x, z) is the ground loss distribution of the inner tunnel boundary; fx, fy, and fz are the Green functions determined by assuming V = 1 in Equations (1)–(3). It means the ground movement induced by unit volume loss; is the unit length of tunnel excavation.
If the ground loss distribution is uniform radial, ug(x, z) will be a constant u0. However, Loganathan and Poulos [35] indicated that the ground loss distribution is a non-uniform pattern instead of a uniform one and proposed the formula:
u g ( x , z ) = 4 g R + g 2 4 R 2 exp ( 1.38 x 2 ( H + R ) 2 0.69 z 2 H 2 )
V = 4 g R + g 2 4 R 2
where g is the gap parameter; R is the radius of the shield tunnel; V is the equivalent ground loss parameter.
The gap parameter g is related to the tunnelling machine and lining geometry, the 3D elastoplastic ground movement at the tunnel face, and the over-excavation of soil around the tunnel shield periphery. Some scholars [36,37,38] have investigated how to determine the parameter g reasonably.

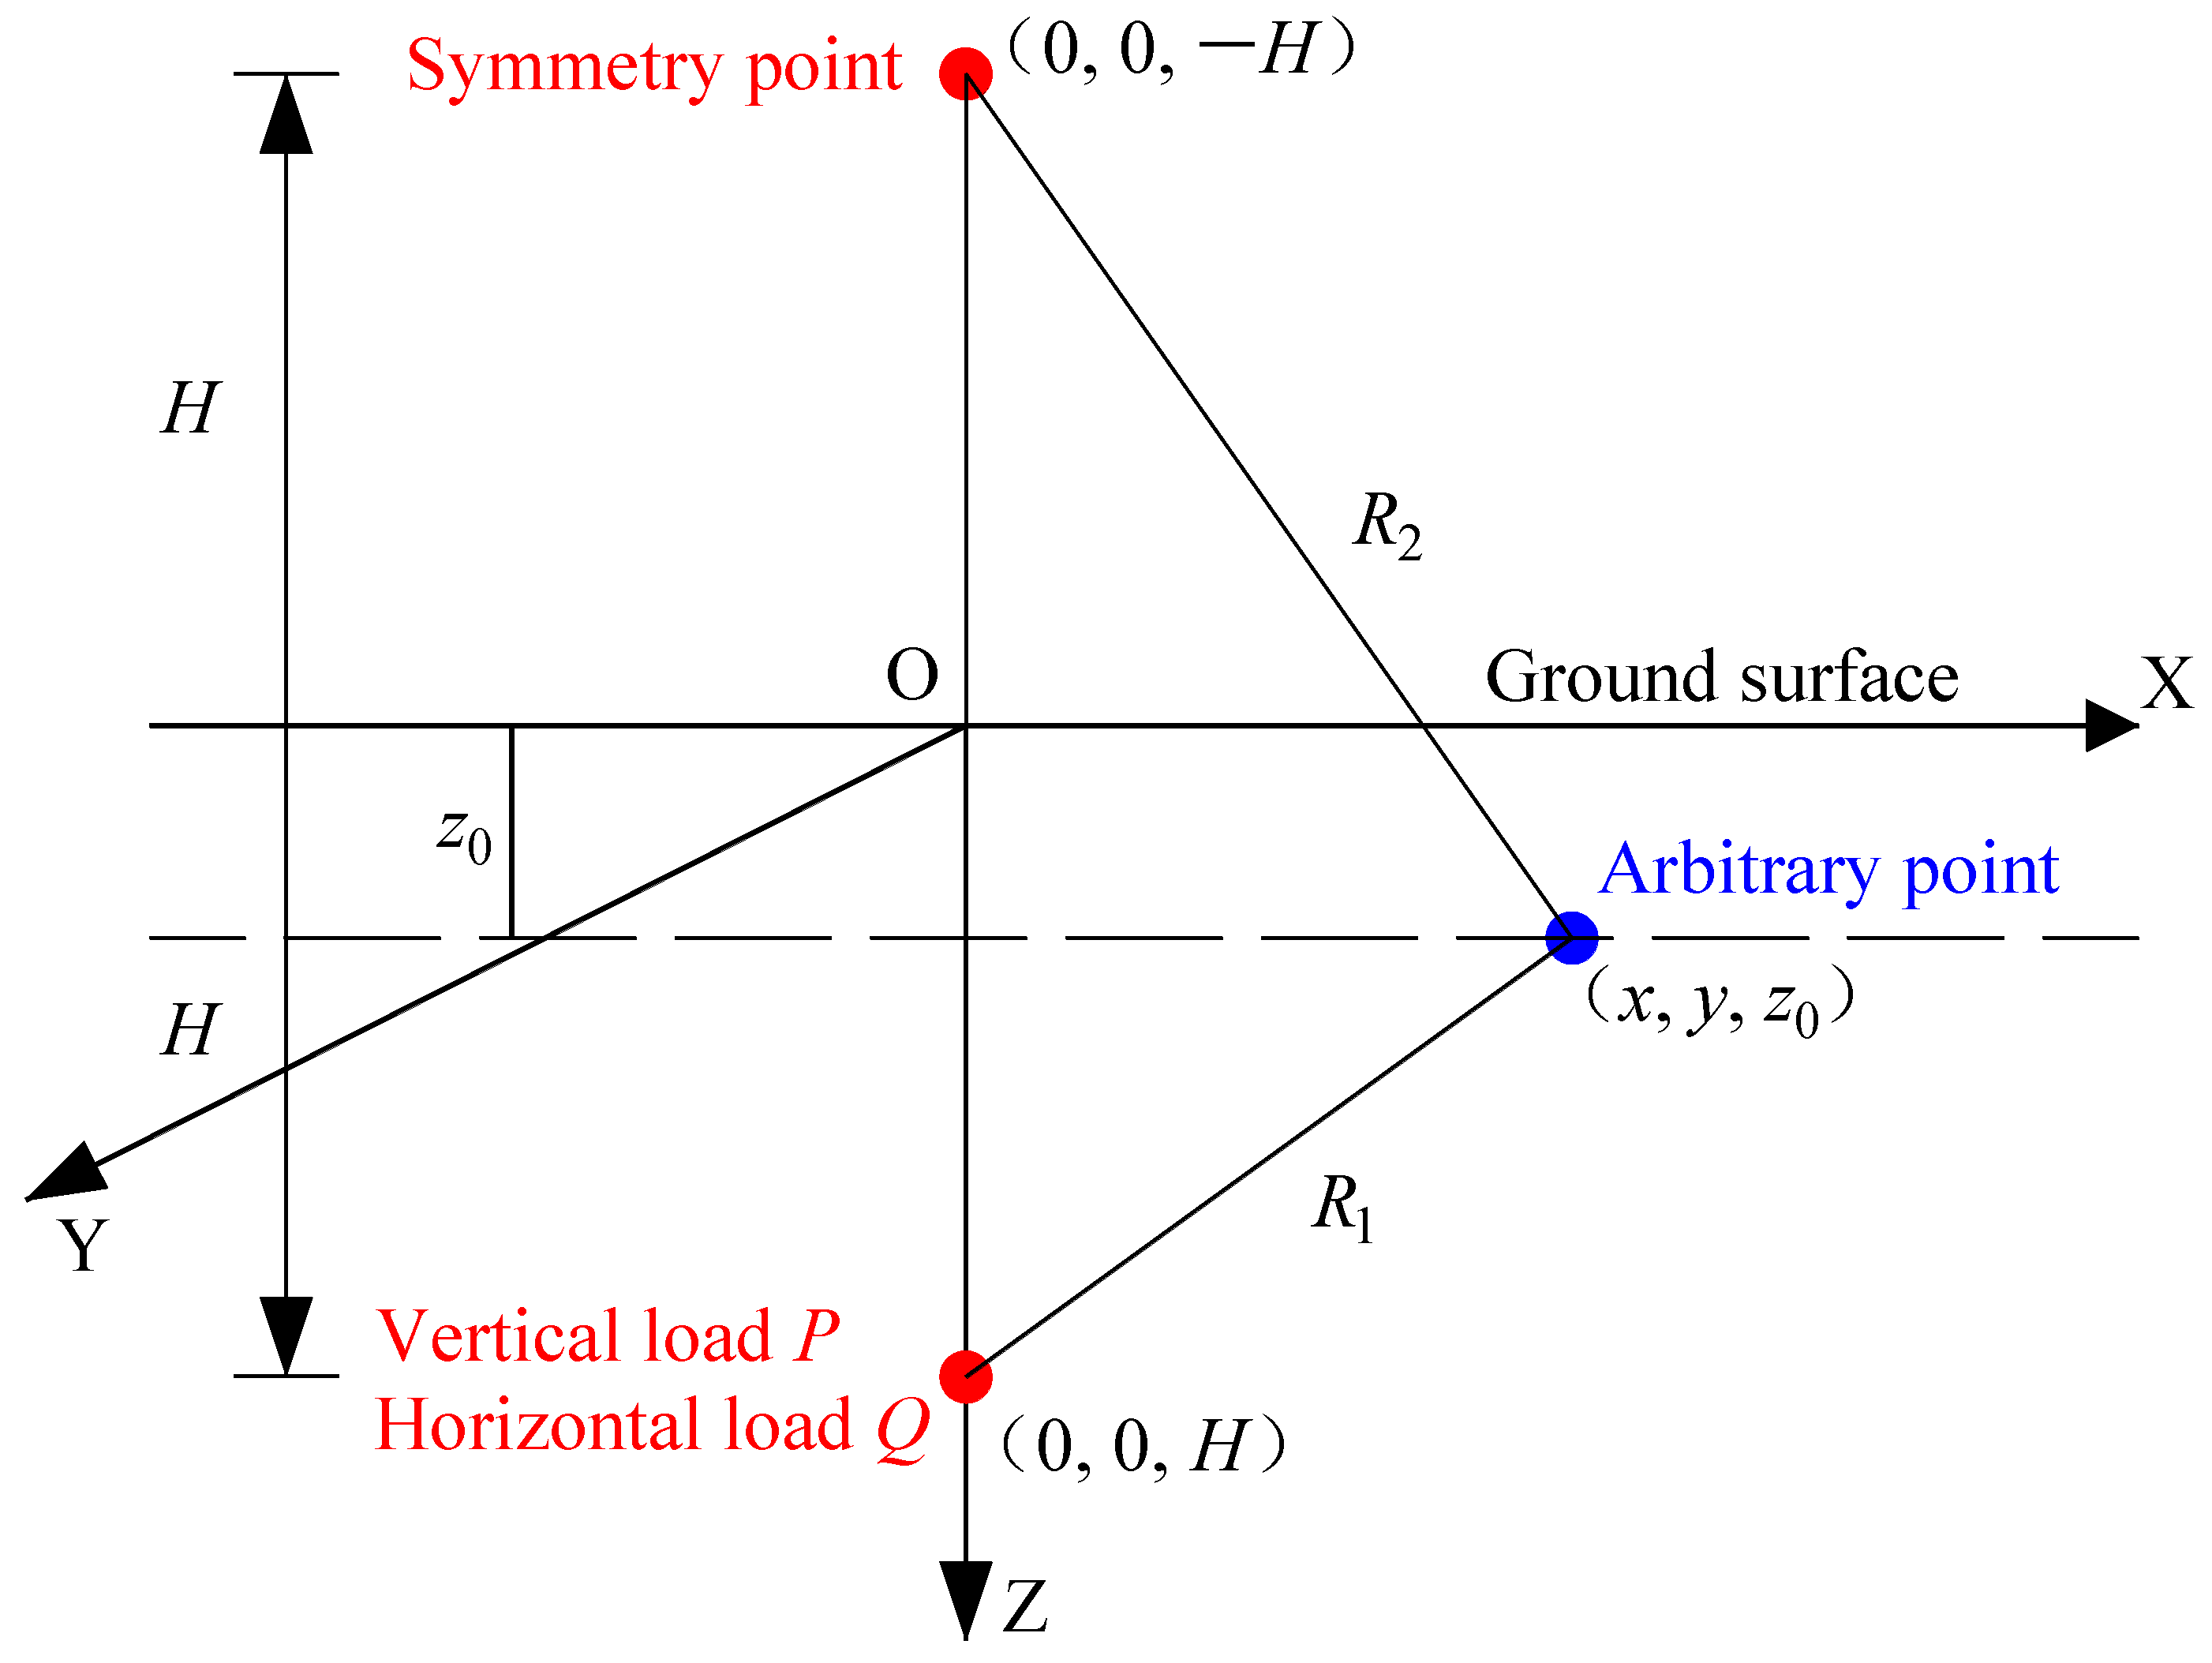
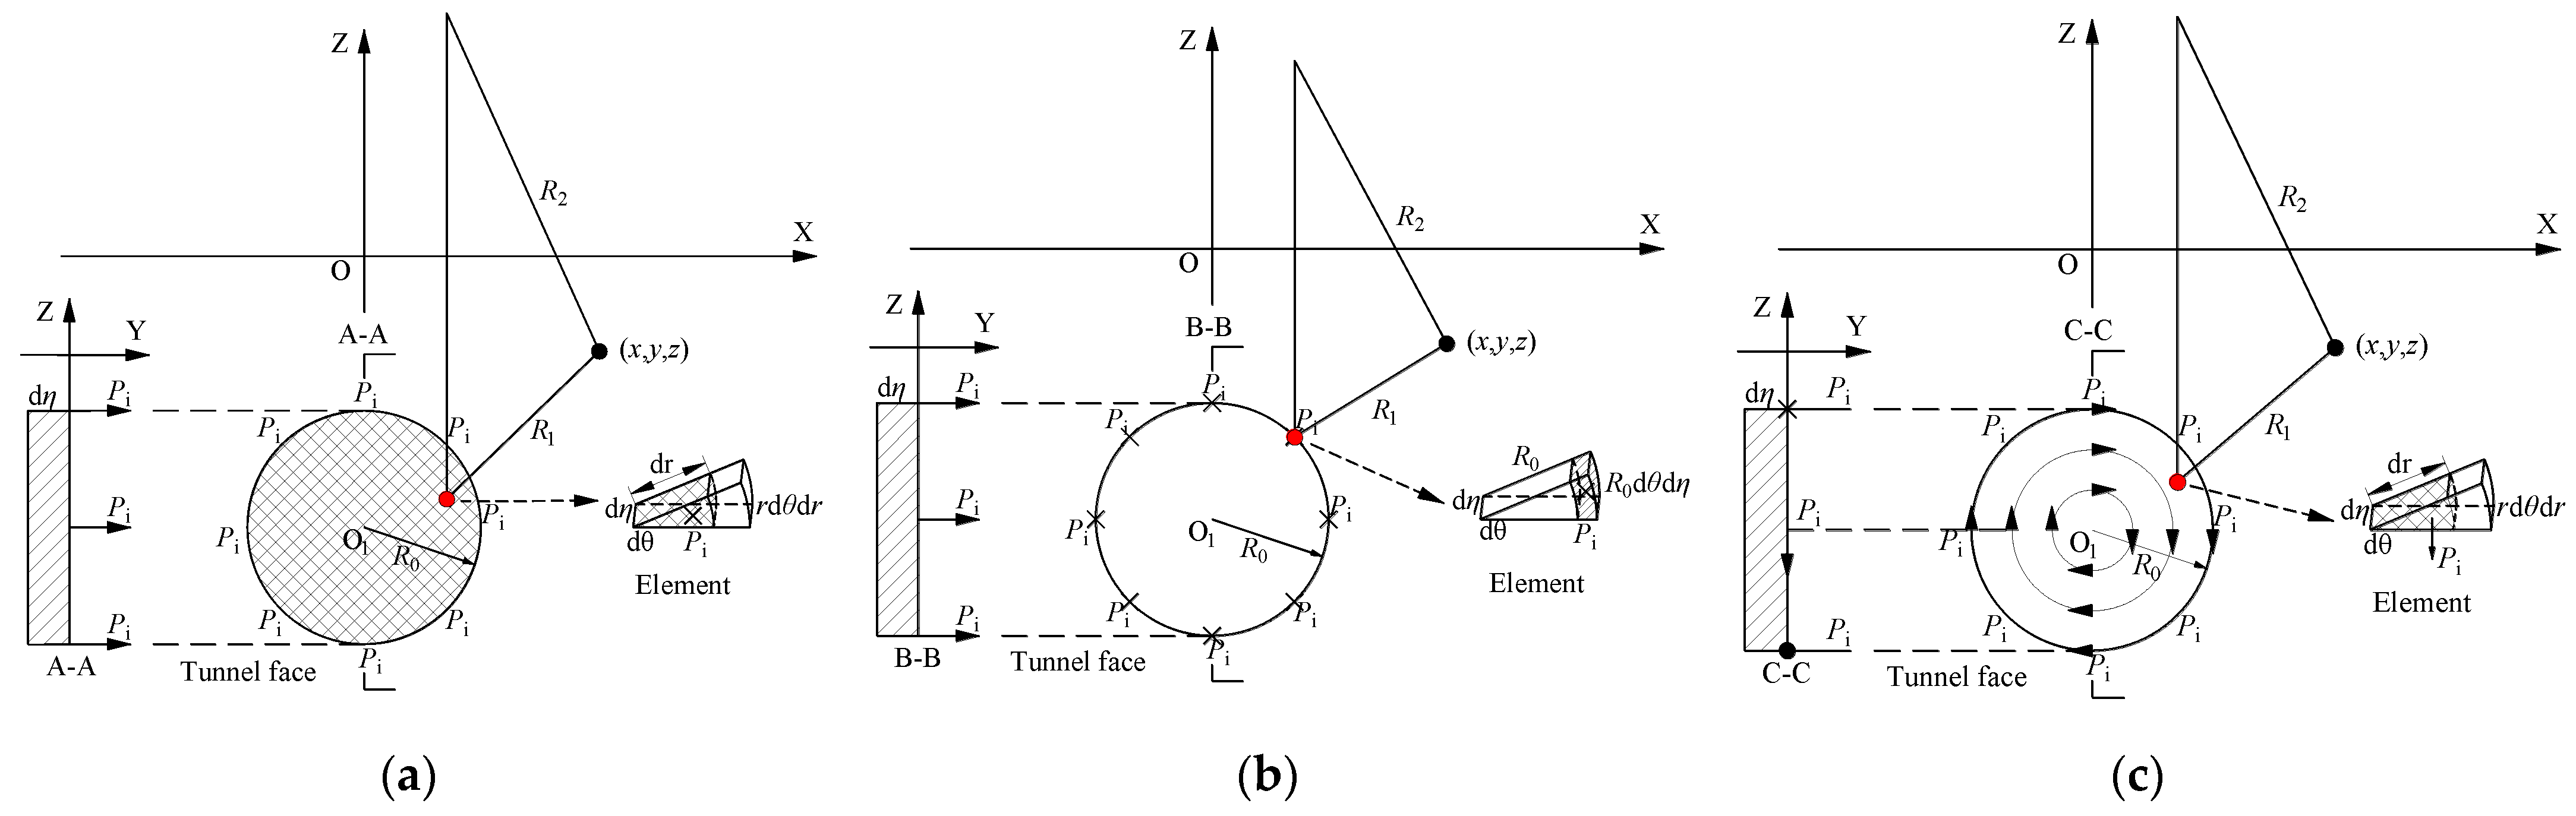
2.2. Free-Field Movements Induced by Different Force Patterns

Mindlin [23] proposed the analytical solutions of the displacements and stress fields induced by a vertical or horizontal load in an elastic half-space (shown in Figure 3). The vertical displacement and vertical stress induced by a vertical load (horizontal load) can be given by Equation (11) and Equation (12), respectively. The other solutions can be detailed in relative research.
u z = P 16 π G ( 1 μ ) [ 3 4 μ R 1 + 8 μ 2 12 μ + 5 R 2 + ( z c ) 2 R 1 3 + ( 3 4 μ ) ( z + c ) 2 2 d c R 2 3 + 6 c z ( z + c ) 2 R 2 5 ] σ z = P 8 π ( 1 μ ) [ ( 1 2 μ ) ( z c ) R 1 3 + ( 1 2 μ ) ( z c ) R 2 3 3 ( z c ) 3 R 1 5 3 ( 3 4 μ ) z ( z + c ) 2 3 c ( z + c ) ( 5 z c ) R 2 5 + 30 c z ( z + c ) 3 R 2 7 ]
u z = Q x 16 π G ( 1 μ ) [ z c R 1 3 + ( 3 4 μ ) ( z c ) R 2 3 6 c z ( z + c ) R 2 5 + 4 ( 1 μ ) ( 1 2 μ ) R 2 ( R 2 + z + c ) ] σ z = Q x 8 π ( 1 μ ) [ 1 2 μ R 1 3 ( 1 2 μ ) R 2 3 3 ( z c ) 2 R 1 5 3 ( 3 4 μ ) ( z + c ) 2 R 2 5 + 6 c R 2 5 ( c + ( 1 2 μ ) ( z + c ) + 5 z ( z + c ) 2 R 2 2 ) ]
Integrating Mindlin’s solutions can represent the free-field movements induced by different force patterns. As shown in Figure 4, the force patterns consist of the support pressure at the tunnel face, the frictional force of the shield shell, and the torsional force of the cutter head. The analytical solutions of these three force patterns are as follows:

2.2.1. Support Pressure at Tunnel Face

Figure 4a shows that the support pressure is perpendicular to the shield tunnel face during the excavation. An element at the tunnel face is removed to perform the force analysis. The coordinate of the element is (r, 0). The equivalent concentrated force dP, the shadow area of the element in Figure 4a, can be expressed as prdrdθdη. According to the A-A section, is the distance of shield tunnel excavation.
The coordinate of any point load P within the tunnel face will be (rcos(θ), 0, H-rsin(θ)). During the shield tunnel excavation, the Cartesian coordinate system will translate η along the Y-axis. Thus, the coordinate of any point load during the shield tunnel excavation will be (rcos(θ), η, H-rsin(θ)). Based on Mindlin’s solution, the parameters R1 and R2 shown in Figure 4a will be rewritten, respectively:
R 1 = ( x r cos ( θ ) ) 2 + ( y η ) 2 + ( z H + r sin ( θ ) ) 2
R 2 = ( x r cos ( θ ) ) 2 + ( y η ) 2 + ( z + H r sin ( θ ) ) 2
The support pressure is a horizontal load along Y-axis. So, the x in Equation (12) should be replaced with y-η. The displacements and stress fields induced by the support pressure can be obtained using the triple integrals. The domain of the triple integrals is a cylindrical region that the tunnel face passes. According to Equation (12), the vertical displacement and vertical stress with shield tunnel advance are given, respectively.
u z = 0 R 0 2 π L 1 L 2 p ( y η ) r d r d θ d η 16 π G ( 1 μ ) [ z c R 1 3 + ( 3 4 μ ) ( z c ) R 2 3 6 c z ( z + c ) R 2 5 + 4 ( 1 μ ) ( 1 2 μ ) R 2 ( R 2 + z + c ) ]
σ z = 0 R 0 2 π L 1 L 2 p ( y η ) r d r d θ d η 8 π ( 1 μ ) [ 1 2 μ R 1 3 ( 1 2 μ ) R 2 3 3 ( z c ) 2 R 1 5 3 ( 3 4 μ ) ( z + c ) 2 R 2 5 + 6 c R 2 5 ( c + ( 1 2 μ ) ( z + c ) + 5 z ( z + c ) 2 R 2 2 ) ]

2.2.2. Frictional Force of Shield Shell

As shown in Figure 4b, the frictional force of the shield shell is a horizontal force during the shield tunnel excavation. The element force dP, the shadow area of the element in Figure 4b, can be expressed as pRdθdη. The frictional force is along the tunnel periphery. Thus, the coordinate of any point load P along the tunnel periphery will be (Rcos(θ), η, H-Rsin(θ)). The parameters R1 and R2 shown in Figure 4b will be rewritten, respectively:
R 1 = ( x R cos ( θ ) ) 2 + ( y η ) 2 + ( z H + R sin ( θ ) ) 2
R 2 = ( x R cos ( θ ) ) 2 + ( y η ) 2 + ( z + H R sin ( θ ) ) 2
Due to the shield tunnel excavation along the Y-axis, the frictional force is a horizontal load along the Y-axis. The Cartesian coordinate system will translate η along the Y-axis. So, the x in Equation (12) should be replaced with y-η. Compared with the support pressure in Section 2.2.1, the displacements and stress fields are obtained by double integrals. The domain of the integral is a cylindrical surface instead of a cylinder. According to Equation (12), the vertical displacement and vertical stress are given, respectively.
u z = 0 2 π L 1 L 2 p ( y η ) R d θ d η 16 π G ( 1 μ ) [ z c R 1 3 + ( 3 4 μ ) ( z c ) R 2 3 6 c z ( z + c ) R 2 5 + 4 ( 1 μ ) ( 1 2 μ ) R 2 ( R 2 + z + c ) ]
σ z = 0 2 π L 1 L 2 p ( y η ) R d θ d η 8 π ( 1 μ ) [ 1 2 μ R 1 3 ( 1 2 μ ) R 2 3 3 ( z c ) 2 R 1 5 3 ( 3 4 μ ) ( z + c ) 2 R 2 5 + 6 c R 2 5 ( c + ( 1 2 μ ) ( z + c ) + 5 z ( z + c ) 2 R 2 2 ) ]

2.2.3. Torsional Force of Cutter Head

As shown in Figure 4c, the torsional force of the cutter head is parallel to the tunnel face during the shield tunnel excavation. The torsional force direction is clockwise or anti-clockwise. The expression of the element load dP of the torsional force, the shadow area of the element in Figure 4c, is the same as that of the support pressure. The coordinates of any point load of these two cases are the same. The parameters R1 and R2 are obtained by Equations (13) and (14).
The torsional force direction is assumed to be clockwise. The torsional force P can be divided into horizontal and vertical components.
p h = P sin ( θ ) p v = P cos ( θ )
The direction of the horizontal component is along the X-axis, and the Cartesian coordinate system will translate rcos(θ) along the X-axis. So, the x in Equation (12) should be replaced with x-rcos(θ). The displacements and stress fields induced by the horizontal component of torsional force can be obtained through the triple integrals. The domain of the triple integrals is a cylindrical region. According to Equation (12), the vertical displacement and vertical stress are given, respectively.
u z h = 0 R 0 2 π L 1 L 2 p h ( x r cos ( θ ) ) r d r d θ d η 16 π G ( 1 μ ) [ z c R 1 3 + ( 3 4 μ ) ( z c ) R 2 3 6 c z ( z + c ) R 2 5 + 4 ( 1 μ ) ( 1 2 μ ) R 2 ( R 2 + z + c ) ]
σ z h = 0 R 0 2 π L 1 L 2 p h ( x r cos ( θ ) ) r d r d θ d η 8 π ( 1 μ ) [ 1 2 μ R 1 3 ( 1 2 μ ) R 2 3 3 ( z c ) 2 R 1 5 3 ( 3 4 μ ) ( z + c ) 2 R 2 5 + 6 c R 2 5 ( c + ( 1 2 μ ) ( z + c ) + 5 z ( z + c ) 2 R 2 2 ) ]
Moreover, the direction of the vertical component is along the Z-axis. The displacements and stress fields induced by the vertical component of torsional force can be obtained by the triple integrals, of which the domain is a cylindrical region. According to Equation (11), the vertical displacement and vertical stress are given, respectively.
u z v = 0 R 0 2 π L 1 L 2 p v r d r d θ d η 16 π G ( 1 μ ) [ 3 4 μ R 1 + 8 μ 2 12 μ + 5 R 2 + ( z c ) 2 R 1 3 + ( 3 4 μ ) ( z + c ) 2 2 d c R 2 3 + 6 c z ( z + c ) 2 R 2 5 ]
σ z v = 0 R 0 2 π L 1 L 2 p v r d r d θ d η 8 π ( 1 μ ) [ ( 1 2 μ ) ( z c ) R 1 3 + ( 1 2 μ ) ( z c ) R 2 3 3 ( z c ) 3 R 1 5 3 ( 3 4 μ ) z ( z + c ) 2 3 d ( z + c ) ( 5 z c ) R 2 5 + 30 c z ( z + c ) 3 R 2 7 ]
Finally, the vertical displacement and stress induced by the torsional force of the cutter head are:
u z = u z h + u z v σ z = σ z h + σ z v

2.3. Tunnel-Soil-Pipeline Interaction Based on Subgrade Reaction Analysis

The subgrade reaction analysis is a primary method to study the tunnel-soil-pipeline interaction. This method regards the existing pipeline as a Euler-Bernoulli beam or Timoshenko beam resting on an elastic foundation model. The foundation model is commonly composed of the simplest Winkler model [39] and the two-parameter Pasternak model [40]. The closely spaced linear springs in the Winkler model represent the subgrade reaction forces. The subgrade reaction forces on the springs are expressed as:
q k = k k ( u z ( x ) w ( x ) )
where kk is the coefficient of subgrade reaction in the Winkler model; w(x) is the deformation of the existing pipelines.
Compared with the Winkler model, the two-parameter Pasternak model is more accurate because a shear layer on the spaced springs can model the interaction between the spaced springs. The subgrade reaction forces on the springs are expressed as:
q p = k p [ u z ( x ) w ( x ) ] + G c d 2 w ( x ) d x 2
where kp is the coefficient of subgrade reaction in the Pasternak model; Gc is the shear stiffness of the shear layer.
Some related researchers have proposed the governing equations of the subgrade reaction analysis for the Euler-Bernoulli beam on the Winkler model (EW) and the Euler-Bernoulli beam on the Pasternak model (EP).
E I d 4 w ( x ) d x 4 + k k w ( x ) = k k u z ( x ) for   ET E I d 4 w ( x ) d x 4 G c d 2 w ( x ) d x 2 + k p w ( x ) = k p u z ( x ) for   EP
Substituting uz(x) calculated in Section 2.1 and Section 2.2 into the Equation (29), the deformation of the existing pipeline can be predicted with the shield tunnel construction process.
The coefficient of subgrade reaction k and the shear stiffness of shear layer Gc are two main parameters. Many published papers estimated k using different methods [41,42,43,44]. The solution proposed by Yu et al. [45] is commonly used because it considers the buried depth.
k = 3.08 λ E s 1 μ 2 E s B 4 E I 8 λ = { 2.18 when   z 0 B 0.5 1 + 1 1.7 z 0 / B when   z 0 B > 0.5
where Es is the elastic modulus of the soil; B is the diameter of the existing pipeline; z0 is the buried depth of the existing pipeline.
Tanahashi [46] proposed an empirical solution to estimate Gc:
G c = E s h t 6 ( 1 + v )
where ht is the elastic layer’ depth, approximately 2.5B suggested by Xu [47].

3. Application of Proposed Method on Nanchang Subway Line 3

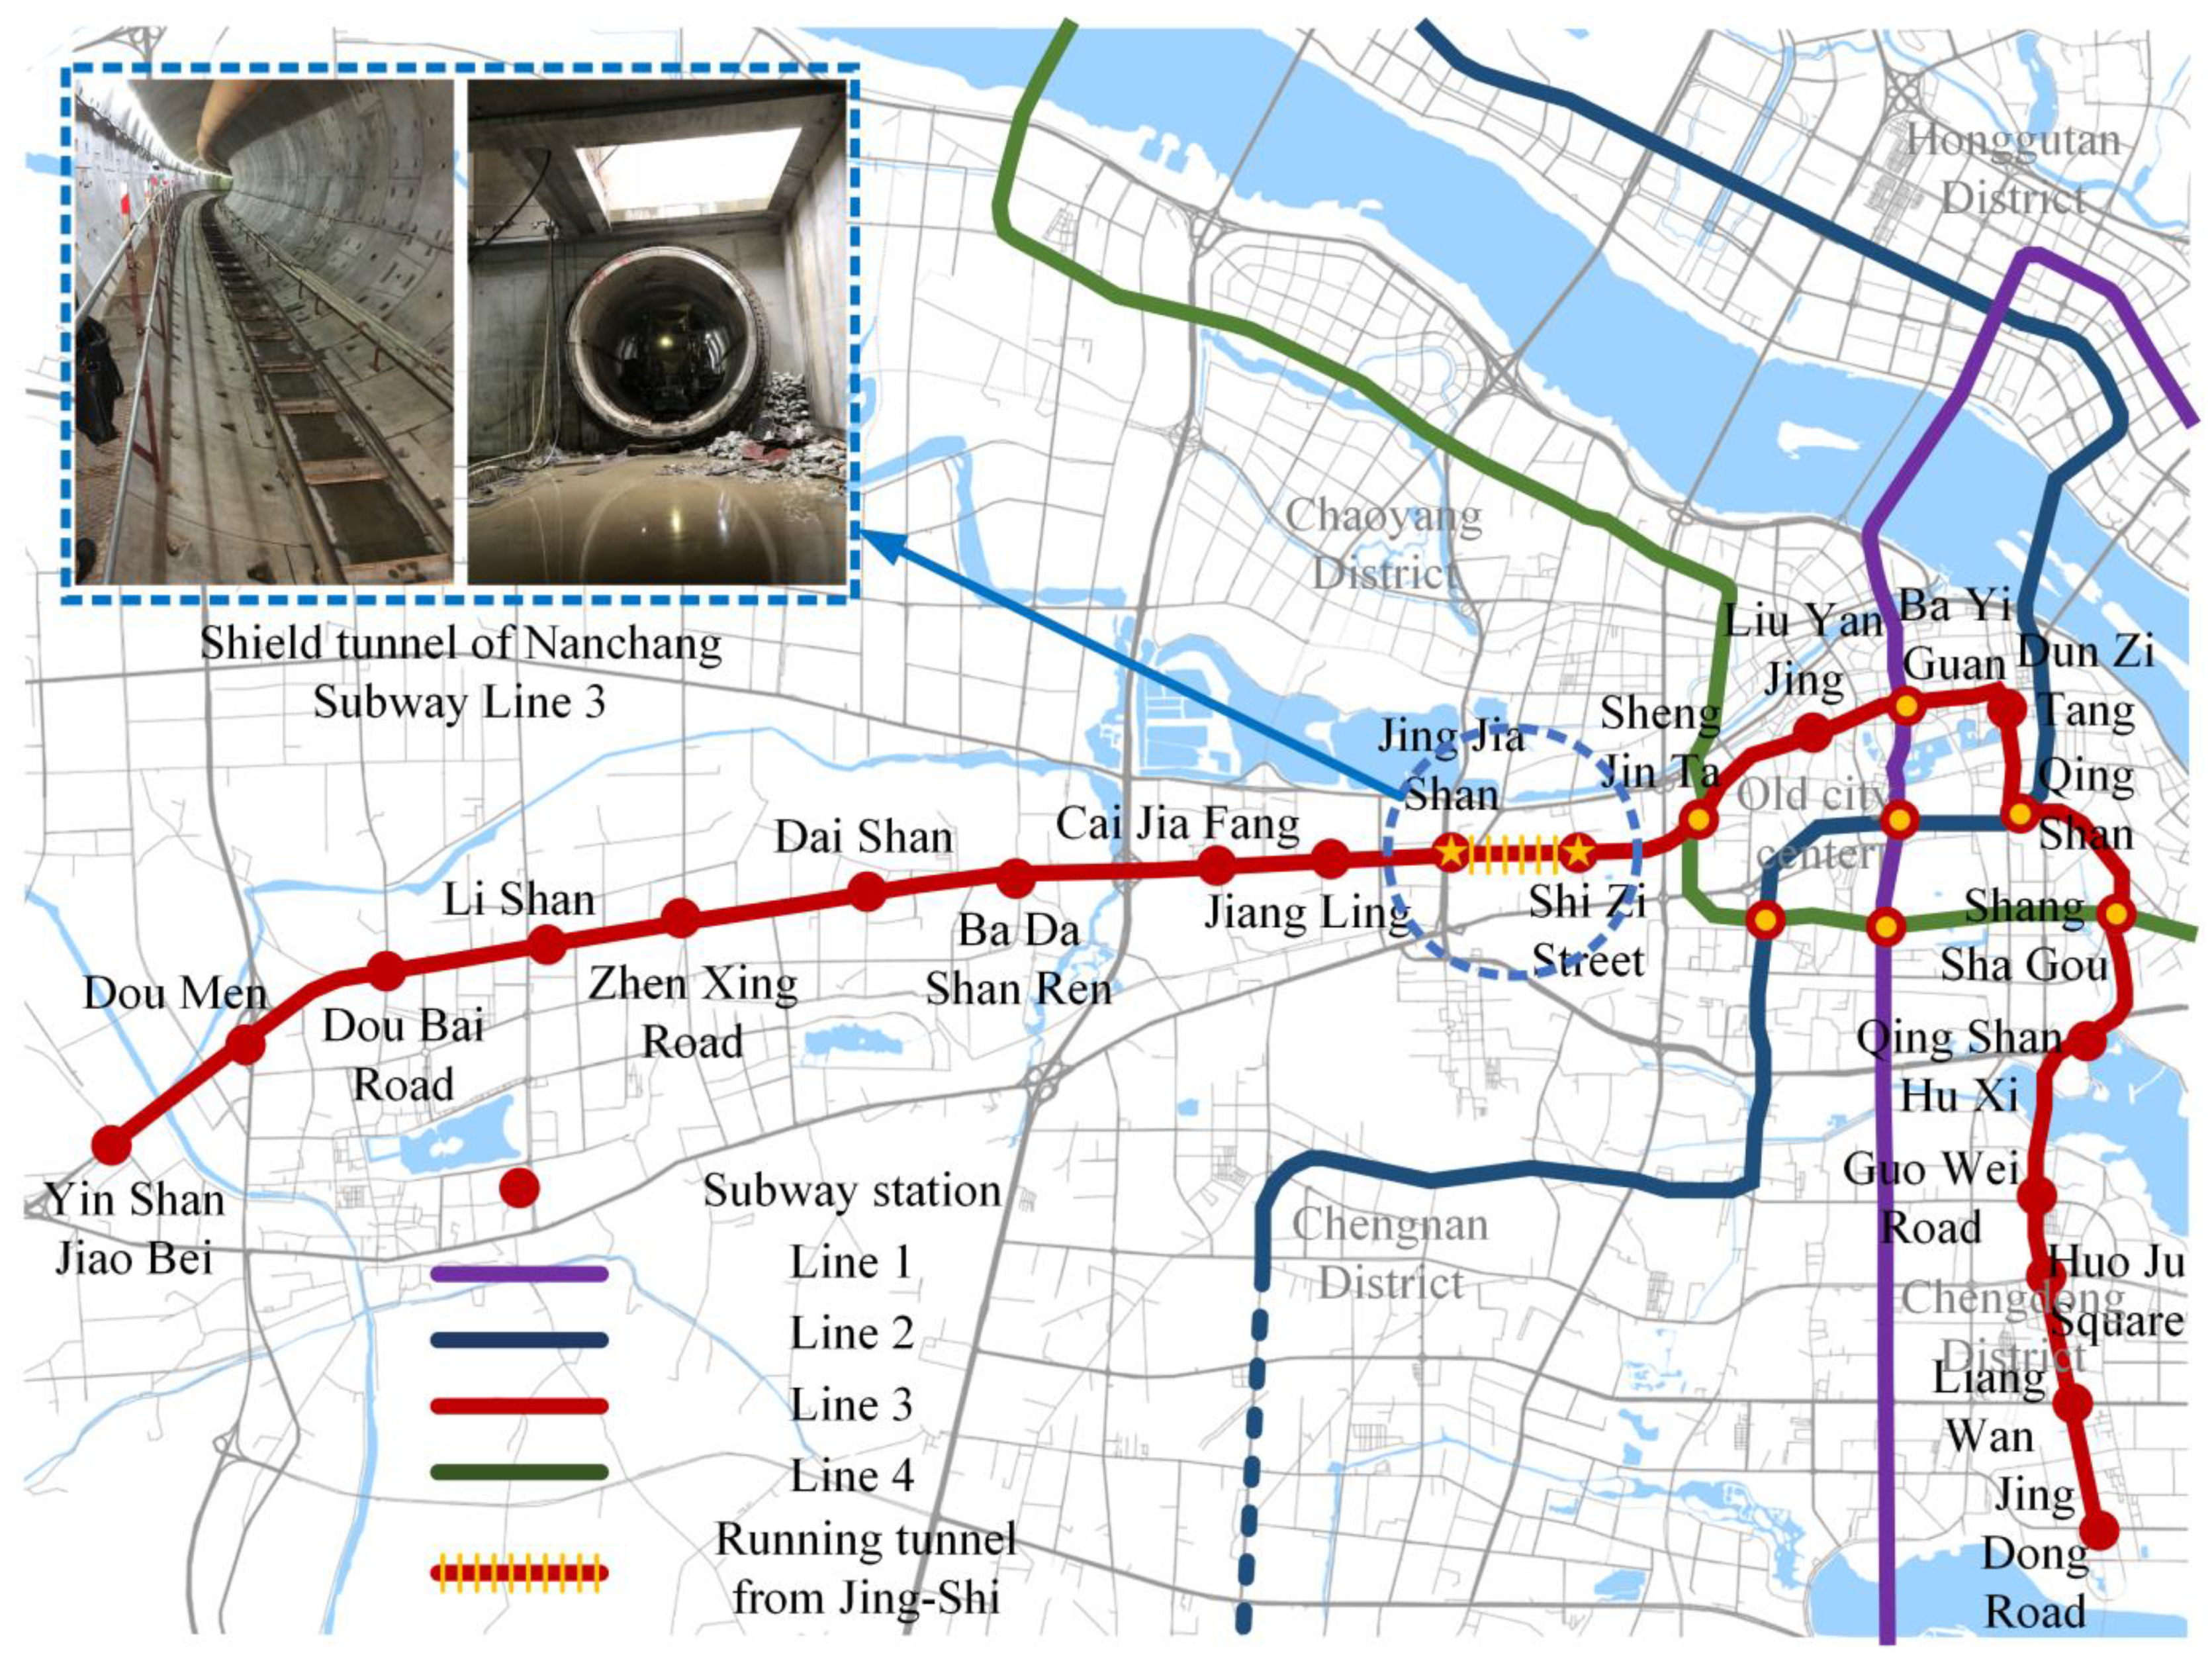
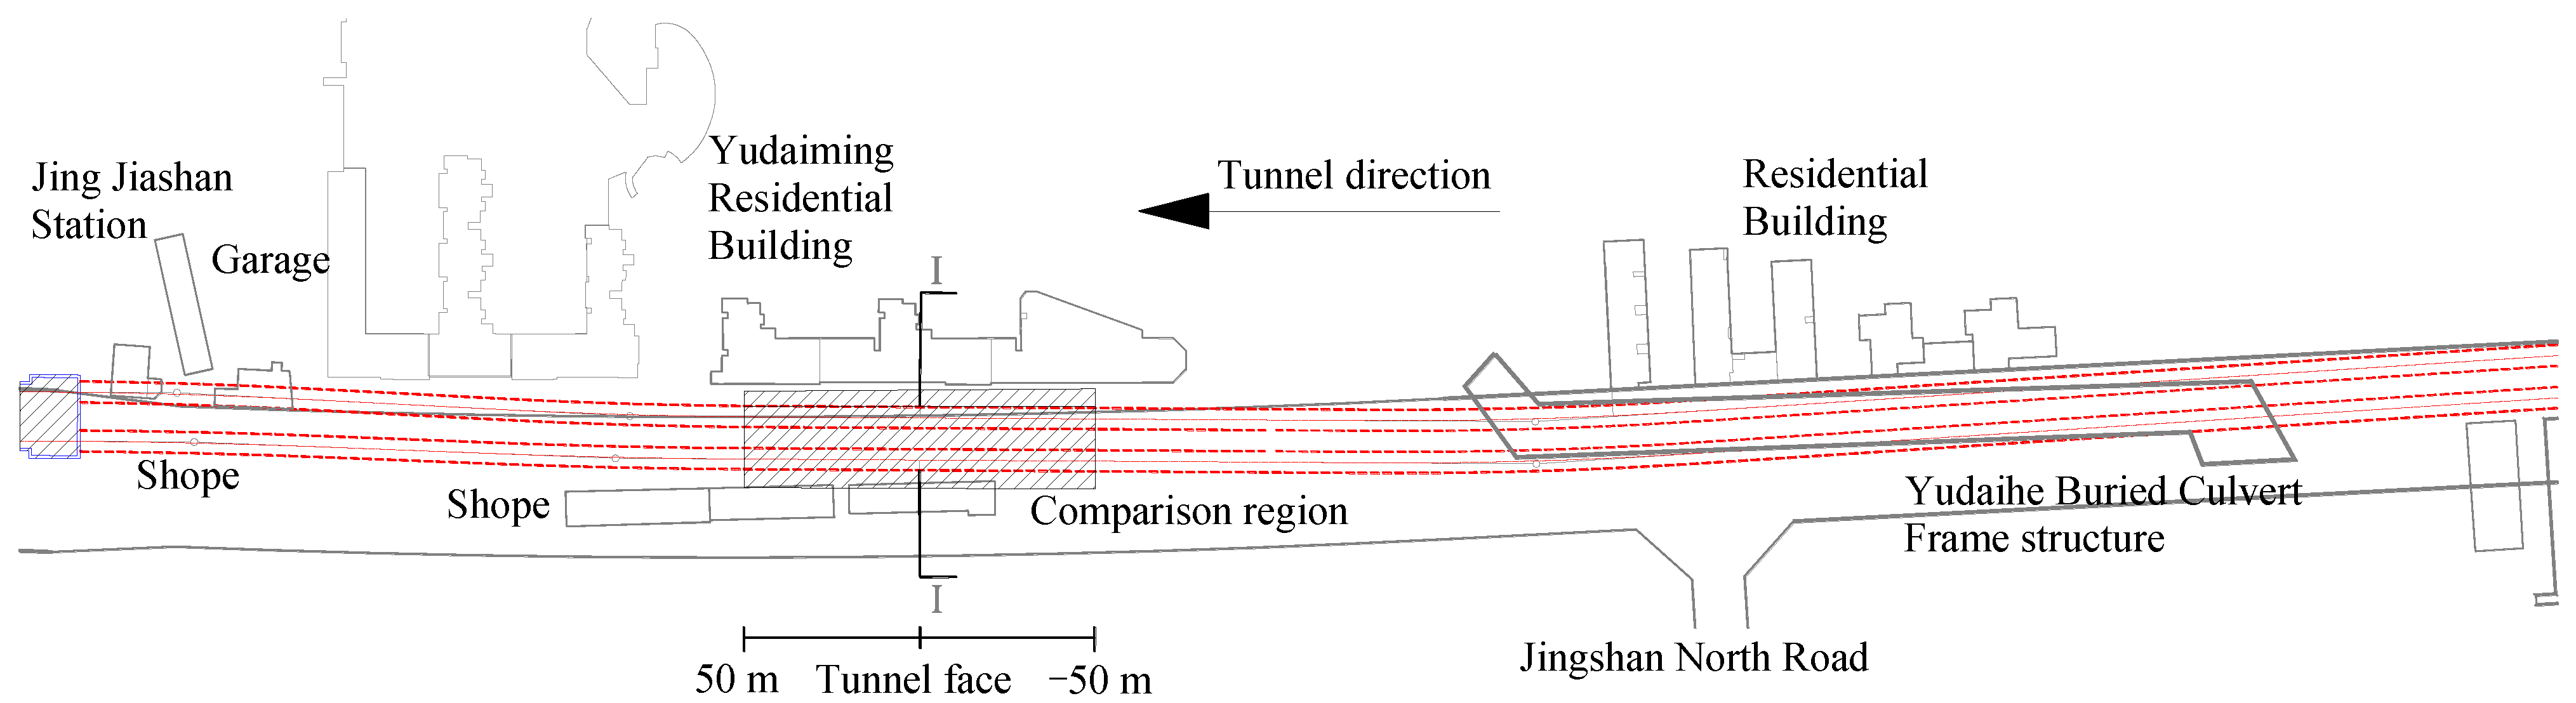
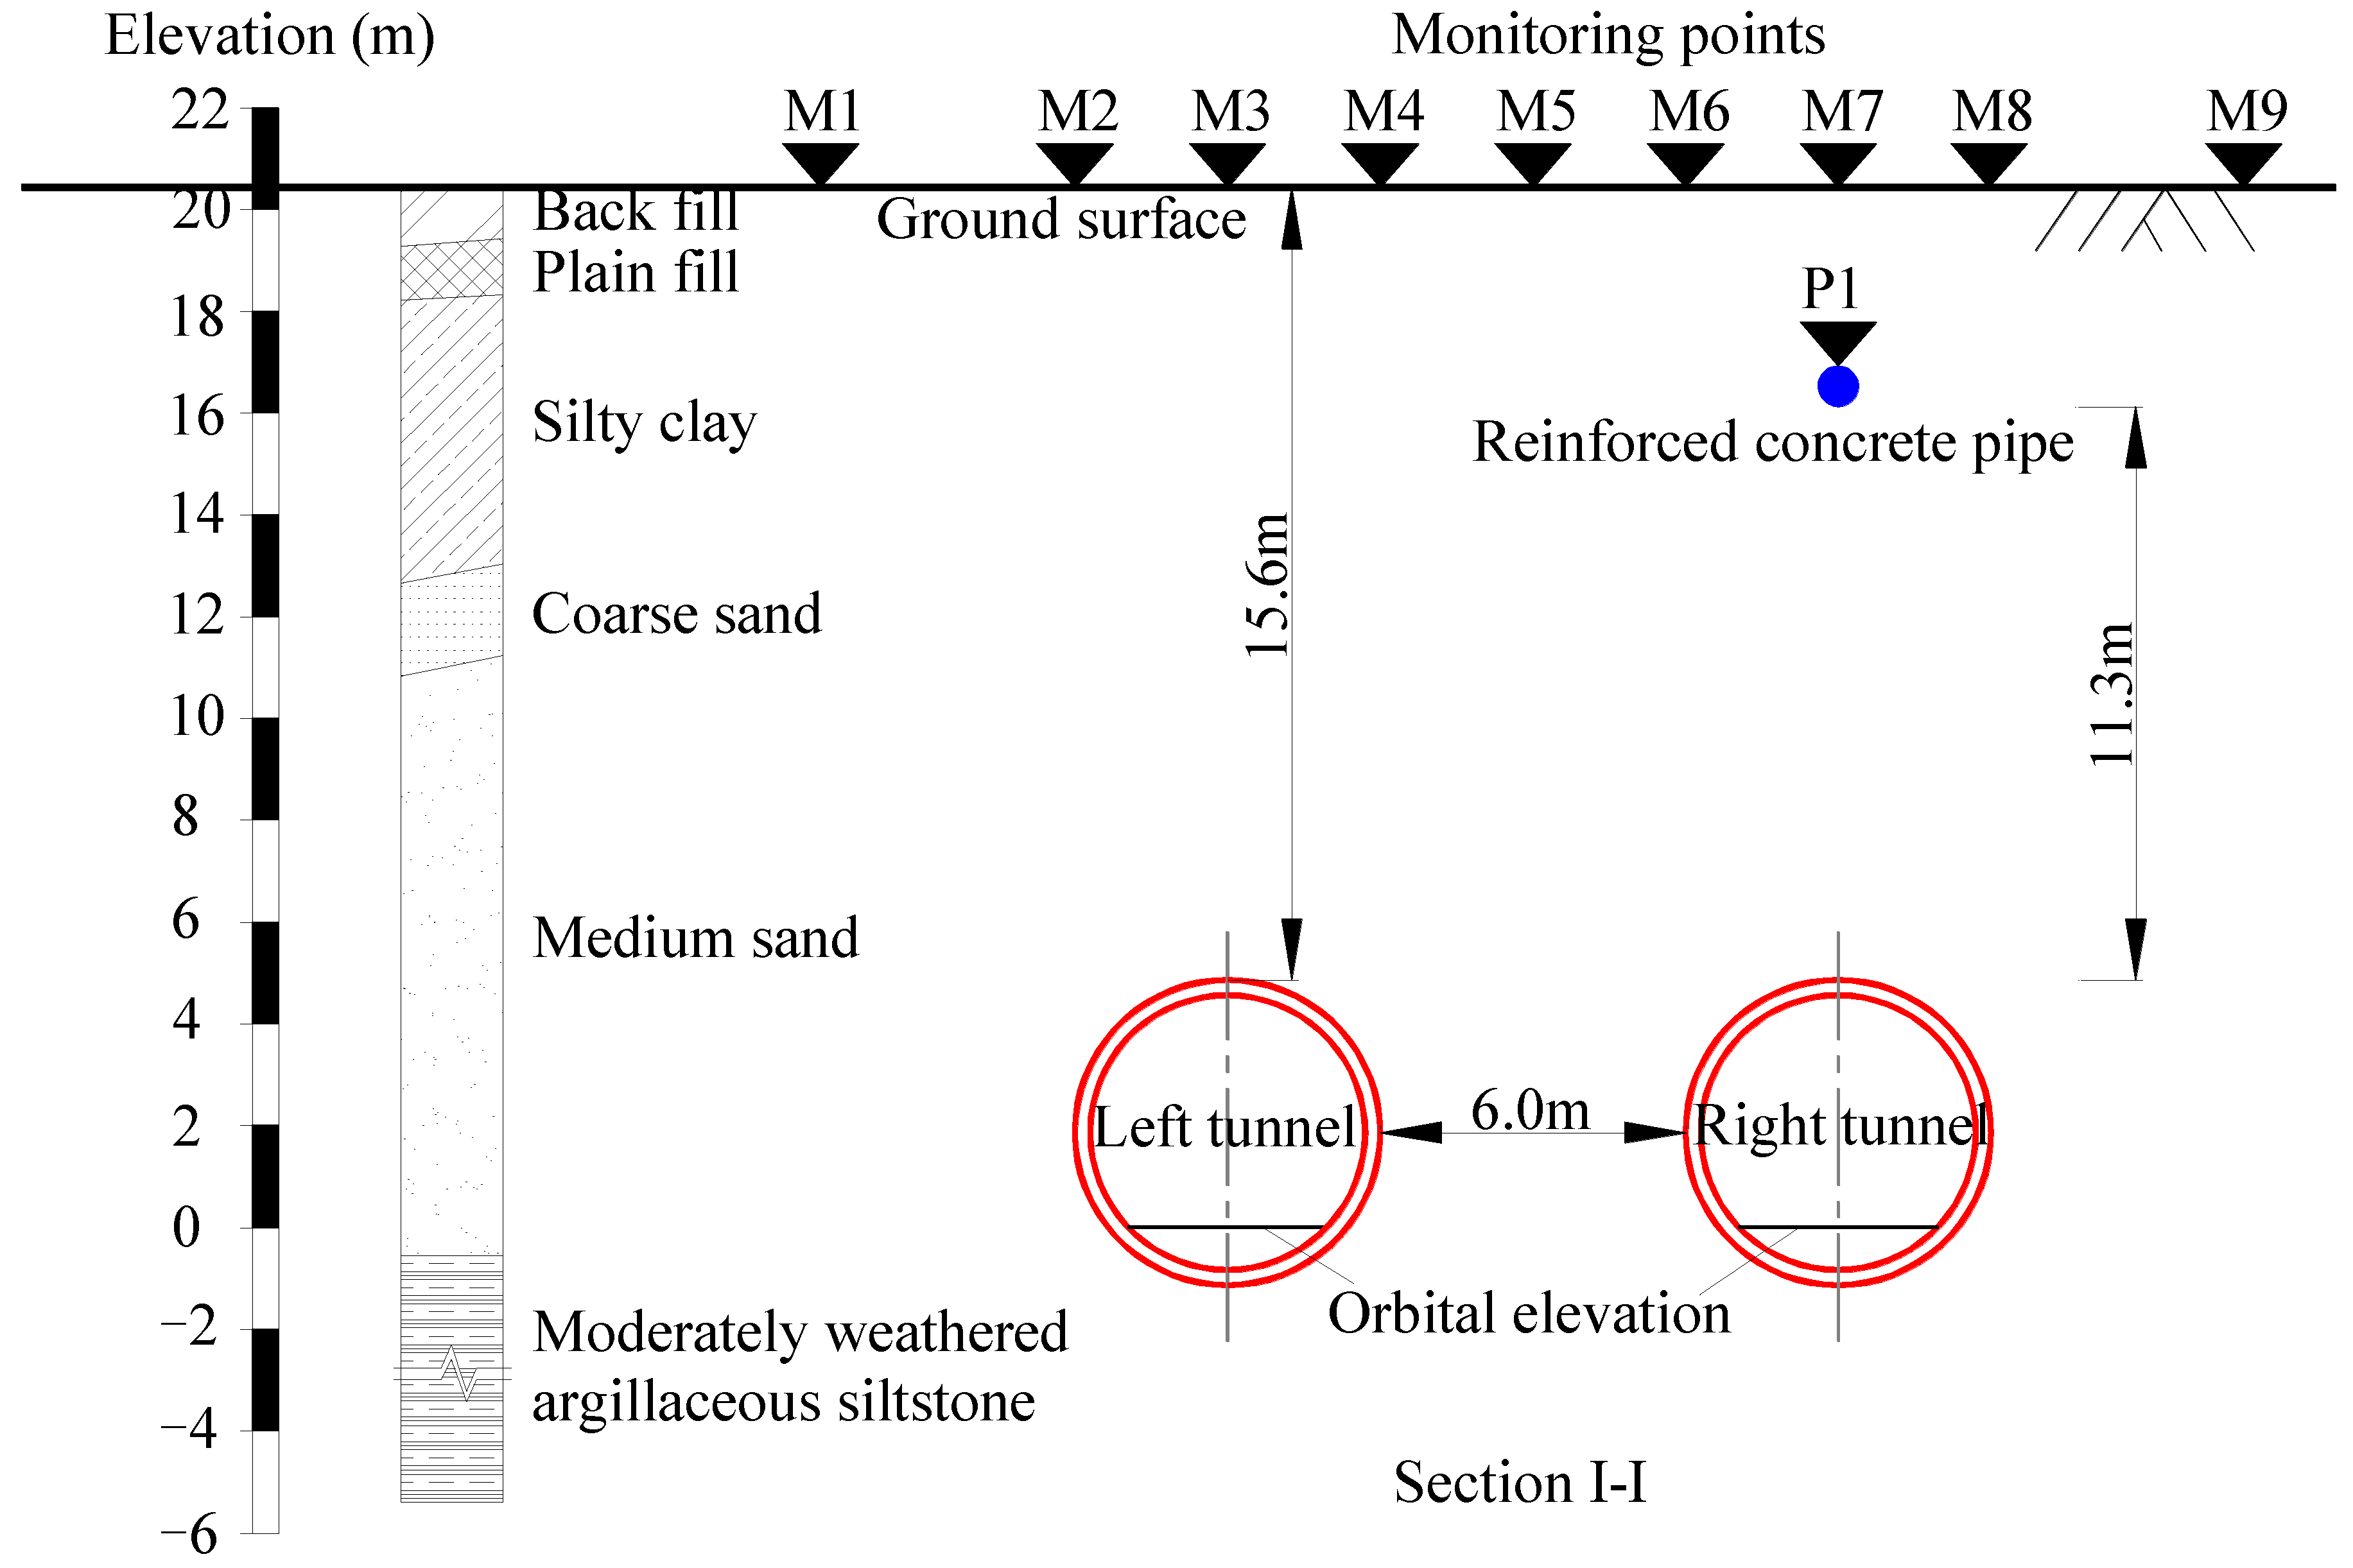
3.1. Project Overview and Monitored Data

Figure 5 shows a plan view of Nanchang Subway Lines. Construction began on Subway Line 1 in 2010, then Lines 2 and 3 were designed in turn. Subway Line 3 was completed in 2020. The total length of Subway Line 3 is 28.5 km, with 22 subway stations from Yin San Jiao Bei Station to Jing Dong Road Station. The stations are mainly excavated by using the cut and cover method and are basically located in medium sand and moderately weathered argillaceous siltstone.
To validate our proposed method, we chose the running tunnel from Jing Jia Shan Station to Shi Zi Street Station. Figure 6 shows a plan view of the running tunnel of Nanchang Subway Line 3. The total length of the running tunnel is 1369.16 m (from DK34+260 to DK35+630). The running tunnel consists of left and right tunnels, excavated by using the shield method. The left and right shield tunnels excavate adjacent to numerous existing buildings and parallel beneath reinforced concrete pipelines. A region from −50 m to 50 m is used in comparison between the analytical and monitoring results.
Figure 7 illustrates a cross-sectional view of the existing pipeline and the new shield tunnels, part of the Nanchang Subway Line 3. The external and the internal radius of the segmental lining are 3.0 m and 2.7 m, respectively. The overburden depth of the shield tunnels is about 15.6 m. The vertical clearance between the shield tunnels and the existing pipeline is about 11.3 m. The external diameter and the width of the existing reinforced concrete pipeline are 0.96 m and 0.08 m, respectively.
After launching from the Shi Zi Street Station, the deformation of the ground surface and pipeline was monitored. The ground surface deformation was measured by total station and bolt-like mark, type TCR1201+ and No. 667556. A magnetic extensometer and probe measured the deformation of the existing pipeline. The monitoring points arrangements for the ground surface and existing pipeline can also be found in Figure 7. The monitoring points are set up every 5 m along the tunnel direction.

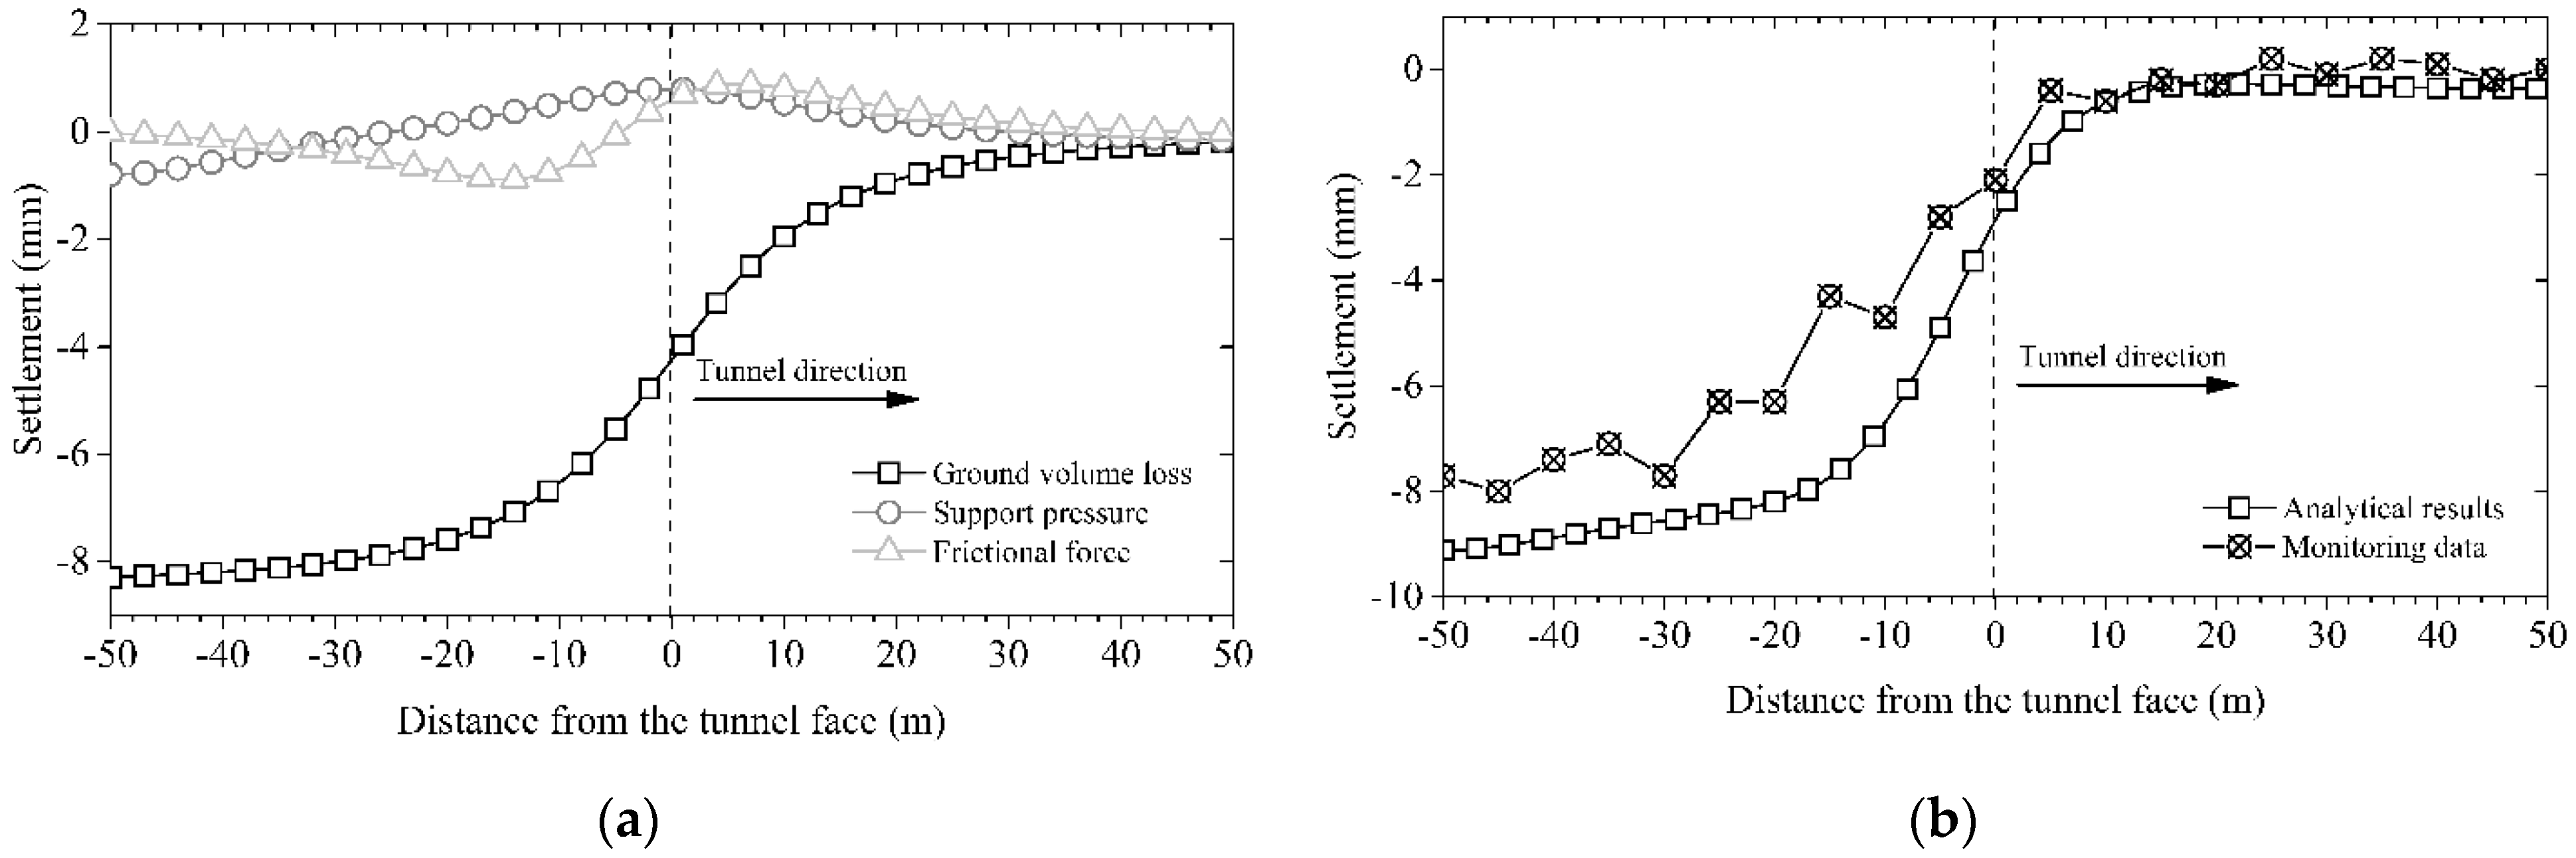
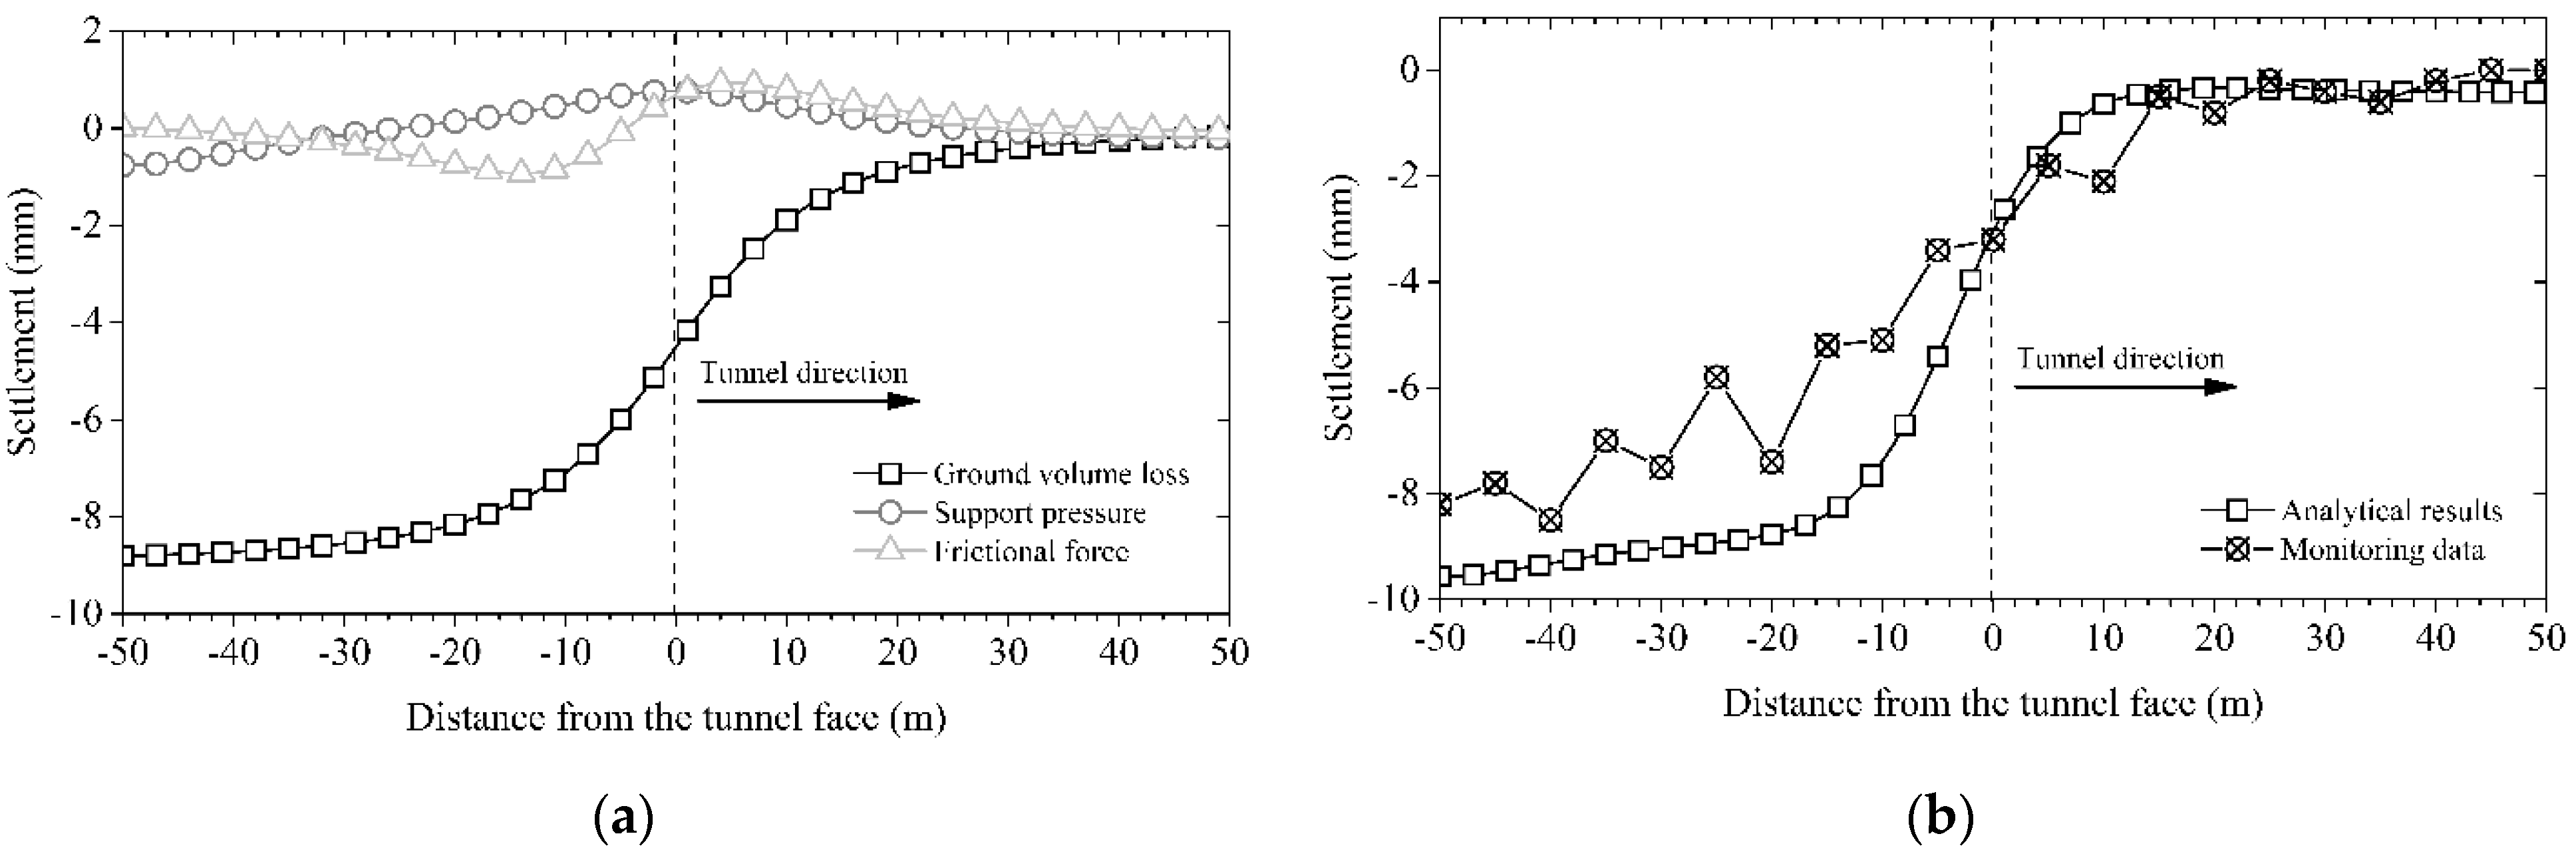
3.2. Calculated Deformation of Ground Surface and Pipeline

The ground surface deformation and pipeline deformation are calculated by our proposed method. The input parameters for the calculation are shown in Table 1. To ensure the stability of the tunnel face, the support pressure is greater than the earth pressure. A differential value of 10 kPa is selected to obtain the deformation induced by support pressure at the tunnel face. The earth pressure also represents the normal force between the shield shell and the soil. The coefficient of the frictional force is 0.3 for medium sand. The ground deformation is calculated by using the Gaussian integration method to obtain the numerical results. The pipeline deformation is obtained by the finite difference method.
Figure 8 shows the different components of the ground surface deformation induced by the shield tunnelling. Y-axis is taken as the shield tunnel construction direction, and the tunnel face is located at y = 0. The maximum ground surface deformation induced by the ground volume loss, support pressure, frictional force, and torsional force are 8.29, 0.79, 0.89, and 1.77 mm, respectively. The ground volume loss causes most of the deformation behind the shield tail. A tiny protrusion before the tunnel face is induced by the support pressure at the tunnel face and the frictional force of the shield shell. The torsional force of the cutter head produces an antisymmetric deformation of which one side is concave, and the other side is convex.
Jin et al. [34] have indicated that the deformation induced by the torsional force was so small that it needs no more attention. However, the conclusion neglects the spatiotemporal characteristic of the tunnel construction. Due to the superposition of the deformation during the shield tunnelling, more attention should be paid to the deformation induced by different force patterns. Moreover, the pipeline and ground surface have similar longitudinal deformation profiles induced by the shield tunnelling. The magnitudes of the pipeline deformation are larger than those of the ground surface. The relevant description of the pipeline deformation is omitted.

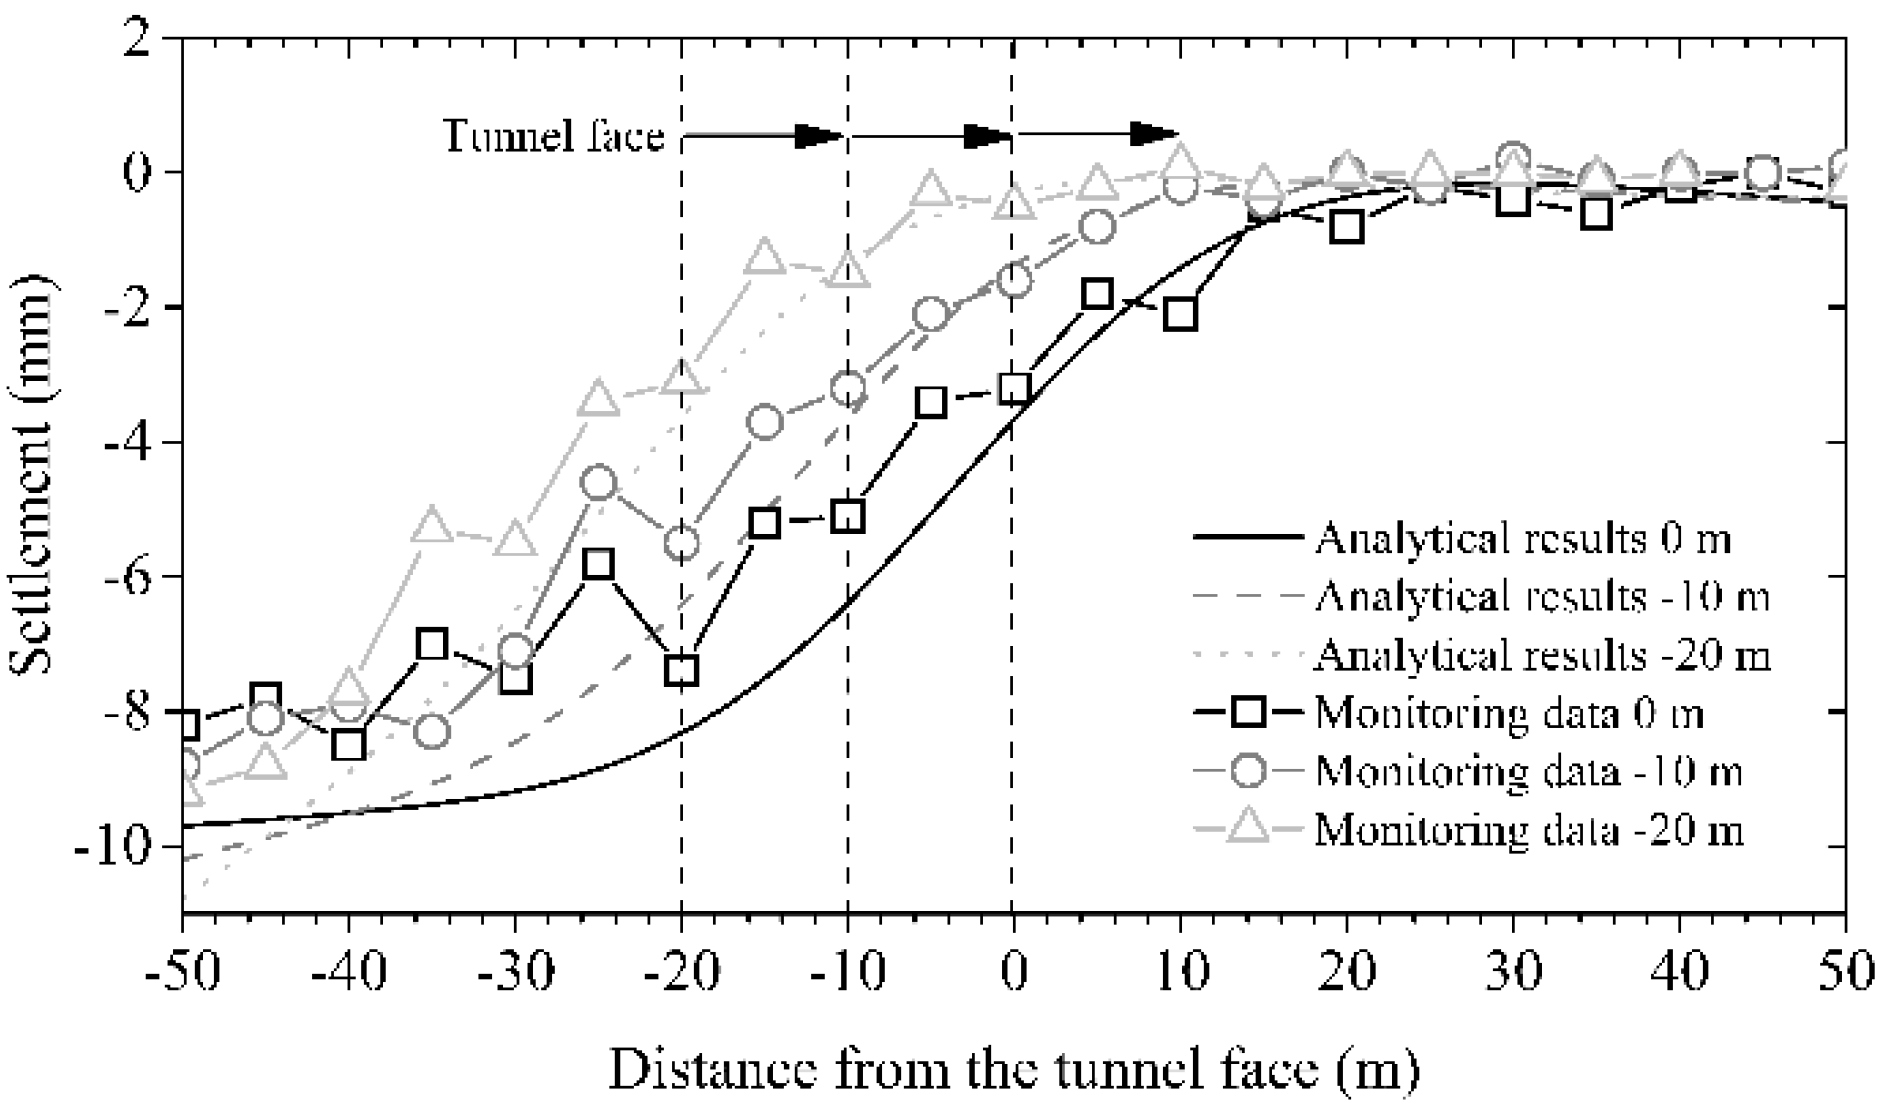
3.3. Comparison between Analytical and Monitoring Results

Figure 9a shows the longitudinal profiles of the ground surface deformation induced by different force patterns during the shield tunnelling. The deformation induced by the torsional force is not drawn because the value is minimal at x = 0. A superposition of all the deformation components is shown in Figure 9b as well as the monitoring data of the ground surface. The analytical deformation develops rapidly near the tunnel face, then eventually increases to a stable value of 9.11 mm far away from the tunnel face. The maximum monitoring data of the ground surface is about 8.0 mm, which is 12% less than the analytical results proposed by our method.
Moreover, Figure 10a illustrates the longitudinal profiles of the ground deformation at the pipeline’s elevation (zp = 4 m) induced by the ground volume loss, support pressure, and frictional force. According to the subgrade reaction analysis in Section 2.3, the pipeline deformation is calculated and drawn in Figure 10b, as well as the monitoring data of the pipeline. The maximum value proposed by our method is 9.6 mm, 11.5% more than the maximum value of the monitoring data. Based on Figure 9 and Figure 10, the analytical results agree well with the monitoring data, confirming that our proposed method is applicable.
Figure 11 shows the pipeline deformation and monitoring data with shield tunnel advance. The shield tunnel is excavated ahead from y = −20 m to −10 m and to 0 m. The longitudinal profiles of the pipeline deformation are similar and move forward as a whole. The predicted deformation before the tunnel face matches well with the monitoring data. In contrast, the deformation is larger than the stable value of the monitoring data after the tunnel face. The differences between the analytical results and the monitoring data mainly come from two aspects: (a) the soil in the multiple layers has different types instead of a uniform and elastic medium. (b) the grouting implementation enhances the soil properties and reduces the pipeline deformation. Although the analytical results diverge from the monitoring data, the proposed method gives a relatively feasible estimation of the pipeline deformation considering the tunnel advancing.

4. Parametric Analysis

During the shield tunnel advances, the ground volume loss, the support pressure at the tunnel face, the frictional force of the shield shell, and the torsional force of the cutter head affect the pipeline’s deformation. Therefore, further parametric analysis is performed in this section to study the influences. The input parameters are listed in Table 1.

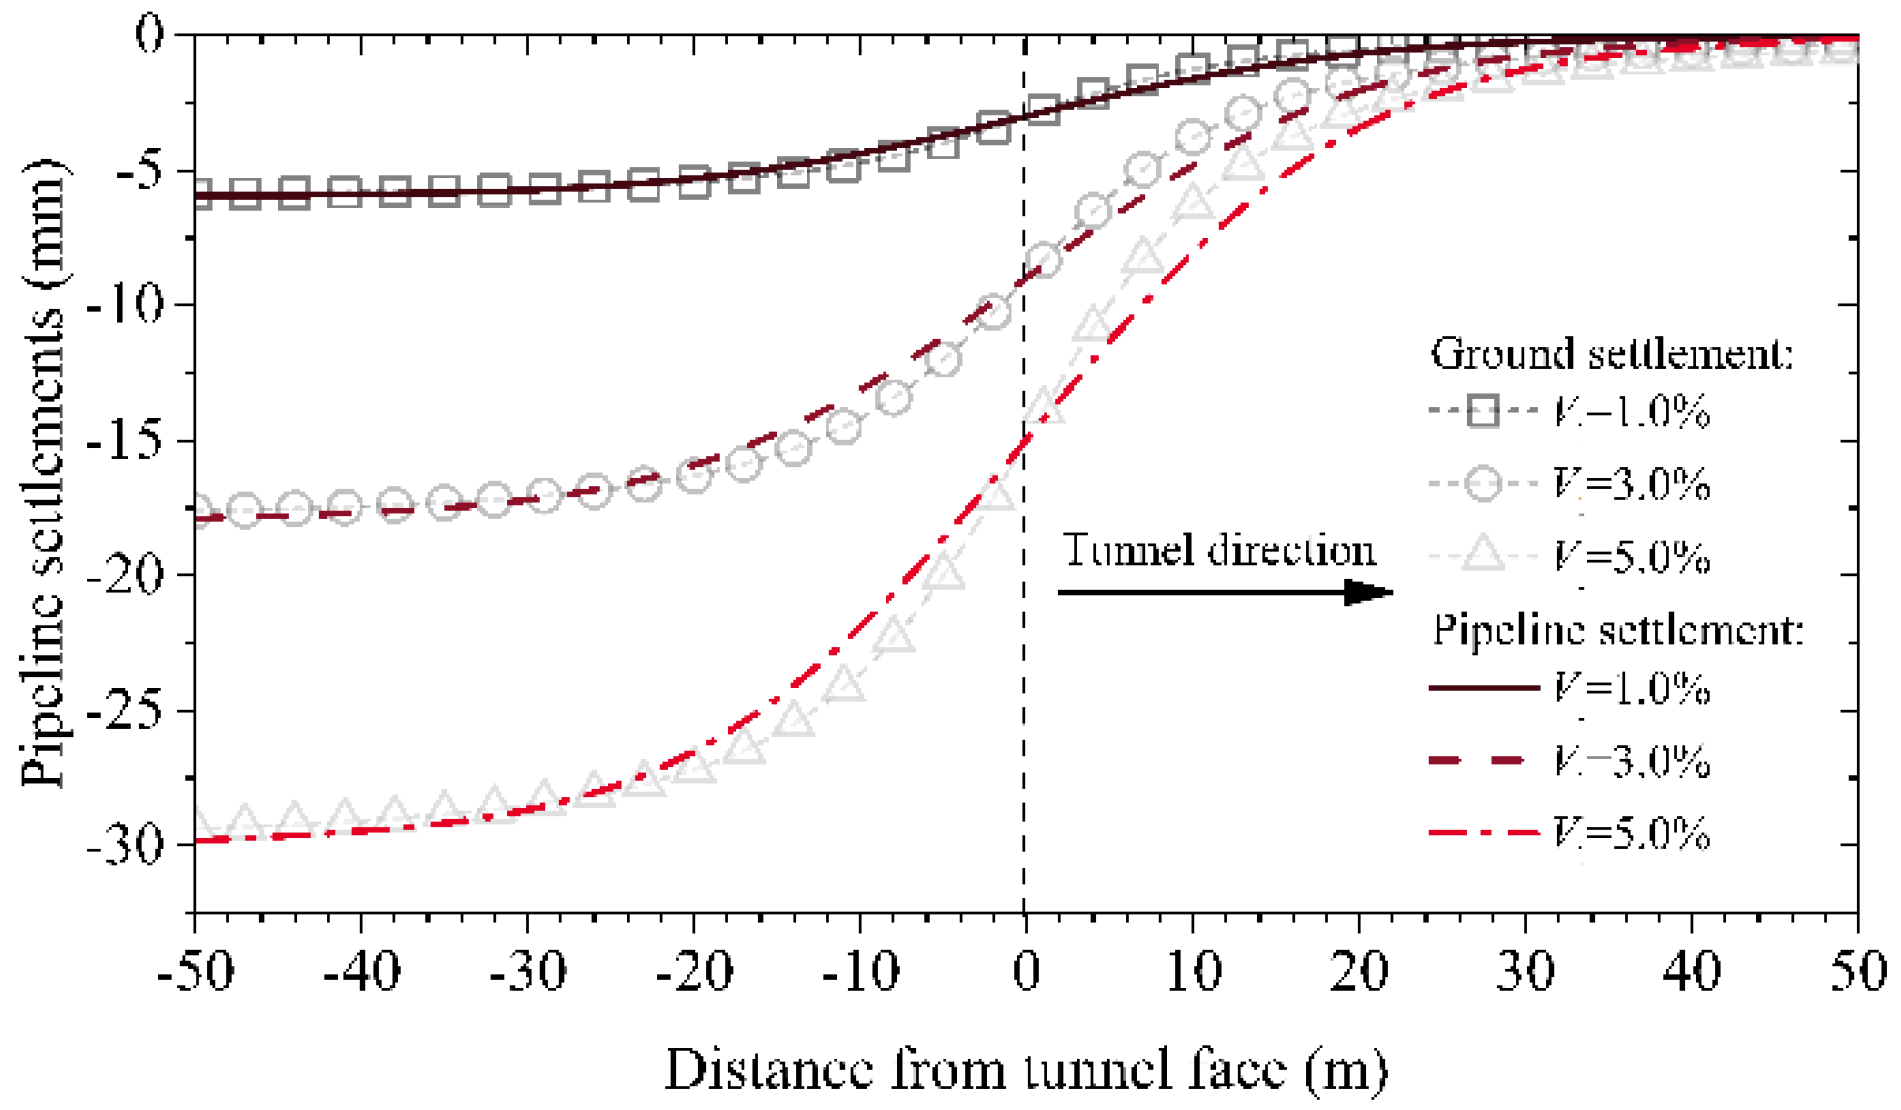
4.1. Ground Volume Loss

The ground volume loss ratio is set to be 1.0%, 3.0%, and 5.0%, respectively. Figure 12 shows the ground deformation at the pipeline’s elevation and the pipeline’s deformation. The pipeline’s deformation increases significantly with the increased ground volume loss. Reducing the ground volume loss is significant in controlling the pipeline’s deformation during tunnel construction.

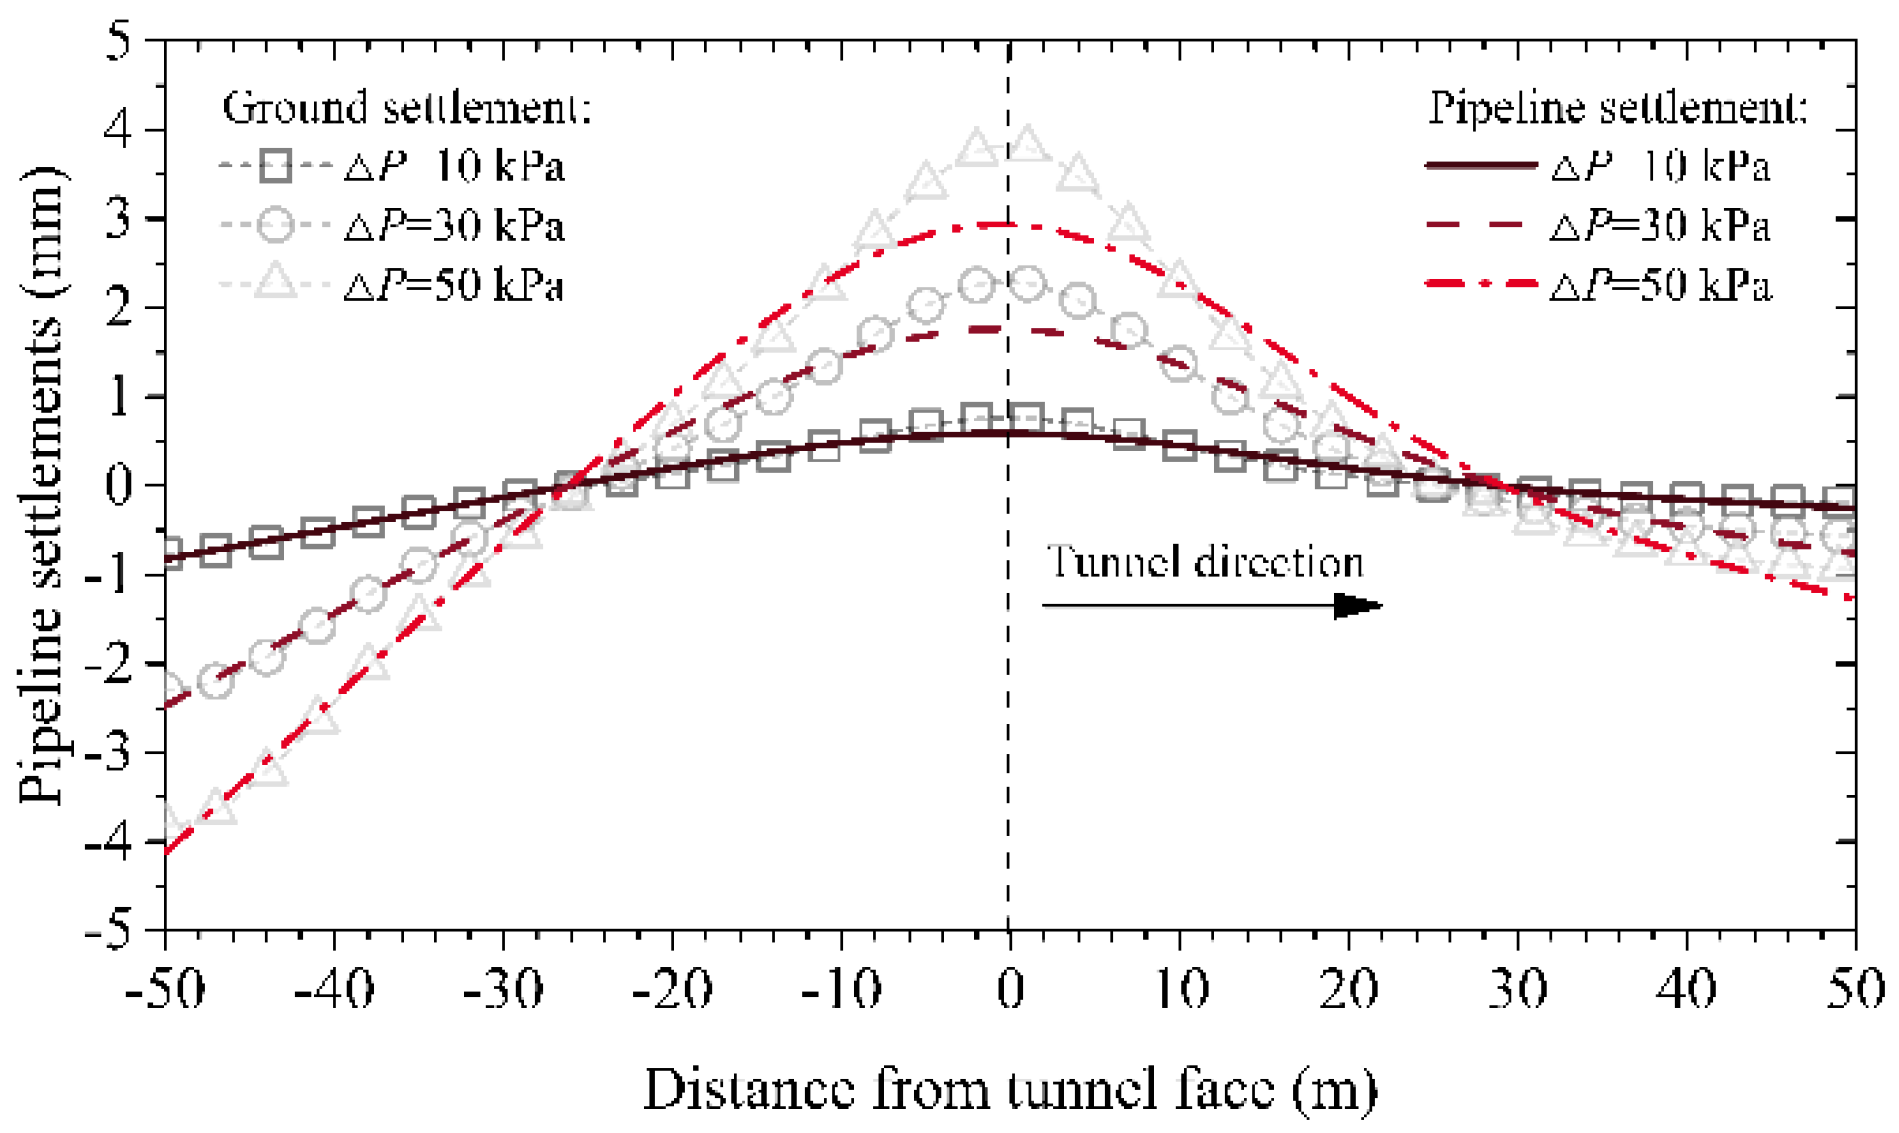
4.2. Support Pressure

Figure 13 shows the ground deformation at the pipeline’s elevation and the pipeline’s deformation with different support pressures at the tunnel face. The divergence of the support pressure ΔP ranges from 10 kPa to 50 kPa. The ground deformation is larger than the pipeline’s deformation. The pipeline’s deformation near the tunnel face increases with the increase of ΔP. To prevent the pipeline’s uplift, the support pressure’s divergence should be limited to a minor value.

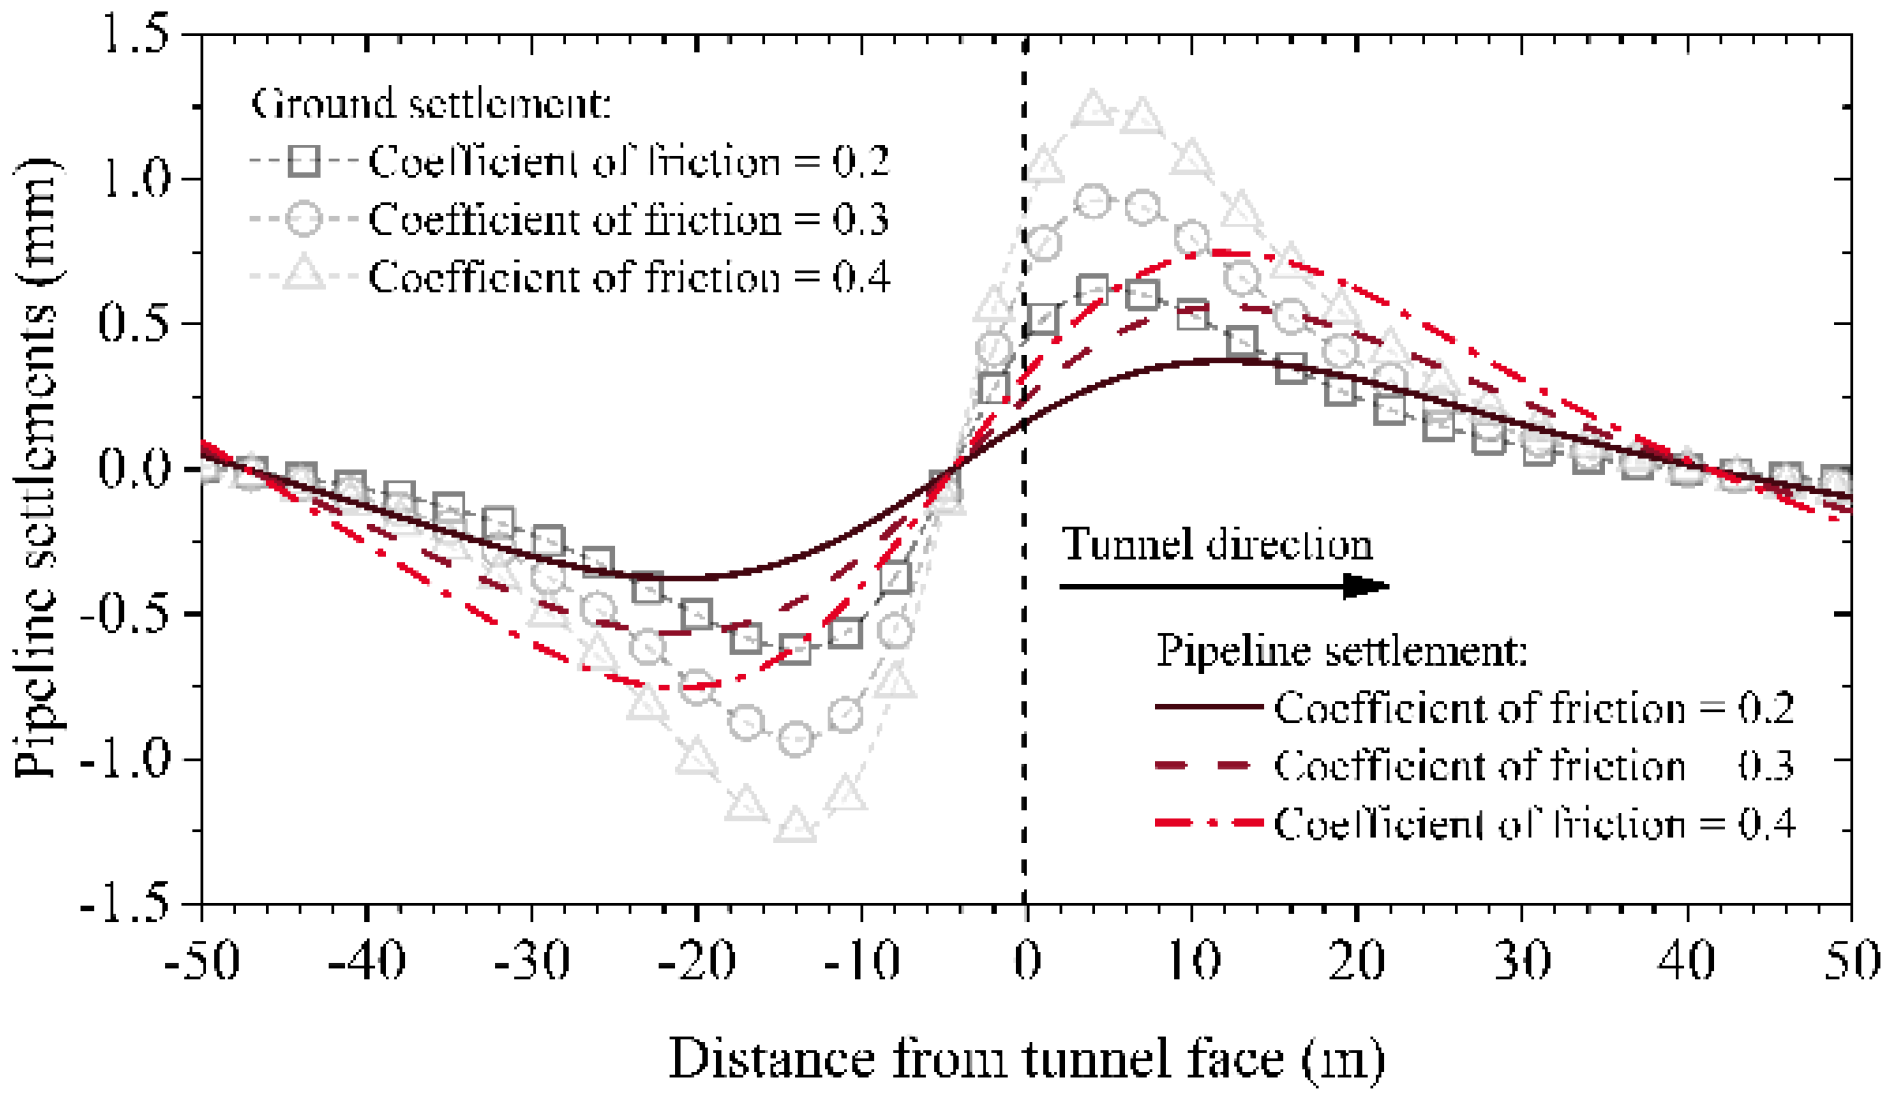
4.3. Frictional Force

The longitudinal profiles of the pipeline’s deformation with different frictional forces are shown in Figure 14. The coefficient of frictional force is set to be 0.2, 0.3, and 0.4. The pipeline’s deformation increases with the increased coefficient of frictional force. The pipeline’s deformation is antisymmetric and protruded before the tunnel face. Therefore, the deformation induced by the frictional forces cannot be ignored. For reducing the relevant deformation, a lubricant needs to be applied on the outer skin of the shield shell.

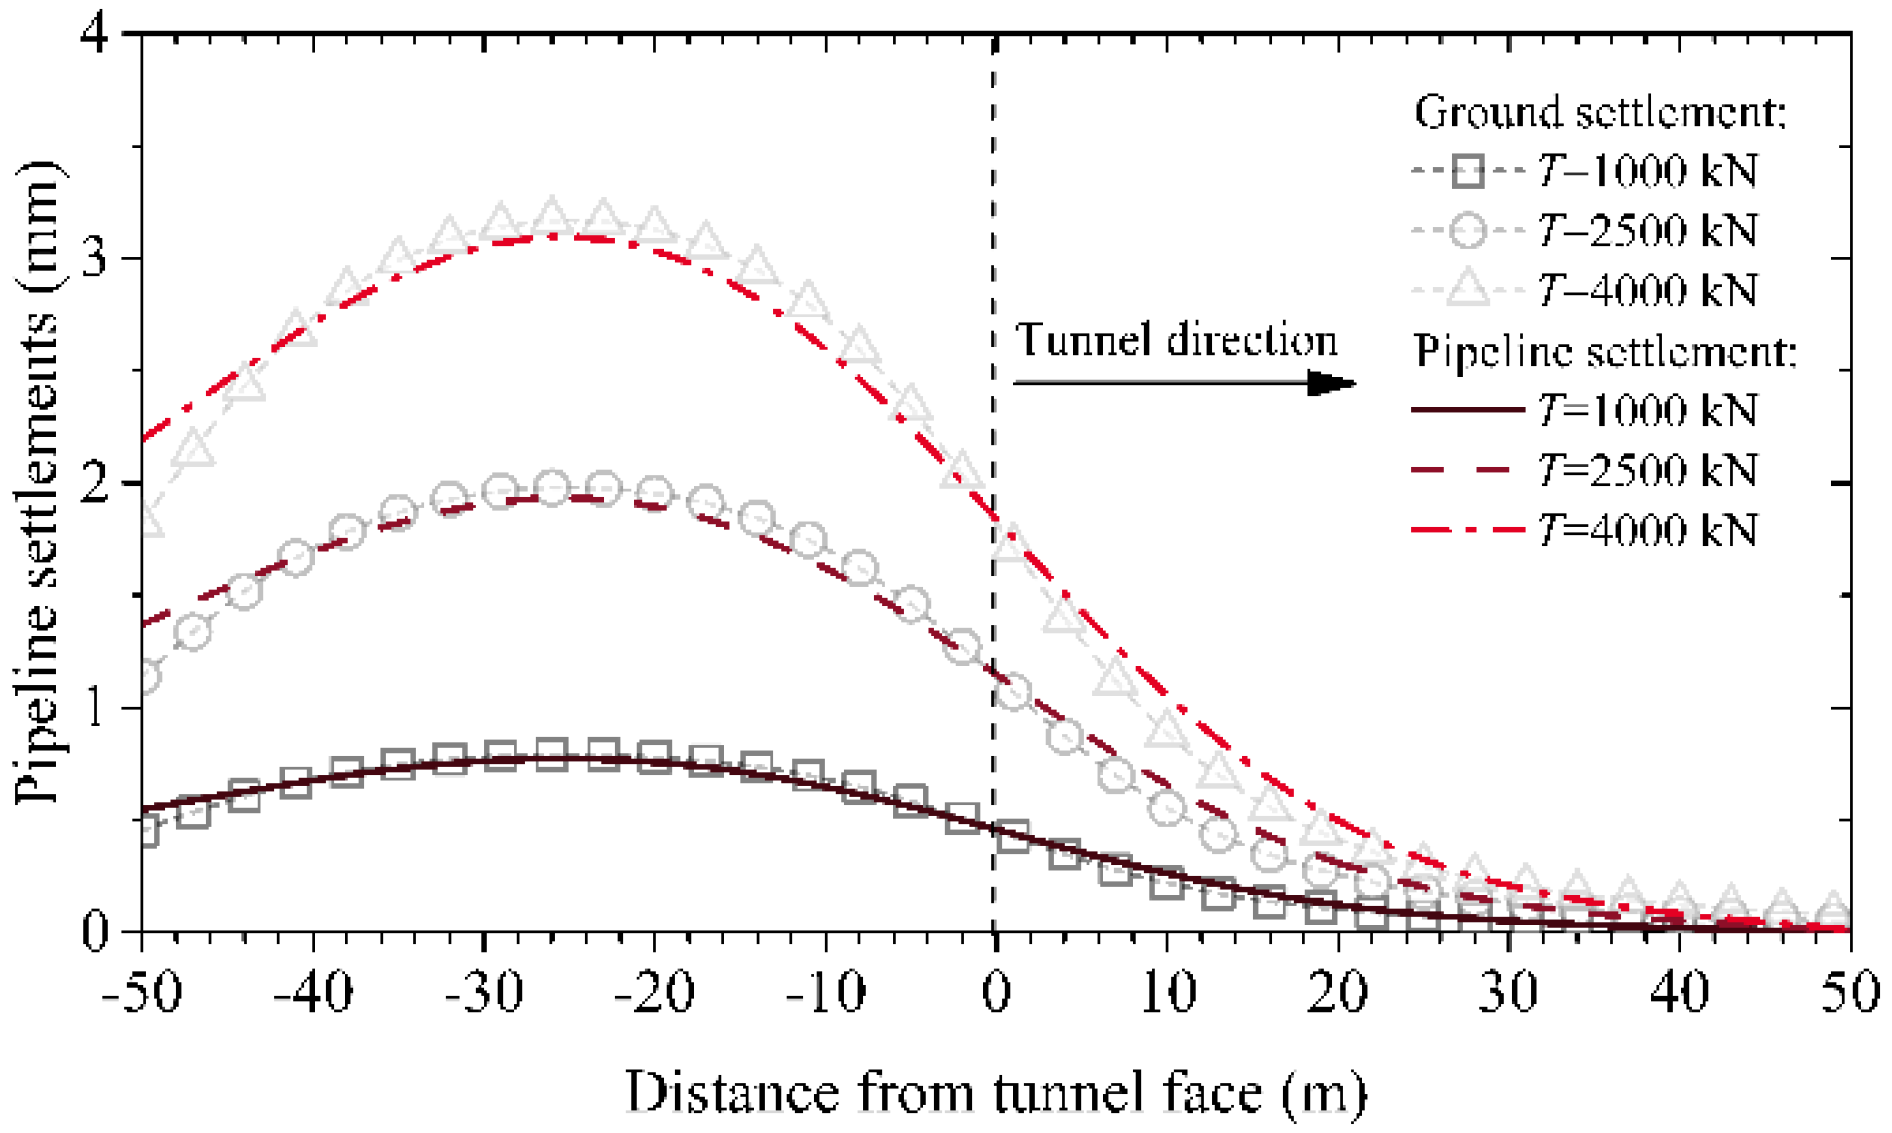
4.4. Torsional Force

According to Figure 8d, the pipeline almost produces no deformation induced by torsional forces because the pipeline is directly above the shield tunnel. The antisymmetric deformation generates on the two sides of the shield tunnel. We select the deformation at x = −10 to illustrate the effect of the torsional forces on the pipeline’s deformation shown in Figure 15. The torsional forces are set to be 1000, 2500, and 4000 kN. The pipeline’s deformation increases with the increase of the torsional forces.

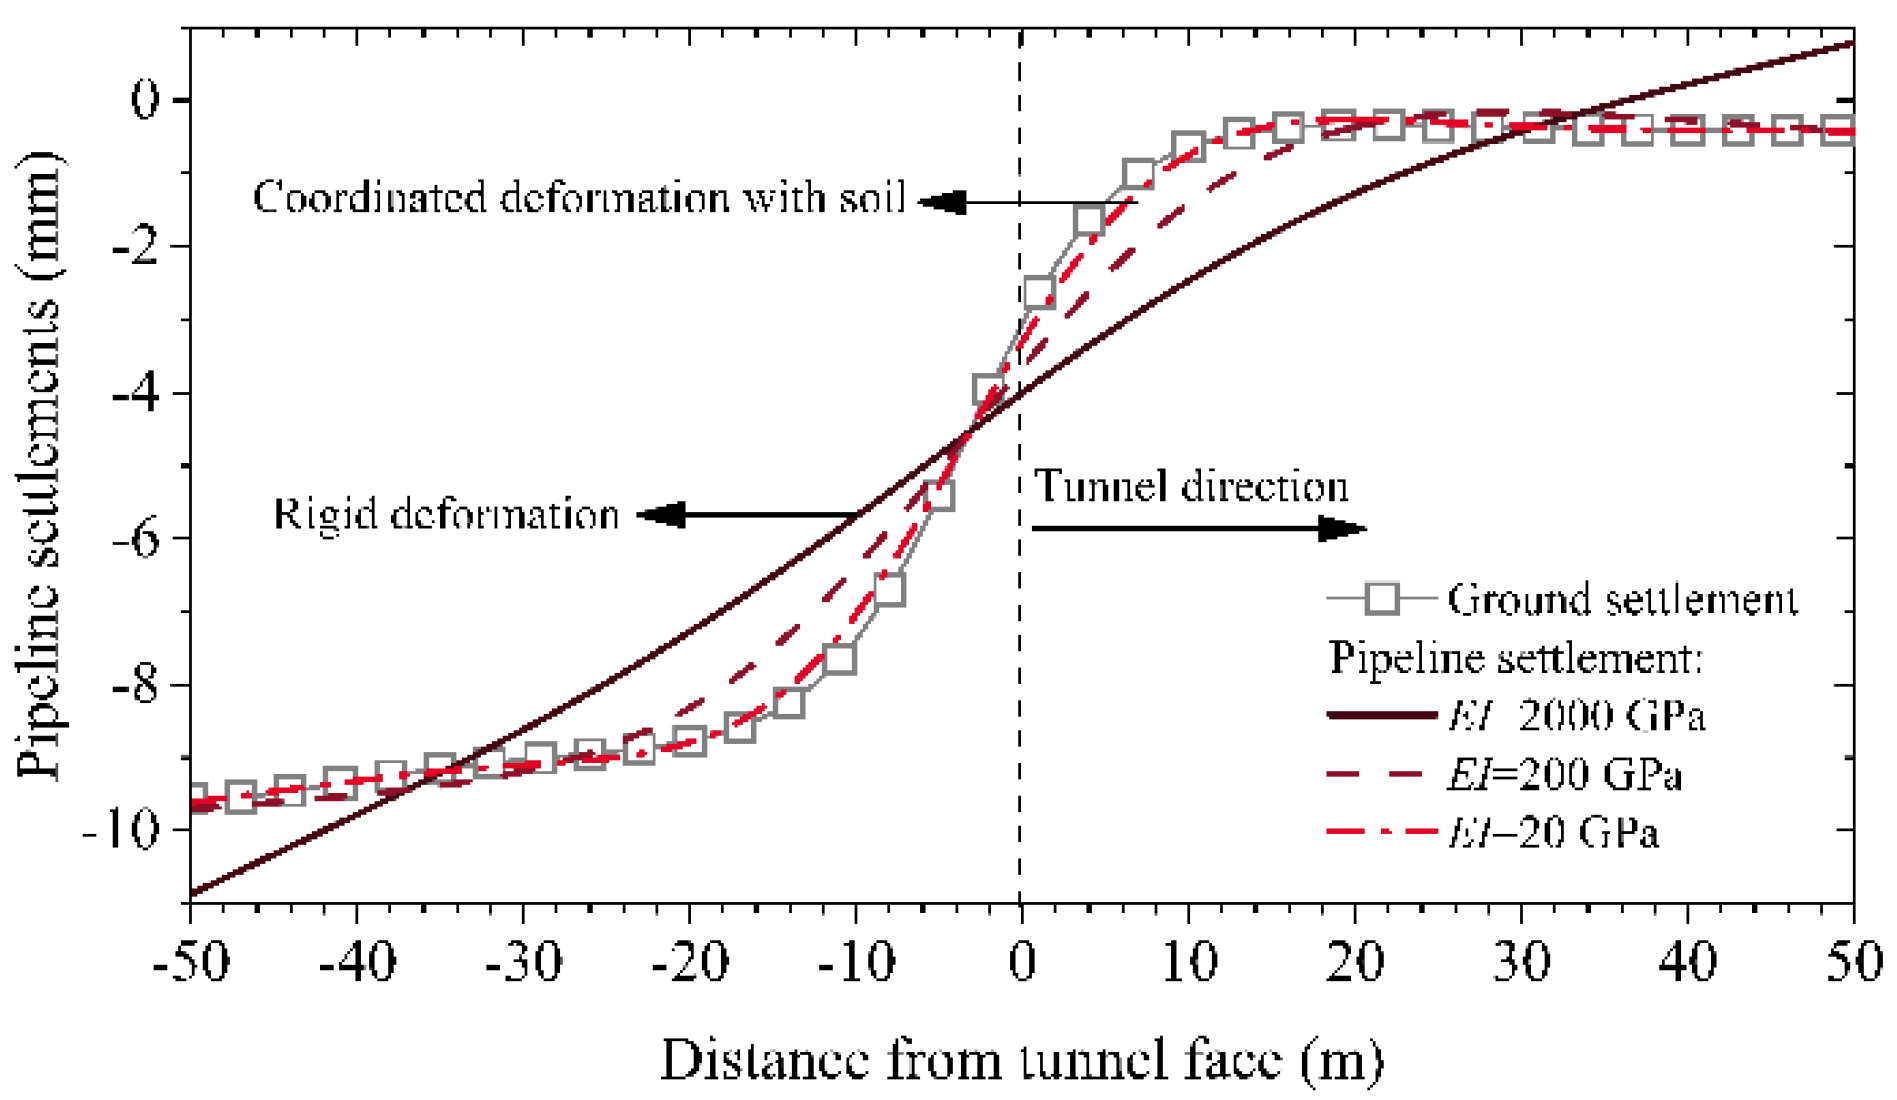
4.5. Equivalent Bending Stiffness of Pipeline

According to the pipeline’s deformation from Figure 12, Figure 13, Figure 14 and Figure 15, the pipeline sometimes generates rigid deformation, sometimes flexible deformation. The flexible deformation is the coordinated deformation with the ground. Some previous studies indicated that the deformation mechanism is relative to the equivalent bending stiffness. Figure 16 illustrates the effect of the equivalent bending stiffness on the pipeline’s deformation. Smaller equivalent bending stiffness results in coordinated deformation with the ground, whereas a larger one results in rigid deformation.

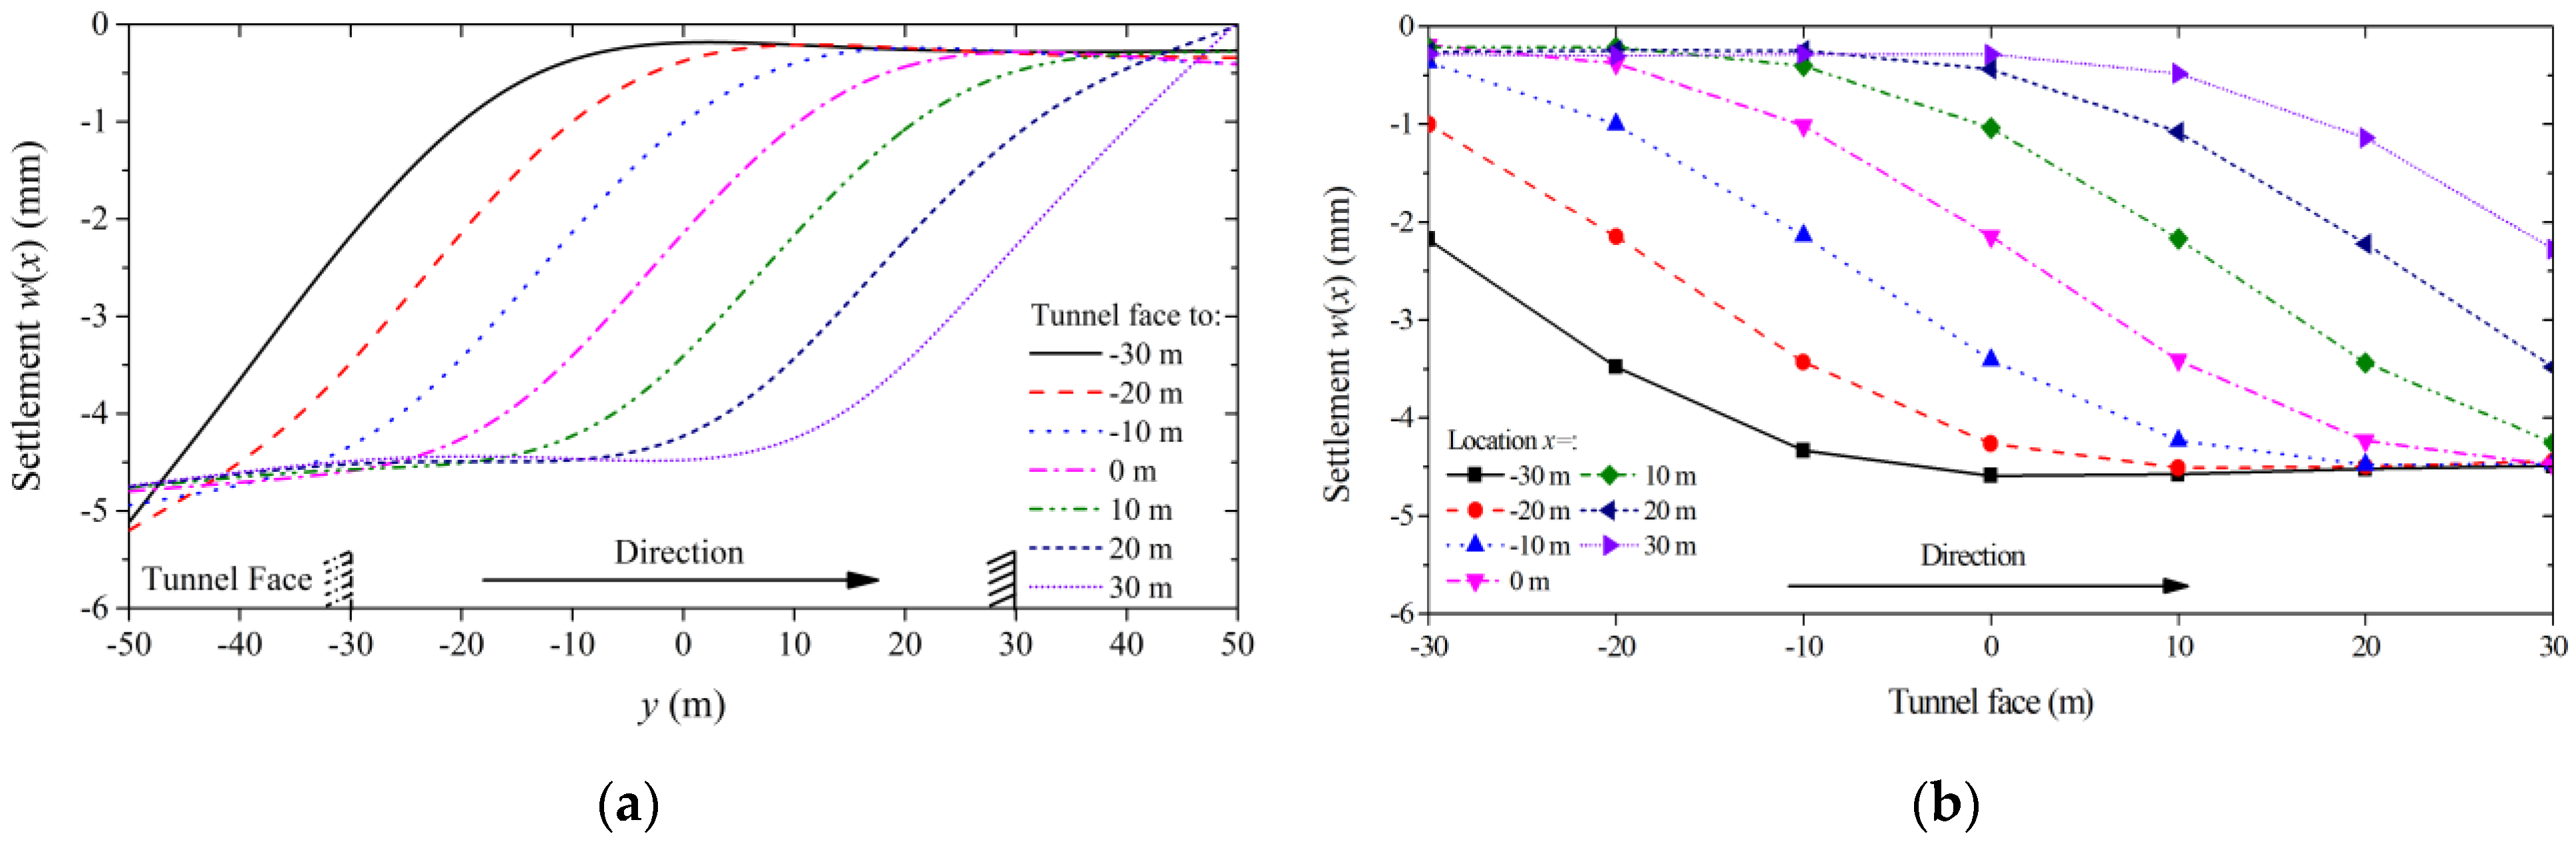
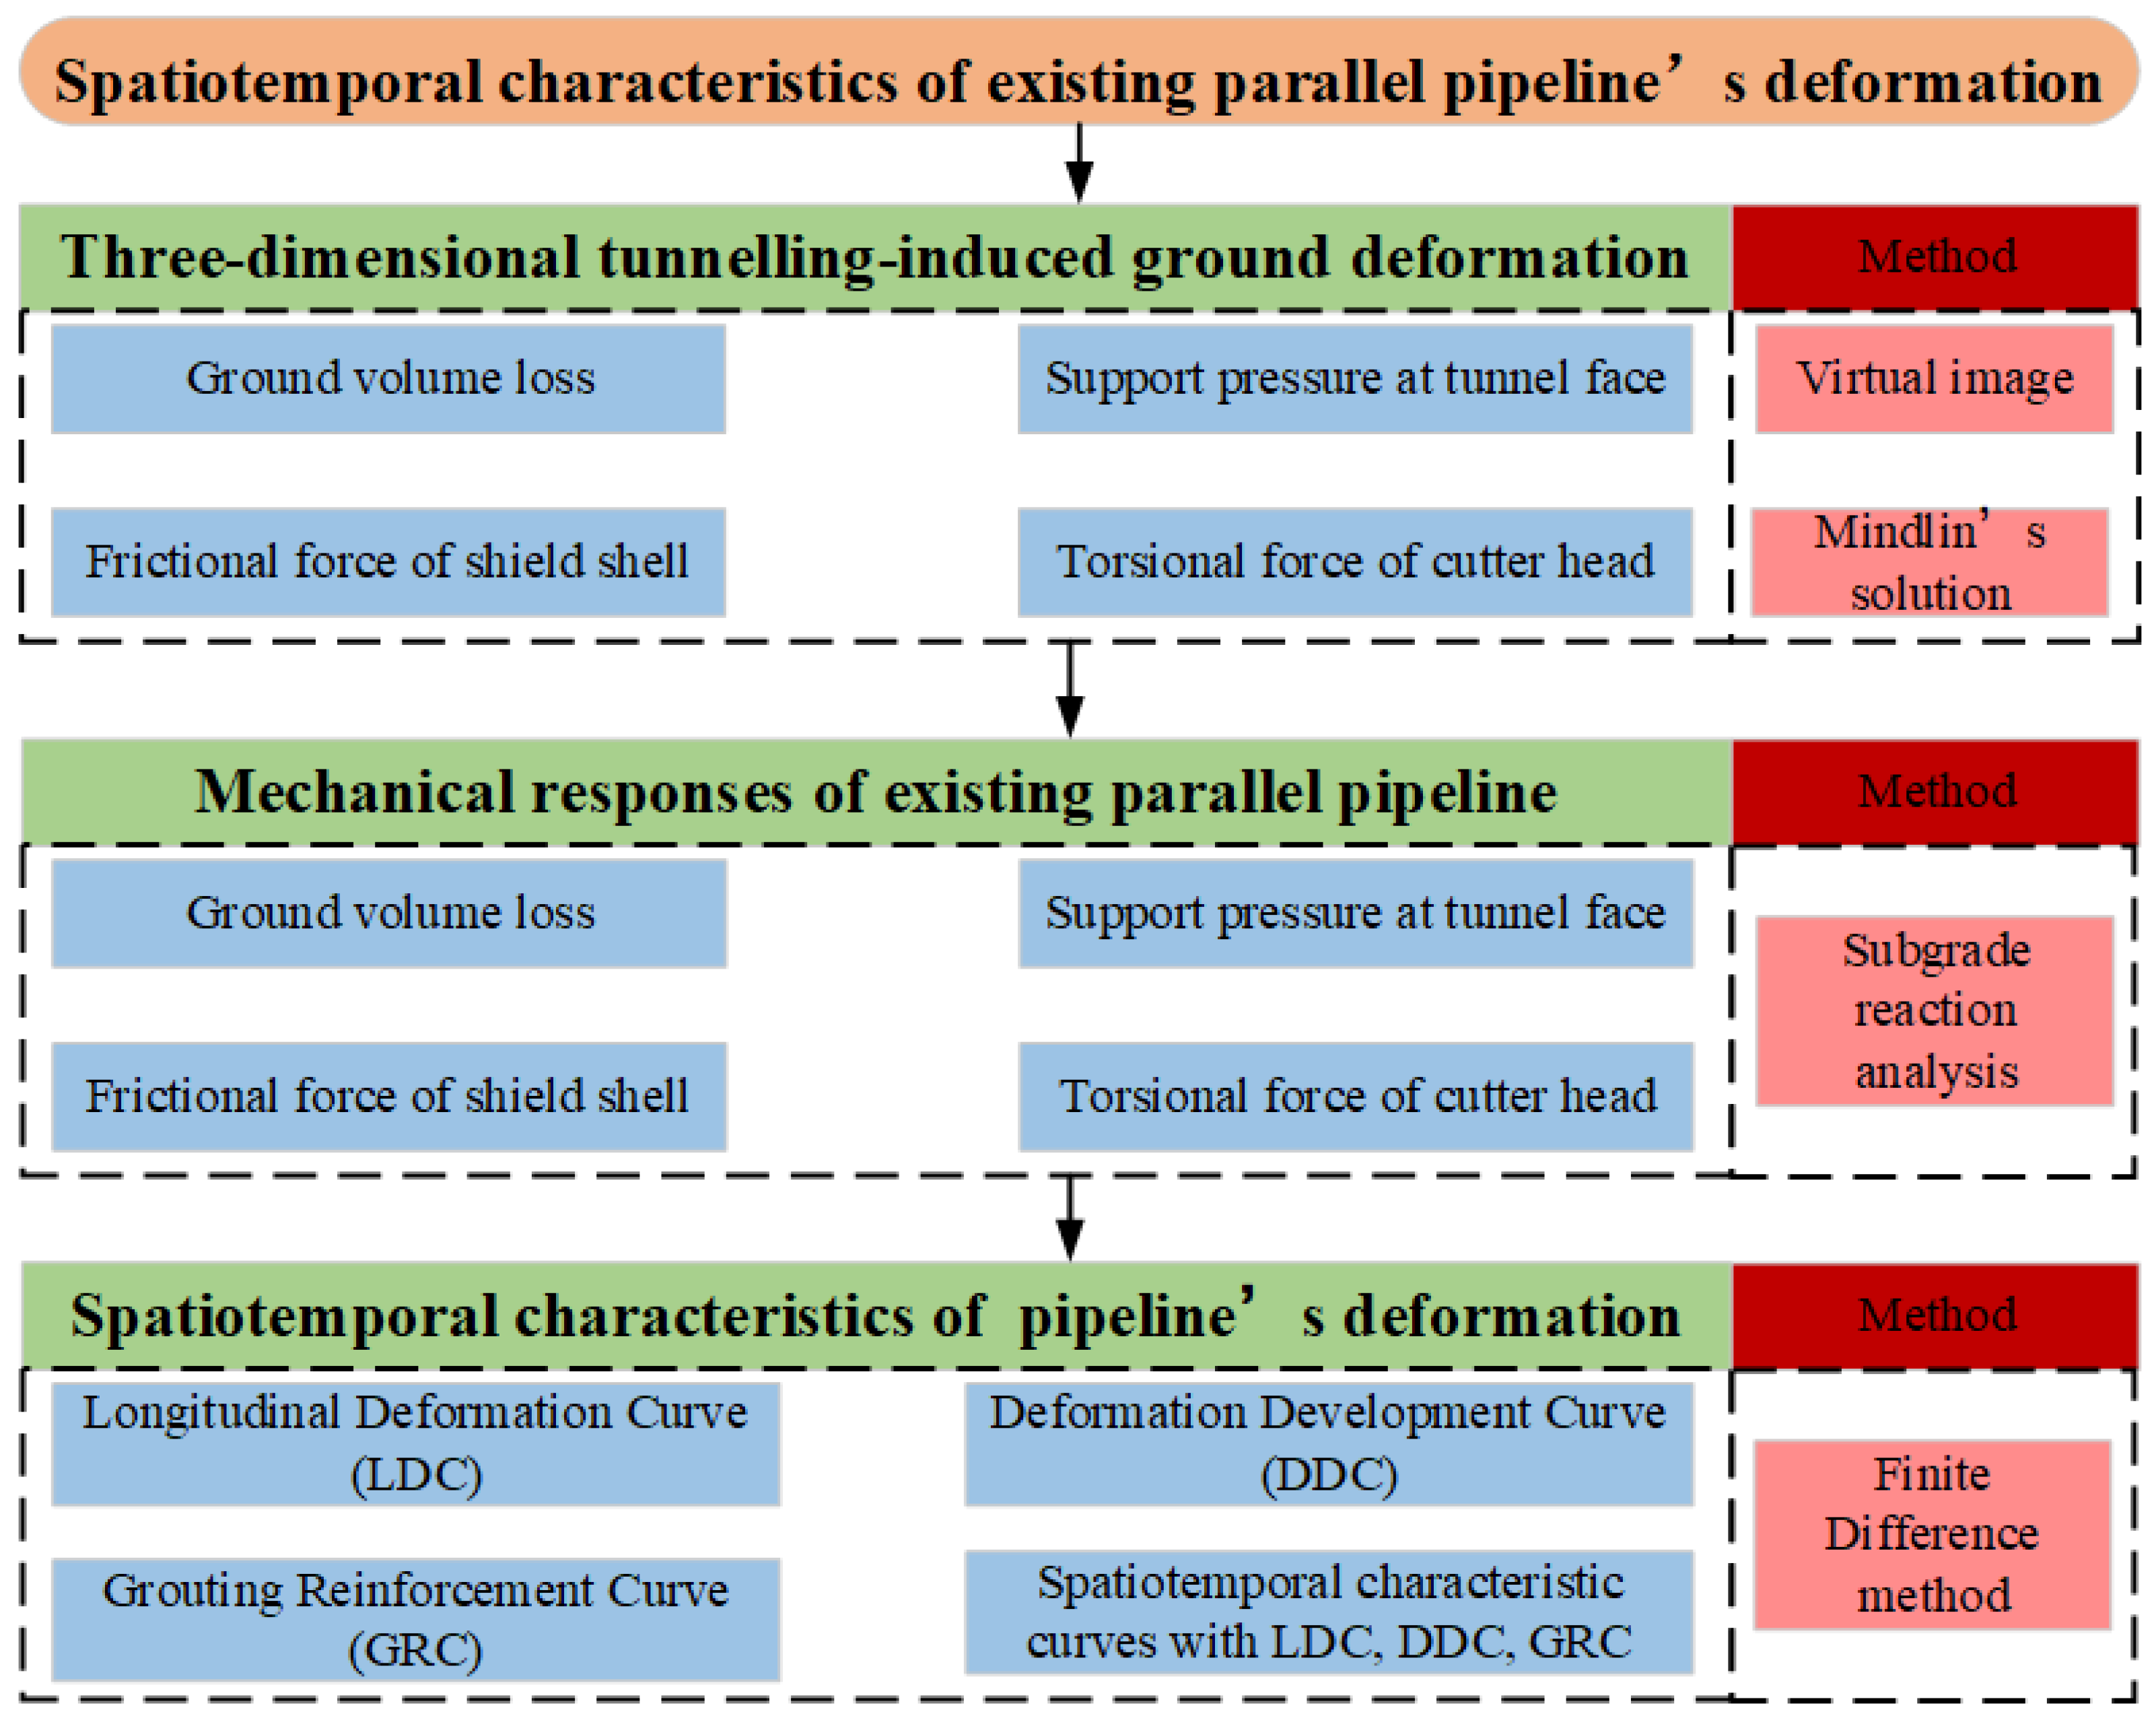
5. Spatiotemporal Characteristics of Existing Pipeline’s Deformation

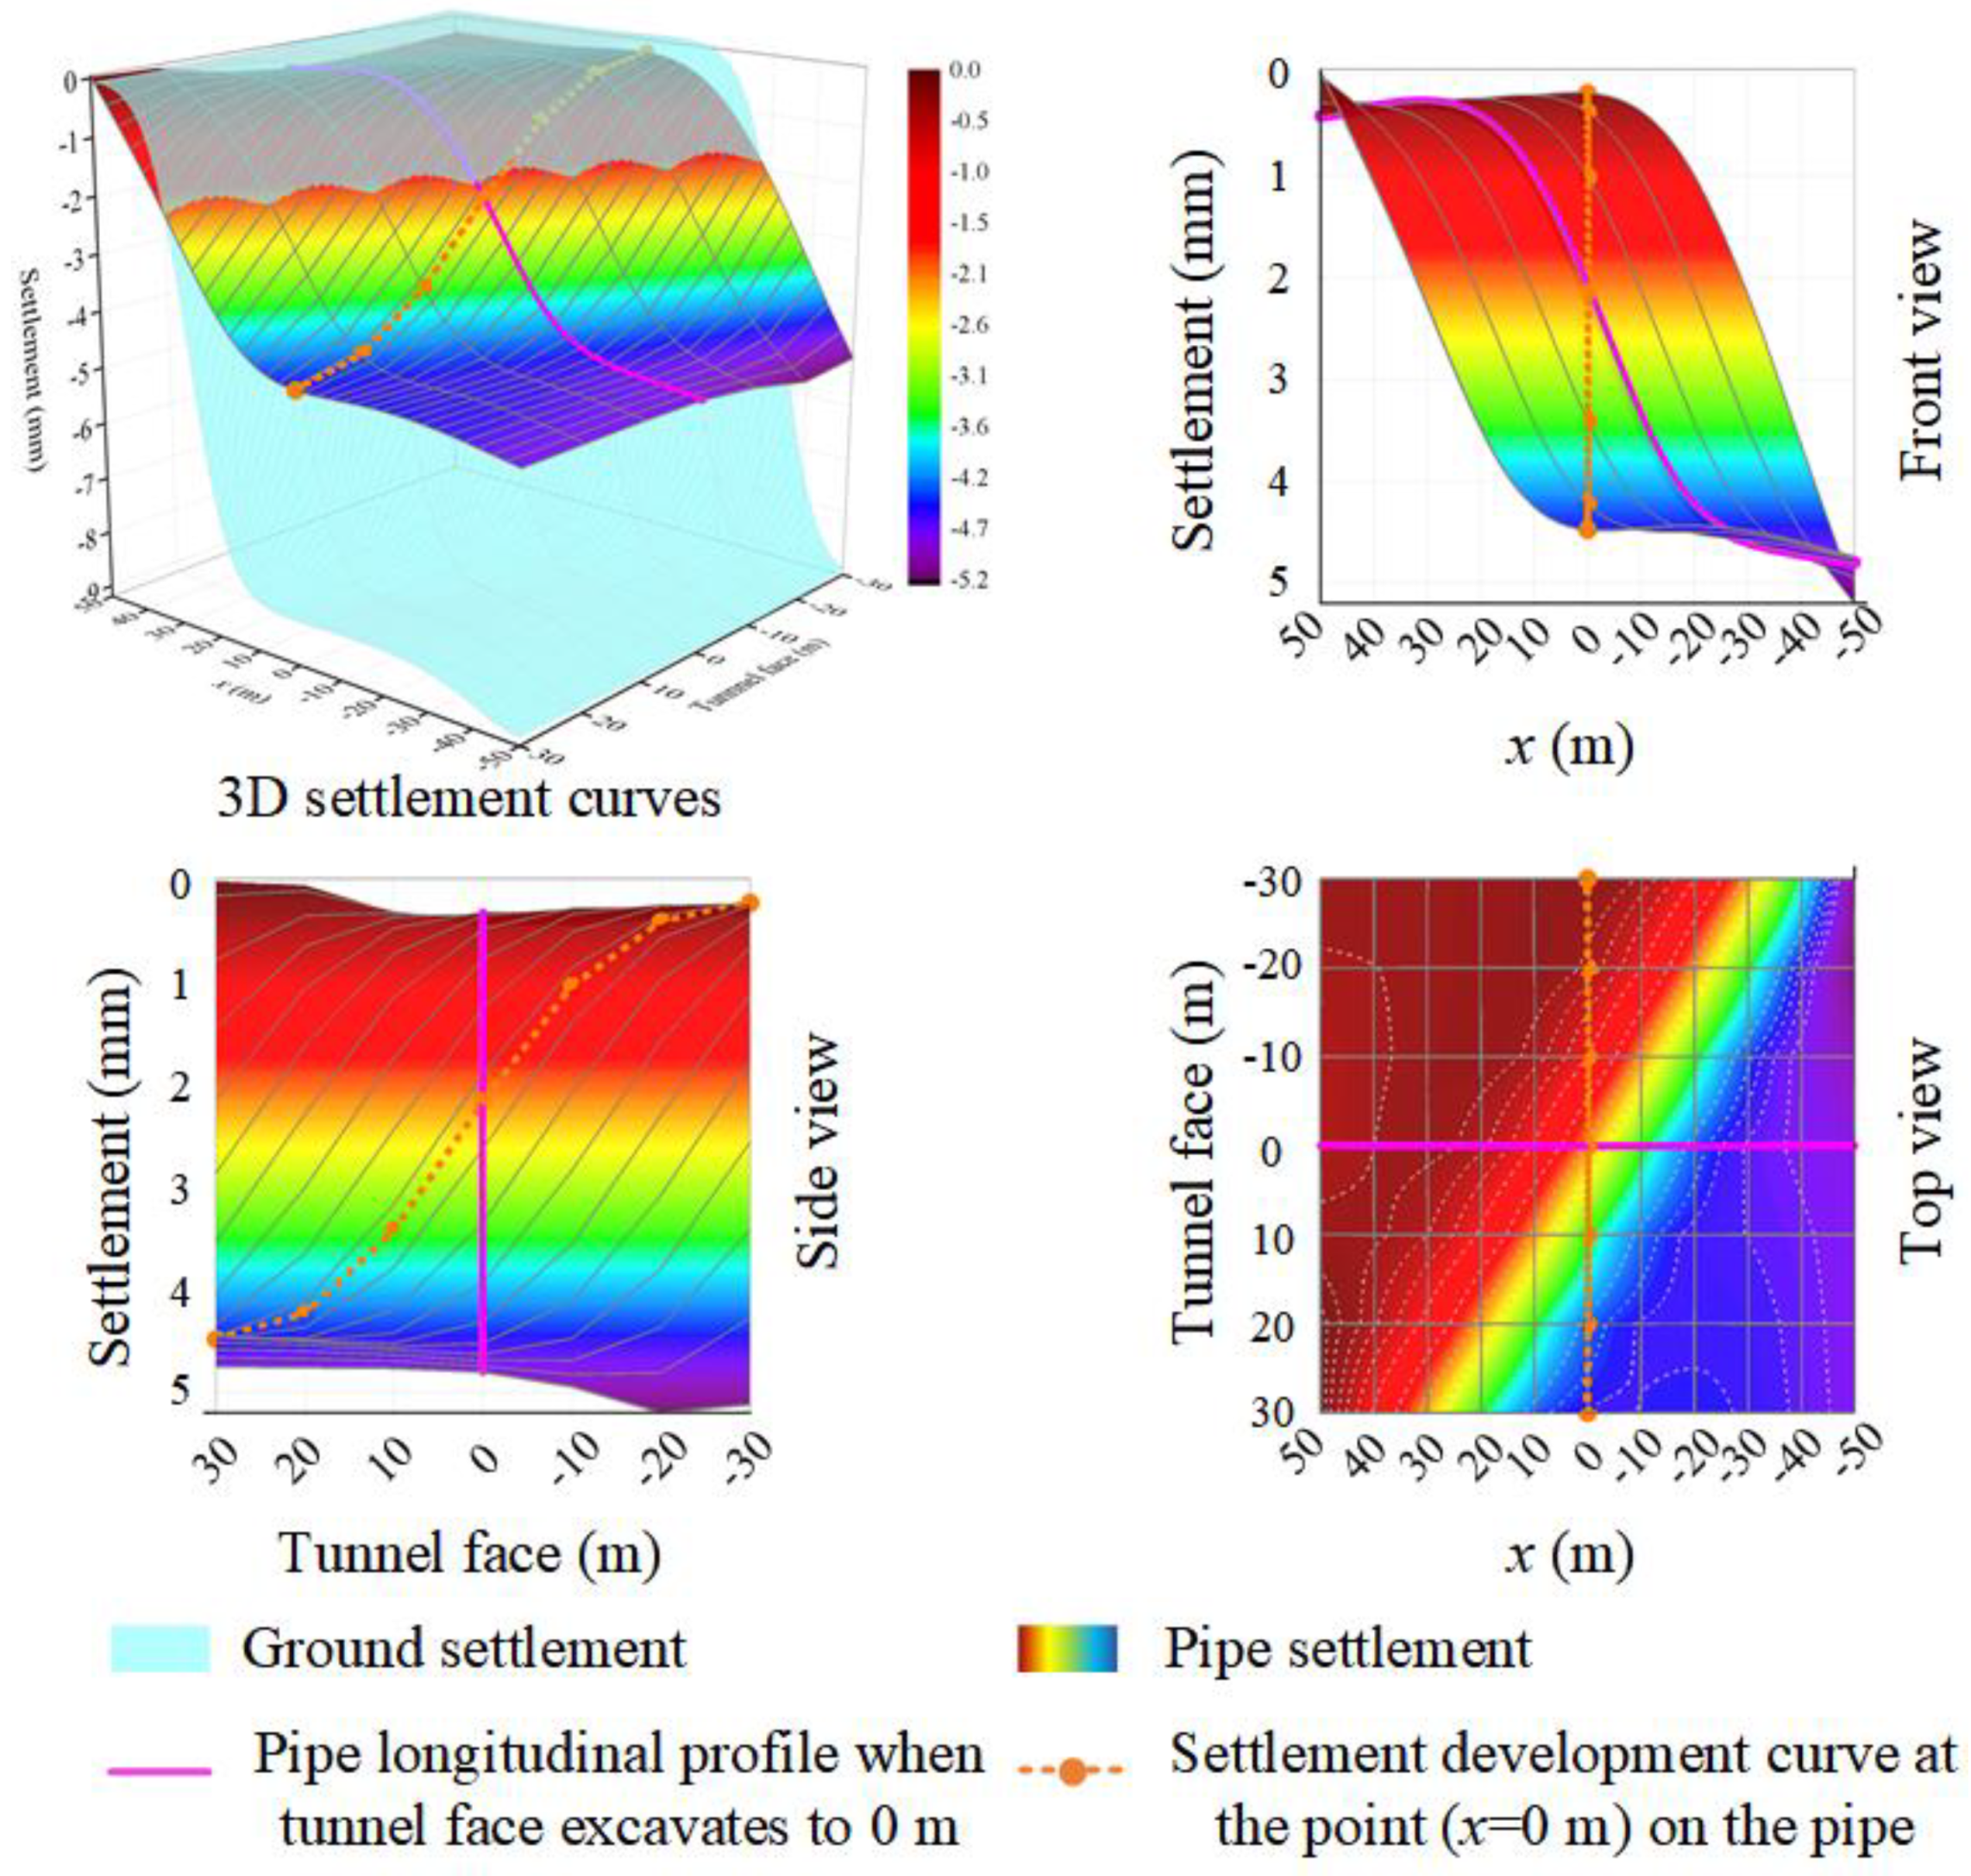
5.1. Three-Dimensional Deformation with Tunnel Construction and Grouting Processes

To study the spatiotemporal characteristics of the existing pipeline’s deformation induced by the new shield tunnel parallel excavating beneath, Figure 17 draws the three-dimensional deformation of the existing pipeline and the ground with shield tunnel advance. The X-axis is the pipeline’s length from −50 m to 50 m, and the Y-axis is the tunnel face’s location from −30 m to 30 m. During the shield tunnel excavation, assume the coefficient of subgrade reaction is k before the tunnel face and increases to 2k behind the tunnel face because the backfill grouting is carried out. The Z-axis is the resultant settlements according to the construction and grouting processes.
The front view shows the envelope of the longitudinal deformation curves (LDC) of the overall existing pipeline, which consists of several S-curves (growth curves). For instance, the solid purple line is the pipeline’s LDC when the new shield tunnel excavates to 0 m. The LDC with different shield tunnel advances is plotted in Figure 18a. As the shield tunnel constructs forward, the LDC with similar profiles moves forward as a whole. Following the published conclusions [31,48], the deformation is categorised into four stages: advance stage, rapid stage, gradual stage, and steady stage. Compared with the perpendicular undercrossing project, the maximum deformation of the existing pipeline is roughly around a specific constant with the tunnel advance. Therefore, the desired pipeline’s LDC at a certain moment of excavation can be predicted based on the measured LDC, all else being equal. When the actual monitored LDC changes significantly, the predicted LDC can be used as an early warning value to alert engineers to control deformation.
The side view shows the envelope of the deformation development curves (DDC) of all points on the pipeline. The envelope consists of several S-curves (growth curves). For instance, the orange dotted line is the DDC for the monitored point at x = 0 as the shield tunnel advances. The DDC for the different points on the existing pipeline is shown in Figure 18b. Consistent with the conclusion proposed by Liu et al. [18], the deformation changes rapidly within a certain range. The magnitude of deformation variation at each point of the existing pipeline is essentially the same for the parallel undercrossing project, whereas it is different for the perpendicular undercrossing project. Thus, the DDC of all the points on the pipeline can be easily extrapolated from the DDC of two monitored points, all other conditions being controlled.
The top view shows the existing pipeline’s settlement contours due to a new shield tunnel parallel excavating beneath. The settlement at any point and any moment during the tunnel advance can be obtained through the top view. The settlement changes significantly around the diagonal, symmetrical about the diagonal.

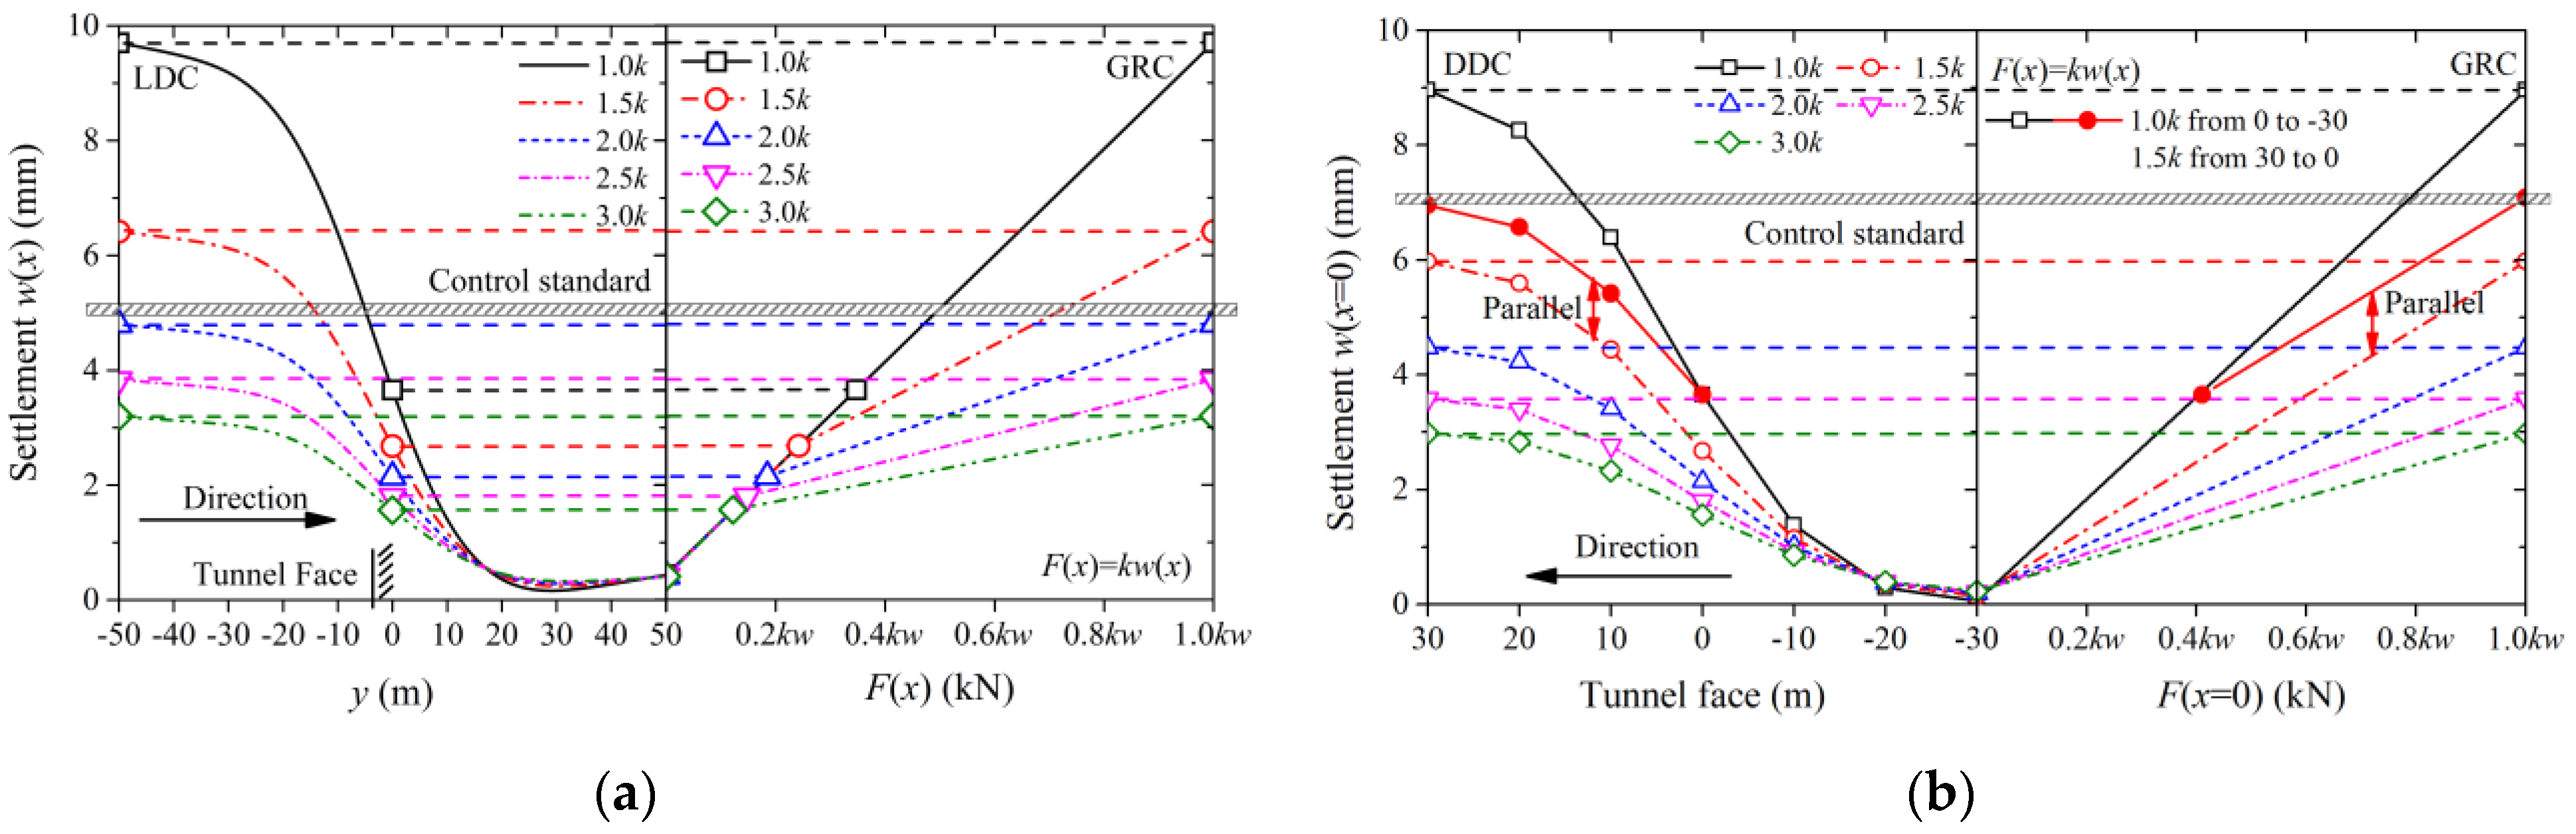
5.2. Spatiotemporal Characteristic Curves Combined with LDC, DDC, and GRC

We can implement the backfill grouting and compensation grouting during the shield tunnel excavation to reinforce the surrounding soil and control the existing pipeline’s deformation. Therefore, the study on the spatiotemporal characteristics of the existing pipeline’s deformation necessarily takes into account the effect of grouting reinforcement. To simplify this issue, we assume that the effect of grouting reinforcement is reflected in enhancing the coefficient of subgrade reaction. The coefficient of subgrade reaction before the tunnel face is set to be k. The coefficient of subgrade reaction behind the tunnel face increases to 1.5, 2, 2.5, and 3k, according to different grouting degrees. Subsequently, we provide a straight line, called the grouting reinforcement curve (GRC), to represent the linear relationship between the subgrade reaction force and the deformation based on the Winkler foundation model. Figure 19 shows the spatiotemporal characteristic curves combined with LDC, DDC, and GRC, respectively.
Figure 19a shows the different LDC obtained by different backfill grouting when shield tunnel excavates to 0 m. The overall pipeline’s deformation gradually decreases with the increase of k. After giving a certain settlement control value, we can provide a reasonable grouting measure according to the spatiotemporal characteristic curves combined with LDC and GRC. For instance, we choose the backfill grouting scheme in which the coefficient of subgrade reaction increases to 2k (blue dotted line).
Figure 19b shows the different DDC at the monitored point of x = 0 obtained by different backfill grouting. The control effectiveness of the grouting reinforcement is unobvious before the tunnel face passes the monitored point, whereas the effectiveness is remarkable after the tunnel face passes the monitored point. After giving a certain settlement control value, we can provide a reasonable grouting measure to control the deformation at a certain point according to the spatiotemporal characteristic curves combined with DDC and GRC. For instance, by connecting the control value to the origin, the minimum coefficient of subgrade reaction can be determined. Alternatively, by connecting the control value to the settlement at any moment (solid red line), the minimum coefficient of subgrade reaction, required after that moment, can be determined.

6. Conclusions

This paper proposes an analytical method to predict the deformation of the existing pipeline parallel to and above the new shield tunnel. The pipeline’s deformation is induced by different force patterns considering the shield tunnel construction process. The findings are as follows:
  • Compared with the final deformation in previous research, our analyses focus on the pipeline’s deformation during the tunnel construction and grouting reinforcement. The importance of deformation control during tunnel construction is emphasised.
  • The influences of different force patterns on the spatiotemporal deformation during the construction phase is considered in more detail. The force patterns consist of the ground volume loss, support pressure at tunnel face, frictional force on shield shell, and torsional force of cutter head.
  • The spatiotemporal deformation of the existing pipeline is studied considering the shield tunnel advance. The calculated results agree well with the monitoring data of the existing pipeline in Subway Line 3 of Nanchang. Our proposed method provides a feasible estimation of the pipeline’s deformation with the tunnel advance.
  • The pipeline’s deformation increases with the increased ground volume loss, support pressure, frictional force, and torsional force. Although most of the deformation is induced by the ground volume loss, the effects of other force patterns on the deformation should not be ignored.
  • We provide the longitudinal deformation curve (LDC), deformation development curve (DDC), and grouting reinforcement curve (GRC) to represent the spatiotemporal characteristics of the existing pipeline’s deformation. The deformation at any point and any moment during the tunnel advance can be roughly extrapolated from the monitored data of any two points.
  • The curves combined with LDC, DDC, and GRC are provided to represent the spatiotemporal characteristics. It can be applied to suggest an appropriate construction and grouting scheme during the shield tunnel construction.

Author Contributions

Conceptualisation, X.L., A.J. and Q.F.; methodology, X.L.; software, X.L.; validation, X.L., J.L. and X.G.; formal analysis, X.L.; investigation, Y.W.; resources, Y.W.; data curation, Y.W. and X.G.; writing—original draft preparation, X.L.; writing—review and editing, Q.F.; visualisation, J.L.; supervision, Q.F.; project administration, A.J.; funding acquisition, X.L. All authors have read and agreed to the published version of the manuscript.

Funding

This research was funded by Chinese National Natural Science Foundation, grant number 52108363 and 52078093, China Postdoctoral Science Foundation, grant number 2021M700654, Key Project of High-speed Rail Joint Fund of National Natural Science Foundation of China, grant number U1934210, and LiaoNing Revitalization Talents Program, grant number XLYC1905015.

Institutional Review Board Statement

Not applicable.

Informed Consent Statement

Informed consent was obtained from all subjects involved in the study.

Conflicts of Interest

The authors declare no conflict of interest.

References

  1. Standing, J.R.; Selman, R. 29 The response to tunnelling of existing tunnels at Waterloo and Westminster. In Building Response to Tunnelling: Case Studies from Construction of the Jubilee Line Extension; Thomas Telford Publishing: London, UK, 2001; pp. 509–546. [Google Scholar]
  2. Mohamad, H.; Bennett, P.; Soga, K.; Mair, R.; Bowers, K. Behaviour of an old masonry tunnel due to tunnelling-induced ground deformation. Géotechnique 2010, 60, 927–938. [Google Scholar] [CrossRef]
  3. Li, X.G.; Yuan, D.J. Response of a double-decked metro tunnel to shield driving of twin closely under-crossing tunnels. Tunn. Undergr. Space Technol. 2012, 28, 18–30. [Google Scholar] [CrossRef]
  4. Fang, Q.; Zhang, D.; Li, Q.; Wong, L.N.Y. Effects of twin tunnels construction beneath existing shield-driven twin tunnels. Tunn. Undergr. Space Technol. 2015, 45, 128–137. [Google Scholar] [CrossRef]
  5. Fang, Q.; Du, J.-M.; Li, J.-Y.; Zhang, D.-L.; Cao, L.-Q. Settlement characteristics of large-diameter shield excavation below existing subway in close vicinity. J. Cent. South Univ. 2021, 28, 882–897. [Google Scholar] [CrossRef]
  6. Marshall, A.M. Tunnelling in sand and Its Effect on Pipelines and Piles. Ph.D. Thesis, University of Cambridge, London, UK, 2009. [Google Scholar]
  7. Ng, C.W.W.; Boonyarak, T.; Masin, D. Three-dimensional centrifuge and numerical modeling of the interaction between perpendicularly crossing tunnels. Can. Geotech. J. 2013, 50, 935–946. [Google Scholar] [CrossRef]
  8. Franza, A. Tunnelling and Its Effects on Piles and Piled Structures. Ph.D. Thesis, University of Nottingham, Nottingham, UK, 2017. [Google Scholar]
  9. Do, N.A.; Dias, D.; Oreste, P.; Djeran-Maigre, I. Three-dimensional numerical simulation of a mechanised twin tunnels in soft ground. Tunn. Undergr. Space Technol. 2014, 42, 40–51. [Google Scholar] [CrossRef]
  10. Avgerinos, V.; Potts, D.M.; Standing, J.R. Numerical investigation of the effects of tunnelling on existing tunnels. Géotechnique 2017, 67, 808–822. [Google Scholar] [CrossRef]
  11. Sun, S.; Rong, C.; Wang, H.; Cui, L.; Shi, X. The ground settlement and the existing pipeline response induced by the nonsynchronous construction of a twin-tunnel. Adv. Civ. Eng. 2021, 2021, 8815304. [Google Scholar] [CrossRef]
  12. Vorster, T.E.B.; Klar, A.; Soga, K.; Mair, R.J. Estimating the effects of tunnelling on existing pipelines. J. Geotech. Geoenviron. Eng. 2005, 131, 1399–1410. [Google Scholar] [CrossRef]
  13. Klar, A.; Marshall, A. Linear elastic tunnel pipeline interaction: The existence and consequence of volume loss equality. Géotechnique 2015, 65, 788–792. [Google Scholar] [CrossRef]
  14. Marshall, A.M.; Klar, A.; Mair, R. Tunneling beneath buried pipes: View of soil strain and its effect on pipeline behavior. J. Geotech. Geoenviron. Eng. 2010, 136, 1664–1672. [Google Scholar] [CrossRef]
  15. Lin, C.; Huang, M.; Nadim, F.; Liu, Z.; Yu, J. Analytical solutions for tunnelling-induced response of two overlying pipelines. Tunn. Undergr. Space Technol. 2021, 108, 103678. [Google Scholar] [CrossRef]
  16. Huang, M.; Zhou, X.; Yu, J.; Leung, C.; Tan, J.Q.W. Estimating the effects of tunnelling on existing jointed pipelines based on Winkler model. Tunn. Undergr. Space Technol. 2019, 86, 89–99. [Google Scholar] [CrossRef]
  17. Liu, X.; Fang, Q.; Zhang, D.L. Mechanical responses of existing tunnel due to new tunnelling below without clearance. Tunn. Undergr. Space Technol. 2018, 80, 44–52. [Google Scholar] [CrossRef]
  18. Liu, X.; Fang, Q.; Zhang, D.; Wang, Z. Behaviour of existing tunnel due to new tunnel construction below. Comput. Geotech. 2019, 110, 71–81. [Google Scholar] [CrossRef]
  19. Zhang, D.-M.; Huang, Z.-K.; Li, Z.-L.; Zong, X. Analytical solution for the response of an existing tunnel to a new tunnel excavation underneath. Comput. Geotech. 2019, 108, 197–211. [Google Scholar] [CrossRef]
  20. Lin, C.; Huang, M.; Nadim, F.; Liu, Z. Tunnelling-induced response of buried pipelines and their effects on ground deformations. Tunn. Undergr. Space Technol. 2020, 96, 103193. [Google Scholar] [CrossRef]
  21. Franza, A.; Viggiani, G.M.B. Role of shear deformability on the response of tunnels and pipelines to single and twin tunnelling. J. Geotech. Geoenviron. Eng. 2021, 147, 04021145. [Google Scholar] [CrossRef]
  22. Peck, R.B. Deep excavations and tunneling in soft ground. In Proceedings of the 7th International Conference on Soil Mechanics and Foundation Engineering, State of the Art Report, Mexico City, Mexico, 25–29 August 1969; pp. 225–290. [Google Scholar]
  23. Mindlin, R.D. Force at a point in the interior of a semi-infinite solid. Physics 1936, 5, 195–202. [Google Scholar] [CrossRef]
  24. Sagaseta, C. Analysis of undrained soil deformation due to ground loss. Geotechnique 1987, 37, 301–320. [Google Scholar] [CrossRef]
  25. Verruijt, A. A complex variable solution for a deforming circular tunnel in an elastic half-plane. Int. J. Numer. Anal. Methods Geomech. 1999, 21, 77–89. [Google Scholar] [CrossRef]
  26. Zhang, Z.G.; Huang, M.S.; Zhang, M.X. Theoretical prediction of ground movements induced by tunnelling in multi-layered soils. Tunn. Undergr. Space Technol. 2011, 26, 345–355. [Google Scholar] [CrossRef]
  27. Wang, F.; Lu, H.; Gou, B.; Han, X.; Zhang, Q.; Qin, Y. Modeling of shield-ground interaction using an adaptive relevance vector machine. Appl. Math. Model. 2016, 40, 5171–5182. [Google Scholar] [CrossRef]
  28. Wang, H.N.; Zeng, G.S.; Jiang, M.J. Analytical stress and displacement around non-circular tunnels in semi-infinite ground. Appl. Math. Model. 2018, 63, 303–328. [Google Scholar] [CrossRef]
  29. Kong, F.; Lu, D.; Du, X.; Shen, C. Elastic analytical solution of shallow tunnel owing to twin tunnelling based on a unified displacement function. Appl. Math. Model. 2019, 68, 422–442. [Google Scholar] [CrossRef]
  30. Zou, J.F.; Wang, F.; Wei, A. A semi-analytical solution for shallow tunnels with radius-iterative-approach in semi-infinite space. Appl. Math. Model. 2019, 73, 285–302. [Google Scholar] [CrossRef]
  31. Fang, Q.; Wang, G.; Yu, F.; Du, J. Analytical algorithm for longitudinal deformation profile of a deep tunnel. J. Rock. Mech. Geotech. Eng. 2021, 13, 845–854. [Google Scholar] [CrossRef]
  32. Li, S.H.; Zhang, M.J.; Li, P.F. Analytical solutions to ground settlement induced by ground loss and construction loadings during curved shield tunneling. J. Zhejiang Univ.-Sci. A (Appl. Phys. Eng.) 2021, 22, 296–313. [Google Scholar] [CrossRef]
  33. Li, P.F.; Wei, Y.J.; Zhang, M.J.; Huang, Q.F.; Wang, F. Influence of non-associated flow rule on passive face instability for shallow shield tunnels. Tunn. Undergr. Space Technol. 2022, 119, 104202. [Google Scholar] [CrossRef]
  34. Jin, D.L.; Shen, X.; Yuan, D.J. Theoretical analysis of three-dimensional ground displacements induced by shield tunnelling. Appl. Math. Model. 2020, 79, 85–105. [Google Scholar] [CrossRef]
  35. Loganathan, N.; Poulos, H.G. Analytical prediction for tunnelling-induced ground movements in clays. J. Geotech. Geoenviron. Eng. 1998, 124, 846–856. [Google Scholar] [CrossRef]
  36. Rowe, R.K.; Lo, K.Y.; Kack, G.J. A method of estimating surface settlement above tunnels constructed in. Can. Geotech. J. 1983, 20, 11–22. [Google Scholar] [CrossRef]
  37. Han, Y.W.; Liang, J.H.; Yuan, X.H. Deformation model of backfill grouting and ground movement analysis of shield tunnel. Chin. J. Geotech. Eng. 2007, 26, 3646–3652. (In Chinese) [Google Scholar]
  38. Lee, K.; Rowe, R.K.; Lo, K. Subsidence owing to tunnelling. 1. Estimating the gap parameter. Can. Geotech. J. 1992, 29, 929–940. [Google Scholar] [CrossRef]
  39. Winkler, E. Die Lehre von der Elastizitat and Feistigkeit; H. Dominicus: Prague, Czech Republic, 1867. [Google Scholar]
  40. Pasternak, P.L. On a New Method of Analysis of an Elastic Foundation by Means of Two Foundation Constants; Gosudatstvennoe Lzdatelgtro Liberaturi po Stroiterlstvui Arkhitekture: Moscow, Russia, 1954. (In Russian) [Google Scholar]
  41. Biot, M.A. Bending of an infinite beam on an elastic foundation. Zeitschrift fiir Angewandte Maihematik und Mechanik 1922, 2, 165–184. [Google Scholar] [CrossRef]
  42. Vesic, A.S. Bending of beams resting on isotropic elastic solid. J. Soil Mech. Found. Eng. ASCE 1961, 87, 35–53. [Google Scholar] [CrossRef]
  43. Attewell, P.B.; Yeates, J.; Selby, A.R. Soil Movement Induced by Tunnelling and Their Effects on Pipelines and Structures; Blackie and Son Ltd.: London, UK, 1986. [Google Scholar]
  44. Klar, A.; Vorster, T.E.B.; Soga, K.; Mair, R.J. Soil-pipe interaction due to tunnelling: Comparison between Winkler and elastic continuum solutions. Géotechnique 2005, 55, 461–466. [Google Scholar] [CrossRef]
  45. Yu, J.; Zhang, C.R.; Huang, M.S. Soil–pipe interaction due to tunnelling: Assessment of Winkler modulus for underground pipelines. Comput. Geotech. 2013, 50, 17–28. [Google Scholar] [CrossRef]
  46. Tanahashi, H. Formulas for an infinitely long bernoulli-euler beam on the Pasternak model. J. Jpn. Geotech. Soc. Soils Found 2004, 44, 109–118. [Google Scholar] [CrossRef] [Green Version]
  47. Xu, L. Study on the Longitudinal Settlement of Shield Tunnel in Soft Soil; Tongji University: Shanghai, China, 2005. (In Chinese) [Google Scholar]
  48. Liu, X. Mechanical Behaviours of Existing Tunnels Due to New Tunnel Construction Below. Ph.D. Thesis, Beijing Jiaotong University, Beijing, China, 2020. [Google Scholar]
Figure 1. Flow chart of this paper.
Applsci 12 00500 g001
Figure 2. Interaction between shield tunnel, soil, and existing pipeline.
Applsci 12 00500 g002
Figure 3. A vertical load or horizontal load in the interior of an elastic half-space.
Applsci 12 00500 g003
Figure 4. Free-field ground movements induced by different force patterns: (a) support pressure at tunnel face; (b) frictional force of shield shell; (c) torsional force of cutter head.
Applsci 12 00500 g004
Figure 5. A plan view of Nanchang Subway.
Applsci 12 00500 g005
Figure 6. A partial plan view of Jing Jiashan-Shi Zijie section of Nanchang Subway Line 3.
Applsci 12 00500 g006
Figure 7. Monitoring section I-I.
Applsci 12 00500 g007
Figure 8. Ground deformations induced by different forces: (a) Displacement induced by ground volume loss; (b) displacement induced by support pressure; (c) displacement induced by frictional force; (d) displacement induced by torsional force.
Applsci 12 00500 g008
Figure 9. Longitudinal profiles of ground surface deformation during shield tunnelling: (a) surface deformation during tunnelling; (b) analytical results and monitoring data.
Applsci 12 00500 g009
Figure 10. Longitudinal profiles of pipeline deformation during shield tunnelling: (a) ground deformation at pipeline’s elevation; (b) analytical results and monitoring data.
Applsci 12 00500 g010
Figure 11. Comparisons of analytical results and monitoring data with shield tunnel advancing.
Applsci 12 00500 g011
Figure 12. Longitudinal profiles of pipeline’s deformation with different ground volume losses.
Applsci 12 00500 g012
Figure 13. Longitudinal profiles of pipeline’s deformation with different support pressures.
Applsci 12 00500 g013
Figure 14. Longitudinal profiles of pipeline’s deformation with different frictional forces.
Applsci 12 00500 g014
Figure 15. Longitudinal profiles of pipeline’s deformation with different torsional forces.
Applsci 12 00500 g015
Figure 16. Longitudinal profiles of pipeline’s deformation with different equivalent bending stiffness.
Applsci 12 00500 g016
Figure 17. Three-dimensional deformation with shield tunnel construction and grouting processes.
Applsci 12 00500 g017
Figure 18. Existing pipeline’s deformation contours extracted from front view and side view: (a) Longitudinal Deformation Curve (LDC) extracted from front view; (b) deformation development curve (DDC) extracted from side view.
Applsci 12 00500 g018
Figure 19. Spatiotemporal characteristic curves between LDC, DDC, and GRC: (a) spatiotemporal characteristic curve between LDC and GRC; (b) spatiotemporal characteristic curve between DDC and GRC.
Applsci 12 00500 g019
Table 1. Input parameters.
zg (m)zp (m)H (m)R (m)Vl (%)S (m)μEs (MPa)EI (GPam3)ΔP (kPa)T (kNm)
0.04.015.63.01.59.00.320.0200.010.02500
Note: zg and zp are the depths of the ground surface and the pipeline, respectively; S is the length of the shield shell; ΔP is the differential value of support pressure; T is the torsional force of the cutter head.
Publisher’s Note: MDPI stays neutral with regard to jurisdictional claims in published maps and institutional affiliations.

