1. Introduction
Machine Learning (ML) is one of the methods used in the field of Artificial Intelligence (AI). In recent years, the computational complexity of widely used algorithms has been growing exponentially [
1]. This is caused by the combination of increasingly fast processor speeds, and the presence of Big Data and progressively powerful graphics processing units. On one hand, allocating more resources enables training and using state-of-the-art models capable of achieving results similar to humans, or even surpassing them. However, on the other hand, training and using such models requires increasingly advanced hardware and enormous amounts of electricity [
1,
2]. This poses a handful of problems, and one of them is the carbon footprint of an AI-focused industry, which is not negligible [
1]. The popularization of cloud computing is not helping either, as it additionally strains the network infrastructure. One of the solutions to these problems is TinyML—a combination of ML and embedded Internet of Things (IoT) devices. This approach evades possible concerns caused by cloud solutions, such as a potential lack of privacy, introduction of latency, additional network strain, as well as non-negligible power consumption [
3].
The latency happens because of the nature of cloud computing; a typical process consists of gathering the data, sending it to the server, waiting for a response, and acting accordingly. This is heavily dependent on network speed and load. In case of slow and/or loaded network infrastructures, the device will be less responsive and less reliable than the TinyML one that does all the computations by itself [
3]. Another factor connected to that topic is the network strain—an inherent part of cloud-computing—as the data acquired by the sensors need to be sent to a server, and the response from that server also needs to be sent back to the device, and this can generate unnecessary network traffic that could be avoided by using the TinyML approach.
Power consumption is also important, as factor-data transmission requires more energy than locally computing the results, even if the microcontroller is at the maximum workload level for a significant amount of time [
3,
4]. As the WeMOS D1 Mini board based on the ESP8266EX Wi-Fi chip requires 185 mA during operation [
5], this is current consumption that is an order of magnitude higher than any TinyML-capable microcontroller, for example, STM32F411 [
6].
The system reliability is also important—transmitting the data over the unpredictable, lossy wireless channels from the device to the cloud poses a handful of problems, including privacy breach/data loss, data compromise, as well as malicious data modification [
3]. The TinyML approach is free from these problems, as its working principles are very different from cloud computing—the data are kept within the device and the communication is reduced to minimum, effectively mitigating the stated problems.
TinyML provides a way to counter the mentioned problems. The proposed approach makes it possible to create cheap, widely available, energy-efficient sensor devices with long battery-operated lifespan [
3]. To the best of our knowledge, there exists no research papers nor any device consisting of such a tiny microcontroller used in this paper that is capable of carrying out the task of analyzing whether the face mask is being worn properly.
The motivation of our work is associated with the COVID-19 pandemic. As it has been proven that wearing a face mask can help limit the spread of the virus [
7,
8,
9,
10,
11,
12], the face mask became mandatory in many public places, especially indoor ones, for example, in shops, cinemas and theaters. For the face masks to be effective, they have to be worn correctly; covering both the nose and the chin. Despite dissemination of these facts, there still exists a group of people that wear face masks incorrectly. Due to the fact that the security guards can only handle a limited area of the frequently visited objects, we propose the usage of TinyML intelligent sensors. With the aim of mounting them on the shelves in shops or near the cinema cash register queues, the battery operation capability is a must. This enforces the power efficiency of such devices in order to prolong the battery life to a reasonable extent. The other important factor is the device cost, as cheaper devices will result in higher accessibility.
The main hypothesis of our research presented in this paper is formulated as follows: it is possible to create a cheap TinyML system with a long uptime that can classify the masked face with satisfactory quality. The key challenge in our research is the fact that candidate hardware platforms are limited by the cost and power consumption, as they are also inherently resource-limited—a small, power-efficient microcontroler will not have much memory nor computational power. To answer the main question, a hardware platform must be chosen and an effective classifier must be developed in order to conduct the research and check if the resulting TinyML system meets the quality requirements. The main contribution of this paper is the enablement of a severely resource-constrained microcontroller to perform complex computer vision tasks, as well as training, testing and implementing the model for the used algorithm that will fit in the Flash and RAM memory of the chosen microcontroller and will work within a reasonable time and with reasonable accuracy. The image preprocessing methods enhancing the system accuracy are also worth mentioning.
This paper is organized as follows. In
Section 2, we discuss the related works, emphasizing the discovered TinyML niche in the computer vision field. In
Section 3, we describe the used algorithms and datasets, and also propose the image preprocessing steps that gave the best observed results. We propose the method of data extraction that made the classification possible. As the TinyML is meant to run on a microcontroller, we evaluate the chosen platform candidates and pick the most suitable one. We discuss the limitations linked to the chosen platform and TinyML overall and describe the method the problem was solved with, as well as the applied improvements. We measure the time required in order to perform the complete face detection and classification and calculate the required energy and estimated battery life. In
Section 4, we present and discuss the results, including the accuracy of the trained models and the overall system accuracy. The last section concludes this work.
2. Related Works
TinyML is an edge computing crossover between the IoT devices and the ML. This approach refines the low power aspect of the IoT devices and combines it with the algorithms capable of performing complex tasks, for example decision-making, prediction or classification. There are numerous established TinyML use cases [
4], including: audio wake words, context recognition, control words, keyword detection, visual wake words, object detection, image classification, gesture recognition, object counting, text recognition, segmentation, forecasting, activity detection, sensing environmental factors (e.g., light or temperature), anomaly detection, motor control or predictive maintenance. Use cases similar to this paper are in the image classification group—we will discuss them in this section. One of the examples can be seen in the Ref. [
13], where TinyML helps achieve better results in autonomous driving. Another example comes from the Ref. [
14], where a person detector is built.
There are also other works that are linked with the topic of this paper. The problem of face detection is solved in the Ref. [
15]. The researchers use a state-of-the-art object detection system called You Only Look Once (YOLO) v3 [
16], capable of real-time object detection. In the mentioned paper, researchers used a seventh-generation Intel i7 Central Processing Unit (CPU) in combination with GTX 1080 Graphics Processing Unit (GPU) and 7.7 GB of RAM memory, achieving the results in less than 30 ms. The other work solving the problem of face detection is the Ref. [
17]. The researchers proposed a method based on Faster Region-based Convolutional Neural Networks (R-CNN) [
18] that is capable of providing the results in 130 ms using Intel Xeon E5 8-core processor with GTX TITAN-X GPU. The authors of the Ref. [
19] solved the problem of face mask detection. The researchers applied YOLOv2 [
20] combined with ResNet-50 [
21] to create the detector. As the YOLOv2 uses a custom network based on Googlenet [
22], it needs 8.52 billion floating-point operations for a forward pass [
20]. Another way of solving the problem of face mask detection is presented in the Ref. [
23]. This paper evaluates the approach based on ResNet [
21] and MobileNet [
24] respectively. The ResNet requires billions of floating-point operations for a forward pass [
21], while MobileNet requires hundreds of millions of floating-point operations [
24] for a forward pass.
There are very few recent works covering the topic of embedded systems used for face mask detection, for example, the Refs. [
25,
26,
27]. The authors used powerful processors in order to achieve impressive results. Our paper focuses on energy efficiency, taking the energy-efficient battery-operated device concept into consideration, which requires the usage of less powerful platforms. The chosen microcontroller is also cheaper than the ones proposed by the researchers, bringing the device cost down and making it more accessible in the process. Platform cost comparison is shown in
Table 1. In the mentioned papers [
25,
26,
27], the researchers focus on the binary classification problem: whether the person wears a face mask or not. Our paper focuses on the classification of the correctly masked face and incorrectly masked face. It should be underlined that, taking the existing ML and TinyML studies and devices into account, to the best of our knowledge, there are no TinyML research papers nor devices with resources comparable to the used STM32F411 microcontroller that were used to implement complex computer vision tasks. After discovering this field research gap, we propose a power-efficient TinyML system that can be used to verify whether the face mask is worn properly using strictly limited resources.
Considering these approaches, despite splendid results, none of them can be transferred into the TinyML domain. This is due to the processing power and memory constraints, as well as immense energy consumption that is not acceptable on battery-operated devices.
3. Materials and Methods
This section presents the methods used in the proposed concept system, as well as the data used to train the classifier models. There are numerous ML classifiers, each with its own benefits and drawbacks. For the task of classification of the masked face, a K-means algorithm was chosen because it is computationally lightweight and requires a relatively small amount of Flash memory for the model in comparison with Neural Networks (NN), which are a popular method in image recognition tasks. The RAM requirement is also remarkably small, as the only calculated intermediate values are the distances between the classified object and the centroids compared to the activation values of every neuron in the network.
For the task of detecting a face, a sliding window technique combined with a K-means classifier was chosen, due to the fact that this approach is lightweight enough to fit into the memory of the microcontroller unlike most of the sophisticated models, executes reasonably fast, and can be further tuned in order to achieve either better results or higher speed.
3.1. K-Means
The K-means algorithm is a method capable of automatically clustering similar data examples together using a training set
, where
[
2,
28]. The algorithm is an iterative procedure that starts by randomly initializing the centroids, and then proceeds to loop consisting of two parts. The first part is the example-centroid assignment procedure, which means that every example gets assigned to the closest centroid using a certain distance metric. The second part is recomputing the centroids, which is done by calculating the mean value of all examples assigned to currently evaluated centroid and shifting the centroid to the computed mean value. This procedure is applied to every centroid, which ends the last step of the loop [
2,
28]. The algorithm can be represented by the pseudocode shown on the
Listing 1.
Listing 1.
K-means algorithm.
Listing 1.
K-means algorithm.
| centroids = initialize_random(); |
| for (int i = 0; i < iterations; i++) |
| { |
| example_assignments = assign_closest_centroid(); |
| centroids = compute_means(); |
| } |
The K-means algorithm will always converge to a certain set of centroid values, but the solution may not be ideal, because it depends on the initial centroid values. Therefore, the K-means algorithm should be run multiple times with different random initializations. After running the algorithm several times, the best centroid set can be chosen from the results [
2,
29]. The typical K-means algorithm implementation uses Euclidean distance as the distance metric in the example-centroid assignment procedure.
The K-means algorithm was chosen for its overall lightness as it requires small amounts of both energy and memory to execute. The drawbacks of the algorithm were mitigated by careful design and testing of the preprocessing filters. Other methods that were considered have not been used due to the computational complexity and memory constraints. Notable methods other than the used K-means with
computational complexity are Support Vector Machines (SVM) with a computational complexity of
, and Neural Networks with a computational complexity of
. The algorithm we chose supported by carefully designed filters gave the best tradeoff between complexity (both computational complexity and memory complexity) and the given results. This is very important due to the strict TinyML limitations regarding the power consumption and available device resources. This approach gave us satisfactory results, and the other methods can be evaluated in future work. For more details, please refer to
Section 3.2.2 and
Section 3.3.
3.2. Data
3.2.1. Datasets
An image is considered a two-dimensional array of values in range . The following datasets were used in this work:
The MaskedFace-Net [
30,
31] dataset was used to train and test the K-means classifier that is capable of detection if the face mask is worn correctly or incorrectly. This dataset consists of 137,013 images (as of 5 November 2020) that is based on the Flickr-Faces-HQ (FFHQ) dataset, that was originally created as a benchmark for the generative adversarial networks (GAN) [
33]. The dataset consists of two subsets:
Correctly Masked Face Dataset (CMFD)-67192 images,
Incorrectly Masked Face Dataset (IMFD)-69821 images.
The Incorrectly Masked Face Dataset contains three subclasses:
Face masks worn only on chin, leaving the mouth and nose uncovered—6243 images;
Face masks covering both chin and mouth, leaving the nose uncovered—57,224 images;
Face masks covering both nose and mouth, leaving chin uncovered—6354 images.
The images are of high-quality, with a size of 1024 × 1024 px. They also incorporate a large enough variation regarding age, ethnicity, and background, and also introduce glasses and headgear.
The Natural images [
32] dataset was used to train and test K-means classifiers supported by the sliding window technique that is capable of face detection. This dataset consists of 6899 images composed of eight subsets:
airplane,
car,
cat,
dog,
flower,
fruit,
motorbike,
person.
The images of people are of good quality, with a size of 256 × 256 px. The images incorporate similar variation as the MaskedFace-Net [
30,
31] dataset. In this paper, the other classes are treated as one non-person class.
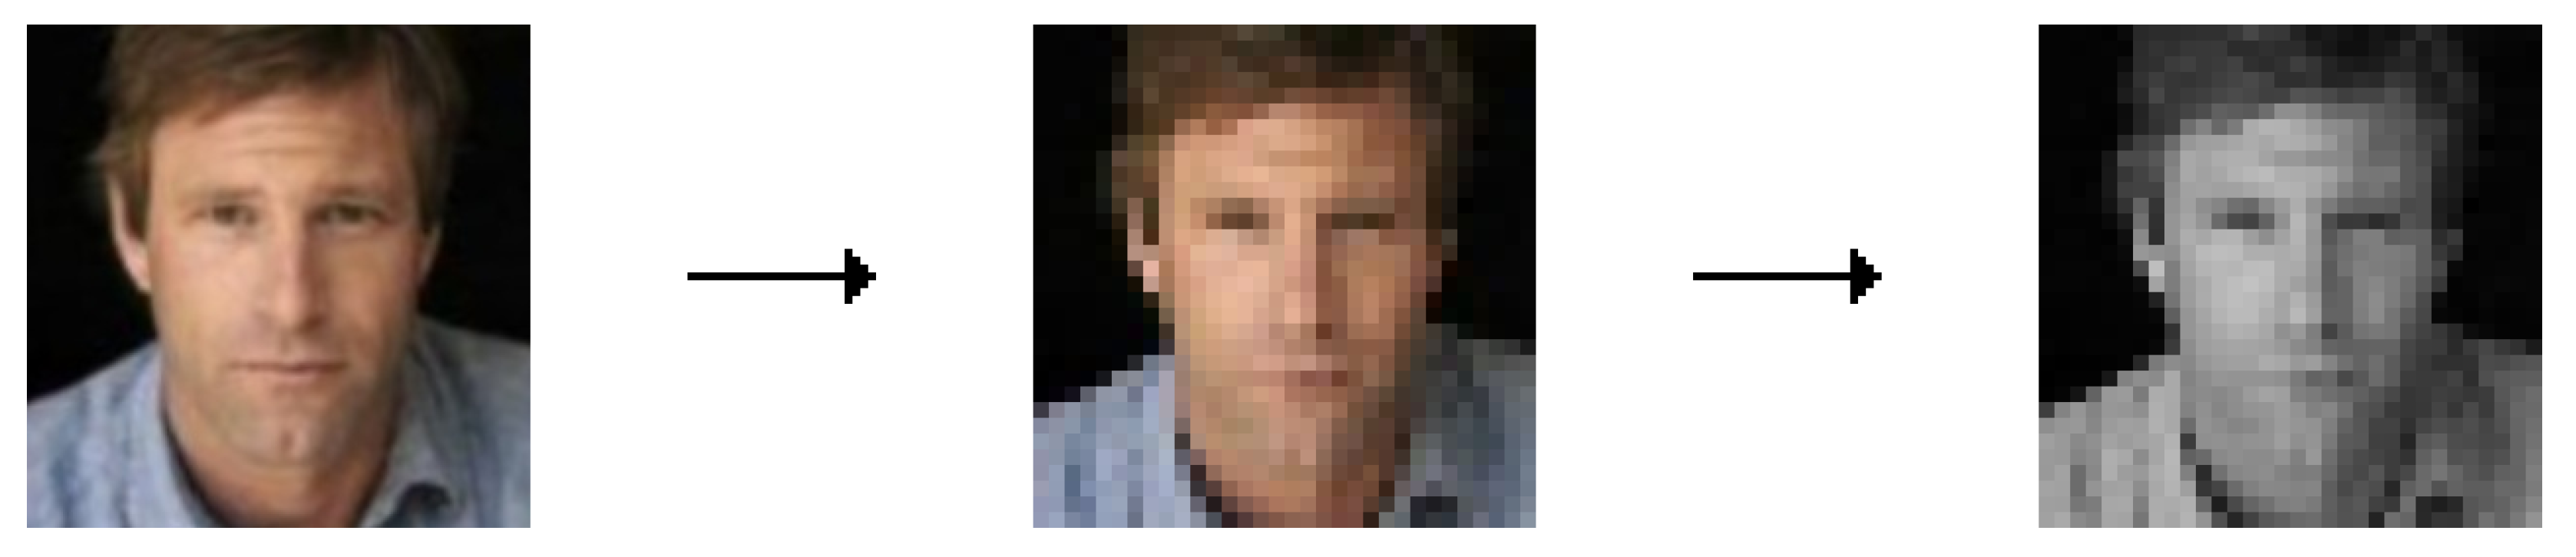
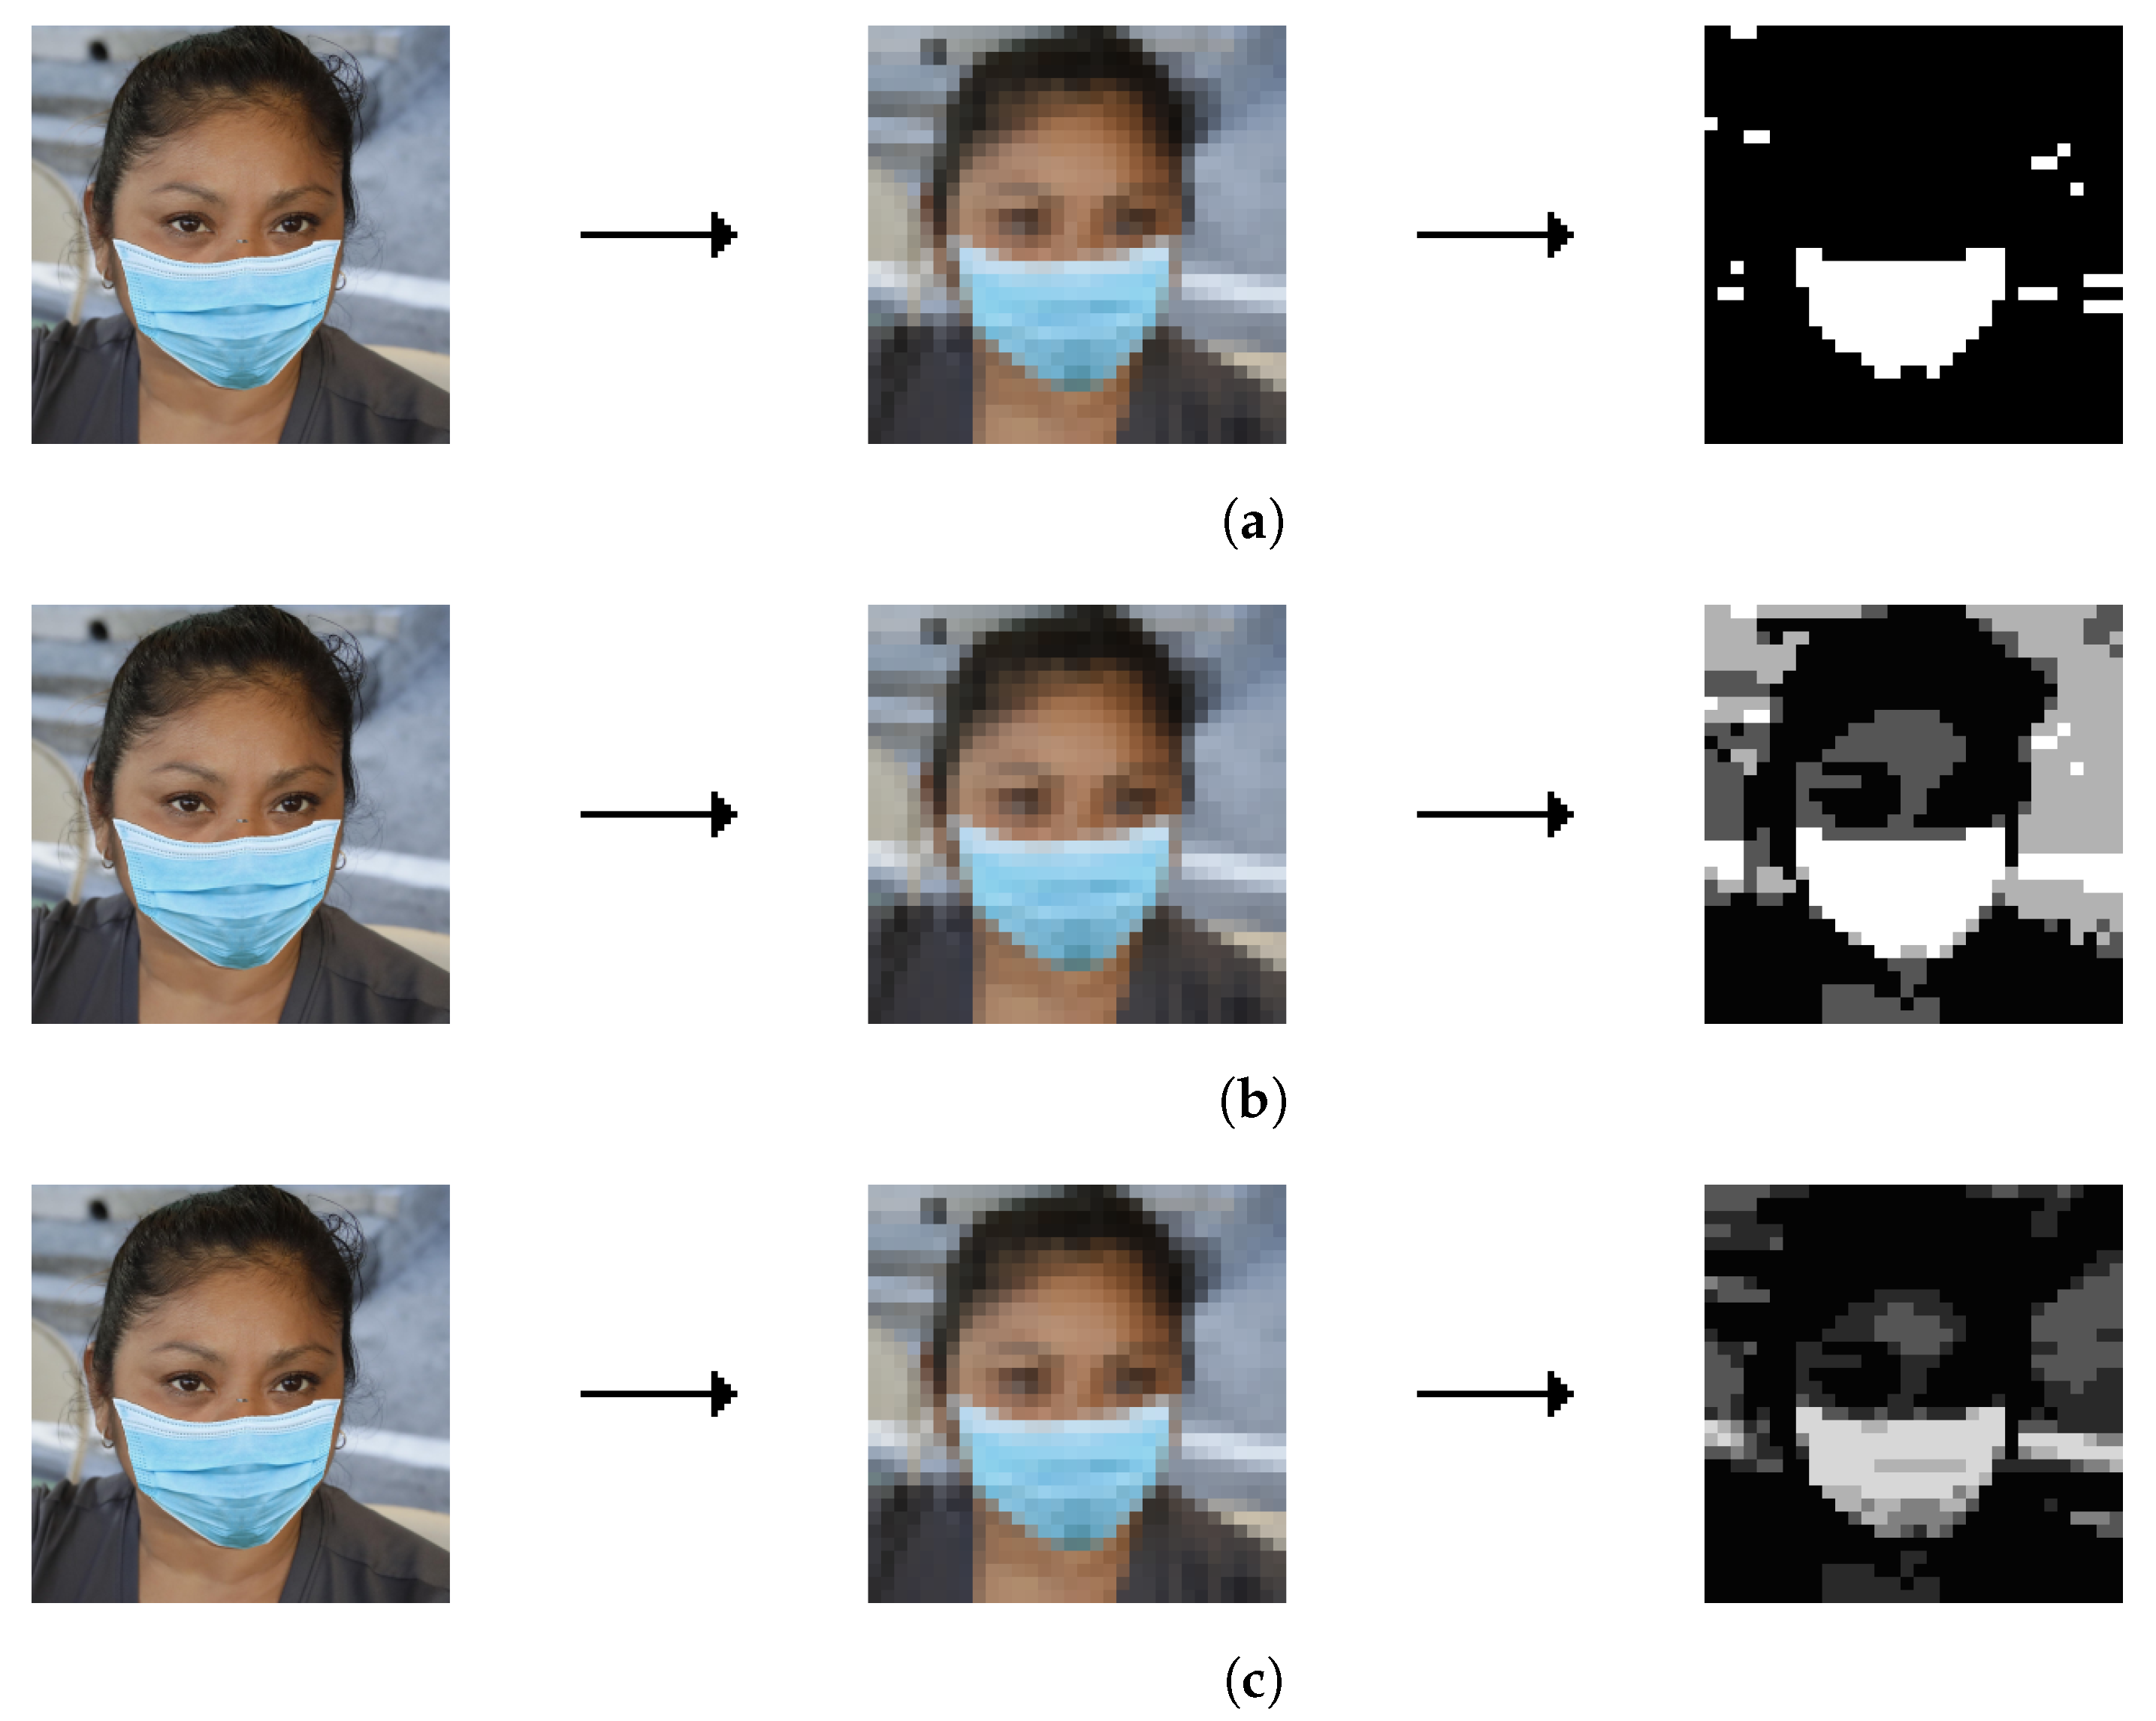
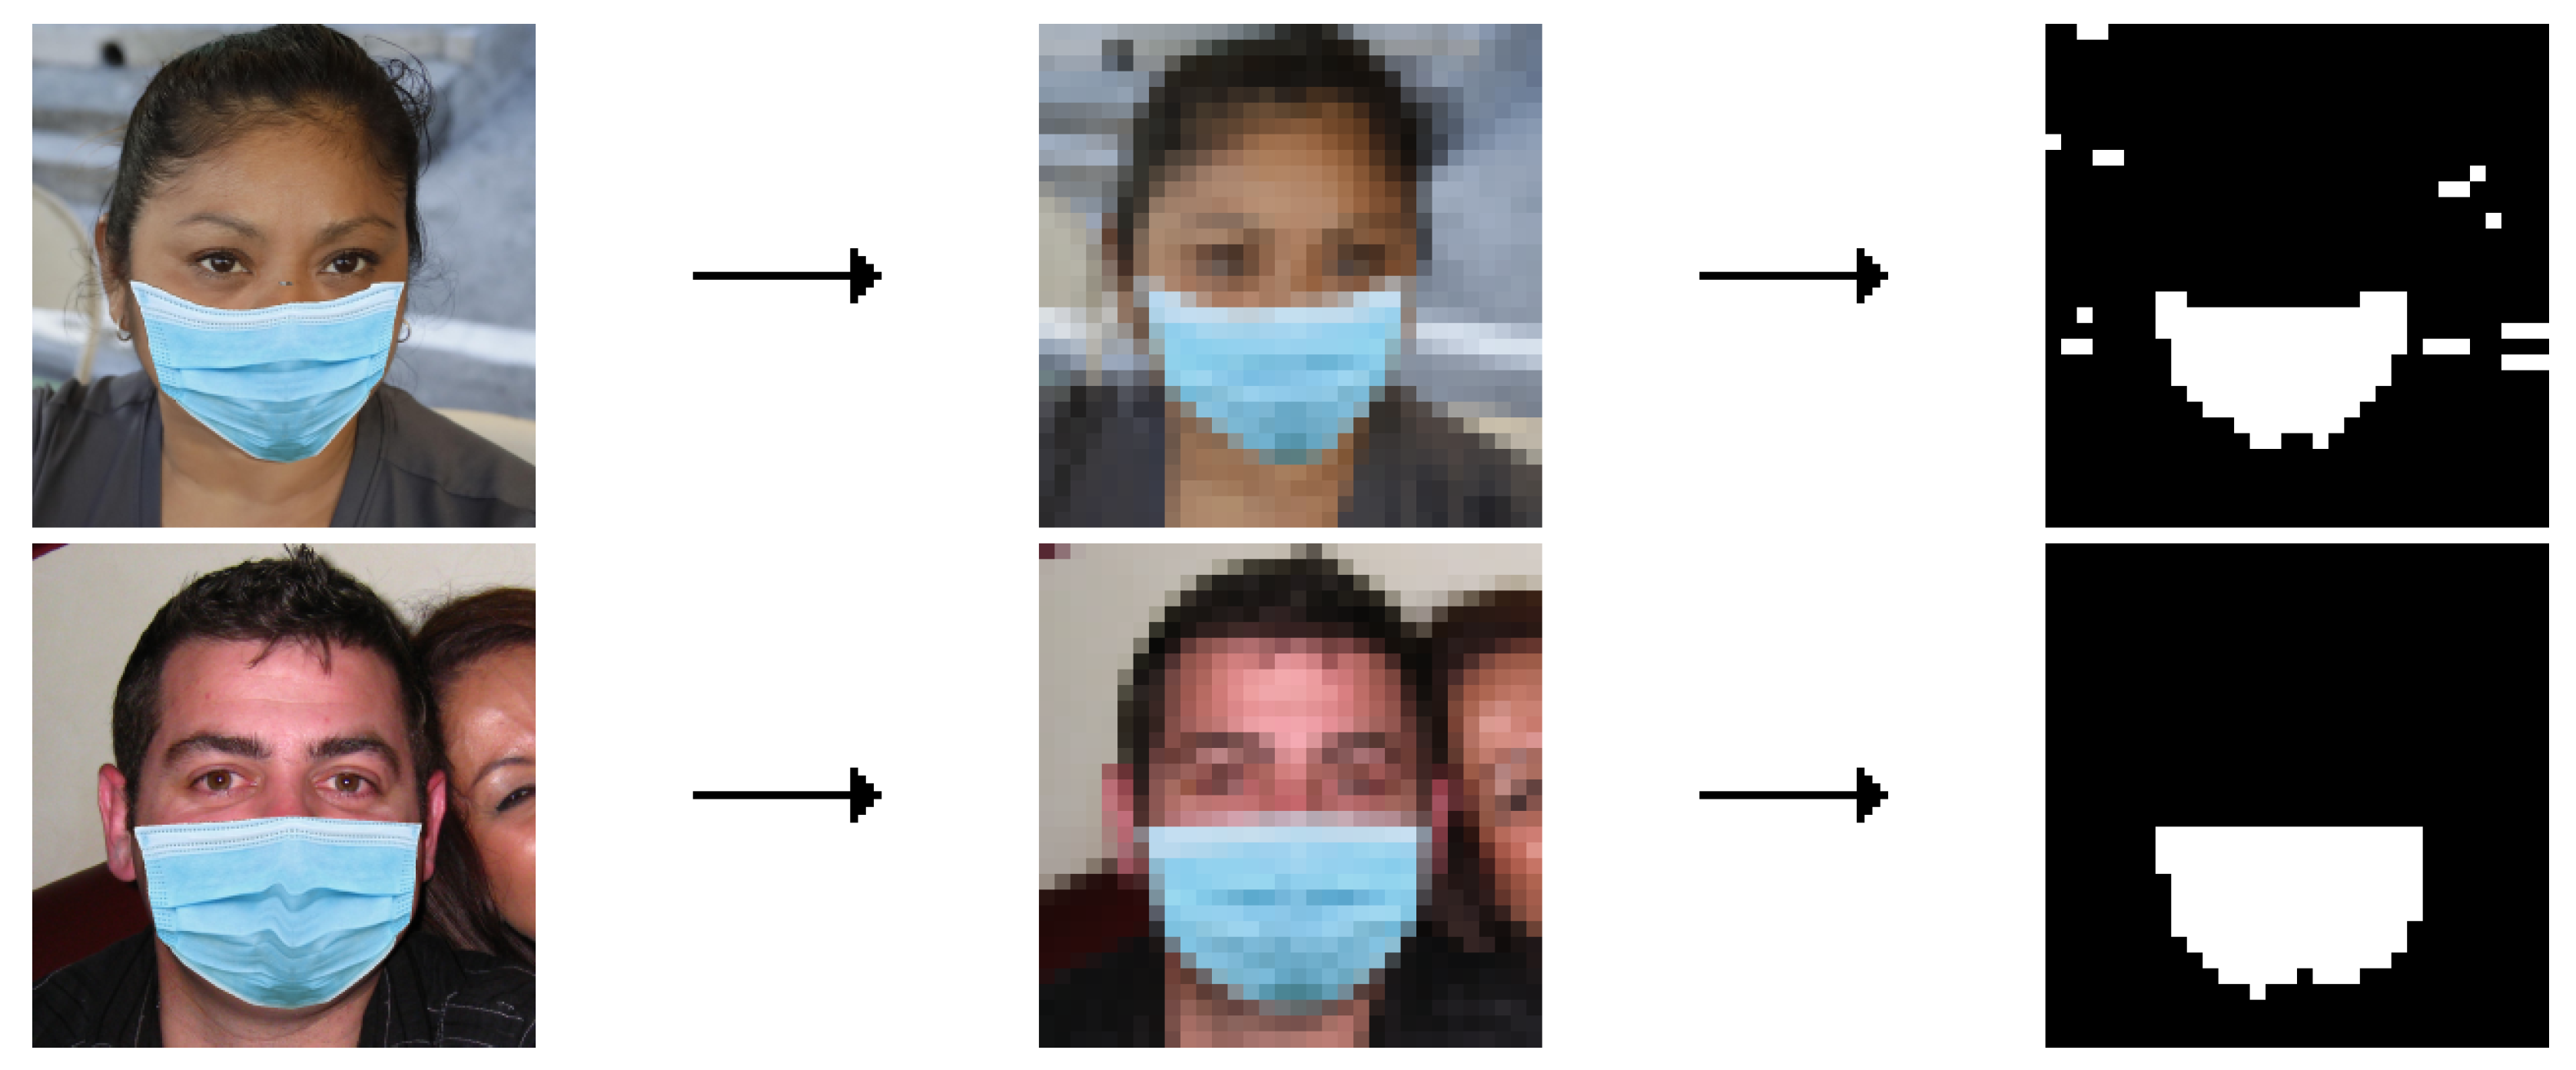
3.2.2. Data Preprocessing
Data for the algorithm consist of preprocessed images from the datasets. The first step is filtering, which is shown on the
Listing 2 for the MaskedFace-Net [
30,
31] dataset and on the
Listing 3 for the Natural images [
32] dataset. The examples are shown in the
Figure 1 and
Figure 2. The downscaling size of 32 × 32 px was chosen as it was the smallest size that did not impact accuracy.
Listing 2.
Filtering of the MaskedFace-Net [
30,
31] dataset.
Listing 2.
Filtering of the MaskedFace-Net [
30,
31] dataset.
Downscaling the image containing a face to 32 × 32 px Calculating the intermediate color value using the procedure: value = max(R, G, B) As most of the face masks are cyan, the intermediate color value is changed according to the procedure: if (B > G && G > R && R < 200) value += 50 else value = 0 if (value > 255) value = 255 Applying the threshold filter to the intermediate values with the boundary value of 240 with the procedure: if (value < 240) value = 0 else value = 255
|
Listing 3.
Filtering of the Natural images [
32] dataset.
Listing 3.
Filtering of the Natural images [
32] dataset.
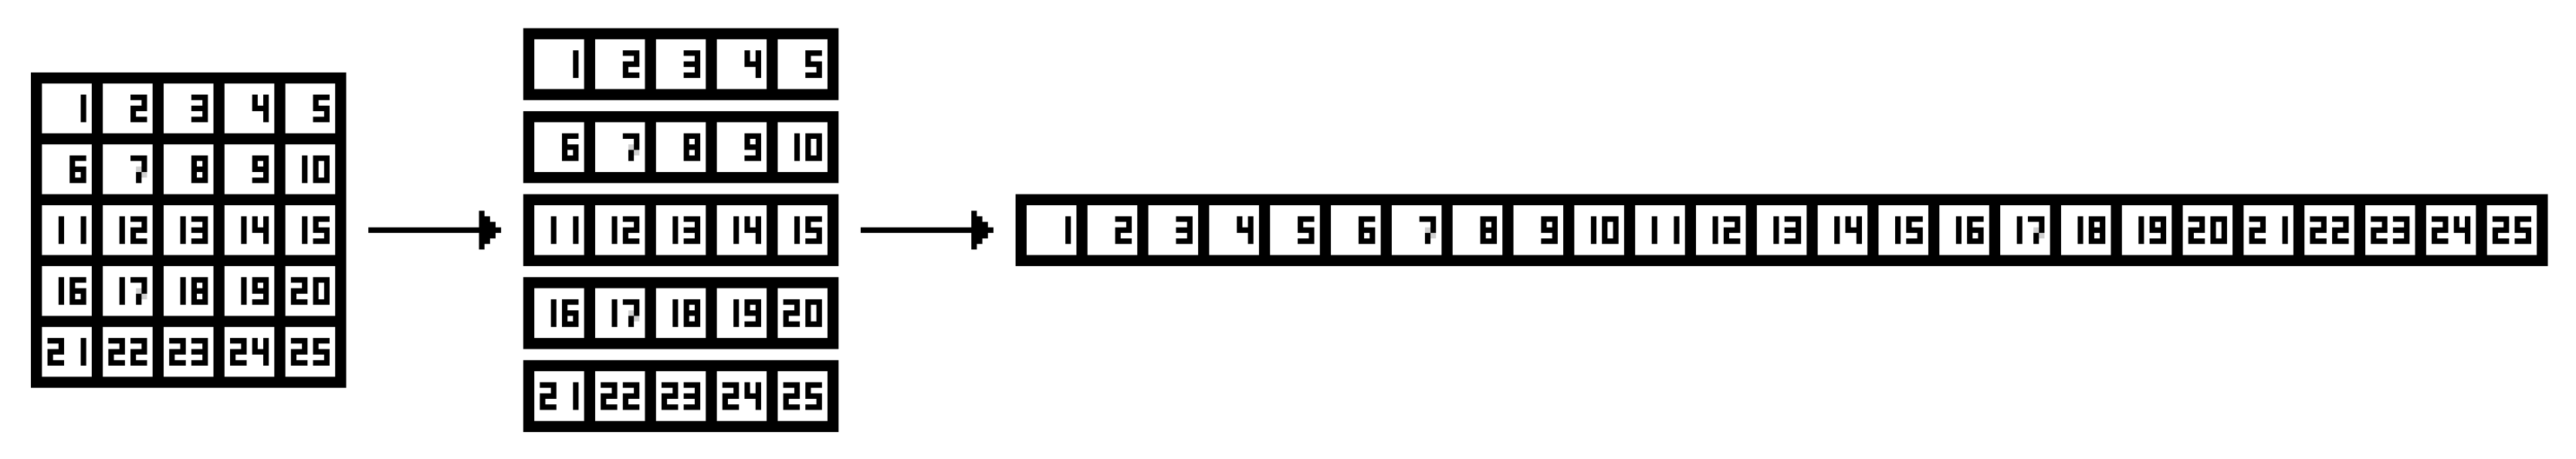
Due to the fact that the data for the K-means algorithm is meant to be a normalized one-dimensional array, as ML algorithms typically work better on normalized data [
2], the next step is feature normalization—every pixel of the image becomes a floating point value in range
stored in a two-dimensional array. The resulting array is then unfolded to a one-dimensional array using the procedure shown on the
Listing 4. An example is shown in
Figure 3.
Listing 4.
Unfolding procedure.
Listing 4.
Unfolding procedure.
3.3. Data Extraction
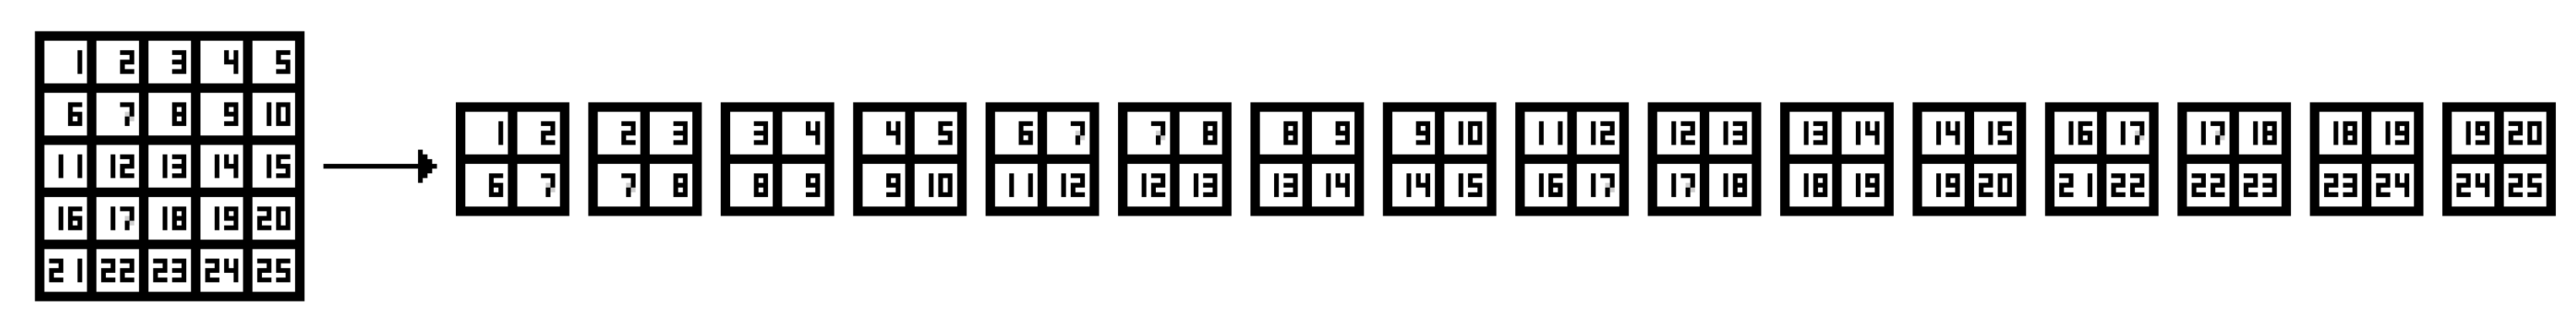
3.3.1. Sliding Window
The sliding window is a technique allowing for an easy detection of objects in computer vision ML tasks [
34] that can run on platforms with limited resources. The window is a rectangle that moves horizontally and vertically through the image [
2]. An example of the sliding window output is shown in
Figure 4.
In order to find the desired object, each fragment of the image limited by the window is passed as an input to the classifier. To enable detection of objects of different sizes, scaling is mandatory [
2].
3.3.2. Face Detection
As the system was designed to work with a 640 × 480 px camera, there are many possible face sizes that can be present on the image. The detection is achieved by applying the sliding window technique supported by the K-means classifier with one of the window parameters shown in the
Table 2. The best result, which is a rectangle with the highest probability of containing a face, is passed as the output of the detector.
3.4. TinyML Platform
3.4.1. Picking the Platform
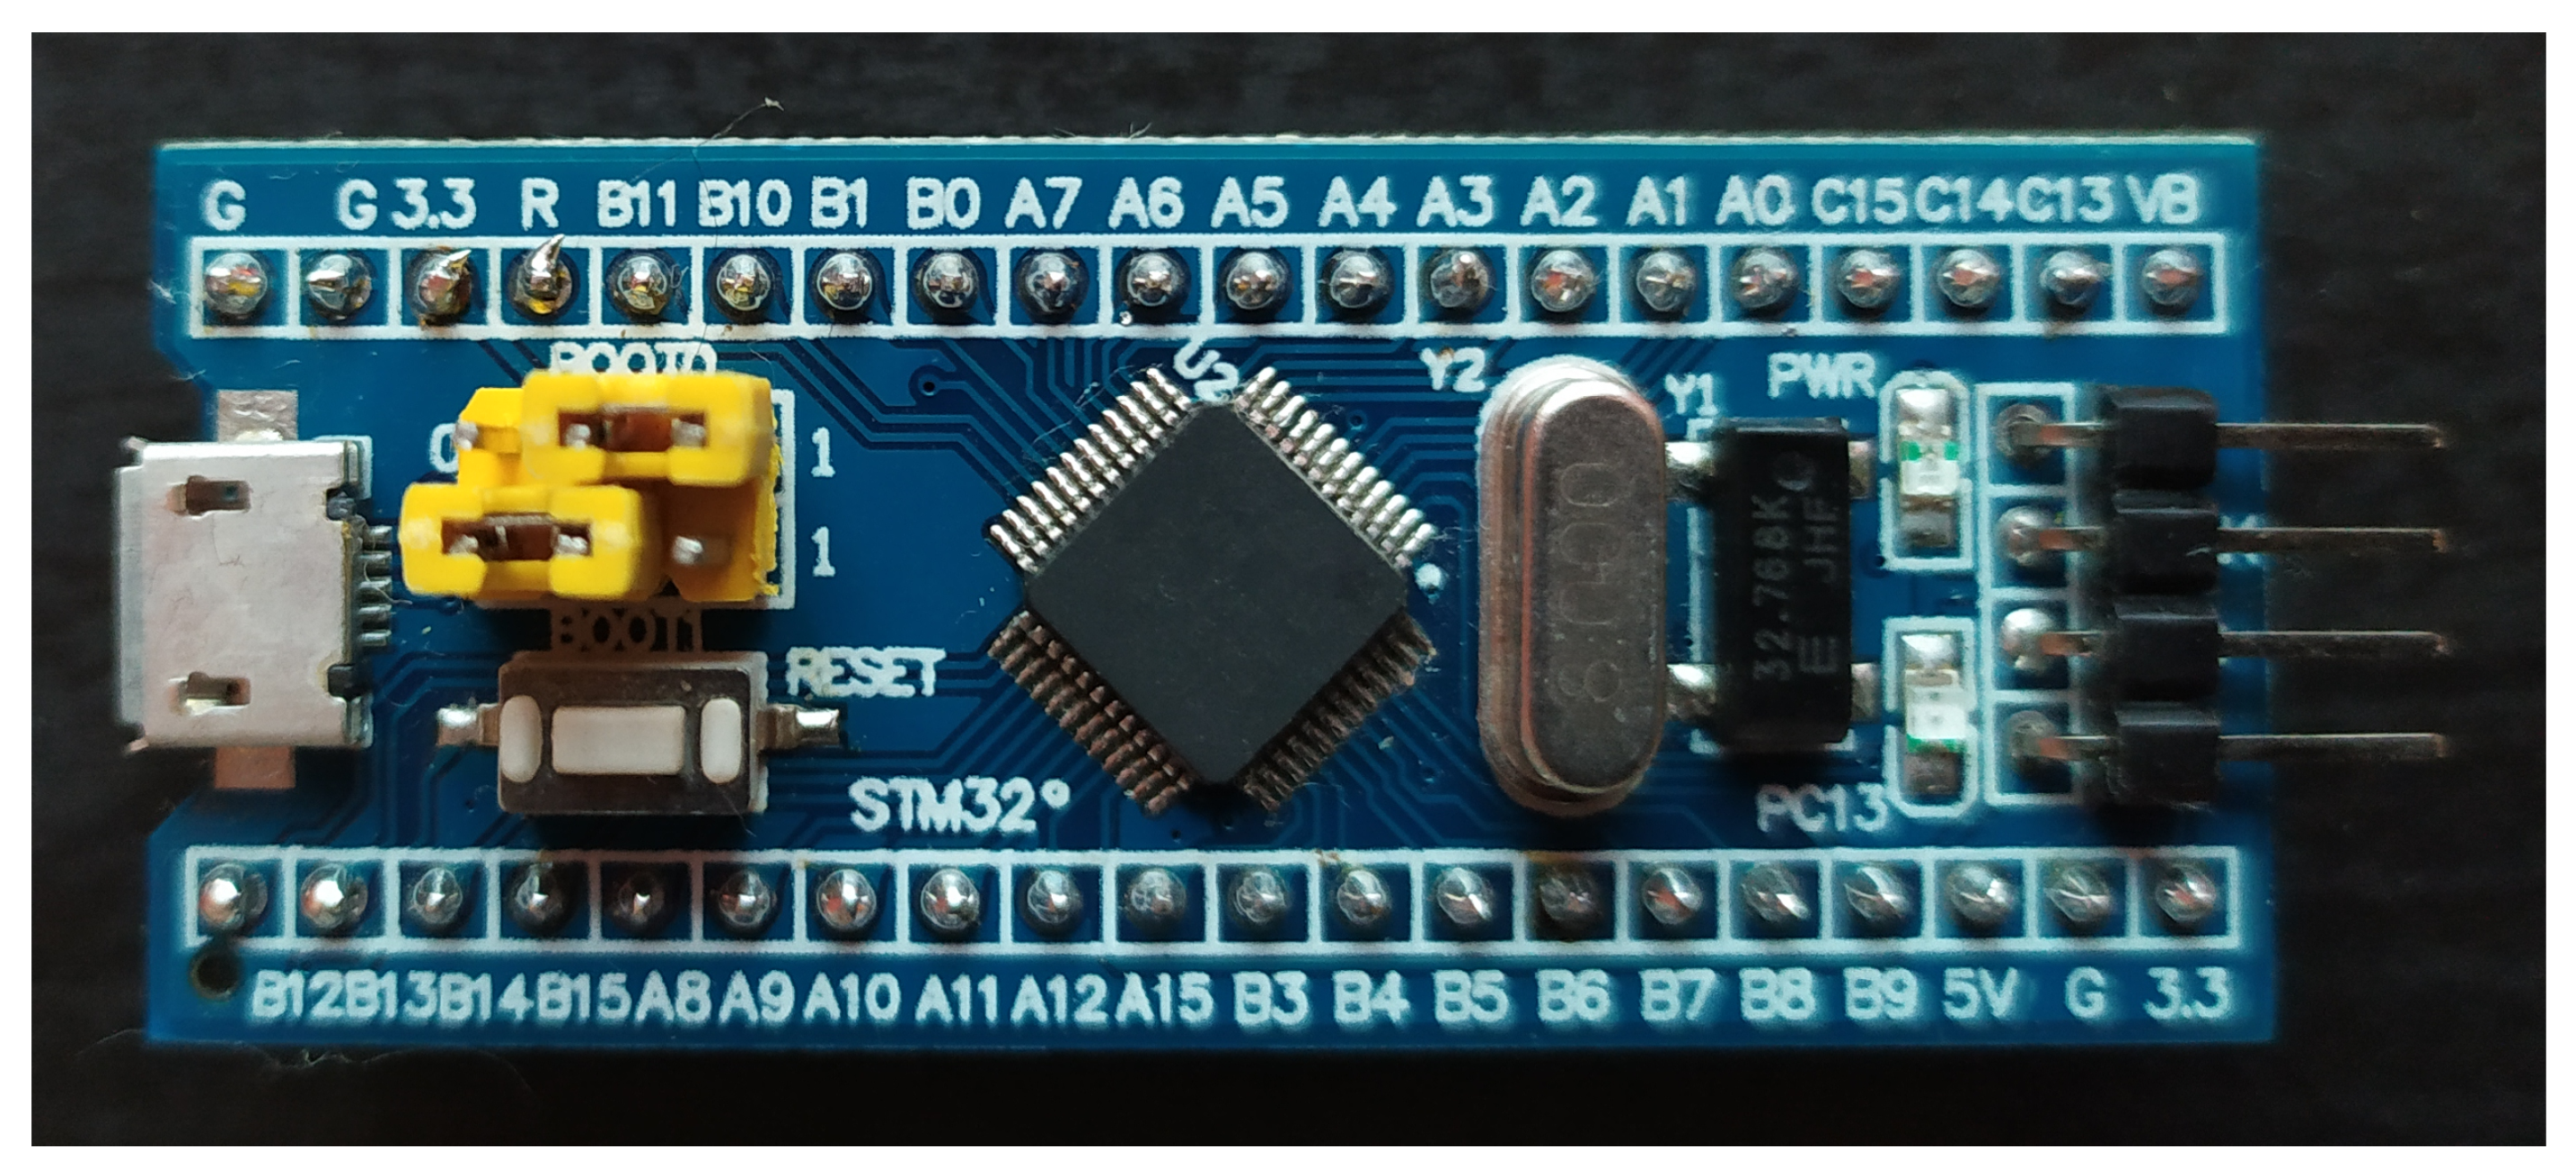
An important factor impacting the whole system design is the choice of the TinyML platform. Among the major features required for consideration are price, accessibility, speed, power consumption and memory size. Three candidates were examined in order to choose the best-fitting TinyML platform:
STM32F103CB, representing the STM32 F1xx family,
STM32F411CE, representing the STM32 F4xx family,
STM32H743VI, representing the STM32 H7xx family.
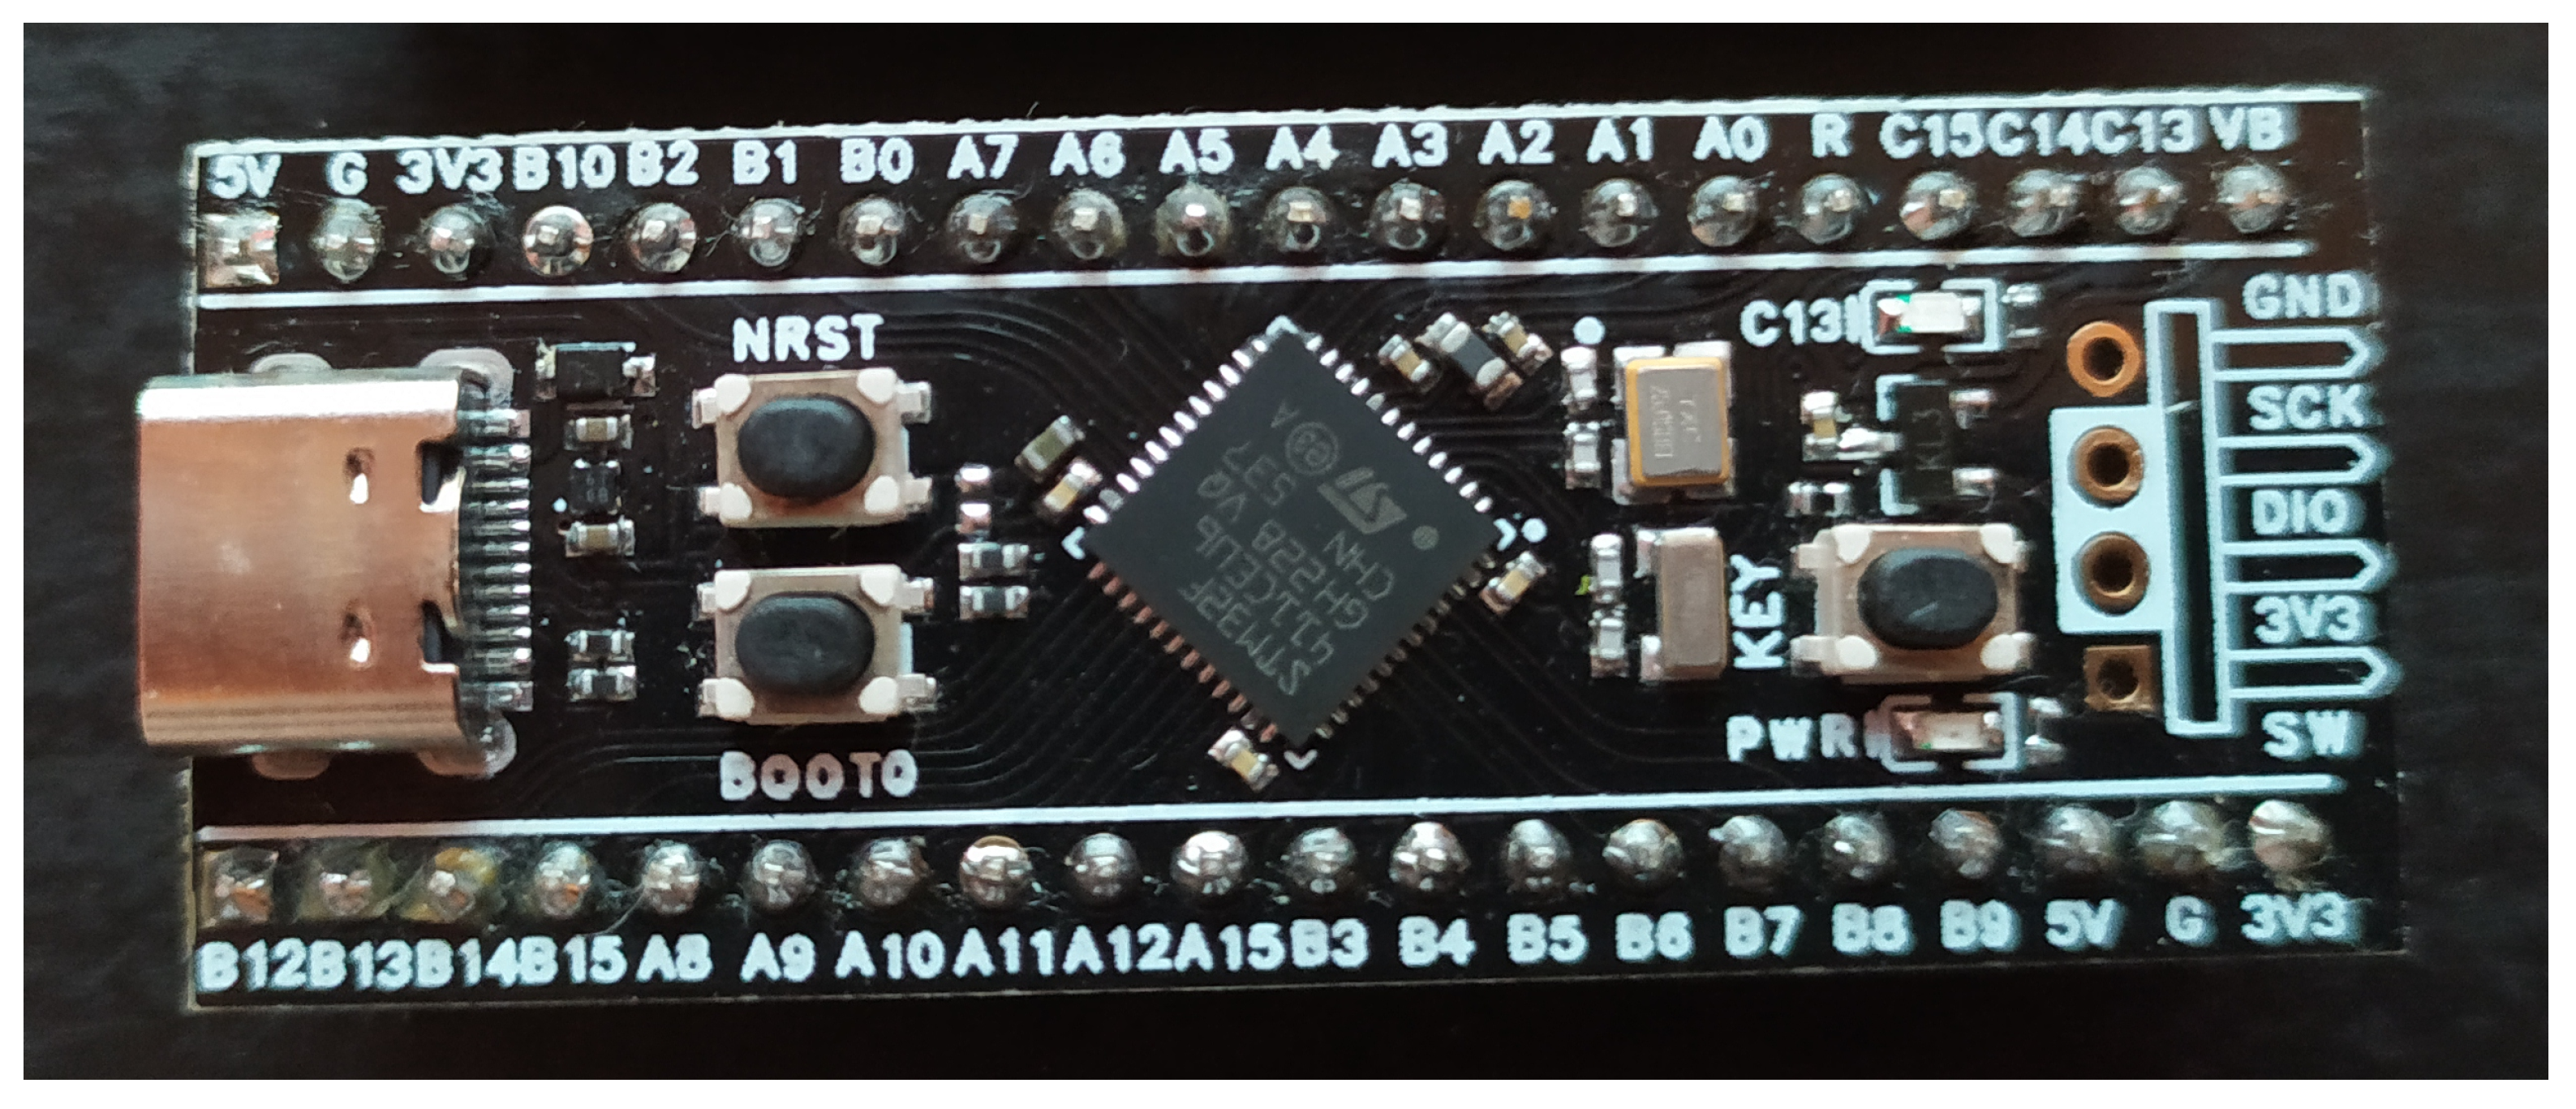
First two microcontrollers are widely available in the form of small evaluation boards, popular among tinkerers, called Bluepill for STM32F103 and Blackpill for STM32F411. The boards are shown in
Figure 5 and
Figure 6. The third microcontroller is not as popular as the two previous ones, due to the lack of availability of small form-factor boards incorporating the STM32H743 chip, although it can be found in expensive, full-sized development boards.
As seen in the
Table 3, the microcontrollers vastly differ from each other. The STM32F103 chip is the cheapest, but it also incorporates the worst power-consumption-to-speed ratio of 0.44 mA/MHz, compared to 0.1 mA/MHz for STM32F411 and 0.275 mA/MHz for STM32H743. It is also the only candidating microcontroller without FPU and with only 20 KB of RAM, what renders the chip unsuitable for this task.
The STM32H743 chip is the most expensive, being over double the STM32F103 price. It contains more than enough memory and is also the fastest of the candidating microcontrollers, containing the ARM Cortex M7 core capable of reaching a speed of 480 MHz. However, in terms of TinyML, it is not suitable due to a worse power-consumption-to-speed ratio than STM32F411, and not being as widely available as the STM32F103 and STM32F411 chips.
3.4.2. Chosen Platform
Considering all the factors, the STM32F411 chip was chosen as the best suitable microcontroller for this task. It is relatively cheap, widely available as a Blackpill evaluation board, and fast enough for computational tasks due to the fast ARM Cortex M4 core, while being the most energy-efficient option out of all candidates. It also contains sufficient onboard memory to have a big enough DMA-driven buffer connected to the external RAM, resulting in no impact on the computation time due to the fact that all needed data can be present in the internal RAM on demand.
3.4.3. Limitations
TinyML is a great approach for creating energy-efficient battery-operated intelligent sensors. Despite many advantages, it also comes with significant drawbacks. There are many ML state-of-the-art algorithms and models, but they require an immense amount of resources which are not present on any typical microcontroller. One of the limiting factors is the amount of memory for both Flash and RAM [
4]. The STM32F411 chip has 512 KB of Flash memory, in which the code and trained models must fit. This makes the usage of the high-precision complex models impossible. Even if this was possible, usage of such models would be impractical, as intricate models would need a tremendous amount of time to calculate the result.
As the STM32F411 microcontroller has 128 KB of RAM, the presence of an external memory chip is required, due to the fact that the image of size 640 × 480 px encoded in the RGB565 format requires 600 KB of storage.
3.5. Masked Face Classification
3.5.1. Solving the Masked Face Problem
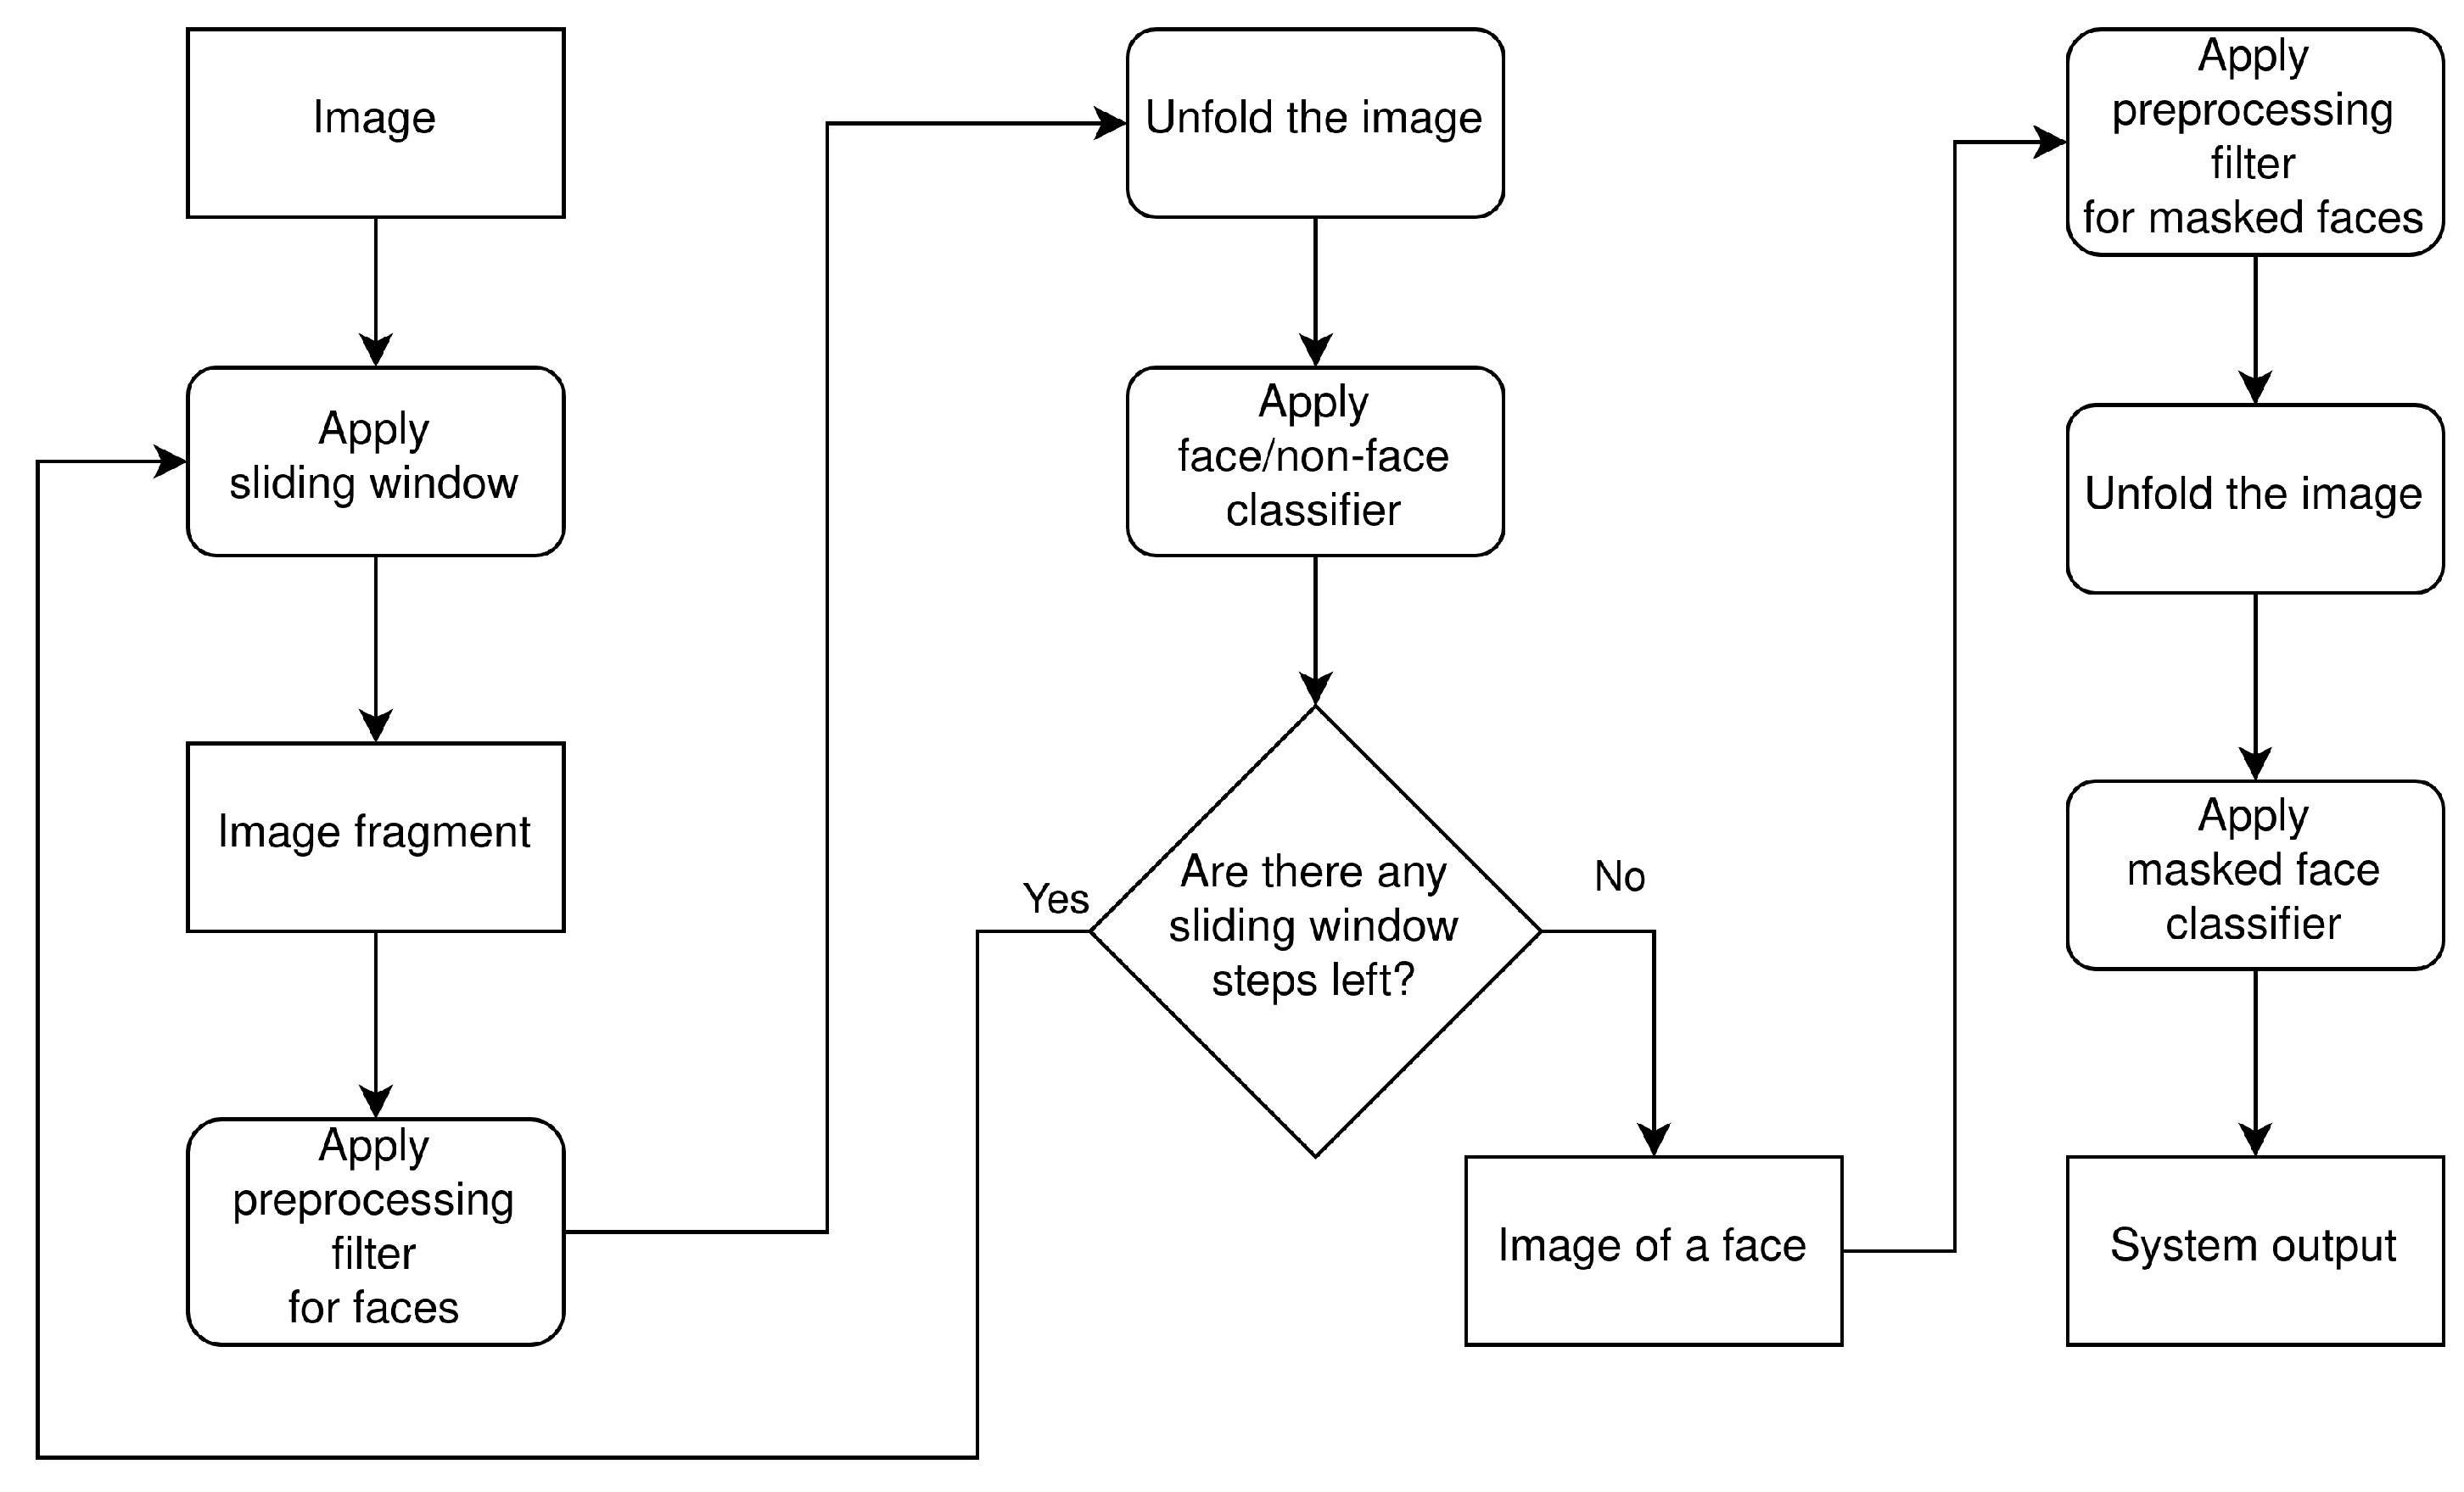
The first step in solving the problem of classification of the masked face is the detection of the face in an image. This is achieved by applying the sliding window technique to the image, obtaining the image fragment in the process. The preprocessing filter is then applied and the image fragment is unfolded. The unfolded array is passed to the K-means face/non-face classifier, and the procedure is repeated until the sliding window positions are exhausted. At this point, the image of a face is obtained. Then, the preprocessing filter is applied and the image of a face is unfolded. The unfolded array is passed to the K-means masked face classifier, which produces the system output. The system flow diagram is shown in
Figure 7.
3.5.2. Improving the Algorithm
The goal is to create a TinyML device that is capable of detecting whether the face mask is being worn correctly or incorrectly. Due to the TinyML nature and the fact that this device is meant to be powered by a battery, saving every possible bit of energy is a must. This can be done by algorithm simplification that can either influence the results or not, depending on the action. An example of algorithm simplification that does not influence the results is distance metric replacement. The conventionally used Euclidean metric gives precise distance values, but in order to classify a vector using K-means algorithm, precise distance value is not required. The only information that is required in order to correctly classify the given example to one particular centroid is the answer to the question: “Which centroid is the closest to the given example?”
This can be done by replacing the Euclidean metric, described with the Formula (
1) with the squared Euclidean metric, described with the Formula (
2).
It can also be proven mathematically. The square root function monotonically increases in the entire domain, that is, . As the distance is never negative, the square root can be removed from the Euclidean metric, creating the squared Euclidean metric, as this metric still allows for explicit comparison of the distance values. This means that replacing the Euclidean metric with a squared Euclidean metric will distort distance values (due to nonlinearity), but will not change the “greater than” and “smaller than” relationships between them, which is the only information needed.
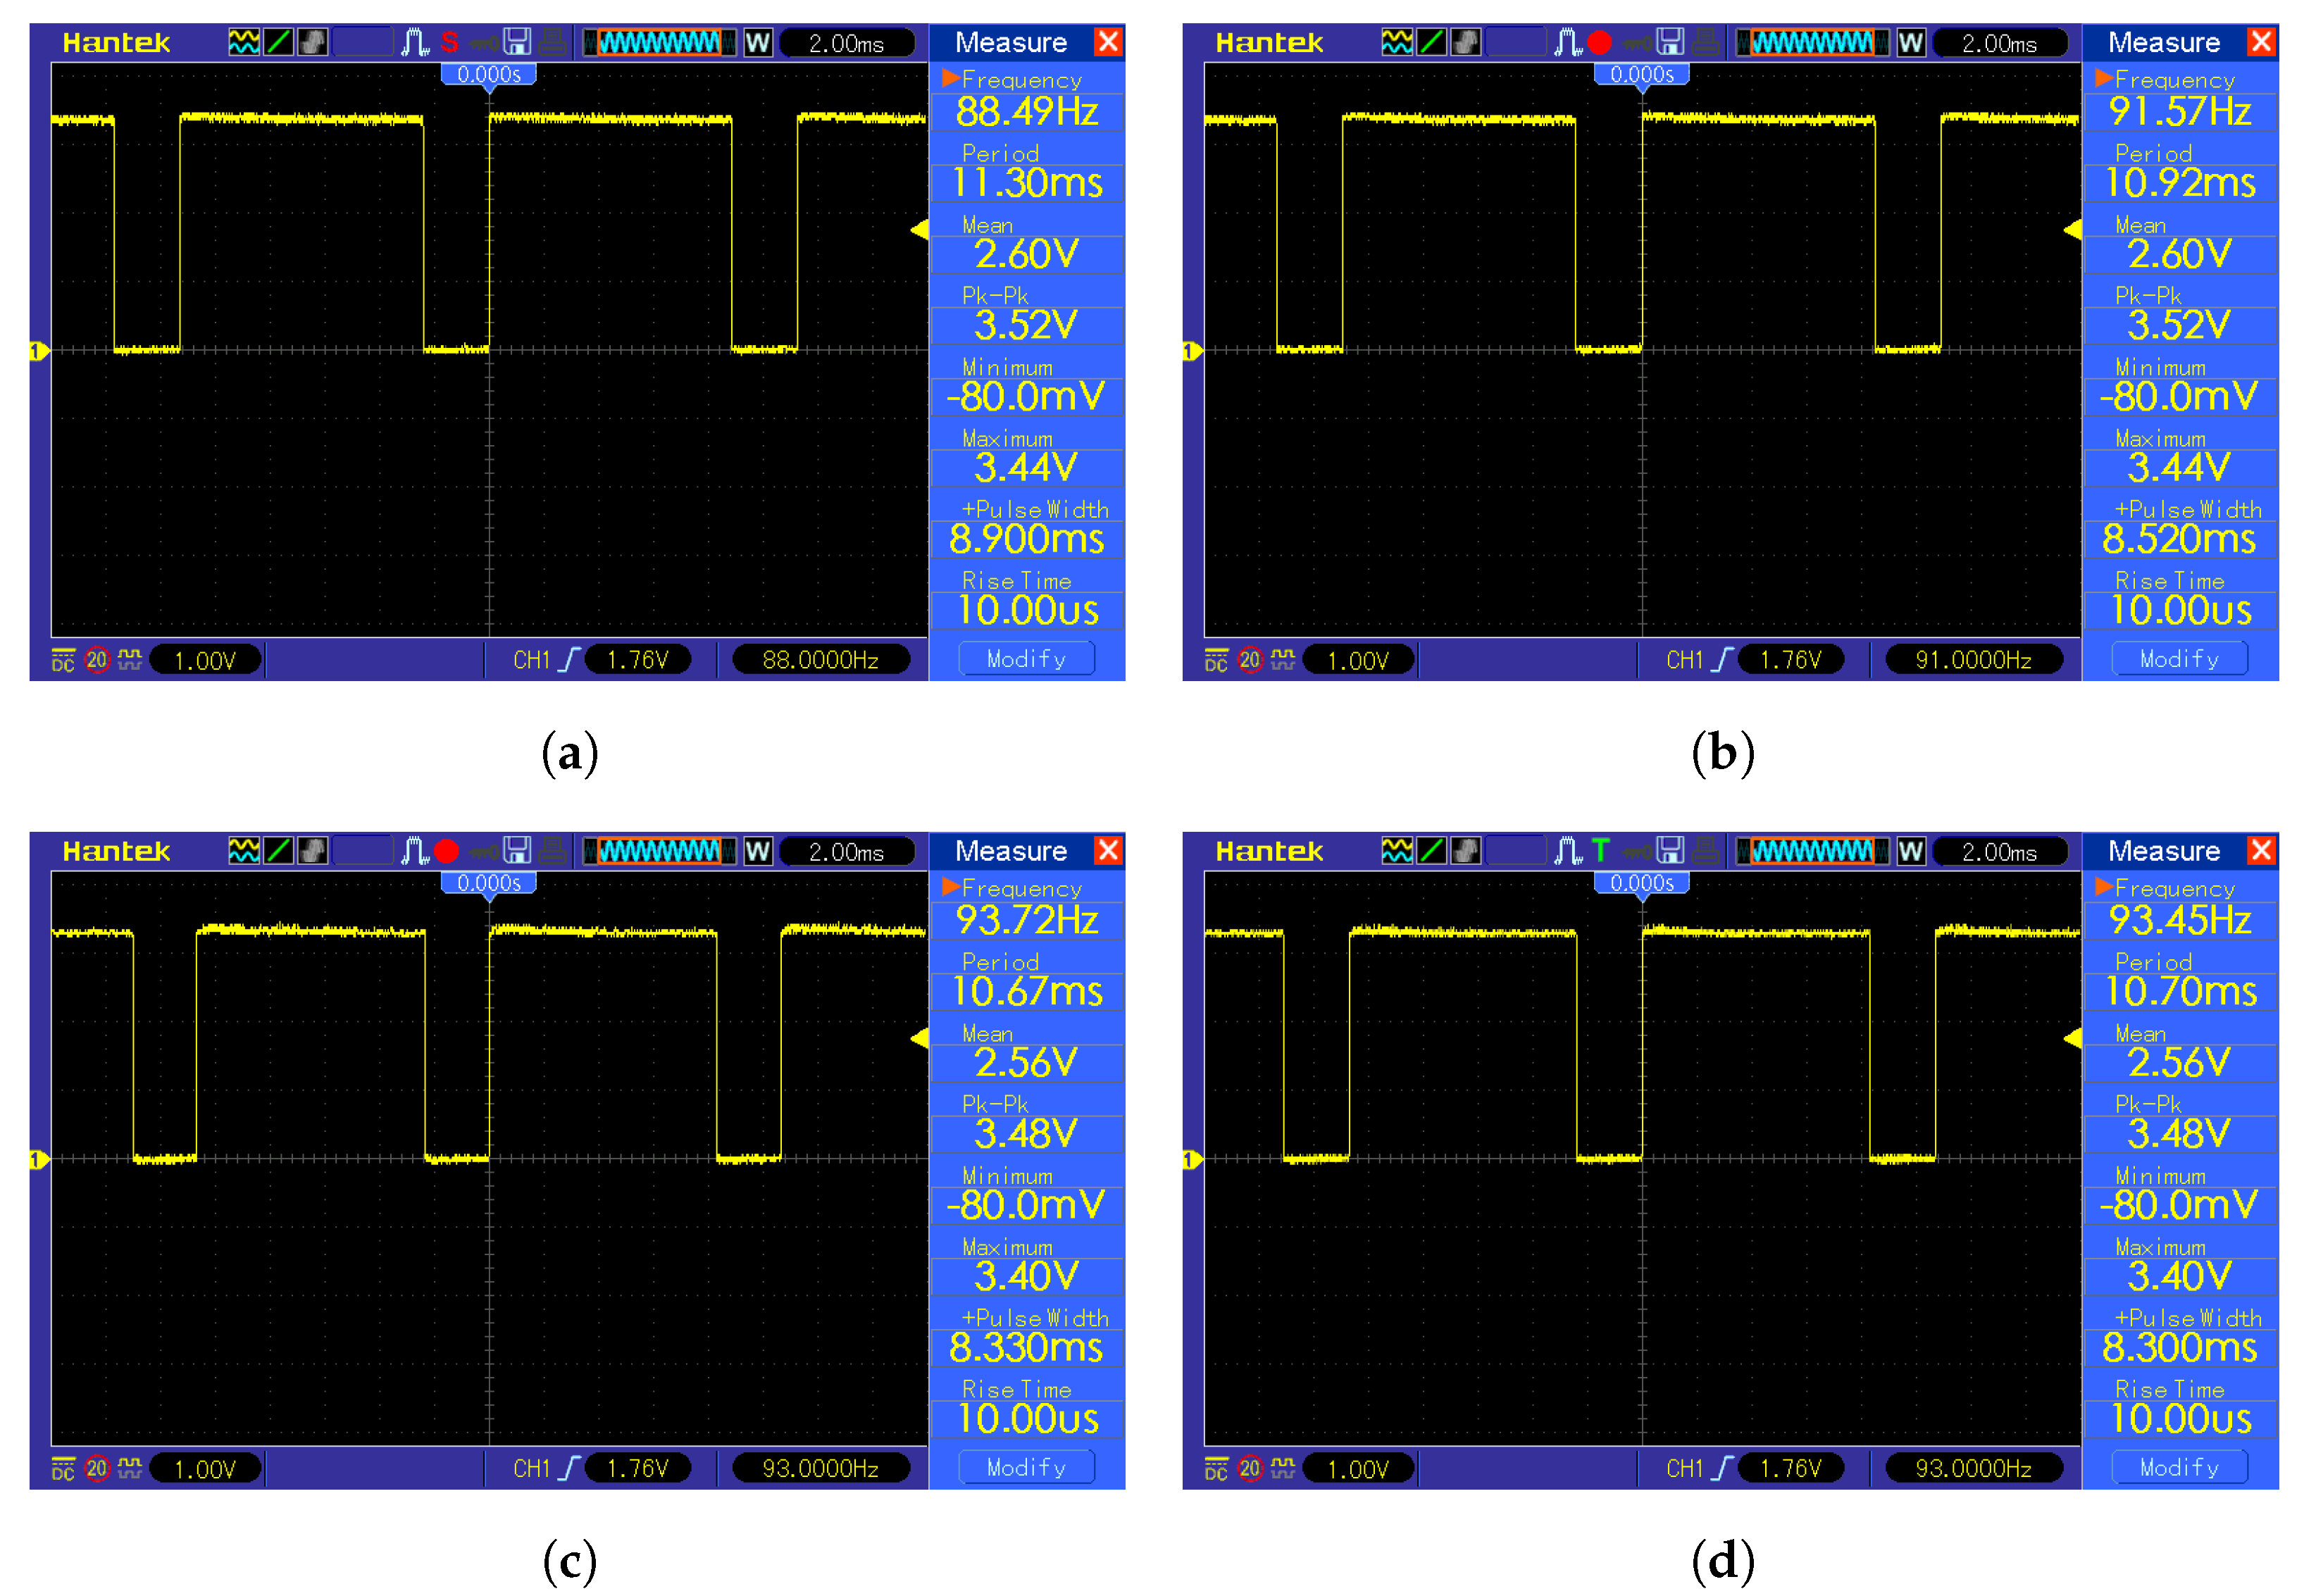
Square root removal is beneficial in the context of TinyML because it is a computationally heavy mathematical operation, which results in an excessive amount of required time and energy. As shown in the
Figure 8, the time difference is non-negligible. The K-means classification with a squared Euclidean metric is a baseline with 8.30 ms calculation time. The K-means classification with a Euclidean metric and bisection algorithm for square root calculation resulted in 8.90 ms of total computation time, which translates into 0.60 ms calculation time for the bisection square root calculation. The K-means classification with a Euclidean metric and Babylonian algorithm resulted in 8.52 ms total computation time, which translates into 0.22 ms calculation time for the Babylonian square root calculation. This translates into a 7.23% overall time increase for K-means classification with a Euclidean metric with a bisection algorithm for square root calculation and 2.65% for K-means classification with a Euclidean metric with a Babylonian algorithm for square root calculation in comparison with K-means classification with a squared Euclidean metric. The K-means classification with a Euclidean metric and optimized
function for square root calculation resulted in 8.33 ms total computation time, which translates into 0.03 ms calculation time for the optimized
function root calculation and a 0.36% overall time increase for K-means classification with a Euclidean metric with an optimized
function for square root calculation in comparison with K-means classification with the squared Euclidean metric.
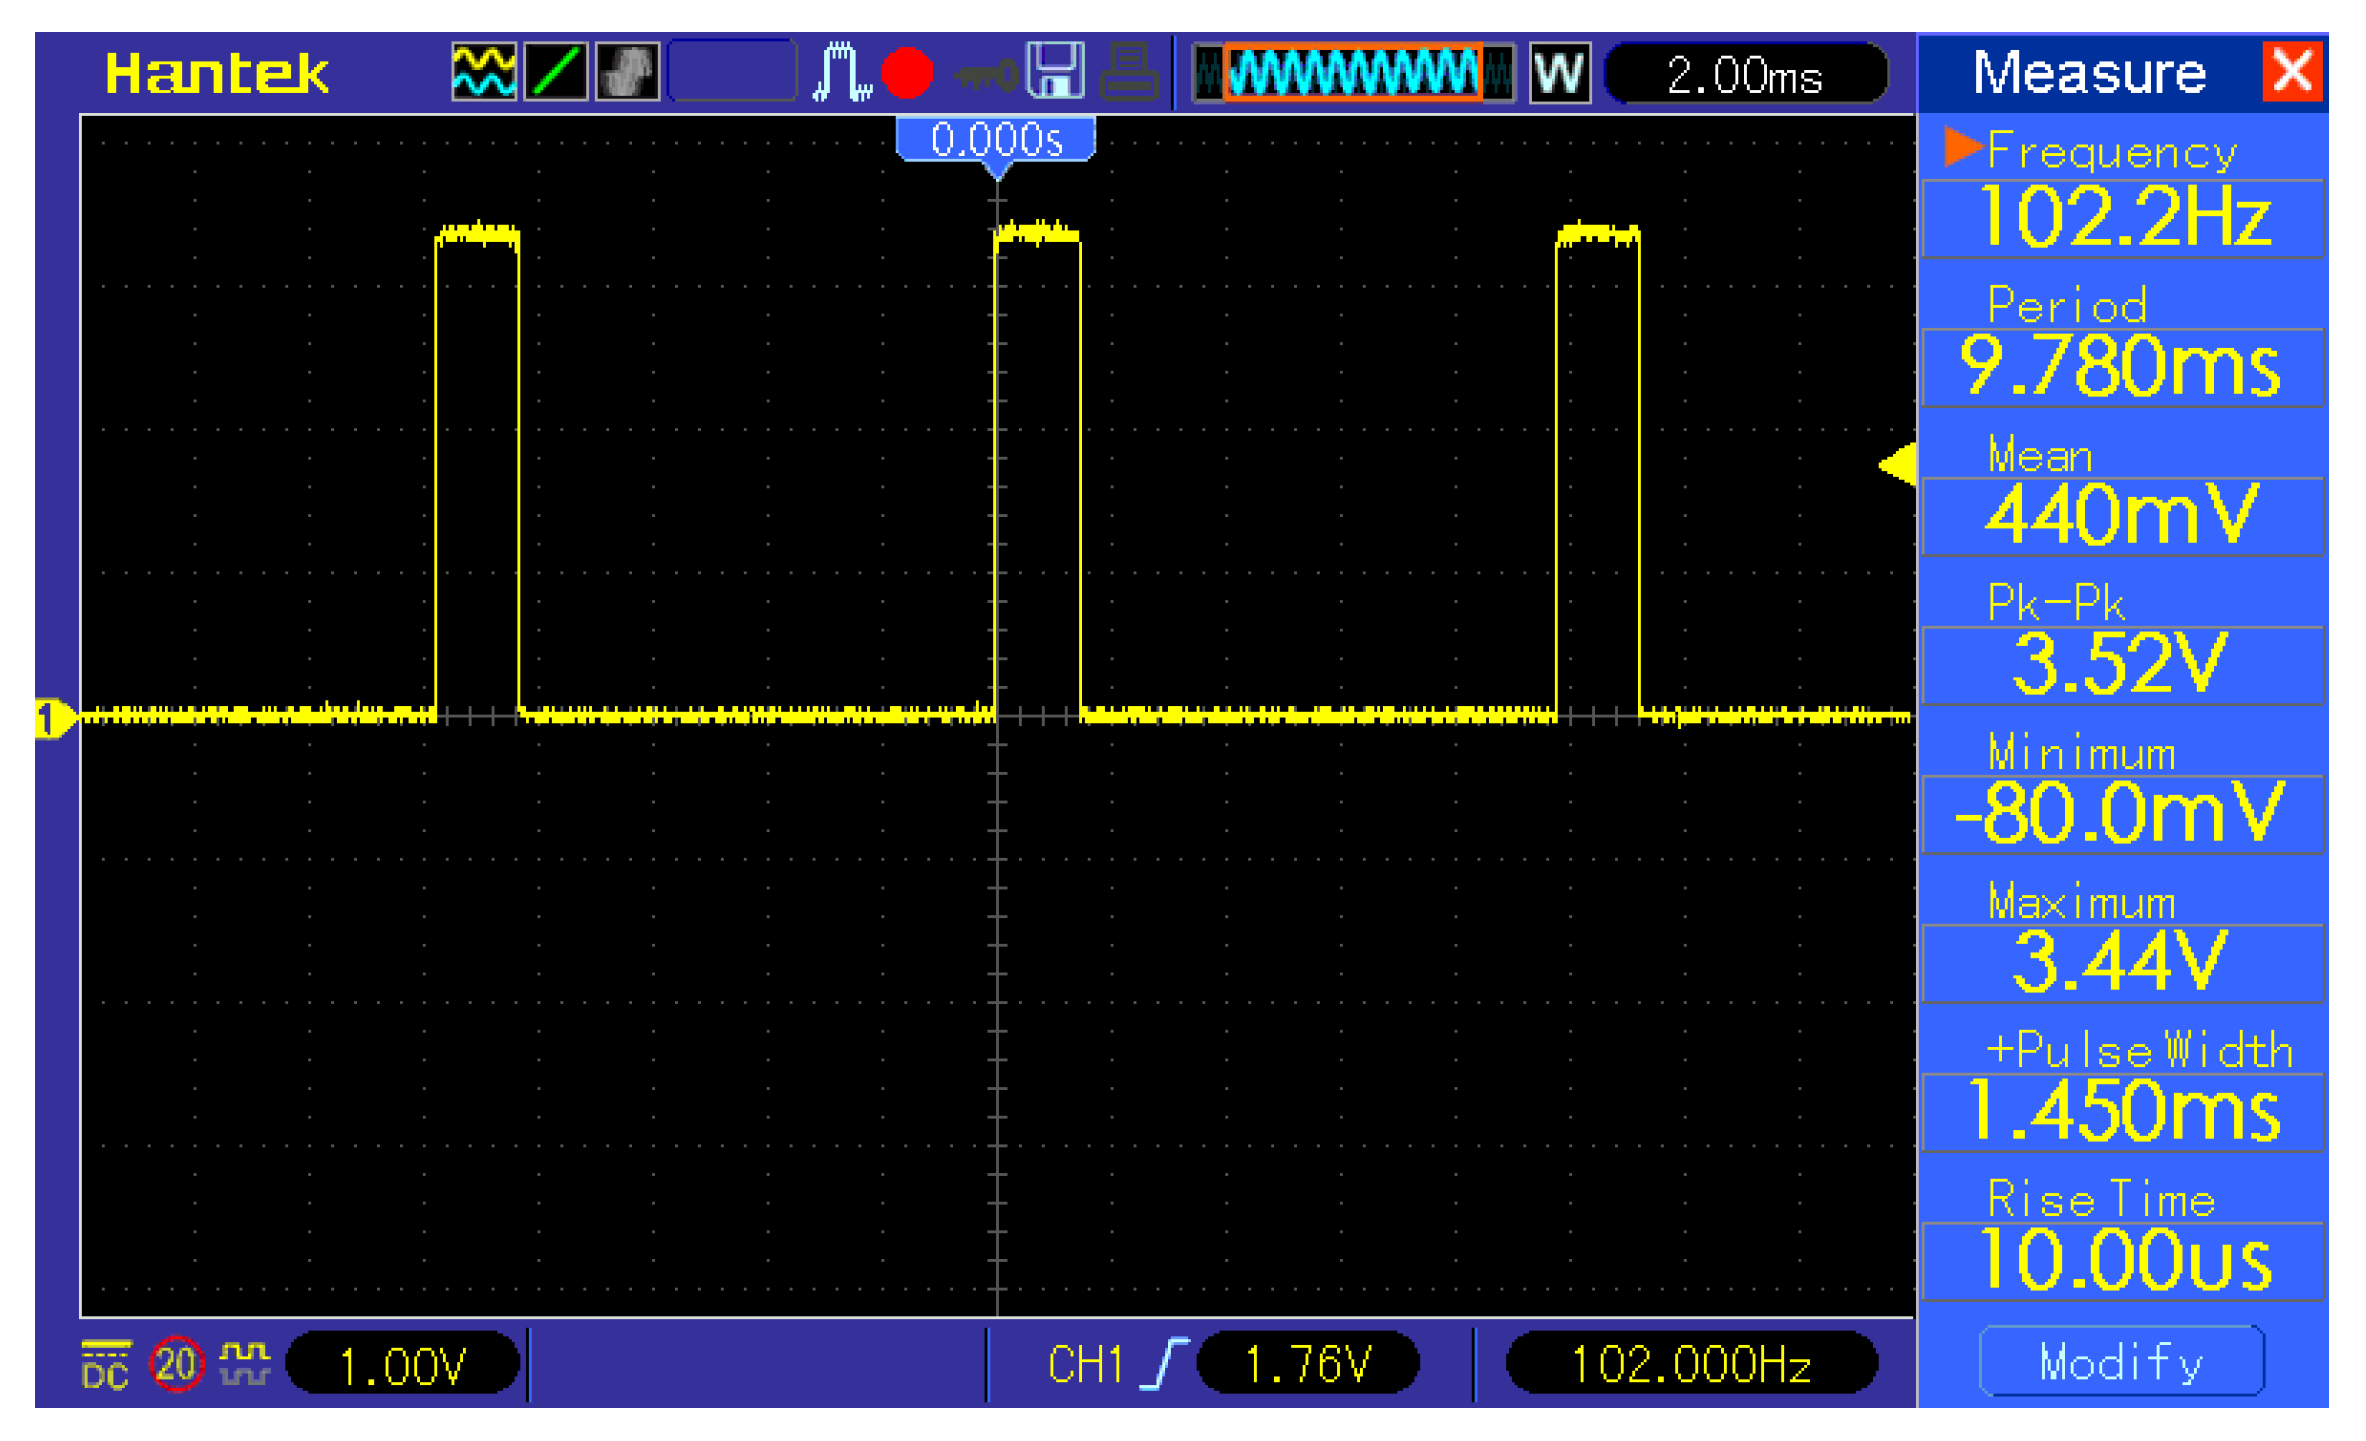
3.6. Measurements
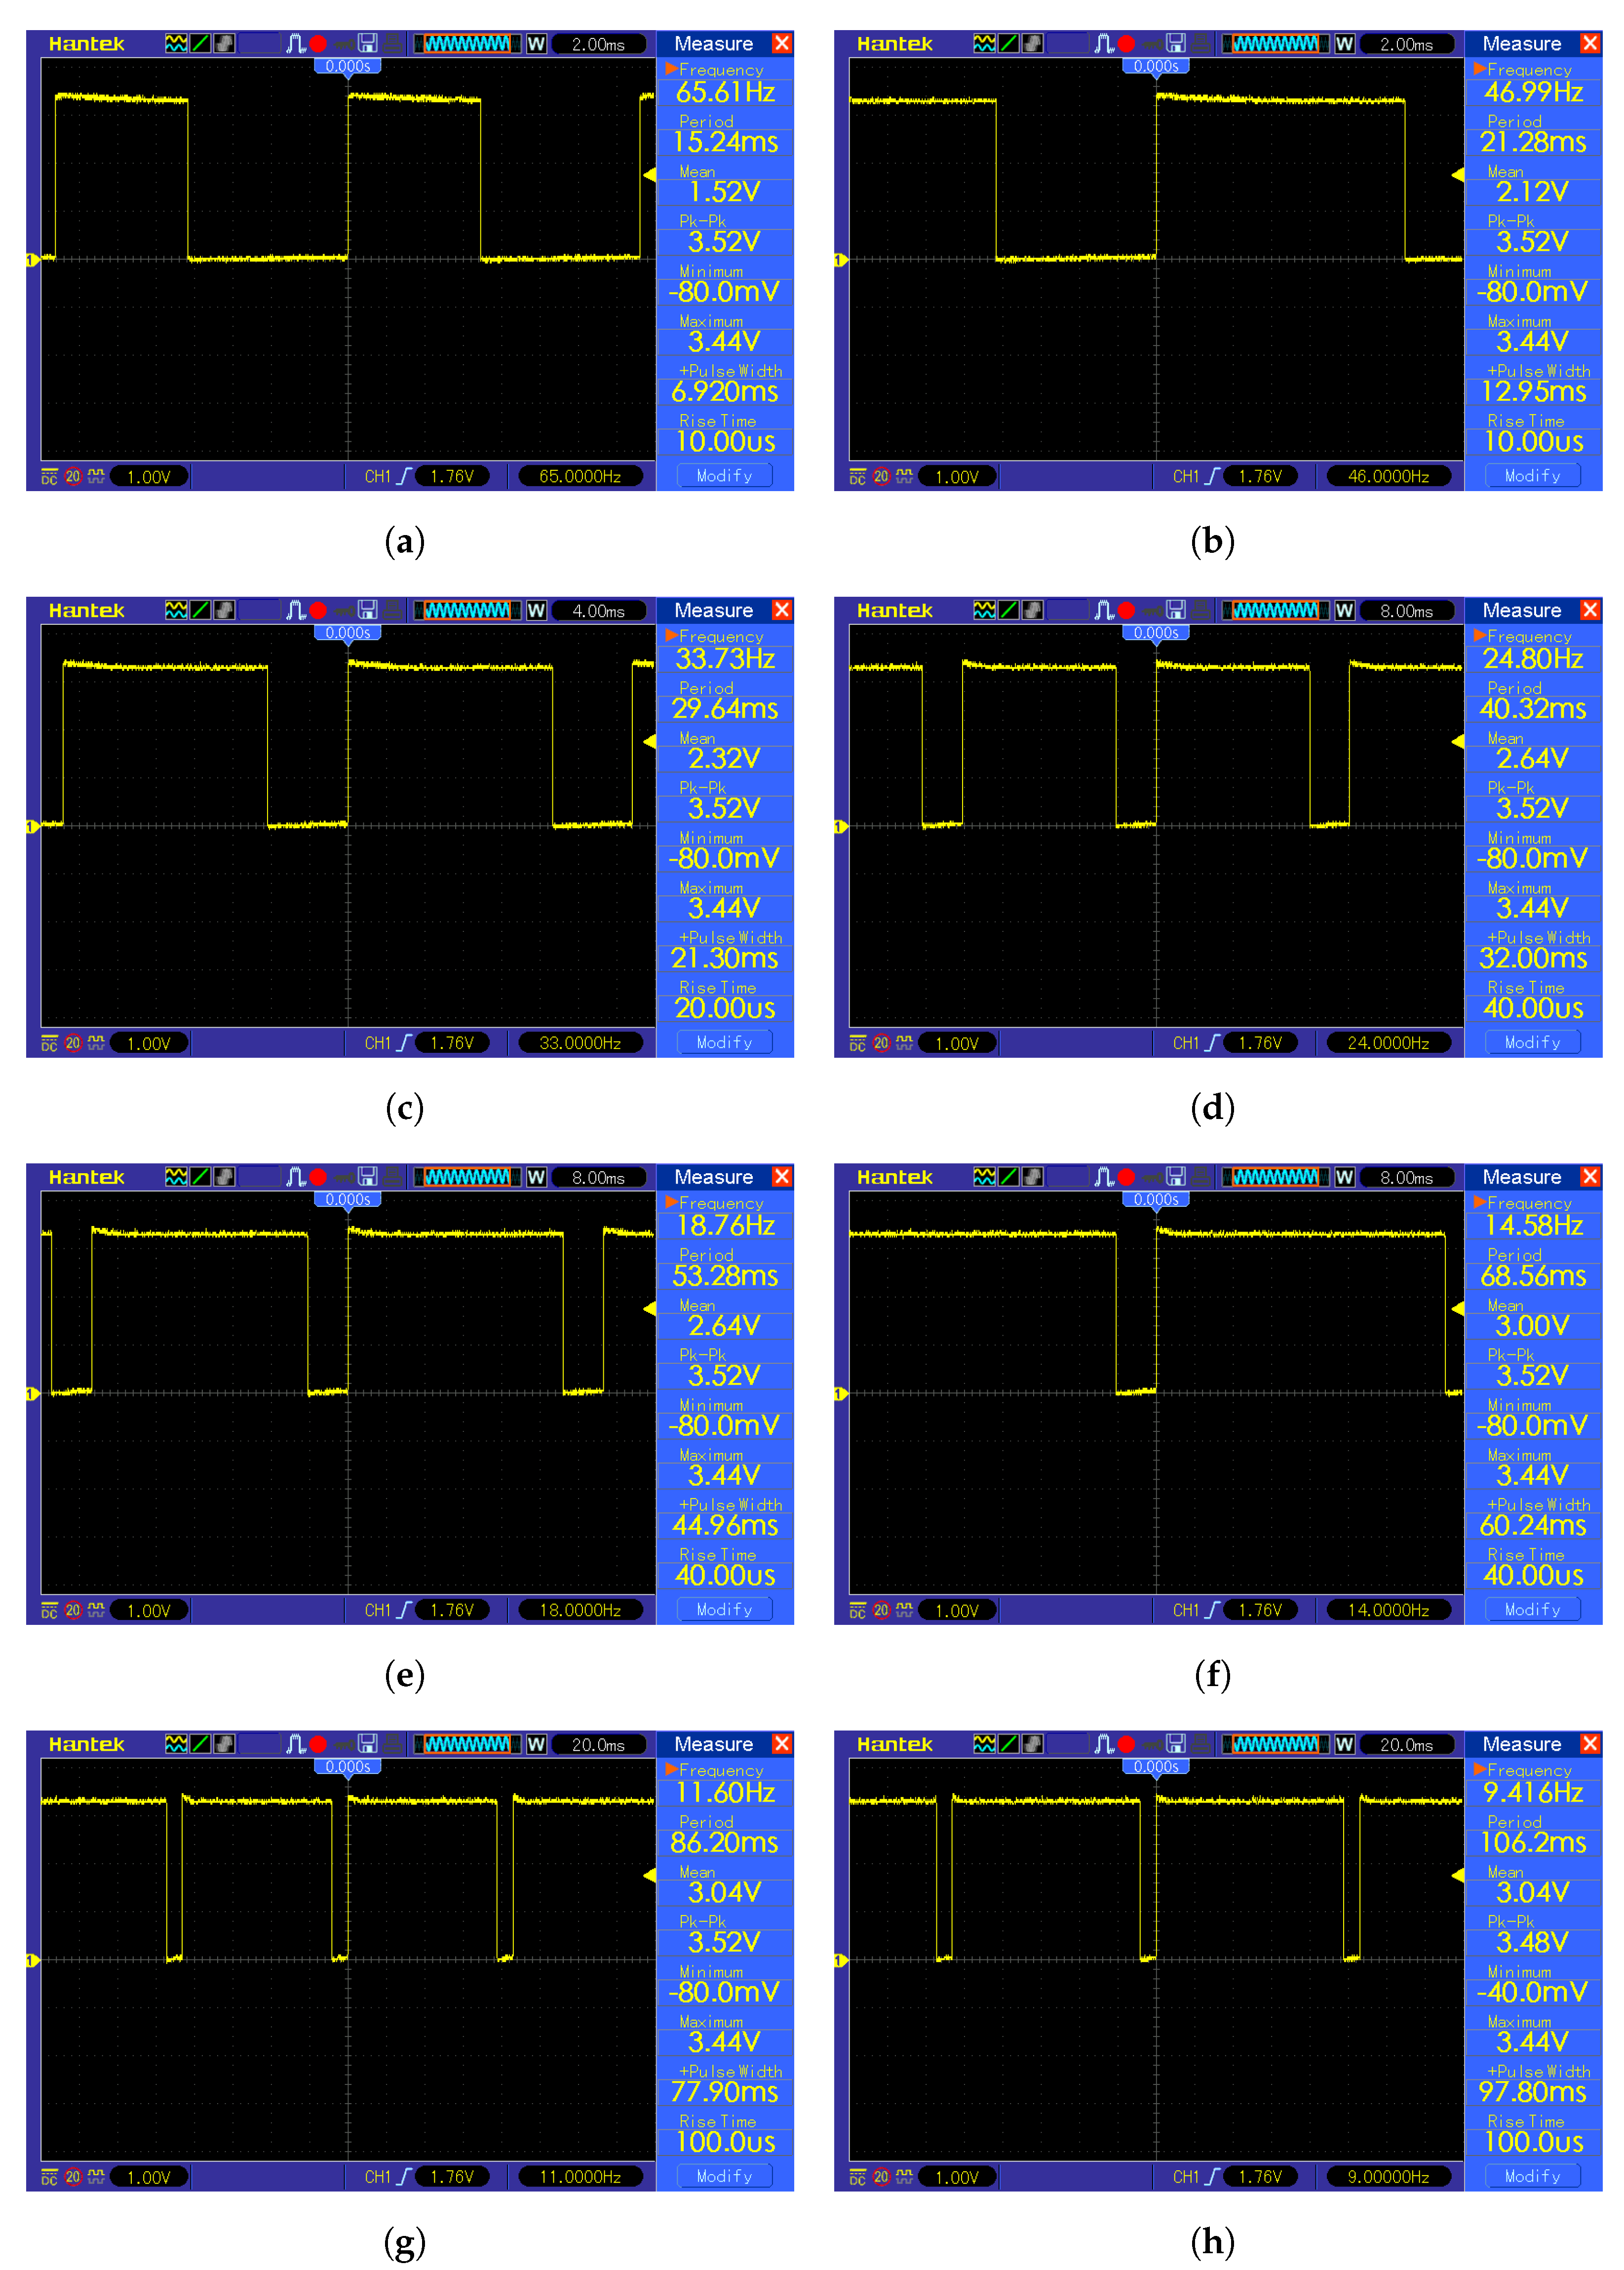
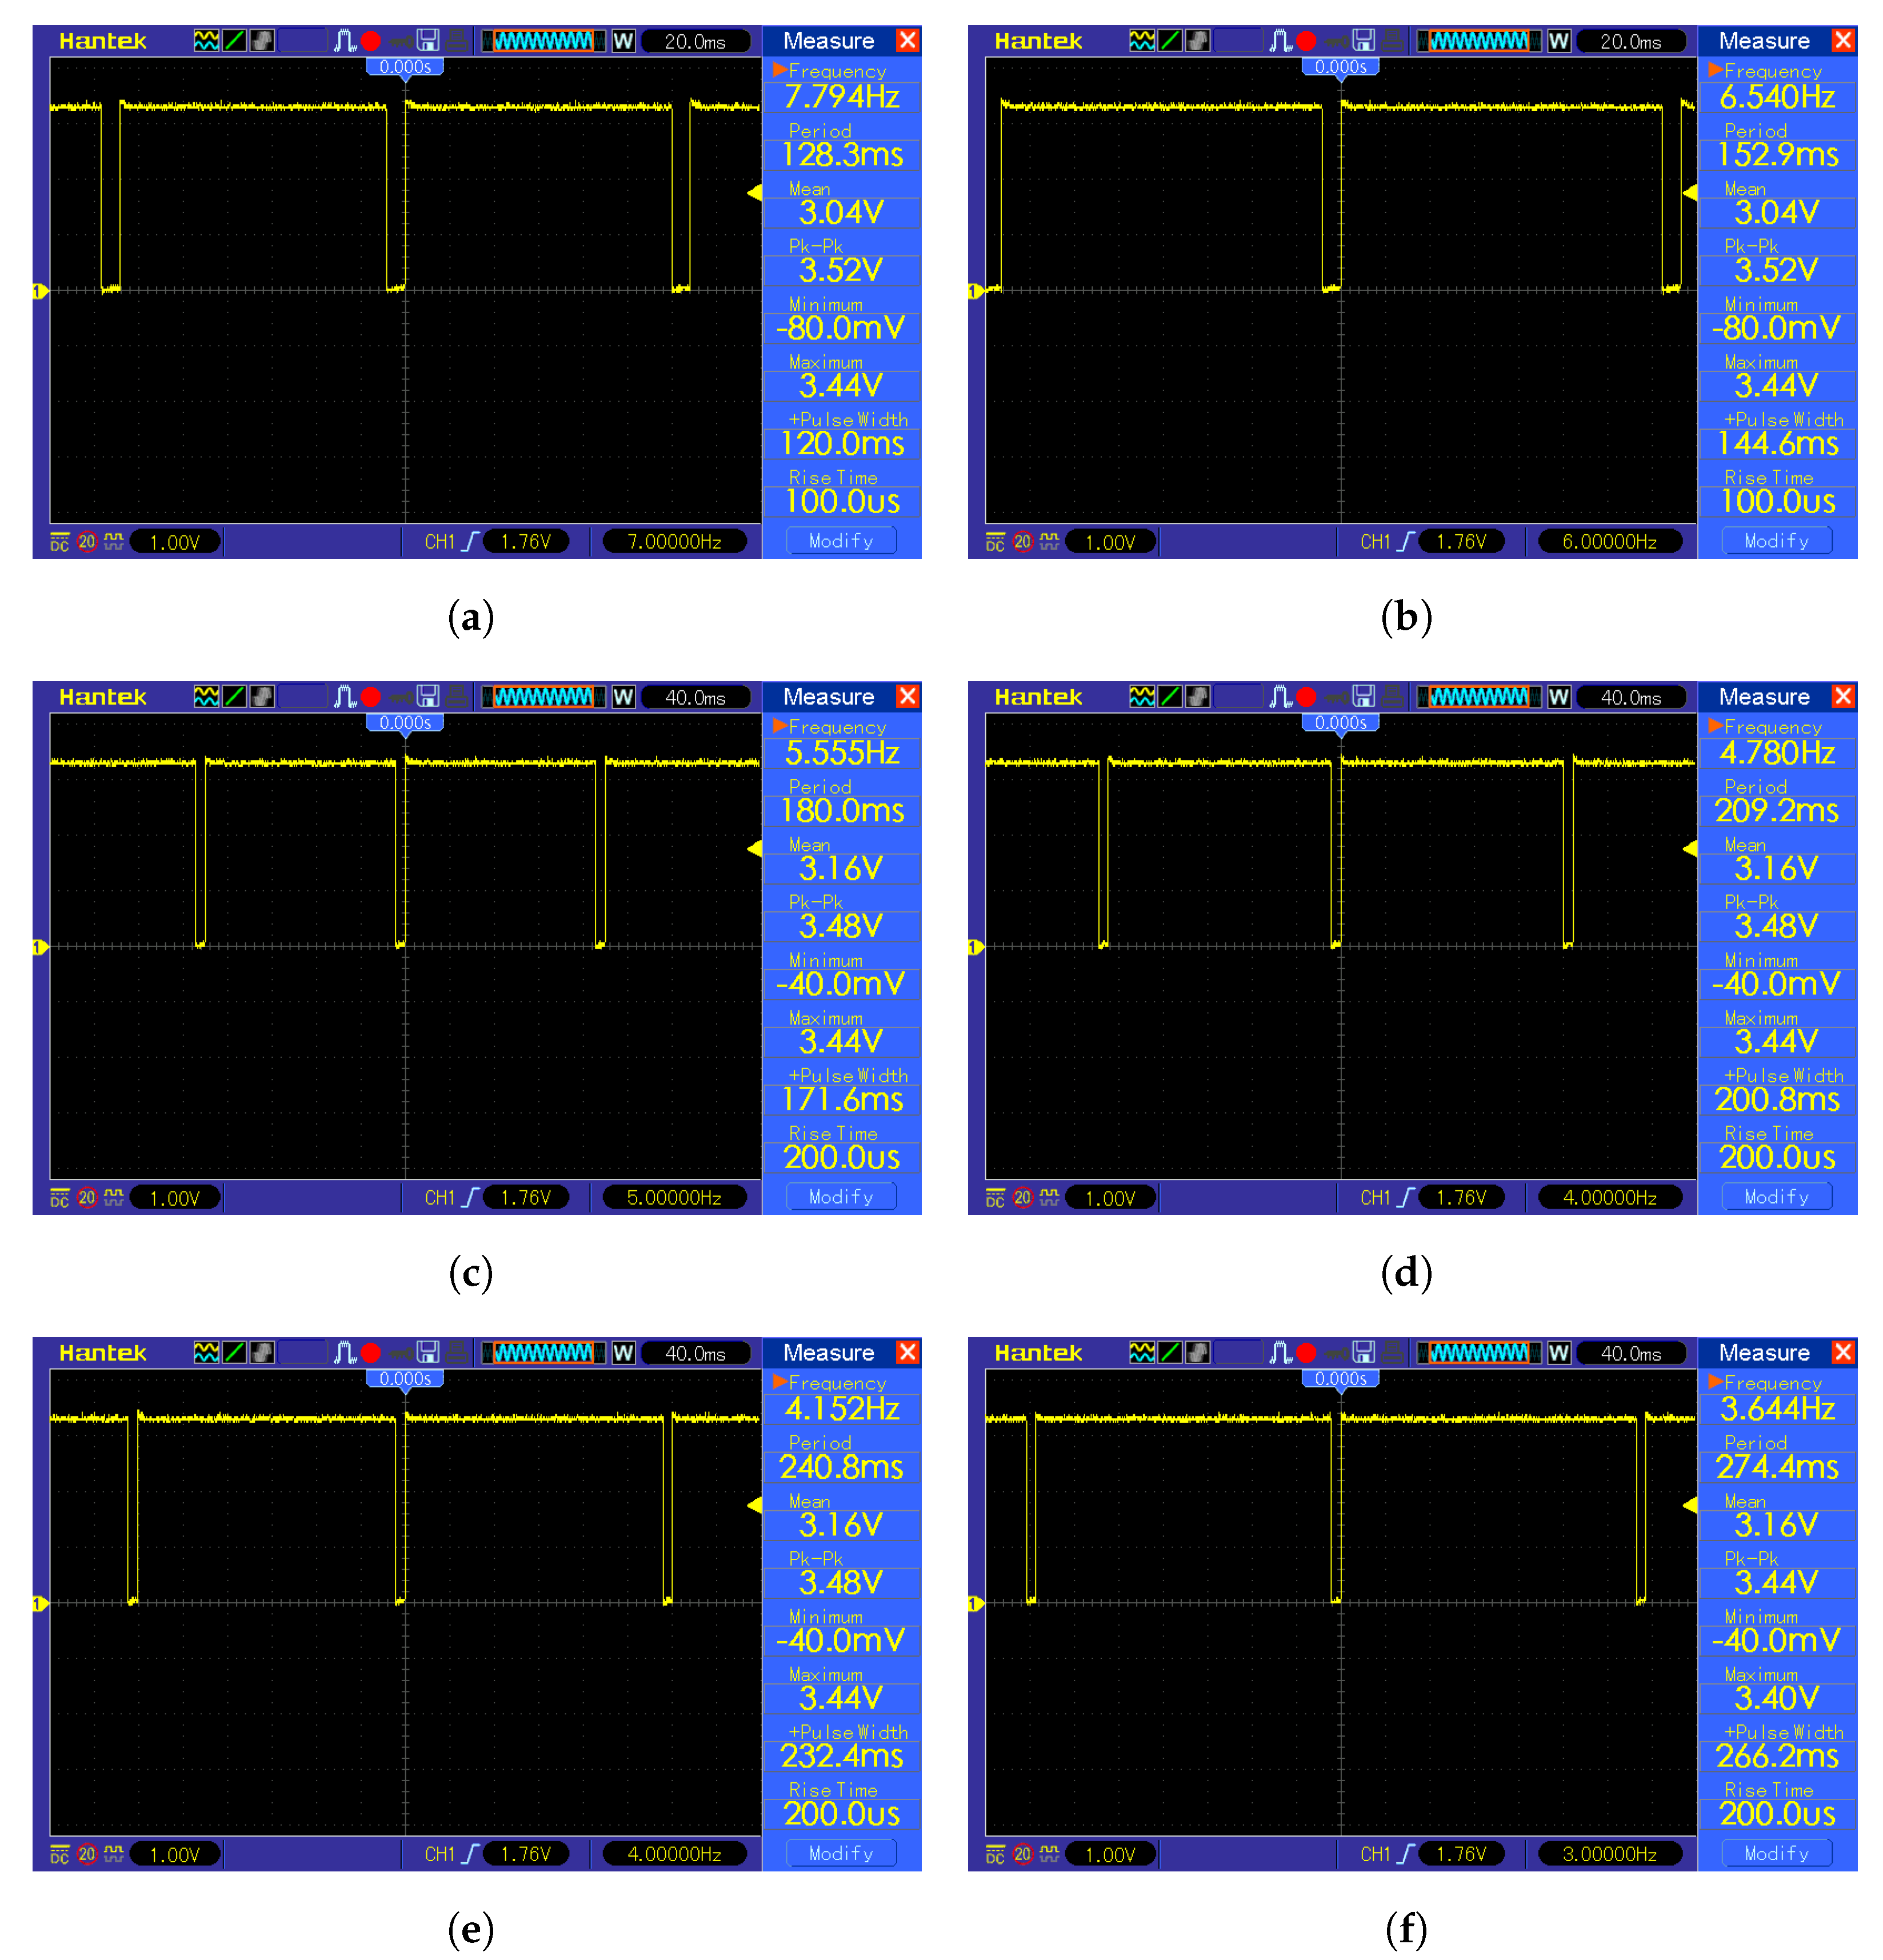
3.6.1. Face Detection
The sliding window was used in combination with the K-means classifier to detect a face in the image. The image fragment limited by the window was downscaled to 32 × 32 px in order to pass it to the classifier after applying the grayscale filter. The most computationally heavy task in this method is the downscaling, which must be measured and taken into consideration. Another procedure to measure is the grayscale filter. The sliding window technique measurement results are shown in
Table 4. The
Figure A1 and
Figure A2 from the
Appendix A contain the oscillograms from the measurements. Due to the fact that during measurements, the microcontroller was programmed to output a logical one during the desired operation to measure and logical zero otherwise, the time measurement of the operation is equivalent to measuring the pulse width. The grayscale conversion measurement shown in the
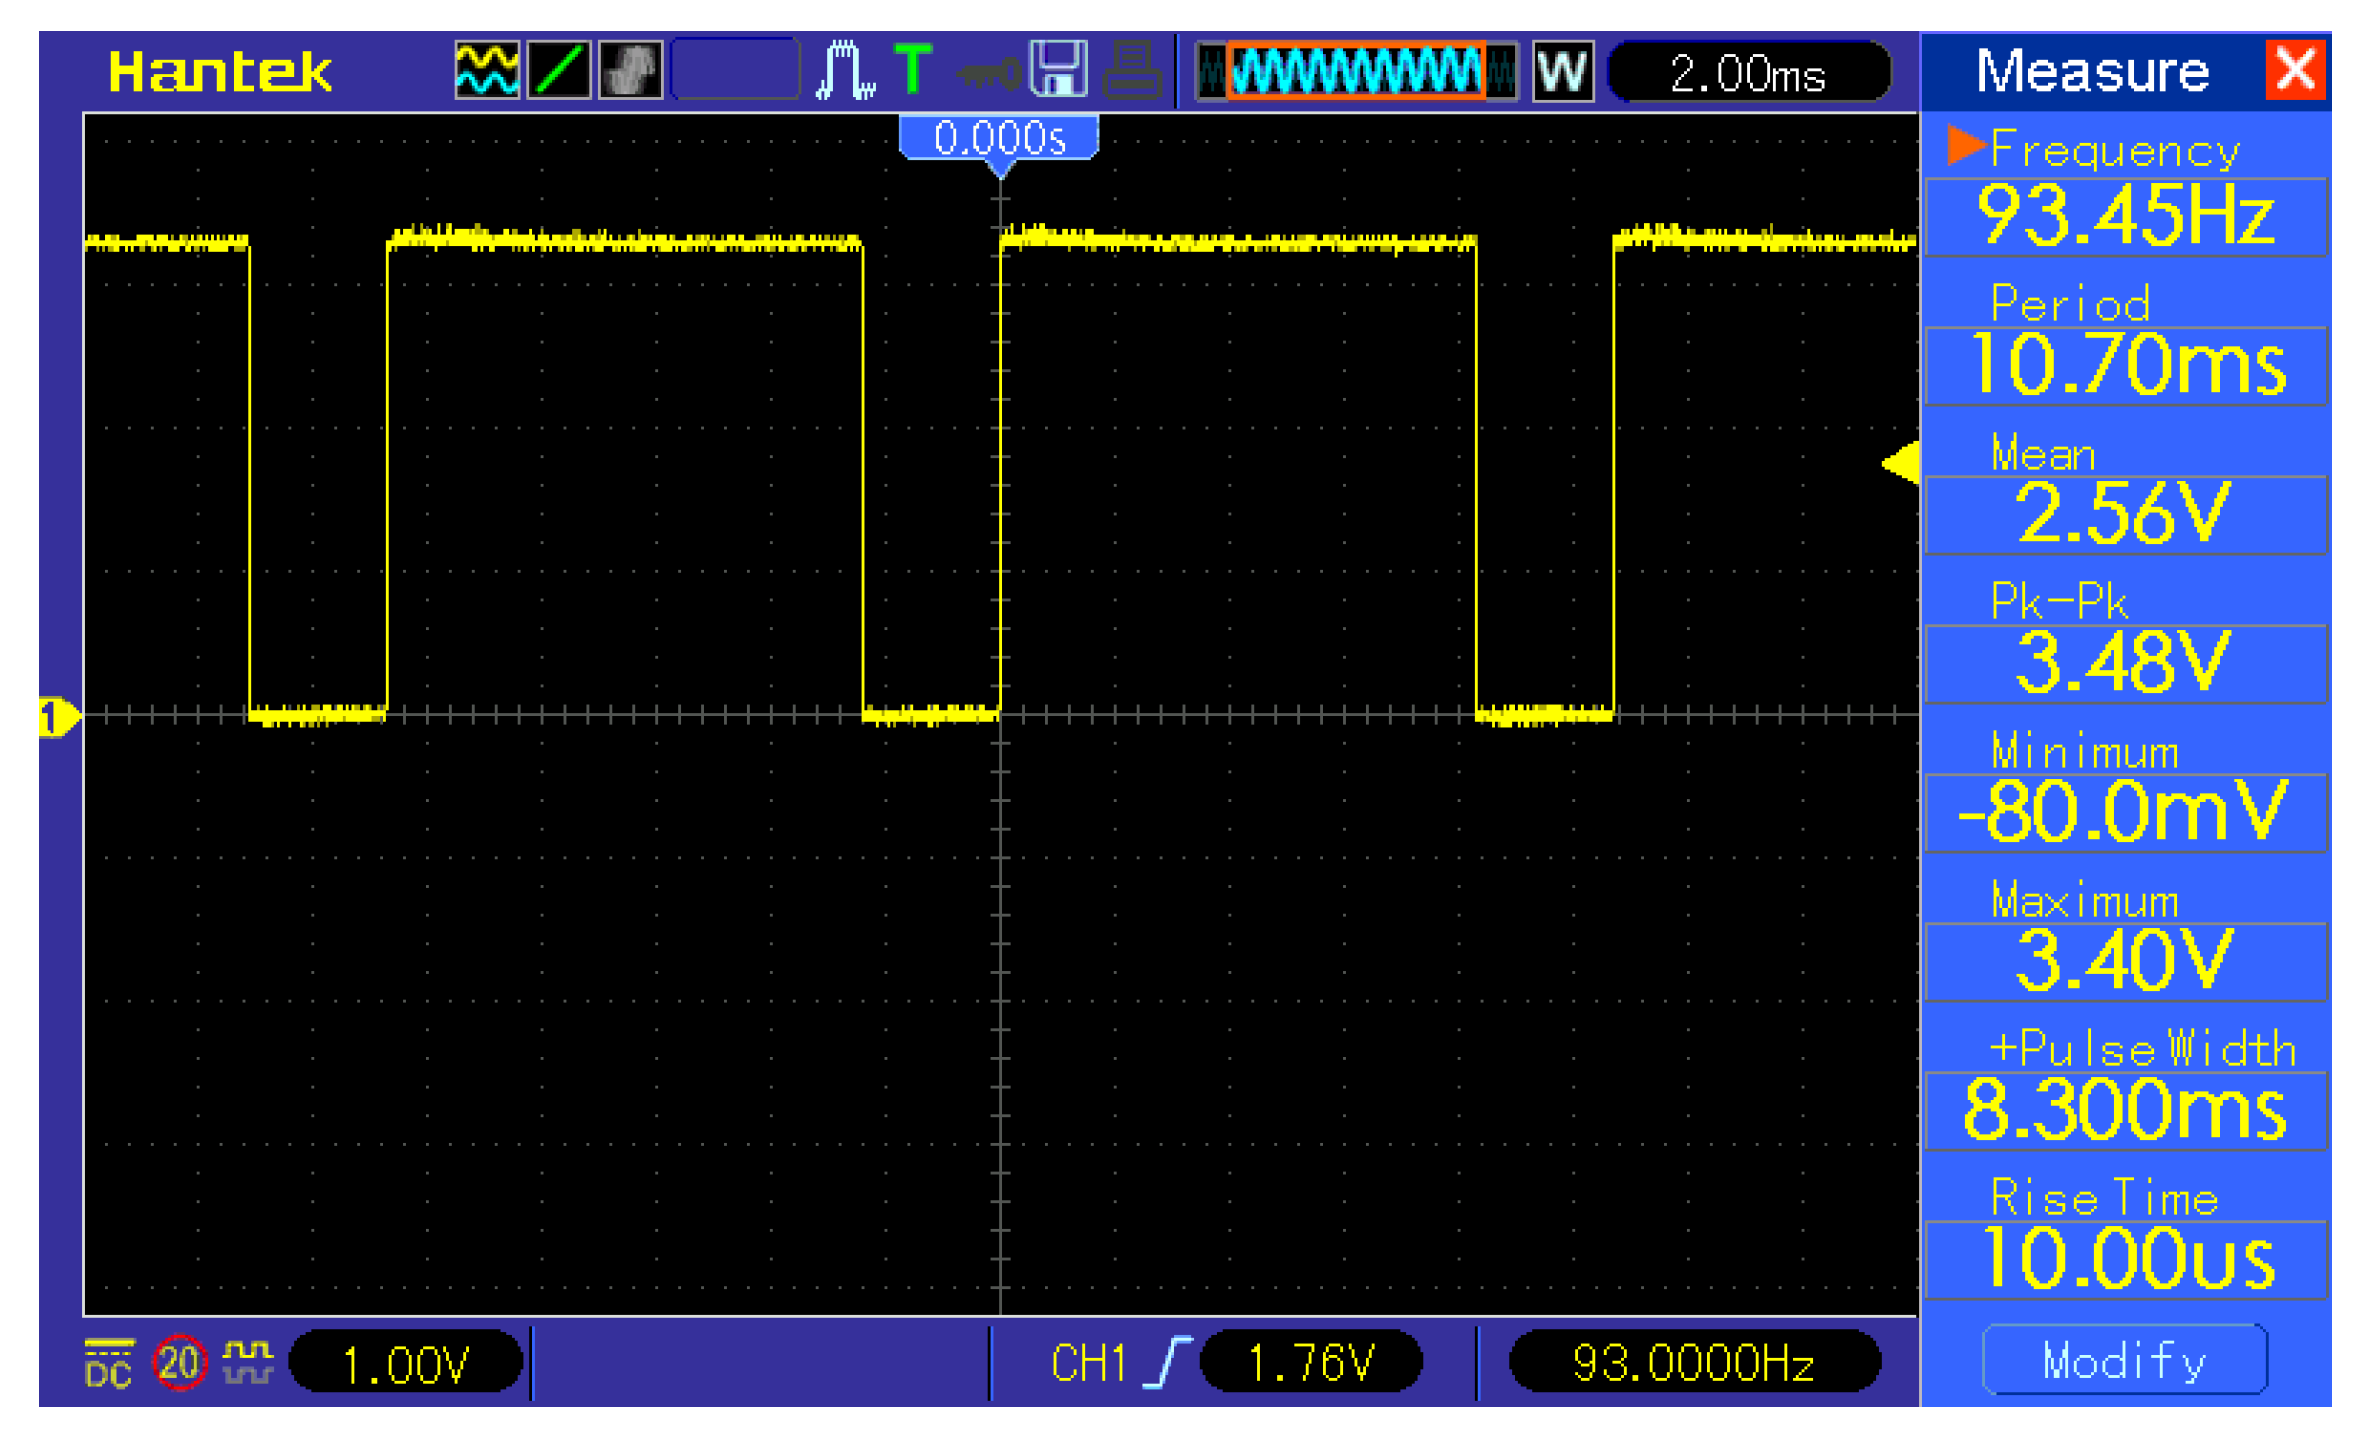
Figure 9 resulted in 1.45 ms of calculation time. The K-means classification measurement shown in the
Figure 10 resulted in a 8.30 ms calculation time.
3.6.2. Masked face Classification
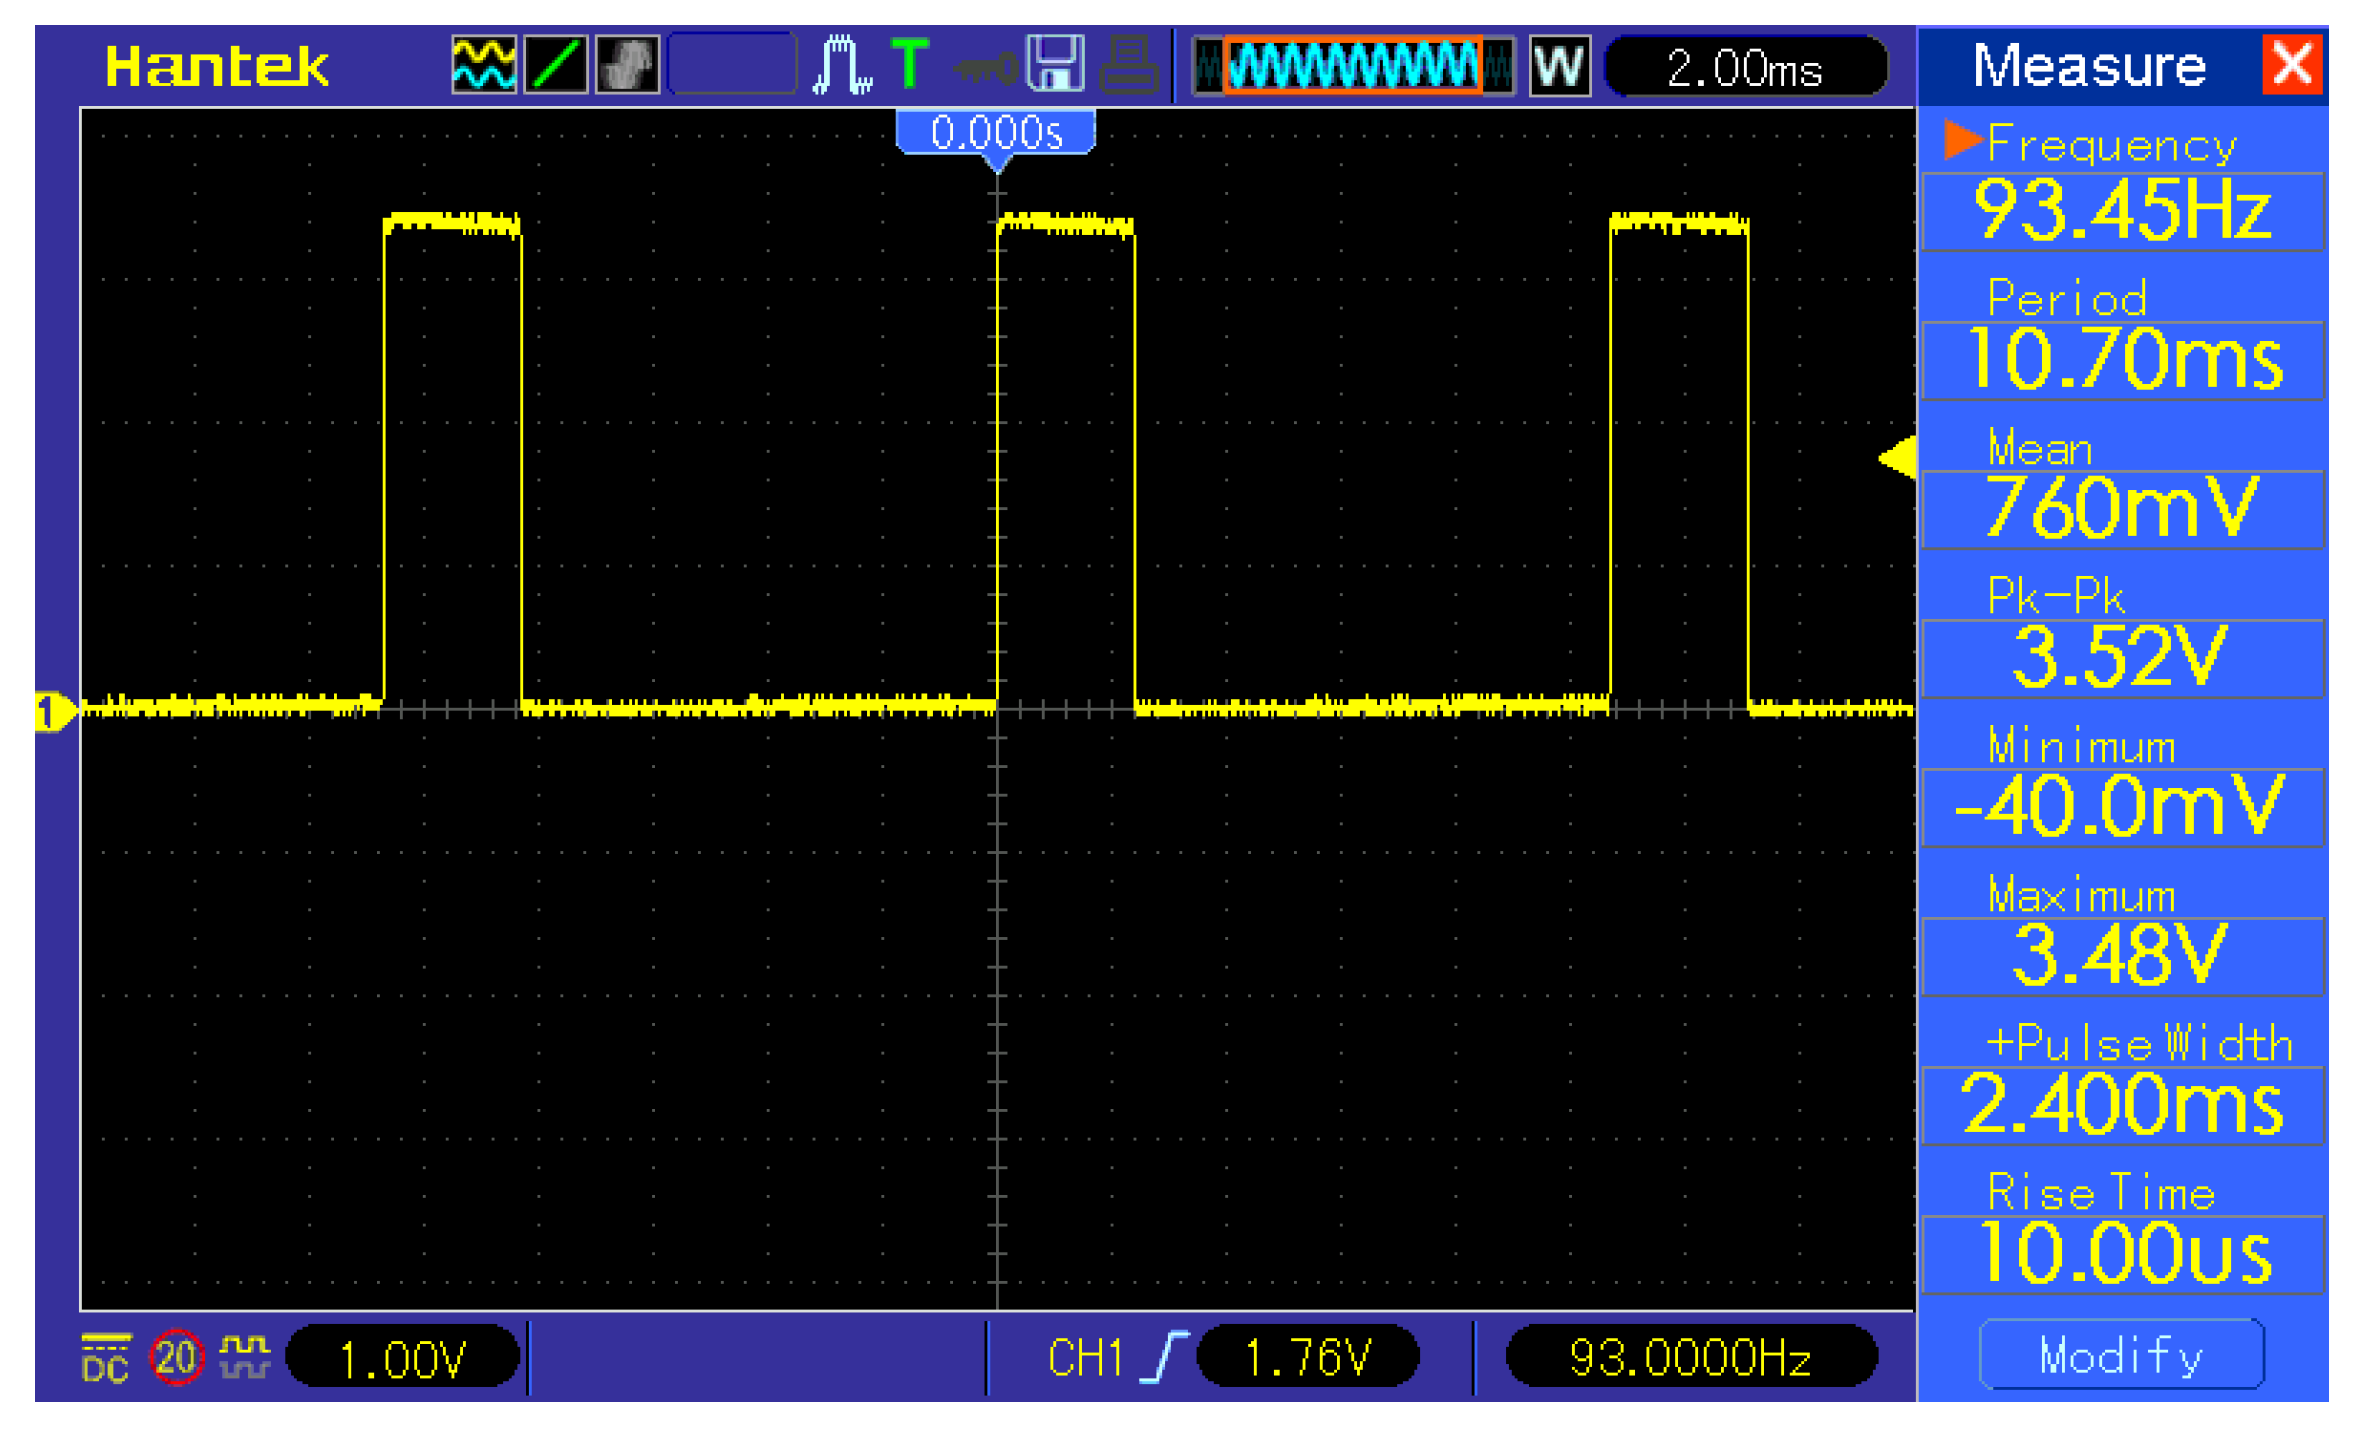
The masked face classification consists of a thresholding part and K-means algorithm part. The measurement of thresholding shown in the
Figure 11 resulted in 2.40 ms of calculation time, and the K-means measurement is shown in the
Figure 10.
4. Results
This section presents a performance evaluation of each system component, including the overall system accuracy and the face detection time calculation results. The tuning of the masked face classifier and sliding window is discussed and presented. Using the acquired data, the energy consumption of one full masked face classification operation is calculated, and the device battery life is estimated.
All datasets used for training the models were split into three subsets:
Training subset consisting of 60% randomly chosen images
Cross-validation subset consisting of 20% randomly chosen images
Testing subset consisting of 20% randomly chosen images
The models were trained using the training subsets and validated using cross-validation subsets. The best-performing model in the validation stage was chosen for testing using the testing subset. As the K-means classifier training is heavily dependent on the initial values, the training was executed 1000 times [
2].
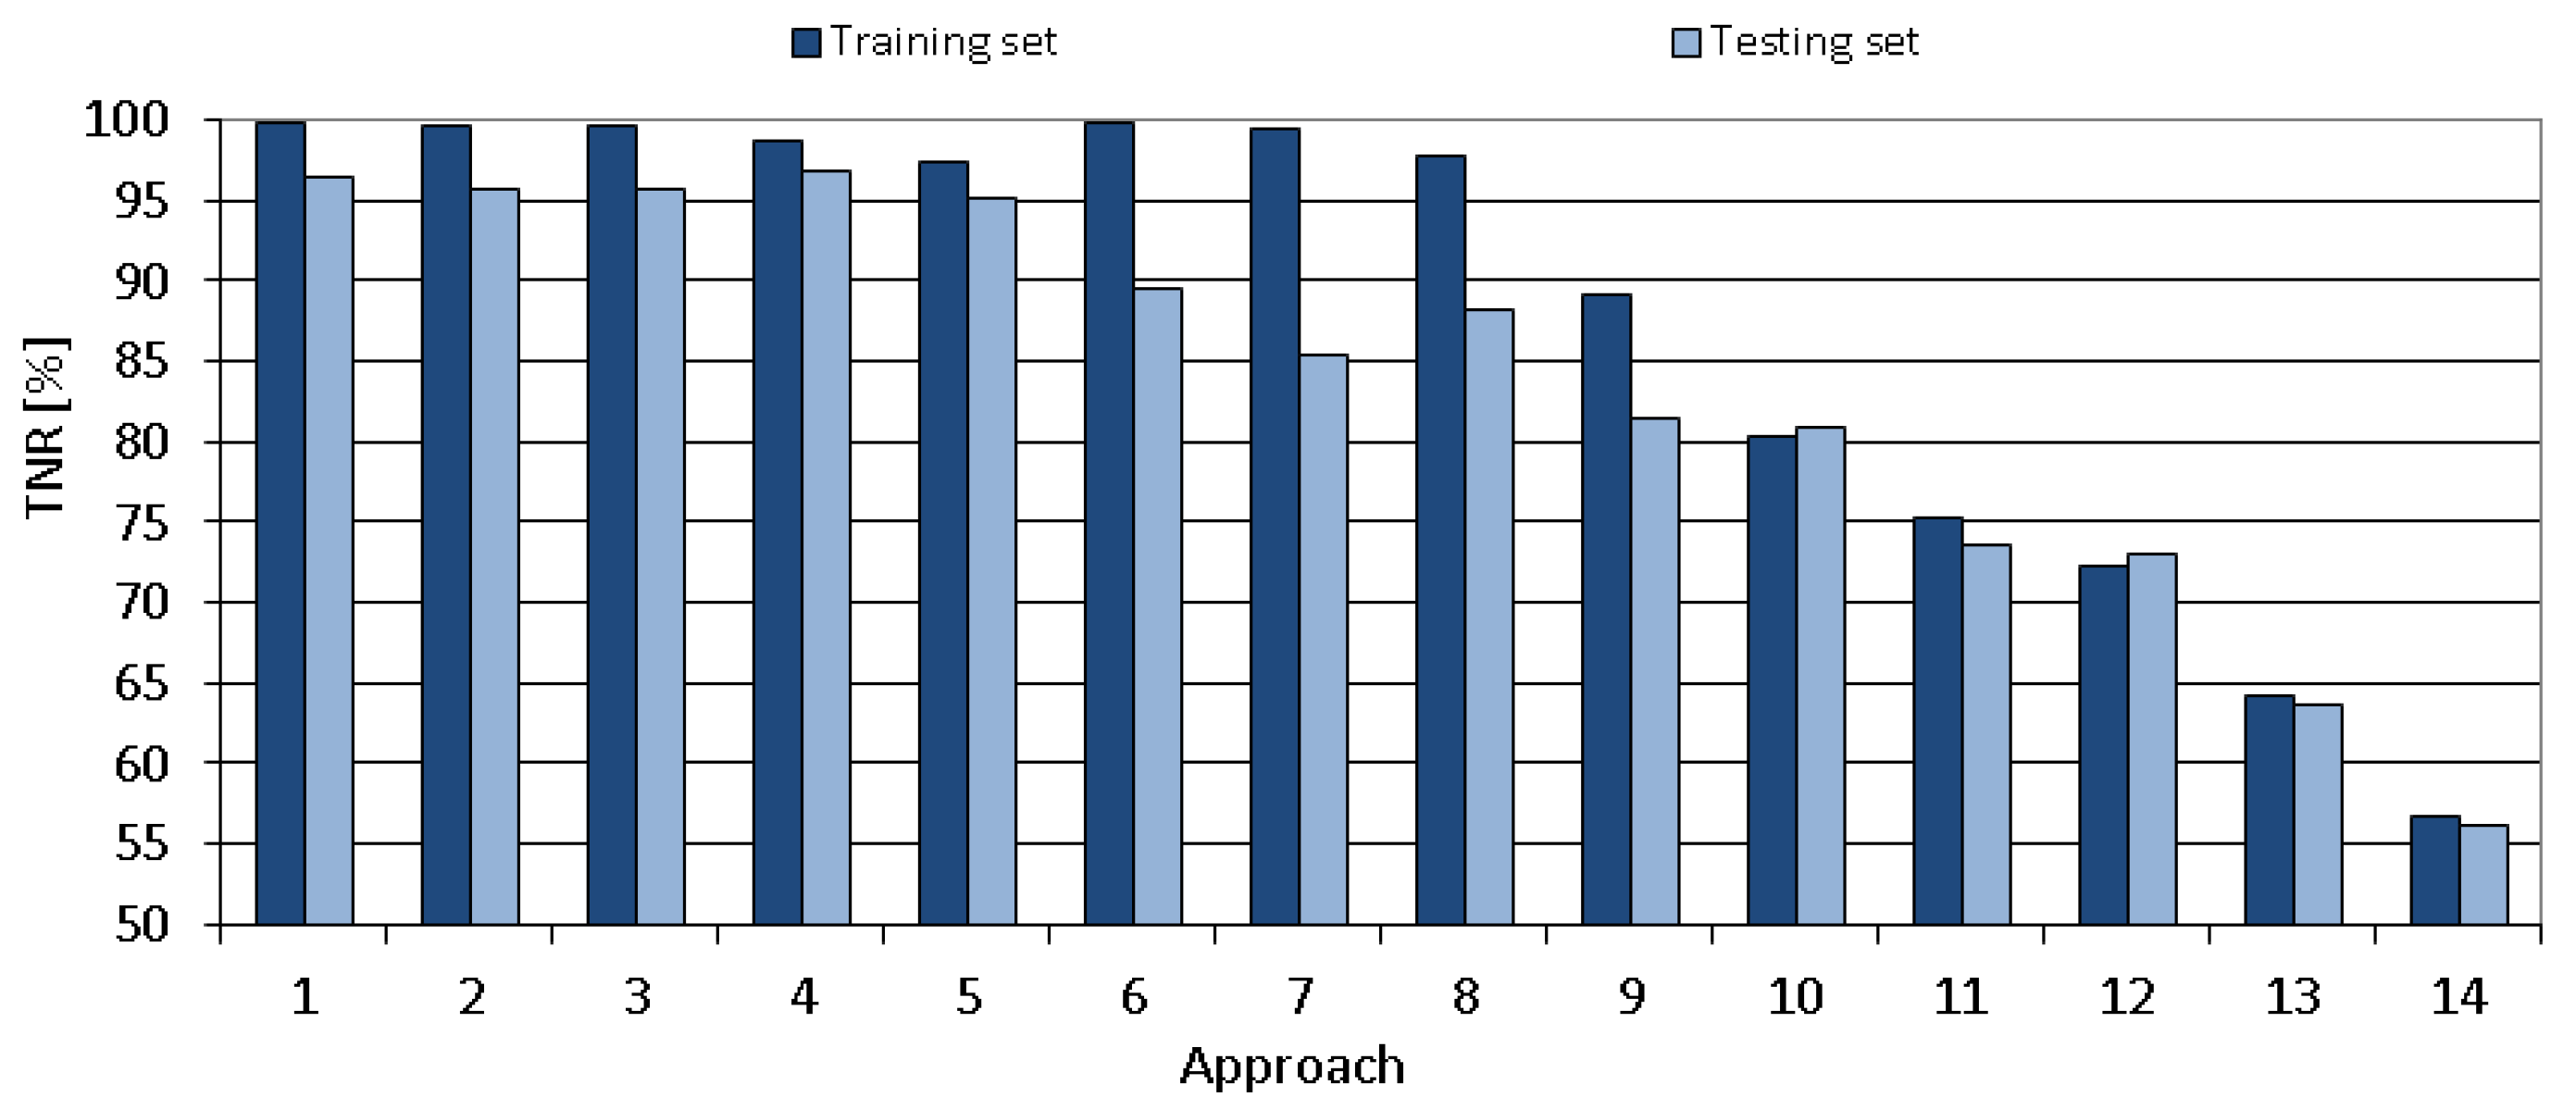
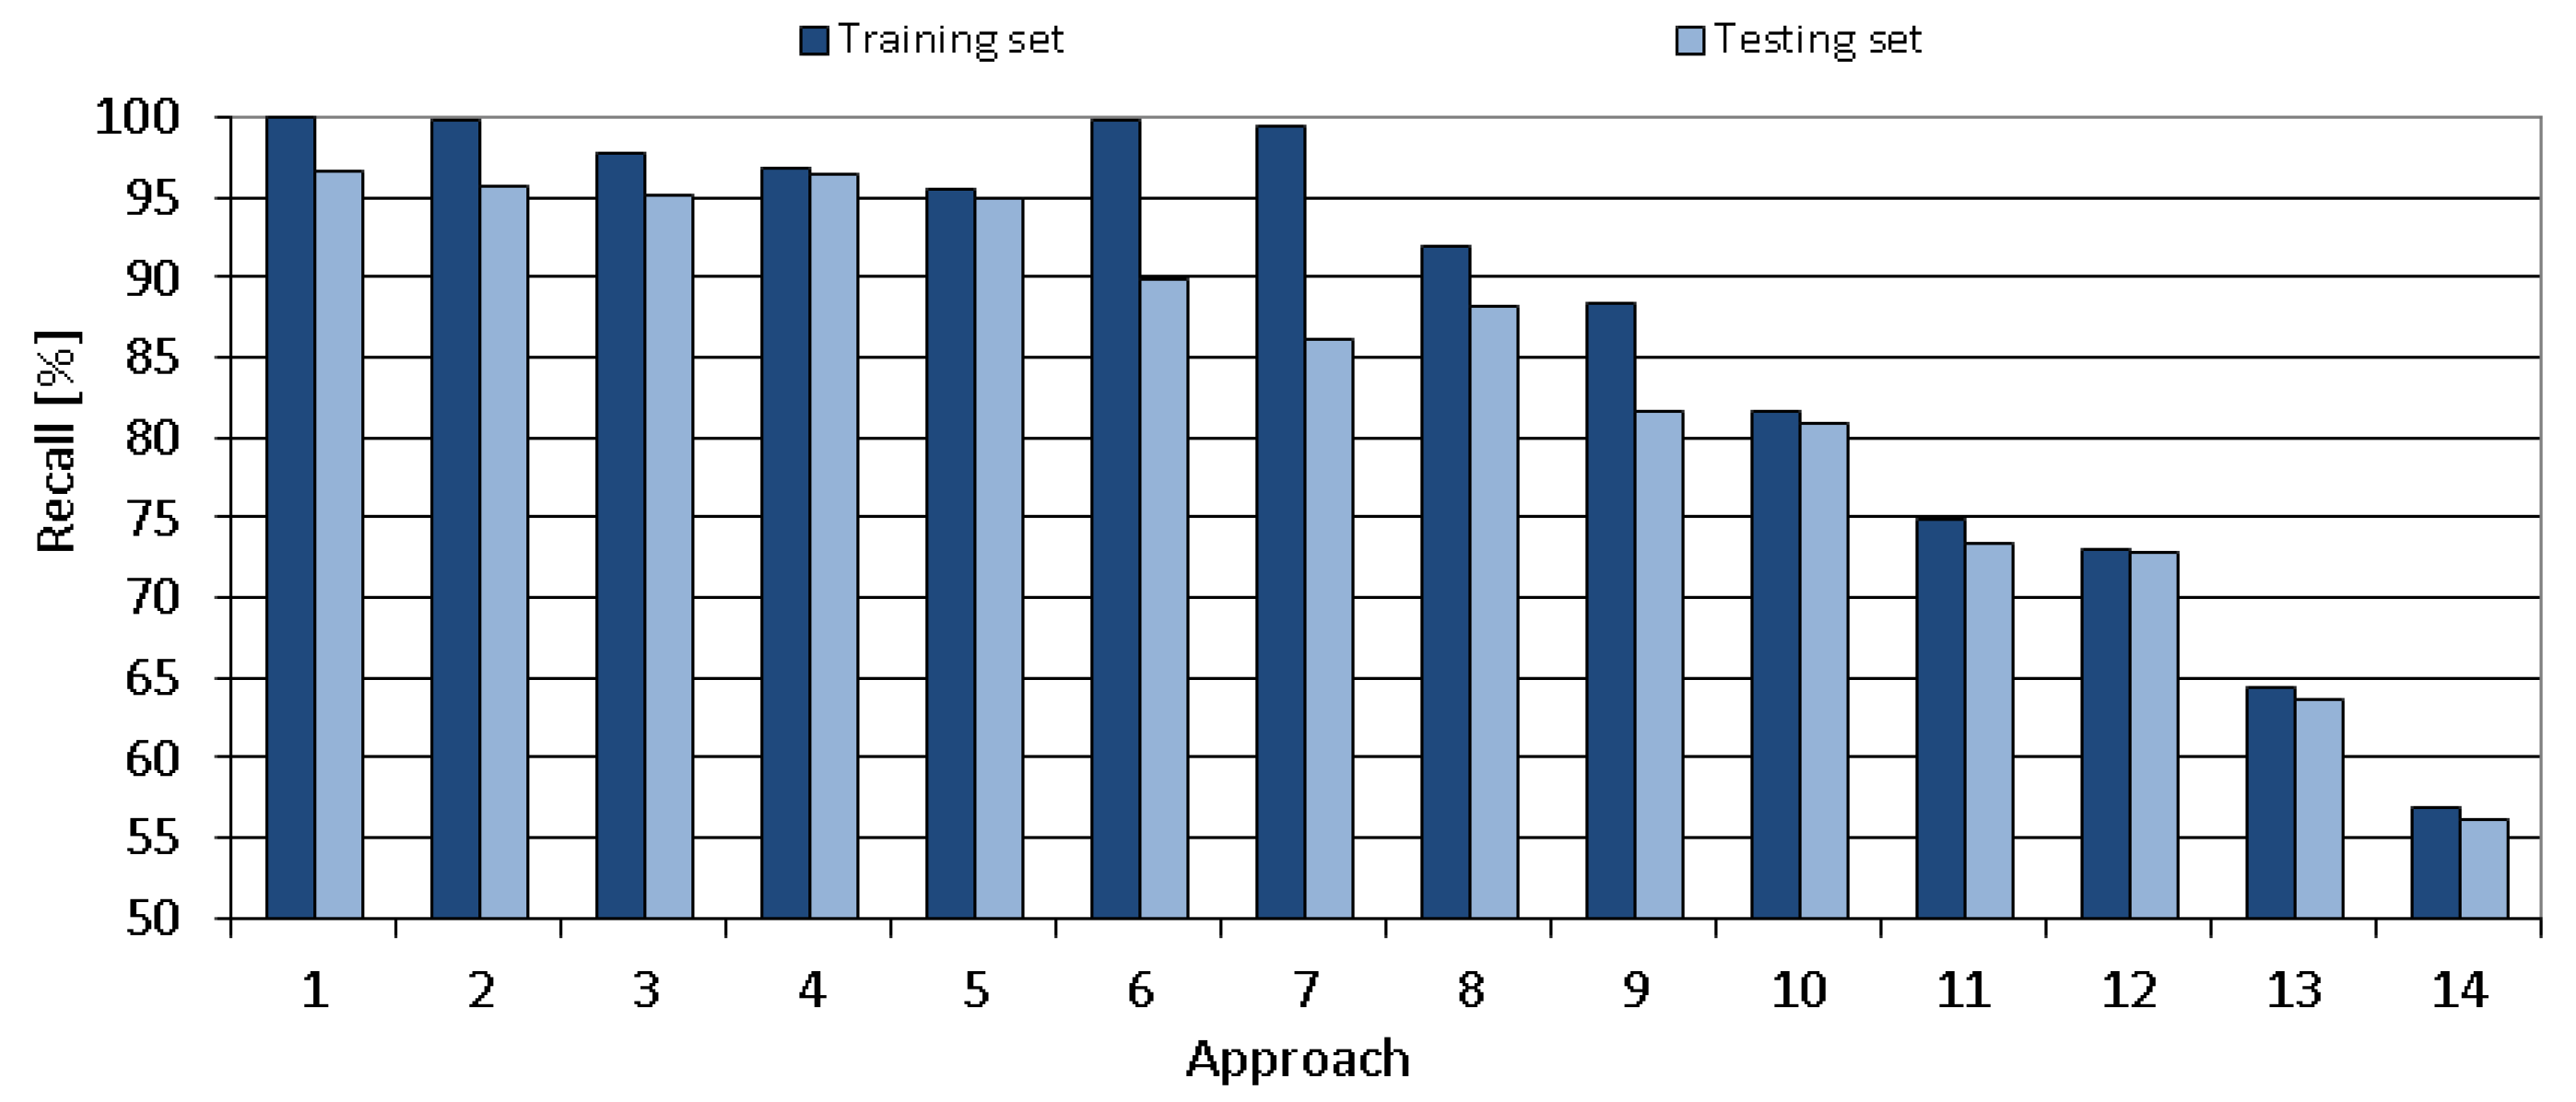
4.1. Masked Face Classifier Tuning
The K-means masked face classifier was trained and tested with different parameters and filtering methods in order to create a model with the best results possible. Tested approaches are described in the
Table 5. There were 14 tuning approaches with three varying parameters: the number of centroids, filtering method and whether the subset of the masked face set was used. The amount of centroids that was tested was in the range 2–4 due to the existence of two major dataset classes (correctly masked face and incorrectly masked face) and four total dataset subclasses (correctly masked face, incorrectly masked face-mouth and nose uncovered, incorrectly masked face-nose uncovered, incorrectly masked face-chin uncovered) in order to check which value gave the best results. Four types of filtering were tested. The first filtering method was composed of a downscaling module that outputs a. 32 × 32 px image, the calculation of an intermediate color value with
, a color-enhancing module sensitive only to the face mask color range, and a thresholding module with a threshold of 240. The second filtering method is composed of downscaling module that outputs 32 × 32 px image, calculation of intermediate color value with
, a color-enhancing module sensitive to the face mask color range and less sensitive to other color ranges, and a thresholding module with threshold levels of 160, 192, and 240. The third filtering method was composed of a downscaling module that outputs a 32 × 32 px image, calculation of an intermediate color value with
and thresholding module with a threshold levels of 160, 176, 192, 208, 224 and 240. The fourth filtering method was composed of a downscaling module that outputs a 32 × 32 px image. The first two described filters were designed to take advantage of the fact that most of the face masks were cyan. The third filter did not have a color-enhancing module sensitive to the face mask color range in order to discover the importance of this module in results. The fourth filter only downscaled the image and was the only filter that resulted in a non-grayscale image. It was also introduced in order to discover the performance of other filtering operations (calculating intermediate value and thresholding).
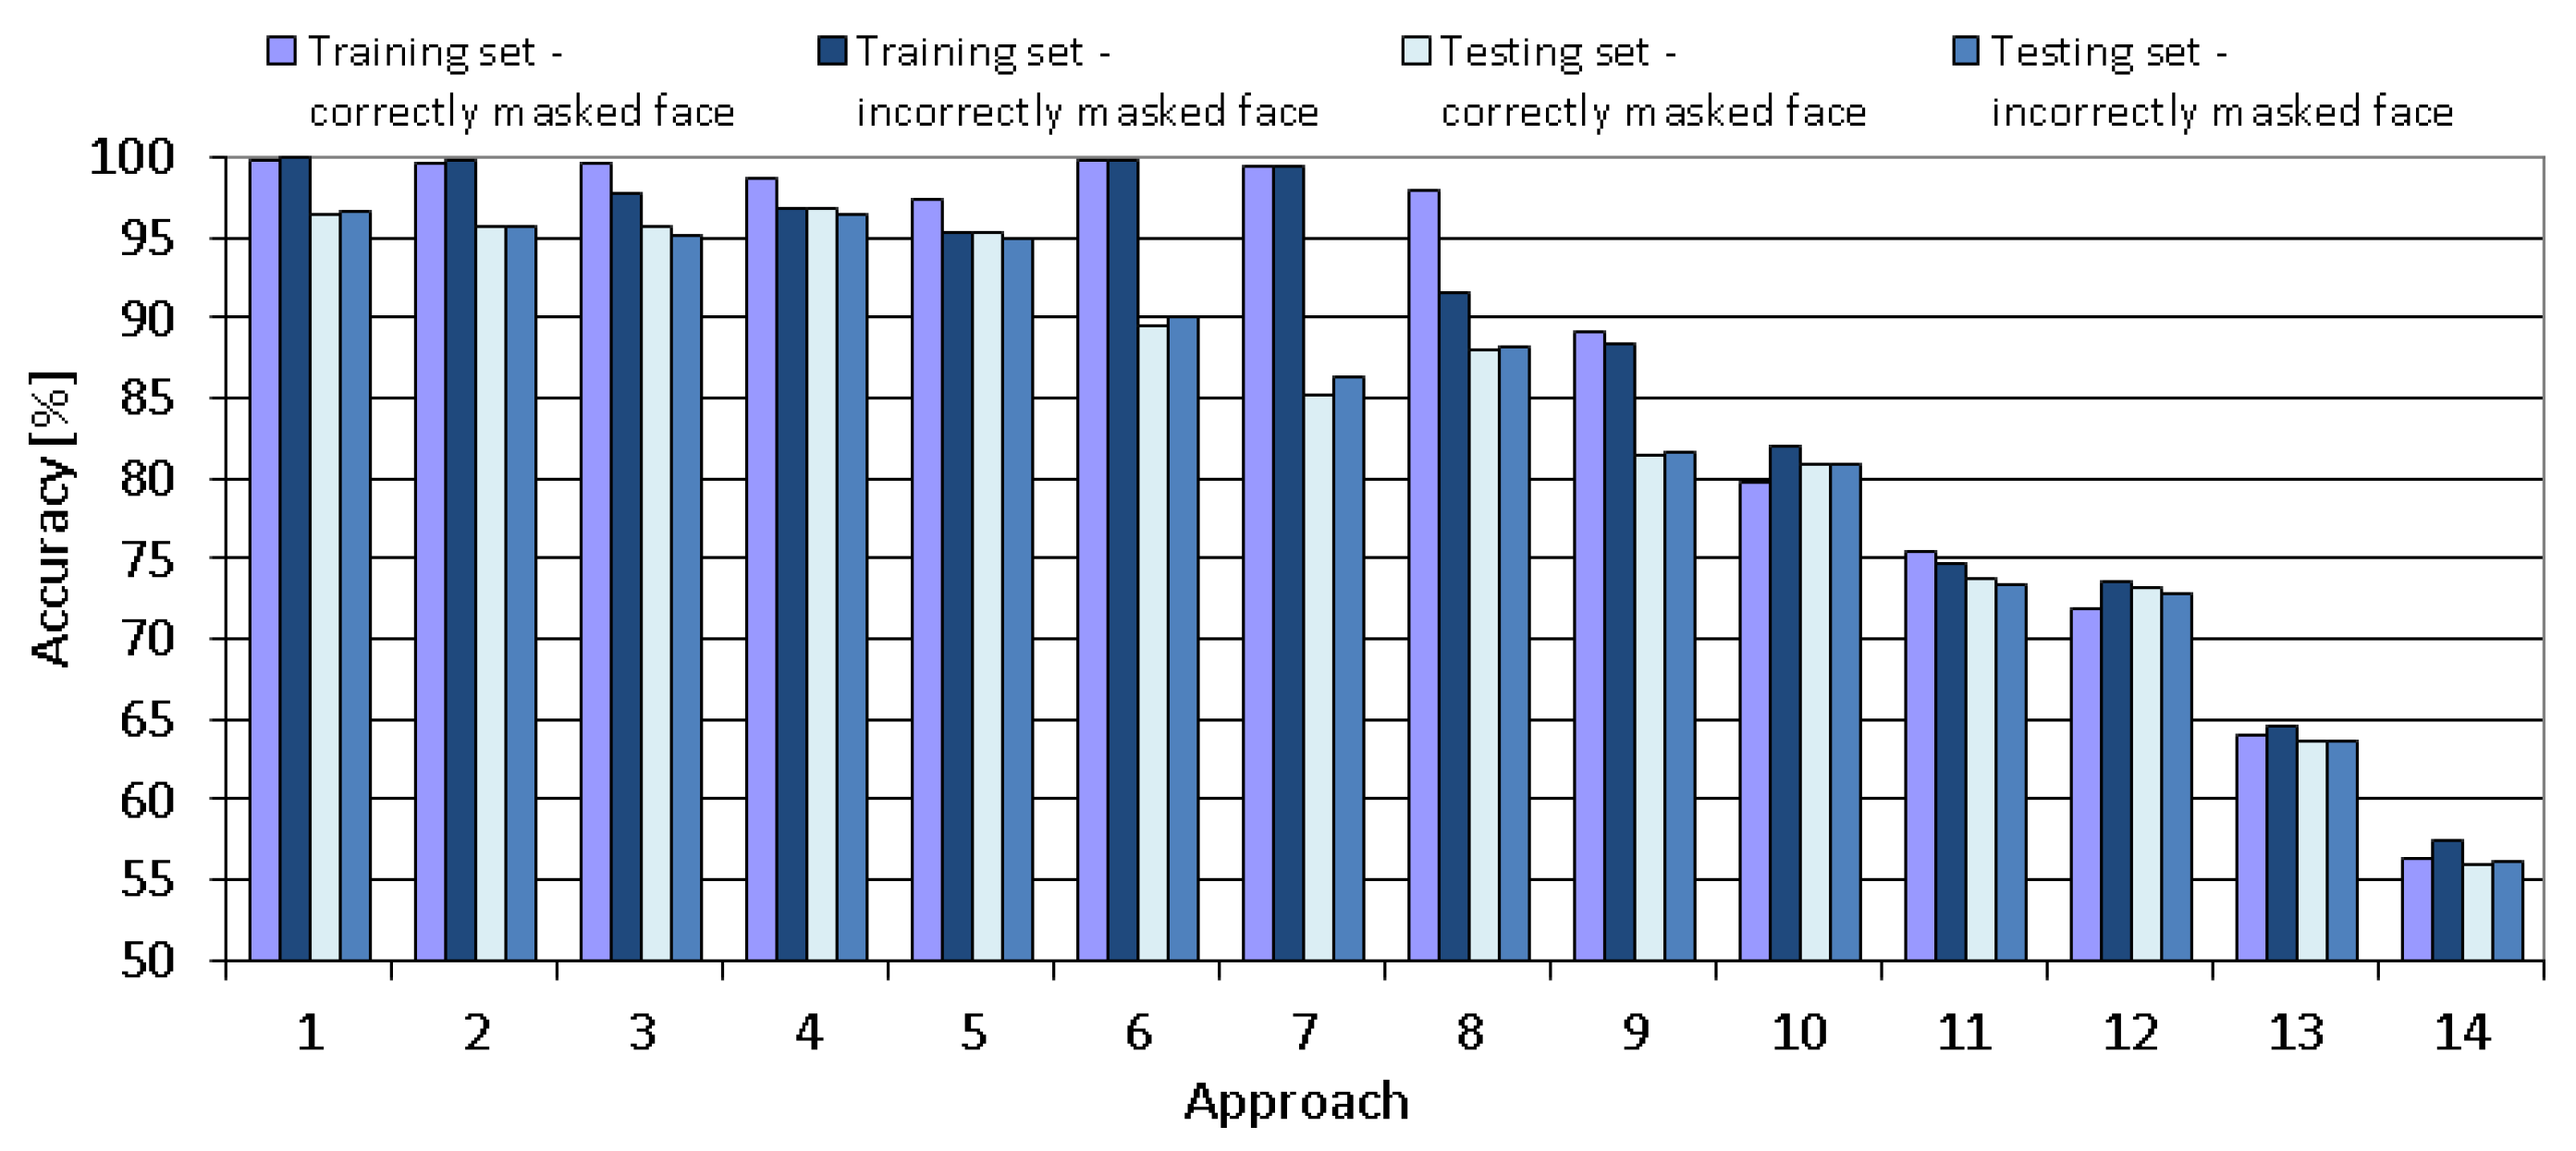
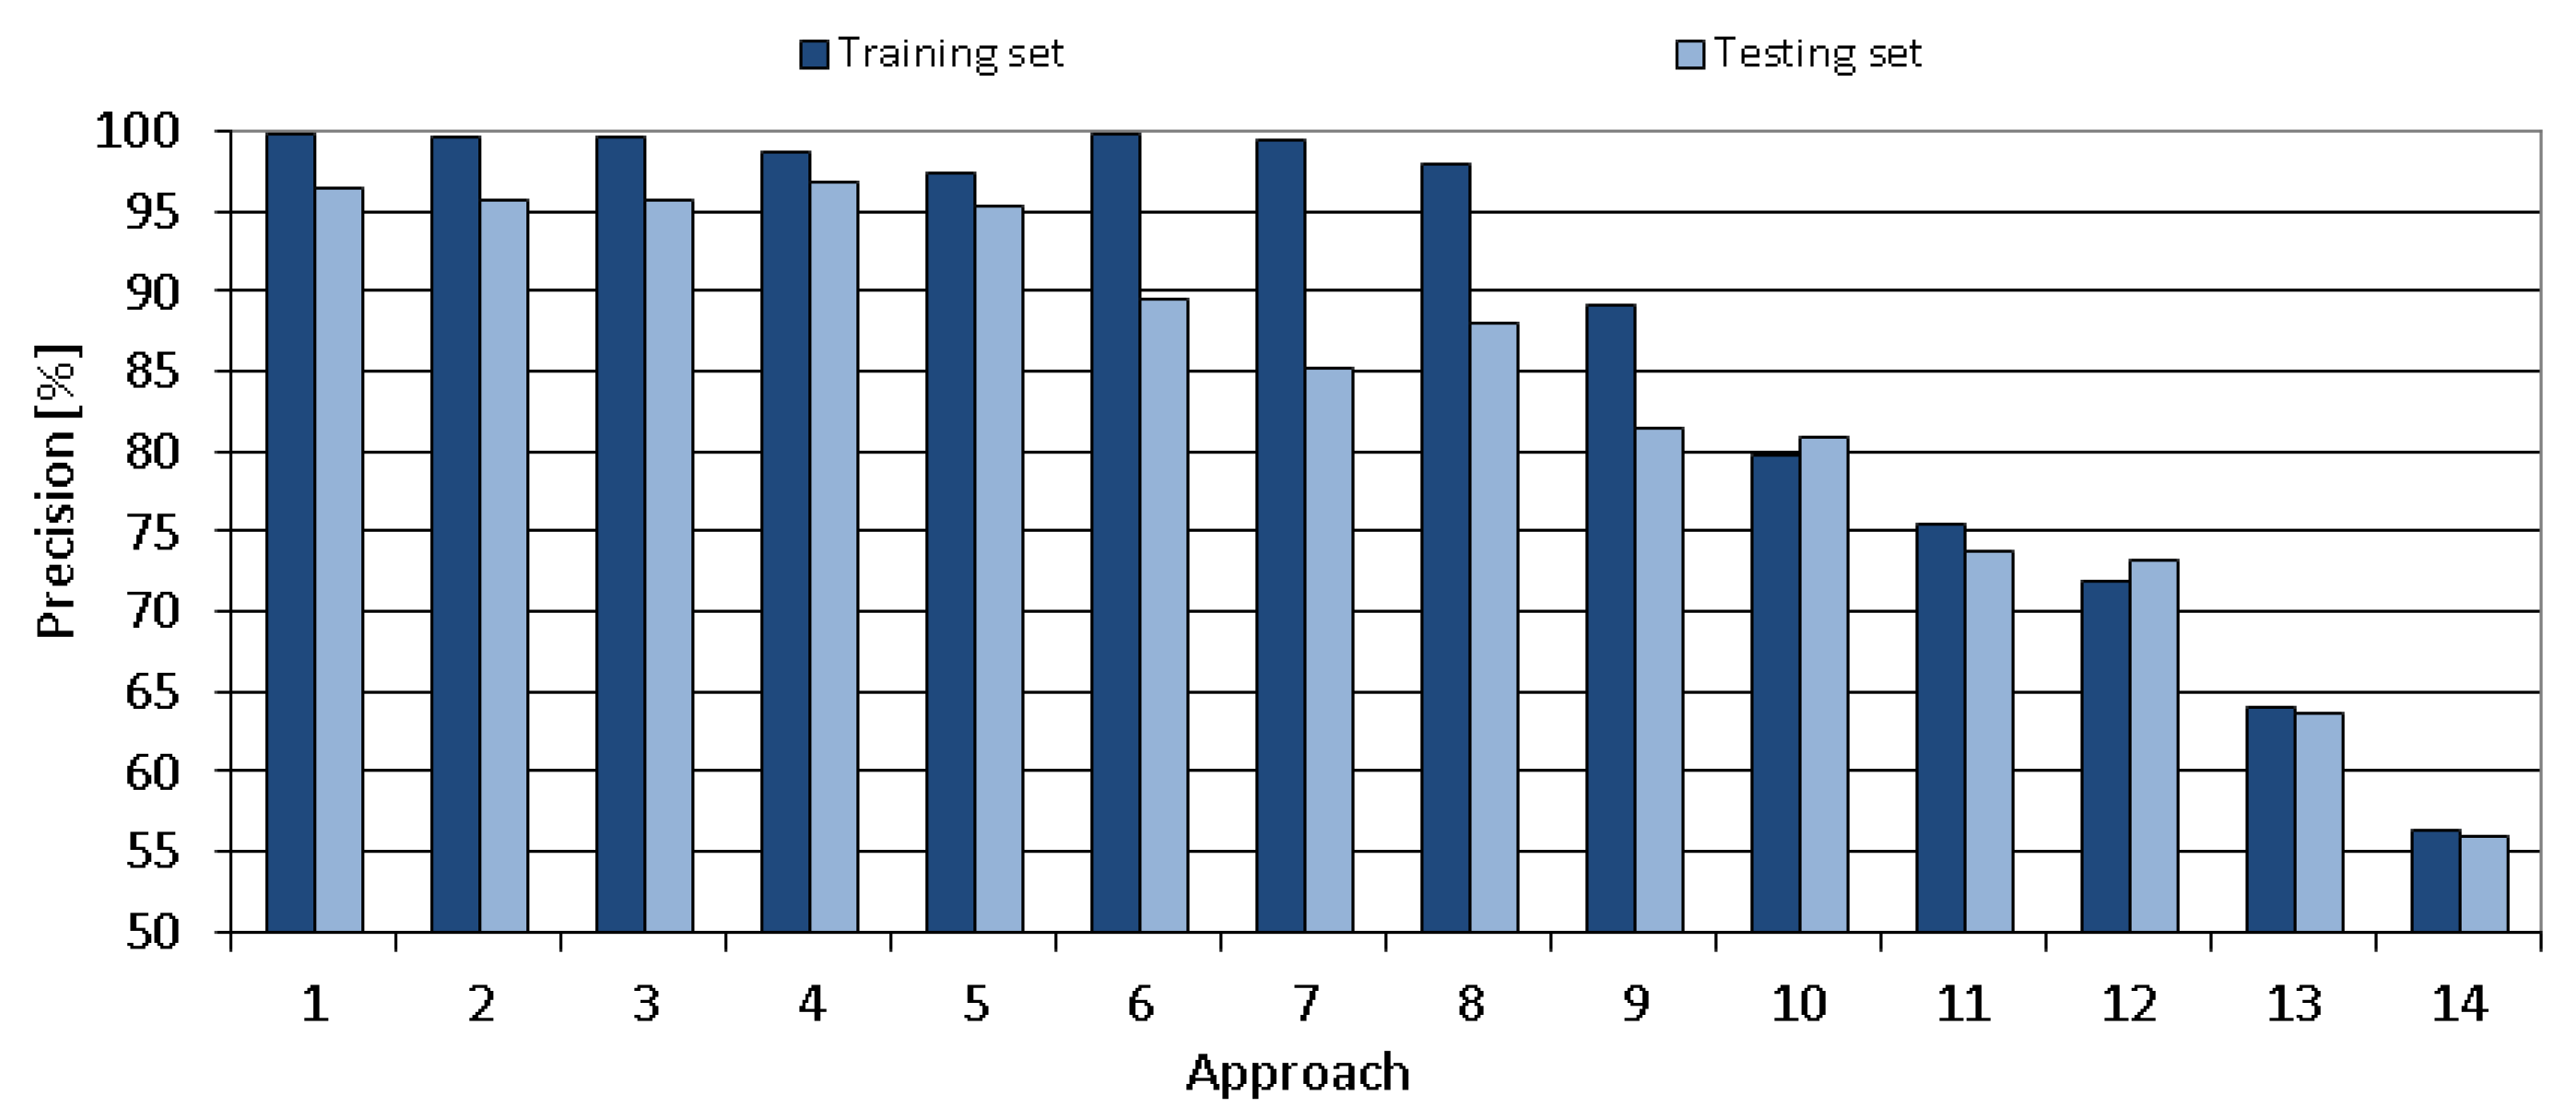
The comparison of all proposed tuning approaches is shown in
Figure 12,
Figure 13,
Figure 14,
Figure 15 and
Figure 16 that present the obtained results of the following metrics: accuracy, TPR, TNR, precision and recall, respectively. As seen in the mentioned Figures, the metrics vary significantly between the tested approaches. The obtained results for the chosen approach (number 4) are of very high-quality.
The comparison of filtering methods is shown in the
Figure 17. The approach numbers 1, 2, 3, 6 and 7 use a subset consisting only of the images where masks are worn on the chin and a similar amount of randomly chosen images where masks are worn correctly. This results in a subset of size 12,226 instead of the complete dataset of 137,013 images. The subset was used to discover the difference in results between “easy data” consisting of only two dataset subclasses (correctly masked face and incorrectly masked face-mouth and nose uncovered; the subclasses are balanced in size) and the full dataset.
Listing 5.
Alternative filtering of the MaskedFace-Net [
30,
31] dataset-method 1.
Listing 5.
Alternative filtering of the MaskedFace-Net [
30,
31] dataset-method 1.
Downscaling the image containing a face to 32 × 32 px Calculating the intermediate color value using the procedure: value = max(R, G, B) As most of the face masks were cyan, the intermediate color value was changed according to the procedure: if (B > G && G > R) value += 50 else if (value > 200) value -= 50 if (value > 255) value = 255 Applying the threshold filter to the intermediate values with the boundary values of 160, 192 and 240 with the procedure: if (value < 160) value = 0 else if (value < 192) value = 85 else if (value < 240) value = 170 else value = 255
|
Listing 6.
Alternative filtering of the MaskedFace-Net [
30,
31] dataset-method 2.
Listing 6.
Alternative filtering of the MaskedFace-Net [
30,
31] dataset-method 2.
Downscaling the image containing a face to 32 × 32 px Calculating the intermediate color value using the procedure: value = max(R, G, B) Applying the threshold filter to the intermediate values with the boundary values of 160, 176, 192, 208, 224 and 240 with the procedure: if (value < 160) value = 0 else if (value < 176) value = 42 else if (value < 192) value = 85 else if (value < 208) value = 127 else if (value < 224) value = 170 else if (value < 240) value = 212 else value = 255
|
The results of all analyzed 14 approaches were validated using the Analysis of Variance (ANOVA) test. For each analyzed approach, we applied the bootstrapping method to obtain 30 results of the accuracy metric. The ANOVA test of the obtained results is shown in
Table 6. According to the reported values, the null hypothesis is rejected, that is, there is sufficient evidence to conclude that not all of the means of analyzed 14 approaches are equal and that there are statistical differences between the tested approaches. Based on the obtained results, the model from Approach 4 was chosen as the best masked face classifier due to the fact that this model performed the best in the test results, accurately classifying the correctly masked face, while being able to achieve almost the best results for accurately classifying the incorrectly masked face, even if only the nose was uncovered. To verify the performance of Approach 4, we made the
t-test comparing Approach 4 against other approaches. In all cases, the obtained
p-value is <0.00001, which means that the differences between the results of Approach 4 and results of other approaches are significant. Therefore, in the remainder of the paper, we present results are obtained using Approach 4.
4.2. Sliding Window Tuning
The sliding window technique can be tuned in two ways—either by maximizing speed, or maximizing accuracy. By using more window sizes, the amount of passes through the image rises, especially with smaller window sizes. With this approach, objects of more sizes can be detected, increasing accuracy. By using less window sizes, the amount of passes through the image falls, trading accuracy for speed. Similar observations can be noticed by modifying the stride value, lowering the stride translates into more window positions, increasing accuracy, and lowering speed, while increasing the stride translates into less window positions, decreasing accuracy and increasing speed. The sliding window parameters were chosen to achieve enough detection coverage while keeping the time relatively low.
4.3. System Accuracy
4.3.1. Masked Face Classification
The masked face classification accuracy results are shown in
Table 7. The results presented here are results of Approach 4 chosen in the tuning section (refer to
Section 4.1). There are values present for correct detection of the correctly masked face, correct detection of the incorrectly masked face, the True Positive Rate (TPR), True Negative Rate (TNR), precision and recall. Considering the fact that all of these values are over 96% and that the dataset classes are balanced in terms of sample amount, this translates into a high-quality classifier.
4.3.2. Face Detection
The face detection metric values are shown in the
Table 8. As with the masked face classification, there are values present for correct detection of the face, correct detection of the non-face, TPR, TNR, precision and recall. As all of these values are over 79%, this also translates into a high-quality classifier, although not as high as the masked face classifier.
Using the acquired data, the time required to detect a face was calculated by multiplying the amount of the window positions with appropriate downscaling time and adding the amount of the window positions multiplied by the K-means processing time, consisting of the grayscale conversion and K-means classification. The results for the proposed window sizes are shown in the
Table 9.
Depending on the device mounting position, one of the proposed window sizes can be used. Smaller window size allows the detection of the face in the scenario where the examined person is standing farther away from the camera, but at the cost of higher computation time. A bgger window size can be used in situations where the examined person is standing closer to the camera, resulting in a shorter computation time.
4.3.3. Total System Accuracy
Taking the results from the
Table 7 and
Table 8, and also considering the fact that the accuracy of the system composed of two systems connected in series is the product of multiplication of the subsystem accuracies, the total system accuracy is shown in the
Table 10. Considering the fact that both accuracy values are over 79%, this system has good-quality predictions.
4.4. Energy Consumption
The amount of consumed energy can be calculated using the Formula (
3).
where E-energy, P-power and t-time. The power can be calculated using the Formula (
4).
where U-voltage and I-current. The Formulas (
3) and (
4) can be combined together, forming the Formula (
5).
As the time required to detect a face in image depends on the chosen window size, the results are shown in the
Table 11. The STM32F411 microcontroller is powered by 3.3 V DC voltage and consumes around 10 mA of current. The time required to classify a masked face is equal to 9.75 ms.
4.5. TinyML Battery Life
Considering the calculated amount of energy required for one face mask operation, the battery life can be estimated. The 18650 battery with a typical capacity of 2500 mAh and nominal voltage of 3.7 V will be used for calculations. As there are high-efficiency power supply chips available with several μA of quiescent current and over 90% efficiency, for example, for TPS63806, the energy loss can be pessimistically modeled as 10%. The singular face mask operation energy consumption results are shown in
Table 12.
Considering the power consumption of the microcontroller, the system could continuously operate for 225 h. With the example of shops visited by 5000 customers every day, the proposed system uptime without recharging the battery is shown in
Table 13. This is especially important, as our low-power design makes the mounting of the proposed system possible wherever it is needed, regardless of the presence of mains power. In the example with a shop, it would be inconvenient to install the mains power cables on market shelves, where the proposed system could be mounted.
5. Conclusions
According to the measurements and results shown in this paper, we have shown that it is possible to create an energy-efficient battery-operated system capable of executing complex computer vision tasks in a reasonable time with a low amount of available resources by using carefully selected methods and algorithms. This approach can help to reduce the energy usage of the intelligent sensor grids, as well as to decrease the network traffic by replacing cloud computing where it is worthwhile.
It should be underlined that taking the existing ML and TinyML studies and devices into account, to the best of our knowledge, there are no TinyML research papers nor devices with the resources comparable to the STM32F411 microcontroller that was used to implement complex computer vision tasks. Meanwhile, there exist research papers handling the topic of such tasks, yet with the use of overly powerful processors with more than enough resource memory and computational capabilities, resulting in higher cost and excessive power consumption of such devices in comparison to the proposed solution.
The main conclusion of this paper is that it is possible to create a cost-effective and battery-operated TinyML system with a long uptime and that provides satisfactory results of masked face classification. In more detail, we created the TinyML system consisting of K-means supported by a sliding window face detection module, a carefully designated preprocessing filter that is responsible for feature extraction, and a K-means masked face classifier. The preprocessing filter transforms the detected face into a downscaled 32 × 32 px image that is converted to intermediate values and passed to the thresholding stage. After unfolding, this results in a feature vector with 1024 dimensions. Our proposed TinyML system solution managed to deliver very high-quality metric values, with accuracy, TPR, TNR, precision and recall being over 96% for masked face classification, while being able to reach up to 145 days of uptime using a typical 18650 battery with a capacity of 2500 mAh and nominal voltage of 3.7 V. The results were achieved using a STM32F411 microcontroller with 100 MHz ARM Cortex M4, which proves that execution of complex computer vision tasks is possible on such low-power devices. It should be noted that the STM32F411 microcontroller draws only 33 mW during the operation. The accuracy of the whole system is over 79%.
There is still room for improvement—future work may include face detection accuracy enhancement and face detection speedup. Further work can also cover other classification algorithms and methods in combination with different preprocessing methods, as well as the research of other hardware platforms that are capable of fulfilling the strict limitations of TinyML.


