Article

Effect of the Extended Rigid Flapping Trailing Edge Fringe on an S833 Airfoil

Department of Mechanical and Materials Engineering, Wright State University, Dayton, OH 45435, USA
*
Author to whom correspondence should be addressed.
Appl. Sci. 2022, 12(1), 444; https://doi.org/10.3390/app12010444
Submission received: 13 October 2021 / Revised: 13 December 2021 / Accepted: 29 December 2021 / Published: 3 January 2022
(This article belongs to the Special Issue New Advances in Fluid Structure Interaction)

Abstract

:
A 2D numerical simulation was conducted to investigate the effect of an extended rigid trailing edge fringe with a flapping motion on the S833 airfoil and its wake flow field, as an analogy of an owl’s wing. This study aims to characterize the influence of the extended flapping fringe on the aerodynamic performance and the wake flow characteristics downstream of the airfoil. The length (Le) and flapping frequencies (fe) of the fringe are the key parameters that dominate the impact on the airfoil and the flow field, given that the oscillation angular amplitude is fixed at 5°. The simulation results demonstrated that the airfoil with an extended fringe of 10% of the chord at a flapping frequency of fe = 110 Hz showed a substantial effect on the pressure distribution on the airfoil and the flow characteristics downstream of the airfoil. An irregular vortex street was predicted downstream, thus causing attenuations of the vorticities, and shorter streamwise gaps between each pair of vortices. The extended flapping fringe at a lower frequency than the natural shedding vortex frequency can effectively break the large vortex structure up into smaller scales, thus leading to an accelerated attenuation of vorticities in the wake.

1. Introduction

For decades, the quiet flight of owls has drawn interest from researchers in the aerodynamic and aeroacoustics fields. Owl-wing-inspired modifications on either leading-edge or trailing-edge designs have attracted plenty of research interest aiming to improve the aerodynamic performance and/or, in the meanwhile, suppress the aerodynamic noise from airfoils or turbine/fan blades. Multiple bio-inspired airfoil designs have been evaluated, including the trailing-edge or leading-edge serrations, trailing-edge flaplets, flapping wings, the compliant surface, and the flexible trailing-edge fringe, etc. [1,2,3,4,5,6,7,8,9]. It has been found that the soft trailing edge fringe can attenuate the primary noise source generated from the trailing edge through the modification of the coherent scattering mechanism. Consequently, aeroacoustic noise above 2 kHz can be effectively attenuated by the compliant surface covered by the down feathers through a bypass dissipation mechanism [10,11]. In the last decade, the use of an owl-wing-inspired trailing edge design as a passive control approach for an airfoil model to minimize drag and improve lift coefficients has gained attention [12,13,14,15,16].
The brush-like trailing edge has been utilized as the trailing edge extension to reduce both the narrowband bluntness noise and broadband turbulent boundary-layer trailing-edge noise, as it contains the characteristics of both porosity and flexibility as the natural fringe [17,18,19,20,21]. A remarkable noise reduction was observed for an airfoil with a flexible trailing edge equipped to the suction side of the airfoil experimentally [21]. The attachment of flaplets on the trailing edge of an airfoil has clearly shown reductions in tonal noise, primarily resulting from the generation of small-scale vortices by the flaplets [22].
Recently, Murayama et al. (2021) carried out an experiment to study the effects of flexible flaps with various gaps on the aerodynamic characteristics of a fixed-wing [23]. The results indicated that the adjustable flaps enabled the suppression of the large-scale vortex shedding, and thus, reduced the fluctuation of aerodynamic forces. This finding is consistent with our experimental findings of an airfoil with soft feathers installed on the trailing edge [24]. Our previous experiment demonstrated that the real bird feather enabled the large-scale vortex to break up into small-scale turbulence. It is illustrated that the vibrating porous feather fringe produces a significant vertical velocity in the flow field around the trailing edge. As a result, it suppressed the leading-edge vortices approaching the flexible tail, and accelerated the shedding vortices’ dissipation. Additionally, Yu et al. (2020) performed computational fluid dynamics (CFD) simulations on an airfoil with an extended trailing-edge fringe [25]. The effects of the fringe lengths and flapping frequencies on shedding vortices have been investigated. The flapping behavior with a certain length and frequency can attenuate the strength of the vortices, and improve the aerodynamics in terms of reducing the drag coefficients, and increasing the lift coefficients. The abovementioned studies aimed at improving the aerodynamics of an airfoil, and reducing the noise. The flapping trailing edge fringe can be applied to wind turbine blades and airplanes to improve noise reduction from the aerodynamic perspective.
In this study, to leverage the influence of the extended flapping trailing edge fringe on the aerodynamic performance of the airfoil, CFD simulations are performed for the S833 airfoil with an extended flapping trailing edge fringe. This numerical simulation model is different from our previous experimental study. First, the experimental model was equipped with real feathers at the trailing edge of the airfoil as a passive flow control without any controlled flapping motion. Due to the complexity of the real feather structure, the porosity, and the biological material properties, such numerical studies haven’t been conducted yet. In this work, a simplified bare fringe without any porosity in a 2D fashion, together with specific flapping motions working as an active control, is adopted in the numerical modeling. In the simulation, three fringe lengths (Le) at four different flapping frequencies (fe) are evaluated thoroughly. The analysis focuses on the flapping-induced changes on the Q-criterion and velocity distributions within the flow field, and the aerodynamic pressure distributions over the airfoil.

2. Materials and Methods

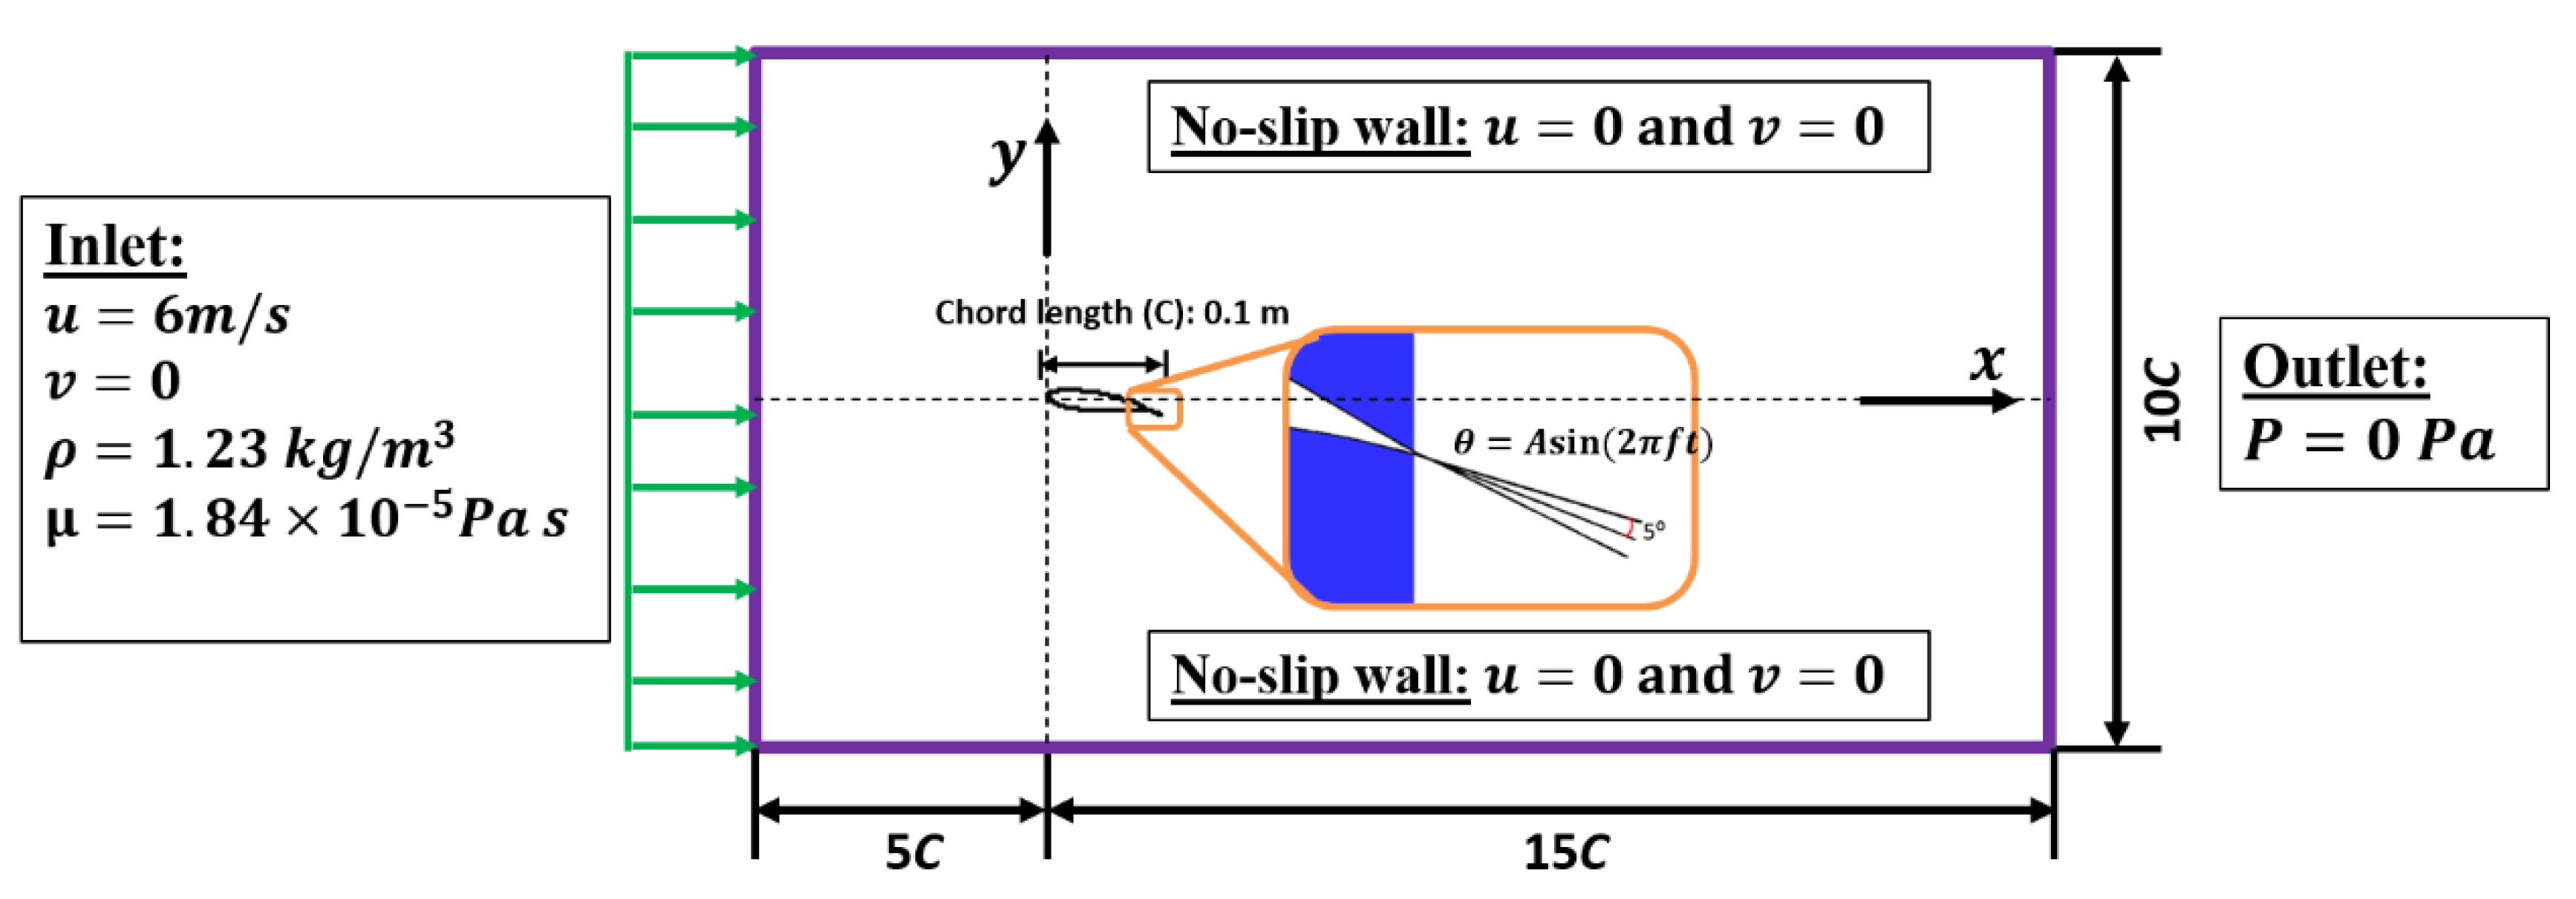
2.1. Computational Model

The NREL’s S833 airfoil has been extensively used to design wind turbine blades [26]. However, with the rapid development of wind farms, noise emission has become a significant issue. The ultimate goal of this study is to explore a novel airfoil design to reduce the noise generation associated with the shedding vortices from wind turbine blades. Thus, the S833 airfoil is selected to investigate the aerodynamic interactions between the vortex shedding in the wake and the flapping fringe installed at the trailing edge. Two-dimensional CFD simulations are performed for the airfoil model. The dimensions and boundary conditions applied in simulations are shown schematically in Figure 1.
The rectangular area of the outside domain is 20C by 10C (C: the chord length of the airfoil), with 5C from the inlet to the leading-edge of the airfoil. The flow boundary conditions applied in the simulation are adopted from the parameters in our previous experimental study [24]. The upstream velocity is set at 6 m/s, and the density and viscosity of the air are assumed as 1.23 kg/m3 and 1.84 × 10⁻⁵ Pa s, respectively, to match the air property at room temperature. This boundary condition corresponds to a Reynolds number (Re) of 40,000, which is the same as the Re number evaluated in the experiment. This Re number falls within the range of the Re number of owls’ flight. The outlet boundary condition is defined as zero static pressure, and surfaces on the airfoil, as well as the top and bottom walls, are defined as non-slip wall conditions. The airfoil’s angle of attack is set at 9 degrees, which is also consistent with the experimental study [24]. The fringe length (Le) ranges from 8% to 12% of the chord, with a step increment of 2%. The flapping frequency (fe) ranges from 80 Hz to 170 Hz, with a step increment of 30 Hz. The initial fe is determined as the shedding vortex frequency (f) of the baseline bare airfoil model, which is 140 Hz, obtained via the power spectral density analysis of the velocity in the downstream wake [25]. The dynamic motion of the trailing edge fringe can be expressed as θ = Asin(2πft), where A is the amplitude flapping angle (A = 5°). The connection point of the flapping motion is fixed at the tip of the trailing edge.

2.2. CFD Simulations

In this work, three fringe lengths at four different flapping frequencies of the extended fringe were evaluated. These variables resulted in 12 simulation cases, and a bare airfoil model was also simulated as the baseline case. Simulations were performed using the CFD software Cradle SC/Tetra 2021 (Dayton, OH, USA). The computational software solves the N–S equations by using the finite volume method with hybrid computational grids, wherein hexahedral grids were generated as prism layers around the airfoil to capture the boundary layer behavior, and tetrahedral grids were generated in the rest of the region. A local mesh refinement technique (grids become coarser along the downstream direction) was adopted to resolve the flow around the flapping fringes installed at the trailing edge to save computational effort.
The turbulence model LKE K-KL-ω was adopted to evaluate the turbulence region over the airfoil. This model is one of the Reynolds-Averaged Navier–Stokes (RANS)-based approaches to predict the transitional flow [25,27,28]. In the LKE model, the energy of the disturbances in the pre-transitional region of a boundary layer is expressed as “Laminar Kinetic Energy”, whereas the turbulence energy is defined as k, and the transport equation of KL is solved with two equations of the fully turbulent model. The flow over the airfoil is governed by the Navier–Stokes equation for two-dimensional, viscous, incompressible flow. The continuity equation and the Reynolds-averaged N–S equations can be expressed as:
( ρ u i ¯ ) ( x i ) = 0
ρ D ( ρ u i ¯ ) D t = ( P ¯ ) ( x i ) + ( x i ) ( μ ( ( u i ¯ ) ( x j ) + ( u i ¯ ) ( x i ) ) ρ u i u j ¯
where i and j are coordinate indices; u is the velocity; x is the flow direction; ρ is the density of the fluid; μ is the dynamic viscosity of the fluid.
The dynamic motion of the fringe was fulfilled using the stretching mesh technique, as it enables the expansion and shrinking of the mesh elements to accommodate the movement of the solid boundary, which can avoid the pressure or velocity discontinuity/fluctuations at interfaces [25]. The CFD simulation, in terms of the turbulence model, grid sensitivity, and the dynamic moving mesh technique, has been validated statically by comparing static lift and drag coefficients with experiments, and dynamically, by comparing pressure contours for an oscillatory plunging motion of an airfoil with the literature reported in our previous study [25].
The numerical simulations were performed on a computational cluster containing 3.4 GHz AMD Phenom II X4 965 Quad-cores and 8 GB RAMs. Each case was run with 32 processors. In the current study, a total physical time period of 1.5 s of the flow was simulated with a time step of 5 × 10⁻⁵ s. The mean computational time for each simulation case was about 23 h.

3. Results and Discussion

The impact of the extended flapping fringe on the airfoil’s aerodynamics were studied primarily through the alterations in the distribution of the Q-criterion, velocities in the flow field, and pressure coefficients over the airfoil model. The variable Q-criterion quantifying the swirling vortex strength is defined as
Q = 1 2 [ ( u x ) 2 + ( v y ) 2 ] u y v x
where u is the instantaneous velocity in the x-direction, and v is the instantaneous velocity in the y-direction.

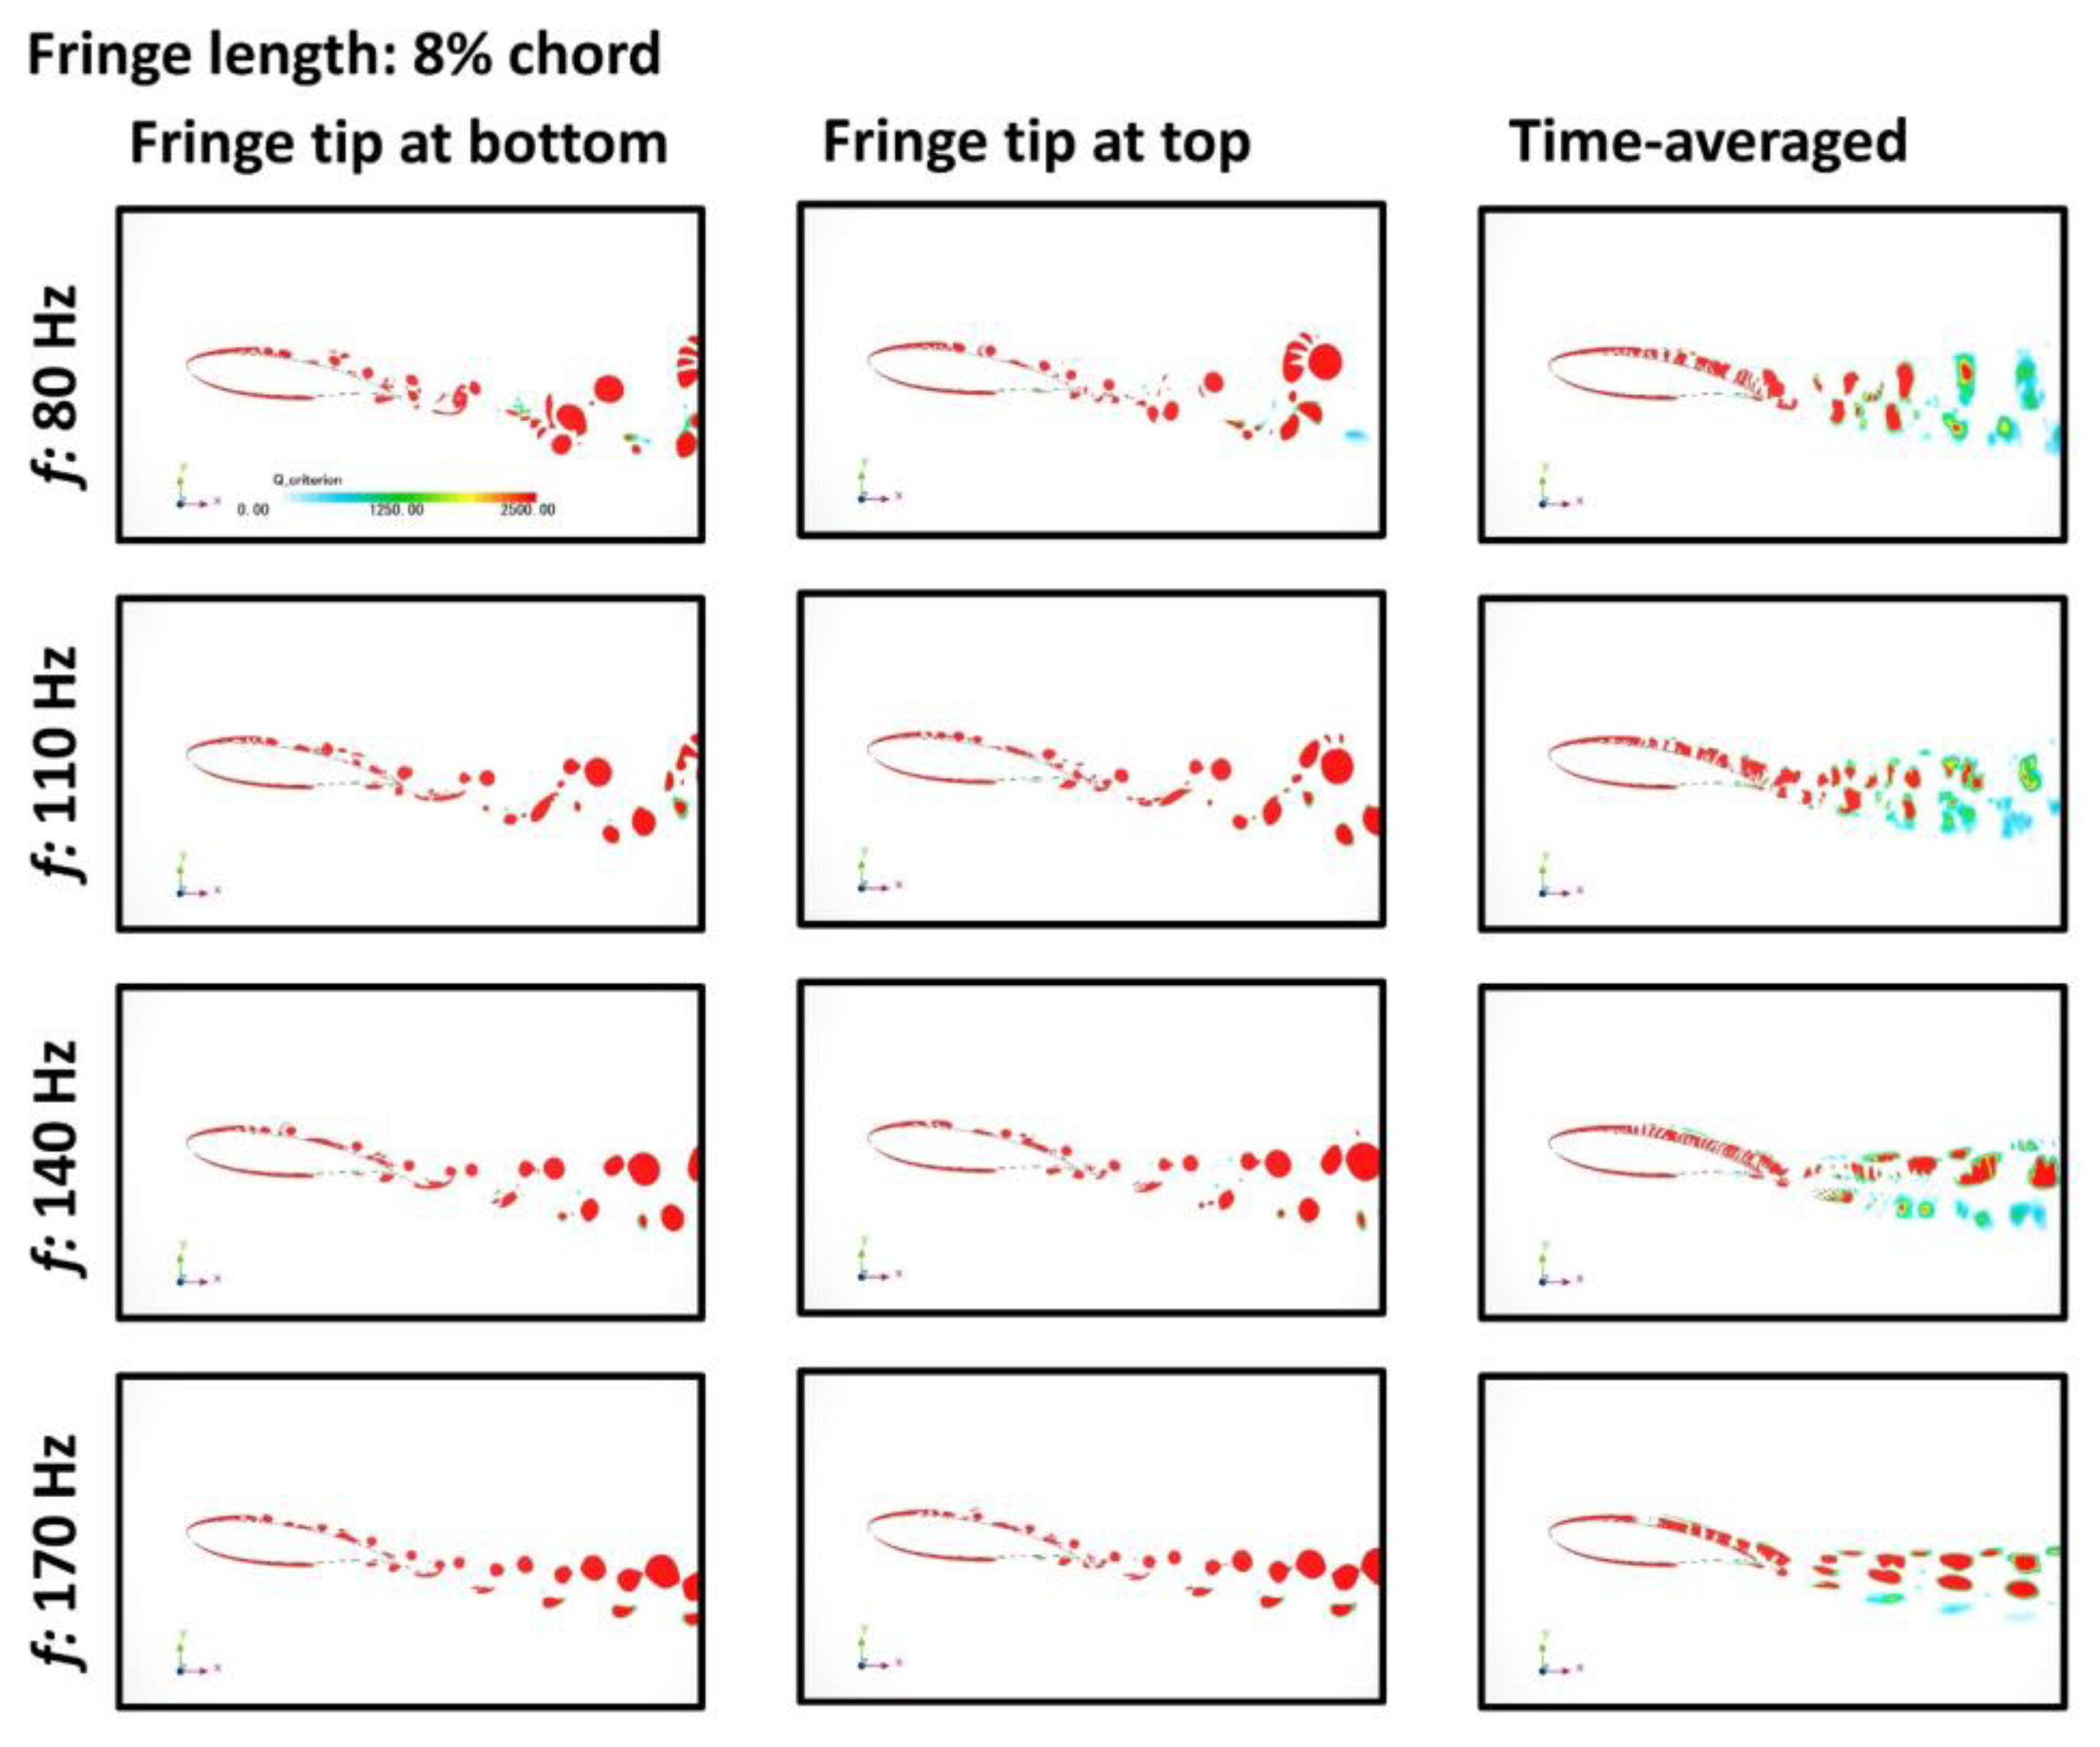
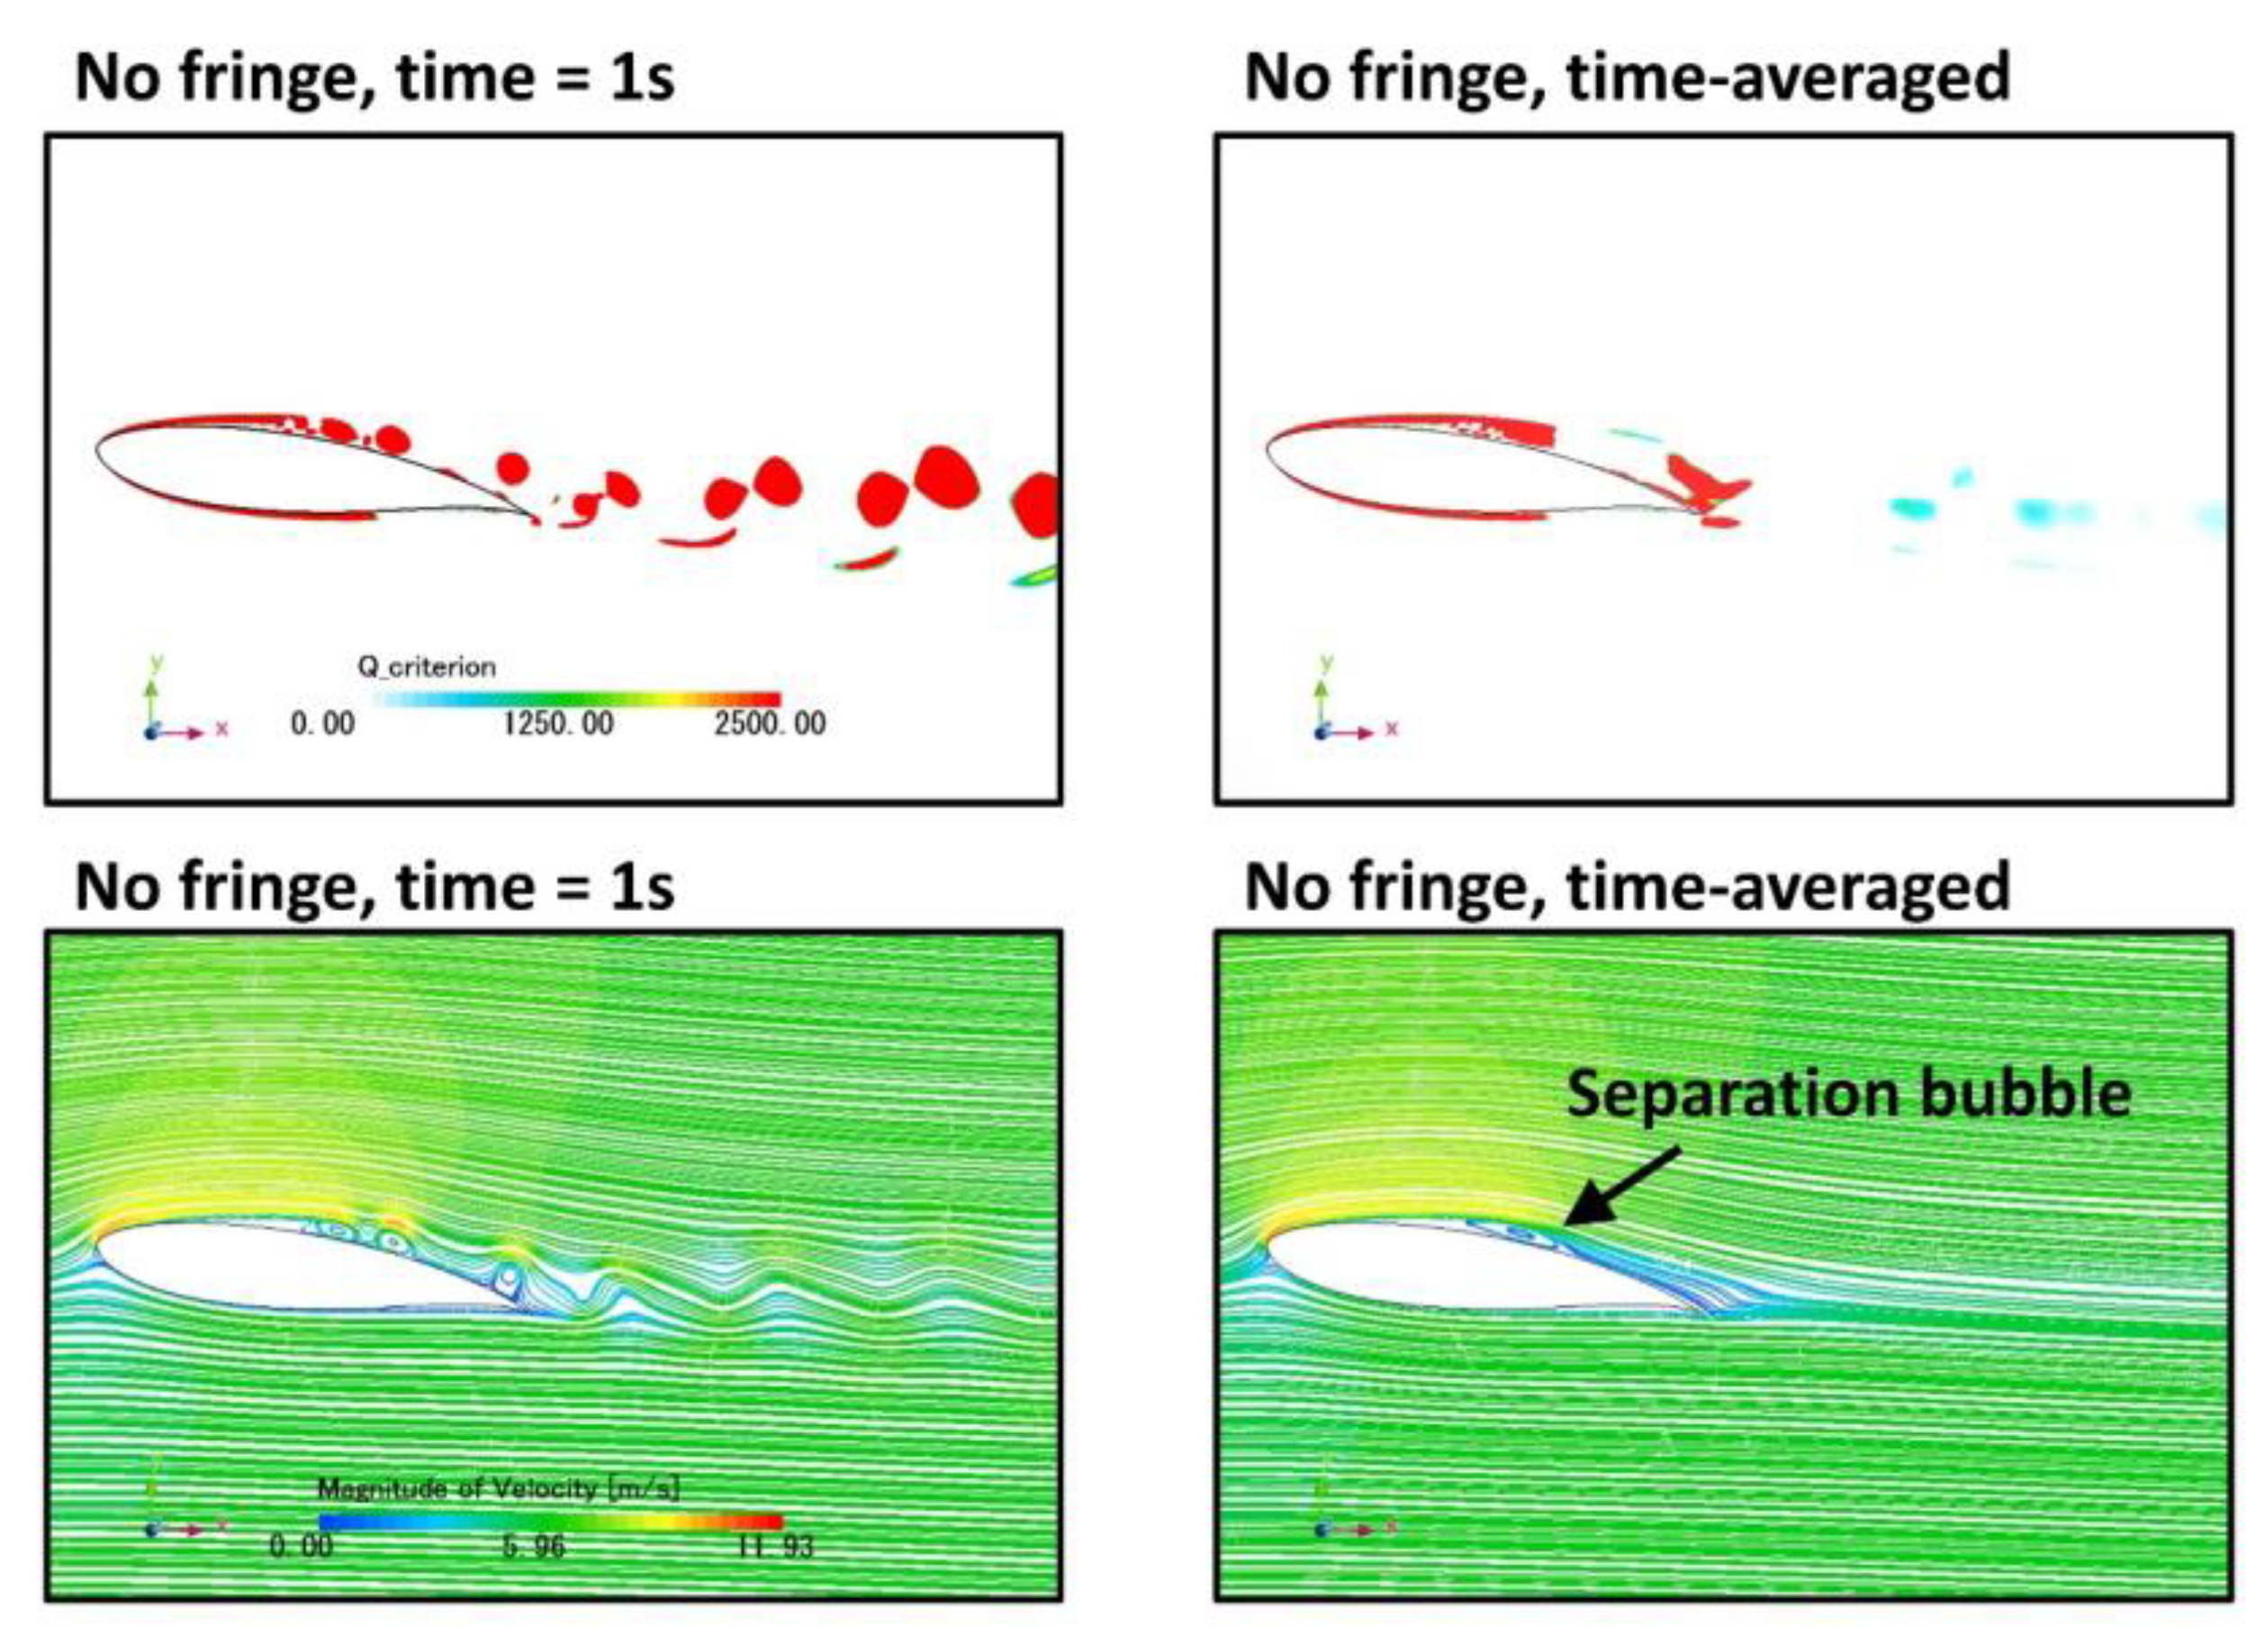
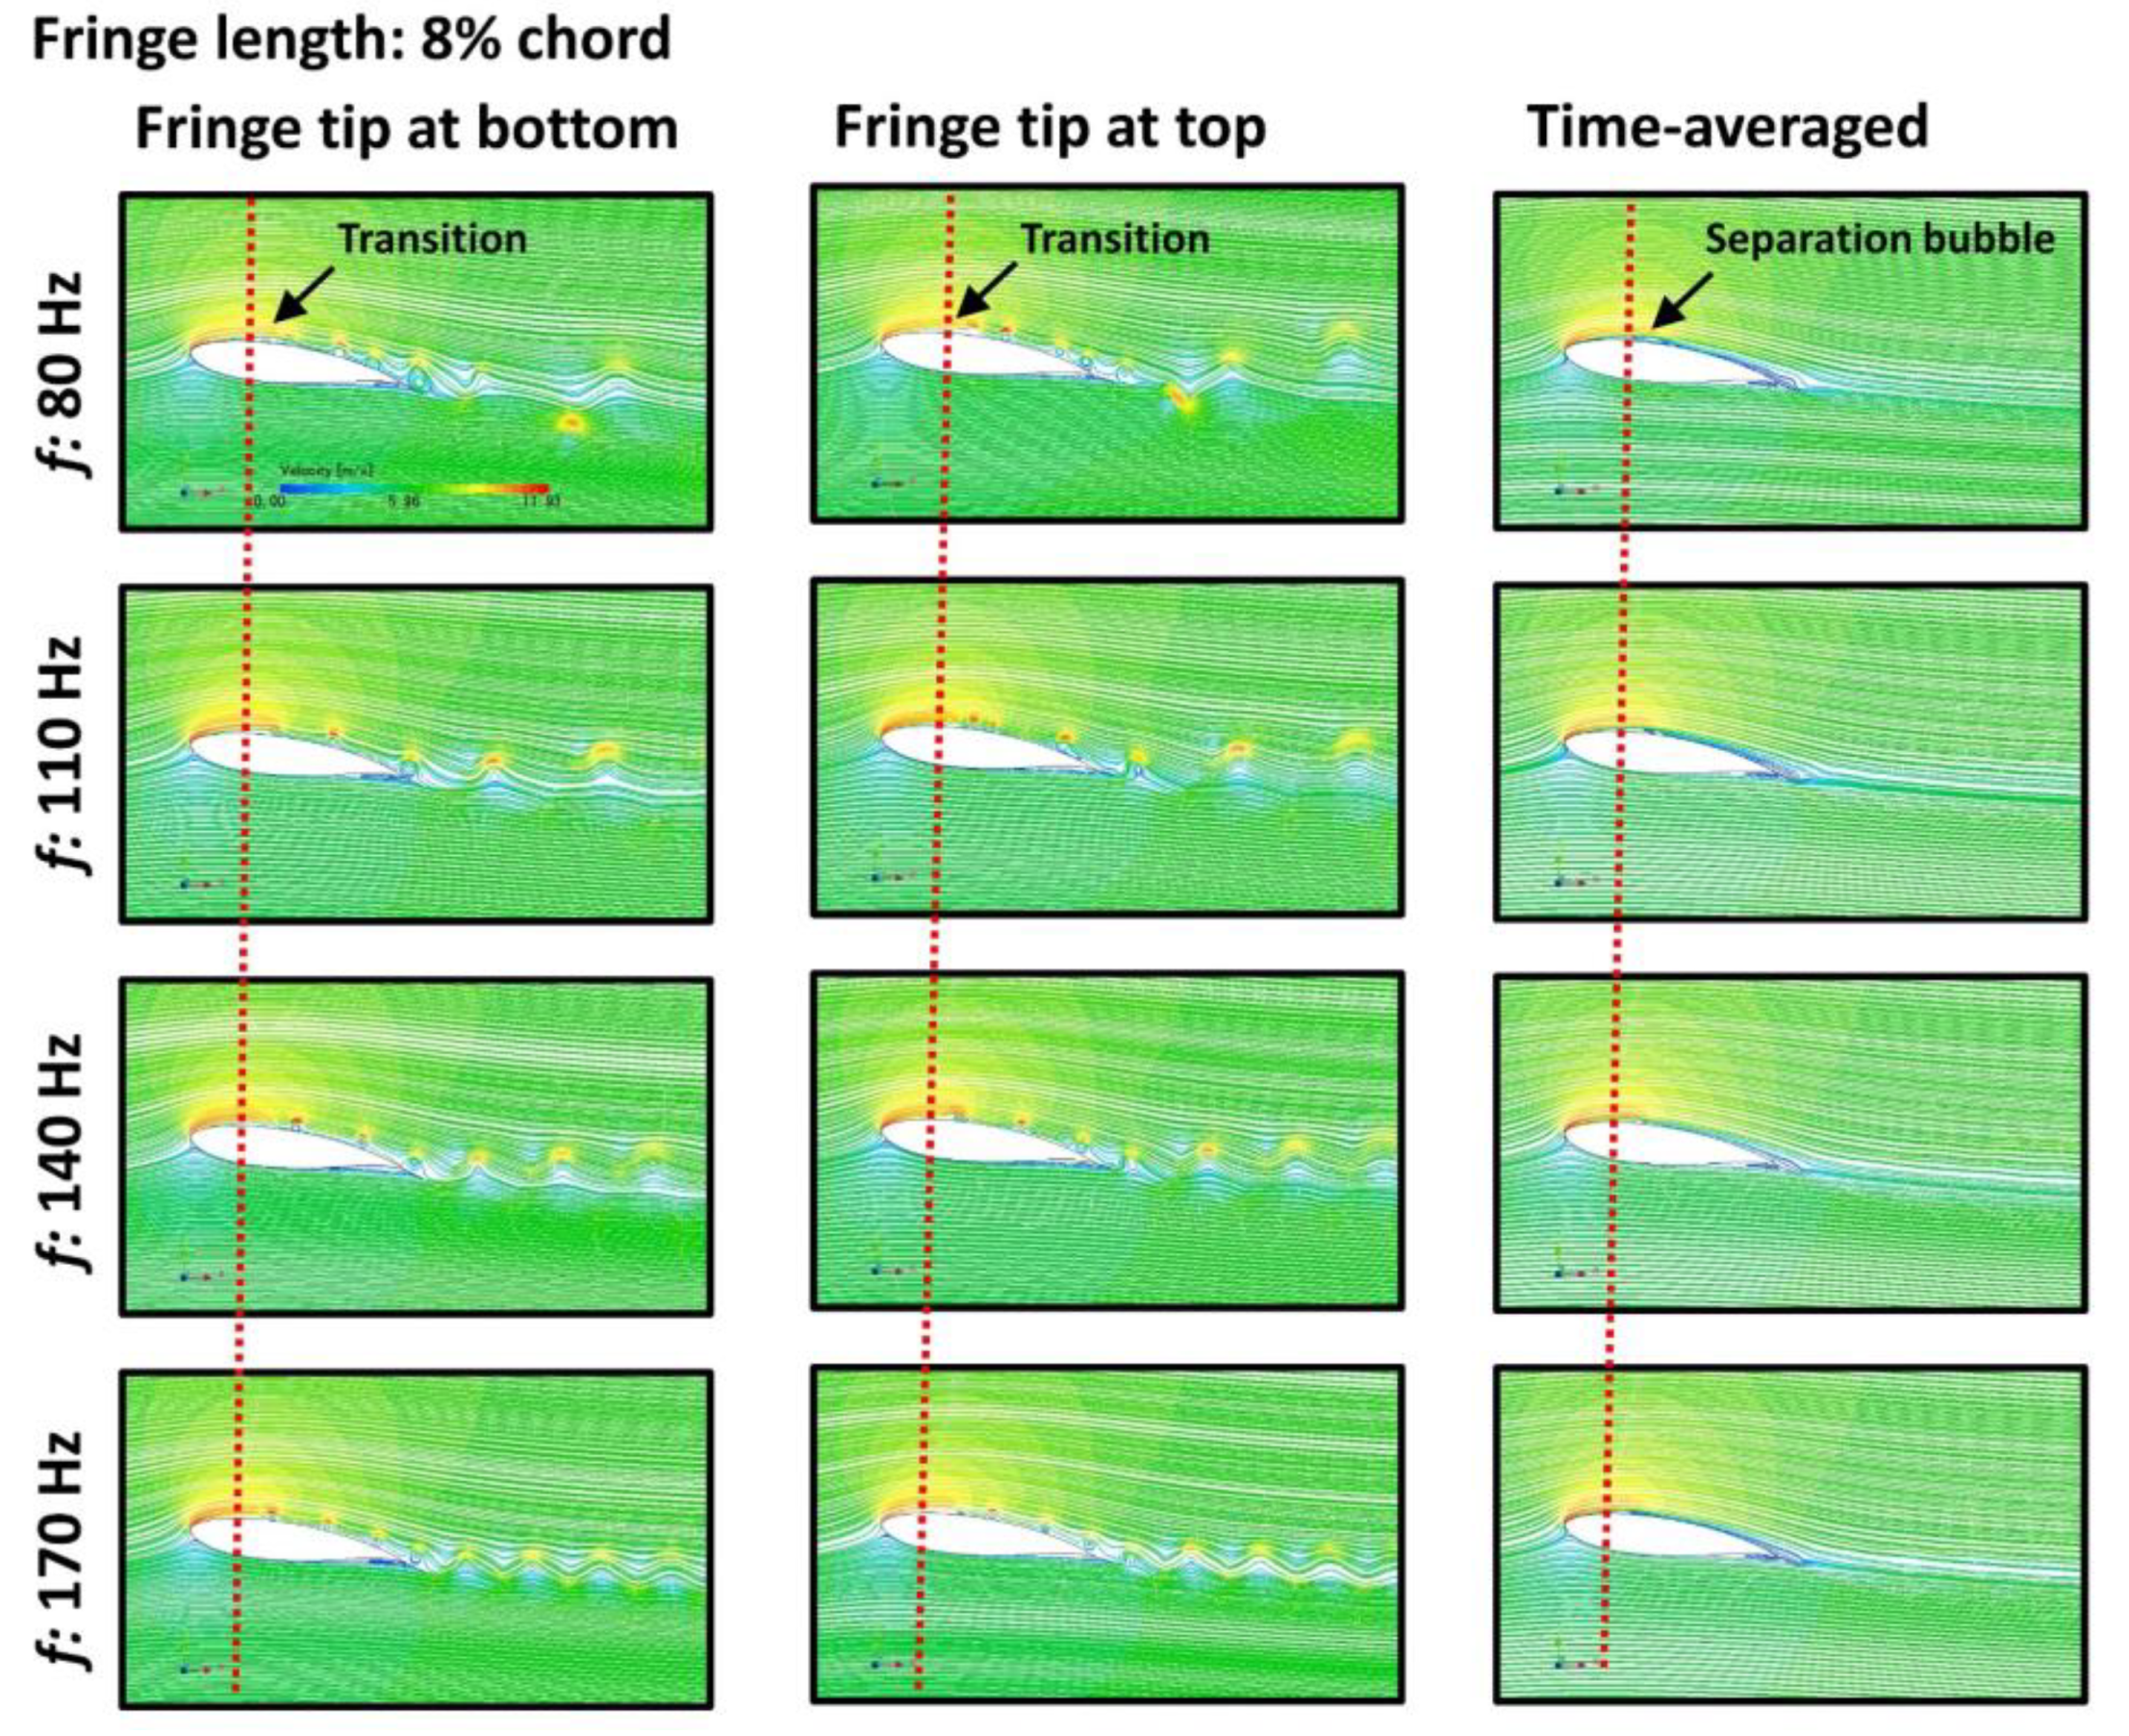
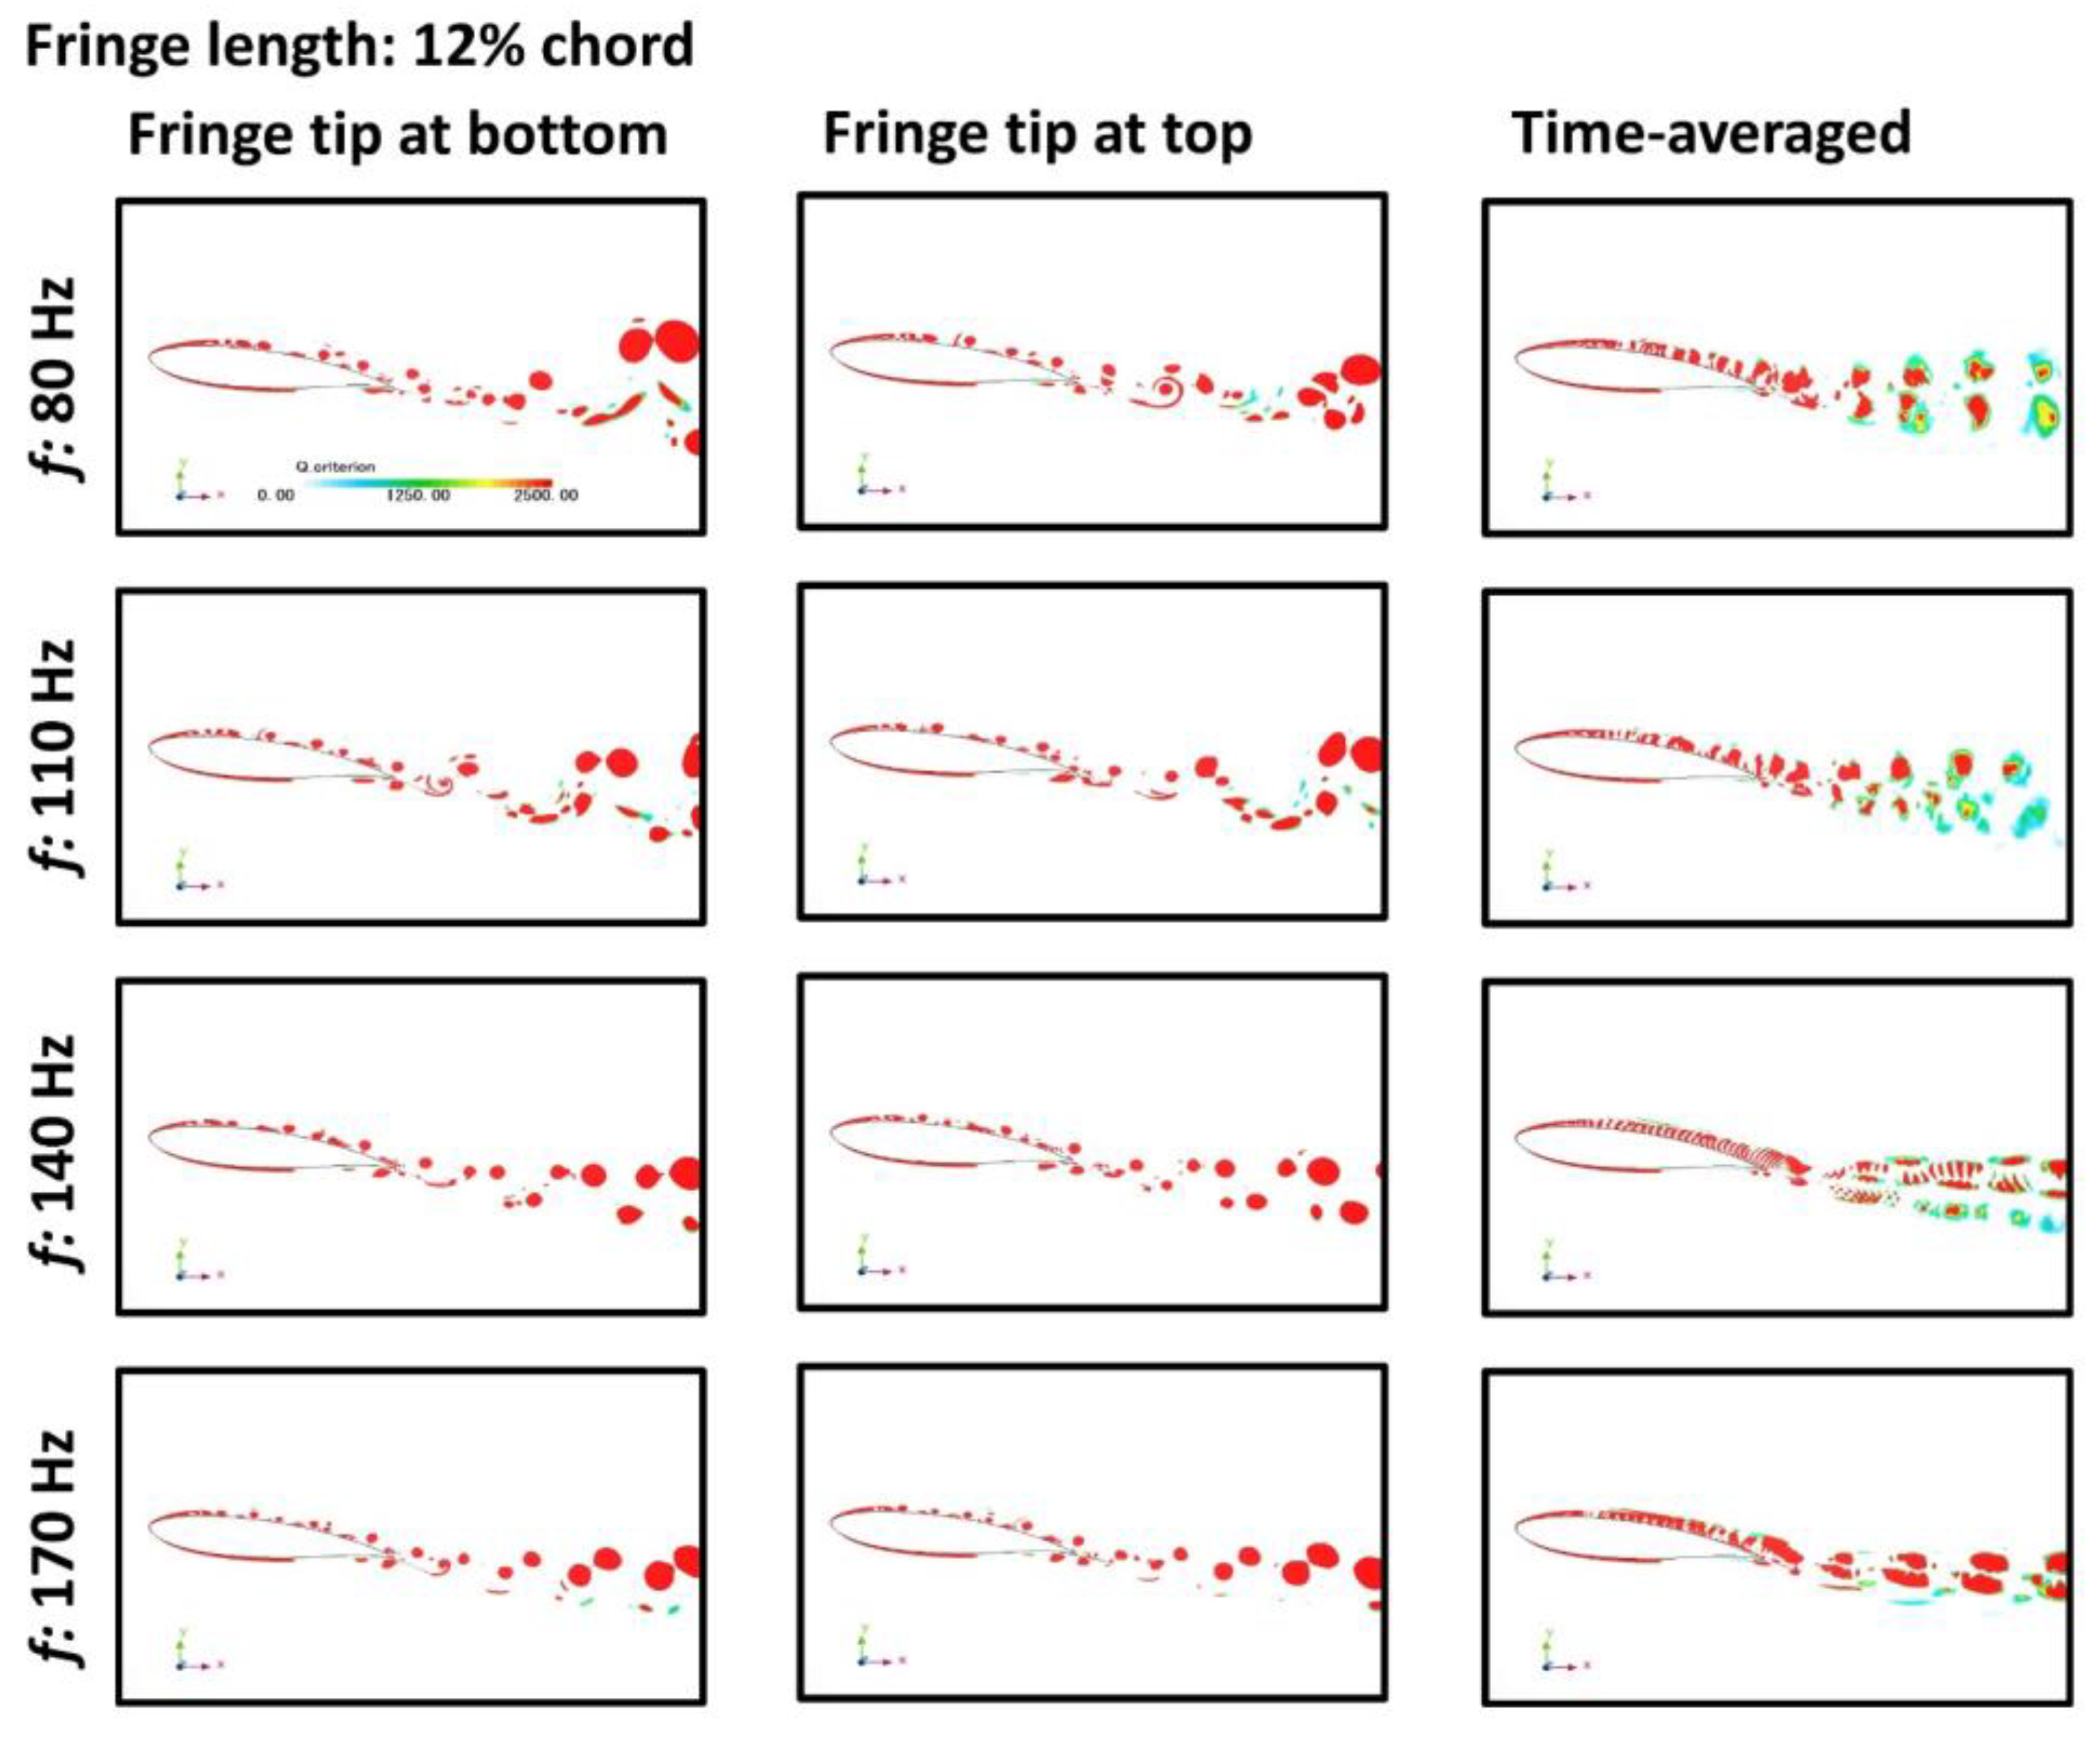
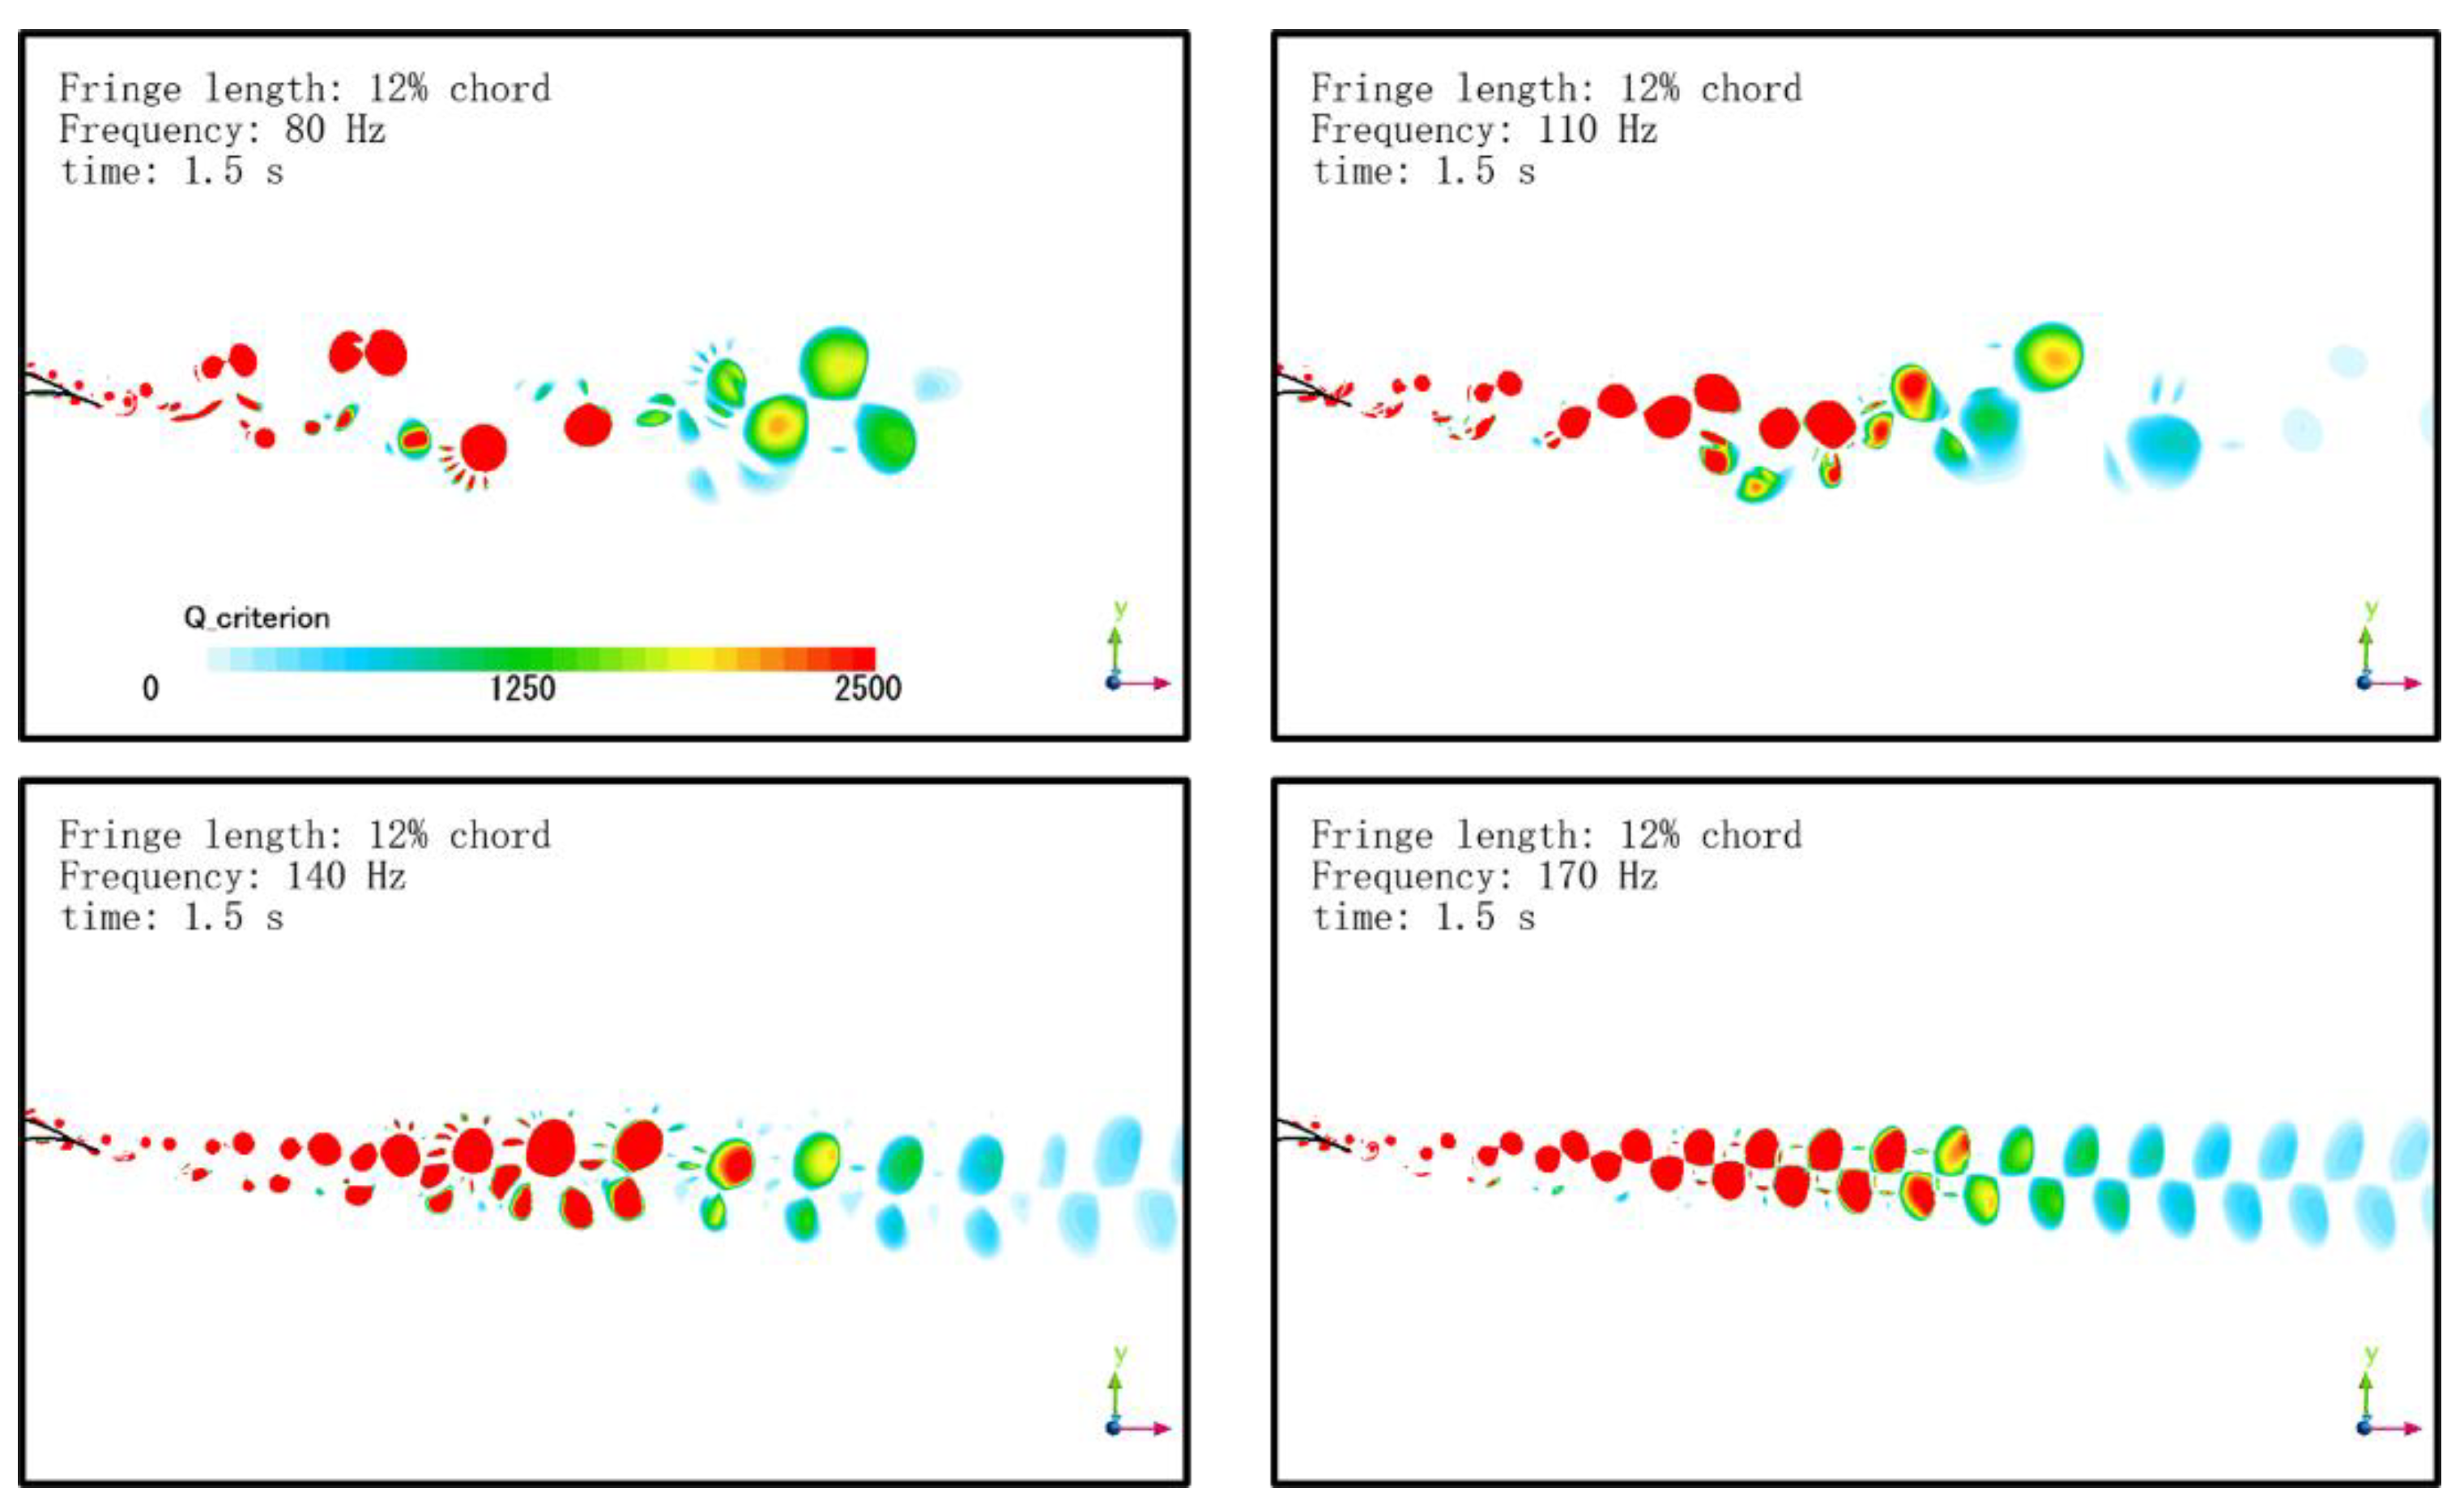
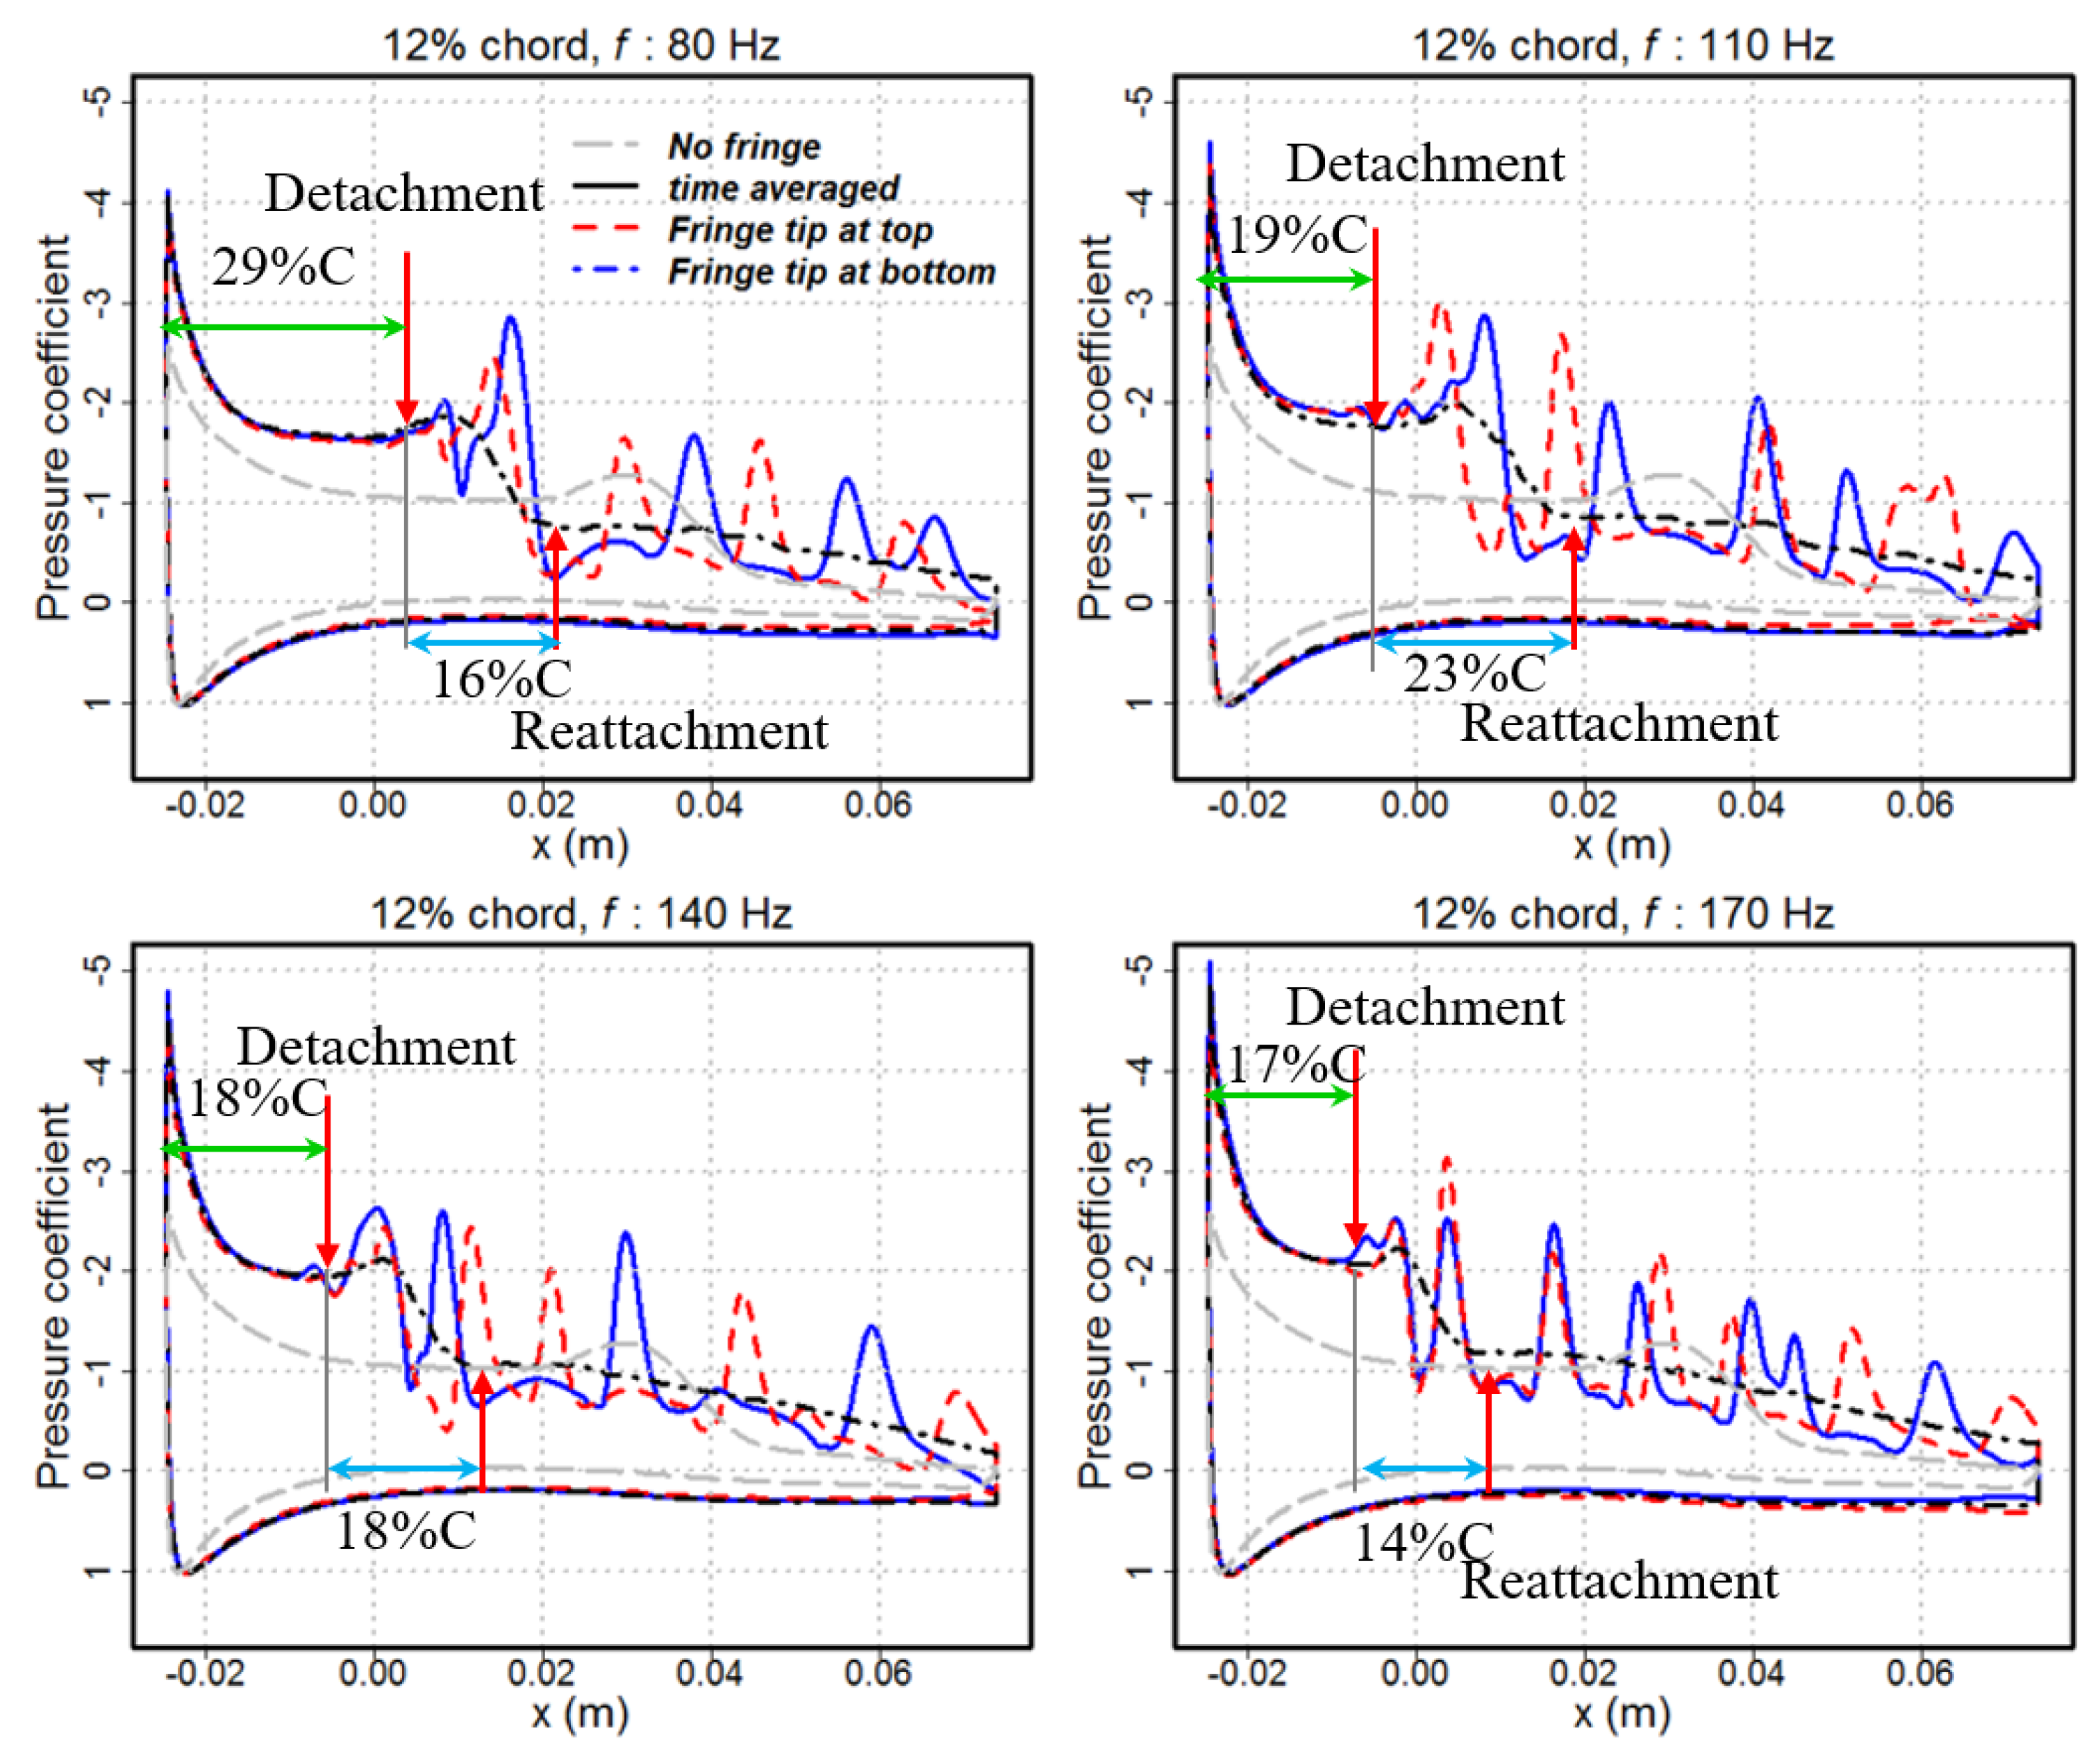
3.1. Effect of the Flapping Motion on the Q-Criterion and Velocity Distributions

The instantaneous (at t = 1 s) and time-averaged Q-criterion and velocity distributions with streamlines of the bare airfoil model (baseline) are presented in Figure 2. The quasi-steady-state of the simulation was reached by checking the periodicity of the flow field. The vortices were shed evenly in the wake, with an identical magnitude of the Q-criterion for each pair, indicating typical Karman vortex street characteristics. The time-averaged Q-criterion shows very weak vortices downstream in the wake. It implies that the rotational direction of two vortices for each pair was opposite, and thus, after averaging, the opposite vorticities counteracts the magnitude of the Q-criterion. A separation bubble was predicted around the middle section on the upper surface of the airfoil, as shown in the instantaneous velocity distribution panel in Figure 2. In the time-averaged flow field, the detachment and reattachment point for the separation bubble can be clearly identified by the streamlines surrounding the circulation region. The separation bubble has a length of about 25% of the chord. In fact, the shedding vortices downstream of the airfoil were initiated by the separation bubble.
The Q-criterion (around the airfoil and in the wake) and velocity distributions for the airfoil model with the fringe length of 8% of the chord at four different fe are presented in Figure 3, Figure 4 and Figure 5. The large-scale vortices initiated over the upper surface of the airfoil were broken up into smaller scale vortices compared to the shed vortices of the bare airfoil model. The flapping motion at the flapping frequency of 80 Hz creates an irregular pattern of vortices compared to the cases with higher frequencies (110–170 Hz), as shown in Figure 3. The time-averaged Q-criterion distributions demonstrate an accelerated decay of vortices by the extended fringe with a low flapping frequency (80 Hz), resulting from the unstructured small-scale vortices being shed irregularly. This observation might be induced by the velocity “offset effect” between induced vortices and the shed vortices from upstream. With the increased flapping frequency, the vortices decayed slowly. This might be attributed to the fact that the contribution from the flapping fringe to the overall swirling strength becomes more dominant with the increased flapping frequency.
In the downstream wake, the airfoil model with fe = 110, 140, or 170 Hz shows evenly shed vortices, as shown in Figure 4. The increased flapping frequency seems to shorten the gap between each pair of vortices, which is directly correlated to the flapping frequency of the fringe. From the comparison of the four flapping frequencies, it is suggested that when the flapping frequency fe is 60 Hz (40%) lower than f (natural vortex shedding frequency of the bare airfoil model, 140 Hz), the regular vortex shedding is interfered with, and results in an irregular vortex distribution with non-uniform scales and shorter gaps between each pair. As can be observed, the flapping trailing edge fringe with fe = 80 and 100 Hz alters the coherent structure of the large-scale vortices in the wake, and at the same time, reduces the vorticity in the flow field (Figure 4).
However, it is difficult to differentiate the influence of the fringe tip position (fringe tip at the top or bottom positions) on the distribution of the Q-criterion. Thus, the instantaneous and time-averaged flow fields around the airfoil were plotted to illustrate the effects of the flapping fringe on the flow field, as shown in Figure 5. The flapping motion induces movement of the separation bubble towards the leading edge of the airfoil for all cases (Figure 5). The existence of the separation bubble caused fluctuated pressure forces on the upper surface, reflecting the unstable pressure distribution over the airfoil model, as shown in Figure 6. Higher flapping frequencies tend to increase the velocity over the top surface of the airfoil, and, as a consequence, it results in a decrease in the aerodynamic pressure. Subsequently, the pressure drop could lead to an increase in the lift coefficient, and a decrease in drag coefficient. It is indicated that the pressure acting on the top surface tends to be small when the flapping fringe tip is at the bottom position, in contrast to that when the fringe tip is at the top position.
The pressure coefficient distributions over the airfoil model with the fringe length of 8%C at four flapping frequencies are compared, as shown in Figure 6. The instantaneous pressure coefficient distribution shows a significant fluctuation corresponding to the shedding vortex over the upper surface as compared to the averaged pressure distribution over the baseline airfoil model. An obvious phase difference of the pressure oscillations can be observed between the case with the fringe tip at the bottom position and that with the fringe tip at the top position. The phase difference is more complicated in the region of the separation bubble compared to the region downstream of the separation bubble. By comparing the time-averaged pressure distributions, one can observe that higher flapping frequencies tend to move the separation bubble forward (towards the leading ledge). The distance from the leading edge to the take-off point of the separation bubble decreases from 33%C to 24%C as the flapping frequency increases from 80 Hz to 170 Hz. The separation bubble length is about 22%C, 25%C, 20%C, and 20%C for the case of fe = 80 Hz, fe = 110 Hz, fe = 140 Hz, and fe = 170 Hz, respectively. Overall, higher flapping frequencies tend to generate a lower time-averaged pressure coefficient over the upper surface, which would result in an increase in the lift coefficient.
Figure 7, Figure 8, Figure 9 and Figure 10 present the instantaneous Q-criterion distribution over the airfoil, the Q-criterion distribution in the wake, the velocity, and the pressure coefficient distributions over the airfoil model, respectively, with the fringe length of 10% at different flapping frequencies. Figure 11, Figure 12, Figure 13 and Figure 14 present the instantaneous Q-criterion distribution over the airfoil, the Q-criterion in the wake, the velocity, and the pressure coefficient distributions over the airfoil model, respectively, with the fringe length of 12% chord at various flapping frequencies. Similarly, the vortex shedding characteristics are similar to the airfoil model with the fringe length of 8% chord. The flapping motion with a relatively lower fe (<140 Hz) can break the large-scale vortex into small-scale vortices at the trailing edge, and, subsequently, alter the coherent structure of the vortex shedding. The irregularly shed vortices and the increased gap between each pair of vortices for cases with a lower fe accelerated the vortex decay compared to those with a higher fe. As the flapping frequency goes up to 170 Hz, the shedding frequency of the vortex is dominated by the flapping motion, which results in a regulated pattern of the shedding vortices. The time-averaged Q-criterion distributions show that the resultant time-averaged vortex strength has been elevated by the flapping fringe. It is indicated that the extended flapping fringe did not always facilitate the reduction of vorticity; conversely, it could promote the vortex domination in the wake, its interaction with the blunt trailing edge, and, possibly, the consequent noise emission from the trailing edge of the airfoil.
With the increased fringe length, the scale of the vortex became smaller, as shown in Figure 7 and Figure 11. Correspondingly, the overall Q-criterion distribution over the top surface of the airfoil is decreased, as presented in Figure 8 and Figure 12. These alterations in the flow field around the airfoil led to a decrease in the pressure coefficient over the upper surface of the airfoil model, as shown in Figure 10 and Figure 14. Compared with the flapping frequency, the effect of the fringe length is less significant in terms of slight changes in both the vortex strength and the pressure distribution.

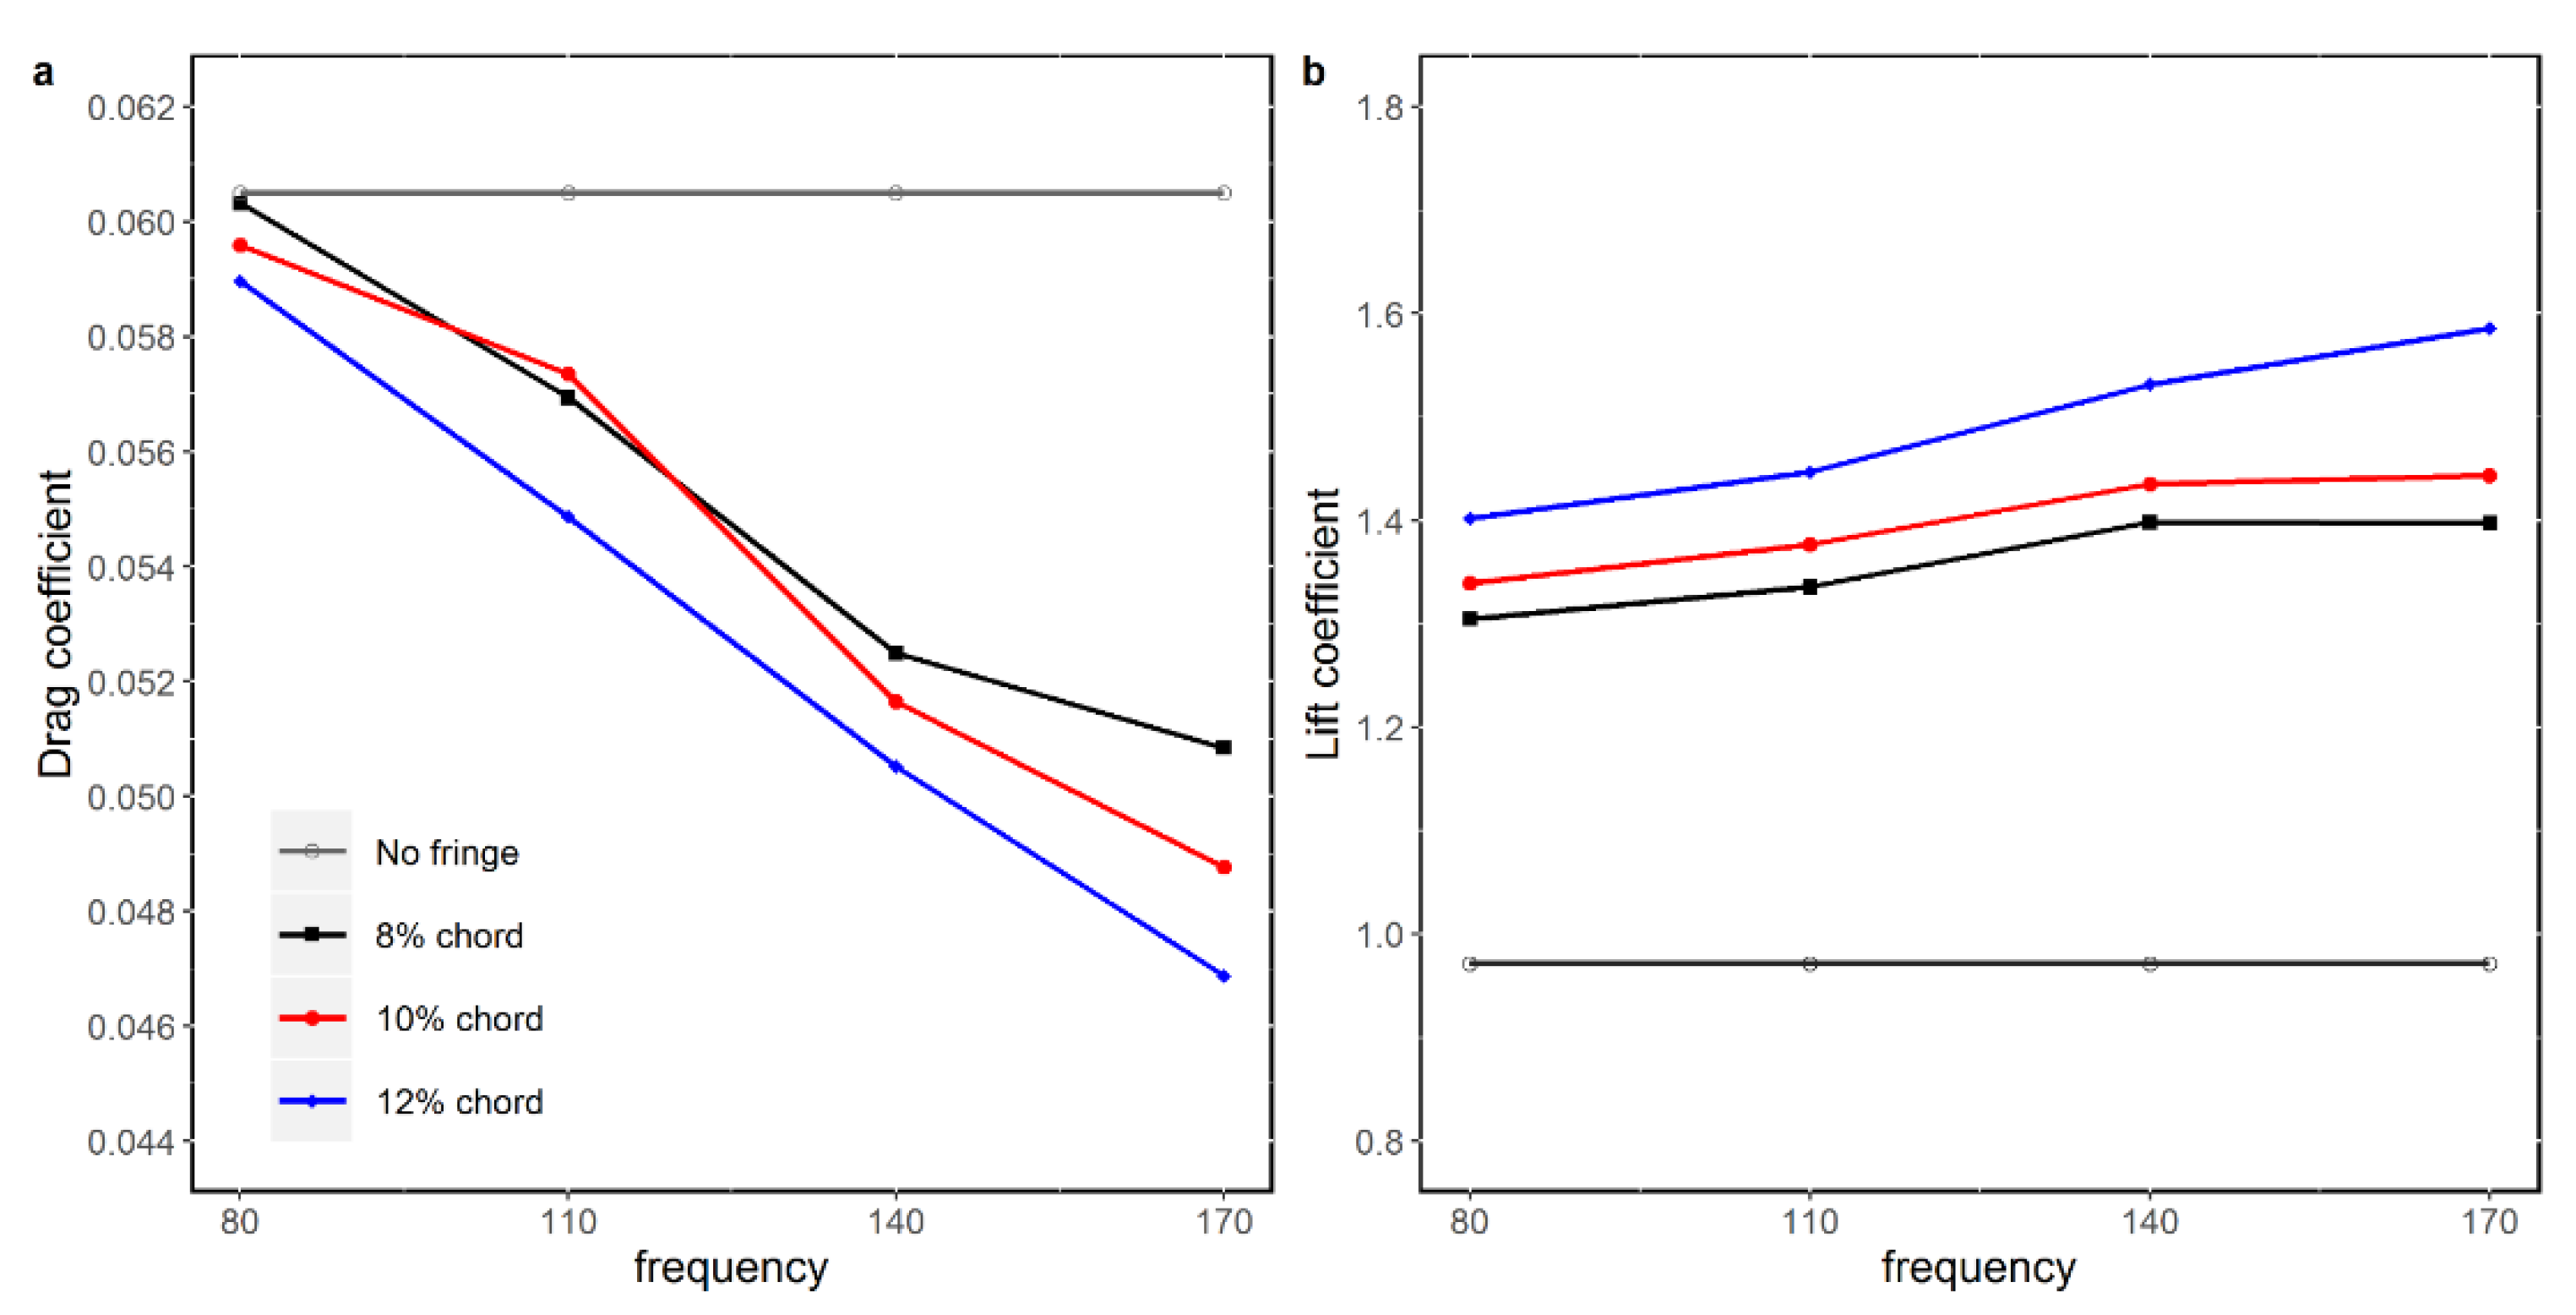
3.2. Effect of the Extended Flapping Fringe on the Lift and Drag Coefficients

The extended flapping trailing edge fringe not only reduced the swirling strength in the wake of the airfoil, but also decreased the drag coefficient, and increased the lift coefficient, surprisingly, as shown in Figure 15. It should be noted that in the integration calculation of the lift and drag, only the pressure distribution over the airfoil surface, excluding the trailing edge fringe, was considered. The drag coefficient essentially decreased with the increase in fringe length, and always decreased with the increase in flapping frequency, whereas the lift coefficient was essentially proportional to these two factors. The airfoil model with Le = 12%C and fe = 170 Hz generated the minimum drag coefficient, i.e., 22.5% lower than the baseline, and the maximum lift coefficient, i.e., 63.2% higher than the baseline, as can be observed in Figure 15. However, this combination would not alleviate the swirling strength of vortices shedding in the wake. For this case, the flapping fringe serves more like a propeller tail, such as the tail of a fish, and thus, reduces the drag, and improves the lift. The drag coefficients of the models with fe = 80 Hz are slightly lower than that of the baseline model, whereas the lift coefficients are elevated dramatically. An fe = 140 Hz, which is the natural shedding frequency for the bare airfoil, did not generate drastically different results. The difference in the lift and drag generation due to the fringe length is the minimum for this case.
In summary, the effects of the fringe length and flapping frequency on the vortex wake and aerodynamic performance are investigated numerically. It is found that a favorable fe should be determined according to the nature shedding frequency, f, of the bare airfoil model. The structure of the shedding vortices or their strength would be either maintained or elevated by the vibration of the fringe at a higher fe (>f). A higher flapping frequency (fe) tends to serve as a booster, rather than a disturber, to increase the local velocity at the trailing edge, resulting in the elevation of the swirling strength, and a shrinking of the dimension of vortices. However, most importantly, a lower fe was able to destruct the shedding vortices’ coherent structure due to the disruption of the fringe on the original shedding pattern from the bare airfoil. Consequently, the swirling strength of vortices became weak, and the irregular distribution made it easy to dissipate.

3.3. Limitation of the Current Study

There are several limitations of this study. First, a RANS turbulence model was used to conduct the simulation. This would cause less accurate simulation results on the structure of shedding vortices. Due to the lack of comparable experimental data, direct validation of the simulation results could not be made, but, qualitatively, the predicted vortex reduction is similar to what we observed in our previous experiment [24]. In addition, to simplify the computational effort, a 2D model geometry was used, and thus, the span-wise porosity effect of feather fringes, as used in the experiment, could not be studied. To improve the understanding, 3D simulations on porous fringes attached at the trailing edge will be investigated in future work. To better mimic the feather fringe of an owl’s wing, a soft material with a biological property should be adopted as well. The flapping motion will then be determined by the fluid-structure interaction as a passive flow control.

4. Conclusions

The airfoil S833 equipped with an extended flapping fringe is used to investigate the effects of two factors, i.e., the trailing fringe length and the flapping frequency, on the vortex shedding characteristics and the aerodynamic performance of the airfoil. The extended fringe with a flapping frequency significantly below the natural shedding frequency (~140 Hz), such as 80 Hz, can alter the coherence structure. Likewise, an irregular vortex structure in the wake can be generated, and thus, cause decrements in the swirling strength, and faster decay of the vortices. The flapping motion can decrease the pressure coefficient over the upper surface of the airfoil, leading to increases in the lift coefficient about 40% relative to the bare airfoil model. Out of the cases in the present study, the model with Le = 0.01 m (10% of the airfoil chord) at a flapping frequency of fe = 110 Hz outperforms other cases, and shows an overall substantially better aerodynamic performance of the airfoil, as well as more favorable vortex characteristics downstream of the airfoil. In spite of the limitations of the study, we can observe the aerodynamic benefits of using an extended flapping fringe at the trailing edge. The pressure alteration around the airfoil would potentially reduce the noise generation for wind turbines especially, which will be studied in our future work as well.

Author Contributions

Conceptualization, H.Y. and Z.Y.; methodology, H.Y. and Z.Y.; software, H.Y. and Z.Y.; validation, H.Y. and Z.Y.; formal analysis, H.Y. and Z.Y.; investigation, H.Y. and Z.Y.; resources, H.Y. and Z.Y.; data curation, H.Y. and Z.Y.; writing—original draft preparation, H.Y. and Z.Y.; writing—review and editing, H.Y. and Z.Y.; visualization, H.Y. and Z.Y.; supervision, Z.Y.; project administration, Z.Y.; funding acquisition, Z.Y. All authors have read and agreed to the published version of the manuscript.

Funding

This research received no external funding.

Institutional Review Board Statement

Not applicable.

Informed Consent Statement

Not applicable.

Data Availability Statement

The analysis data are available from the corresponding author on reasonable request.

Conflicts of Interest

The authors declare no conflict of interest.

References

  1. Zhao, M.; Cao, H.; Zhang, M.; Liao, C.; Zhou, T. Optimal design of aeroacoustic airfoils with owl-inspired trailing edge serrations. Bioinspir. Biomim. 2021, 16, 056004. [Google Scholar] [CrossRef] [PubMed]
  2. Oerlemans, S.; Fisher, M.; Maeder, T.; Kögler, K. Reduction of wind turbine noise using optimized airfoils and trailing-edge serrations. AIAA J. 2009, 47, 1470–1481. [Google Scholar] [CrossRef]
  3. Li, D.; Liu, X.; Hu, F.; Wang, L. Effect of trailing-edge serrations on noise reduction in a coupled bionic aerofoil inspired by barn owls. Bioinspir. Biomim. 2019, 15, 16009. [Google Scholar] [CrossRef] [PubMed]
  4. Talboys, E.; Geyer, T.F.; Prüfer, F.; Brücker, C. A parametric study of the effect of self-oscillating trailing-edge flaplets on aerofoil self-noise. Appl. Acoust. 2021, 177, 107907. [Google Scholar] [CrossRef]
  5. Geissler, W.; van der Wall, B.G. Dynamic stall control on flapping wing airfoils. Aerosp. Sci. Technol. 2017, 62, 1–10. [Google Scholar] [CrossRef]
  6. Xinyu, L.; Bifeng, S.; Wenqing, Y.; Wenping, S. Aerodynamic performance of owl-like airfoil undergoing bio-inspired flapping kinematics. Chin. J. Aeronaut. 2021, 34, 239–252. [Google Scholar]
  7. Moreau, D.J.; Doolan, C.J. Noise-reduction mechanism of a flat-plate serrated trailing edge. AIAA J. 2013, 51, 2513–2522. [Google Scholar] [CrossRef] [Green Version]
  8. Winzen, A.; Klaas, M.; Schröder, W. PIV measurements comparing natural and model owl wings. In Proceedings of the 17th International Symposium on Applications of Laser Techniques to Fluid Mechanics, Lisbon, Portugal, 7–10 July 2014. [Google Scholar]
  9. Winzen, A.; Klän, S.; Klaas, M.; Schröder, W. Flow field analysis and contour detection of a natural owl wing using PIV measurements. In Nature-Inspired Fluid Mechanics; Springer: Berlin/Heidelberg, Germany, 2012; pp. 119–134. [Google Scholar]
  10. Lilley, G. A study of the silent flight of the owl. In Proceedings of the 4th AIAA/CEAS Aeroacoustics Conference, Toulouse, France, 2–4 June 1998; p. 2340. [Google Scholar]
  11. Sarradj, E.; Fritzsche, C.; Geyer, T. Silent owl flight: Bird flyover noise measurements. AIAA J. 2011, 49, 769–779. [Google Scholar] [CrossRef]
  12. Kerho, M.; Hutcherson, S.; Blackwelder, R.F.; Liebeck, R.H. Vortex generators used to control laminar separation bubbles. J. Aircr. 1993, 30, 315–319. [Google Scholar] [CrossRef]
  13. Klan, S.; Bachmann, T.; Klaas, M.; Wagner, H.; Schröder, W. Experimental analysis of the flow field over a novel owl based airfoil. In Animal Locomotion; Springer: Berlin/Heidelberg, Germany, 2010; pp. 413–427. [Google Scholar]
  14. Miao, J.M.; Ho, M.H. Effect of flexure on aerodynamic propulsive efficiency of flapping flexible airfoil. J. Fluids Struct. 2006, 22, 401–419. [Google Scholar] [CrossRef]
  15. Shan, H.; Jiang, L.; Liu, C.; Love, M.; Maines, B. Numerical study of passive and active flow separation control over a NACA0012 airfoil. Comput. Fluids 2008, 37, 975–992. [Google Scholar] [CrossRef]
  16. Veldhuis, L.L.M.; Jansen, D.P.; El Haddar, J.; Correale, G. Novel Passive and Active Flow Control for High Lift. In Proceedings of the 28th International Congress Aeronautucal Science, Brisbane, Australia, 23–28 September 2012. [Google Scholar]
  17. Finez, A.; Jacob, M.; Jondeau, E.; Roger, M. Broadband noise reduction with trailing edge brushes. In Proceedings of the 16th AIAA/CEAS Aeroacoustics Conference, Stockholm, Sweden, 7–9 June 2010; p. 3980. [Google Scholar]
  18. Herr, M.; Dobrzynski, W. Experimental Investigations in Low-Noise Trailing Edge Design. AIAA J. 2005, 43, 1167–1175. [Google Scholar] [CrossRef]
  19. Das, C. An Experimental Investigation of Flow-Induced Noise Mechanism of a Flexible Flat-Plate Trailing-Edge. 2015. Available online: https://www.semanticscholar.org/paper/AN-EXPERIMENTAL-INVESTIGATION-OF-FLOW-INDUCED-NOISE-Das-Mimani/6b0724fa4ad87b65336240d253d30b5a3b1c4176#citing-papers (accessed on 10 October 2021).
  20. Schlanderer, S.C.; Sandberg, R.D. DNS of a compliant trailing-edge flow. In Proceedings of the 19th AIAA/CEAS Aeroacoustics Conference, Berlin, Germany, 27–29 May 2013; p. 2013. [Google Scholar]
  21. Kamps, L.; Brücker, C.; Geyer, T.F.; Sarradj, E. Airfoil self noise reduction at low Reynolds numbers using a passive flexible trailing edge. In Proceedings of the 23rd AIAA/CEAS Aeroacoustics Conference, Denver, CO, USA, 5–9 June 2017; p. 3496. [Google Scholar]
  22. Talboys, E.; Geyer, T.F.; Brücker, C. An aeroacoustic investigation into the effect of self-oscillating trailing edge flaplets. J. Fluids Struct. 2019, 91, 102598. [Google Scholar] [CrossRef] [Green Version]
  23. Murayama, Y.; Nakata, T.; Liu, H. Flexible flaps inspired by avian feathers can enhance aerodynamic robustness in low Reynolds number airfoils. Front. Bioeng. Biotechnol. 2021, 9, 374. [Google Scholar] [CrossRef] [PubMed]
  24. Yang, Z.; He, Z.; Chen, F. Study on the Vortex Wake of an Airfoil Equipped with Flexible Trailing Edge Fringe. In Proceedings of the 53rd AIAA Aerospace Sciences Meeting, Kissimmee, FL, USA, 5–9 January 2015; p. 1707. [Google Scholar] [CrossRef] [Green Version]
  25. Yu, H.; Yang, Z. A numerical simulation on the airfoil s833 equipped with flapping trailing edge fringes. J. Appl. Fluid Mech. 2020, 13, 571–582. [Google Scholar] [CrossRef]
  26. Somers, D.M. S833, S834, and S835 Airfoils: November 2001–November 2002; National Renewable Energy Lab. (NREL): Golden, CO, USA, 2005. [Google Scholar]
  27. Walters, D.K.; Leylek, J.H. A new model for boundary layer transition using a single-point RANS approach. J. Turbomach. 2004, 126, 193–202. [Google Scholar] [CrossRef]
  28. Walters, D.K.; Cokljat, D. A three-equation eddy-viscosity model for Reynolds-averaged Navier–Stokes simulations of transitional flow. J. Fluids Eng. 2008, 130, 121401. [Google Scholar] [CrossRef]
Figure 1. The 2-dimensional computational domain and boundary conditions for the CFD simulation. C: chord length of the airfoil; u: velocity in the x-direction; v: velocity in the y-direction; ρ: density of the fluid; μ: viscosity of the fluid; P: pressure; θ: dynamic motion of the trailing edge fringe; A: amplitude of the flapping angle and set at 5 degrees; f: frequency of the flapping motion.
Applsci 12 00444 g001
Figure 2. The simulated instantaneous (time = 1 s) and time-averaged Q-criterion and velocity distributions with streamline of the bare airfoil model.
Applsci 12 00444 g002
Figure 3. Q-criterion distributions around the airfoil model with the fringe length of 8% chord at different flapping frequencies. Left column: instantaneous Q-criterion distributions at the fringe tip moved to the top; Middle column: instantaneous Q-criterion distributions at the fringe tip moved to the bottom; Right column: time-averaged Q-criterion distribution.
Applsci 12 00444 g003
Figure 4. Instantaneous Q-criterion distributions in the wake of the airfoil model with the fringe length of 8% chord at different flapping frequencies at t = 1.5 s.
Applsci 12 00444 g004
Figure 5. The velocity distribution around the airfoil model with the fringe length of 8% chord at different flapping frequencies. Left column: instantaneous velocity distributions when the fringe tip moved to the top; Middle column: instantaneous Q-criterion distributions when the fringe tip moved to the bottom; Right column: time-averaged Q-criterion distribution.
Applsci 12 00444 g005
Figure 6. Pressure coefficient distribution over the airfoil model with the fringe length of 8% chord at four flapping frequencies.
Applsci 12 00444 g006
Figure 7. Q-criterion distributions around the airfoil model with the fringe length of 10% chord at different flapping frequencies.
Applsci 12 00444 g007
Figure 8. Instantaneous Q-criterion distributions in the wake of the airfoil model with the fringe length of 10% chord at different flapping frequencies at t = 1.5 s.
Applsci 12 00444 g008
Figure 9. The velocity distribution around the airfoil model with the fringe length of 10% chord at different flapping frequencies.
Applsci 12 00444 g009
Figure 10. Pressure coefficient distribution over the airfoil model with the fringe length of 10% chord at different flapping frequencies.
Applsci 12 00444 g010
Figure 11. Q-criterion distributions around the airfoil model with the fringe length of 12% chord at different flapping frequencies.
Applsci 12 00444 g011
Figure 12. Instantaneous Q-criterion distributions in the wake of the airfoil model with the fringe length of 12% chord at different flapping frequencies at t = 1.5 s.
Applsci 12 00444 g012
Figure 13. The velocity distribution around the airfoil model with the fringe length of 12% chord at different flapping frequencies.
Applsci 12 00444 g013
Figure 14. Pressure coefficient distribution over the airfoil model with the fringe length of 12% chord at different flapping frequencies.
Applsci 12 00444 g014
Figure 15. Time-averaged force coefficients for airfoil models with different fringe lengths at different flapping frequencies: (a) Drag coefficient; (b) Lift Coefficient.
Applsci 12 00444 g015
Publisher’s Note: MDPI stays neutral with regard to jurisdictional claims in published maps and institutional affiliations.

