Author Contributions
Formal analysis, G.M., A.K.P., S.A., E.I.A. and B.S.K.; Investigation, G.M., A.K.P. and B.S.K.; Methodology, G.M., A.K.P. and E.I.A.; Project administration, S.A. and E.I.A.; Software, G.M., A.K.P. and E.I.A.; Validation, G.M., A.K.P., S.A. and E.I.A.; Visualization, E.I.A.; Writing—original draft, G.M., A.K.P. and E.I.A.; Writing—review & editing, G.M., A.K.P., E.I.A. and S.A. All authors have read and agreed to the published version of the manuscript.
Figure 1.
Restricted 2 + 2 body problem model.
Figure 1.
Restricted 2 + 2 body problem model.
Figure 2.
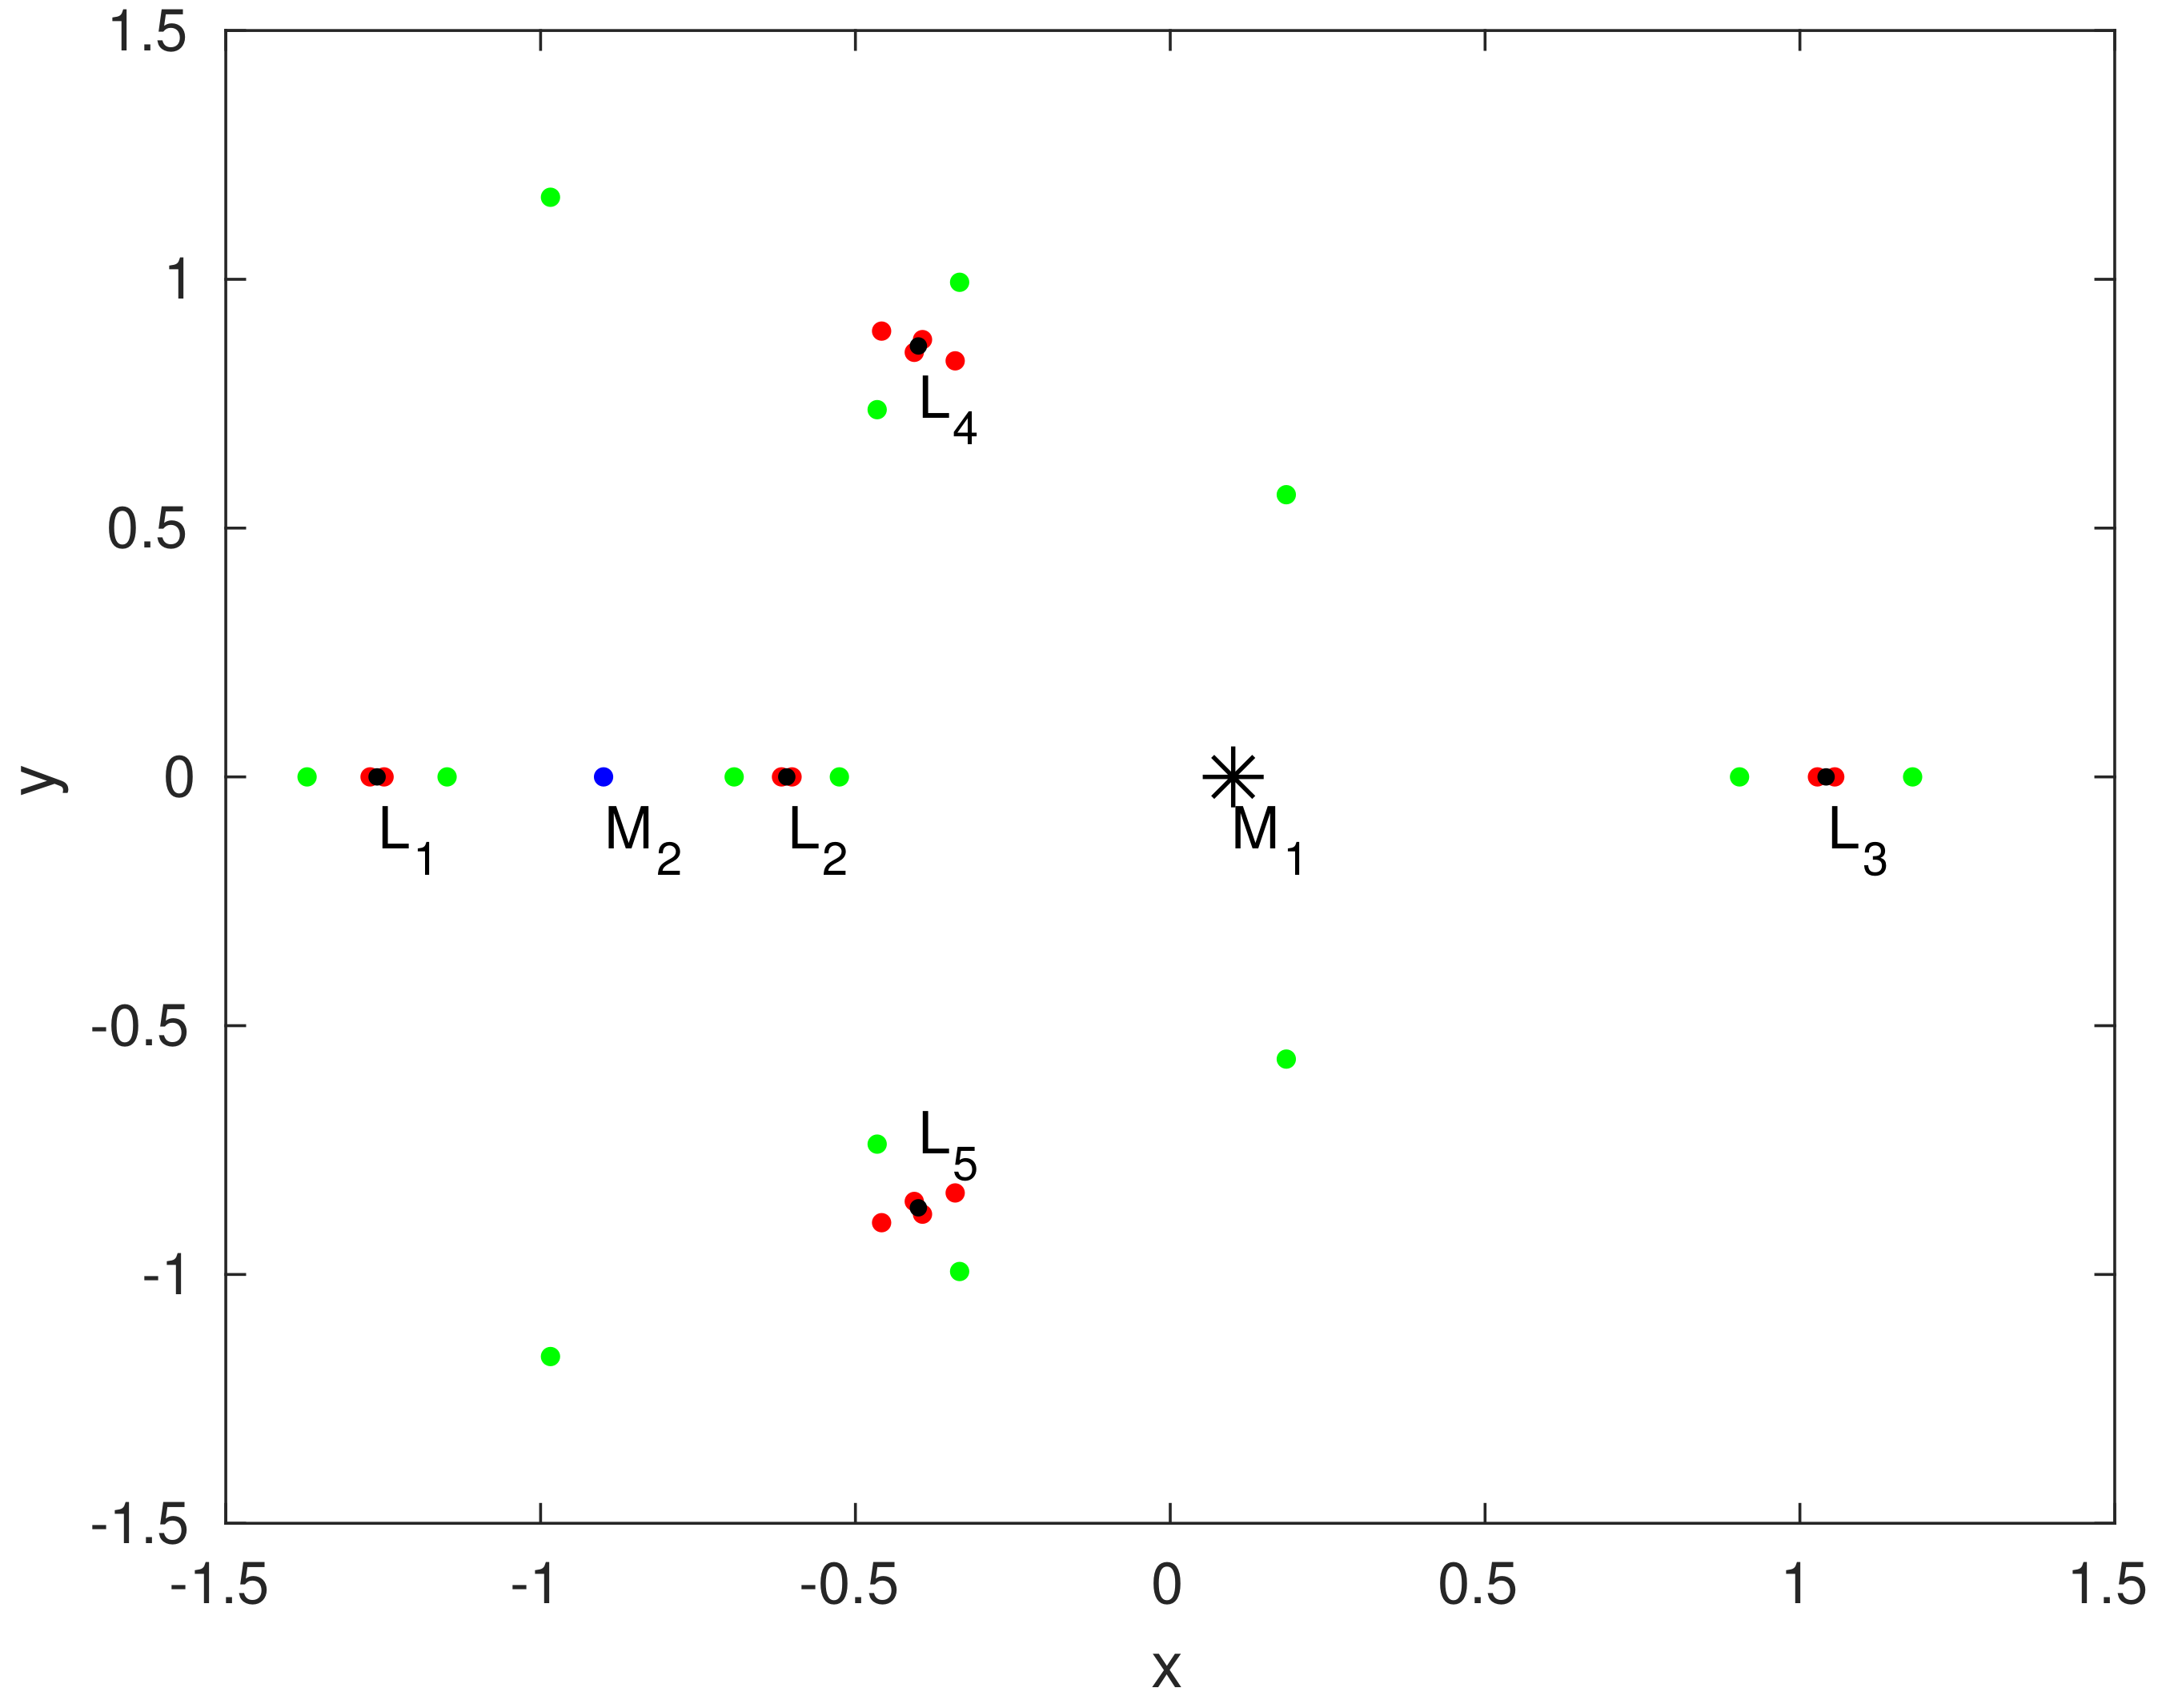
The position of equilibrium points when , , , , and parameter . The positions of the primaries are and , represented by an asterisk and blue dot, respectively. , and with black dots are the Lagrangian points of CRTBP. The equilibrium points of R2+2BP with the planetesimal belt effect are shown in green and red dots for and , respectively.
Figure 3.
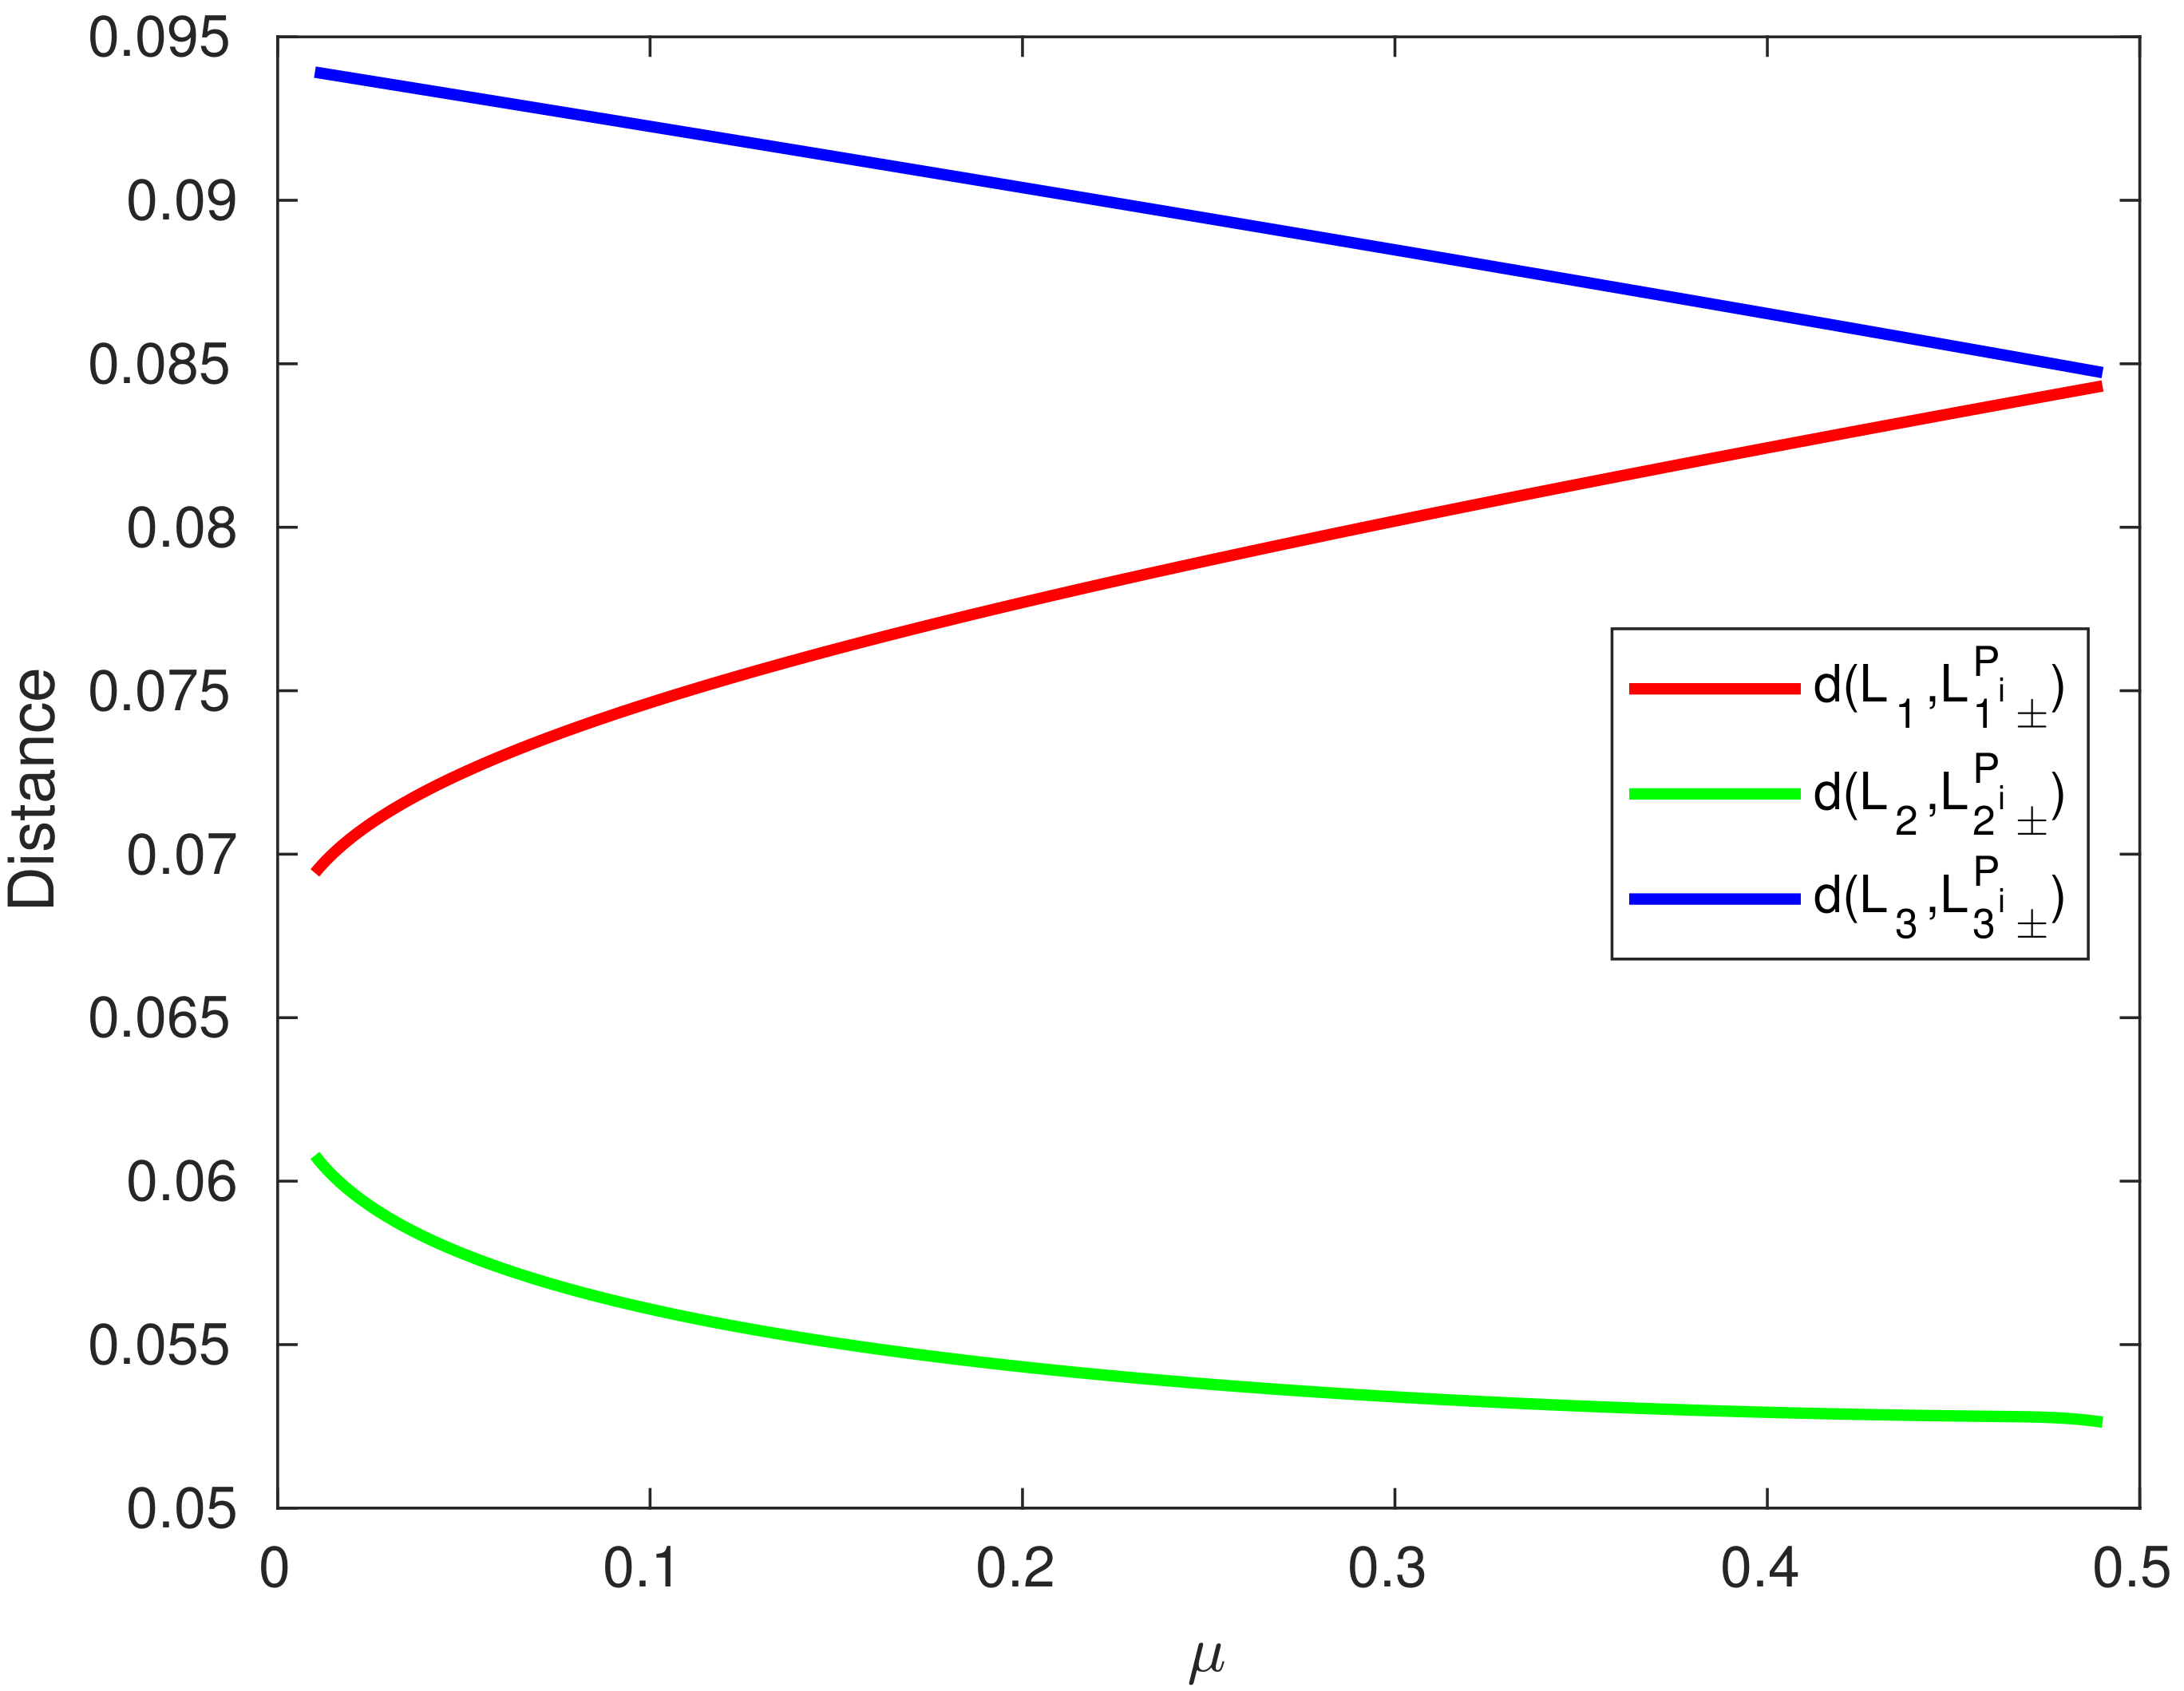
Distance versus mass ratio plot in the presence of the planetesimal belt effect for collinear equilibrium points.
Figure 3.
Distance versus mass ratio plot in the presence of the planetesimal belt effect for collinear equilibrium points.
Figure 4.
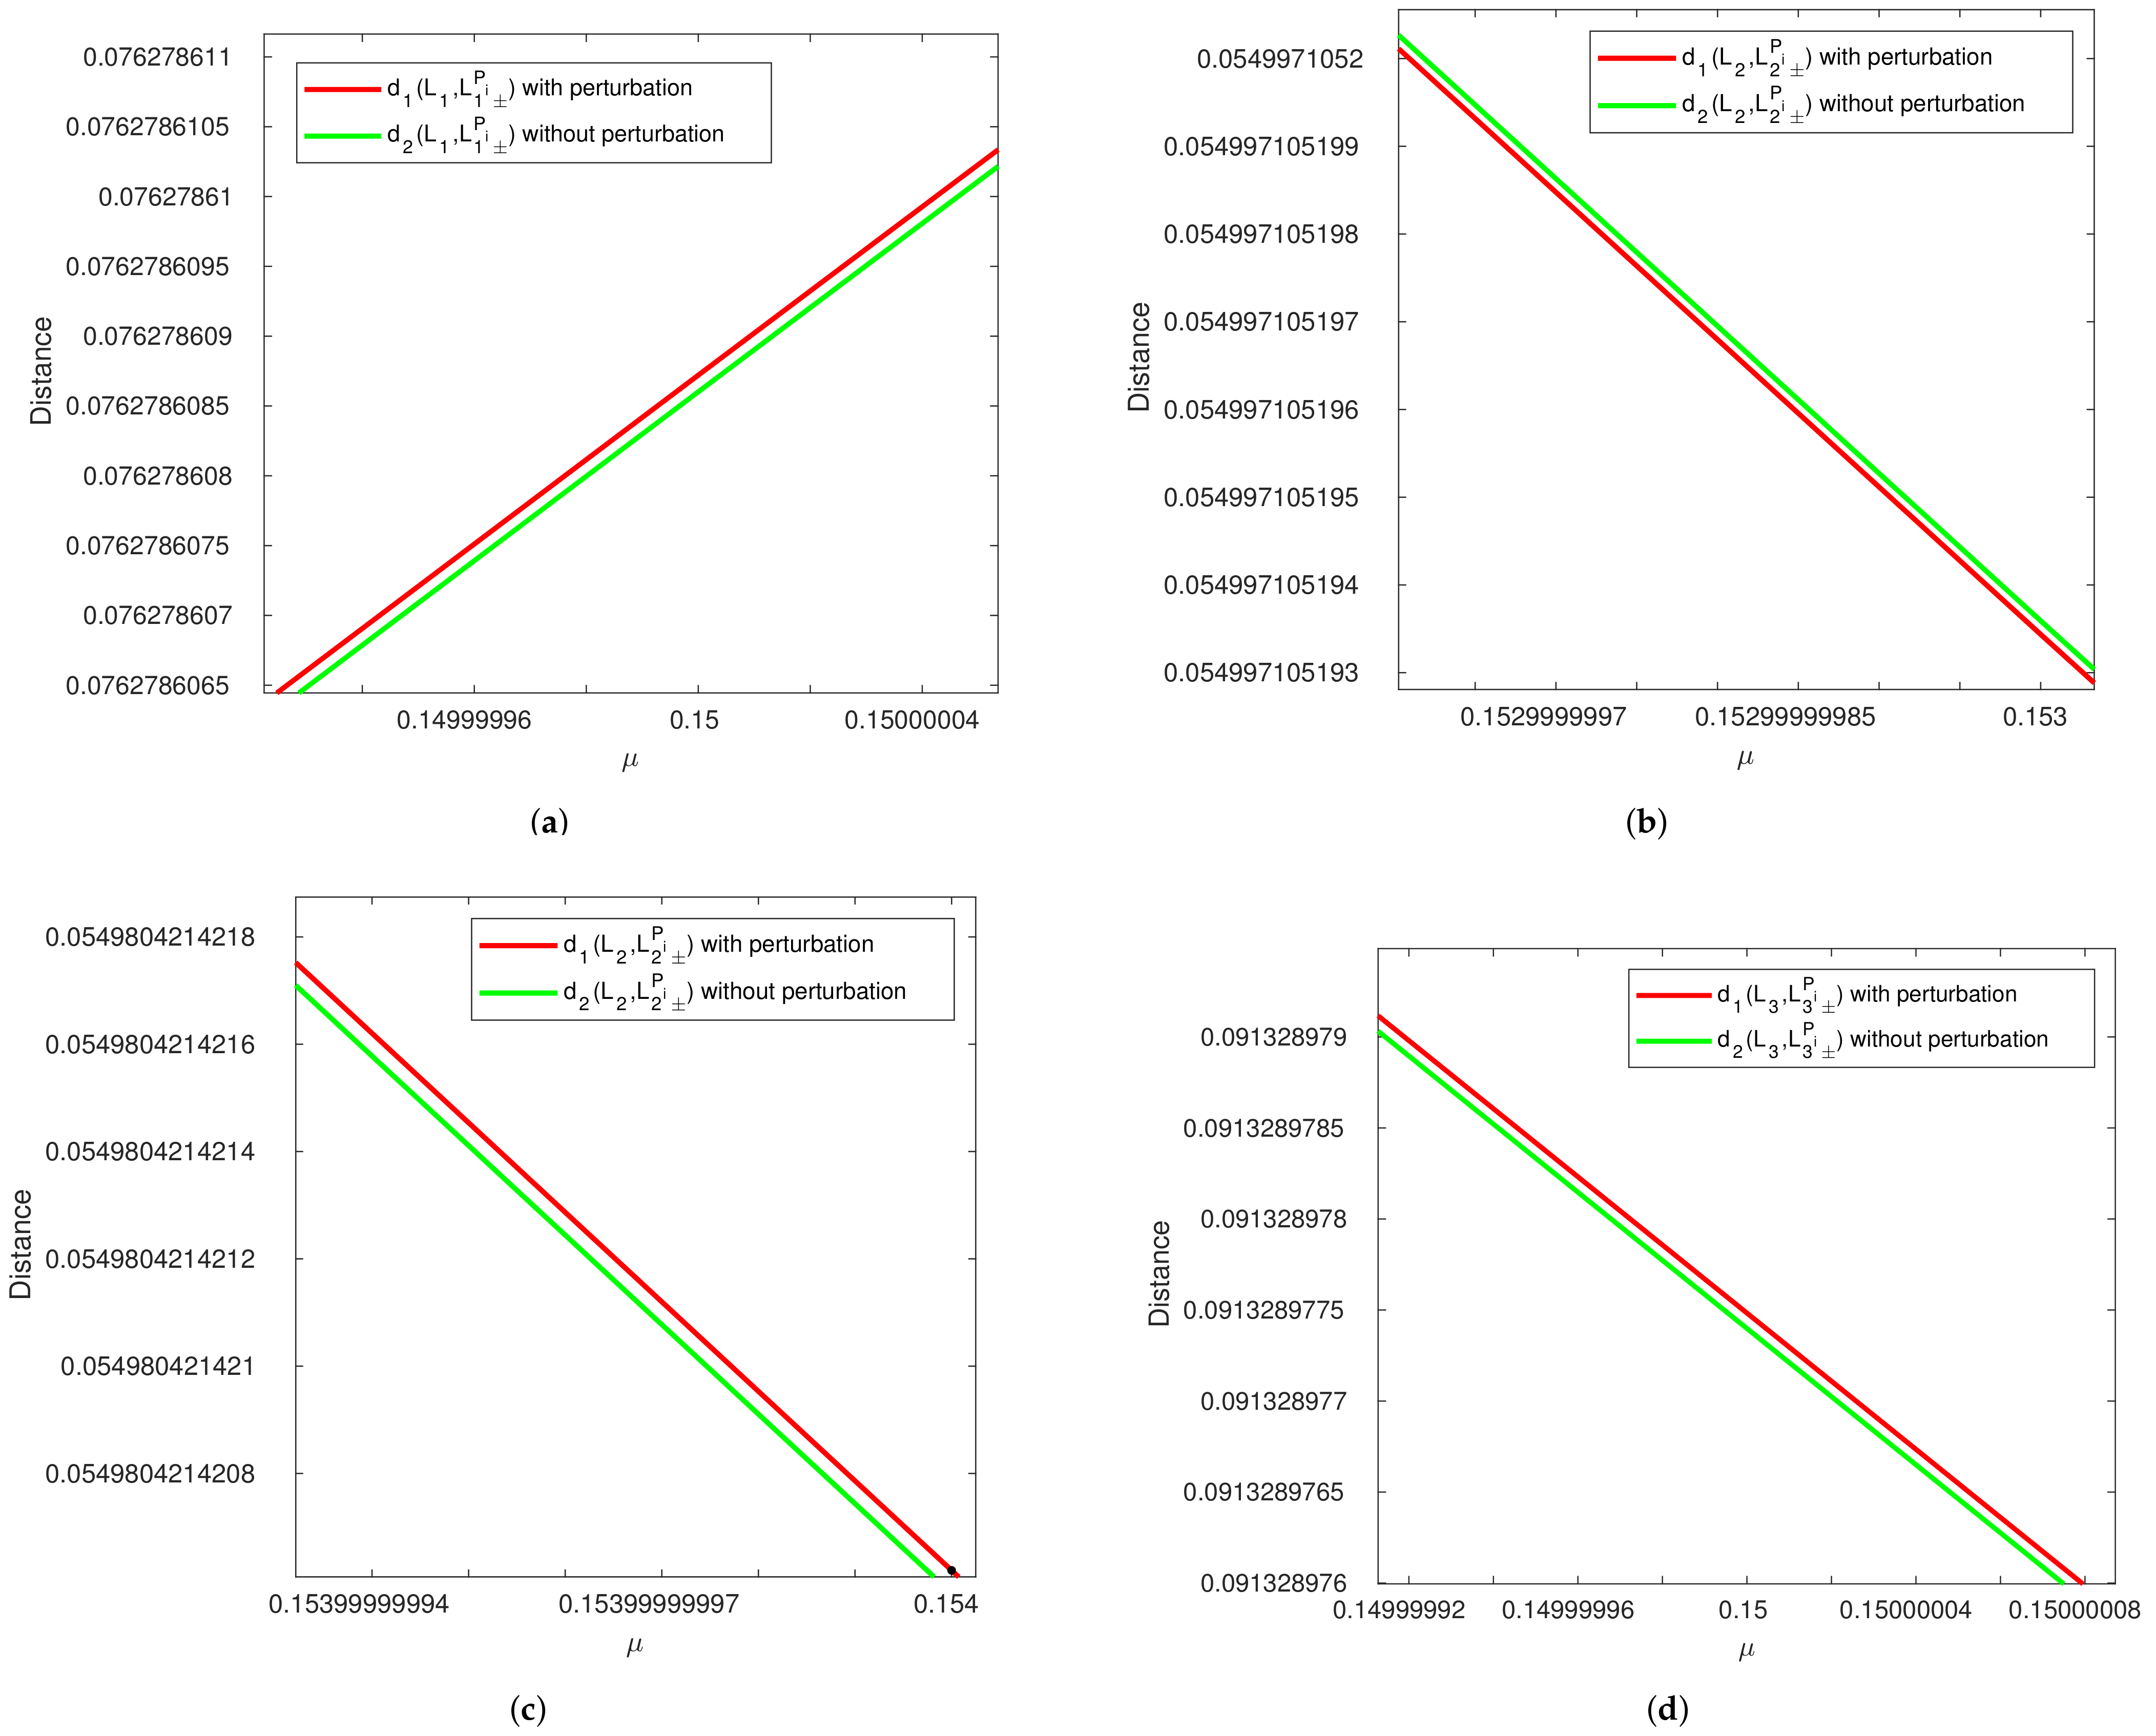
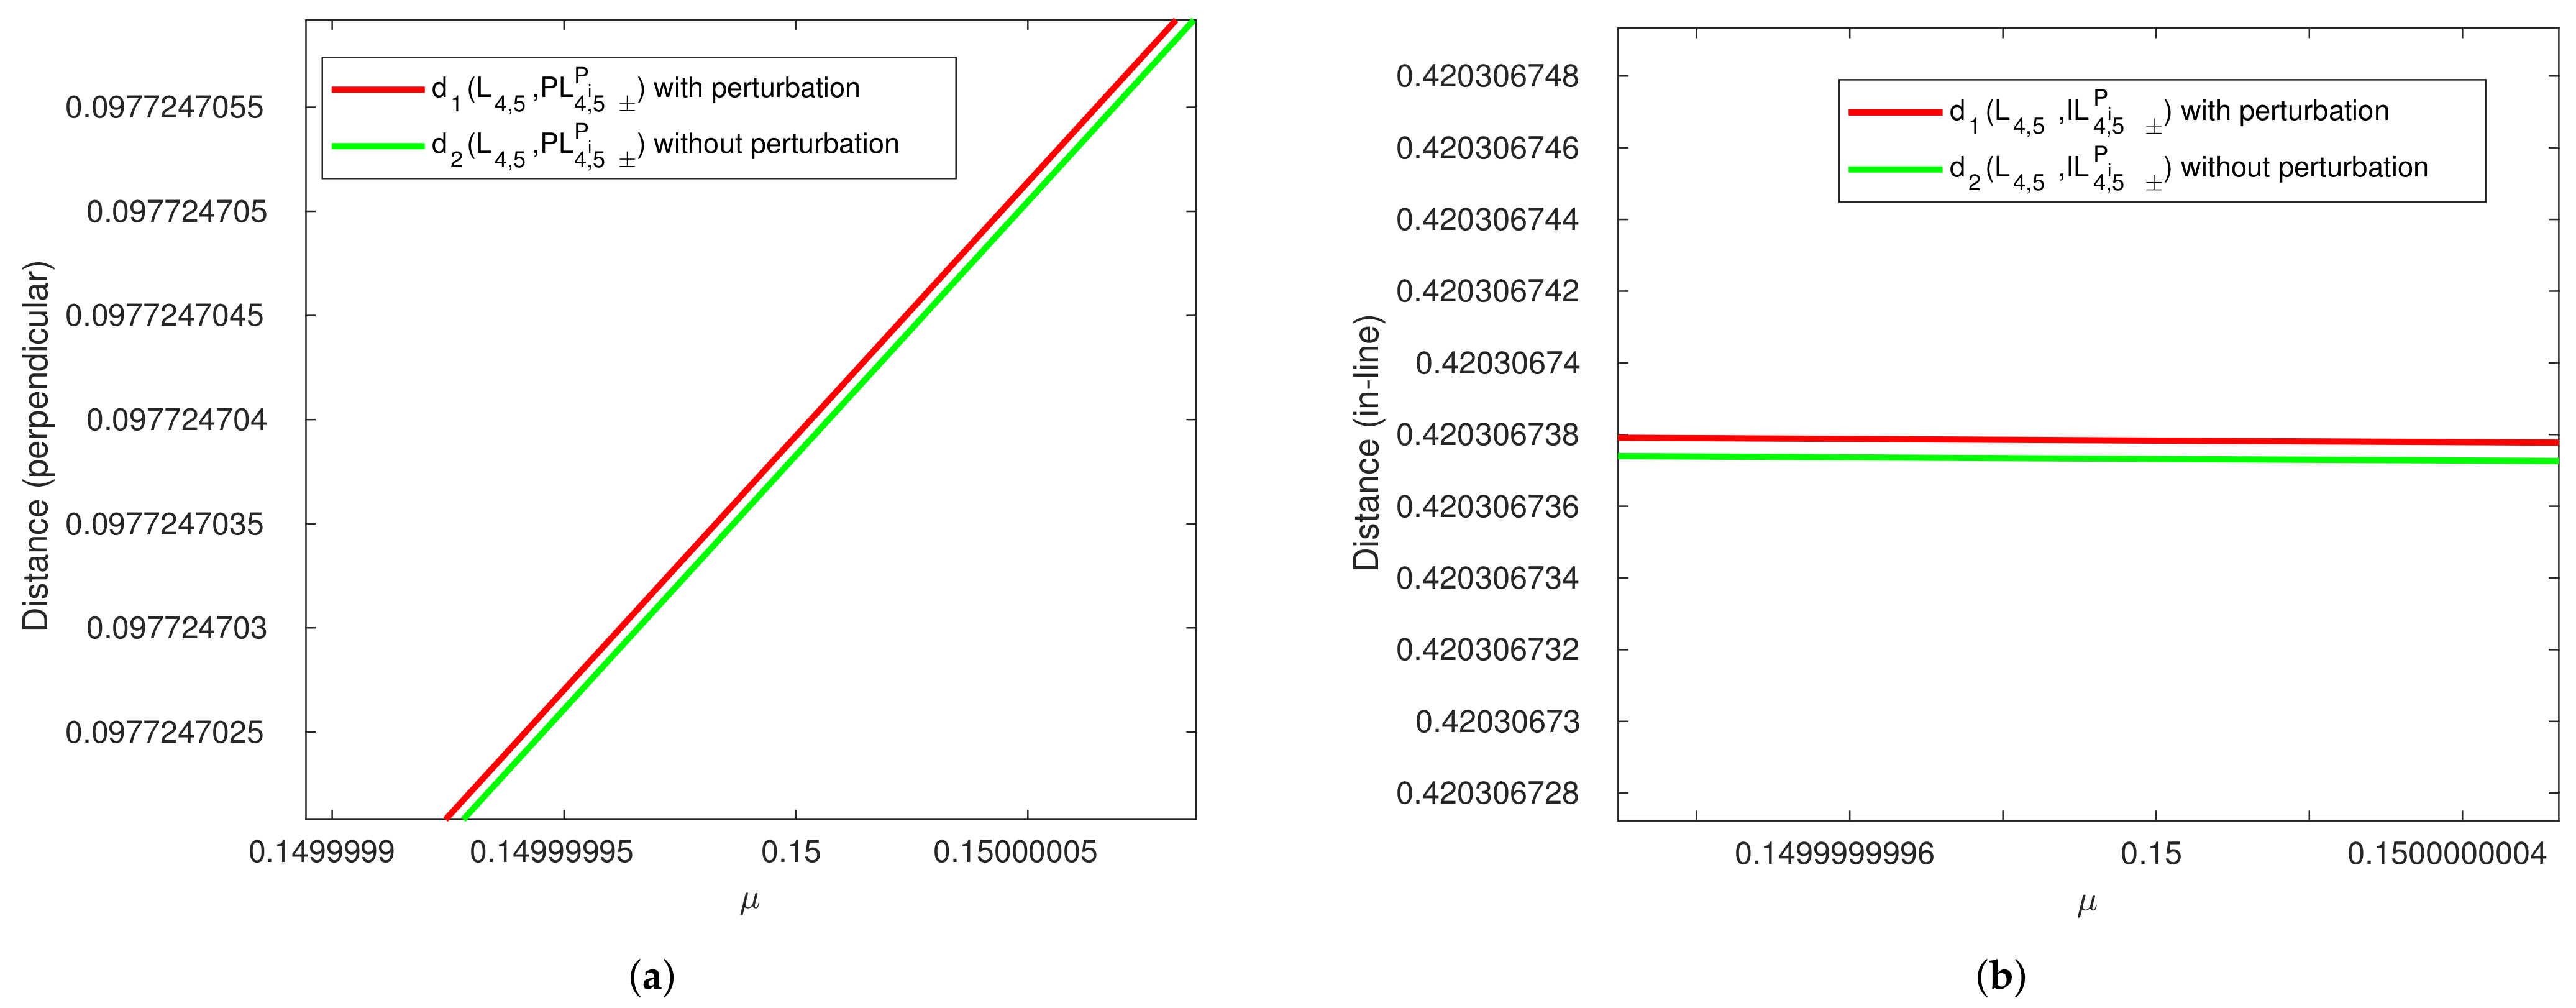
Comparison of distance versus between perturbed (red line) and unperturbed (green line) collinear equilibrium points in R2+2BP. (a) For equilibrium point. (b) For equilibrium point. (c) For equilibrium point. (d) For equilibrium point.
Figure 4.
Comparison of distance versus between perturbed (red line) and unperturbed (green line) collinear equilibrium points in R2+2BP. (a) For equilibrium point. (b) For equilibrium point. (c) For equilibrium point. (d) For equilibrium point.
Figure 5.
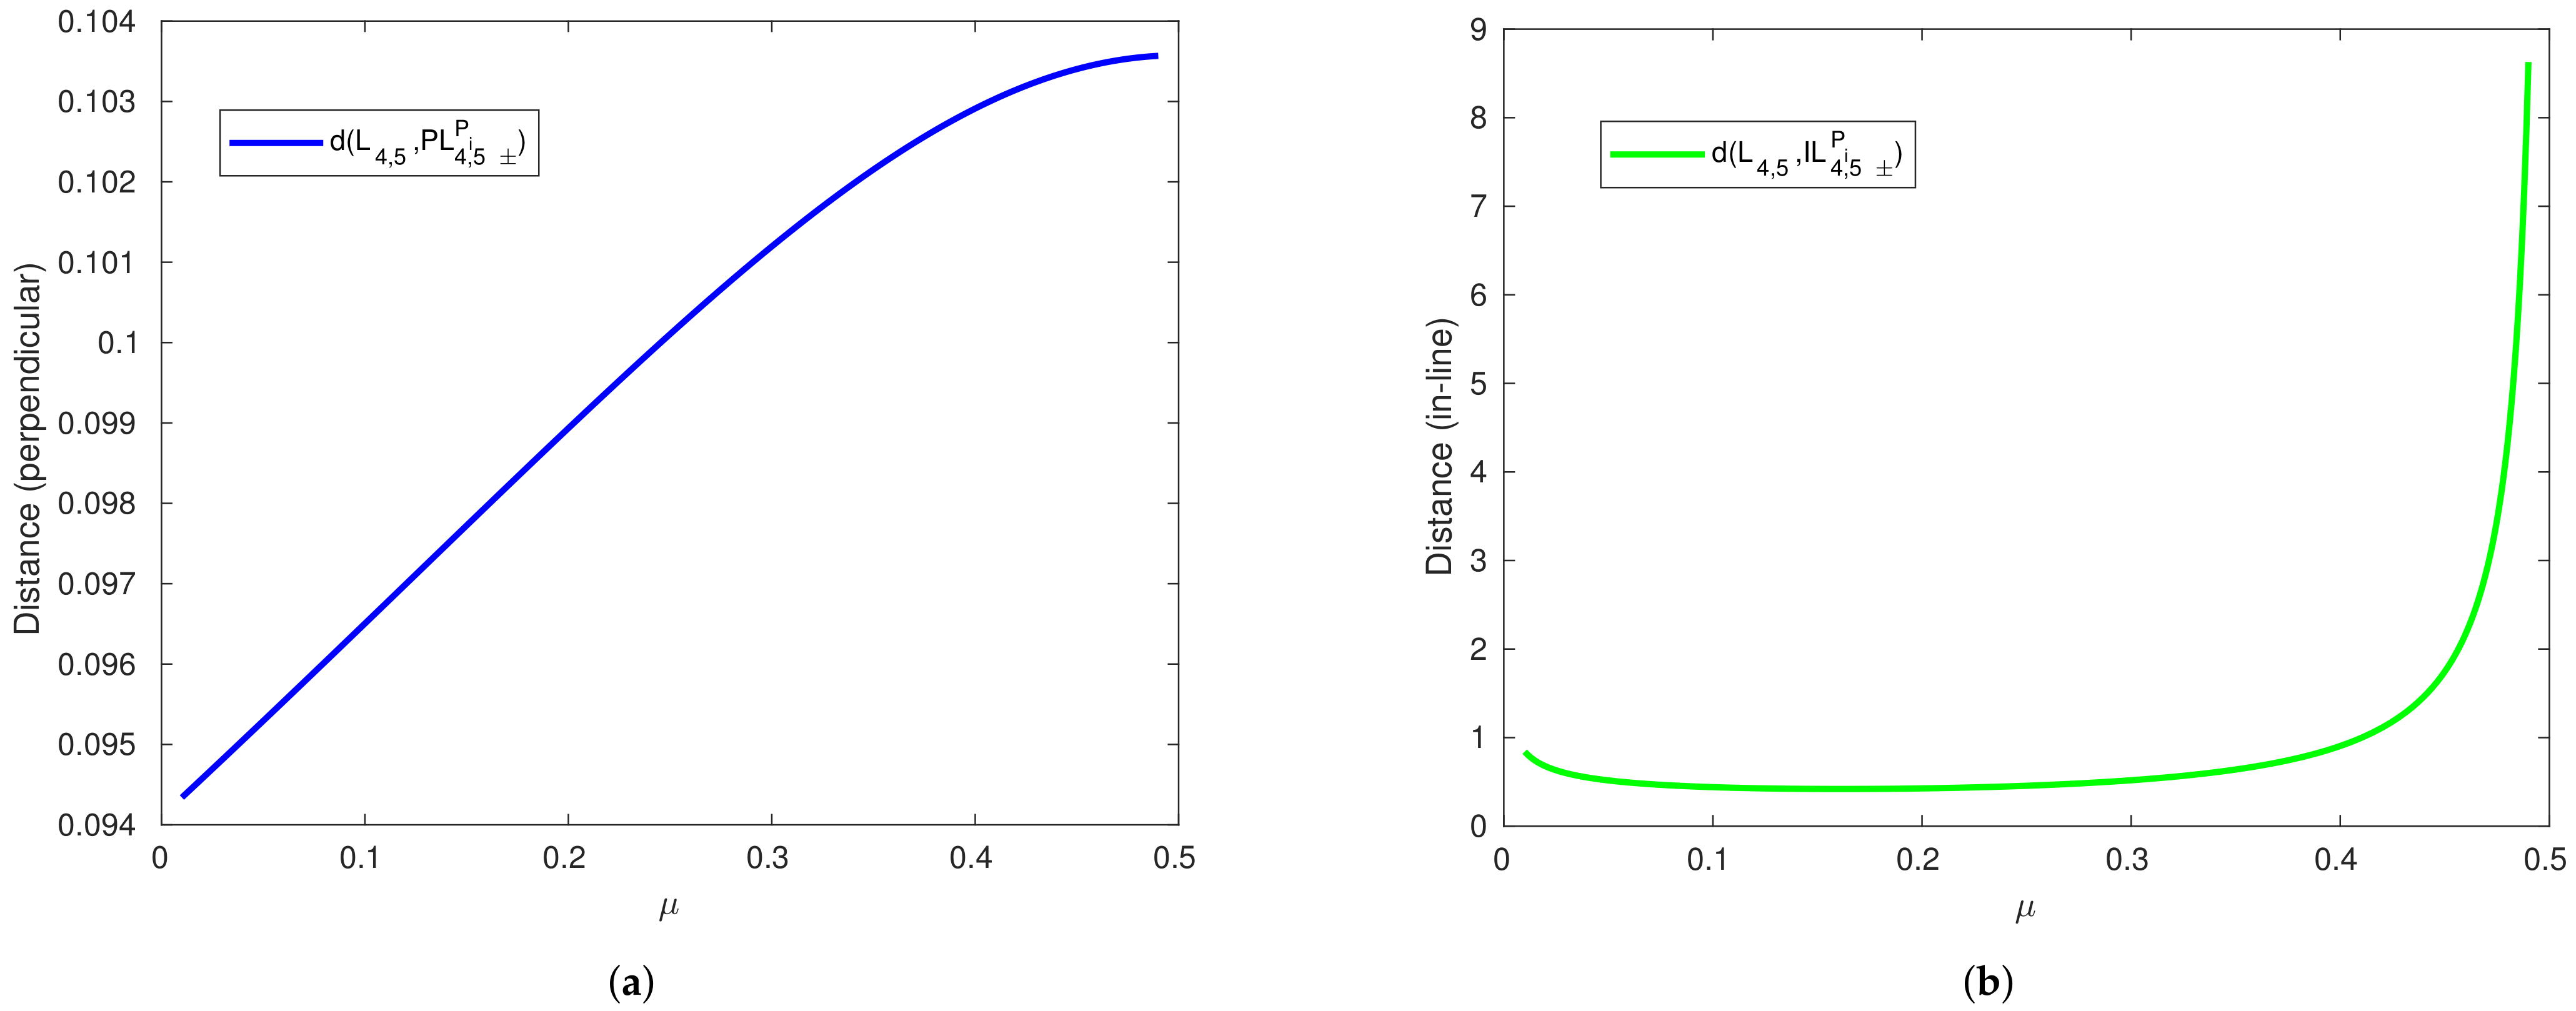
Distance versus in the presence of the planetesimal belt effect for noncollinear equilibrium points. (a) Perpendicular equilibrium points. (b) Inline equilibrium points.
Figure 5.
Distance versus in the presence of the planetesimal belt effect for noncollinear equilibrium points. (a) Perpendicular equilibrium points. (b) Inline equilibrium points.
Figure 6.
Comparison of distance versus between perturbed (red line) and unperturbed (green line) noncollinear equilibrium points in R2+2BP. (a) Perpendicular equilibrium points. (b) Inline equilibrium points.
Figure 6.
Comparison of distance versus between perturbed (red line) and unperturbed (green line) noncollinear equilibrium points in R2+2BP. (a) Perpendicular equilibrium points. (b) Inline equilibrium points.
Figure 7.
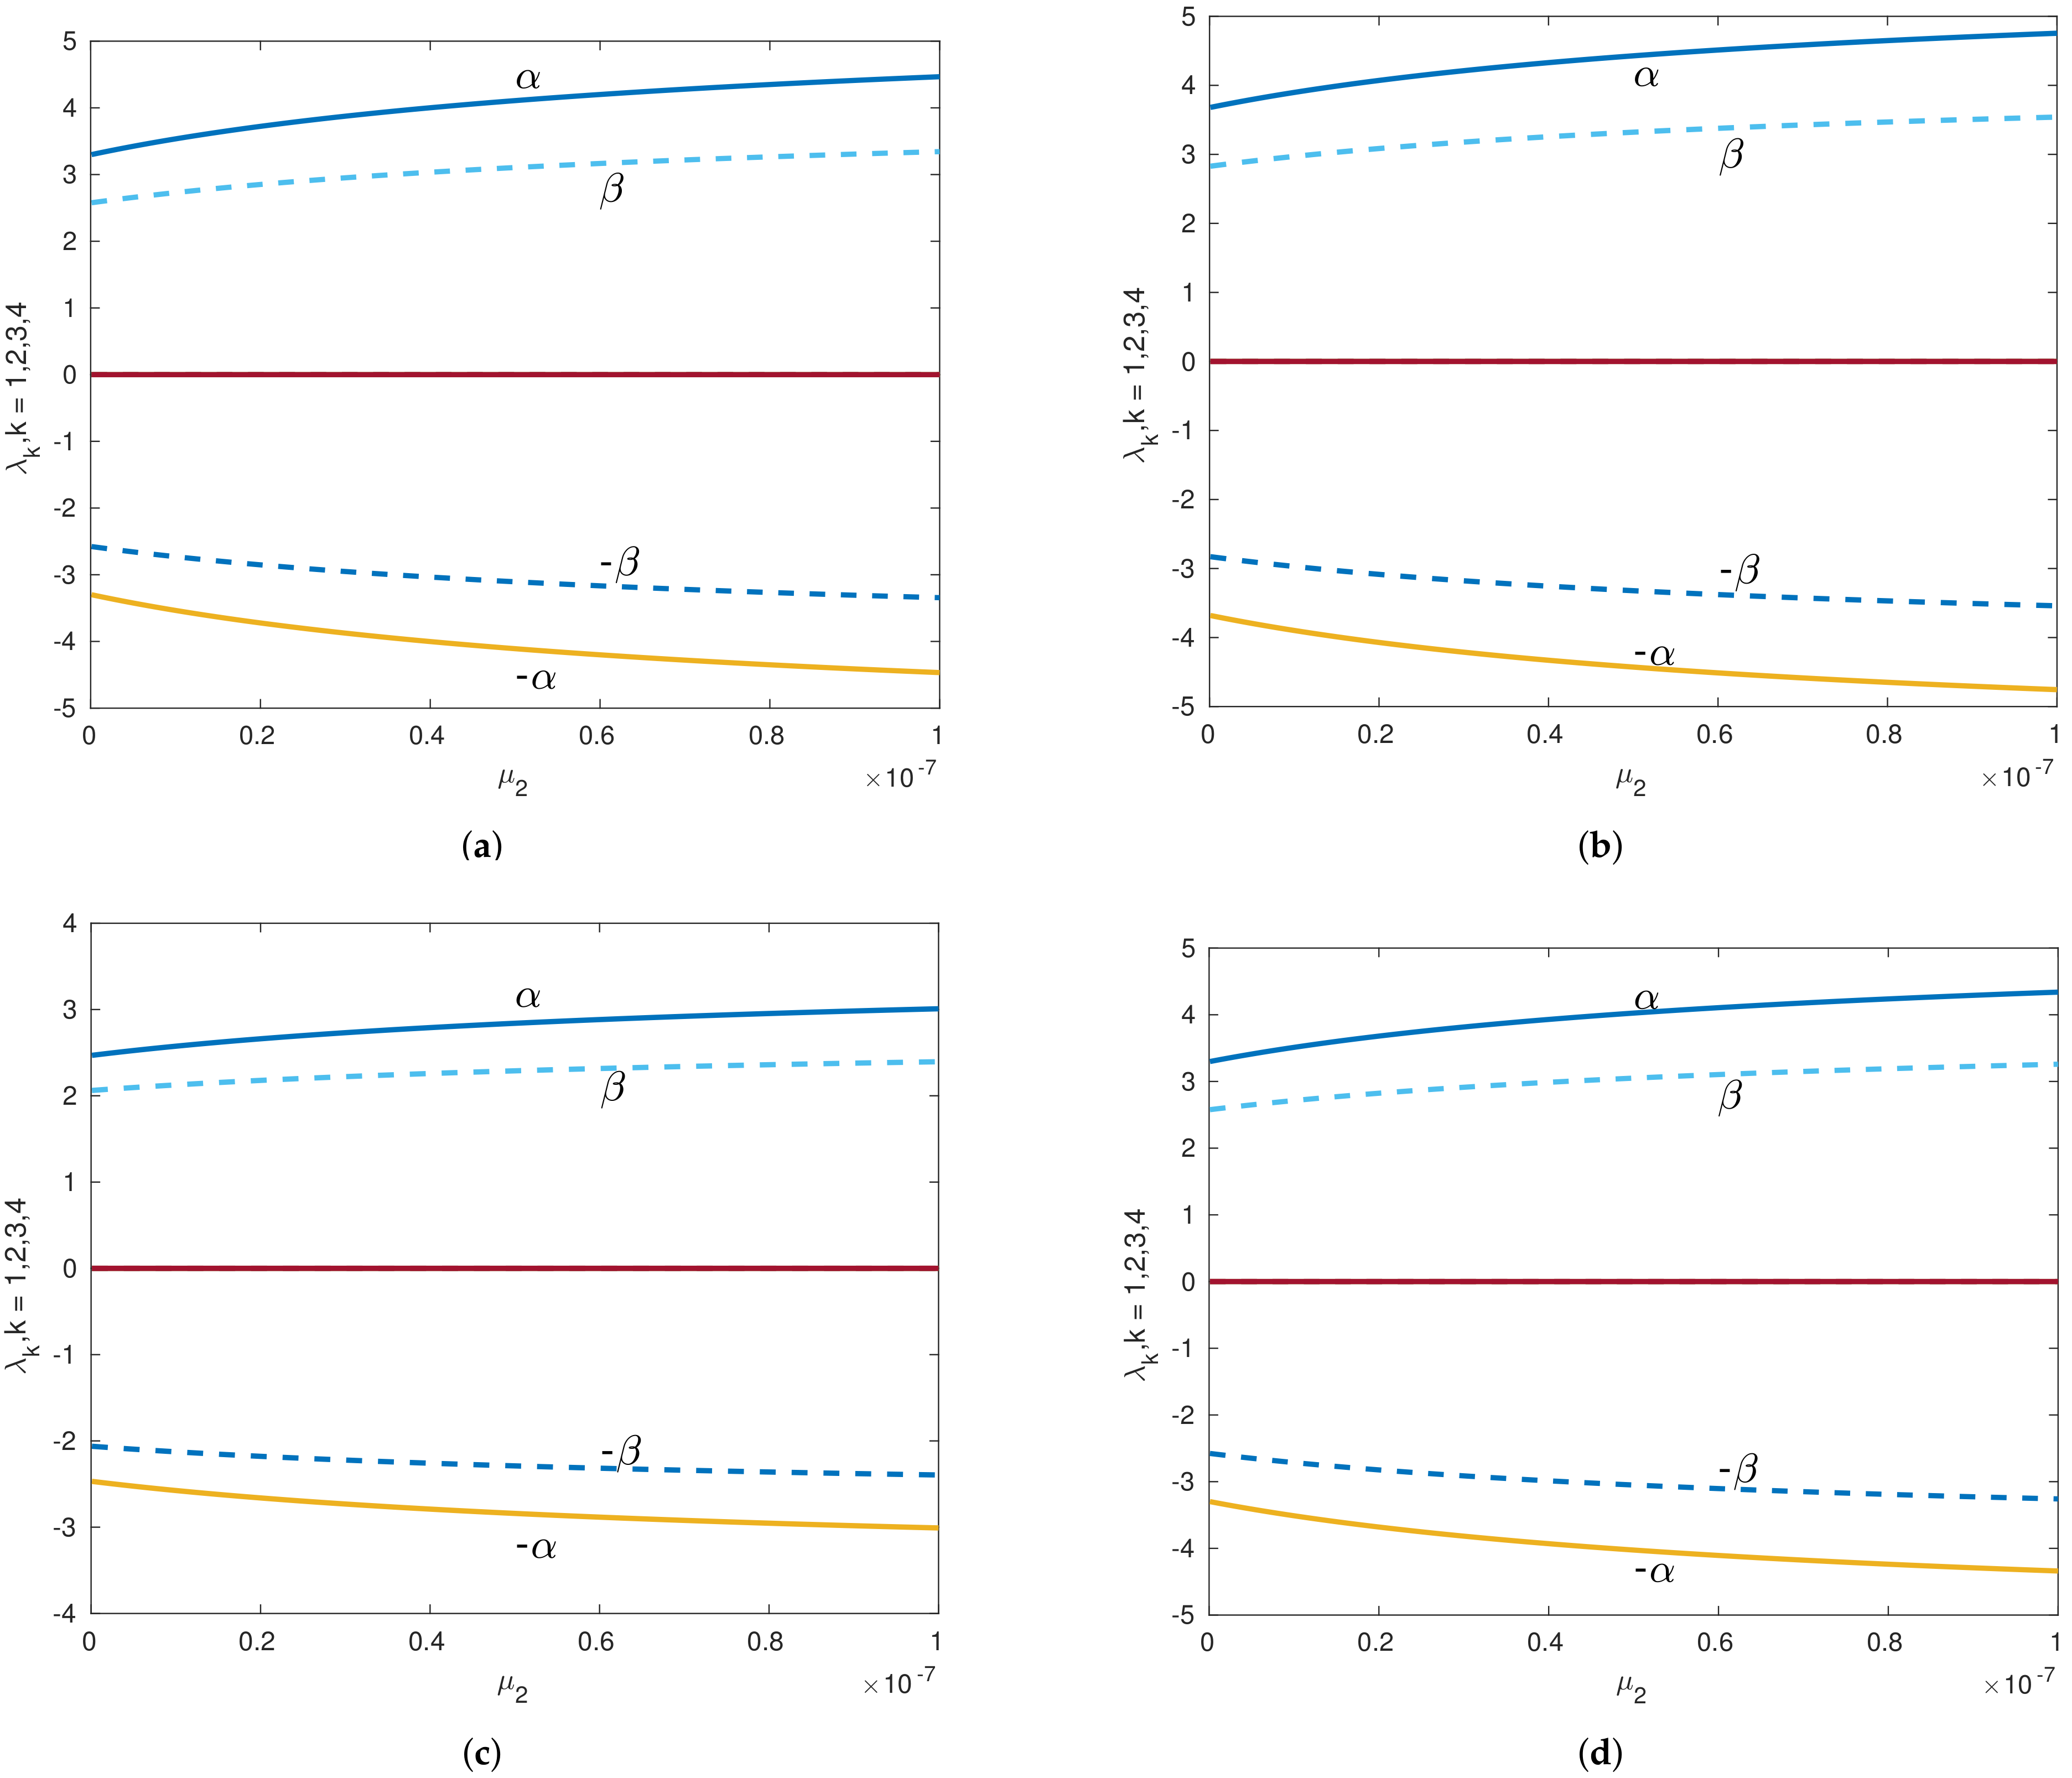
Eigenvalues versus of the Sun–Saturn system in the presence of the Kuiper belt effect for collinear equilibrium points with . Continuous lines indicate the real parts of the eigenvalues, and dashed lines denote the imaginary parts of the eigenvalues for collinear points. (a) Eigenvalues versus of equilibrium point left to . (b) Eigenvalues versus of equilibrium point right to . (c) Eigenvalues versus of equilibrium point left to . (d) Eigenvalues versus of equilibrium point right to . (e) Eigenvalues versus of equilibrium point left to . (f) Eigenvalues versus of equilibrium point right to .
Figure 8.
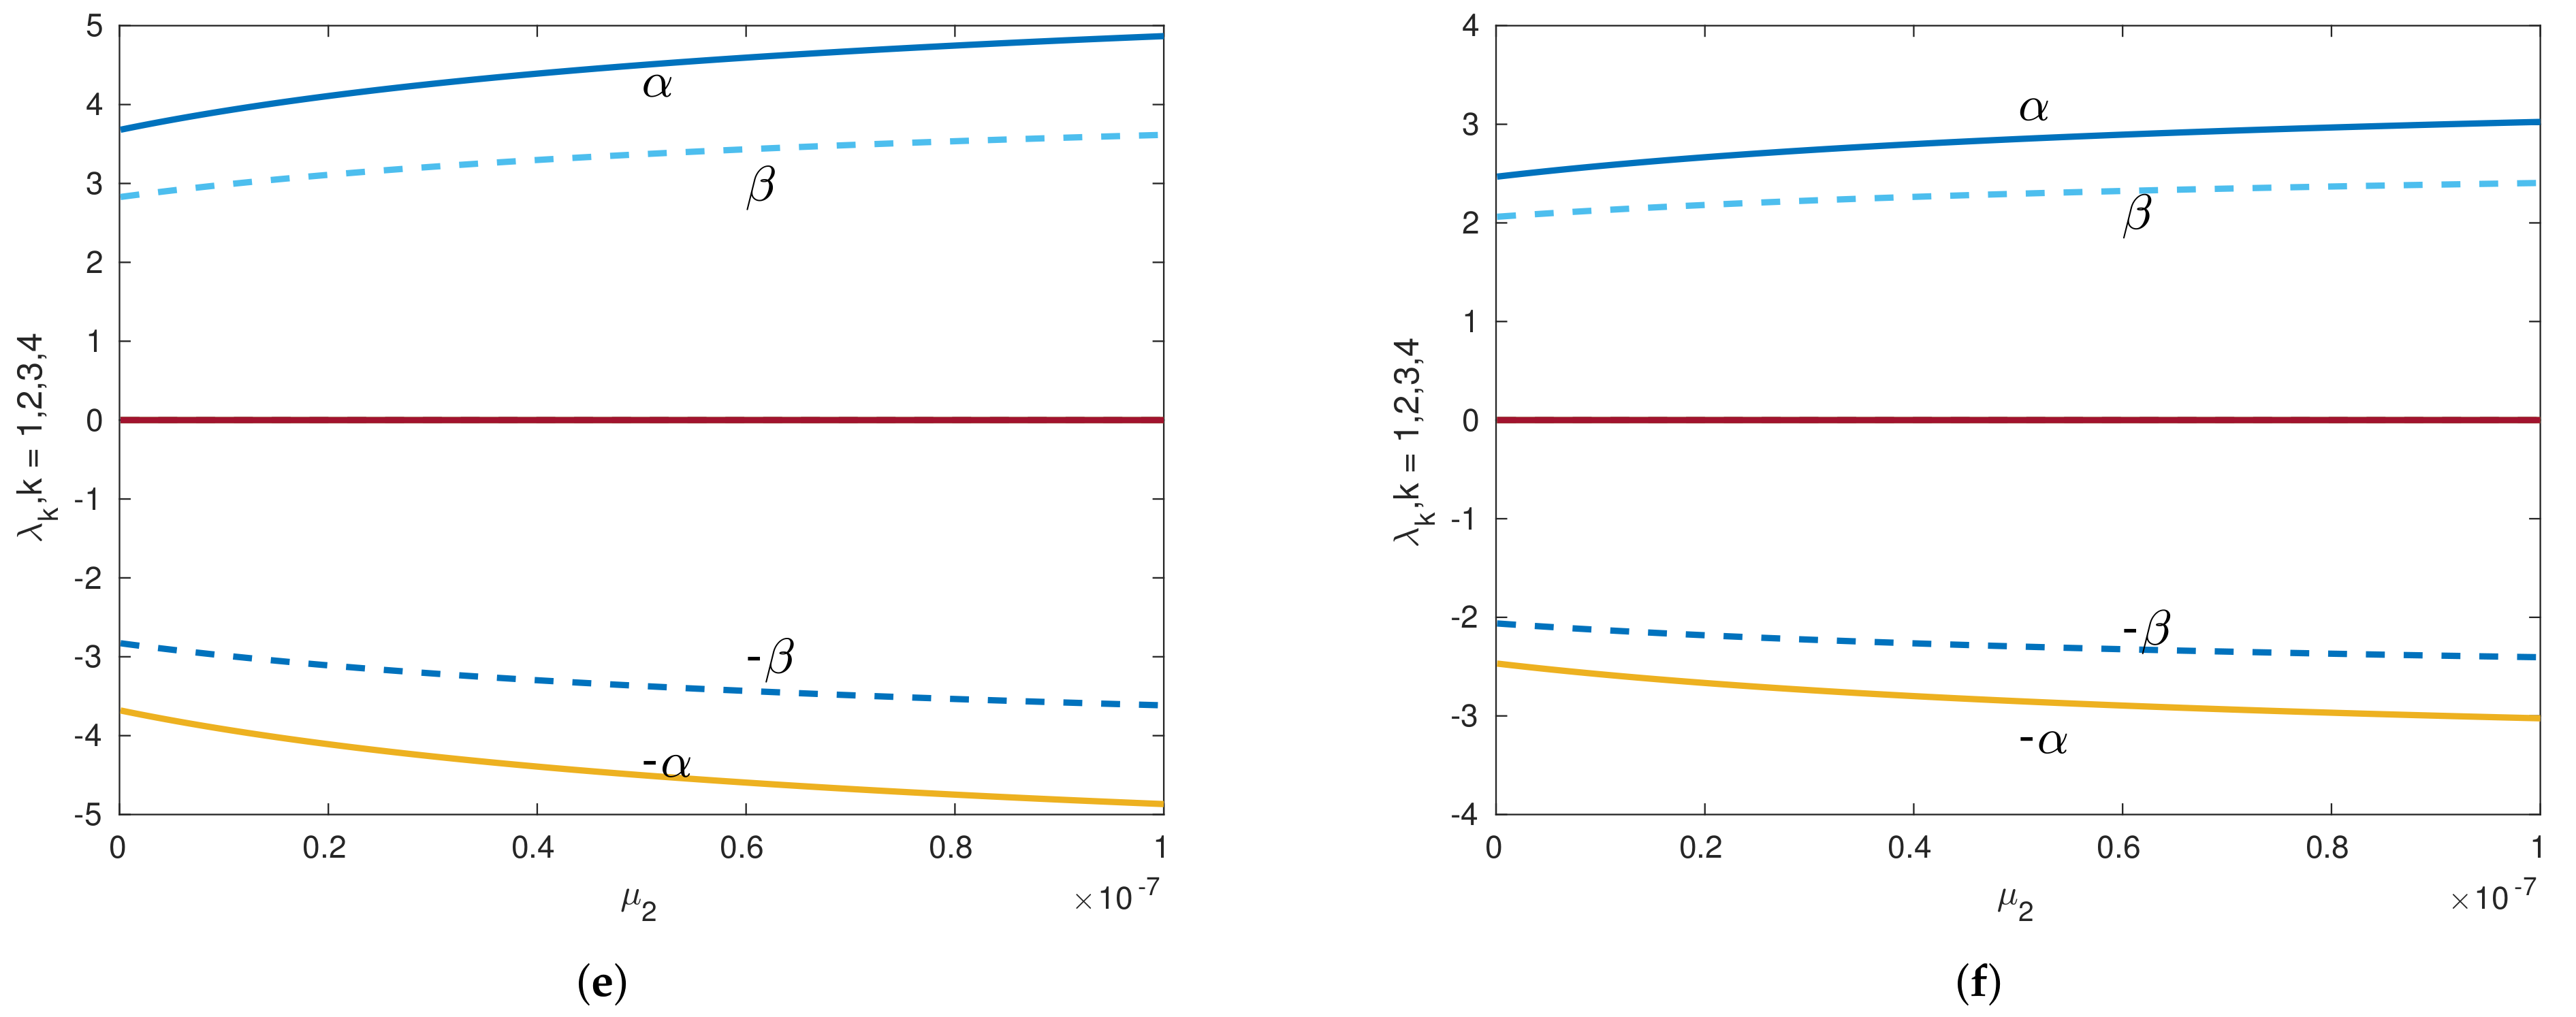
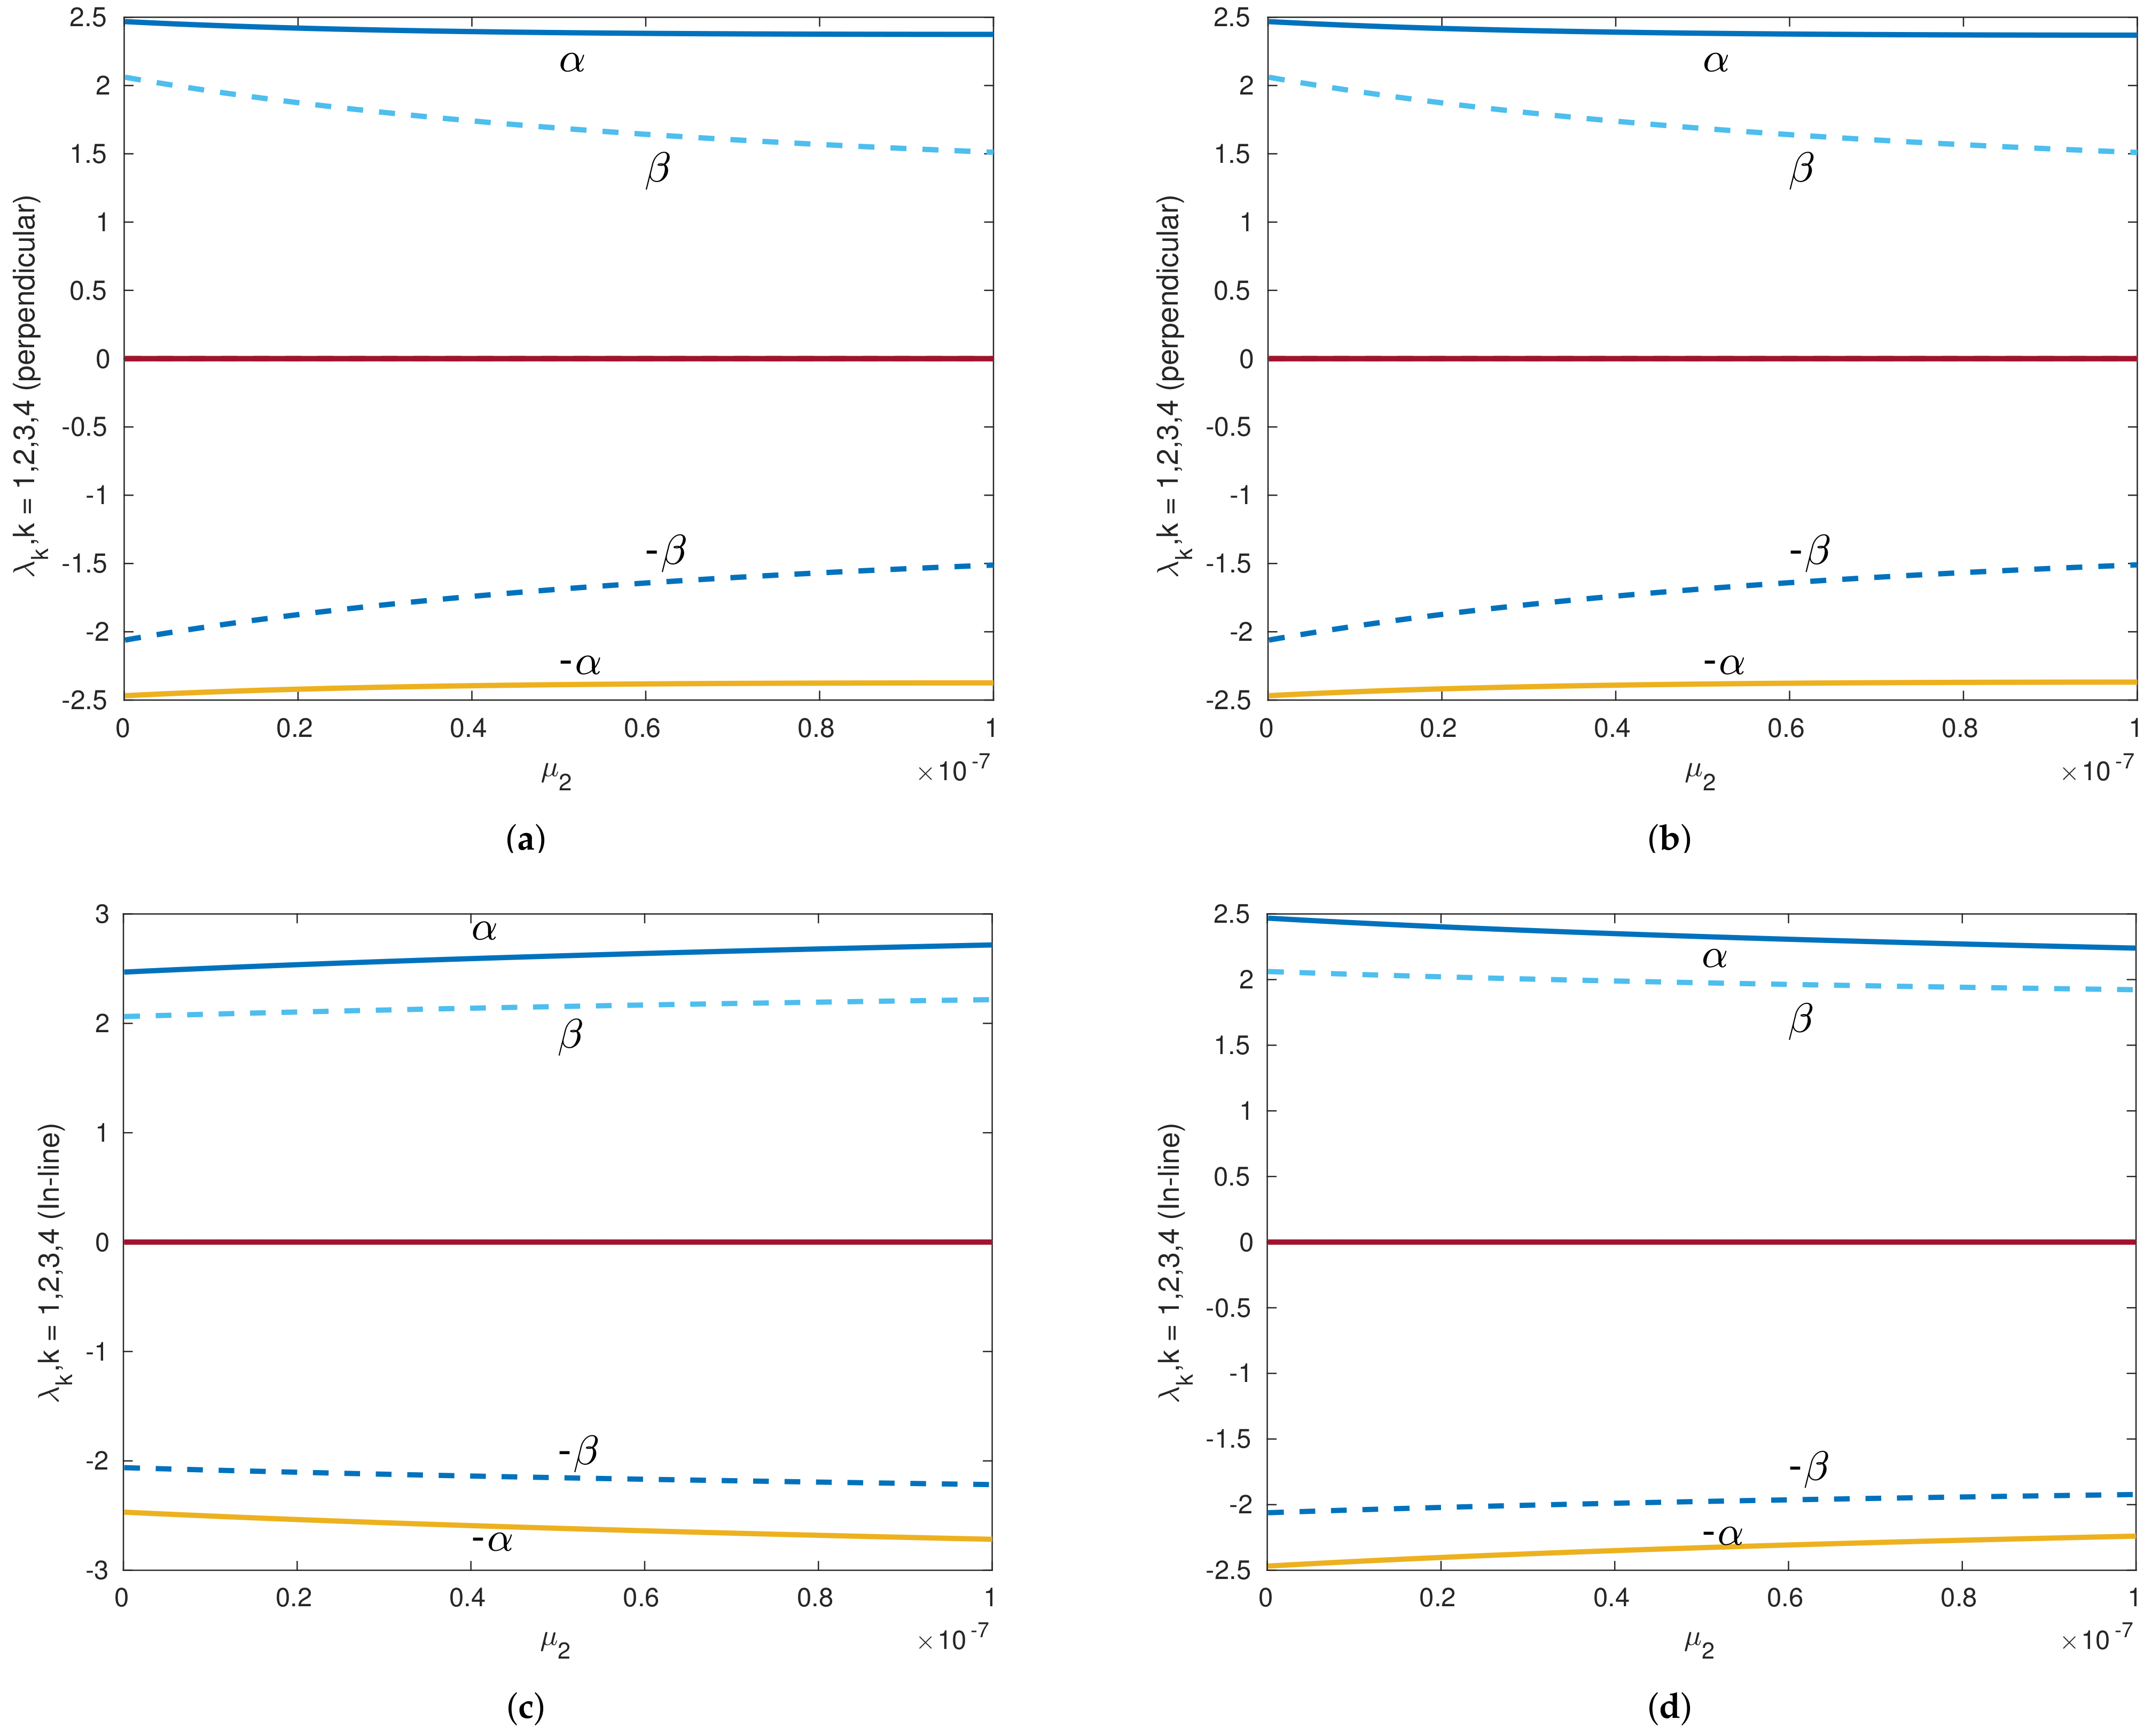
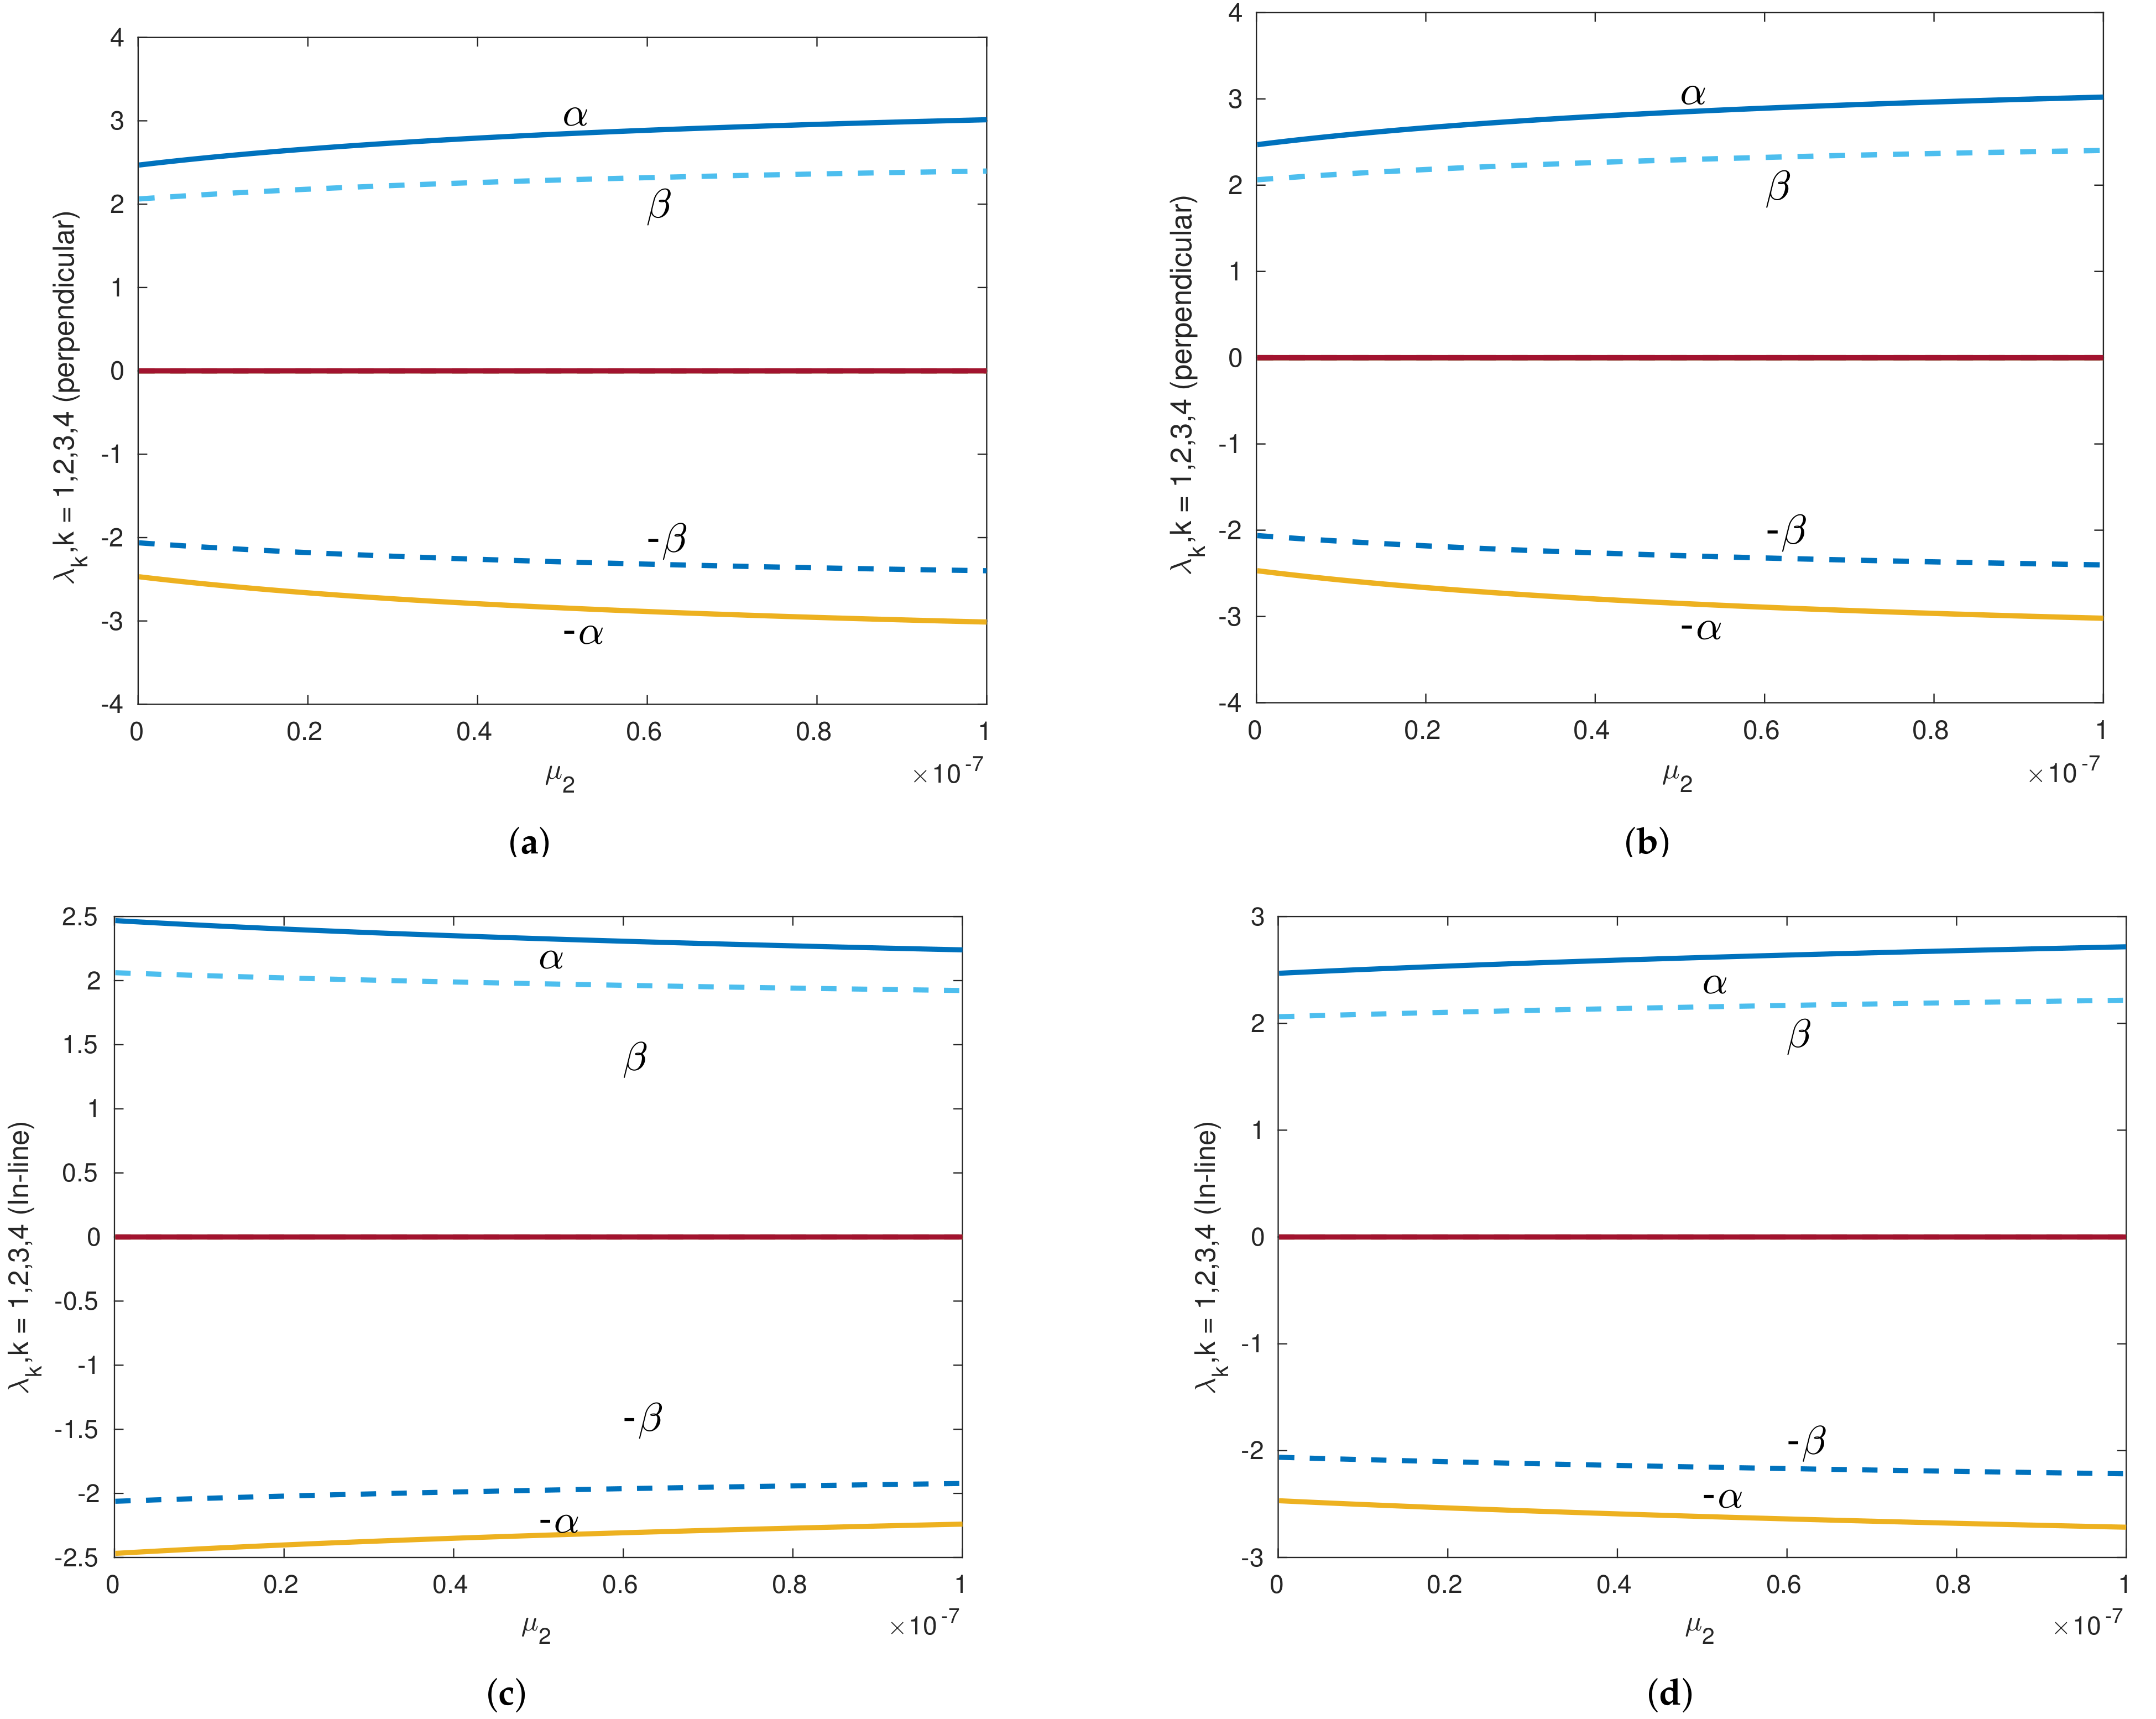
Eigenvalues versus of th Sun–Saturn system in the presence of the Kuiper belt effect near equilibrium point with . Continuous lines denote the real part of the eigenvalues, and dashed lines denote the imaginary parts of the eigenvalues for collinear points. (a) Eigenvalues of perpendicular equilibrium point near toward smaller primary. (b) Eigenvalues of perpendicular equilibrium point near away from smaller primary. (c) Eigenvalues of inline equilibrium point near away from center. (d) Eigenvalues of inline equilibrium point near toward center.
Figure 9.
Eigenvalues versus of the Sun–Saturn system in the presence of the Kuiper belt effect near equilibrium point with . Continuous lines denote the real part of the eigenvalues, and dashed lines denote the imaginary parts of the eigenvalues for collinear points. (a) Eigenvalues of perpendicular equilibrium point near toward smaller primary. (b) Eigenvalues of perpendicular equilibrium point near away from smaller primary. (c) Eigenvalues of inline equilibrium point near away from center. (d) Eigenvalues of inline equilibrium point near toward center.
Table 1.
Equilibrium solution of R2+2BP near .
Table 1.
Equilibrium solution of R2+2BP near .
| | | | |
|---|
| 0.0001 | −1.03220039257577 | −1.03264998998316 | −1.03242743926651 | −1.03242294329243 |
| 0.0010 | −1.06968776321577 | −1.07014443189694 | −1.06991838089976 | −1.06991381421295 |
| 0.0100 | −1.14652917405563 | −1.14700090922027 | −1.14676740031377 | −1.14676268296213 |
| 0.1000 | −1.25944627441467 | −1.25995339005807 | −1.25970236781459 | −1.25969729665815 |
Table 2.
Equilibrium solution of R2+2BP near .
Table 2.
Equilibrium solution of R2+2BP near .
| | | | |
|---|
| 0.0001 | −0.96784674731841 | −0.96828366422587 | −0.96806302118760 | −0.96806739035667 |
| 0.0010 | −0.93107229302701 | −0.93150165725965 | −0.93128482832217 | −0.93128912196449 |
| 0.0100 | −0.84787219955956 | −0.84828522573752 | −0.84807664751765 | −0.84808077777943 |
| 0.1000 | −0.60884456030787 | −0.60922565908104 | −0.60903320420059 | −0.60903701518832 |
Table 3.
Equilibrium solution of R2+2BP near .
Table 3.
Equilibrium solution of R2+2BP near .
| | | | |
|---|
| 0.0001 | 1.00036136204178 | 0.99972197050552 | 1.00004486323133 | 1.00003846931597 |
| 0.0010 | 1.00073630603426 | 1.00009702640224 | 1.00041986261641 | 1.00041346982009 |
| 0.0100 | 1.00448569150204 | 1.00384753168358 | 1.00416980239190 | 1.00416342079372 |
| 0.1000 | 1.04192234926276 | 1.04129546687074 | 1.04161204247871 | 1.04160577365479 |
Table 4.
Equilibrium solution near of different planetary systems.
Table 4.
Equilibrium solution near of different planetary systems.
| | | | |
|---|
| 0.0002860 | −1.04608393024869 | −1.04613298051897 | −1.04608402825123 | −1.04603497798094 |
| 0.0000310 | −1.02190711476239 | −1.02195566697454 | −1.02190721176980 | −1.02185865955764 |
| 0.0000003 | −1.00464841079892 | −1.00469660080715 | −1.00464850708266 | −1.00460031707443 |
Table 5.
Equilibrium solution near of different planetary systems.
Table 5.
Equilibrium solution near of different planetary systems.
| | | | |
|---|
| 0.0002860 | −0.95473464120842 | −0.95478173944278 | −0.95473473531078 | −0.95468763707642 |
| 0.0000310 | −0.97834688228738 | −0.97839450372324 | −0.97834697743511 | −0.97829935599925 |
| 0.0000003 | −0.99536525492820 | −0.99541324652773 | −0.99536535081551 | −0.99531735921598 |
Table 6.
Equilibrium solution near of different planetary systems.
Table 6.
Equilibrium solution near of different planetary systems.
| | | | |
|---|
| 0.0002860 | 1.00011913765467 | 1.00004978229365 | 1.00011899908252 | 1.00018835444353 |
| 0.0000310 | 1.00001290410545 | 0.99994354530304 | 1.00001276552642 | 1.00008212432883 |
| 0.0000003 | 1.00000019376614 | 0.99993083453848 | 1.00000005518627 | 1.00006941441393 |
Table 7.
Perpendicular equilibrium solution of the restricted 2 + 2 body problem near .
Table 7.
Perpendicular equilibrium solution of the restricted 2 + 2 body problem near .
| | | | |
|---|
| | | |
|---|
| 0.0001 | −0.49990159842961 | 0.86602249507265 | −0.49989840157039 | 0.86602803274910 |
| | −0.50005984296138 | 0.86574838008869 | −0.49974015703862 | 0.86630214773306 |
| 0.0010 | −0.49900159770815 | 0.86602249376500 | −0.49899840229185 | 0.86602803393550 |
| | −0.49915977081539 | 0.86574825532526 | −0.49884022918461 | 0.86630227237524 |
| 0.0100 | −0.49000159029866 | 0.86602248059246 | −0.48999840970134 | 0.86602804590512 |
| | −0.49015902986560 | 0.86574699761614 | −0.48984097013440 | 0.86630352888144 |
| 0.1000 | −0.40000149309951 | 0.86602233889207 | −0.39999850690049 | 0.86602817663806 |
| | −0.40014930995065 | 0.86573337046563 | −0.39985069004935 | 0.86631714506449 |
Table 8.
In-ine equilibrium solution of the restricted 2 + 2 body problem near .
Table 8.
In-ine equilibrium solution of the restricted 2 + 2 body problem near .
| | | | |
|---|
| | | |
|---|
| 0.0001 | −0.49978629067686 | 0.86595962036838 | −0.50001370932314 | 0.86609090745337 |
| | −0.48852906768613 | 0.85946090966168 | −0.51127093231387 | 0.87258961816007 |
| 0.0010 | −0.49894714879015 | 0.86599478074186 | −0.49905285120985 | 0.86605574695864 |
| | −0.49371487901505 | 0.86297695301132 | −0.50428512098495 | 0.86907357468918 |
| 0.0100 | −0.48997516675820 | 0.86601107095682 | −0.49002483324180 | 0.86603945554077 |
| | −0.48751667582044 | 0.86460603405128 | −0.49248332417956 | 0.86744449244630 |
| 0.1000 | −0.39998667432169 | 0.86601844124247 | −0.40001332567831 | 0.86603207428765 |
| | −0.39866743216923 | 0.86534360550600 | −0.40133256783077 | 0.86670691002412 |
Table 9.
Perpendicular equilibrium solution of the restricted 2 + 2 body problem near .
Table 9.
Perpendicular equilibrium solution of the restricted 2 + 2 body problem near .
| | | | |
|---|
| | | |
|---|
| 0.0001 | −0.49989840157039 | −0.86602803274910 | −0.49990159842961 | −0.86602249507265 |
| | −0.49974015703862 | −0.86630214773306 | −0.50005984296138 | −0.86574838008869 |
| 0.0010 | −0.49899840229185 | −0.86602803393550 | −0.49900159770815 | −0.86602249376500 |
| | −0.49884022918461 | −0.86630227237524 | −0.49915977081539 | −0.86574825532526 |
| 0.0100 | −0.48999840970134 | −0.86602804590512 | −0.49000159029866 | −0.86602248059246 |
| | −0.48984097013440 | −0.86630352888144 | −0.49015902986560 | −0.86574699761614 |
| 0.1000 | −0.39999850690049 | −0.86602817663806 | −0.40000149309951 | −0.86602233889207 |
| | −0.39985069004935 | −0.86631714506449 | −0.40014930995065 | −0.86573337046563 |
Table 10.
The inline equilibrium solution of the restricted 2 + 2 body problem near .
Table 10.
The inline equilibrium solution of the restricted 2 + 2 body problem near .
| | | | |
|---|
| | | |
|---|
| 0.0001 | −0.50001370932314 | −0.86609090745337 | −0.49978629067686 | −0.86595962036838 |
| | −0.51127093231387 | −0.87258961816007 | −0.48852906768613 | −0.85946090966168 |
| 0.0010 | −0.49905285120985 | −0.86605574695864 | −0.49894714879015 | −0.86599478074186 |
| | −0.50428512098495 | −0.86907357468918 | −0.49371487901505 | −0.86297695301132 |
| 0.0100 | −0.49002483324180 | −0.86603945554077 | −0.48997516675820 | −0.86601107095682 |
| | −0.49248332417956 | −0.86744449244630 | −0.48751667582044 | −0.86460603405128 |
| 0.1000 | −0.40001332567831 | −0.86603207428765 | −0.39998667432169 | −0.86601844124247 |
| | −0.40133256783077 | −0.86670691002412 | −0.39866743216923 | −0.86534360550600 |
Table 11.
Perpendicular equilibrium solution near of different planetary systems.
Table 11.
Perpendicular equilibrium solution near of different planetary systems.
| | | | |
|---|
| | | |
|---|
| 0.000286 | −0.49971403464001 | 0.86602523034786 | −0.49971396535999 | 0.86602535037870 |
| | −0.49974864000649 | 0.86596527494152 | −0.49967935999351 | 0.86608530578504 |
| 0.000031 | −0.49996903464443 | 0.86602524927065 | −0.49996896535557 | 0.86602536928619 |
| | −0.50000364442855 | 0.86596530150765 | −0.49993435557145 | 0.86608531704919 |
| 0.000000 | −0.49999973464497 | 0.86602534317275 | −0.49999966535503 | 0.86602546318647 |
| | −0.50003434496569 | 0.86596539632081 | −0.49996505503431 | 0.86608541003841 |
Table 12.
Inline equilibrium solution near of different planetary systems.
Table 12.
Inline equilibrium solution near of different planetary systems.
| | | | |
|---|
| | | |
|---|
| 0.000286 | −0.49971226314910 | 0.86602428787884 | −0.49971573685090 | 0.86602629284772 |
| | −0.49797714910011 | 0.86502280592385 | −0.50145085089989 | 0.86702777480271 |
| 0.000031 | −0.49996535971608 | 0.86602320762467 | −0.49997264028392 | 0.86602741093216 |
| | −0.49632871608103 | 0.86392365553369 | −0.50360928391897 | 0.86812696302315 |
| 0.000000 | −0.49998261604195 | 0.86601553975479 | −0.50001678395805 | 0.86603526660443 |
| | −0.48291574195066 | 0.85616197836003 | −0.51708365804934 | 0.87588882799919 |
Table 13.
Perpendicular equilibrium solution near of different planetary systems.
Table 13.
Perpendicular equilibrium solution near of different planetary systems.
| | | | |
|---|
| | | |
|---|
| 0.000286 | −0.49971396535999 | −0.86602535037870 | −0.49971403464001 | −0.86602523034786 |
| | −0.49967935999351 | −0.86608530578504 | −0.49974864000649 | −0.86596527494152 |
| 0.000031 | −0.49996896535557 | −0.86602536928619 | −0.49996903464443 | −0.86602524927065 |
| | −0.49993435557145 | −0.86608531704919 | −0.50000364442855 | −0.86596530150765 |
| 0.000000 | −0.49999966535503 | −0.86602546318647 | −0.49999973464497 | −0.86602534317275 |
| | −0.49996505503431 | −0.86608541003841 | −0.50003434496569 | −0.86596539632081 |
Table 14.
Inline equilibrium solution near of different planetary systems.
Table 14.
Inline equilibrium solution near of different planetary systems.
| | | | |
|---|
| | | |
|---|
| 0.000286 | −0.49971396535999 | −0.86602535037870 | −0.49971403464001 | −0.86602523034786 |
| | −0.49967935999351 | −0.86608530578504 | −0.49974864000649 | −0.86596527494152 |
| 0.000031 | −0.49996896535557 | −0.86602536928619 | −0.49996903464443 | −0.86602524927065 |
| | −0.49993435557145 | −0.86608531704919 | −0.50000364442855 | −0.86596530150765 |
| 0.000000 | −0.49999966535503 | −0.86602546318647 | −0.49999973464497 | −0.86602534317275 |
| | −0.49996505503431 | −0.86608541003841 | −0.50003434496569 | −0.86596539632081 |

