Article

A Comprehensive Failure Risk Assessment Method of Machining Center Component Based on Topology Analysis

1
Key Laboratory of Reliability of CNC Equipment, Ministry of Education, Changchun 130022, China
2
School of Mechanical and Aerospace Engineering, Jilin University, Changchun 130022, China
*
Author to whom correspondence should be addressed.
Appl. Sci. 2022, 12(1), 423; https://doi.org/10.3390/app12010423
Submission received: 1 December 2021 / Revised: 28 December 2021 / Accepted: 30 December 2021 / Published: 2 January 2022

Abstract

:
The risk assessment of the failure mode of the traditional machining center component rarely considers the topological characteristics of the system and the influence of propagation risks, which makes the failure risk assessment results biased. Therefore, this paper proposes a comprehensive failure risk assessment method of a machining center component based on topology analysis. On the basis of failure mode and cause analysis, considering the correlation of failure modes, Analytic Network Process (ANP) is used to calculate the influence degree of failure modes, and it is combined with component failure mode frequency ratio and failure rate function to calculate independent failure risk. The ANP model of the machining center is transformed into a topological model, and the centrality measurement of network theory is used to analyze the topology of the machining center. The weight of the topological structure index is measured by subjective and objective weighting methods, and then the importance degree of the machining center component is calculated. In this paper, the coupling degree function is introduced to calculate the importance of the connection edge, which is combined with the failure probability to calculate the failure propagation influence degree, and the component propagation failure risk is calculated based on this. Finally, the independent failure risk and the propagation failure risk of the component are integrated to realize the failure risk assessment of the component. Taking a certain type of machining center as an example to illustrate the application, compared with the traditional assessment method, the effectiveness and advancement of the method proposed in this paper have been verified.

1. Introduction

A machining center is an important carrier of intelligent manufacturing. Therefore, ensuring its safe and reliable operation is essential. The risk assessment of a machining center is of important and far-reaching significance for developing a reasonable and effective risk control scheme and for reducing system risk.
Risk indicates the likelihood that the study subject suffered harm or loss. The reason for the risk assessment is to obtain the risk forecast information of the research object, and on this basis, through risk decision making and other actions, to minimize various losses due to risks. In this regard, scholars have conducted considerable research and established corresponding risk assessment models to analyze the risks of the system under different failure modes. The existing risk assessment methods are divided into qualitative, quantitative, and a combination of both.
Qualitative risk assessment method is a typical fuzzy analysis method, which can quickly and systematically assess resources, threats, and vulnerabilities. Commonly used qualitative risk assessment methods mainly include the hazard and operability analysis method (HAZOP) [1,2], expert investigation method [3], failure mode and effect analysis method (FMEA) [4,5,6] and failure mode effects and criticality analysis method (FMECA) [7,8,9]. The HAZOP method is used to determine the cause of this deviation by analyzing abnormal changes in process parameters during the production process and then analyze what measures should be taken. The expert investigation method is a method for judging and predicting the risk trend of the research object based on the expert’s knowledge and experience. FMEA and FMECA identify the failure mode and evaluate the consequences or effects of the failure mode to determine the impact of the failure risk and countermeasures. The qualitative assessment method has the advantages of simple operation and easy to master; thus, it is often preferred. However, the results of this assessment method rely too much on the experience of the evaluator. When the factors considered by the evaluator are not comprehensive, unsystematic, or unable to reflect the status of the system, the assessment results are often inaccurate.
Quantitative risk assessment methods mainly quantify the occurrence probability and impact of security incidents and then quantitatively describe the risk level of the assessment object.
The current quantitative risk assessment methods are mostly based on fault tree analysis (FTA) [10,11,12], event tree analysis (ETA) [13,14,15], and criticality analysis (CA) [16,17]. The FTA method obtains the minimum cut set of the fault tree through calculation, finds out the weak links in the system, and develops appropriate risk control strategies for the weak links. ETA is based on the time and causal sequence of the occurrence of events, starting from the initial event and then identifying the intermediate events related to it until finding the resulting event, and conducting risk assessment on it. CA divides the risk severity and possibility of the research object into corresponding grades according to characteristics, forms a risk assessment matrix, and assigns a certain weighted value to measure the risk. The quantification of risk by quantitative analysis method promotes the close connection between operation mechanism and operation norms. The analysis goals are more specific and accurate, providing a reliable reference for the reasonable formulation of emergency plan. However, when the assessment system is relatively complex, the quantitative risk assessment method needs to deal with a huge amount of data, and the calculation process becomes more complicated.
The comprehensive assessment method that combines the two is an organic combination of qualitative and quantitative assessment methods, taking into account the advantages of both.
A typical combination of qualitative and quantitative risk assessment method is probabilistic risk assessment method (PRA) [18]. The method is mainly quantitative analysis, and the current research is focused on the probability and the consequences of failure events and the combination function of the two. In addition, some scholars have introduced the Bayesian network (BN) fusion fault tree analysis for risk assessment [19]. This method takes advantage of the fault tree’s advantage in cause analysis, analyzes the severity of various events, and establishes a multi-state model of variables. It then uses the conditional probability distribution table to establish the conditional probability relationship of different variables, converts the fault tree into a Bayesian network, and then realizes quantitative risk assessment. Otherwise, the failure mode effects and criticality analysis is combined with the fault tree analysis for risk analysis [20]. This method establishes the risk priority index through FMECA to judge the failure risk level, combines the field operation failure statistical data, conducts the fault tree analysis to obtain the occurrence probability and the basic event critical importance, and then carries out the risk assessment accordingly.
At present, the failure risk assessment method has made great progress in the machining center, but there are still certain limitations. In the actual machining process, a certain component in the system fails, which will spread the failure to other components through the physical connection relationship between the components and then cause the cascading failures. Therefore, the safe and reliable operation of the system is closely related to the failure propagation mechanism, but there are currently few studies on the correlation of failure modes among components, and most of them do not consider the impact of propagation risks. In addition, the topological structure of the system is the foundation for the safe and reliable operation of the system, but most of the current failure risk assessment methods ignore the influence of the topological characteristics of the system itself, which makes the evaluation results inaccurate. Therefore, in view of the current assessment model established is only a static model, real-time dynamic assessment of failure risk cannot be realized, or different failure modes are ignored for the influence of the breadth and depth of failure propagation. This paper proposes a comprehensive failure risk assessment method for a machining center component based on topology analysis.

2. Comprehensive Risk Assessment of the Machining Center Component Based on Topological Analysis

The failure risk of the component of the machining center is not only related to the independent risk of itself but is also related to its position in the topology and the impact of the failure of the adjacent component (that is, the risk of propagation). Therefore, this paper considers the independent risk attributes of the component and the impact of the propagation risk to comprehensively assess the failure risk of the machining center. The comprehensive failure risk assessment framework of machining center component based on topological analysis is shown in Figure 1.
On the basis of failure mode and cause analysis, considering the correlation of failure modes, ANP is used to calculate the influence degree of failure modes and to calculate the independent risk value of components in combination with the component failure mode frequency ratio and the failure rate function. The influence of the topological characteristics of the machining center on the propagation of failure cannot be ignored. Therefore, based on the machining center ANP model, starting from the component level, introducing the centrality measurement of network theory (the degree centrality, betweenness centrality, and closeness centrality of the component nodes) and using the analytic hierarchy process (AHP) and entropy weight method (EWM) to carry out the subjective and objective combination weighting of the indicators to calculate the structural importance of the machining center components to characterize the topological properties of the model. The coupling degree function is introduced to calculate the importance of the connection edges, combining it with the failure probability to calculate the failure propagation influence degree and thus to realize the calculation of the component propagation failure risk. Finally, the independent failure risk and the propagation failure risk of the component are integrated to evaluate the comprehensive failure risk of the component. The method proposed in this paper provides a reference for the formulation of the fault risk control plan for the user of the machining center and is of great significance for reducing the fault risk of the machining center.

2.1. Calculation of Independent Failure Risk of Machining Center Component Based on ANP

The independent failure risk of a machining center component refers to the risk generated by itself, which is mainly related to the frequency ratio of each failure mode of the component, the failure rate of the component and the influence of the failure mode. Therefore, the equation for calculating the independent failure risk probability of the component is as follows:
R I i ( t ) = j = 1 n α i j ( t ) λ i ( t ) β i j
where R I i ( t ) represents the independent failure risk of component i at time t . n is the number of failure mode types for the component i . α i j ( t ) represents the frequency ratio of failure mode caused by failure mode j of component i at time t . λ i ( t ) is the failure rate of component i at time t . β i j represents the influence degree of the j -th failure mode of component i .
Therefore, in order to realize the independent failure risk calculation of machining center component, it is necessary to obtain component failure mode frequency ratio, failure rate and the influence degree of failure mode. The following will focus on the solution of these three parts.

2.1.1. Calculation of Frequency Ratio of Failure Modes of Machining Center Component

Through the failure analysis of the machining center, the weak links of the research object (parts or components) are found, and the potential weaknesses are identified. The failure analysis results are fed back to the design, manufacturing and use department of the product, such that they can take countermeasures and measures to improve the reliability of the product from the design, manufacturing, use and maintenance. Commonly used failure analysis methods are mostly based on failure mode and effect analysis (FMEA) [21]. The so-called failure mode and effect analysis is to analyze the product that has failed. Its task is to find out which failure modes may occur in components, identify the mechanism of failure, and study the possible effects. Combined with the field failure information, the frequency ratio of component failure modes is calculated. The block diagram of the working procedure for calculating the frequency ratio of the failure modes of the machining center is shown in Figure 2.

2.1.2. ANP-Based Calculation of Influence Degree of Failure Mode of Machining Center Component

Different failure modes cause different levels of failure damage to components, and the same failure mode has different effects on different components, and there is a certain correlation between the failure modes. That is, the occurrence of one failure is likely to cause the occurrence of another failure, for example, the loosening of the locking component will cause the component to fall off. Therefore, based on the analysis of the failure mode of the machining center, considering the correlation of the failure mode, a correlation analysis method ANP is introduced to calculate the failure mode influence degree of the component.
ANP was proposed by Professor T.L. Saaty of the University of Pittsburgh in 1996 and is widely used in many fields such as politics, economy, society, and management. The advantage of ANP is that it abandons the assumption of independence between each element and considers the mutual influence between the elements within the hierarchy, using the form of proportional scale to quantify the correlation between elements by a specific value. Therefore, the use of ANP can combine qualitative and quantitative methods, which can meet the needs of correlation analysis between failure modes of machining centers. A typical ANP model is shown in Figure 3.
The basic steps of the ANP method are as follows:
(1)
Correlation analysis of elements
The objective problem is analyzed and then considers whether there is an interdependent relationship between the elements.
(2)
Construction of network hierarchical model
Generally, the elements are divided into two layers. The first one is the control layer or the target layer, which refers to the decision-making criterion. At least one criterion should exist. The second is the network layer, which contains all elements and is governed by the control layer. The elements have an interdependent relationship.
(3)
Construction of judgment matrix
The elements are compared in pairs to construct the judgment matrix. The judgment matrix is usually quantified on a scale of 1–9, as shown in Table 1. Experts compare elements in different situations based on experience and give different quantitative levels.
(4)
Construction of unweighted matrix and weighted matrix
The unweighted matrix w is derived by comparing the elements in pairs. Each column in the matrix, a sorting weight is based on a certain element. For the convenience of calculation, each column of the unweighted matrix needs to be normalized to obtain the weighted matrix W i j ( W i j = a i j w i j ).
(5)
Establishment of a super-limit matrix
The size of the weighted matrix element W i j reflects the one-step dominance of element i to element j . Similarly, through the multi-step self-multiplication of the matrix, a super limit matrix that tends to be stable is obtained. There is only one value corresponding to each element in the matrix, that is, the final influence degree of the element, which is the failure mode influence degree β i j sought in this paper.
Since the ANP model is a network model, the final super matrix calculation is complicated; thus, the ANP analysis method generally chooses to use the matching Super Decisions software or calculation program to assist in the calculation.

2.1.3. Failure Rate Function of Machining Center Component

In this paper, the Johnson method is used to correct the failure time sequence of components [22]. The two-parameter Weibull distribution commonly used in engineering is used as the hypothetical distribution of failure data of machining center components [23]. The construction process of the failure rate function is detailed in the literature [24], and then the failure probability function can be obtained as:
F ( t ) = 1 exp [ ( t θ ) γ ] ,   t 0 .
The failure rate function is:
λ ( t ) = γ θ γ t γ 1 ,   t 0 ,
where t is a time variable, t 0 . θ stands for scale parameter, θ > 0 , γ stands for shape parameter, γ > 0 . The shape parameter determines the shape of the failure rate function curve. When 0 < γ < 1 , it indicates that the failure rate is a decreasing function of time, which is characterized as early failure. When γ 1 , it indicates that the failure rate is constant. When γ > 1 , it indicates that the failure rate function is an increasing function of time, which represents loss failure.

2.2. Analysis of the Topological Characteristics of the Machining Center Component

2.2.1. Analysis of Multi-Dimensional Topological Structure of Machining Center Components

At present, there are certain limitations in the modeling of the failure propagation model of the machining center. For example, the failure propagation model is only considered from the perspective of the failure mechanism or only based on the function flow. It is only an abstraction of the overall function structure of the machining center system and cannot accurately represent the topological structure of the system. Therefore, on the basis of obtaining the ANP model of the machining center, this paper transforms it into a topological structure model from the component level and uses the centrality measure of network theory to analyze its topological structure [25].
(1)
Degree centrality
Degree is a simple and important concept used to describe the attributes of individual nodes. Degree Centrality (DC) is the most direct metric used to characterize node centrality [26]. The number of adjacent nodes of node v i in the network is called the degree of node v i , and its calculation equation is as follows:
D i = j n a i j , i j ,
where i is the currently concerned node v i . j is any node v j in the network. n is the number of nodes in the network. a i j is the element in the adjacency matrix D . When node v i and node v j are directly connected, a i j = 1 , otherwise a i j = 0 .
Then, the degree centrality of a node is:
D C i = D i n 1 .
The node degree is to characterize the importance of a node in the local network from the network topology. When the degree of a node is larger, it means that the degree centrality of the node is higher. That is, the greater the number of neighboring nodes directly connected to the node, the more important the node, and the more important its position in the network.
(2)
Betweenness centrality
Node betweenness centrality (BC) is used to measure the importance of a node’s position in the entire network [27]. Much of the literature believes that the greater the betweenness centrality of a node, the more critical it is in the network. The calculation equation is as follows:
B C i = j = 1 n k = 1 n N ( j , i , k ) N ( j , k ) n ( n 1 ) / 2 ,
where N ( j , k ) is the number of shortest paths between component nodes v j and v k . N ( j , i , k ) is the number of shortest paths passing through node v i between nodes v j and v k .
(3)
Closeness centrality
Closeness Centrality (CC) is used to measure the ability of a node to influence other nodes through the network [28], and its measurement standard is the topological distance between nodes. The smaller the distance between a node and other nodes, the greater its closeness centrality value, which means that the node is at the center of the network model, and its importance is greater. The closeness centrality of node v i is defined as the reciprocal of the sum of the shortest paths between all nodes in the topological network, namely:
C C i = [ j = 1 N d i j ] 1 ,   i j ,
where d i j is the shortest distance between component node v i and v j , v i v j .

2.2.2. Calculation of the Structure Comprehensive Importance of the Component Based on the Topology Analysis

In order to coordinate the multi-dimensional structural importance index of the machining center component and identify the comprehensive importance of the topological structure of the machining center components, it is necessary to calculate the structure comprehensive importance of the component. The specific calculation steps are as follows:
(1)
Problem setting
Suppose there are n components to be evaluated and the number of indicators to measure their structural importance is g . The j -th importance index value of the i -th component is recorded as x j i ( i = 1 , 2 , , n ; j = 1 , 2 , , g ) , and then the initial matrix X = [ x j i ] g × n .
(2)
Normalization of evaluation index values
In order to solve the incommensurability of each structural importance index and the contradiction of the measurement criteria, it is necessary to standardize the structural importance index value x j i and convert it into a single index coefficient q j i with the same value range and trend. Then, normalize the different states of the same indicator to form a normalized matrix P = [ p j i ] g × n .
The data normalization processing methods include range normalization, linear normalization, curve normalization [29] and fuzzy normalization [30]. In order to simplify the calculation, this paper uses the linear scale transformation method in the literature [29] to normalize the original data.
For the positive indicators x j i that are bigger and better, take
q j i = x j i x j max ( i = 1 , 2 , , n ) ,
where x j max = max 1 n { x j i } , ( j = 1 , 2 , , g ) .
For the negative indicators x j i that are smaller and better, take
q j i = x j min x j i ( i = 1 , 2 , , n ) ,
where x j min = min 1 n { x j i } , ( j = 1 , 2 , , m ) .
The initial matrix X is normalized to obtain the structural importance index coefficient matrix Q = [ q j i ] g × n , 0 q j i 1 .
Normalize the structural importance index coefficient matrix Q to obtain the normalized matrix P = [ p j i ] g × n .
p j i = q j i / i = 1 n q j i ( j = 1 , 2 , , g ) ,
(3)
Determination of combination weight
There are two main types of weight determination methods, namely subjective weighting method and objective weighting method. The weight of the subjective weighting method reflects the intention of the decision maker and is greatly influenced by the evaluation subject. The objective weighting method mainly relies on mathematical theories and methods, has a certain dependence on sample data and practical problems, ignores the subjective information of decision makers, and cannot reflect the importance of decision makers to different structural importance indicators. Therefore, in order to obtain a reasonable weight value, the weighting results of the two methods need to be integrated to obtain the combined weight value. However, the index weights calculated by different methods will be different or even contradictory. Therefore, the consistency of the different weights must be checked before the combination of weights. Only after passing the consistency check can the combination weighting be carried out. At present, there are many related theories of combination weighting. This paper assumes that the importance of the two weighting methods is the same. Therefore, after the two weighting results have passed the consistency check, equal weights are used for combination weighting to obtain combined weights. Specific steps are as follows:
  • (1)
    Subjective weighting
In this paper, the analytic hierarchy process (AHP) is used to subjectively weight each indicator [31]. The main steps are as follows:
(a) Determine the evaluation factors, that is, the three centrality measures that characterize the topological characteristics of the model in this paper, degree centrality, betweenness centrality, and closeness centrality.
(b) Construct a judgment matrix. The value of the element of the judgment matrix reflects the expert’s understanding of the relative importance of each centrality measurement evaluation index of the machining center component. Generally, the scale method of 1–9 and its reciprocal is used to obtain the judgment matrix A .
(c) Hierarchical single sorting. Maximum eigenvalue and consistency tests were calculated. Because there is only one level in the index system in this paper, the single-level ranking is the final ranking. Commonly used judgment matrix calculation methods are the square root method or sum product method. This paper uses the sum product method to calculate a judgment matrix and conduct a consistency test.
(d) Determine the weight, and calculate the relative weight of the index based on the criterion according to the judgment matrix and the weight of each index can be obtained as ω = ( ω 1 , ω 2 , , ω g ) .
  • (2)
    Objective weighting
This paper uses the entropy method [32] to objectively weight each index. Suppose the weight is ω = ( ω 1 , ω 2 , , ω g ) , for matrix P , the information entropy of the j -th evaluation index is:
e ( d j ) = 1 ln n i = 1 n ( p i j p j ln p i j p j ) ,
where p i j is the normalized value corresponding to the j -th index of the i -th component, p j = i = 1 n p i j .
According to Equation (11), the information entropy of each index can be obtained, and substituting it into Equation (12), the objective weight ω of each index can be obtained.
ω i = 1 g E e [ 1 e ( d j ) ] ,
where E e = j = 1 g e ( d j ) , 0 ω 1 , i = 1 g ω i = 1 .
  • (3)
    Consistency test of weights
Assume that the consistency test is performed on k kinds of weights. When k = 2 , the degree of consistency of the weights can be indicated by the Spearman rank correlation coefficient or by the distance function [33]:
d ( ω ( 1 ) ω ( 2 ) ) = [ 1 2 j = 1 n ( ω ω ) 2 ] 1 2 ,
where 0 d ( ω ( 1 ) ω ( 2 ) ) 1 . When d ( ω ( 1 ) ω ( 2 ) ) is smaller, it indicates that the results of the two weights are closer.
When k 3 , the Kendall concordance test method [34] in the non-parametric statistical method is generally used to test the consistency of multiple weighting results.
  • (4)
    Combination weighting
After passing the consistency check, the subjective and objective weights are combined according to equal weights to obtain a new weight ϖ = [ ω 1 , ω 2 , , ω g ] .
ω i = 1 2 ( ω i + ω i ) , ( 1 i g ) .
(4)
Comprehensive structure importance model of the component of the machining center
Combining the multi-dimensional structural importance index with the combined weight, the calculation equation for the importance of the component node of the machining center can be obtained, as shown in Equation (15):
I ( i ) = ω 1 D C i + ω 2 C C i + ω 3 B C i ,
where ω 1 , ω 2 , and ω 3 are the weight values of each structural index, respectively.

2.2.3. Calculation Importance of Connection Edges of Machining Center Component Based on Topological Characteristics

When the component k fails, the failure will be transmitted to the component i with a certain value along the connecting edge, causing the component i to fail, and this value is related to the importance of the connecting edge where the two components are located. Shen et al. (2014) uses the efficacy function to describe the contribution of influencing factors to the overall state evolution of the system and uses the coupling degree model to describe the coupling degree between the coupled factors. Based on this idea, this paper takes the importance of the component node as the function value and calculates the importance of the connecting edge between the components by constructing the coupling degree between the components, characterizes the strength of the mutual influence of the two components, and defines the connection edge between the components. The calculation equation of importance is shown in Equation (16).
I ( k , i ) = I ( k ) I ( i ) ( I ( k ) + I ( i ) ) 2 ,
where I ( k , i ) is the importance value of the connecting edge between components k and i . The larger the value, the greater the contribution of the connecting edge k i to the failure propagation. I ( k ) and I ( i ) are the comprehensive structure importance values of the components k and i , respectively.

2.3. Comprehensive Failure Risk Assessment of Machining Center Component Based on Topological Analysis

2.3.1. Calculation of Propagation Failure Risk of Machining Center Components

There is a certain failure propagation relationship between the components of the machining center. A component may be affected or even fail due to the failure of the upstream node. Therefore, the influence of the propagation failure risk on the component cannot be ignored. The calculation equation of the propagation failure risk of the component is as follows:
R P i ( t ) = k D i R I k ( t ) P ( k , i ) ,
where R P i ( t ) represents the propagation failure risk of component i at time t . R I k ( t ) represents the independent failure risk of component k at time t . D i represents the set of upstream components connected to component i . P ( k , i ) is the failure propagation influence of the connection edge k i , and P ( k , i ) is calculated as follows:
P ( k , i ) = F k ( t ) I ( k , i ) ,
where F k ( t ) is the failure probability of component k at time t . I ( k , i ) indicates the importance of connecting edge k i .

2.3.2. Comprehensive Failure Risk Assessment of Machining Center Components

On the basis of obtaining the independent failure risk of the machining center component, the integrated risk value of the machining center component can be obtained by taking the propagation failure risk into consideration. The calculation equation is as follows:
R Z i ( t ) = R I i ( t ) + R p i ( t ) = R I i ( t ) + k D R I k ( t ) P ( k , i ) .
Based on this, the dynamic ranking of the comprehensive failure risk values of the components can be realized, and then the real-time comprehensive failure risk assessment of the components can be realized.

3. Case Application

In this paper, a certain type of machining center is taken as the research object. According to the structure and working principle of this type of machining center, it is divided into 12 subsystems, namely tool magazine (M), spindle system (S), electrical system (V), XYZ axis feed system (J), chip removal system (K), hydraulic system (H), pneumatic system (G), CNC system (NC), protection system (Q), cooling system (W), lubrication system (L), and workbench (T). Each component is abstracted as a node, the failure correlation between components is abstracted as an edge, and a digraph of the component correlation of the machining center is drawn, as shown in Figure 4. The components with independent failures are not considered for the time being. The collected field failure data of the machining center were statistical analyzed to obtain the frequency diagram of the failure components of the machining center, as shown in 
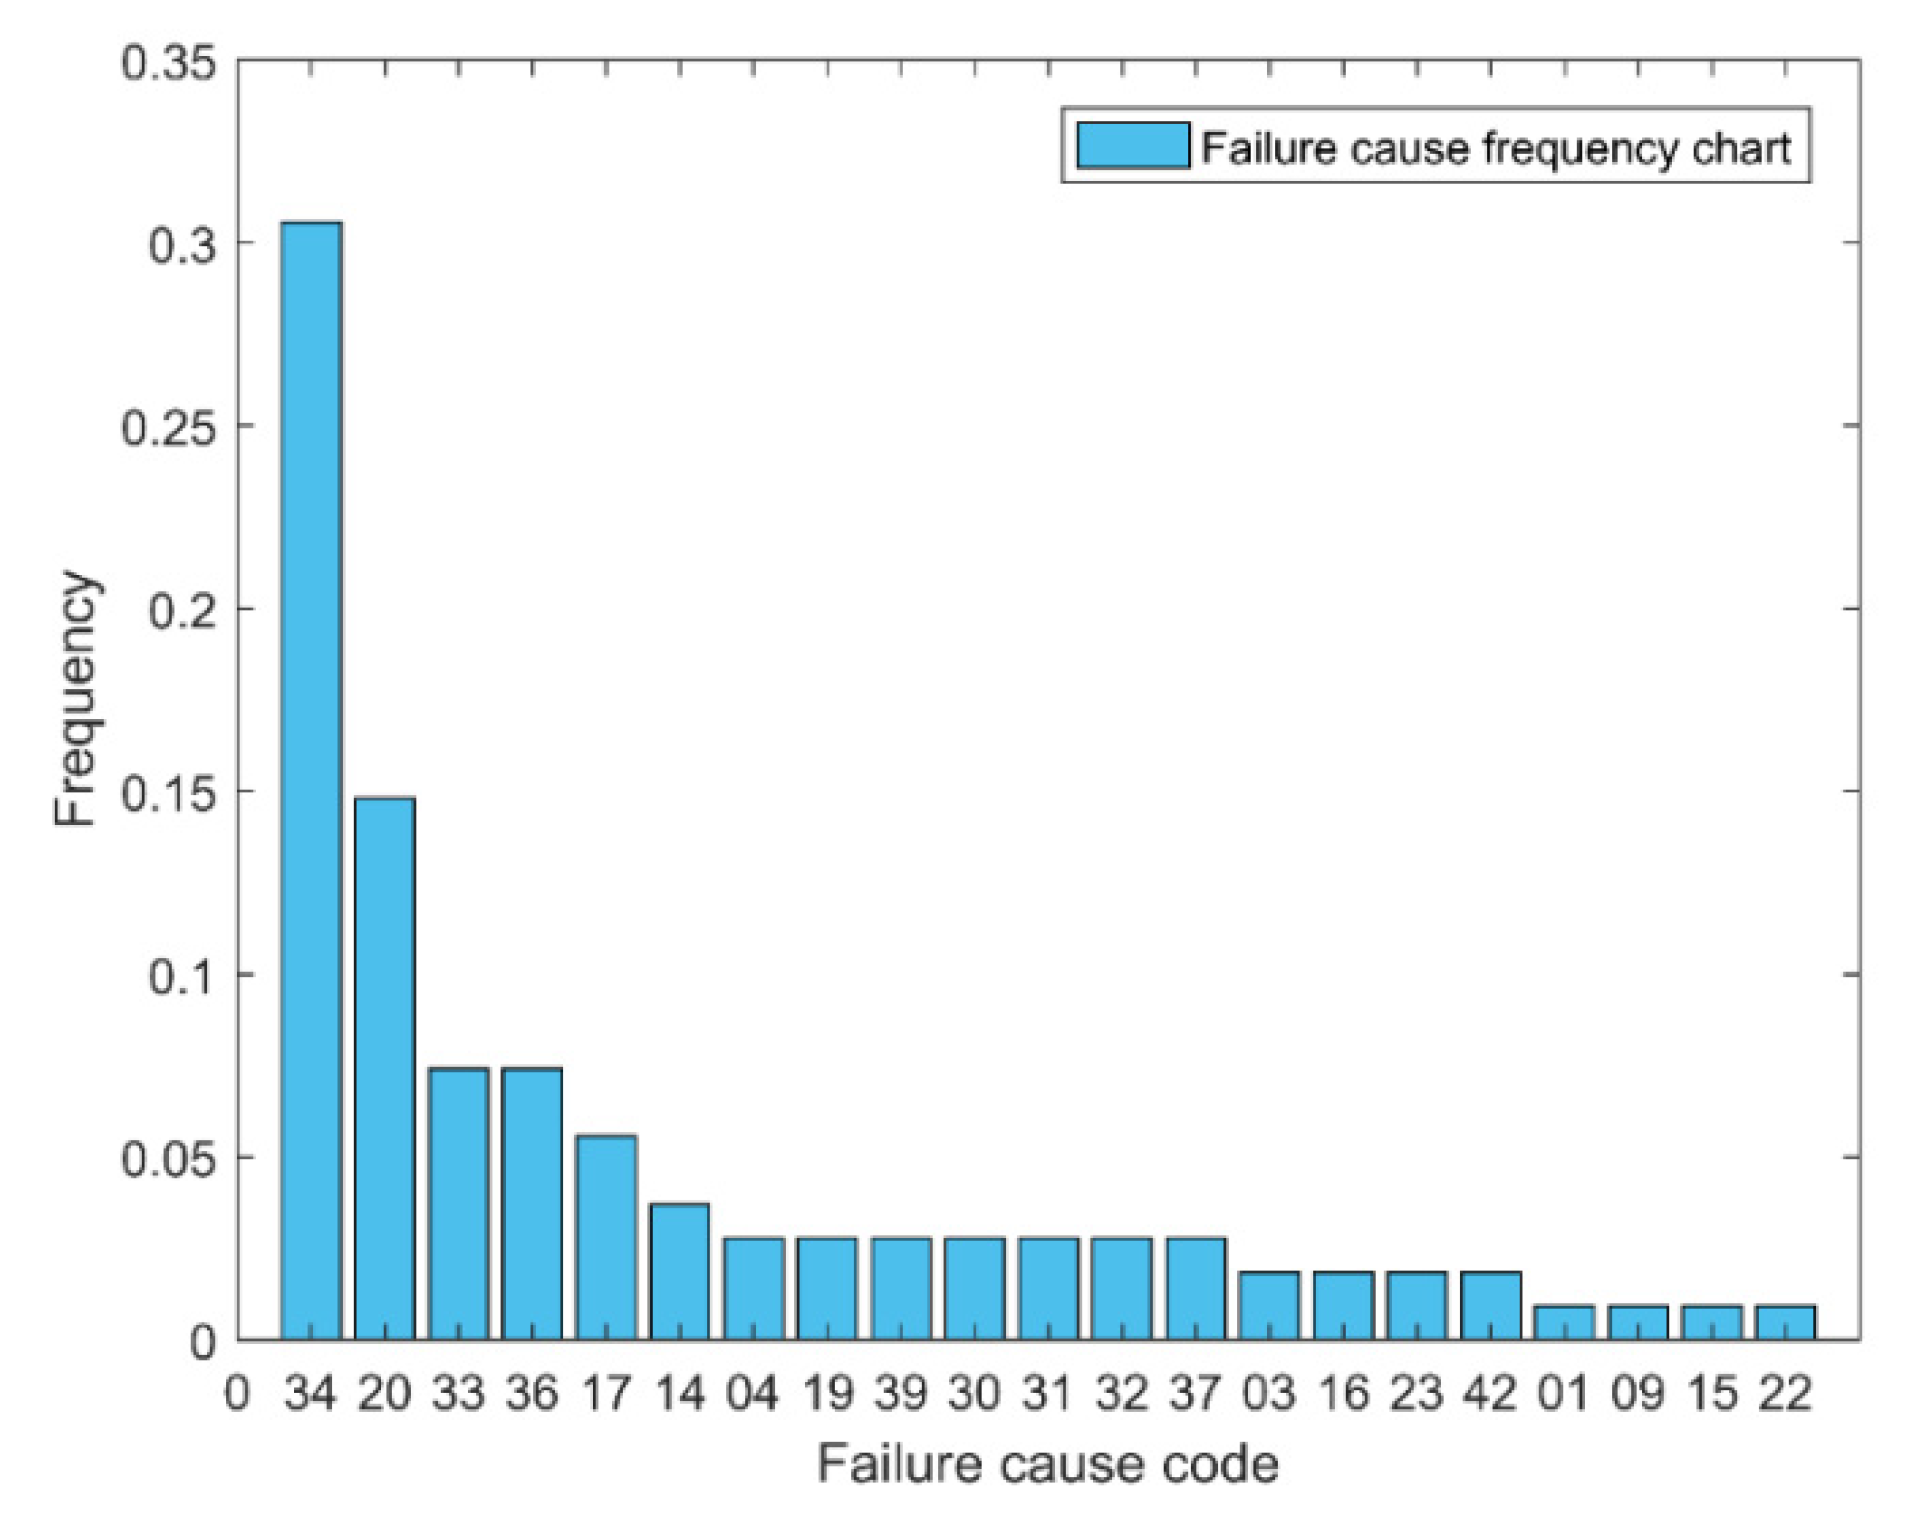
Figure 5. The failure mode analysis is carried out to obtain the failure mode frequency table of the machining center as shown in Table 2, and the failure causes analysis is carried out to obtain the failure cause frequency table of the machining center, as shown in Table 3, as well as the failure cause frequency chart, as shown in the Figure 6.
It can be seen from Table 2 that the most frequent failure mode of this kind of machining center is parts damage (21.3%), followed by liquid, gas, and oil component damage (14.81%) and liquid, gas, and oil leakage (14.81%), followed by component damage (4.63%), no movement of moving parts (4.63%), and vibration or shaking (4.63%). It can be seen that the quality of components and the quality of assembly adjustment have a significant impact on the overall reliability of the machining center.
It can be seen from Table 3 and Figure 6 that component damage, part damage, leakage, etc. are the main causes of failure. Once again, the quality of parts and the quality of assembly adjustment are the key factors that affect the reliability of machining centers.
According to the component failure data of the machining center, considering the influence of multiple truncated data, the order of component failure data is corrected, parameter estimation and hypothesis distribution test are performed, and the failure rate model parameters of each component are shown in Table 4. This paper only considers components that are associated with failure, and the rest of the components are not considered for the time being.
According to the independent risk calculation equation of the machining center component, the independent risk value of each failure mode of the component can be obtained at any time. This paper takes 4000 h as an example for illustrate.
According to Table 4 and Equation (3), the failure rate of each component of the machining center at 4000 h is shown in Table 5.
In order to obtain the influence degree of the failure mode, the target layer and the control layer of the ANP model constructed in this paper are both the influence degree of the failure mode of the machining center. Each component is a cluster, and the elements in the cluster are the failure modes included in the component. According to the division result of the component and the failure mode, the component code and the failure mode code are combined to form the element code, and the Super Decision software is applied to obtain the ANP model of the failure mode, as shown in Figure 7.
This paper selects engineers who have worked in the company for many years to score. The values obtained from the scoring table are sorted out and analyzed as the input to the pairwise judgment matrix of the failure mode. Any failure mode that has a mutual influence relationship should be compared in pairs. In the Assess/Compare menu of the SD software, you can enter the pairwise judgment matrix. In order to avoid the occurrence of abnormal situations, the judgment matrix needs to be checked for consistency. When the inconsistency coefficient is less than 0.1, the calculation can be continued. This paper takes the cooling system W101 as an example, and the results of the consistency check of the judgment matrix are shown in Table 6.
It can be seen from Table 6 that the inconsistency coefficients are all less than 0.1; thus, the calculation can be continued, and the super limit matrix can be directly obtained by the SD software, as shown in Figure 8.
It can be seen from Figure 8 that the non-zero value of each row of the super limit matrix is the same, indicating that the matrix has become stable, and the non-zero value is the failure mode influence degree, as shown in Figure 9. In the same way, the failure mode influence value of the remaining components of the machining center can be obtained.
Table 7 summarizes the influence degree of the failure mode of each component of the machining center and the frequency ratio of the failure mode of each component.
Substituting the calculation results in Table 7 into Equation (1), the independent failure risk value of each component of the machining center at 4000 h can be obtained, as shown in Table 8.
From Table 8, the ranking results of the independent failure risk values of the failure modes of each component of the machining center at 4000 h is M > N C > V > K > W > G > L > J > S . That is, at this time, the component with the largest independent failure risk value of the failure mode is the tool magazine, and the smallest component is the spindle system.
According to the ANP model (Figure 10a) of the machining center, it is abstracted into the topological structure model of the machining center, as shown in Figure 10b.
According to Figure 10b, the machining center topology model and Equations (4)–(7), the degree centrality, betweenness centrality and closeness centrality of the nodes in the machining center component topology model can be calculated, as shown in Table 9.
Based on the analysis of the topological structure of the machining center, a comparison chart of the structural indicators of the components as shown in Figure 11 is obtained.
According to Table 9 and Figure 11, the component nodes with the highest degree centrality are the electrical system (V) and the spindle system (S), the component with the highest betweenness centrality is the cooling system (W), and the component with the highest closeness centrality is the electrical system (V). It can be found that there are obvious differences in the evaluation results of different structural indicators of the component. Therefore, the integration of multiple indicators for comprehensive importance modeling is important for evaluating the topological properties of machining centers.
This paper has nine components, and the number of structural importance indicators is three. Since each structural importance indicator in this paper meets the standardization requirements, there is no need for normalization processing. X is P and the initial evaluation matrix X is as follows:
                                                  V                   W                   K               N C                 L                   G                   J                   S                   M X = D C i B C i C C i [ 0.556 0.222 0.222 0.444 0.444 0.222 0.444 0.556 0.444 0.000 0.028 0.000 0.000 0.000 0.000 0.000 0.000 0.000 0.143 0.045 0.053 0.071 0.083 0.059 0.071 0.083 0.077 ]
Based on the AHP combined with the experts’ understanding of the relative importance of the evaluation indicators of the centrality measurement of the machining center components, using the scale method of 1–9 and its reciprocal, the judgment matrix is obtained as follows:
A = [ 1 1 / 3 2 3 1 2 1 / 2 1 / 2 1 ]
According to the AHP method, the subjective weight vectors of the four structural indicators are obtained ω = ( 0.268 , 0.537 , 0.195 ) .
According to Equation (11), the information entropy of each indicator can be obtained, e ( d 1 ) = 0.973 , e ( d 2 ) = 0.000 , e ( d 3 ) = 0.975 . Substituting the calculation result into Equation (12), the objective weight of each indicator can be obtained ω = ( 0.026 , 0.950 , 0.024 ) .
In this paper, k = 2 ; thus, substitute ω and ω into Equation (13) to obtain d ( ω ( 1 ) ω ( 2 ) ) = 0.360 . It shows that the correlation coefficients of the weights assigned by the two methods are in the range of (0, 0.360), indicating that the weights obtained by the two weighting methods are consistent. Therefore, combination weighting can be performed, and the combination weight value of W = [ 0.147 , 0.744 , 0.109 ] can be obtained according to Equation (14).
Substituting the centrality measurement values and combination weights in Table 9 into Equation (15), the importance of each component of the machining center is obtained, as shown in Table 10.
It can be seen from Table 10 that the electrical system (V) is the component with the greater comprehensive structure importance, followed by the spindle system (S), and the component with the less comprehensive structure importance is the chip removal system (K).
According to Equation (16) and Table 10, combined with the topological structure model of the machining center, the importance of each connection edge can be calculated, as shown in Table 11.
According to Equations (3) and (18) in combination with Table 11, the influence degree P ( k , i ) of the failure propagation of each connection edge can be calculated, as shown in Table 12.
Substituting the calculation results in Table 12 into Equation (17), the failure mode propagation risk value of each component of the machining center at 4000 h can be obtained, as shown in Table 13.
On the basis of obtaining the independent risk of component failure mode and propagation risk, according to Equation (19), the comprehensive risk value of each component failure mode can be obtained. The failure mode independent risk, propagation risk and comprehensive risk value ranking trend comparison chart of each component is shown in Figure 12.
It can be seen from Figure 12 that there are differences in the ranking of the independent failure risk value and the propagation failure risk value of each component at 4000 h, and the ranking of the independent failure risk value is J > M > K > N C > L > W > V > S > G . The propagation failure risk value is ranked as S > M > J > K > N C > W > V = L = G . The comprehensive failure risk value is ranked as J > M > S > K > N C > W > L > V > G . It can be found that the component with a large independent failure risk value may not necessarily have a large propagation failure risk value, while the component with a small independent failure risk value is relatively important because of its relatively important position in the topology model, which leads to a large propagation failure risk value. Therefore, the propagation failure risk has a greater impact on the component. The impact cannot be ignored. The impact of independent failure risks and propagation failure risks on the components should be considered comprehensively, such that the results obtained are more accurate.

4. Comparison Analysis

The comprehensive failure risk assessment method of the component failure mode of machining center based on topology analysis proposed in this paper is a dynamic model. The comprehensive failure risk value corresponding to each component can be obtained at any time, and the influence of propagation failure risk on the component is considered. To show its effectiveness and credibility, this paper takes the machining center running for 2000 and 3000 h as an example, gives the comprehensive failure risk value considering the propagation failure risk, compares it with the traditional independent failure risk value [35], and obtains a comparison chart of the ranking trend of component risk values at different times, as shown in Figure 13.
According to Figure 13, it can be found that the ranking results of the risk value of the machining center components are different at different times, and the comprehensive risk value ranking results of the components at 2000 h is M > J > S > W > K > V > L > N C > G . That is to say, at 2000 h, the component with the largest risk of failure is the tool magazine (M), followed by the feed system (J), and the component with the smallest risk of failure is the pneumatic system (G). The independent risk ranking result obtained by the method that does not consider the propagation risk is M > J > W > K > V > L > S > N C > G . At 3000 h, the comprehensive risk value ranking result is M > J > S > W > K > V > N C > L > G . The independent risk ranking result obtained by the method that does not consider the propagation risk is M > J > W > K > S > V > L > N C > G . This shows that, at 3000 h, the component with the largest risk of failure is the tool magazine (M), followed by the feed system (J), and the component with the smallest risk of failure is the pneumatic system (G). The method proposed in this paper is different from the traditional independent failure risk calculation method. The main reason is that this paper considers the influence of the topological characteristics of the component and the influence of the propagation failure risk. In addition, because the frequency ratio of failure modes and the failure rate are dynamically changing at different times, dynamic ranking results will be given, which is more in line with engineering reality; thus, the method proposed in this paper is effective and feasible.

5. Conclusions

This paper proposes a novel failure risk assessment method, which takes into account the characteristics of the model topology, calculates the propagation failure risk, and integrates it with the independent failure risk to achieve a more comprehensive and accurate risk assessment of the machining center components. The method proposed in this paper has the following contributions.
(1)
This paper improves the calculation of traditional independent failure risk, considers the correlation between component failure modes, introduces ANP to calculate the failure mode influence degree, and combines it with the component failure mode frequency ratio and the failure rate function, which then obtains a more complete component independent failure risk value.
(2)
This method considers the influence of the model’s topological structure characteristics on the risk of propagation failure. The centrality measurement of network theory is introduced to analyze the topological characteristics of the machining center, and the importance of the component nodes and connecting edges is obtained. Combined with the component failure probability to calculate the component failure propagation influence degree, the component propagation failure risk value calculation was realized.
(3)
The comprehensive failure risk assessment method proposed in this paper can obtain a dynamic ranking of the failure risk values of machining center components. Therefore, dynamic risk control strategies can be formulated to reduce unnecessary shutdown losses of the machining center.
The effectiveness and advancement of the proposed method is verified by an example. The risk assessment method proposed in this paper can provide a basis and guidance for manufacturing enterprises to formulate reasonable and effective risk control plans and to reduce production system risks. In the future, multi-step propagation and diffusion of failure modes can be considered, and combined with on-site real-time condition monitoring data, this method can be extended to the failure risk assessment of more complex industrial equipment.

Author Contributions

Conceptualization, L.M. and Y.Z.; methodology, L.M.; software, G.G.; validation, L.M. and Y.Z.; formal analysis, Y.Z.; investigation, L.M. and G.G.; resources, Y.Z.; data curation, Y.Z.; writing—original draft preparation, L.M.; writing—review and editing, L.M.; visualization, G.G.; supervision, Y.Z.; project administration, Y.Z.; funding acquisition, Y.Z. and L.M. All authors have read and agreed to the published version of the manuscript.

Funding

This research was funded by Jilin Province Science and Technology Development Plan Project (grant no. 20190302104GX) and Project 101832020DJX037, supported by Ph.D. Graduate Interdisciplinary Research of Jilin University.

Institutional Review Board Statement

Not applicable.

Informed Consent Statement

Not applicable.

Data Availability Statement

Not applicable.

Conflicts of Interest

The authors declare no conflict of interest.

References

  1. Viegas, R.A.; da Silva Mota, F.D.A.; Costa, A.P.C.S.; dos Santos, F.F.P. A multi-criteria-based hazard and operability analysis for process safety. Process. Saf. Environ. Prot. 2020, 144, 310–321. [Google Scholar] [CrossRef]
  2. Lee, J.; Shigrekar, A.; Borrelli, R.A. Application of hazard and operability analysis for safeguardability of a pyroprocessing facility. Nucl. Eng. Des. 2019, 348, 131–145. [Google Scholar] [CrossRef]
  3. Cheng, M.H.; Liu, T.K.; Olenin, S.; Su, P.X. Risk assessment model based on expert’s perspective for ballast water management. Ocean. Coast. Manag. 2019, 171, 80–86. [Google Scholar] [CrossRef]
  4. Wang, W.Z.; Liu, X.W.; Liu, S.L. Failure Mode and Effect Analysis for Machine Tool Risk Analysis Using Extended Gained and Lost Dominance Score Method. IEEE Trans. Reliab. 2020, 69, 954–967. [Google Scholar] [CrossRef]
  5. Lo, H.W.; Liou, J.J.H.; Huang, C.N.; Chuang, Y.C. A novel failure mode and effect analysis model for machine tool risk analysis. Reliab. Eng. Syst. Saf. 2019, 183, 173–183. [Google Scholar] [CrossRef]
  6. Wu, D.D.; Tang, Y.C. An improved failure mode and effects analysis method based on uncertainty measure in the evidence theory. Qual. Reliab. Eng. Int. 2020, 36, 1786–1807. [Google Scholar] [CrossRef]
  7. Gupta, G.; Mishra, R.P. A Failure Mode Effect and Criticality Analysis of Conventional Milling Machine Using Fuzzy Logic: Case Study of RCM. Qual. Reliab. Eng. Int. 2017, 33, 347–356. [Google Scholar] [CrossRef]
  8. Singh, J.; Singh, S.; Singh, A. Distribution transformer failure modes, effects and criticality analysis (FMECA). Eng. Fail. Anal. 2019, 99, 180–191. [Google Scholar] [CrossRef]
  9. Feng, C.M.; Chung, C.C. Assessing the Risks of Airport Airside through the Fuzzy Logic-Based Failure Modes, Effect, and Criticality Analysis. Math. Probl. Eng. 2013, 2013, 239523. [Google Scholar] [CrossRef]
  10. Zheng, X.L.; Chen, H.L.; Xue, S.; Zheng, C.S.; Qi, F.L. Study on explosion risk assessment of low-concentration gas safe combustion system based on FAHP-fuzzy fault tree. Qual. Reliab. Eng. Int. 2021, 1–17. [Google Scholar] [CrossRef]
  11. Yasli, F.; Bolat, B. A risk analysis model for mining accidents using a fuzzy approach based on fault tree analysis. J. Enterp. Inf. Manag. 2018, 31, 577–594. [Google Scholar] [CrossRef] [Green Version]
  12. Liu, G.Y.; Yokoyama, S. Proposal for a Quantitative Skill Risk Evaluation Method Using Fault Tree Analysis. Ieee Trans. Eng. Manag. 2015, 62, 266–279. [Google Scholar] [CrossRef]
  13. Mineo, S.; Pappalardo, G.; D’Urso, A.; Calcaterra, D. Event tree analysis for rockfall risk assessment along a strategic mountainous transportation route. Environ. Earth Sci. 2017, 76, 1–21. [Google Scholar] [CrossRef] [Green Version]
  14. Rahman, S.; Karanki, D.R.; Epiney, A.; Wicaksono, D.; Zerkak, O.; Dang, V.N. Deterministic sampling for propagating epistemic and aleatory uncertainty in dynamic event tree analysis. Reliab. Eng. Syst. Saf. 2018, 175, 62–78. [Google Scholar] [CrossRef]
  15. Chen, F.; Wang, C.; Wang, J.; Zhi, Y.; Wang, Z. Risk assessment of chemical process considering dynamic probability of near misses based on Bayesian theory and event tree analysis. J. Loss Prev. Process. Ind. 2020, 68, 104280. [Google Scholar] [CrossRef]
  16. Kristjanpoller, F.; Cardenas-Pantoja, N.; Viveros, P.; Mena, R. Criticality Analysis Based on Reliability and Failure Propagation Effect for a Complex Wastewater Treatment Plant. Appl. Sci. 2021, 11, 10836. [Google Scholar] [CrossRef]
  17. Shen, G.-X.; Zhao, X.-Z.; Zhang, Y.-Z.; Han, C.-Y. Research on criticality analysis method of CNC machine tools components under fault rate correlation. IOP Conf. Ser. Mater. Sci. Eng. 2018, 307, 012023. [Google Scholar] [CrossRef] [Green Version]
  18. Picoco, C.; Rychkov, V.; Aldemir, T. A framework for verifying Dynamic Probabilistic Risk Assessment models. Reliab. Eng. Syst. Saf. 2020, 203, 107099. [Google Scholar] [CrossRef]
  19. Chen, T.T.; Wang, C.H. Fall Risk Assessment of Bridge Construction Using Bayesian Network Transferring from Fault Tree Analysis. J. Civil. Eng. Manag. 2017, 23, 273–282. [Google Scholar] [CrossRef]
  20. Mzougui, I.; Elfelsoufi, Z. Improvement of Failure Mode, Effects, and Criticality Analysis by Using Fault Tree Analysis and Analytical Hierarchy Process. J. Fail. Anal. Prev. 2019, 19, 942–949. [Google Scholar] [CrossRef]
  21. Ma, Y.; Ma, J.; Sun, C.; Zhang, S.; Cui, X.; Li, Y. Component-based failure mode and effect analysis for flight control systems. J. Xidian Univ. 2016, 43, 174–179. [Google Scholar] [CrossRef]
  22. Shen, G.; Meng, S.; Zhang, Y.; Qi, X.; Luan, L.; Song, Q. Application of average rank time method in reliability modeling for subsystems. J. Jilin Univ. (Eng. Technol. Ed.) 2014, 44, 101–105. [Google Scholar] [CrossRef]
  23. Ebeling, C.E. An Introduction to Reliability and Maintainability Engineering; McGraw-Hill Education Asia Co.: New York, NY, USA, 2008. [Google Scholar]
  24. Zhang, Y.Z.; Mu, L.M.; Shen, G.X.; Yu, Y.; Han, C.Y. Fault diagnosis strategy of CNC machine tools based on cascading failure. J. Intell. Manuf. 2019, 30, 2193–2202. [Google Scholar] [CrossRef]
  25. Guo, S.; Lu, Z. Basic Theory of Complex Networks; China Science Publishing & Media Ltd: Beijing, China, 2012. [Google Scholar]
  26. Fu, K.; Xia, J.; Zhao, X. Node importance evaluation in dynamic convergence complex networks. J. Harbin Inst. Technol. 2017, 49, 112–119. [Google Scholar] [CrossRef]
  27. Jung, S.; Lee, S.; Kwon, O.; Kim, B. Grid-based Traffic Vulnerability Analysis by Using Betweenness Centrality. J. Korean Phys. Soc. 2020, 77, 538–544. [Google Scholar] [CrossRef]
  28. Yang, G.Y.; Xu, D.L.; Zhang, H.C. Closeness-centrality-correlation for detecting interdependency between coupled systems. Mod. Phys. Lett. B 2021, 35, 2150216. [Google Scholar] [CrossRef]
  29. Liao, Y.; Liu, L.; Xing, C. Investigation of Different Normalization Methods for TOPSIS. Trans. Beijing Inst. Technol. 2012, 32, 871–875, 880. [Google Scholar] [CrossRef]
  30. Siebert, J. Fuzzy eigenvector method for deriving normalized fuzzy priorities from fuzzy multiplicative pairwise comparison matrices. Fuzzy Optim. Decis. Mak. 2019, 18, 175–197. [Google Scholar] [CrossRef]
  31. Song, H.; Lu, X.; Wu, Q.; Xu, Y.; Peng, B. Weight Calculation Method for Consumer Goods Risk Assessment Indexes Based on Analytic Hierarchy Process. IOP Conf. Ser. Earth Environ. Sci. 2020, 440, 042001. [Google Scholar] [CrossRef]
  32. Shen, G.; Chen, B.; Zhang, Y.; Xue, Y. Optimum reliability model based on the entropy-fuzzy value. J. Jilin Univ. (Eng. Technol. Ed.) 2008, 38, 117–121. [Google Scholar] [CrossRef]
  33. Shan, C.; Dong, Z.; Fan, K.; Yang, J.; Liu, C.; Fang, Q. Application of combination weighting method to weight calculation in river health evaluation. J. Hohai Univ. (Nat. Sci.) 2012, 40, 622–628. [Google Scholar] [CrossRef]
  34. Puth, M.T.; Neuhauser, M.; Ruxton, G.D. Effective use of Spearman’s and Kendall’s correlation coefficients for association between two measured traits. Anim. Behav. 2015, 102, 77–84. [Google Scholar] [CrossRef] [Green Version]
  35. Feng, R. Reliability and Risk Assessment of Machining Center Based on Failure Rate Correlation. Master’s Thesis, Jilin University, Changchun, China, 2015. [Google Scholar]
Figure 1. Comprehensive failure risk assessment framework diagram of machining center component.
Applsci 12 00423 g001
Figure 2. Block diagram of the calculation of the failure mode frequency ratio of the machining center.
Applsci 12 00423 g002
Figure 3. Typical ANP model.
Applsci 12 00423 g003
Figure 4. Digraph of the machining center component association relationship.
Applsci 12 00423 g004
Figure 5. Frequency diagram of failure parts of machining center.
Applsci 12 00423 g005
Figure 6. Frequency chart of failure causes of machining center.
Applsci 12 00423 g006
Figure 7. ANP model of failure mode of machining center.
Applsci 12 00423 g007
Figure 8. Super limit matrix of failure mode of machining center (W).
Applsci 12 00423 g008
Figure 9. The failure mode influence degree of the cooling system.
Applsci 12 00423 g009
Figure 10. Transformation of ANP model of machining center into topological structure model.
Applsci 12 00423 g010
Figure 11. Comparison of structural indicators of machining center components.
Applsci 12 00423 g011
Figure 12. Comparison chart of ranking trends for each risk value of the component at 4000 h.
Applsci 12 00423 g012
Figure 13. Comparison diagram of the ranking trend of component risk values at different moments.
Applsci 12 00423 g013
Table 1. 1–9 scale scoring method.
ScoreRepresentation
1Have the same degree of influence
3One element is slightly more influential than another
5One element is significantly more influential than another
7One element has a stronger influence than another
9One element is extremely influential than another
2, 4, 6, 8Represents the median value of the above adjacent judgment
ReciprocalThe degree of influence of element i on element j and the degree of influence of element j on element i are the reciprocal of each other
Table 2. Failure modes frequency table of the machining center.
Pattern CodeFailure TypeFailure ModeNumberFrequency
010101-Damaged01-Parts are damaged230.2130
010301-Damaged03-Damage to liquid, gas, oil parts and components160.1481
030103-Clogged or leaky type01-Liquid, gas, and oil leakage160.1481
010201-Damaged02-Components are damaged50.0463
050105-Functional01-No movement of moving parts50.0463
060506-State type05-Vibration or shaking50.0463
020202-Loose type02-Locking parts are loose40.0370
050305-Functional03-Transposition, shift is not in place40.0370
041004-Disadjustment type10-Spindle misalignment30.0278
060306-State type03-Abnormal noise30.0278
030203-Clogged or leaky type02-Liquid, gas and oil clogging is not smooth20.0185
020502-loose type05-Components and parts fall off20.0185
060706-State type07-Loss of function of the components20.0185
080508-Other types05-Insufficient coolant and lubricating oil20.0185
050205-Functional02-Moving parts are stuck10.0093
050605-Functional06-Moving parts10.0093
Table 3. Frequency table of failure cause of the machining center.
CodeCauseFrequency NumberFrequencyCodeCauseFrequency NumberFrequency
34Damaged parts330.305632CNC parameter error30.0278
20Leakage160.148137Improper design30.0278
33Damaged components80.074103Stuck20.0185
36Improper adjustment80.074116Gap discomfort20.0185
17Pressure and flow are not suitable60.055623Overheat20.0185
14Loose40.037042Insufficient coolant20.0185
04Burn out30.027801Fracture10.0093
19Blockage30.027809Dislocation10.0093
39Sensing parts malfunction30.027815Fall off10.0093
30Flutter30.027822Drift10.0093
31Misoperation30.0278
Table 4. Model parameter of failure rate of each component of machining center.
Component γ ^ θ ^
M1.3122458.100
J1.2952606.440
S0.6417832.664
V0.7717935.696
K0.9315960.776
G0.52427503.400
W0.9104145.720
NC0.5427912.399
L0.7918161.512
Table 5. Failure rate of each component of the machining center at 4000 h.
ComponentFailure Rate (1/h)ComponentFailure Rate (1/h)
V0.000114G0.000048
W0.000220J0.000564
K0.000161S0.000104
NC0.000094M0.000621
L0.000112
Table 6. Inconsistency report of W101.
SortRowColCurrent ValBeat ValOld Inconsist.New Inconsist.
1W103W3026.00011.0490.02460.008
2W103W6104.0002.2610.02460.009
3W301W3022.0001.3200.02460.017
4W301W6102.0001.3880.02460.018
5W302W6103.0002.4440.02460.023
6W103W3015.0005.0150.02460.025
Table 7. Frequency ratio of failure modes and influence degree of failure modes of each component of machining center.
CodePattern Code α i j β i j CodePattern Code α i j β i j
M01010.31580.3421S04100.23080.2444
05030.15790.117501010.15380.0325
02020.10530.032002020.15380.0115
06050.10530.002306050.15380.0111
02010.05260.002102030.07690.0084
02050.05260.139805030.07690.4367
05010.05260.103706090.07690.0678
05020.05260.112106030.07690.0092
05060.05260.035106060.25000.1785
06160.05260.1133
W01010.28570.2979J01010.28570.3515
03020.21430.069501030.14290.3571
03010.14290.074905020.14290.0959
08050.14290.071606010.14290.0420
01030.07140.275406030.14290.1377
06010.07140.096208030.14290.0157
06100.07140.1146
L01030.57140.3333V01020.87500.2500
03010.28570.266701080.12500.2500
01010.14290.400004090.1000.5000
NC01020.66700.5000G04030.42860.3049
05010.33300.500003010.28570.1848
K01010.50000.500001030.14290.2054
05010.50000.500004040.14290.3049
Table 8. Independent risk value of each component of the machining center at 4000 h.
Component R I i Component R I i
V0.00003G0.00001
W0.00003J0.00011
K0.00008S0.00002
NC0.00005M0.00010
L0.00004
Table 9. Centrality measure of machining center component nodes.
ComponentDegree CentralityBetweenness CentralityCloseness Centrality
V0.5560.0000.143
W0.2220.0280.045
K0.2220.0000.053
NC0.4440.0000.071
L0.4440.0000.083
G0.2220.0000.059
J0.4440.0000.071
S0.5560.0000.083
M0.4440.0000.077
Table 10. Importance of each component of machining center.
ComponentImportanceComponentImportance
V0.097G0.039
W0.058J0.073
K0.038S0.091
NC0.073M0.074
L0.074
Table 11. Importance of each connection edge of machining center.
Connection EdgeImportanceConnection EdgeImportance
VNC0.495LM0.500
VW0.484LJ0.500
WK0.489G→S0.458
NCJ0.500GM0.475
NCM0.500JS0.497
NCS0.497V→S0.500
LK0.473VM0.495
LS0.497VJ0.495
Table 12. Importance of each connection edge of machining center.
Connection Edge P ( k , i ) Connection Edge P ( k , i )
VNC0.221LM0.217
VW0.216LJ0.217
WK0.303GS0.140
NCJ0.249GM0.145
NCM0.249JS0.410
NCS0.248VS0.223
LK0.205VM0.221
LS0.216VJ0.495
Table 13. Propagation failure risk value of each component of the machining center at 4000 h.
Component R p i ( × 10 3 ) Component R p i ( × 10 3 )
V0.0000G0.0000
W0.0074J0.0290
K0.0126S0.0872
NC0.0075M0.0308
L0.0000
Publisher’s Note: MDPI stays neutral with regard to jurisdictional claims in published maps and institutional affiliations.

