Article

Effect of the Planetesimal Belt on the Dynamics of the Restricted Problem of 2 + 2 Bodies

by
Govind Mahato
1,
Ashok Kumar Pal
2,
Sawsan Alhowaity
3,
Elbaz I. Abouelmagd
3,4,* and
Badam Singh Kushvah
1
1
Department of Mathematics & Computing, Indian Institute of Technology (Indian School of Mines), Dhanbad 826004, Jharkhand, India
2
Department of Mathematics and Statistics, Manipal University Jaipur, Jaipur 303007, Rajasthan, India
3
Department of Mathematics, College of Science & Humanities, Shaqra University, Sahqra 15551, Saudi Arabia
4
Celestial Mechanics and Space Dynamics Research Group (CMSDRG), Astronomy Department, National Research Institute of Astronomy and Geophysics (NRIAG), Helwan, Cairo 11421, Egypt
*
Author to whom correspondence should be addressed.
Appl. Sci. 2022, 12(1), 424; https://doi.org/10.3390/app12010424
Submission received: 27 November 2021 / Revised: 25 December 2021 / Accepted: 27 December 2021 / Published: 2 January 2022

Abstract

:
In this paper, we study the existence and stability of collinear and noncollinear equilibrium points within the frame of the perturbed restricted problem of 2 + 2 bodies by a planetesimal belt. We compare and investigate the corresponding results of the perturbed and unperturbed models. The impact of the planetesimal belt is observed on collinear and noncollinear equilibrium points. We demonstrate that all equilibrium points are unstable, and we numerically investigate the noncollinear equilibrium points. Finally, we emphasize that the proposed problem is a credible model for describing the capture of small bodies by a planet.

1. Introduction

In the field of celestial mechanics, the circular restricted three-body problem (CRTBP), where an infinitesimal body moves under the influence of two primaries without affecting the motion of the primaries, has been extensive used. For details and investigations, see [1,2,3,4]. The dynamics of the combined system of two primaries and two minor bodies, called the restricted 2 + 2 body problem (R2+2BP), was analyzed in [5,6]. In this model, two equations of the motion of the CRTBP are coupled with each other by mutual gravitational interactions. This model, or the dual-satellite-like model, helps with studying the dynamic behavior of binary asteroids in the presence of two primaries. Whipple studied R2+2BP and found 14 pairs of equilibrium points [5]. The study of R2+2BP with different disturbing forces produced more precise and accurate data about the system’s dynamic behavior.
Many researchers incorporated different effects of R2+2BP to analyze the perturbed dynamics of the system. For example, Kumar et al. studied the generalized R2+2BP by considering the second primary as a straight segment, and showed that length parameter has a subsequent effect on the location of all equilibrium points [7]. Kalvouridis and Mavraganis [8] found R2+2BP dynamics in the presence of the photo gravitational effect, and Kalvouridis [9] studied the impact of oblate in R2+2BP. The families of a periodic orbit in R2+2BP were discussed by Spurgin [10], who found that the orbits are stable. The stability of R2+2BP was evaluated by Milani and Nobili [11], who showed that the integral of the system, which is similar to RTBP, does not result in hill stability. The restricted 2 + 2 problem with a homogeneous axis-symmetric ellipsoid was described by El-Shaboury [12], who also found 16 solutions in the neighborhood of triangular equilibrium points. A ring-shaped disk-like region formed from dust, comets, asteroids, etc., in the space having considerable mass exerts some gravitational force and affects the dynamic behavior of infinitesimal bodies.
In our solar system, the asteroid belt and kuiper belt are dust-belt-like structures. Dust-belt-like structures are also present in the Proxima Centauri system. Many researchers have studied the effect of the asteroid belt in CRTBP [13,14,15,16], and found that these perturbations exhibit significant changes in the equilibrium position. In this paper, we investigate some new aspects of R2+2BP, along with the disk-like belt effect on the potential function; as such, we found the change in the equilibrium positions. Moreover, we analyze the variation in the distance of the equilibrium location of a minor body P 1 and P 2 for μ 1 = μ 2 from its neighboring equilibrium point L i , i = 1 , 2 , 3 , 4 , 5 ) versus mass ratio μ . The effects of perturbed equilibrium points are compared with those of the unperturbed 2 + 2 body problem. We discuss the stability of the perturbed system with the help of eigenvalues for the particle P 1 .
In general, the restricted 2 + 2 bodies problem is formulated as a credible model to show the capture of small bodies by a planet. In particular, two primaries are considered to revolve in a circular mutual orbit and two infinitesimal bodies, where neither of them affects the primaries’ motion. If the small bodies are temporarily captured in the Hill sphere of the smaller primary, they may become close enough to each other to exchange energy so that one of them becomes regularly and permanently captured. The aforementioned descriptions are considered the major applications of the restricted 2 + 2 bodies problem, which motivated us to study a more generalized model for this problem.
This paper is organized as follows: In Section 2, we formulate the restricted 2 + 2 body problem in the presence of the planetesimal belt effect. In Section 3, the variation in equilibrium points against mass ratio μ is described and we compare the perturbed equilibrium points with unperturbed equilibrium points. Furthermore, a stability analysis is performed in Section 4, and in Section 5, we discuss the results and provide our conclusions.

2. Formulation of the Model

The restricted 2 + 2 body problem consists of two primaries, M 1 and M 2 , with unitless masses 1 μ and μ , respectively. They are assumed to move on circular Keplerian orbits around their common center of mass under their mutual gravitational force. Two infinitesimal bodies, P 1 and P 2 , of dimensionless masses μ 1 and μ 2 , respectively, move in the gravitational field while mutually attracting each other without perturbing the primaries. The perturbed mean motion n can be considered as in [15,16,17,18],
n 2 = 1 + 2 M b r c r c 2 + T 2 3 2 ,
where M b is the total mass of the planetesimal belt, and r c is the dimensionless reference radius of the planetesimal belt. The gravitational potential of the planetesimal-belt-like system is expressed as in [19,20],
φ b ( R , z ) = M b ( R 2 + [ a + z 2 + b 2 ] 2 ) 1 2 ,
where R is the minor body’s radial distance, a is the flatness parameter, b is the core parameter, and z is the coordinate of the planetesimal belt in a direction of Z-axis. The potential reduces to the system of a point mass with the condition a = b = 0 . Restricting the condition to the X Y plane (i.e., Z = 0 ) and defining T = a + b , we have the unit less potential written as,
φ b ( R , 0 ) = M b ( R 2 + T 2 ) 1 2 .
According to the formulation of the restricted 2 + 2 body problem given by [5,21,22], R2 + 2BP is characterized by three parameters, μ , μ 1 and μ 2 , which are the mass parameters of M 2 , P 1 , and P 2 , respectively. We consider a perturbed R2+2BP in the rotating coordinate system. Let ( μ , 0 , 0 ) , ( μ 1 , 0 , 0 ) , ( x 1 , y 1 , z 1 ) , and ( x 2 , y 2 , z 2 ) be the coordinates of M 1 , M 2 , P 1 , and P 2 , respectively, in a rotating frame, as shown in Figure 1.
Using dimensionless variables and considering the effect of the planetesimal belt, the restricted 2 + 2 problem is described by differential equations [5]:
x i ¨ 2 n y i ˙ = 1 μ i U x i , y i ¨ + 2 n x i ˙ = 1 μ i U y i , z i ¨ = 1 μ i U z i ,
U = i = 1 2 μ i 1 2 n 2 x i 2 + y i 2 + 1 μ r 1 i + μ r 2 i + 1 2 μ 3 i r + M b R i 2 + T 2 1 2 .
where
n 2 = 1 + 2 M b r c r c 2 + T 2 3 2 , μ = M 2 M 1 + M 2 , μ i = m i M 1 + M 2
r c 2 = 1 μ + μ 2 , R i 2 = x i 2 + y i 2 ,
r 1 i 2 = ( x i μ ) 2 + y i 2 + z i 2 , r 2 i 2 = ( x i μ + 1 ) 2 + y i 2 + z i 2 , r 2 = ( x 1 x 2 ) 2 + ( y 1 y 2 ) 2 + ( z 1 z 2 ) 2 .

3. Equilibrium Points

The equilibrium points are the positions of an infinitesimal body where the motion of the minor vanishes. Thus, the velocity and acceleration of P i , i = 1 , 2 are zero, i.e., x i ˙ = y i ˙ = z i ˙ = x i ¨ = y i ¨ = z i ¨ = 0 . Applying these conditions in Equation (2), we obtain, 2.0
U x 1 = μ 1 n 2 x 1 ( 1 μ ) ( x 1 μ ) r 11 3 μ ( x 1 μ + 1 ) r 21 3 μ 2 ( x 1 x 2 ) r 3 M b x 1 R 1 2 + T 2 3 2 = 0 ,
U y 1 = μ 1 n 2 y 1 ( 1 μ ) y 1 r 11 3 μ y 1 r 21 3 μ 2 ( y 1 y 2 ) r 3 M b y 1 R 1 2 + T 2 3 2 = 0 ,
U z 1 = ( 1 μ ) z 1 r 11 3 μ z 1 r 21 3 μ 2 ( z 1 z 2 ) r 3 = 0 ,
U x 2 = μ 2 n 2 x 2 ( 1 μ ) ( x 2 μ ) r 12 3 μ ( x 2 μ + 1 ) r 22 3 μ 1 ( x 2 x 1 ) r 3 M b x 2 ( R 2 2 + T 2 ) 3 2 = 0 ,
U y 2 = μ 2 n 2 y 2 ( 1 μ ) y 2 r 12 3 μ y 2 r 22 3 μ 2 ( y 2 y 1 ) r 3 M b y 2 ( R 2 2 + T 2 ) 3 2 = 0 ,
U z 2 = ( 1 μ ) z 2 r 21 3 μ z 2 r 22 3 μ 1 ( z 2 z 1 ) r 3 = 0 .
Simplifying Equation (5), we obtain,
z 1 = z 2 μ 2 r 3 ( 1 μ ) r 11 3 + μ r 21 3 + μ 2 r 3 .
Using the value of z 1 from (9) in (8), we obtain either z 2 = 0 or c = 0 , where
c = ( 1 μ ) r 21 3 + μ r 22 3 + μ 1 r 3 μ 1 μ 2 r 6 ( 1 μ ) r 11 3 + μ r 21 3 + μ 2 r 3 .
However, we observe that c is nonzero for all values of μ , μ 1 , and μ 2 . Therefore, z 2 must be zero and hence z 1 = 0 . Consequently, all equilibrium points of the restricted 2 + 2 body problem lie on the X Y plane. Hence, the solutions of the equilibrium points can be obtained from Equations (3), (4), (6) and (7).

3.1. Collinear Equilibrium Points

The collinear equilibrium points appear on the X-axis. These points can be calculated using Equations (3) and (6) with conditions y 1 = 0 and y 2 = 0 . Then, we have,
μ 1 n x 1 ( 1 μ ) ( x 1 μ ) | x 1 μ | 3 μ ( x 1 μ + 1 ) | x 1 μ + 1 | 3 μ 2 ( x 1 x 2 ) | x 1 x 2 | 3 M b x 1 2 1 3 2 T 2 x 1 2 + 15 8 T 4 x 1 4 = 0 ,
μ 1 n x 1 ( 1 μ ) ( x 1 μ ) | x 1 μ | 3 μ ( x 1 μ + 1 ) | x 1 μ + 1 | 3 μ 2 ( x 1 x 2 ) | x 1 x 2 | 3 M b x 1 2 1 3 2 T 2 x 1 2 + 15 8 T 4 x 1 4 = 0 .
The solution of the present model obtained by the perturbation method was proposed by [5]. The solutions of Equations (10) and (11) are x 1 and x 2 , expressed in a power series with small parameters [5,8].
x 1 = L j + a 11 ε 2 + a 12 ε 2 2 + , x 2 = L j + a 21 ε 1 + a 22 ε 1 2 + ,
where ε i = μ i ( μ 1 + μ 2 ) 2 3 and L j , j = 1 , 2 , 3 are the collinear Lagrangian points of CRTBP. Hence, Equations (10) and (11) can be written as:
a 11 W x x 0 ε 2 μ 2 ( x 1 x 2 ) | x 1 x 2 | 3 = 0 ,
a 21 W x x 0 ε 1 μ 1 ( x 2 x 1 ) | x 1 x 2 | 3 = 0 ,
where
W = 1 2 n 2 x 2 + y 2 + 1 μ r 1 + μ r 2 + M b R 2 + T 2 1 2 .
Using Equations (12) and (13), we have a 11 = a 21 and a 11 = ± 1 ( W x x ) 1 3 . Thus, the equilibrium points of R2+2BP are:
L j ± P 1 = L j ± μ 2 [ ( μ 1 + μ 2 ) 2 W x x ] 1 3 ,
L j ± P 2 = L j ± μ 1 [ ( μ 1 + μ 2 ) 2 W x x ] 1 3 .
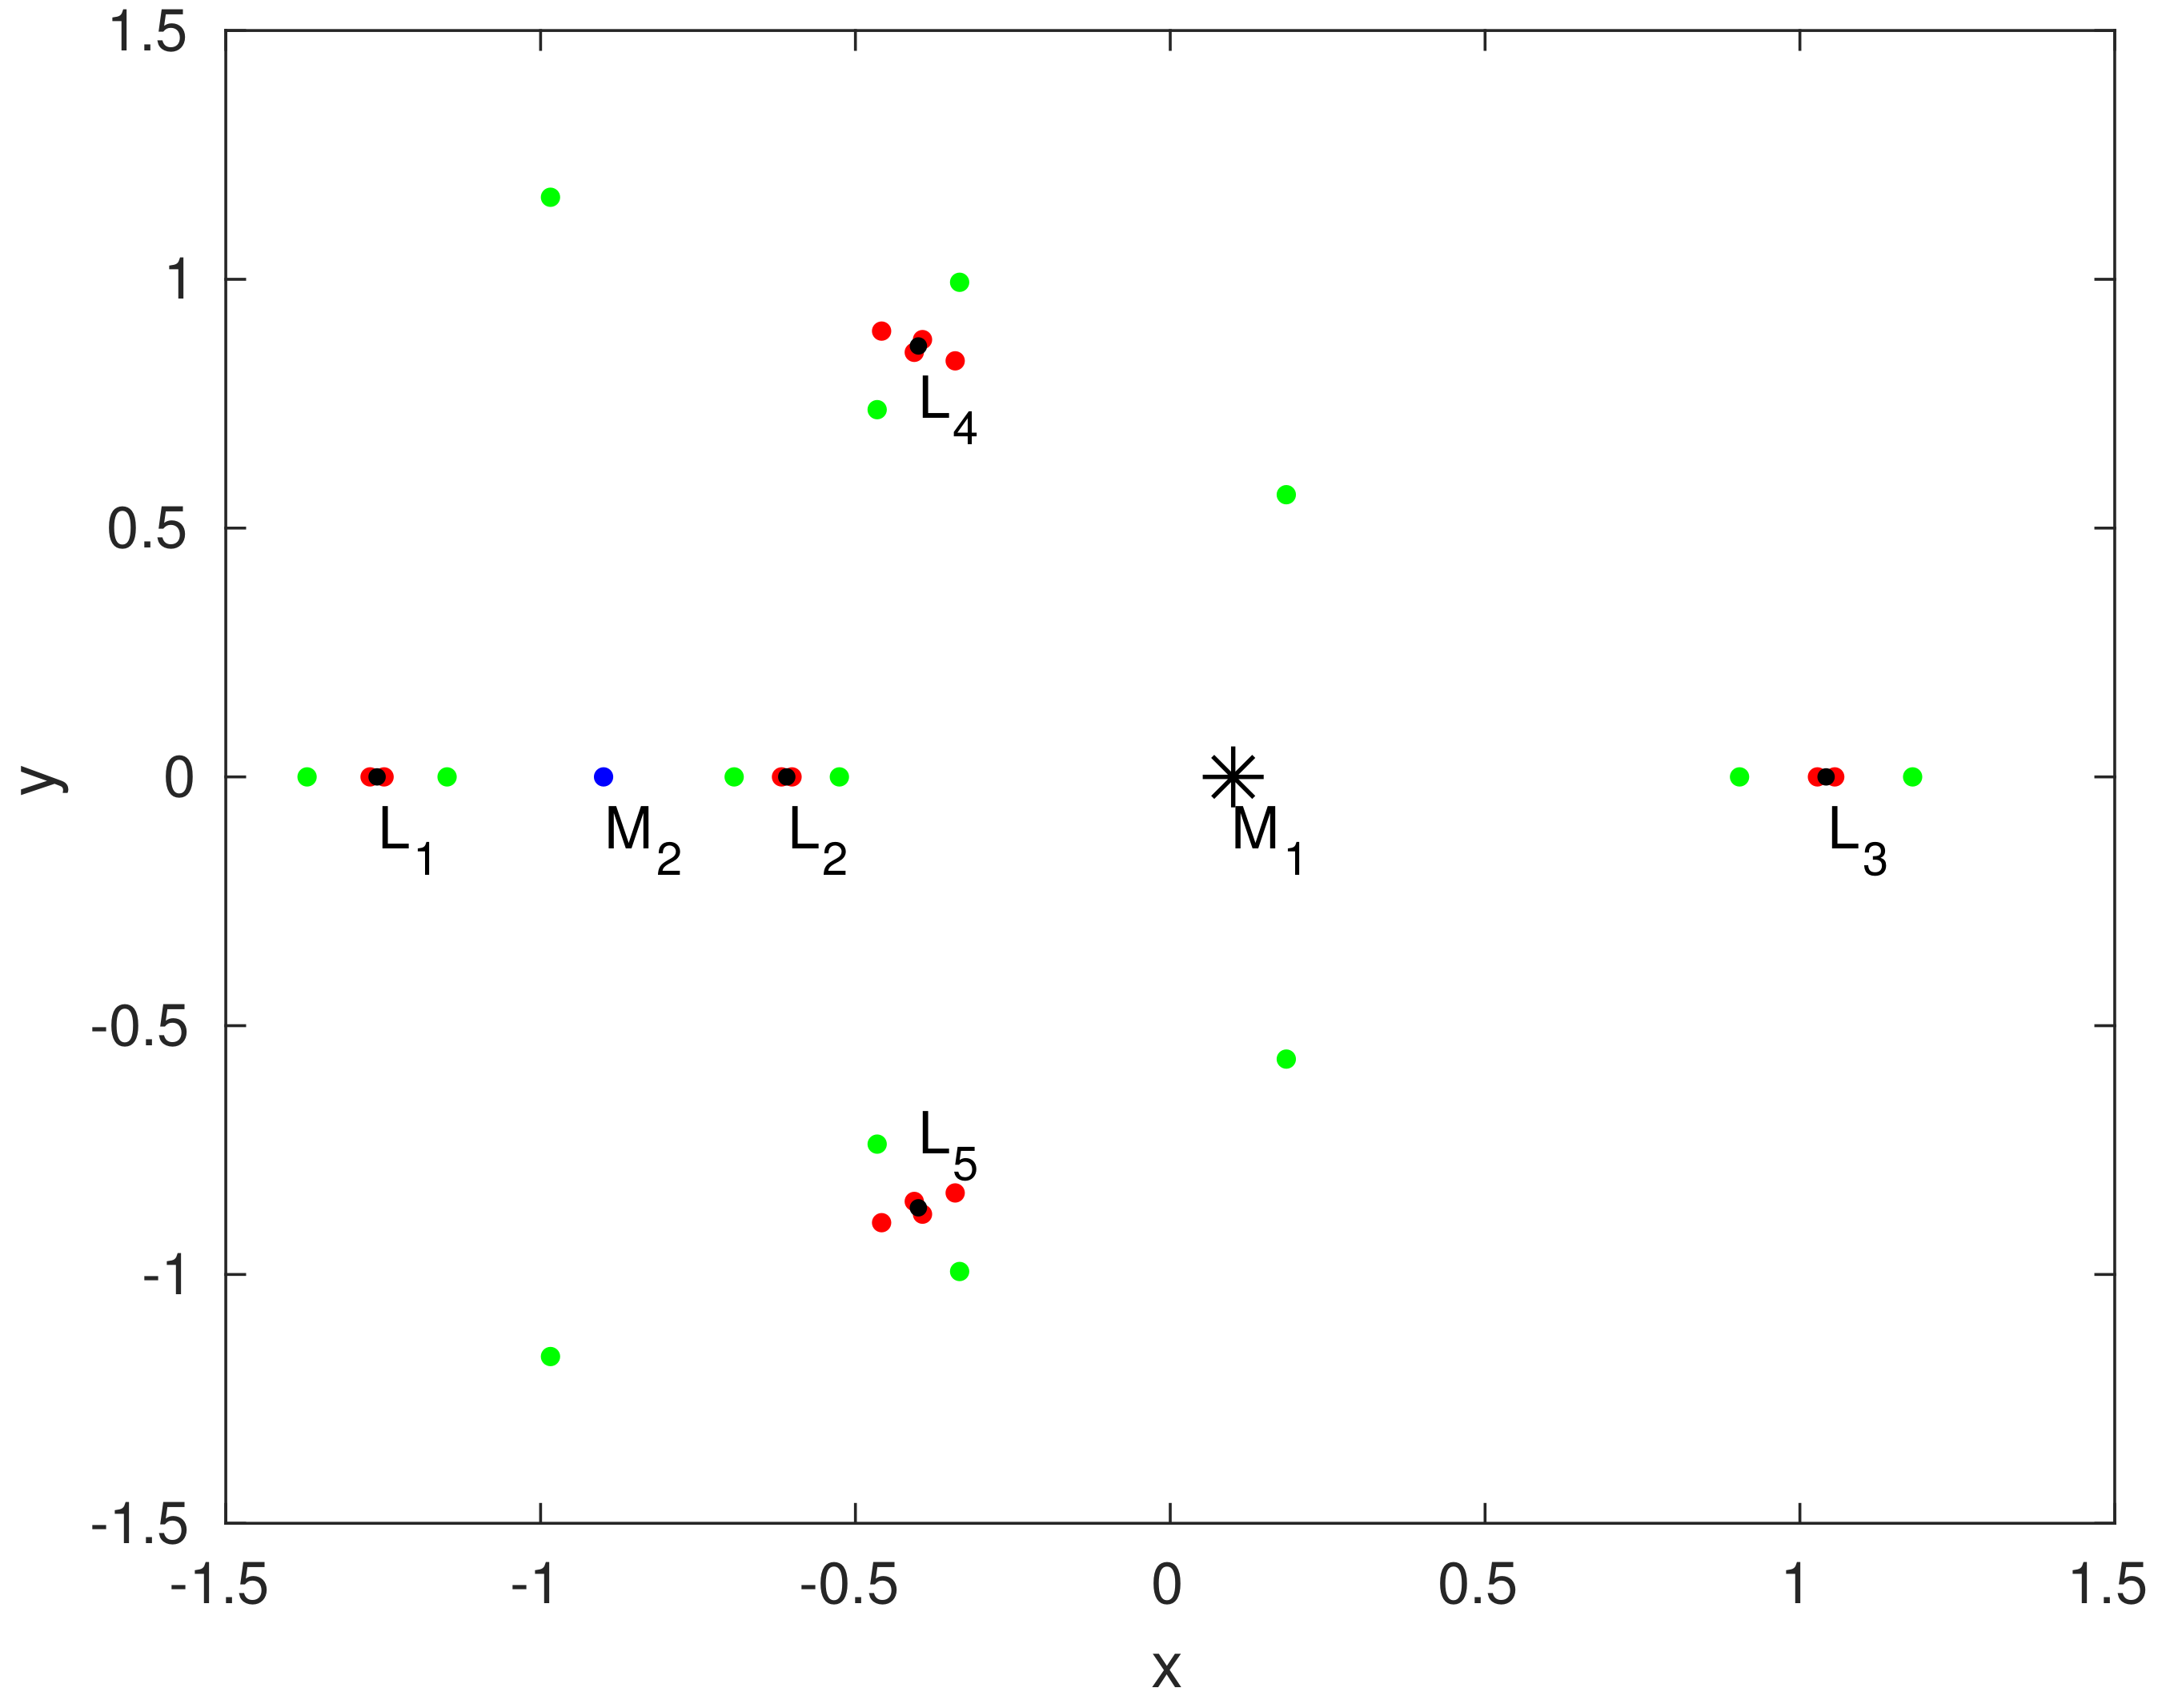
Equations (15) and (16) yield paired equilibrium positions near the collinear equilibrium points L j , j = 1 , 2 , 3 of R2+2BP. We denote the collinear equilibrium points as L j ± P i , ( i = 1 , 2 . j = 1 , 2 , 3 ) . Superscript P i denotes the equilibrium points for an infinitesimal body; P i , i = 1 , 2 denotes the equilibrium points near L 1 , L 2 , and L 3 . Subscript j ± denotes the relative position of equilibrium points, where + indicates the right and − indicates the left position with respect to L j , j = 1 , 2 , 3 . Figure 2 shows the positions of the equilibrium points when μ = 0.1 , μ 1 = 0.01 , and μ 2 = 0.001 with the planetesimal belt effect M b = 3 × 10 7 and parameter T = 0.11 . The positions of the equilibrium points are shown as P 1 (green) and P 2 (red). In the presence of the planetesimal belt effect, we can observe that the first equilibrium position of P 1 L 1 P 1 is to the left of L 1 . The equilibrium position of P 2 L 1 + P 2 is to the right of L 1 . Similarly, the second equilibrium position of P 1 , i.e., L 1 + P 1 , is to the right of L 1 . The equilibrium position of P 2 , i.e., L 1 P 2 , is to the left of L 1 . As such, we also found four collinear equilibrium points near L 2 and L 3 .
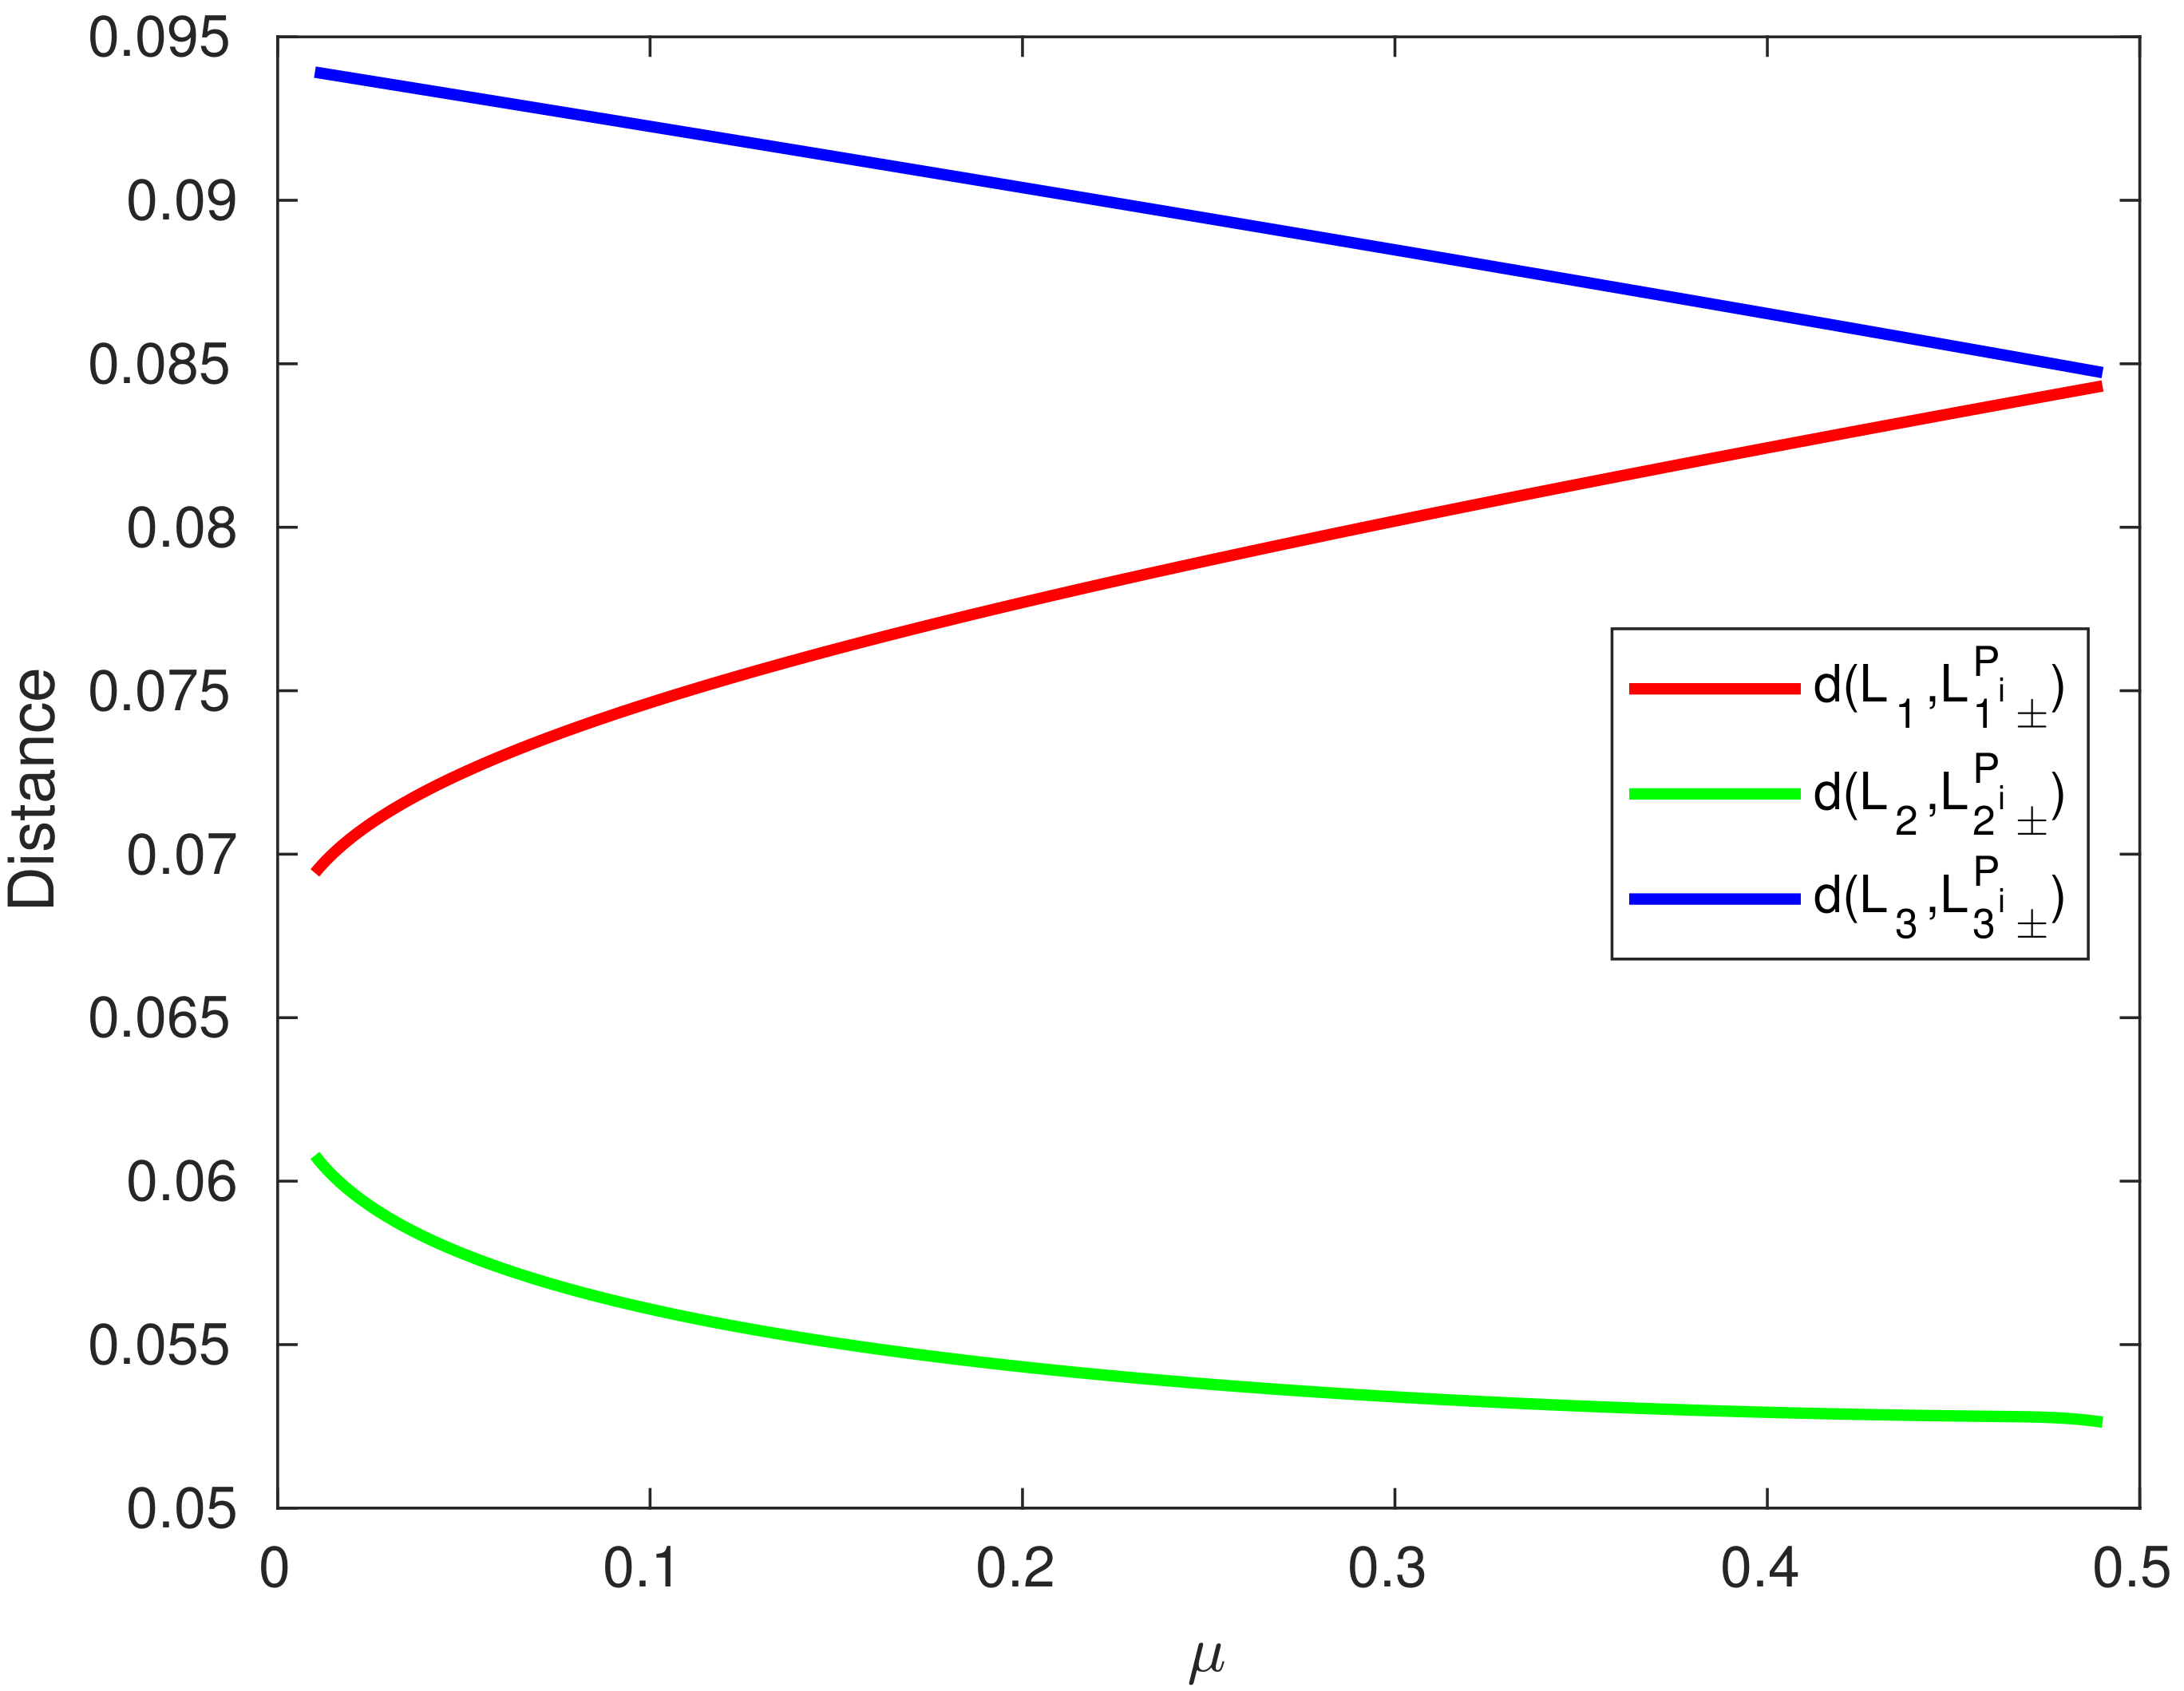
The positions of the collinear equilibrium points were also calculated numerically, as shown in Table 1, Table 2 and Table 3 for μ 1 = 10 10 , μ 2 = 10 12 , M b = 3.7 × 10 7 , and T = 0.11 with the variation in μ . Table 1 shows that when μ increases L 1 ± P 1 , L 1 ± P 2 decreases. In Table 2 and Table 3, L 2 ± P 1 , L 2 ± P 2 , L 3 ± P 1 , and L 3 ± P 2 increase with increasing μ . Moreover, we analyzed the effect of the planetesimal belt on R2+2BP. The equilibrium positions of two minor bodies are the same if the masses are equal, i.e., μ 1 = μ 2 . Consequently, the distance from L j to L j ± P i for i = 1 , 2 is equal, i.e., if d ( x , y ) is the distance between points x and y, then d ( L j , L j ± P 1 ) = d ( L j , L j ± P 2 ) . Therefore, we plot the distance versus μ in Figure 2 by considering M b = 3.7 × 10 7 , T = 0.11 and μ 1 = μ 2 = 10 2 ; in Figure 3, d ( L 1 , L 1 ± P i ) increases as μ increases in 0 < μ < 0.5 . Concurrently, d ( L 2 , L 2 ± P i ) , and d ( L 3 , L 3 ± P i ) decrease as μ increases from 0 to 0.5 .
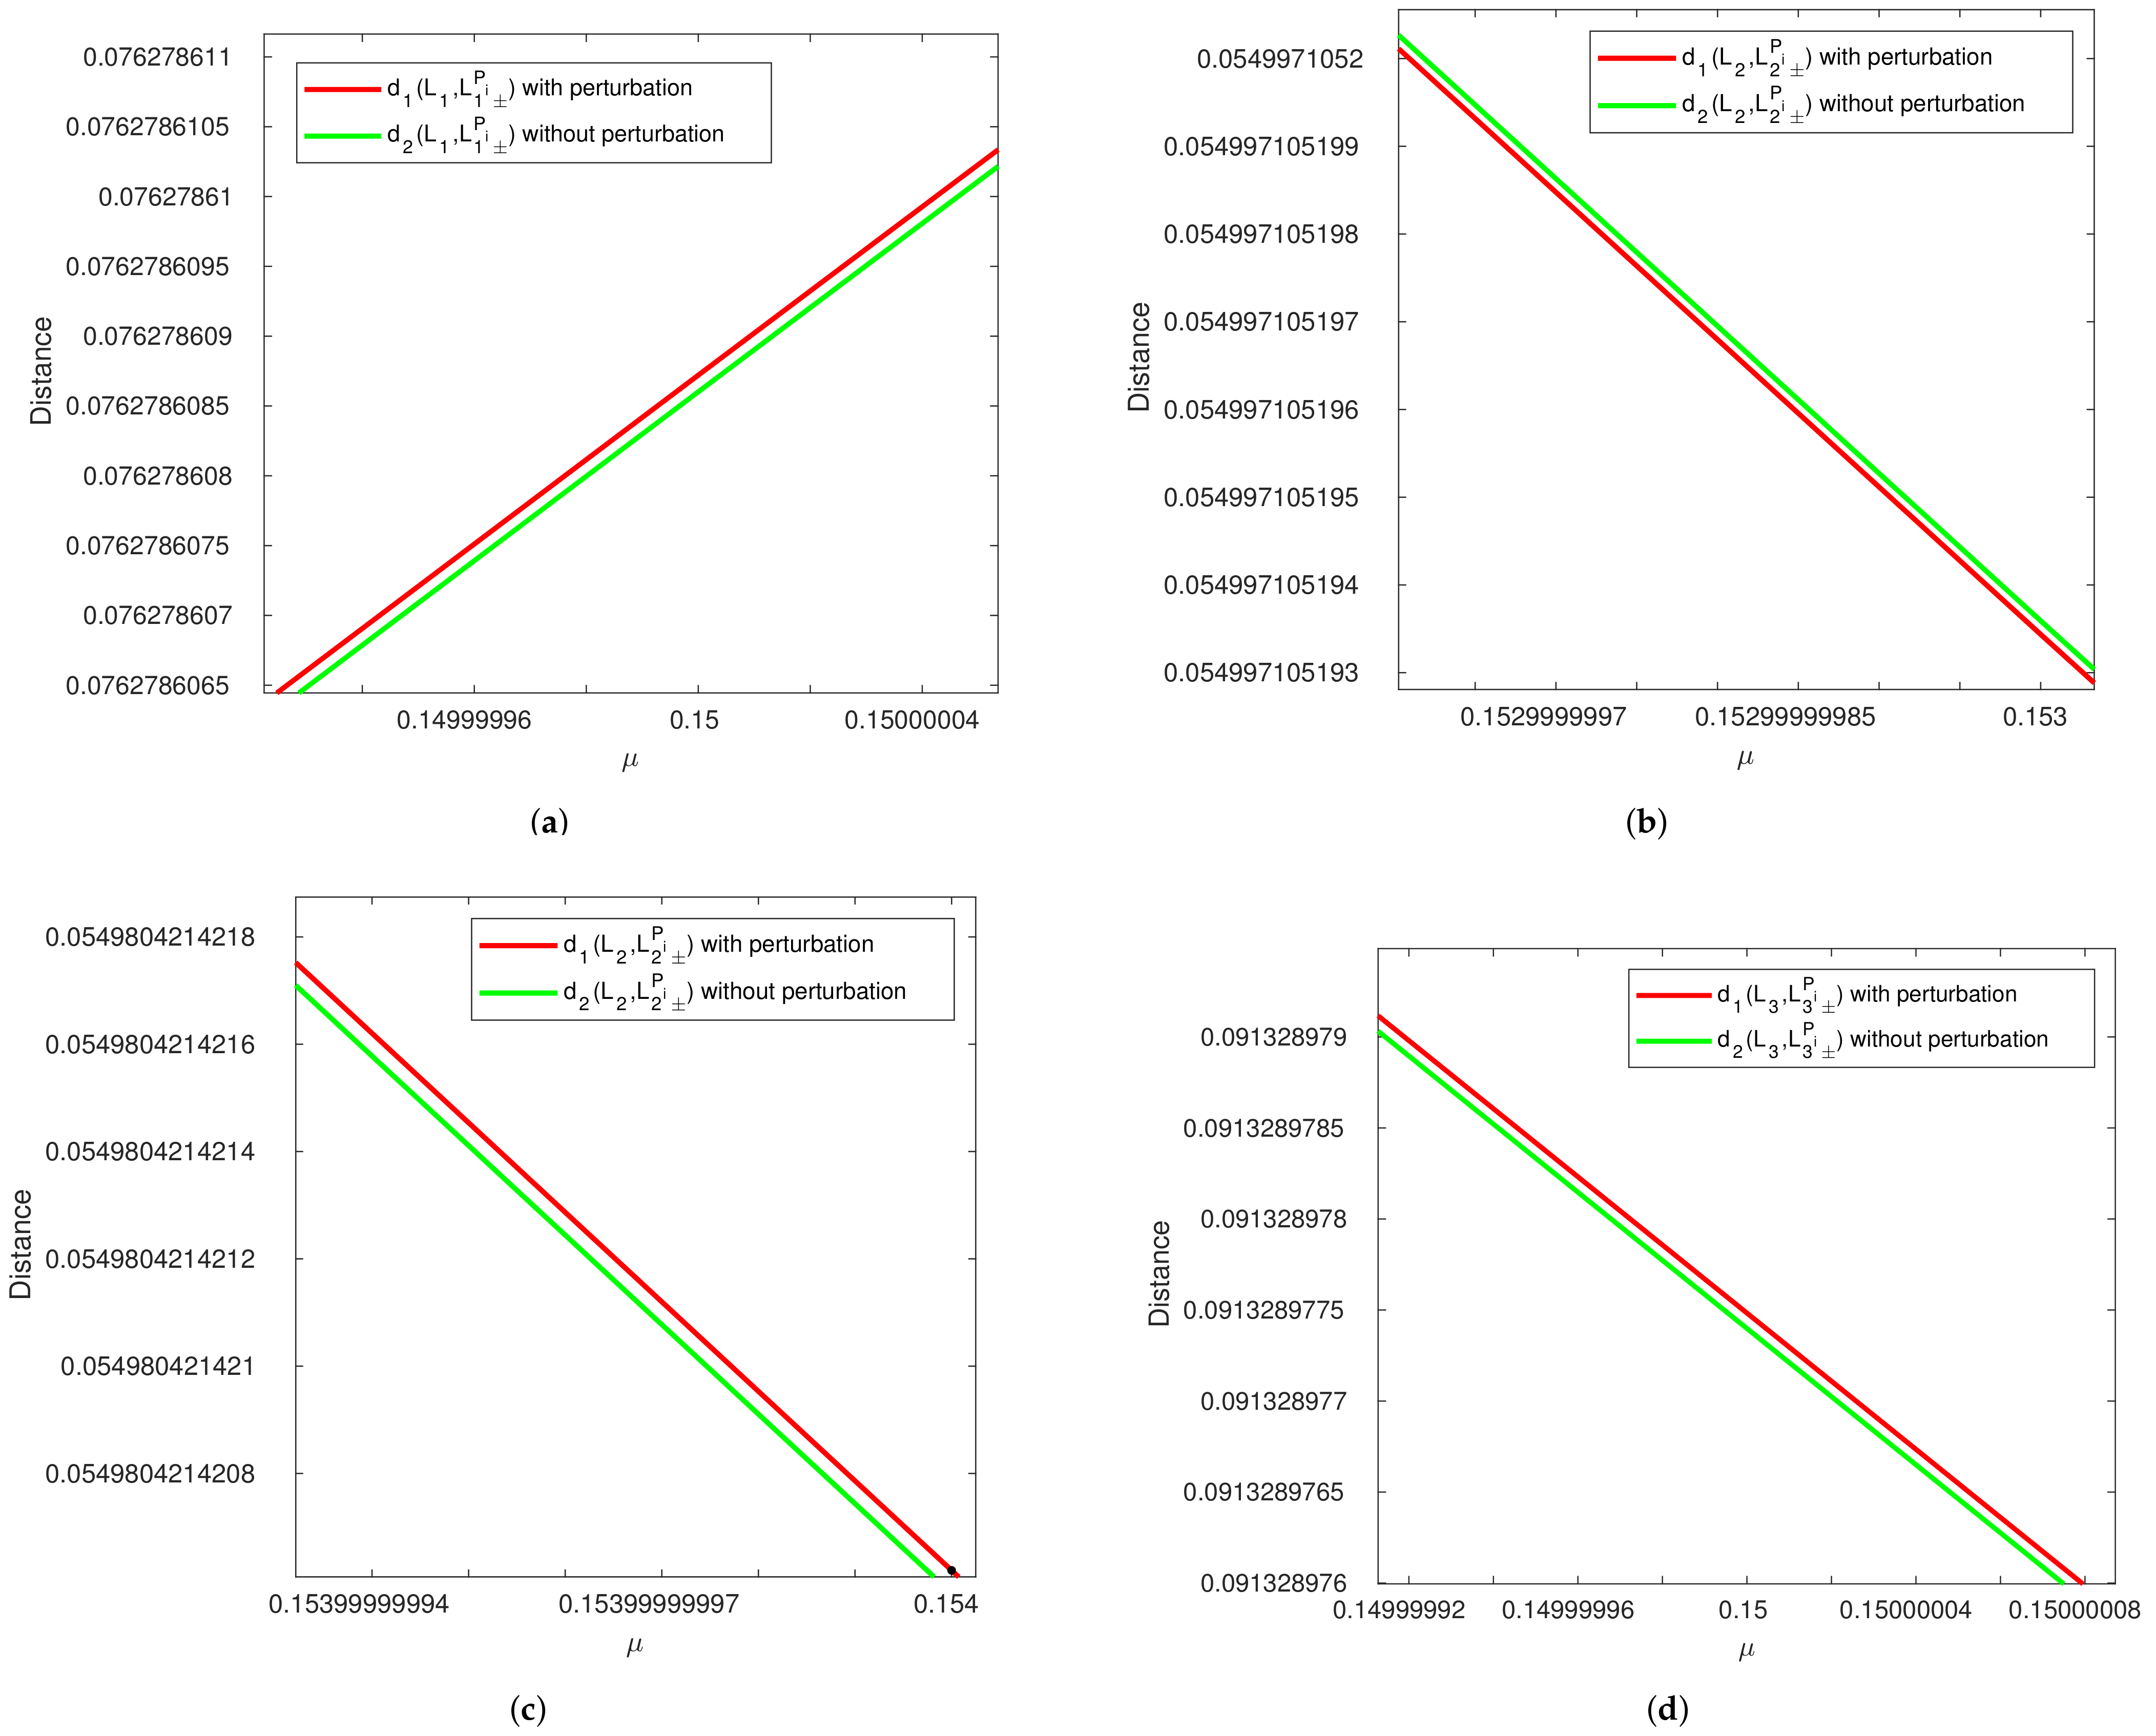
In Figure 4, we compare the effect of planetesimal belt perturbation on the collinear equilibrium points with unperturbed collinear equilibrium points in consideration of a distance function. In Figure 4a–d, the red line shows the distance d 1 ( L j , L j ± P i ) , ( j = 1 , 2 , 3 ) and ( i = 1 , 2 ) with the planetesimal belt effect, and the green line shows the distance d 2 ( L j , L j ± P i ) without the planetesimal belt effect. Here, d 1 is used to show the effect on distance with planetesimal belt perturbation, whereas d 2 is used for unperturbed collinear points. Figure 4a,d shows that d 1 ( L 1 , L 1 ± P i ) > d 2 ( L 1 , L 1 ± P i ) and d 1 ( L 3 , L 3 ± P i ) > d 2 ( L 3 , L 3 ± P i ) when 0 < μ < 0.5 . We used a step length h = 0.001 for the variation in μ . We found that d 1 ( L 2 , L 2 ± P i ) < d 2 ( L 2 , L 2 ± P i ) for μ < 0.153 and d 1 ( L 2 , L 2 ± P i ) > d 2 ( L 2 , L 2 ± P i ) for μ > 0.153 , as shown in Figure 4a–c.
Table 4, Table 5 and Table 6 show the collinear equilibrium points of the system: Sun–Saturn with the Kuiper belt ( μ = 0.000286 , M b = 3.00 × 10 7 , T = 0.11 ), Sun–Mars with an asteroid belt ( μ = 0.0000003 , M b = 1.6 × 10 9 , T = 0.11 ), and the Proxima Centauri system with a dust disc ( μ = 0.000031 , M b = 2.50 × 10 7 , T = 0.11 ), as described by the authors in [16,23,24] for the restricted 2 + 2 body problem having μ 1 = 10 10 and μ 2 = 10 12 . Table 4 shows the equilibrium points near L 1 , Table 5 represents the equilibrium points near L 2 , and the equilibrium points near L 3 are depicted in Table 6.

3.2. Noncollinear Equilibrium Points

The noncollinear equilibrium points of R2+2BP can be found by solving Equations (3), (4), (6) and (7) with y 1 0 and y 2 0 . The solution can be obtained by the power series perturbation method. Let x i and y i , i = 1 , 2 be the solutions; then,
x i = x L j + a i 1 ε 3 i + a i 2 ε 3 i 2 + , y i = y L j + a i 1 ε 3 1 + a i 2 ε 3 i 2 + .
Solving the above, we obtain
x i P = μ 1 2 ± α j ( 1 ) i μ 3 i [ ( μ 1 + μ 2 ) 2 ( W x y α j + W y y ) ] 1 3 [ 1 + α j 2 ] 1 2 ,
y i P = ( 1 ) k + 1 3 2 ± μ 3 i ( ( μ 1 + μ 2 ) 2 ( W x y 0 α j + W y y 0 ) 1 3 ( 1 + α j 2 ) 1 2 ,
x i I = μ 1 2 ± α j μ 3 i ( ( μ 1 + μ 2 ) 2 ( W x x 0 + W x y 0 α j ) ) 1 3 ( 1 + 1 α j 2 ) 1 2 ,
y i I = ( 1 ) k + 1 3 2 ± ( 1 ) i + 1 μ 3 i [ ( μ 1 + μ 2 ) 2 ( W x x + W x y α j ) ] 1 3 [ 1 + 1 α j 2 ] 1 2 ,
where, j = 1 , k = 1 at L 4 and j = 2 , k = 2 at L 5
α 1 , 2 = ( 1 ) k + 1 ± ( 1 ) k 1 12 ( μ 0.5 ) 2 3 ( μ 0.5 ) .
Equations (17)–(20) represent the noncollinear equilibrium points in R2+2BP. In this section, we use different notations to represent equilibrium points near L 4 and L 5 . The prefixes x and y are used in L j ± P i to denote the X and Y coordinates of equilibrium points, respectively. The noncollinear equilibrium points can be distinguished as the perpendicular and inline equilibrium solutions in [9]. Again, the prefixes I and P are used for inline and perpendicular equilibrium points, i.e., I x L 4 P 1 is the X-coordinate of the equilibrium point of the first infinitesimal body toward the origin.
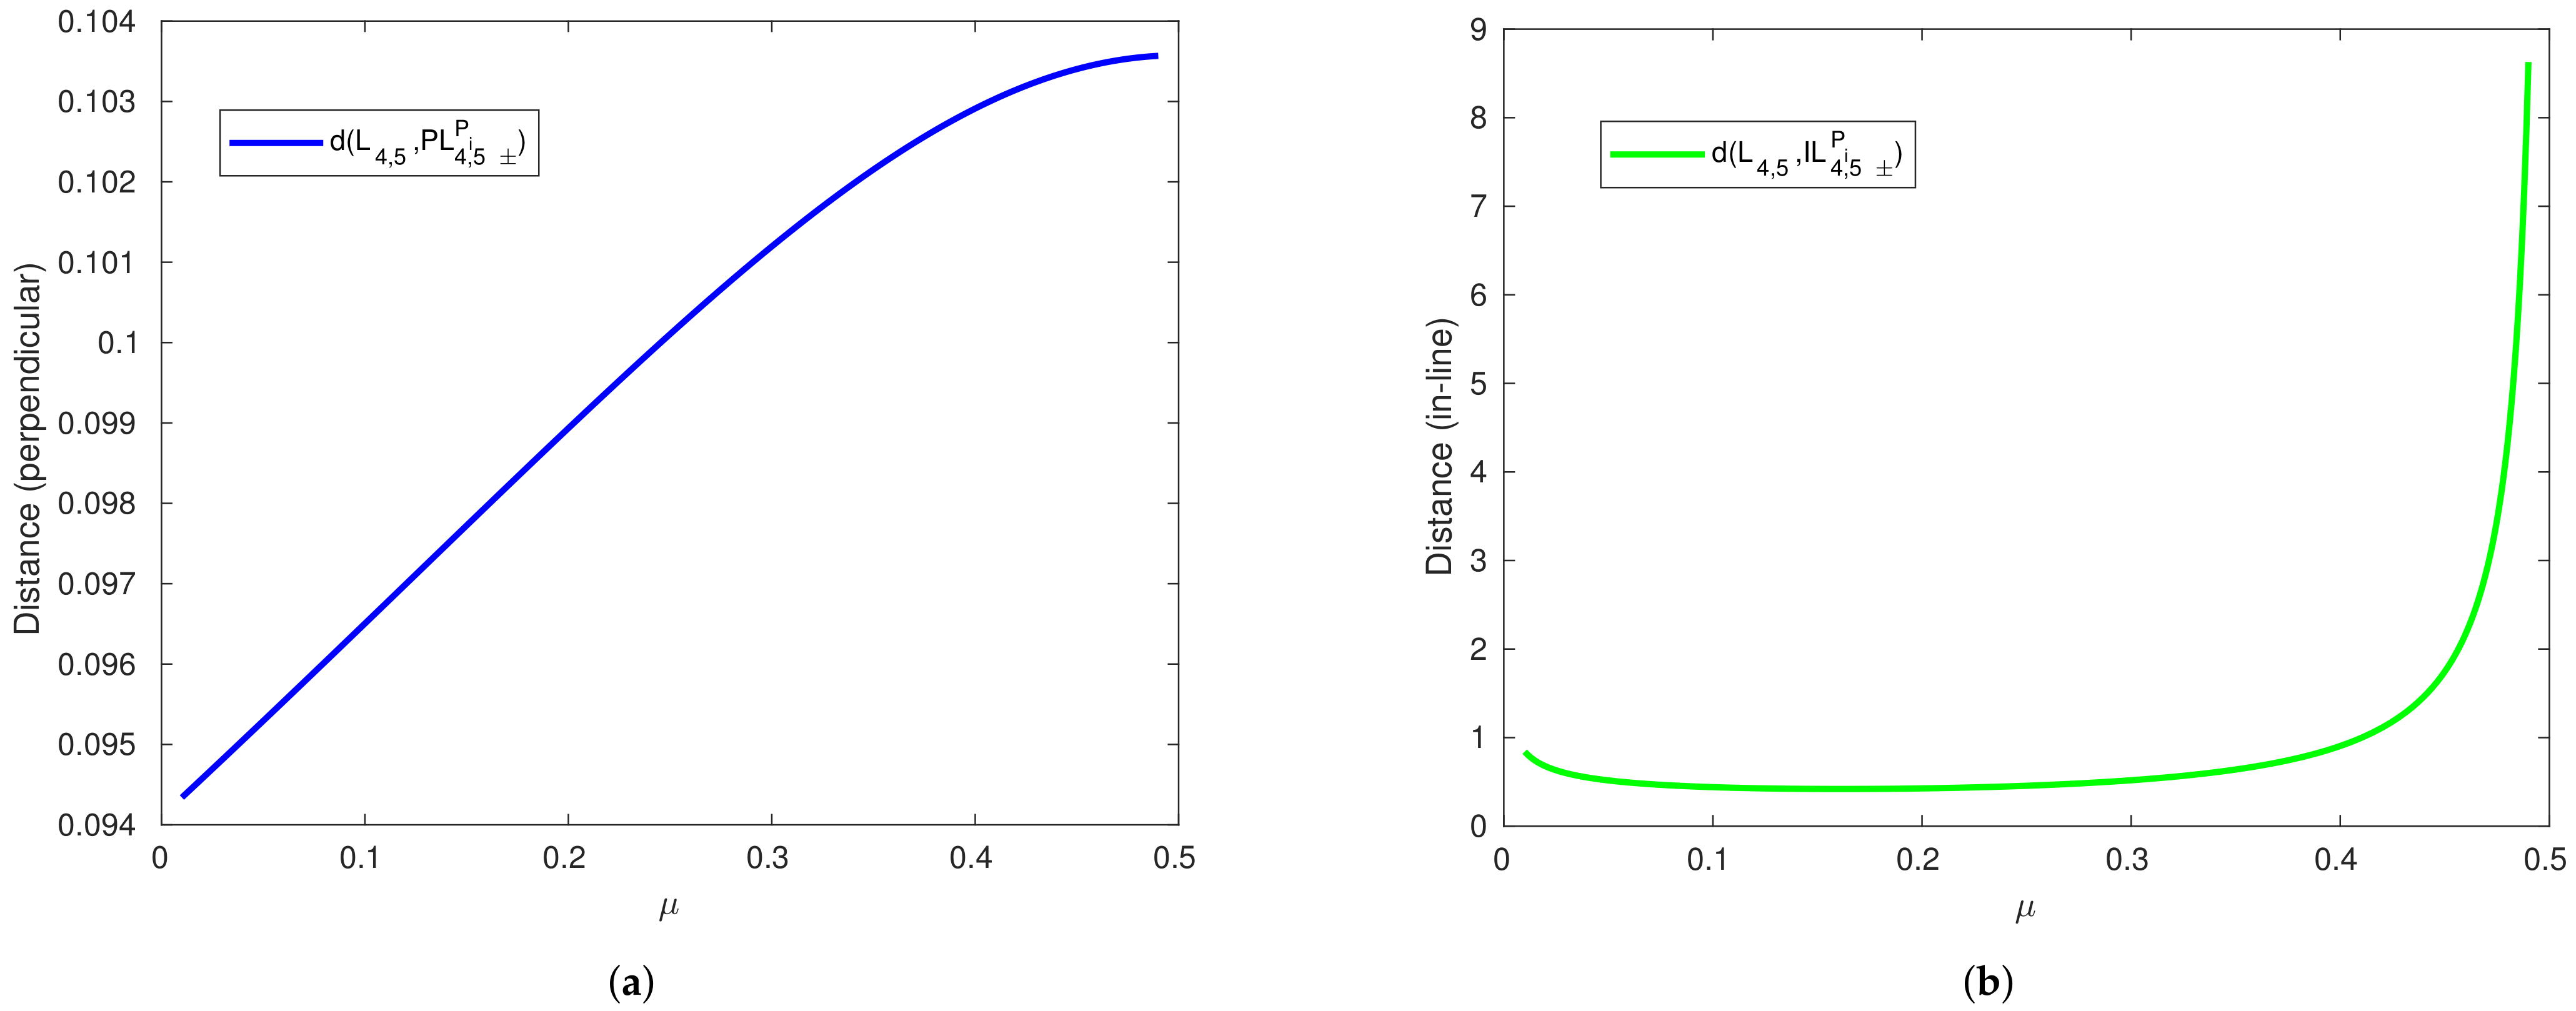
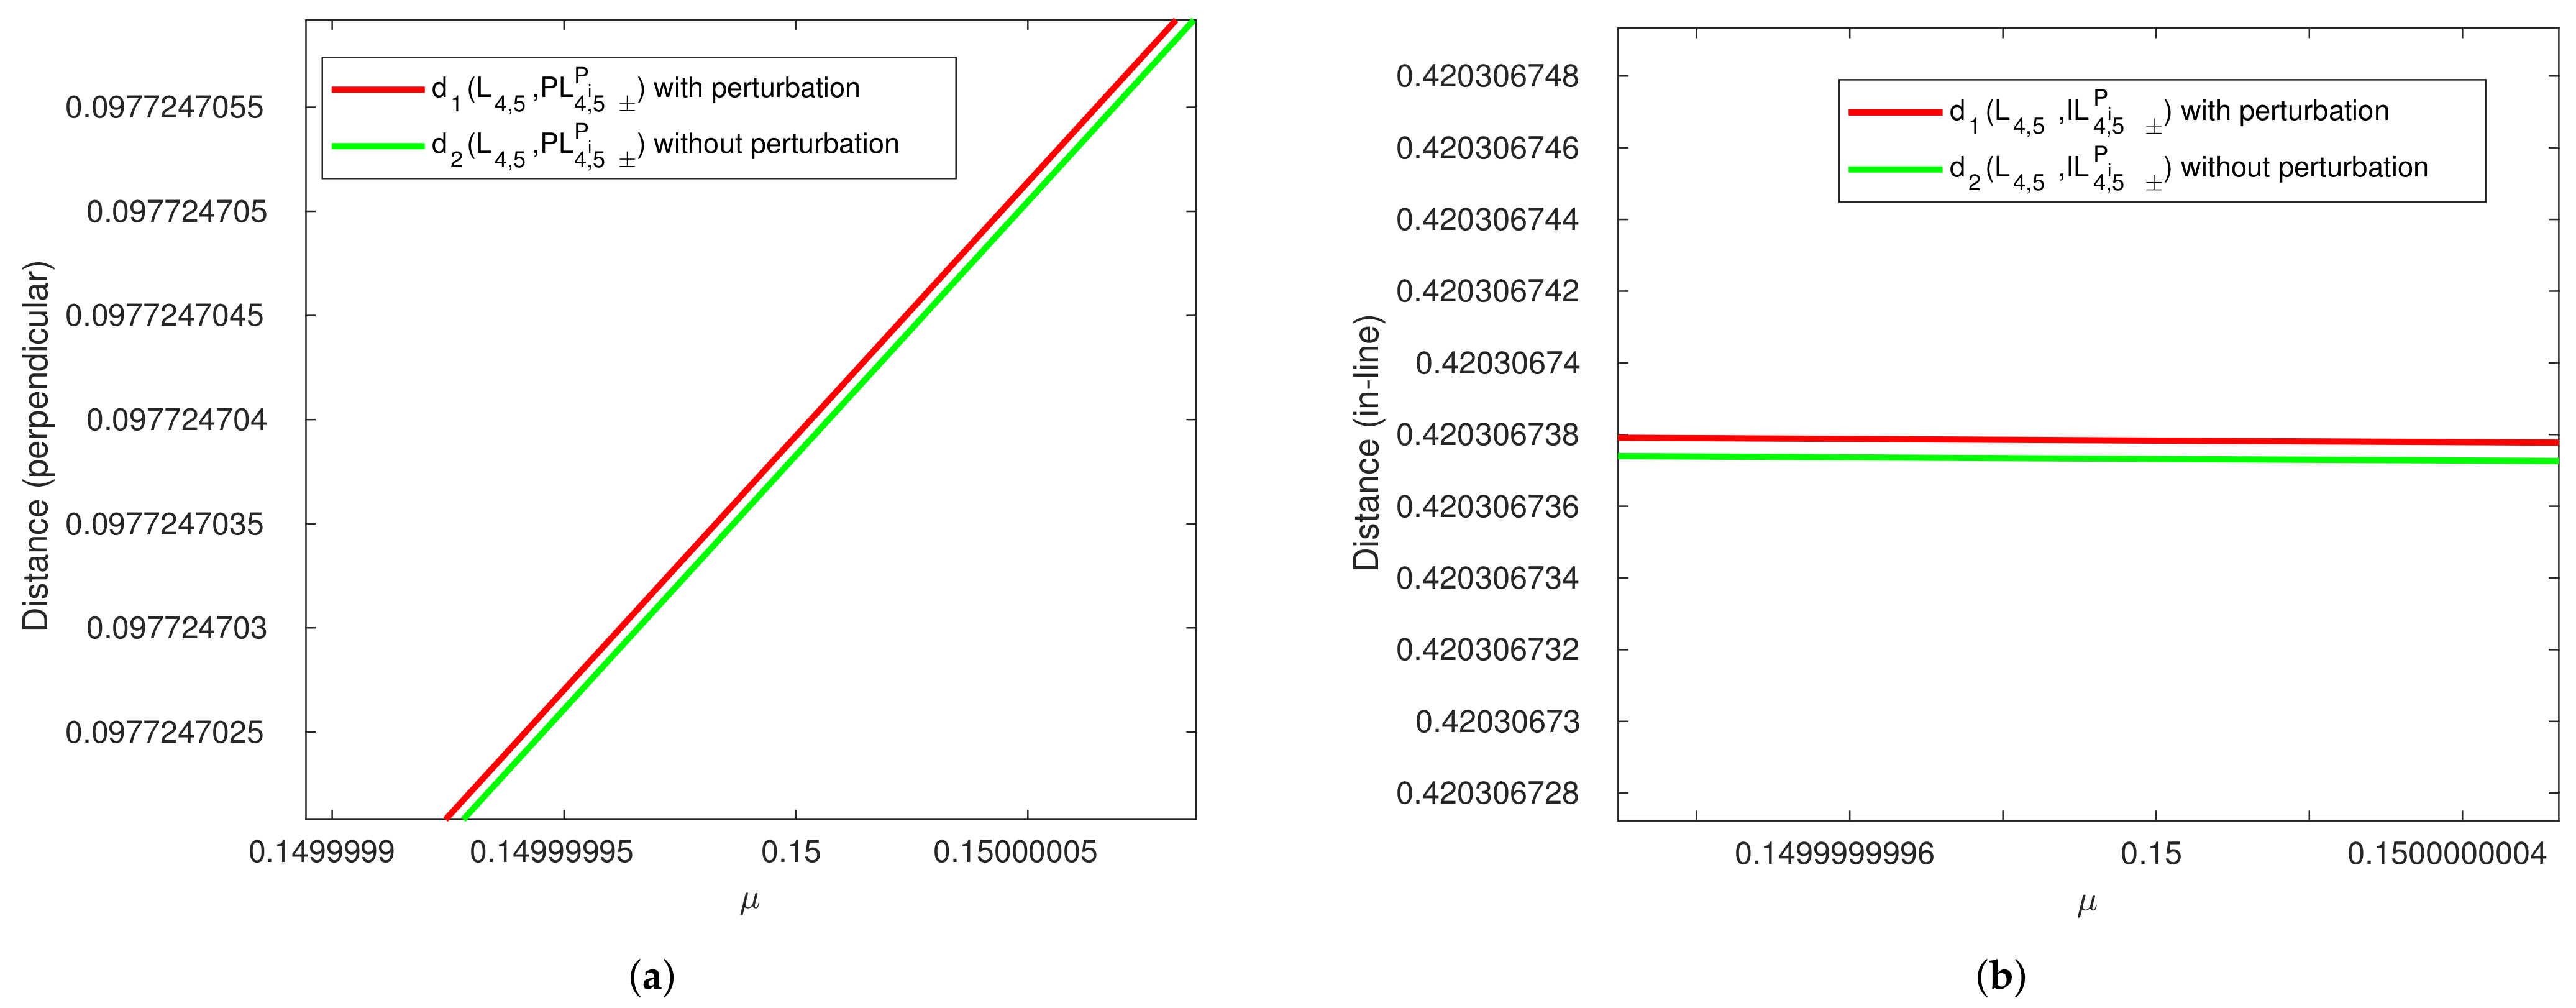
The distance versus μ of the perpendicular and inline equilibrium positions to L 4 , 5 with the planetesimal belt effect M b = 3.7 × 10 7 , T = 0.11 and μ 1 = μ 2 = 10 2 are shown in Figure 5a,b. In the case of the perpendicular equilibrium position d ( L 4 , 5 , P L 4 , 5 ± P i ) increases as μ increases, as shown in Figure 5a. In Figure 5b, in the case of the inline equilibrium position, the distance d ( L 4 , 5 , I L 4 , 5 ± P i ) increases rapidly when μ approaches 1 2 . Figure 6a shows that d 1 ( L 4 , 5 , P L 4 , 5 ± P i ) > d 2 ( L 4 , 5 , P L 4 , 5 ± P i ) , i.e., due to perturbation, the distance increases with respect to the unperturbed distance in the case of perpendicular noncollinear equilibrium points. Here, we use d 1 and d 2 for the perturbed and unperturbed distances, respectively. Furthermore, when the noncollinear equilibrium points are in the perpendicular position, d 1 ( L 4 , 5 , I L 4 , 5 ± P i ) > d 2 ( L 4 , 5 , I L 4 , 5 ± P i ) , as shown in Figure 6b. Hence, we concluded that the distance increases due to the perturbation.
The positions of the noncollinear equilibrium points were calculated numerically and are shown in Table 7, Table 8, Table 9 and Table 10 for μ 1 = 10 10 , μ 2 = 10 12 , M b = 3.7 × 10 7 , and T = 0.11 . Table 7 shows the perpendicular equilibrium points, where the coordinates were taken as ( P x L 4 P i , P y L 4 P i ) and ( P x L 4 + P i , P y L 4 + P i ) , i = 1 , 2 . We observed that the coordinates P x L 4 + P i , P y L 4 + P i , and P x L 4 P i increased, and P y L 4 P i decreased as we increased the value of μ . The inline equilibrium points ( I x L 4 P i , I y L 4 P i ) and ( I x L 4 + P i , I y L 4 + P i ) are shown in Table 8.
Furthermore, we observed that I x L 4 P i , I y L 4 P i , and I x L 4 + P i increased as μ increased, whereas I y L 4 + P i decreased as μ increased. Table 9 represents the perpendicular equilibrium points near L 5 , and ( P x L 5 + P i P y L 5 + P i ) and ( P x L 5 P i , P y L 5 P i ) are coordinates in which P x L 5 P i , P y L 5 P i , and P x L 5 + P i increased and P y L 5 + P i decreased as μ increased. Finally, the coordinates of the inline equilibrium points are shown in Table 10. ( I x L 5 + P i , I y L 5 + P i ) and ( I x L 5 P i , I y L 5 P i ) are the coordinates, and we observed that I x L 5 + P i , I y L 5 + P i ) and ( I x L 5 P i ) increased and I y L 5 P i decreased as the value of μ increased.

4. Stability of Motion near Equilibrium Points

We found four paired equilibrium positions around each of L 4 and L 5 . In this section, we analyze the stability of the infinitesimal body P 1 . Let ( x 0 , y 0 ) be any equilibrium point of particle P 1 , and δ and ζ be small perturbations in the x and y directions, respectively, i.e., x 1 = x 0 + δ and y 1 = y 0 + ζ ,
δ ¨ 2 n ζ ˙ = 1 μ 1 U x 1 ( x 0 + δ , y 0 + ζ ) = 1 μ 1 ( δ U x 1 x 1 0 + ζ U x 1 y 1 0 ) ,
ζ ¨ + 2 n δ ˙ = 1 μ 1 U y 1 ( x 0 + δ , y 0 + ζ ) = 1 μ 1 ( δ U y 1 x 1 0 + ζ U y 1 y 1 0 ) .
The equations can be written in matrix form as X ˙ = A X , i.e.,
δ ˙ ζ ˙ δ ¨ ζ ¨ = 0 0 1 0 0 0 0 1 1 μ 1 U x 1 x 1 0 1 μ 1 U x 1 y 1 0 0 2 n 1 μ 1 U x 1 y 1 0 1 μ 1 U y 1 y 1 0 2 n 0 δ ζ δ ˙ ζ ˙
The characteristic equation of the matrix may be reduced to
λ 1 4 + ( 4 n 2 1 μ 1 U x 1 x 1 0 1 μ 1 U y 1 y 1 0 ) λ 1 2 + 1 μ 1 2 ( U x 1 x 1 0 U y 1 y 1 0 U y 1 x 1 0 2 ) = 0 .
Solving Equation (23), we have,
λ 1 , 2 = ± b b 2 4 c 2 1 2 ,
λ 3 , 4 = ± b + b 2 4 c 2 1 2 ,
where, b = 4 n 1 2 1 μ 1 U x 1 x 1 0 1 μ 1 U y 1 y 1 0 and c = 1 μ 1 2 ( U x 1 x 1 0 U y 1 y 1 0 U y 1 x 1 0 2 ) .
We note that Equations (24) and (25) are the eigenvalues of the characteristic Equation (23). With the help of these eigenvalues, we can find the stability of particle P 1 .

4.1. Stability at Collinear Points

The stability of the collinear equilibrium point of R2+2BP can be approximated by Equation (23), with condition y 1 = y 2 = 0 , i.e.,
U x 1 x 1 0 = μ 1 n + 2 ( 1 μ ) | x 1 μ | 3 + 2 μ | x 1 μ + 1 | 3 + μ 2 | x 1 x 2 | 3 + 3 M b x 1 2 T 2 + x 1 2 5 2 M b T 2 + x 1 2 3 2 ,
U y 1 y 1 0 = μ 1 n ( 1 μ ) | x 1 μ | 3 μ | x 1 μ + 1 | 3 μ 2 | x 1 x 2 | 3 M b T 2 + x 1 2 3 2 ,
and
U x 1 y 1 0 = 0 ,
for i = 1 . Consequently, b 2 4 c > 0 , and hence, the characteristic equation yields at least one positive real root. This results in the instability at the collinear points.
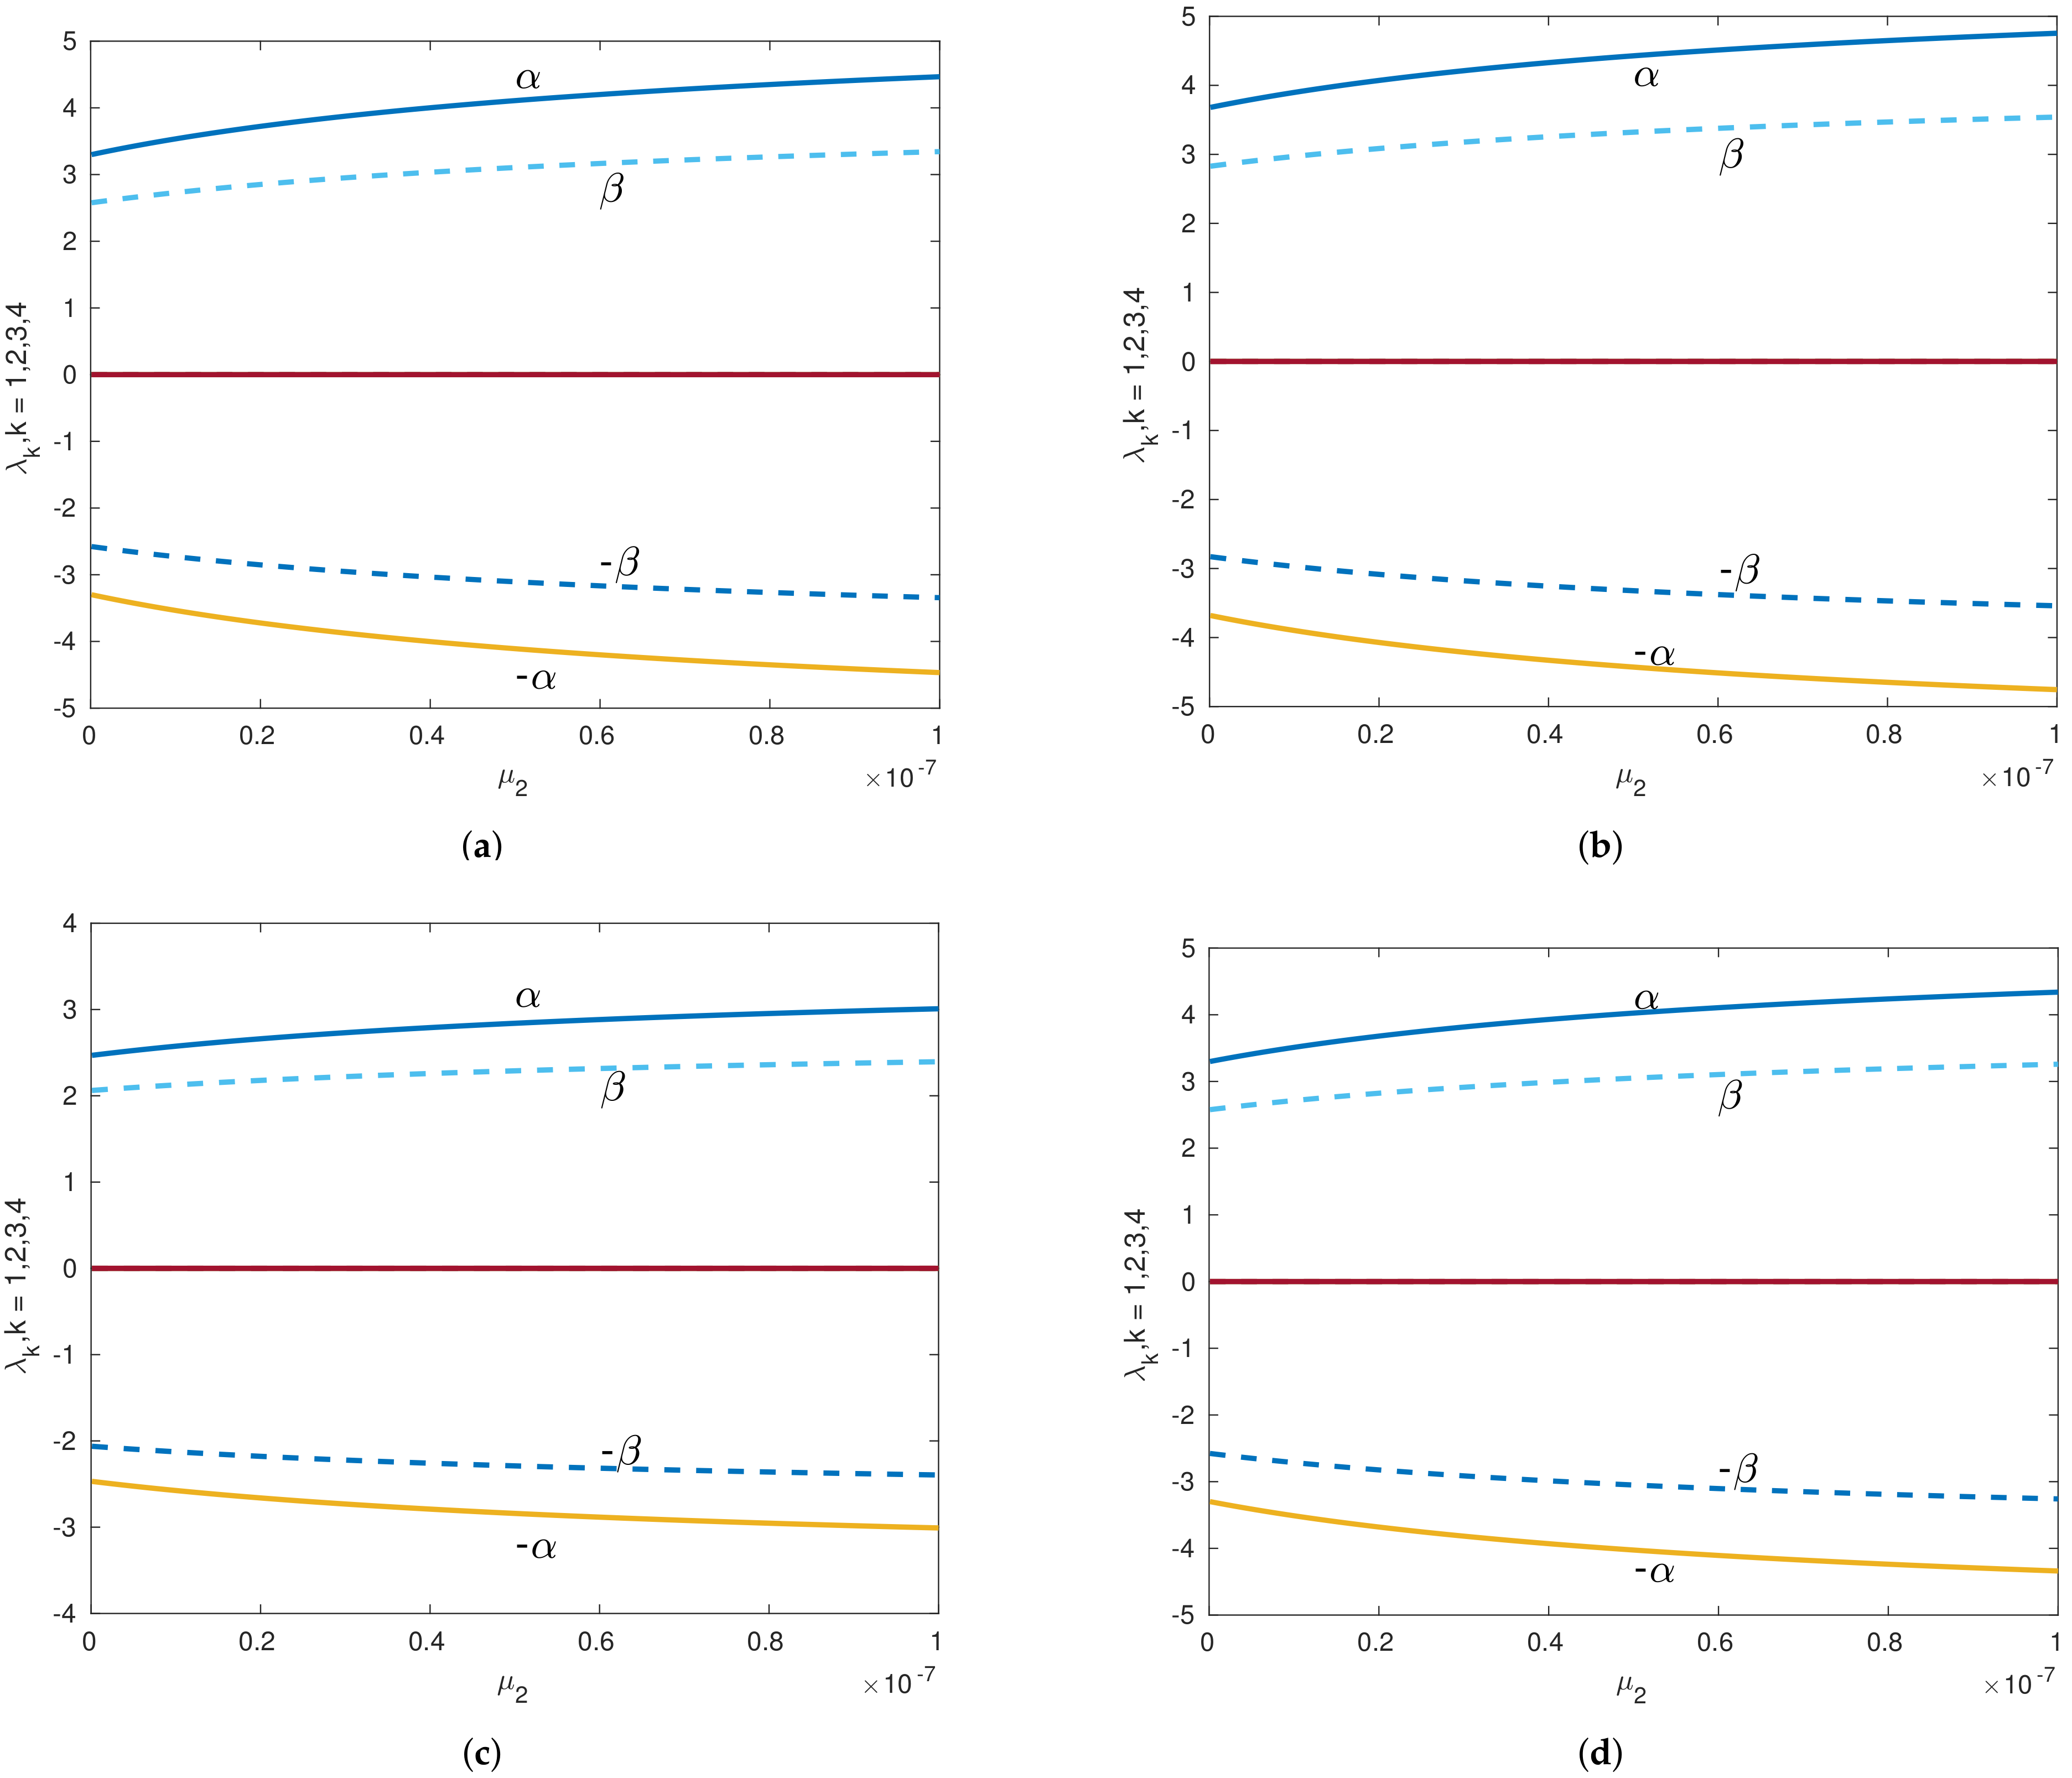
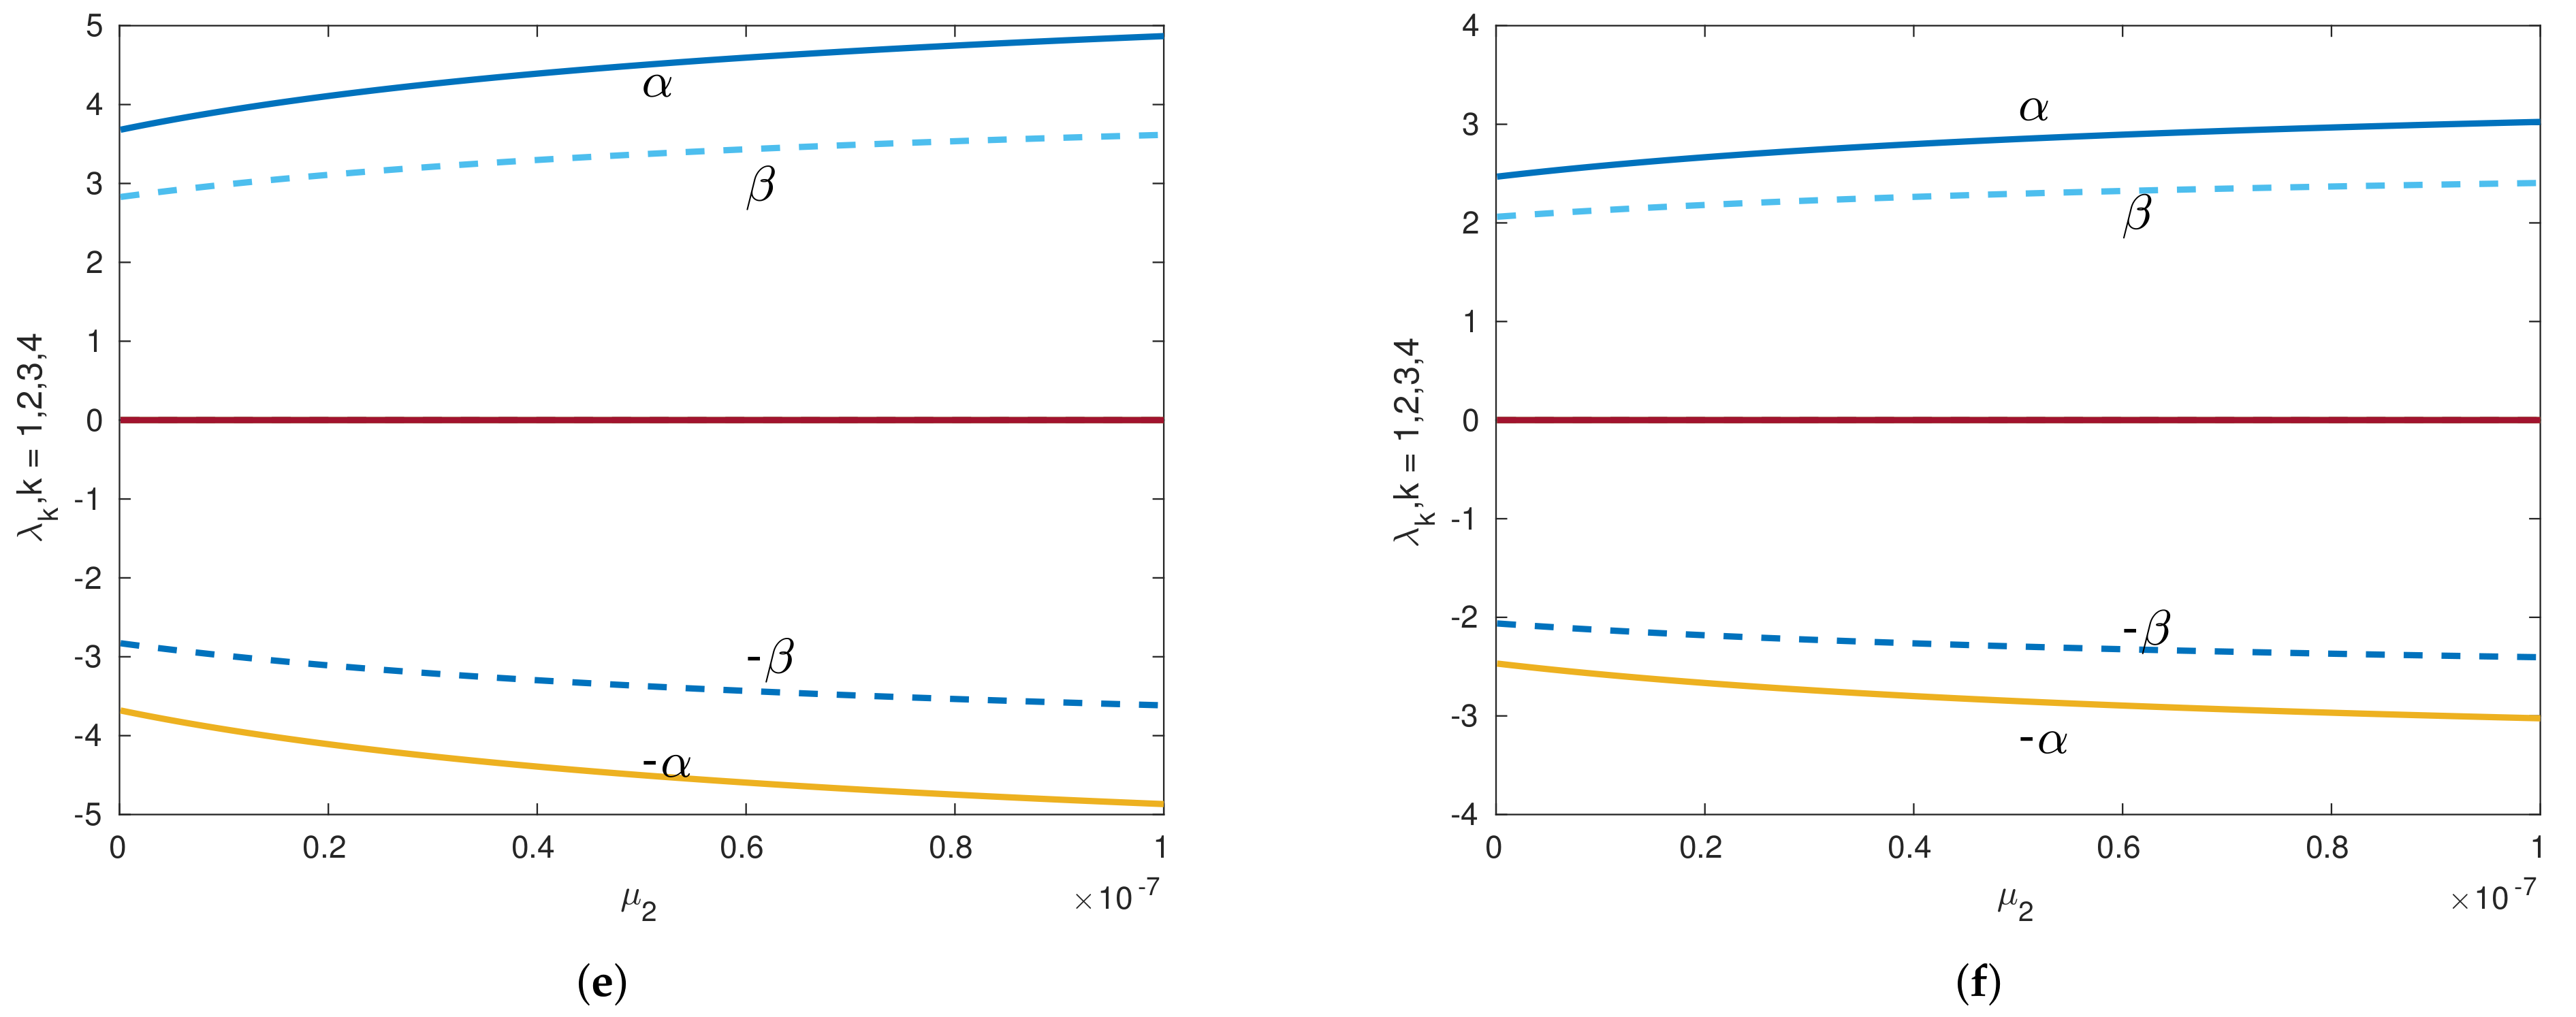
Table 4, Table 5 and Table 6 provide the collinear equilibrium points for the following systems: Sun–Saturn with the Kuiper belt, Sun–Mars with an asteroid belt, and the Proxima Centauri system with a dust disc. With the help of these collinear equilibrium points, we calculated the stability of these systems using Equations (23)–(28). We found that real nonzero eigenvalues occur with opposite signs and purely imaginary eigenvalues with opposite signs. Thus, the collinear equilibrium points have a saddle×center behavior [25], i.e., all collinear equilibrium points are unstable. Again, as shown in Figure 7, we selected the Sun–Saturn system with the Kuiper belt with μ 1 = 10 7 , and plotted the eigenvalues against μ 2 ( 10 10 , 10 7 ) . Continuous lines indicate the nonzero real parts of eigenvalues, denoted as α , and the dashed lines represent the nonzero imaginary parts of eigenvalues, denoted as β . Figure 7a,b presents the stability near L 1 , Figure 7b,e displays the stability near L 2 , and the stability near L 3 is shown in Figure 7c,f. We can observe that all figures have a nonzero positive α , and thus all collinear points are unstable in the considered system.

4.2. Stability at Noncollinear Points

The stability of the triangular restricted problem of 2 + 2 bodies may be approximated by Equation (23), which is calculated for i = 1 with the help of the following equations:
U x 1 x 1 0 = μ 1 ( n + 3 ( 1 μ ) ( x 1 μ ) 2 ( ( x 1 μ ) 2 + y 1 2 ) 5 2 1 μ ( ( x 1 μ ) 2 + y 1 2 ) 3 2 + 3 μ ( x 1 μ + 1 ) 2 ( ( x 1 μ + 1 ) 2 + y 1 2 ) 5 2 μ ( ( x 1 μ + 1 ) 2 + y 1 2 ) 3 2 ) + 3 μ 1 μ 2 ( x 1 x 2 ) 2 ( ( x 1 x 2 ) 2 + ( y 1 y 2 ) 2 ) 5 2 μ 1 μ 2 ( ( x 1 x 2 ) 2 + ( y 1 y 2 ) 2 ) 3 2 + 3 M b x 1 2 T 2 + x 1 2 + y 1 2 5 2 M b T 2 + x 1 2 + y 1 2 3 2 ,
U x 1 y 1 0 = μ 1 3 ( 1 μ ) ( x 1 μ ) y 1 ( ( x 1 μ ) 2 + y 1 2 ) 5 2 + 3 μ ( x 1 μ + 1 ) y 1 ( ( x 1 μ + 1 ) 2 + y 1 2 ) 5 2 + 3 μ 1 μ 2 ( x 1 x 2 ) ( y 1 y 2 ) ( ( x 1 x 2 ) 2 + ( y 1 y 2 ) 2 ) 5 2 3 M b x 1 y 1 T 2 + x 1 2 + y 1 2 5 2 ,
U y 1 y 1 0 = μ 1 ( n + 3 ( 1 μ ) y 1 2 ( ( x 1 μ ) 2 + y 1 2 ) 5 2 1 μ ( ( x 1 μ ) 2 + y 1 2 ) 3 2 + 3 μ y 1 2 ( ( x 1 μ + 1 ) 2 + y 1 2 ) 5 2 μ ( ( x 1 μ + 1 ) 2 + y 1 2 ) 3 2 ) + 3 μ 1 μ 2 ( y 1 y 2 ) 2 ( ( x 1 x 2 ) 2 + ( y 1 y 2 ) 2 ) 5 2 μ 1 μ 2 ( ( x 1 x 2 ) 2 + ( y 1 y 2 ) 2 ) 3 2 + 3 M b y 1 2 T 2 + x 1 2 + y 1 2 5 2 M b T 2 + x 1 2 + y 1 2 3 2 .
The characteristic Equation (23) provides the eigenvalues to study the stability of the noncollinear equilibrium points in the presence of the planetesimal belt effect. The kinds of roots of Equation (23) depend on the parameters μ , μ 1 , μ 2 , M b , and T. The noncollinear equilibrium points are shown in Table 11, Table 12, Table 13 and Table 14 for different planetary systems. We analyzed the stability of th noncollinear equilibrium points using Equations (23)–(28), and we found that the real nonzero eigenvalues occur with opposite signs and purely imaginary eigenvalues occur with opposite signs. Thus, the noncollinear equilibrium points have a saddle×center behavior.
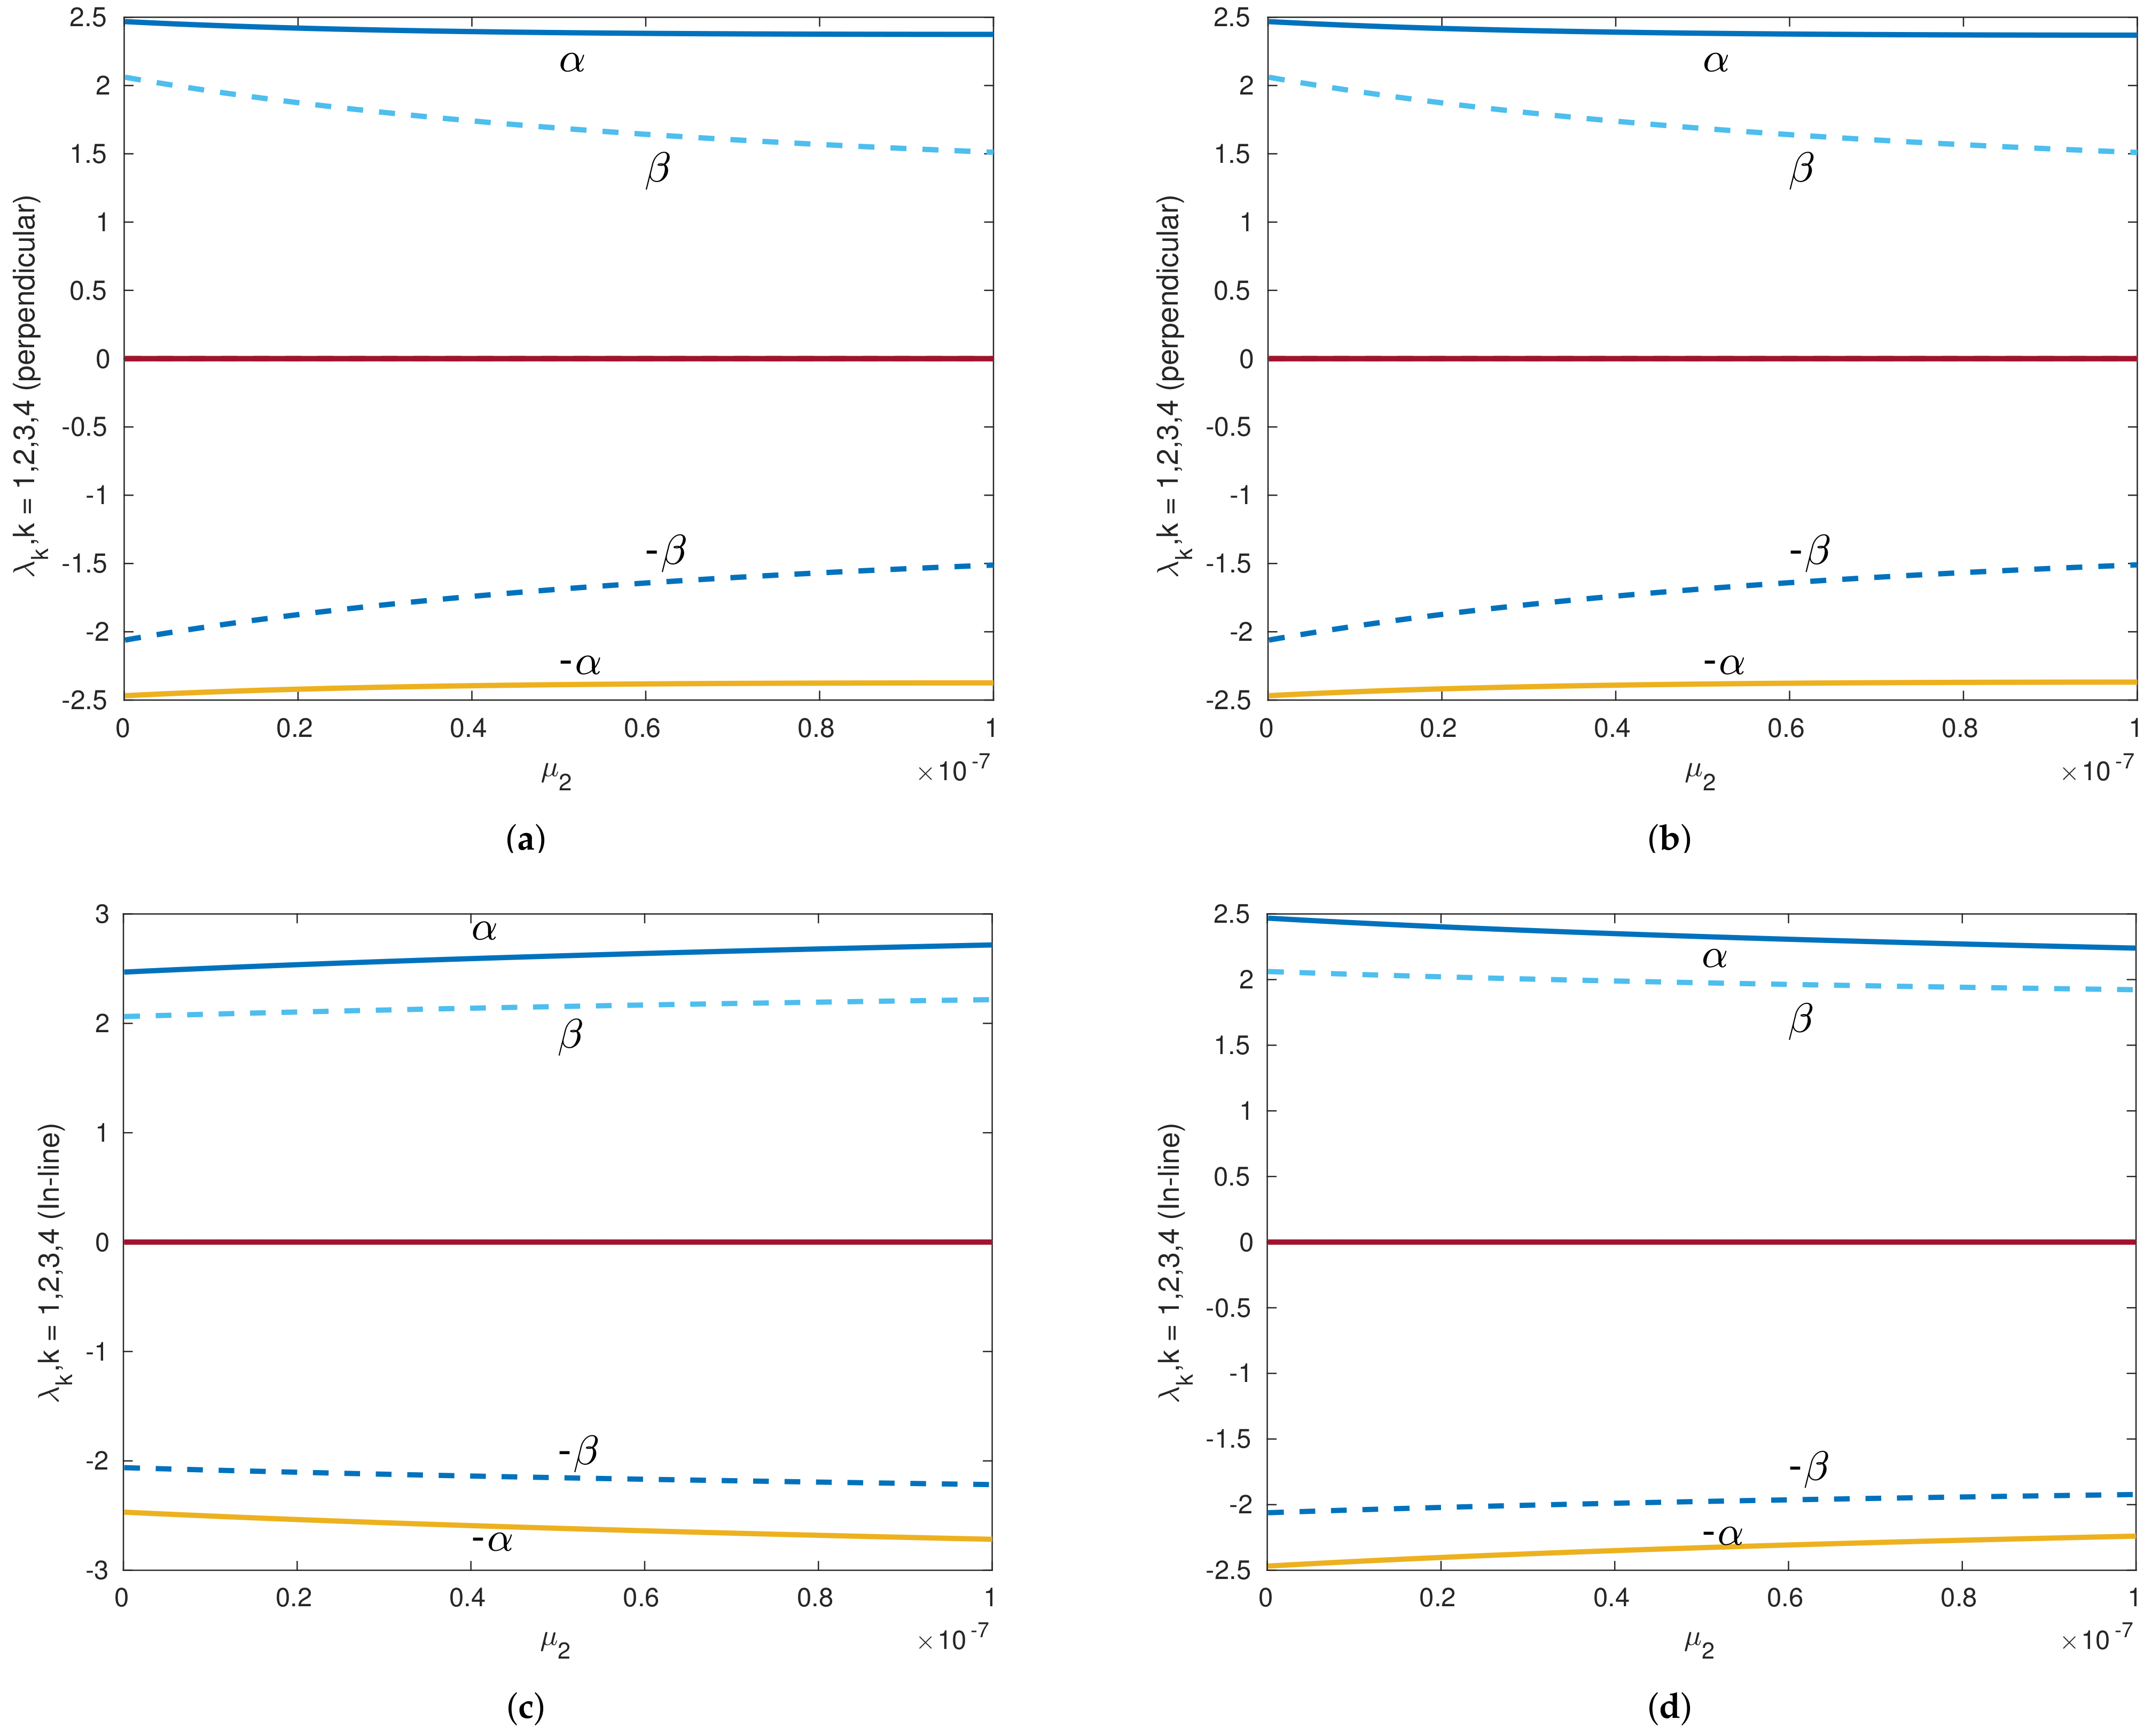
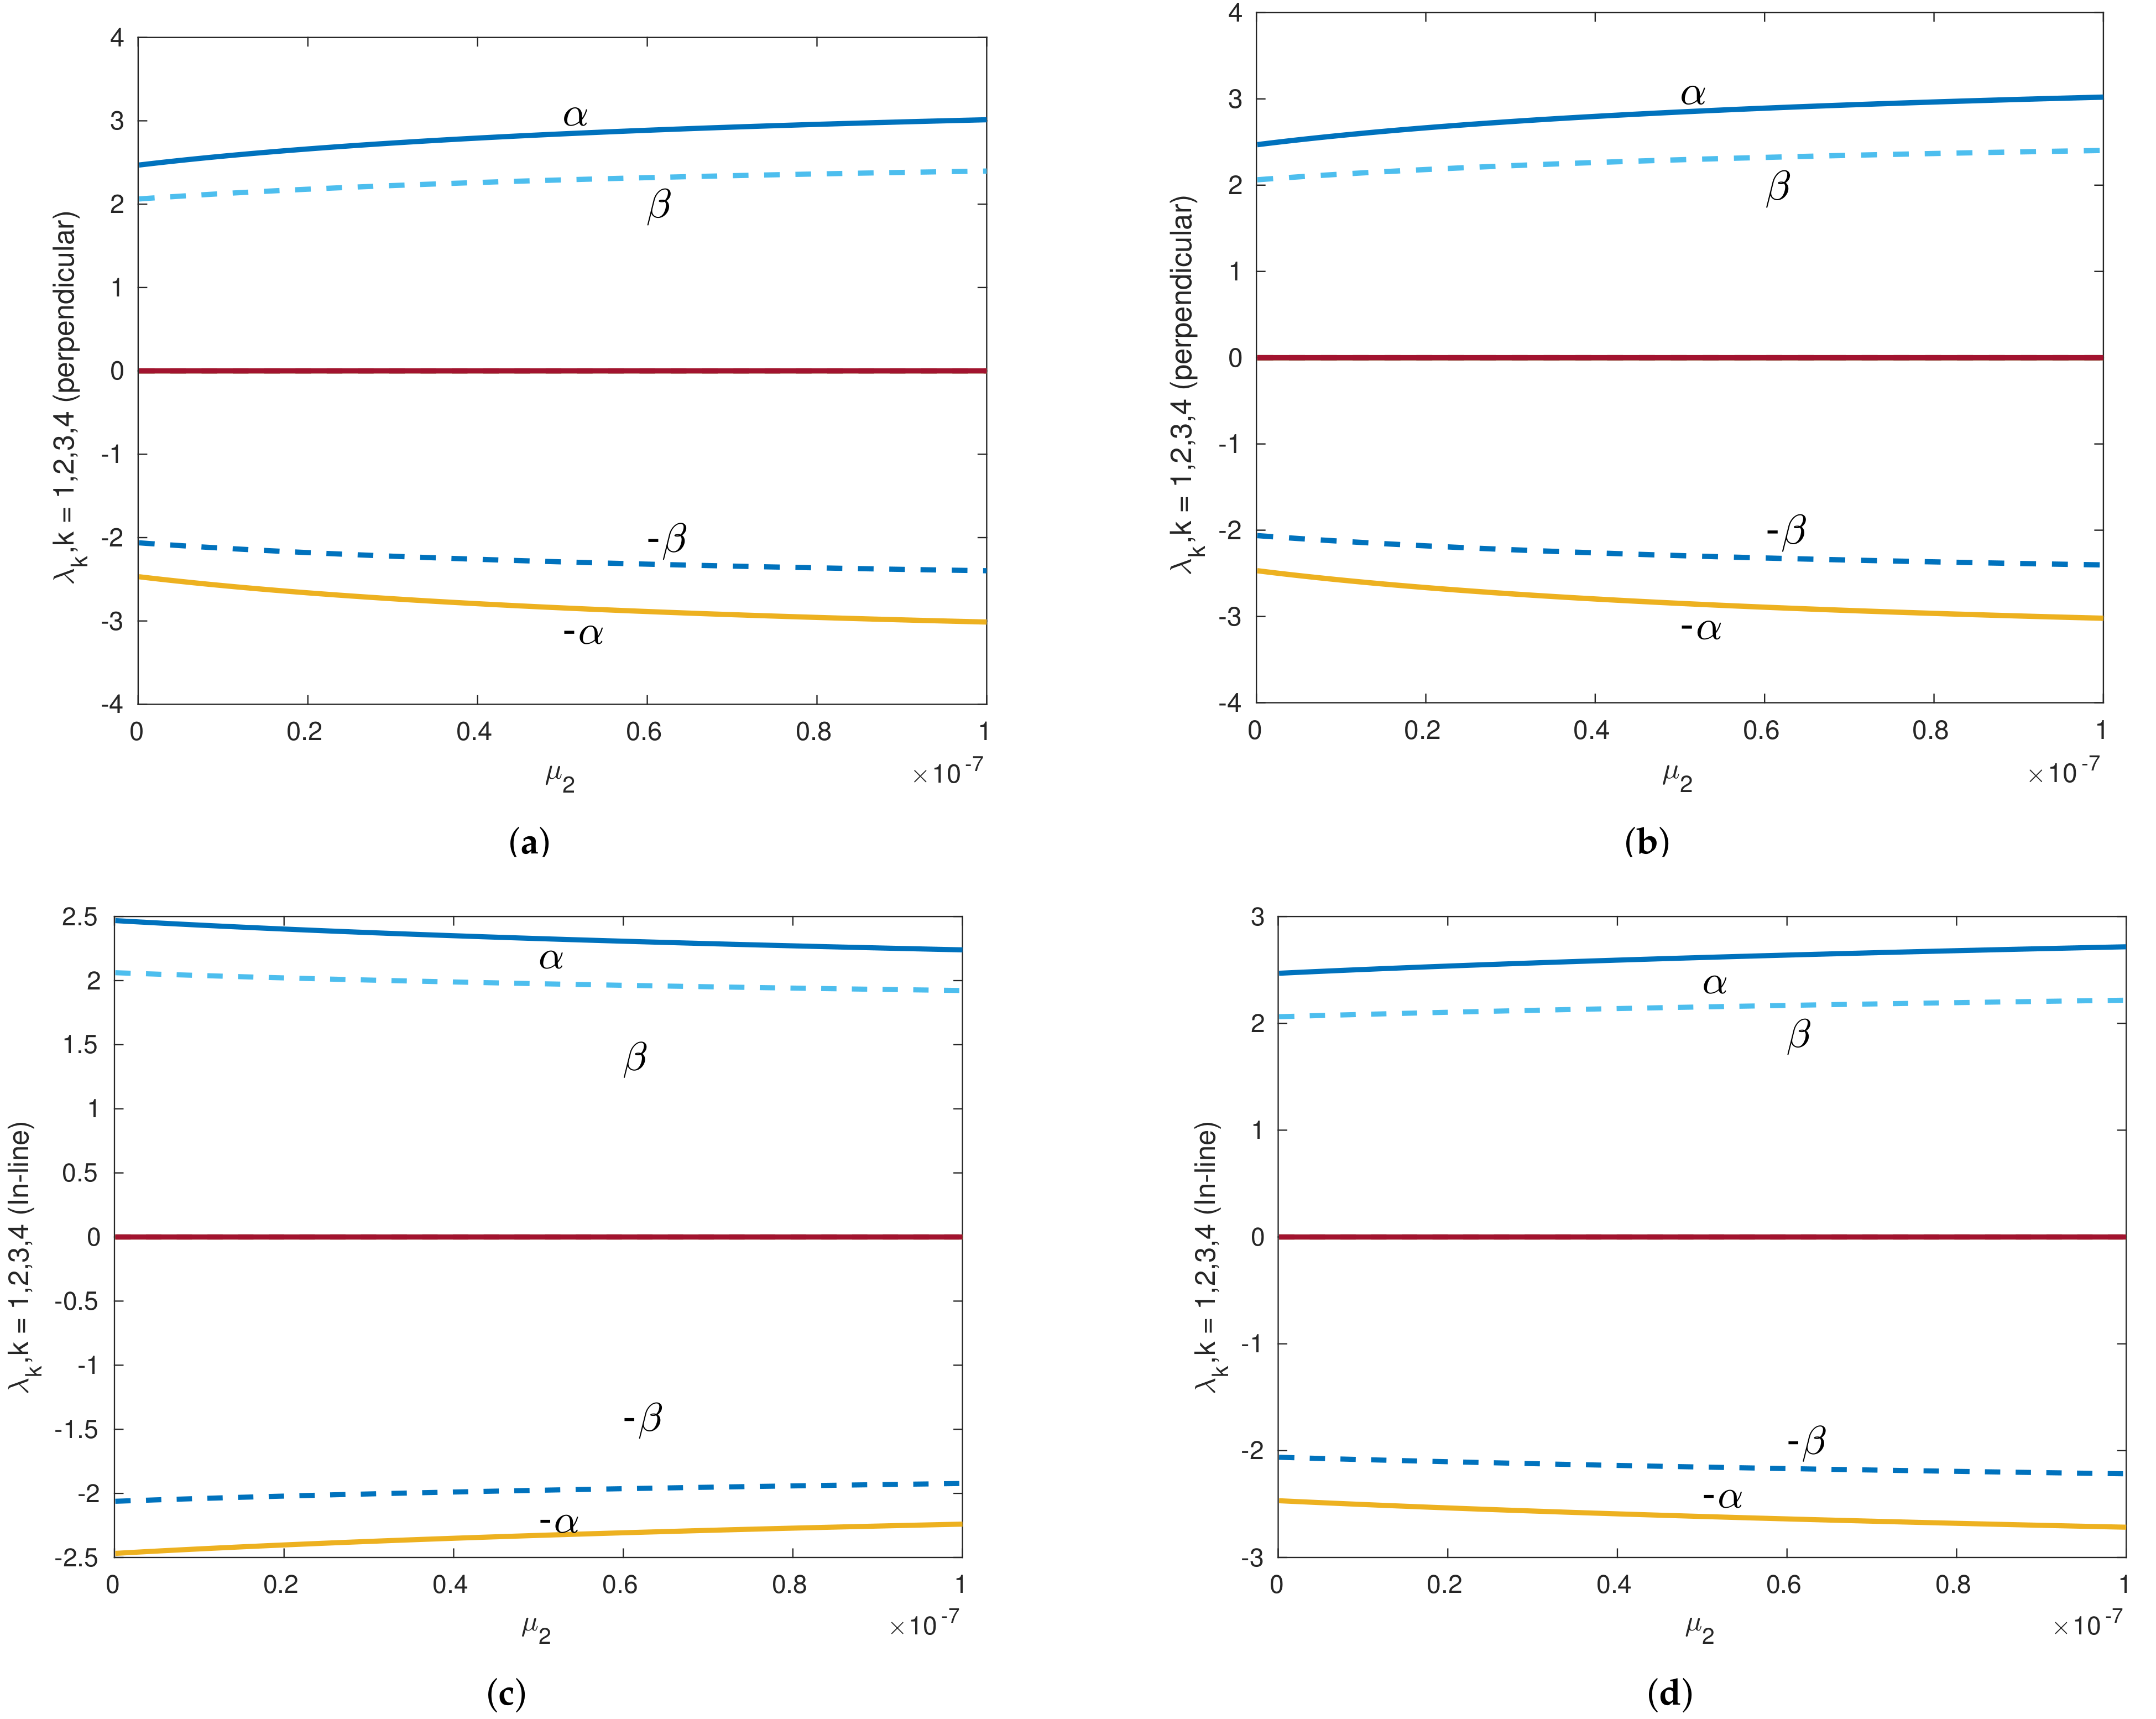
In Figure 8 and Figure 9, for the Sun–Saturn system with the Kuiper belt with μ 1 = 10 7 , we plot the eigenvalues against μ 2 ( 10 10 , 10 7 ) . Figure 8 describes the stability near L 4 . Figure 8a,b presents the eigenvalues of the perpendicular equilibrium points, and Figure 8c,d depicts the eigenvalues of the inline equilibrium points near L 4 . It can be observed in Figure 8a–d that real nonzero positive eigenvalues exist; thus, all noncollinear equilibrium points near L 4 are unstable in the considered system. Similarly, in Figure 9, we plot the eigenvalues of the equilibrium positions near L 5 . Figure 9a,b shows the eigenvalues of the perpendicular equilibrium points, whereas Figure 9c,d depicts the eigenvalues of the inline equilibrium points. Clearly, it can be observed that at least one nonzero positive real part α of the eigenvalue exists. Thus, all equilibrium positions are unstable for the considered system.

5. Conclusions

In this study, we considered the effect of the planetesimal belt on the restricted problem of 2 + 2 bodies in a rotating coordinate system. In the absence of the planetesimal belt effect, i.e., M b = 0 , the proposed system coincides with the system obtained by Whipple [5]. Again, if we consider P 1 and P 2 as the single minor body, the system will convert into the CRTBP. The problem possesses 14 paired equilibrium positions around the five equilibrium points of the CRTBP. The main highlights of work can be summarized as:
  • Dynamic analysis of the perturbed restricted problem of 2 + 2 bodies;
  • Existence and stability analysis of both collinear and noncollinear equilibrium points;
  • Description of the effect of the planetesimal belt on the motion in the proximity of equilibrium points.
The effect of the planetesimal belt on the equilibrium points and the variation in their distance from L j , j = 1 , 2 , 3 , 4 , 5 were studied for some fixed parameter M b = 3.7 × 10 7 and T = 0.11 , which we compared with the unperturbed R2+2BP. For mass parameter μ 1 = μ 2 = 10 2 , the distance of collinear equilibrium points d ( L 1 , L 1 ± P i ) , i = 1 , 2 increases, and d ( L 2 , L 2 ± P i ) and d ( L 3 , L 3 ± P i ) decrease with the variation in μ . The distance d ( L 4 , I L 4 ± P i ) at the inline equilibrium points increases monotonically, but the distance d ( L 4 , P L 4 ± P i ) at the perpendicular equilibrium decreases initially for some μ . After that, it increases when μ approaches one-half. The distance of equilibrium points in the presence of the planetesimal belt effect differs from the unperturbed distance. At the collinear point, the perturbed distance d 1 is greater than the unperturbed distance d 2 at L 1 and L 3 . Near L 2 , d 1 < d 2 for μ < 0.153 , and d 1 < d 2 for μ > 0.153 . In the case of an inline and perpendicular equilibrium point, d 1 > d 2 with the variation of μ . Table 1, Table 2 and Table 3 show that the collinear equilibrium points L 1 ± P i decrease and L 2 ± P i , L 3 ± P i increases with the variation in μ ( 0 , 0.5 ) .
From the stability analysis, we found six paired collinear equilibrium points and eight paired noncollinear equilibrium points. The stability of all collinear equilibrium points was found to be unstable. The generalization of the stability of noncollinear equilibrium points is difficult as five different types of parameters μ , μ 1 , μ 2 , M b , and T are present in the perturbed R2+2BP. The stability of noncollinear equilibrium points can be analyzed numerically. The different considered planetary systems with suitable μ 1 and μ 2 were found to be unstable.
In the framework of the perturbed restricted problem of 2 + 2 bodies by a planetesimal belt, our obtained results can be outlined as:
  • The existence of equilibrium points was examined for both collinear and noncollinear points;
  • The stability of motion around these points was studied;
  • We compared the corresponding results of the perturbed and unperturbed models;
  • The impact of a planetesimal belt was observed on collinear and noncollinear equilibrium points;
  • All equilibrium points were found to be unstable, whereas the noncollinear equilibrium points were investigated numerically.
Furthermore, the restricted 2 + 2 bodies problem can be used as a credible model to describe the capture of small bodies by a planet. If the small bodies are temporarily captured in the Hill sphere of a smaller primary, they may become near enough to each other to exchange energy so that one of them becomes regularly and permanently captured.

Author Contributions

Formal analysis, G.M., A.K.P., S.A., E.I.A. and B.S.K.; Investigation, G.M., A.K.P. and B.S.K.; Methodology, G.M., A.K.P. and E.I.A.; Project administration, S.A. and E.I.A.; Software, G.M., A.K.P. and E.I.A.; Validation, G.M., A.K.P., S.A. and E.I.A.; Visualization, E.I.A.; Writing—original draft, G.M., A.K.P. and E.I.A.; Writing—review & editing, G.M., A.K.P., E.I.A. and S.A. All authors have read and agreed to the published version of the manuscript.

Funding

This research received no external funding.

Institutional Review Board Statement

Not applicable.

Informed Consent Statement

Not applicable.

Data Availability Statement

The data analyzed in this study were generated by MATLAB R2018b software. The mass parameter μ of the different planetary system, the mass of the planetesimal belt M b , and the parameter T were taken from various sources [16,23,24] and are available at the following: URL: https://nssdc.gsfc.nasa.gov/planetary/factsheet/index.html, https://ssd.jpl.nasa.gov/?phys_data (accessed on 26 December 2021).

Acknowledgments

We thank the DST(SERB) Government of India (project no. -DST(SERB)/(163)/ 2016-2017/506/AM) for the use of the computation facility. The first author thanks the Council of Scientific and Industrial Research (CSIR), Government of India (file no. 09/085(0126)/2019-EMR-1) for financial support. The second author thanks Manipal University Jaipur for the financial supported from the Enhanced Seed Grant through the Endowment Fund reference no. EF/2021-22/QE04-07. This work was funded by the National Research Institute of Astronomy and Geophysics (NRIAG), Helwan, Cairo, Egypt. The fourth author, therefore, thanks NRIAG for technical and financial support.

Conflicts of Interest

The authors declare that there are no conflict of interest regarding the publication of this article.

Ethics Statement

The authors state that this research complies with all ethical standards.

References

  1. Pathak, N.; Abouelmagd, E.I.; Thomas, V. On higher order resonant periodic orbits in the photo–gravitational planar restricted three–body problem with oblateness. J. Astronaut. Sci. 2019, 66, 475–505. [Google Scholar] [CrossRef]
  2. Pathak, N.; Thomas, V.; Abouelmagd, E.I. The perturbed photogravitational restricted three-body problem: Analysis of resonant periodic orbits. Discret. Contin. Dyn. Syst.-S 2019, 12, 849. [Google Scholar] [CrossRef] [Green Version]
  3. Selim, H.H.; Guirao, J.L.; Abouelmagd, E.I. Libration points in the restricted three-body problem: Euler angles, existence and stability. Discret. Contin. Dyn.-Syst.-S 2019, 12, 703. [Google Scholar] [CrossRef] [Green Version]
  4. Abouelmagd, E.I.; Guirao, J.L.G.; Llibre, J. Periodic orbits for the perturbed planar circular restricted 3–body problem. Discret. Contin. Dyn. Syst.-B 2019, 24, 1007. [Google Scholar] [CrossRef] [Green Version]
  5. Whipple, A.L. Equilibrium solutions of the restricted problem of 2 + 2 bodies. Celest. Mech. 1984, 33, 271–294. [Google Scholar] [CrossRef]
  6. Jung, C.; Zotos, E.E. Order and chaos in a three dimensional galaxy model. Mech. Res. Commun. 2015, 69, 45–53. [Google Scholar] [CrossRef] [Green Version]
  7. Kumar, D.; Kaur, B.; Chauhan, S.; Kumar, V. Robe’s restricted three-body problem when one of the primaries is a finite straight segment. Int. J. Non-Linear Mech. 2019, 109, 182–188. [Google Scholar] [CrossRef]
  8. Kalvouridis, T.; Mavraganis, A. Equilibria and stability of the restricted photogravitational problem of 2 + 2 bodies. Astrophys. Space Sci. 1995, 226, 137–148. [Google Scholar] [CrossRef]
  9. Kalvouridis, T. Parametric dependence of the stationary solutions in the restricted 2 + 2 body problem. Astrophys. Space Sci. 1998, 259, 77–90. [Google Scholar] [CrossRef]
  10. Spurgin, G.C. Periodic orbits in the four body problem with large and small masses. J. Differ. Equ. 2010, 249, 1131–1144. [Google Scholar] [CrossRef] [Green Version]
  11. Milani, A.; Nobili, A.M. Instability of the 2 + 2 body problem. Celest. Mech. 1987, 41, 153–160. [Google Scholar] [CrossRef]
  12. El-Shaboury, S. Equilibrium solutions of the restricted problem of 2 + 2 axisymmetric rigid bodies. Celest. Mech. Dyn. Astron. 1990, 50, 199–208. [Google Scholar] [CrossRef]
  13. Qi, Y.; de Ruiter, A. Orbital analysis of small bodies in co-orbital motion with Jupiter through the torus structure. Mon. Not. R. Astron. Soc. 2021, 502, 2183–2197. [Google Scholar] [CrossRef]
  14. Atash, A.A.; Selim, F.; Al-Khaled, K.; Hassan, I.; Abouelmagd, E.I. Periodic orbit in the frame work of restricted three bodies under the asteroids belt effect. Appl. Math. Nonlinear Sci. 2020, 5, 157–176. [Google Scholar]
  15. Singh, J.; Taura, J.J. Motion in the generalized restricted three-body problem. Astrophys. Space Sci. 2013, 343, 95–106. [Google Scholar] [CrossRef]
  16. Yousuf, S.; Kishor, R. Effects of the albedo and disc on the zero velocity curves and linear stability of equilibrium points in the generalized restricted three-body problem. Mon. Not. R. Astron. Soc. 2019, 488, 1894–1907. [Google Scholar] [CrossRef]
  17. Ishwar, B.; Kushvah, B. Linear Stability of Triangular Equilibrium Points in the Generalized Photogravitational Restricted Three Body Problem with Poynting_Robertson Drag. J. Dyn. Syst. Geom. Theor. 2006, 4, 79–86. [Google Scholar] [CrossRef] [Green Version]
  18. Abouelmagd, E.I.; Awad, M.; Elzayat, E.; Abbas, I.A. Reduction the secular solution to periodic solution in the generalized restricted three-body problem. Astrophys. Space Sci. 2014, 350, 495–505. [Google Scholar] [CrossRef] [Green Version]
  19. Miyamoto, M.; Nagai, R. Three-dimensional models for the distribution of mass in galaxies. Publ. Astron. Soc. Jpn. 1975, 27, 533–543. [Google Scholar]
  20. Kushvah, B.S. Linear stability of equilibrium points in the generalized photogravitational Chermnykh’s problem. Astrophys. Space Sci. 2008, 318, 41–50. [Google Scholar] [CrossRef]
  21. Kumar, D.; Aggarwal, R.; Kaur, B. An insight on the restricted problem of 2 + 2 bodies with straight segment. Astron. Nachrichten 2020, 341, 669–683. [Google Scholar] [CrossRef]
  22. Michalakis, D.; Mavraganis, A. The equilibrium configurations of the restricted problem of 2 + 2 triaxial rigid bodies. Celest. Mech. Dyn. Astron. 1995, 63, 81–100. [Google Scholar] [CrossRef]
  23. Anglada, G.; Amado, P.J.; Ortiz, J.L.; Gómez, J.F.; Macías, E.; Alberdi, A.; Osorio, M.; Gómez, J.L.; de Gregorio-Monsalvo, I.; Pérez-Torres, M.A.; et al. ALMA discovery of dust belts around Proxima Centauri. Astrophys. J. Lett. 2017, 850, L6. [Google Scholar] [CrossRef] [Green Version]
  24. Bixel, A.; Apai, D. Probabilistic Constraints on the Mass and Composition of Proxima b. Astrophys. J. Lett. 2017, 836, L31. [Google Scholar] [CrossRef] [Green Version]
  25. James, J.M. Celestial Mechanics Notes Set 4: The Circular Restricted Three Body Problem; Florida Atlantic University, Department of Mathematical Sciences: Boca Raton, FL, USA, 2006. [Google Scholar]
Figure 1. Restricted 2 + 2 body problem model.
Applsci 12 00424 g001
Figure 2. The position of equilibrium points when μ = 0.1 , μ 1 = 0.01 , μ 2 = 0.001 , M a = 3 × 10 7 , and parameter T = 0.11 . The positions of the primaries are M 1 and M 2 , represented by an asterisk and blue dot, respectively. L 1 , L 2 , L 3 , L 4 , and L 5 with black dots are the Lagrangian points of CRTBP. The equilibrium points of R2+2BP with the planetesimal belt effect are shown in green and red dots for P 1 and P 2 , respectively.
Applsci 12 00424 g002
Figure 3. Distance versus mass ratio μ plot in the presence of the planetesimal belt effect for collinear equilibrium points.
Applsci 12 00424 g003
Figure 4. Comparison of distance versus μ between perturbed (red line) and unperturbed (green line) collinear equilibrium points in R2+2BP. (a) For L 1 equilibrium point. (b) For L 2 equilibrium point. (c) For L 2 equilibrium point. (d) For L 3 equilibrium point.
Applsci 12 00424 g004
Figure 5. Distance versus μ in the presence of the planetesimal belt effect for noncollinear equilibrium points. (a) Perpendicular equilibrium points. (b) Inline equilibrium points.
Applsci 12 00424 g005
Figure 6. Comparison of distance versus μ between perturbed (red line) and unperturbed (green line) noncollinear equilibrium points in R2+2BP. (a) Perpendicular equilibrium points. (b) Inline equilibrium points.
Applsci 12 00424 g006
Figure 7. Eigenvalues versus μ 2 ( 10 10 , 10 7 ) of the Sun–Saturn system in the presence of the Kuiper belt effect for collinear equilibrium points with μ 1 = 10 7 . Continuous lines indicate the real parts of the eigenvalues, and dashed lines denote the imaginary parts of the eigenvalues for collinear points. (a) Eigenvalues versus μ 2 of equilibrium point left to L 1 . (b) Eigenvalues versus μ 2 of equilibrium point right to L 1 . (c) Eigenvalues versus μ 2 of equilibrium point left to L 2 . (d) Eigenvalues versus μ 2 of equilibrium point right to L 2 . (e) Eigenvalues versus μ 2 of equilibrium point left to L 3 . (f) Eigenvalues versus μ 2 of equilibrium point right to L 3 .
Applsci 12 00424 g007aApplsci 12 00424 g007b
Figure 8. Eigenvalues versus μ 2 ( 10 10 , 10 7 ) of th Sun–Saturn system in the presence of the Kuiper belt effect near L 4 equilibrium point with μ 1 = 10 7 . Continuous lines denote the real part of the eigenvalues, and dashed lines denote the imaginary parts of the eigenvalues for collinear points. (a) Eigenvalues of perpendicular equilibrium point near L 4 toward smaller primary. (b) Eigenvalues of perpendicular equilibrium point near L 4 away from smaller primary. (c) Eigenvalues of inline equilibrium point near L 4 away from center. (d) Eigenvalues of inline equilibrium point near L 4 toward center.
Applsci 12 00424 g008
Figure 9. Eigenvalues versus μ 2 ( 10 10 , 10 7 ) of the Sun–Saturn system in the presence of the Kuiper belt effect near L 5 equilibrium point with μ 1 = 10 7 . Continuous lines denote the real part of the eigenvalues, and dashed lines denote the imaginary parts of the eigenvalues for collinear points. (a) Eigenvalues of perpendicular equilibrium point near L 5 toward smaller primary. (b) Eigenvalues of perpendicular equilibrium point near L 5 away from smaller primary. (c) Eigenvalues of inline equilibrium point near L 5 away from center. (d) Eigenvalues of inline equilibrium point near L 5 toward center.
Applsci 12 00424 g009
Table 1. Equilibrium solution of R2+2BP near L 1 .
μ L 1 + P 1 L 1 P 1 L 1 + P 2 L 1 P 2
0.0001−1.03220039257577−1.03264998998316−1.03242743926651−1.03242294329243
0.0010−1.06968776321577−1.07014443189694−1.06991838089976−1.06991381421295
0.0100−1.14652917405563−1.14700090922027−1.14676740031377−1.14676268296213
0.1000−1.25944627441467−1.25995339005807−1.25970236781459−1.25969729665815
Table 2. Equilibrium solution of R2+2BP near L 2 .
μ L 2 + P 1 L 2 P 1 L 2 + P 2 L 2 P 2
0.0001−0.96784674731841−0.96828366422587−0.96806302118760−0.96806739035667
0.0010−0.93107229302701−0.93150165725965−0.93128482832217−0.93128912196449
0.0100−0.84787219955956−0.84828522573752−0.84807664751765−0.84808077777943
0.1000−0.60884456030787−0.60922565908104−0.60903320420059−0.60903701518832
Table 3. Equilibrium solution of R2+2BP near L 3 .
μ L 3 + P 1 L 3 P 1 L 3 + P 2 L 3 P 2
0.00011.000361362041780.999721970505521.000044863231331.00003846931597
0.00101.000736306034261.000097026402241.000419862616411.00041346982009
0.01001.004485691502041.003847531683581.004169802391901.00416342079372
0.10001.041922349262761.041295466870741.041612042478711.04160577365479
Table 4. Equilibrium solution near L 1 of different planetary systems.
μ L 1 + P 1 L 1 P 1 L 1 + P 2 L 1 P 2
0.0002860−1.04608393024869−1.04613298051897−1.04608402825123−1.04603497798094
0.0000310−1.02190711476239−1.02195566697454−1.02190721176980−1.02185865955764
0.0000003−1.00464841079892−1.00469660080715−1.00464850708266−1.00460031707443
Table 5. Equilibrium solution near L 2 of different planetary systems.
μ L 2 + P 1 L 2 P 1 L 2 + P 2 L 2 P 2
0.0002860−0.95473464120842−0.95478173944278−0.95473473531078−0.95468763707642
0.0000310−0.97834688228738−0.97839450372324−0.97834697743511−0.97829935599925
0.0000003−0.99536525492820−0.99541324652773−0.99536535081551−0.99531735921598
Table 6. Equilibrium solution near L 3 of different planetary systems.
μ L 3 + P 1 L 3 P 1 L 3 + P 2 L 3 P 2
0.00028601.000119137654671.000049782293651.000118999082521.00018835444353
0.00003101.000012904105450.999943545303041.000012765526421.00008212432883
0.00000031.000000193766140.999930834538481.000000055186271.00006941441393
Table 7. Perpendicular equilibrium solution of the restricted 2 + 2 body problem near L 4 .
μ PxL 4 P 1 PyL 4 P 1 PxL 4 + P 1 PyL 4 + P 1
PxL 4 P 2 PyL 4 P 2 PxL 4 + P 2 PyL 4 + P 2
0.0001−0.499901598429610.86602249507265−0.499898401570390.86602803274910
−0.500059842961380.86574838008869−0.499740157038620.86630214773306
0.0010−0.499001597708150.86602249376500−0.498998402291850.86602803393550
−0.499159770815390.86574825532526−0.498840229184610.86630227237524
0.0100−0.490001590298660.86602248059246−0.489998409701340.86602804590512
−0.490159029865600.86574699761614−0.489840970134400.86630352888144
0.1000−0.400001493099510.86602233889207−0.399998506900490.86602817663806
−0.400149309950650.86573337046563−0.399850690049350.86631714506449
Table 8. In-ine equilibrium solution of the restricted 2 + 2 body problem near L 4 .
μ IxL 4 P 1 IyL 4 P 1 IxL 4 + P 1 IyL 4 + P 1
IxL 4 P 2 IyL 4 P 2 IxL 4 + P 2 IyL 4 + P 2
0.0001−0.499786290676860.86595962036838−0.500013709323140.86609090745337
−0.488529067686130.85946090966168−0.511270932313870.87258961816007
0.0010−0.498947148790150.86599478074186−0.499052851209850.86605574695864
−0.493714879015050.86297695301132−0.504285120984950.86907357468918
0.0100−0.489975166758200.86601107095682−0.490024833241800.86603945554077
−0.487516675820440.86460603405128−0.492483324179560.86744449244630
0.1000−0.399986674321690.86601844124247−0.400013325678310.86603207428765
−0.398667432169230.86534360550600−0.401332567830770.86670691002412
Table 9. Perpendicular equilibrium solution of the restricted 2 + 2 body problem near L 5 .
μ PxL 5 + P 1 PyL 5 + P 1 PxL 5 P 1 PyL 5 P 1
PxL 5 + P 2 PyL 5 + P 2 PxL 5 P 2 PyL 5 P 2
0.0001−0.49989840157039−0.86602803274910−0.49990159842961−0.86602249507265
−0.49974015703862−0.86630214773306−0.50005984296138−0.86574838008869
0.0010−0.49899840229185−0.86602803393550−0.49900159770815−0.86602249376500
−0.49884022918461−0.86630227237524−0.49915977081539−0.86574825532526
0.0100−0.48999840970134−0.86602804590512−0.49000159029866−0.86602248059246
−0.48984097013440−0.86630352888144−0.49015902986560−0.86574699761614
0.1000−0.39999850690049−0.86602817663806−0.40000149309951−0.86602233889207
−0.39985069004935−0.86631714506449−0.40014930995065−0.86573337046563
Table 10. The inline equilibrium solution of the restricted 2 + 2 body problem near L 5 .
μ IxL 5 + P 1 IyL 5 + P 1 IxL 5 P 1 IyL 5 P 1
IxL 5 + P 2 IyL 5 + P 2 IxL 5 P 2 IyL 5 P 2
0.0001−0.50001370932314−0.86609090745337−0.49978629067686−0.86595962036838
−0.51127093231387−0.87258961816007−0.48852906768613−0.85946090966168
0.0010−0.49905285120985−0.86605574695864−0.49894714879015−0.86599478074186
−0.50428512098495−0.86907357468918−0.49371487901505−0.86297695301132
0.0100−0.49002483324180−0.86603945554077−0.48997516675820−0.86601107095682
−0.49248332417956−0.86744449244630−0.48751667582044−0.86460603405128
0.1000−0.40001332567831−0.86603207428765−0.39998667432169−0.86601844124247
−0.40133256783077−0.86670691002412−0.39866743216923−0.86534360550600
Table 11. Perpendicular equilibrium solution near L 4 of different planetary systems.
μ PxL 4 P 1 PyL 4 P 1 PxL 4 + P 1 PyL 4 + P 1
PxL 4 P 2 PyL 4 P 2 PxL 4 + P 2 PyL 4 + P 2
0.000286−0.499714034640010.86602523034786−0.499713965359990.86602535037870
−0.499748640006490.86596527494152−0.499679359993510.86608530578504
0.000031−0.499969034644430.86602524927065−0.499968965355570.86602536928619
−0.500003644428550.86596530150765−0.499934355571450.86608531704919
0.000000−0.499999734644970.86602534317275−0.499999665355030.86602546318647
−0.500034344965690.86596539632081−0.499965055034310.86608541003841
Table 12. Inline equilibrium solution near L 4 of different planetary systems.
μ IxL 4 P 1 IyL 4 P 1 IxL 4 + P 1 IyL 4 + P 1
IxL 4 P 2 IyL 4 P 2 IxL 4 + P 2 IyL 4 + P 2
0.000286−0.499712263149100.86602428787884−0.499715736850900.86602629284772
−0.497977149100110.86502280592385−0.501450850899890.86702777480271
0.000031−0.499965359716080.86602320762467−0.499972640283920.86602741093216
−0.496328716081030.86392365553369−0.503609283918970.86812696302315
0.000000−0.499982616041950.86601553975479−0.500016783958050.86603526660443
−0.482915741950660.85616197836003−0.517083658049340.87588882799919
Table 13. Perpendicular equilibrium solution near L 5 of different planetary systems.
μ PxL 5 + P 1 PyL 5 + P 1 PxL 5 P 5 PyL 5 P 1
PxL 5 + P 2 PyL 5 + P 2 PxL 5 P 5 PyL 5 P 2
0.000286−0.49971396535999−0.86602535037870−0.49971403464001−0.86602523034786
−0.49967935999351−0.86608530578504−0.49974864000649−0.86596527494152
0.000031−0.49996896535557−0.86602536928619−0.49996903464443−0.86602524927065
−0.49993435557145−0.86608531704919−0.50000364442855−0.86596530150765
0.000000−0.49999966535503−0.86602546318647−0.49999973464497−0.86602534317275
−0.49996505503431−0.86608541003841−0.50003434496569−0.86596539632081
Table 14. Inline equilibrium solution near L 5 of different planetary systems.
μ IxL 5 + P 1 IyL 5 + P 1 IxL 5 P 1 IyL 5 P 1
IxL 5 + P 2 IyL 5 + P 2 IxL 5 P 2 IyL 5 P 2
0.000286−0.49971396535999−0.86602535037870−0.49971403464001−0.86602523034786
−0.49967935999351−0.86608530578504−0.49974864000649−0.86596527494152
0.000031−0.49996896535557−0.86602536928619−0.49996903464443−0.86602524927065
−0.49993435557145−0.86608531704919−0.50000364442855−0.86596530150765
0.000000−0.49999966535503−0.86602546318647−0.49999973464497−0.86602534317275
−0.49996505503431−0.86608541003841−0.50003434496569−0.86596539632081
Publisher’s Note: MDPI stays neutral with regard to jurisdictional claims in published maps and institutional affiliations.