Article

Investigation of Deep Shaft-Surrounding Rock Support Technology Based on a Post-Peak Strain-Softening Model of Rock Mass

School of Civil Engineering, Liaoning Technical University, Fuxin 123000, China
*
Author to whom correspondence should be addressed.
Appl. Sci. 2022, 12(1), 253; https://doi.org/10.3390/app12010253
Submission received: 24 October 2021 / Revised: 19 December 2021 / Accepted: 23 December 2021 / Published: 28 December 2021
(This article belongs to the Special Issue Deep Rock Mass Engineering: Excavation, Monitoring, and Control)

Abstract

:
To control the large deformation that occurs in deep shaft-surrounding rock, the post-peak strain-softening characteristics of deep jointed rock mass are discussed in detail. An equivalent post-peak strain-softening model of jointed rock mass is established based on continuum theory and the geological strength index surrounding rock grading system, and numerical simulations are performed using FLAC3D software. The convergence-constraint method is used to analyze the rock support structure interaction mechanism. A composiste support technique is proposed in combination with actual field breakage conditions. During the initial support stage, high-strength anchors are used to release the rock stress, and high-stiffness secondary support is provided by well rings and poured concrete. This support technology is applied in the accessory well of a coal mine in Niaoshan, Heilongjiang, China. The stability of the surrounding rock support structure is calculated and analyzed by comparing the ideal elastic-plastic model and equivalent jointed rock mass strain-softening model. The results show that a support structure designed based on the ideal elastic-plastic model cannot meet the stability requirements of the surrounding rock and that radial deformation of the surrounding rock reaches 300 mm. The support structure designed based on the equivalent joint strain-softening model has a convergence rate of surrounding rock deformation of less than 1 mm/d after 35 days of application. The surrounding rock deformation is finally controlled at 140 mm, indicating successful application of the support technology.

1. Introduction

The scale of modern industrial production is rapidly expanding and the demand for mineral resources continues to increase. However, the availability of shallow resources is becoming increasingly scarce. The contradiction between the development demand and shallow resource shortage has gradually driven mining engineering to exploit increasingly deep and ultra-deep mining environments, which has led to new challenges because deep rock mass has considerably more complex mechanical properties than shallow rock mass. The so-called problem of “three highs and one disturbance” (i.e., high ground stress, high temperature, high karst hydraulic pressure, and intense mining disturbance) is prominent in such rock mass. These complex environmental conditions lead to a series of large nonlinear deformation phenomena that do not occur in shallow engineering rock mass and pose increased engineering difficulty to effectively support the surrounding rock. Conventional support techniques applied in shallow engineering are not fully applicable to deep engineering [1,2,3]. Deep shaft-surrounding rock support technology is related to the safety and economic benefits of deep shaft projects, and restricts the development of deep shaft mineral resource projects. A comprehensive study of deep surrounding rock support technology is, therefore, critical for establishing suitable techniques for mining deep rock mass.
Extensive studies have addressed the stability control technology of deep shaft-surrounding rock and fruitful results have been achieved. On the basis of analyzing a large amount of well bore survey data, Wang et al. [4] believed that there are four main reasons for well bore rupture and instability: negative friction, geological tectonic movement, mechanical erosion at the bottom of the overburden, and the interlayer slip caused by mining. These authors pointed out that the key to the design of a well bore support structure is to enhance the ability of the well wall to resist horizontal shear and reduce interlayer sliding. Zhang et al. [5] proposed that additional vertical stress is the main reason for failure and instability of a shaft wall. The shaft has high rigidity and is difficult to compress, but the soil layer easily loses water and then compresses and sinks—shear stress is caused by inconsistent vertical deformation between the two. Acting on the well bore to form additional stress, these researchers proposed the surrounding rock stability control technology of grouting around the well bore and decompression of the well bore. Liu et al. [6,7] stated that the destructive effect of temperature stress on the shaft wall cannot be ignored. Based on the theory of elastic mechanics, they deduced an analytical solution for the temperature stress on the shaft wall of a coal mine. The research results show that, among the factors that lead to damage of a shaft wall, the influence of temperature stress is greater than that of the mass of the shaft wall.
Many scholars have conducted research on shaft stability control technologies under various special geological conditions. Regarding stability control of shafts passing through alternate hard rock and soft rock formations, Sun et al. [8] used the 3DEC numerical simulation method to analyze the interaction between the surrounding rock and the shaft wall structure in the intersecting area of soft and hard layers. The research results showed that the deep rock mass and shaft wall structure mainly undergo shear failure. On this basis, a joint control technology employing grouting and pressure relief excavation was proposed. For a shaft in a water-bearing fault fracture zone, Cao et al. [9] found that the strength of the surrounding rock decreases after softening with water, which is the root cause of shaft instability and failure. Aiming at a control technology to achieve stability of rock surrounding a shaft in soft and broken areas, Kang et al. [10,11] proposed measures such as grouting, to strengthen the rock mass, and optimizing the shaft excavation method, to maintain stability of the rock mass. In recent years, many scholars have continued to optimize shaft-surrounding rock support technology using steel structures incorporated into the shaft support system. Gao et al. [12,13] developed a new support form of steel structure concrete. Their research showed that compared with a single concrete structure, such steel structure concrete has higher compressive strength and better support for vertical shafts. Yu et al. [14,15], based on engineering reality combined with indoor tests and field survey methods, proposed a U-shaped steel arch and cast concrete shaft support technology. Yu et al. [16,17,18] adopted a numerical calculation method to analyze the large deformation mechanism of a soft rock roadway in vertical and inclined shafts and correspondingly proposed the use of bolt–shotcrete support technology, which has been successfully applied in practical engineering.
Previous studies have proposed useful solutions to technical problems involving the deformation control of deep shaft-surrounding rock. However, most did not consider the strain-softening mechanical behavior of deep shaft-surrounding rock, and no specific post-peak rock mass strain-softening mechanical model has been established to reveal the post-peak rock mass mechanical response. The post-peak strain-softening characteristics of rock mass are the basis for more accurate analysis of shaft stability and the design of safe and reliable supporting structures. Therefore, it is of great significance to study the post-peak strain-softening characteristics of rock mass.
This paper analyzes the supporting structure interaction mechanism in terms of the stability of deep shaft-surrounding rock and softening characteristics of deep rock mass. A combination of related theories is used to establish an equivalent joint strain-softening model and to characterize the post-peak strain-softening characteristics of rock mass. The relevant surrounding rock support technology is adapted to the post-peak strain-softening characteristics of deep rock mass, and composite support technology is proposed for the deep well surrounding rock, which involves high-strength anchor cables, well circles, and shotcrete. The developed support technology is applied to the Heilongjiang Niaoshan coal mine project. The results show that the surrounding rock deformation is controlled within a safe range, confirming the field application results. The concepts and support technology results presented here provide a useful reference for future mine engineering support design.

2. Theoretical Basis

2.1. Equivalent Strain-Softening Model for Jointed Rock Mass

2.1.1. Quantifying the Surrounding Rock Grading System Using the GSI (Geological Strength Index) Series

Engineering practice shows that the post-peak behavior of rock mass is highly sensitive to variations in rock mass quality grade and confining pressure. The selection of a reasonable surrounding rock rating method is, therefore, a key factor to ensuring the safety and reliability of a support structure in underground engineering. The geological strength index (GSI) is a surrounding rock rating system that describes broken rock mass of poor quality, and has been widely used and improved in a large number of engineering practices. Cai et al. [19,20] proposed a rock mass grading method that takes the block volume V b and structural plane condition factor J c as decisive factors to obtain a GSI value for a rock mass using a GSI quantification chart. The volume V b of a rock mass can be calculated by the joint spacing and joint plane angle. Rock mass joints are shown in Figure 1, where S i and γ i represent the distance and angle between the joint spacing and joint plane, respectively.
The rock block volume V b can then be calculated according to:
V b = S 1 S 2 S 3 sin γ 1 sin γ 2 sin γ 3
The condition factor J c of the rock mass structural plane can be determined as:
J C = J W J S J A
where J W is a large-scale waveform coefficient that ranges from 1 to 10 m, J S is a small-scale smoothness coefficient that ranges from 1 to 20 cm, and J A is the joint alteration coefficient. In numerical simulations, the GSI value can sometimes be very hard to determine in reference to the chart, which tends to be somewhat subjective and inherently introduces errors. To improve the system accuracy and convenience, Cai et al. [21] established a formula for calculating the GSI based on V b and J c using surface fitting technology according to:
G S I ( V b , J c ) = 26.5 + 8.79 ln J c + 0.9 ln V b 1 + 0.015 ln J c 0.0253 ln V b
A visual image method is used to describe the relationship between the GSI and V b and J c , which improves the practicality and accuracy of the system. A visual image of the GSI system is shown in Figure 2.
To further improve and perfect the quantitative method of the GSI value, Cai et al. [20] proposed that V b and J C are not constant values and that their magnitudes gradually decrease during the local plastic shear failure process upon rock mass unloading. Equation (3) shows that the GSI magnitude of a rock mass will gradually deteriorate from the peak G S I p to a post-peak residual G S I r . Alejano et al. [22] discussed the relationship between G S I p and G S I r and fitted an empirical relationship as follows:
G S I r = 17.25 × e 0.0107 × G S I P

2.1.2. Strain-Softening Model of Equivalent Jointed Rock Mass

A circular roadway is shown in Figure 3a with a radius R and original stress σ 0 . The resistance of the virtual support after excavation is P i , which represents the spatial binding force of the working face before and after excavation. The surrounding rock of the roadway is composed of three parts, namely an elastic zone, a softening zone, and a residual zone. During rock excavation unloading, the jointed plutons change from the peak G S I p in the elastic stage (point B) to the residual G S I r in the plastic residual stage (point D) after joint fissure extension and softening (point C). This process can be equivalently formulated using continuum theory. Yang et al. [23] proposed a modified numerical model (a damage strain-softening model) based on continuum fast Lagrangian analysis secondary development to model the fracture development of jointed rock mass from a microscopic damage viewpoint of the damage evolution and strain-softening process. The rock mass is assumed to be a homogeneous, isotropic continuum described by Mohr–Coulomb and Hoek–Brown model parameters.
Among the plastic strain-softening models used for rock materials, the yield criterion and plastic potential energy are jointly determined by the stress tensor σ i j and softening parameter η , which are expressed as:
f ( σ θ , σ r , η ) = 0
The unloading process involving rock excavation is shown in Figure 3b. When η = 0 , the plutons are in the elastic deformation stage, with 0 < η < η * for the strain-softening stage and η > η * for the residual phase, where η * is the critical softening parameter value for the transformation of the plutons from strain softening to the residual stage. The softening process of plutons is determined by the slope M. The simplified piecewise linear strain-softening model (Figure 3b) states that ideal brittle failure occurs when M→∞ and ideal plastic behavior occurs if M = 0.
The Hoek–Brown (H-B) criterion is one of the most widely used yield criteria for plutons and has been extensively developed and refined [24,25]. The 2018 version of the H-B yield criterion is adopted in this paper [25], namely:
σ 1 = σ 3 + σ c i ( m b σ 3 σ c i + s ) a
where σ 1 and σ 3 are the maximum and minimum principal stresses during pluton destruction, respectively; σ c i is the uniaxial compressive strength of the rock mass, which remains unchanged during the pre- and post-peak periods; m b is the H-B constant, which takes the value of m i that reflects the degree of vulnerability of the pluton and should also remain unchanged during the pre- and post-peak periods; s reflects the degree of pluton destruction, which ranges from 0 to 1. The criterion introduces the perturbation coefficient D into the pluton intensity calculation, and the parameters can be expressed by:
m b = m i exp ( G S I 100 28 14 D ) s = exp ( G S I 100 9 3 D ) a = 1 2 + 1 6 ( e G S I / 15 e 20 / 3 ) }
The H-B strain-softening model is obtained by assuming that m b and s in the H-B constant decay linearly with η , and is given as:
ω ( η ) = { ω p ω p ω r η η ,       0 < η < η ω r ,                                       η η
where ω p is the peak parameter, ω r is the residual parameter, and∙ ω can be substituted for m b .
In this paper, the softening parameter η is defined as the plastic shear strain, which is obtained via the difference between the maximum and minimum main plastic strains:
γ p = η = ε 1 p ε 3 p
where γ p is the plastic shear strain and ε 1 p and ε 3 p are the maximum and minimum plastic strains, respectively.
The maximum host plastic strain of a pluton from Figure 3b can be expressed as:
ε 1 p = ε 1 peak , e + ε 1 drop ε 1 e
where ε 1 p e a k , e is the maximum principal strain of elasticity before the peak, ε 1 d r o p is the strain softening after the peak, and ε 1 e , is the maximum principal strain of elasticity. These can be further expressed as:
ε 1 peak , e = σ 1 p ( σ 3 ) E ε 1 drop = σ 1 p ( σ 3 ) σ 1 r ( σ 3 ) M ε 1 e = σ 1 r ( σ 3 ) E }
where σ 1 p is the peak principal stress, σ 1 r is the residual principal stress, and E is the elastic modulus of the jointed plutons.
In considering the shear swelling angle ψ , ε 3 p can be represented as:
ε 3 p = 1 2 K ψ ε 1 p
where:
K ψ = 1 + sin ψ 1 sin ψ
When ψ = 0, Equation (12) becomes:
ε 3 p = 1 2 ε 1 p
The above analysis shows that the slope M of the softening curve is the key to controlling the softening process of jointed plutons. In this paper, the formulation proposed by Alejano et al. [26] is applied to consider the change of peripheral pressure and quality grade of the plutons:
M = ξ E
when: σ 3 S p σ c i 0.1
ξ = [ 0.0046 e 0.0768 G S I p ] ( σ 3 S p σ c i ) 1
when: σ 3 S p σ c i 0.1
ξ = [ 0.0046 e 0.0768 G S I p ] ( σ 3 2 S p σ c i + 0.05 ) 1
In summary, the analysis reveals that the post-peak mechanical behavior of plutons in deep fault fracture zones is affected by the pluton quality grade and the peri-pressure. The pluton softening parameter η* varies during the post-peak unloading of the plutons and its size follows the peri-pressure changes experienced by the plutons. To verify the correctness of the analysis and reliability of the strain-softening model, the model was validated and analyzed using room triaxial compression tests.

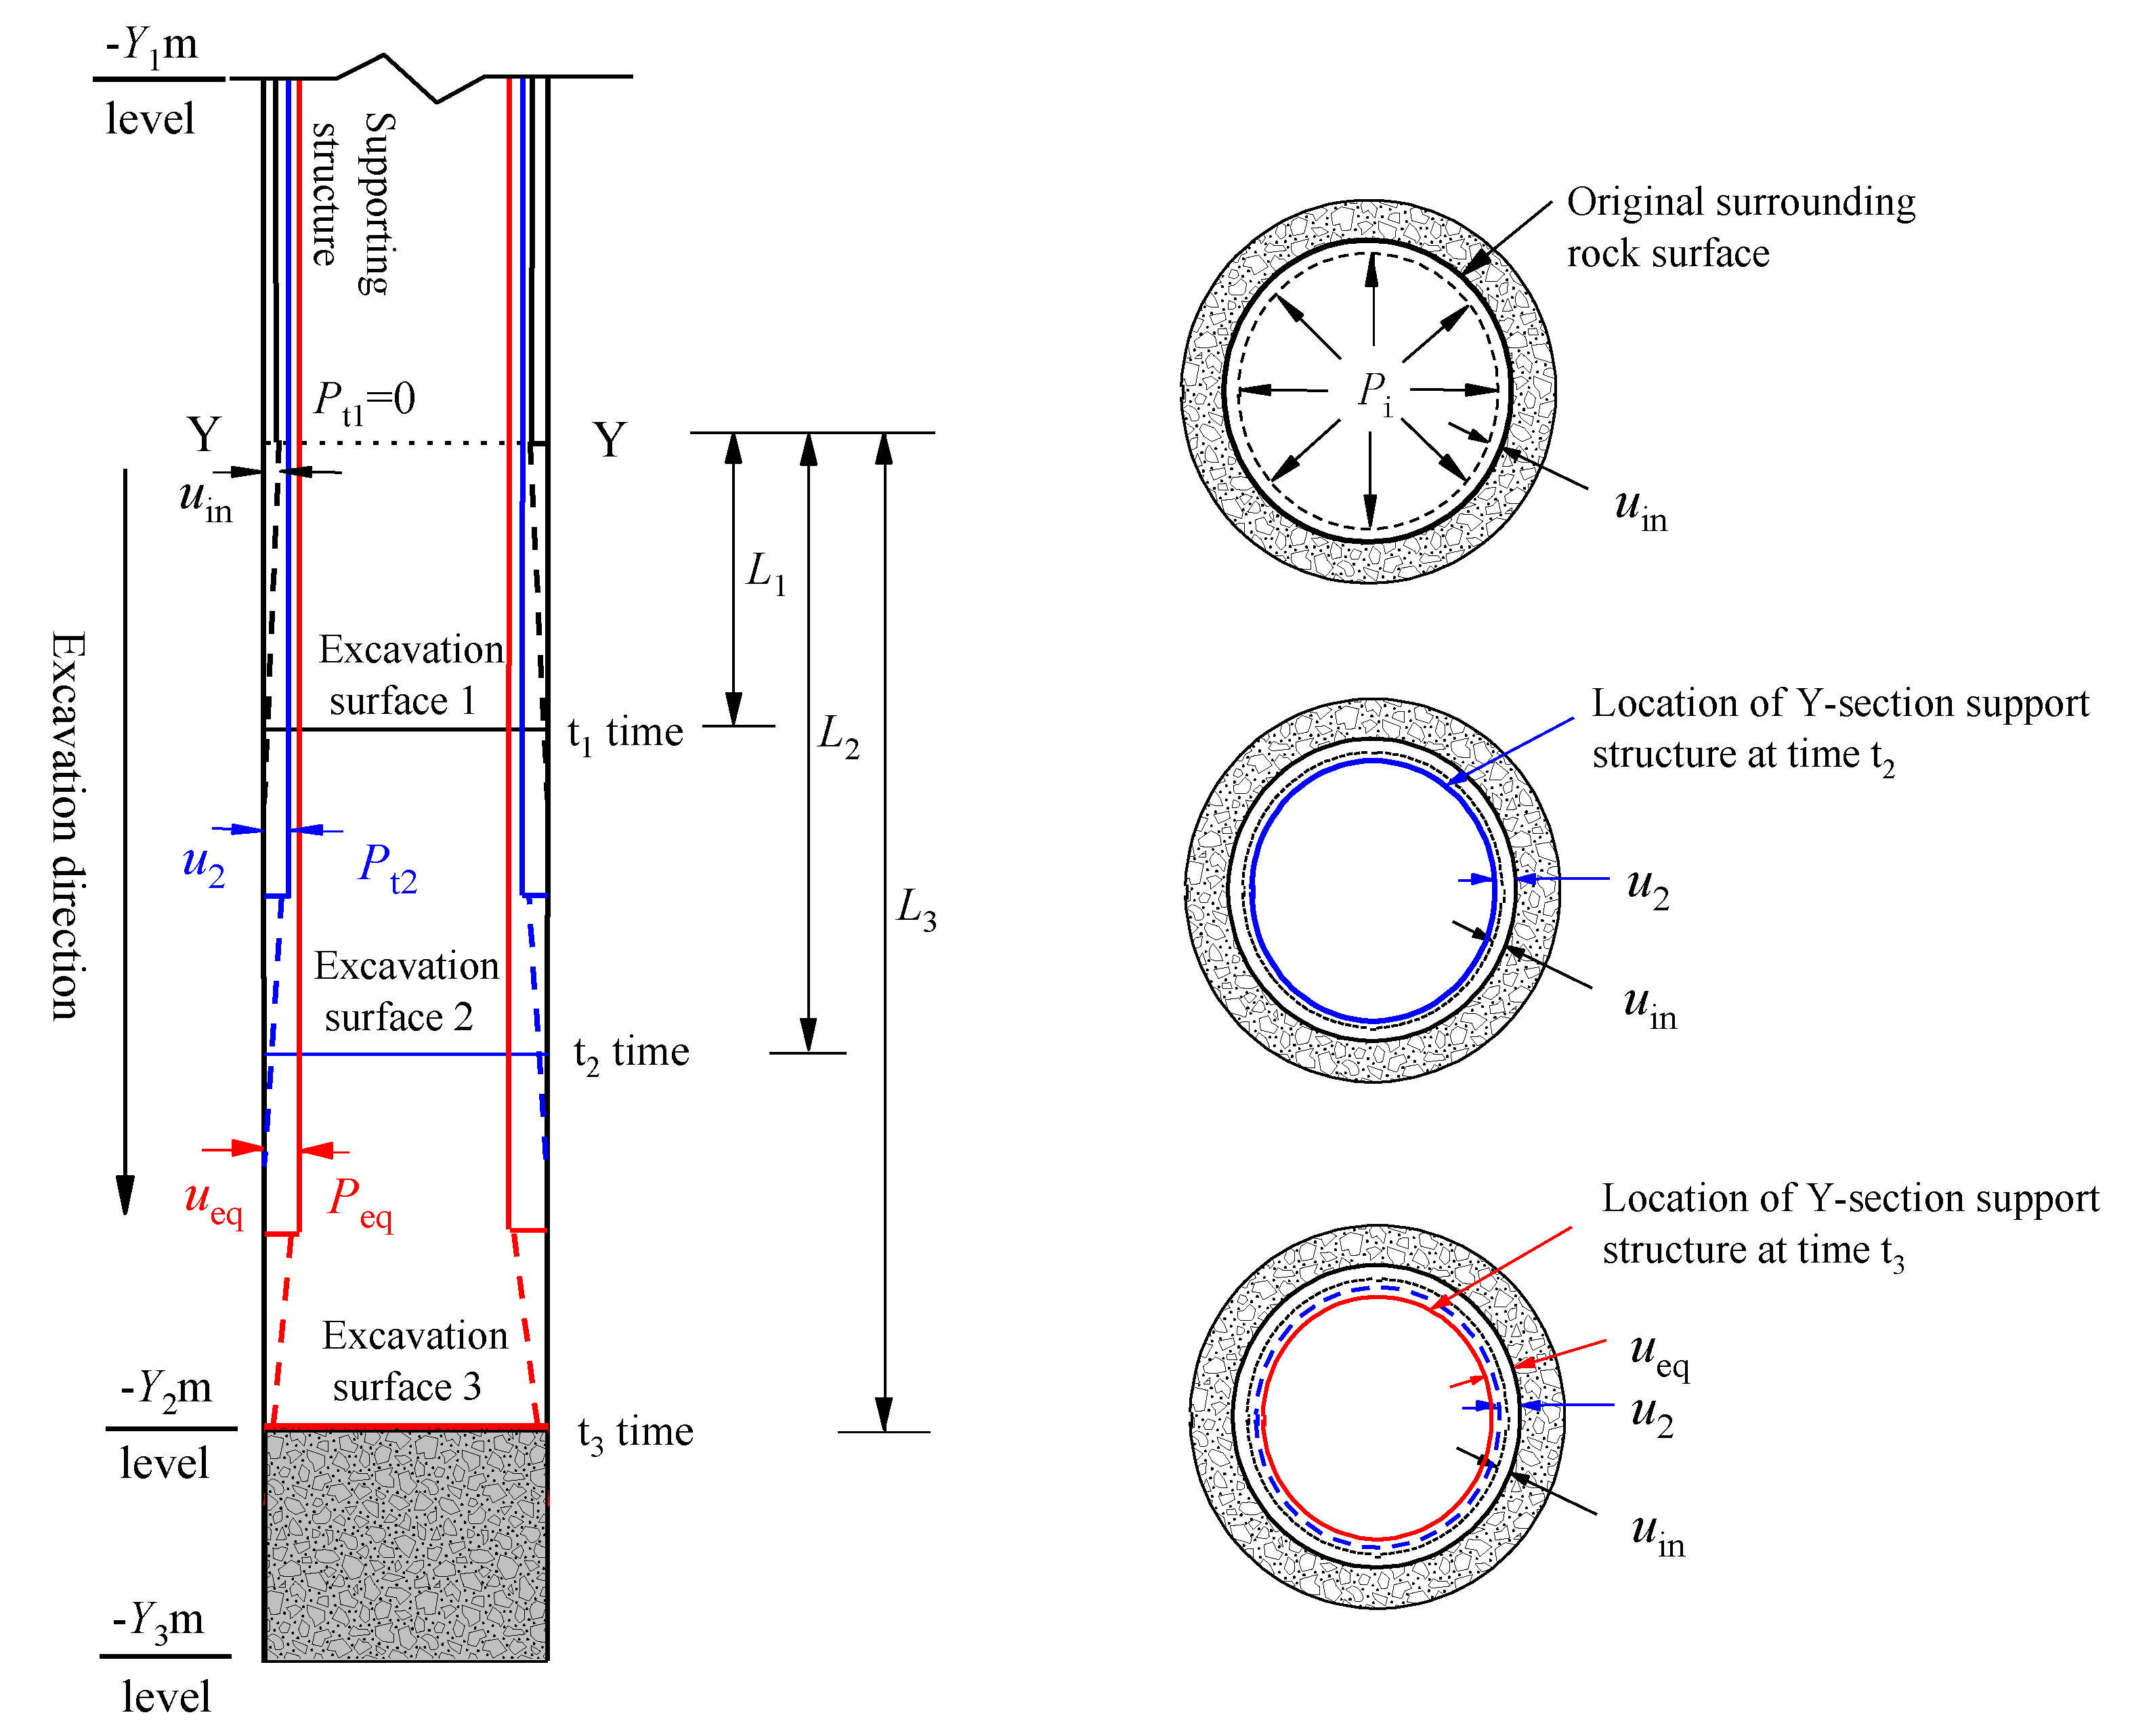
2.2. Principle of Convergence–Constraint Method

The main content of the convergence–constraint method includes three parts: the characteristic rock curve (GRC), the characteristic support curve (SCC), and the deformation curve of the longitudinal section (LDP) [27].
The key steps to rationally applying the convergence–constraint method and evaluating the stability of the rock and support structure are to (1) draw characteristic curves of the rock and support structure based on the mechanical parameters of the pluton and the support structure, (2) understand the stress and displacement change law between the rock and support structure, and (3) determine the optimal support timing of the rock to establish an optimal support system [28,29].

2.3. Shaft Support Characteristic Curve

Shaft excavation construction is typically carried out using parallel excavation–support operations, as shown in Figure 4. During the shaft excavation process, the excavation face exerts a constraint effect equivalent to that of the setting support structure on the surrounding rock over a certain range behind the excavation. This constrained effect size is therefore reflected by the LDP, and the support structure is generally set at a distance L from the excavation surface. At time t 1 for section Y in Figure 4, when the excavation is carried forward to excavation 1 at a distance L 1 , the Y section is partially reduced by the constraint effect of the excavation surface and the rock stress is partially released behind the excavation surface. This produces an initial radial displacement u i n . The support structure is set after the rock stress is released, and the rock in section Y acts on the pressure P t 1 = 0 on the support structure. An additional point of support P i is required to suppress the rock and produce the same radial displacement u i n without the effect of excavation surface confinement. The distance between excavation face 2 and section Y is L 2 . As the excavation face continues to advance to excavation face 2 ( t 2 in Figure 4), the constraint effect of the excavation face on section Y is greatly weakened owing to expansion of the spacing. The radial displacement of the surrounding rock at section Y and the pressure acting on the supporting structure continue to increase to u 2 and P t 2 , respectively. When the excavation face advances to excavation face 3 at a distance of L 3 from section Y at time t 3 (Figure 4), the excavation face no longer has a limiting effect on section Y and the stresses of the surrounding rock and supporting structure at section Y are adjusted to a stable state. The stable radial displacement of the surrounding rock is u e q and the stable pressure of the supporting structure is P e q .
As shown in Figure 5, the supporting pressure of the supporting characteristic curve can be expressed as:
P = K u
where K is the support stiffness coefficient (i.e., slope of the SCC). When u i n < u < u e l , the supporting structure is in the elastic stage; when u e l < u < u max , the supporting structure is in the yielding stage and K = 0; when u > u max , the support system is destroyed.
For end-anchored anchor rods and anchor cables:
K b o l = 1 S c S l [ 4 L b o l π ϕ 2 E b o l + Q ] P max , b o l = T max S c S l }
where K b o l is the supporting stiffness of the anchor rod, P max , b o l is the maximum bearing capacity of the anchor rod system; E b o l is the elastic modulus of the anchor rod material, R is the excavation radius of the circular roadway; S c and S l are the anchor rod spacing and row spacing, respectively; L b o l is the length of the free end of the anchor rod; ϕ is the diameter of the anchor rod; T max is pull-out resistance of the anchor rod; Q is a constant related to the force and deformation characteristics of the anchor rod body, backing plate, and anchor head.
For concrete support:
K s h o t = E c o n ( 1 + v c o n ) [ R 2 ( R t s h o t ) 2 ] ( 1 2 v c o n ) R 2 + ( R t s h o t ) 2 1 R P max , s h o t = 1 2 σ c [ 1 ( R t s h o t ) 2 R 2 ] }
where K s h o t is the stiffness of the concrete support, P max , s h o t is the maximum bearing capacity of the concrete structure, t s h o t is the shotcrete thickness, and E c o n and v c o n are the elastic modulus and Poisson’s ratio of the shotcrete, respectively.
For steel support:
K s e t = E s e t A s e t d ( R h s e t / 2 ) 2 P max , s e t = σ s e t A s e t ( R h s e t / 2 ) d }
where K s e t is the stiffness of the steel arch support, P max , s e t is the maximum bearing capacity of the steel support, E s e t is the elastic modulus of the steel arch material, d is the shed distance, A s e t is the cross-sectional area of the steel arch, σ s e t is the yield strength of steel, and h s e t is the cross-section height of the steel arch.
The longitudinal section deformation curve and surrounding rock characteristic curve can be obtained using the method proposed by Hoek et al. [30] or by establishing a three-dimensional numerical model [31,32]. Oreste et al. [33,34] provided a detailed introduction to the method of determining the characteristic curve of a supporting structure.
A three-dimensional numerical model was established based on the H-B yield criterion, and the GRC of the shaft-surrounding rock and deformation curve of the longitudinal section were obtained. The on-site supporting structure parameters were combined to draw the GRCs of the different supporting structures, evaluate the reliability of the supporting scheme, and propose a reasonable supporting scheme.

3. Model Validation and Analysis

3.1. Triaxial Compression Tests of Surrounding Rock

In the tests, a British GDS high-precision soft rock rheometer was used that comprised a 250 KN motor-driven digital load holder, a 32 MPa pressure and volume control system, a local strain sensor, and a versatile testing module. This approach meets the requirements for conventional triaxial tests with high accuracy.
Indoor triaxial compression tests were performed on rock specimens from the Niaoshan coal mine wells. The pluton specimens were cylindrical in shape with a radius r = 25 mm and height h = 100 mm according to the specification [35] ratio h/r = 4–4.5. The test specimens and experimental equipment are shown in Figure 6.
Three-axis compression tests were performed using the displacement-controlled formula to load the specimen via axial pressure to the circumferential pressure to the target value after fixing the circumferential pressure value σ 3 . The circumferential pressure σ 3 values were taken to be 0, 1, 3, and 7 MPa, and the load was continued until the test item failed. The axial pressure acceleration rate was 0.1 mm/min. The test results are shown in Table 1 and Figure 7.

3.2. Parameter Determination of Equivalent Strain-Softening Model

The rock mass volume V b and structural plane condition factor J C ranges are estimated according to Equations (1) and (2) in line with the on-site construction documentation, surveying, and mapping data. The calculation results are then substituted into Equation (3). The GSI value of the surrounding rock in this section is estimated to be between 58 and 63; thus, we take an average value of GSI = 60. A disturbance coefficient of rock mass D = 0 is taken according to the on-site excavation situation. The parameters in Equations (12)–(17) can be obtained by field observations. The uniaxial compressive strength of the intact rock mass is σ c = 4.156 MPa < 100 MPa. The elastic modulus E can, therefore, be calculated according to the formula proposed by Hoek et al. [36]:
E = ( 1 D 2 ) σ c 100 × 10 [ ( G S I 10 ) / 40 ]
When a strain-softening model is solved using FLAC3D numerical software, the model softening parameter e p s can be calculated by:
e p s = 3 3 1 + K ψ + K ψ 2 γ p 1 + K ψ
The m i value for the material parameters of different rocks can generally be evaluated using empirical tabular methods or according to:
m i = σ c i / | σ t |
where σ t is the uniaxial tensile strength of intact plutons. It is worth noting that the empirical tabular method heavily relies on practical engineering experience, which subjects the determination of the material parameters to some subjectivity and results in certain estimation errors. The m i values can be evaluated using the theory of Equation (24), but are generally not easily calculated owing to the difficulty in obtaining the rock uniaxial tensile strength. Hoek et al. [24,30] proposed that m i be considered as an empirical fitting parameter and the construction of an m i fitting formula on the basis of a large number of triaxial experiments. Peng et al. [37] proposed a negative exponential model for the relationship of m i and the circumferential pressure, and fitted the model parameters using three-axis experimental data from multiple rocks to verify the rationality of the model. In this paper, the material parameter m i of rock mass under different confining pressures is determined by the method presented in [37]. The determination of m i in combination with Equation (7) using the H-B constant m b is listed in Table 2 and the model parameters are summarized in Table 3.

3.3. Validation and Analysis of Model Reliability

The stress–strain curves of the plutons were obtained by carrying out triaxial compressive tests at four peri-compressive pressures (0, 1, 3, 7 MPa) on rock samples collected from a coal mine well in Niaoshan, Heilongjiang, China. The obtained model parameters and mechanical parameters of the plutons were substituted into strain-softening models to draw model curves of the rock at four peri-pressures. A comparative analysis of the two classes of curves (Figure 8) is performed separately to verify the reliability of the strain-softening model after reaching the peaks of the equivalently jointed plutons.
According to the comparative analysis results shown in Figure 8, the model curves of the peak and residual stresses of the pluton body change linearly with the surrounding pressure, which is consistent with rock mechanics theory. During the linear elastic deformation stage before reaching the peak stress, the pluton model curves at different ambient pressures largely coincide with the experimental curves and all agree to a higher extent. This shows that the strain-softening model better describes the mechanical behavior during the linear elastic phase, which conforms to the actual stress–strain variation law of plutons. The model results also generally agree with the test curve variation law during the strain-softening phase after the peak has been reached.
The tests show that the equivalent jointed pluton strain-softening model well characterizes the post-peak nonmechanical properties of plutons. The major source of difficulty in controlling deep rock lies in the contradiction between the uncoordinated nature of the established support structures and the strain-softening properties of plutons, the latter of which are poorly understood. The softening model is, therefore, applied in engineering design to further verify the reliability of the strain-softening model for equivalent jointed plutons by field application, and a reasonable scheme for rock support in a deep well is accordingly established.

4. Design and Stability Analysis of Surrounding Rock-Supporting Structure of Shaft

4.1. Engineering Example

The Niaoshan coal mine is located in Heilongjiang Province, China. The geology comprises, from the bottom to the top of the mining area, the Upper Chengzihe Formation (K1C), Muling Formation (K1m), Dongshan Formation (K1ds), Houshigou Formation (K1- 2h), and tertiary and quaternary strata. The ground elevation of the mining area is +350 m, the design and production final level of the auxiliary shaft is −700 m, the cross-section is circular, and the excavation radius is 4.5 m. When an auxiliary shaft is constructed in the −600–700 m horizontal section, it passes through the fault fracture zone. According to the geological survey data, there are 23 faults with a drop of more than 30 m and 13 faults with a drop of more than 100 m in the middle and deep parts of the area. The rock mass in this section is mainly tuffaceous mudstone and thin-bedded argillaceous sandstone. The rock mass is low in strength, easily weathers and peels off, and swells and softens in contact with water, showing the mechanical properties of soft rock with well-developed rock mass joints and fissures. It is prone to significant deformation. The geological survey data show that the average cohesion of the rock mass c = 2.2 MPa and the average internal friction angle φ = 26°. Groundwater is not developed in this section and the rock mass is dry. In situ stress testing was carried out on the horizontal section ranging from −400 m to −700 m in the mining area. The test results showed that the distribution of in situ stress was mainly horizontal principal stress. The average maximum and minimum horizontal principal stresses were 23 MPa and 22 MPa, respectively. The results from the horizontal ground stress test at −600 m are shown in Table 4, where αH is the maximum horizontal principal stress azimuth angle.

4.2. Rock Mass Mechanical Properties

A KDVJ-400 borehole surveying instrument and digital panoramic borehole camera system were used to survey the rock mass. The mechanical strength parameters of the surrounding rock are summarized according to the survey data and field and laboratory tests, and converted into equivalent Mohr–Coulomb peak and residual strength parameters following the method given in [38], as shown in Table 5.

4.3. Original Support Scheme Design

The excavation section of the surrounding rock of the on-site shaft was 3.8 m high. The original support design mainly adopted a combined support of bolts, sheds, and shotcrete. After the excavation of the surrounding rock is completed, a well circle will be erected, anchor rods will be driven, and the concrete will be sprayed to form a well-lining structure. In an excavation section, the design time of the bolt structure installation phase comprises two shifts, the installation time of the well circle is one shift, and the installation time of the concrete structure is one shift, with a total of 8 h per shift. The specific support designs of the original plans 1 and 2 are shown in Table 6, and the supporting characteristic parameters of various supporting structures are listed in Table 7.
The support scheme process flow is shown in Figure 9.

4.4. Numerical Calculation Model and Model Parameters

According to the actual situation in the field, the magnitude of the horizontal anisotropic geostress in the shaft is almost equal and the sections are circular. The convergence–constraint method is, therefore, applied in this paper to calculate the rock support structure stability and FLAC3D software is used to numerically solve the strain-softening model for equivalently jointed plutons. The structure dimensions for building the vertical well computational model are shown in Figure 10a and the model boundary conditions are shown in Figure 10b,c, where Pv is the vertical principal stress, PH is the maximum horizontal principal stress, and Ph is the minimum horizontal principal stress. During the excavation process, the section height was 2 m and a total of 30 excavations were cycled. The surrounding rock GRC was calculated using an equivalent two-dimensional model [39], as shown in Figure 10c. Suppose the virtual support pressure Pi is gradually released, each release is 2% of the original rock stress, and the release cycle is repeated 50 times. The relationship curve between the surrounding rock pressure and rock displacement is obtained, and the model calculation parameters are listed in Table 3.
The reliability of the strain-softening model for deep weak rock masses is tested using numerical simulation methods to calculate and analyze the stability of the support design system in combination with the actual damage of the on-site supporting structure and on-site observations. The ideal elastoplastic model and equivalent jointed rock strain-softening model are used to calculate the stability of the surrounding rock support structure based on the Mohr–Coulomb criterion.

4.5. Analysis of Original Supporting Structure Calculation Results

4.5.1. GRC, SCC, and LDP Curves

The section 0.5 m from the working face is selected for calculation. The original support plan is calculated using the convergence–constraint method to obtain the surrounding rock GRC, SCC, and LDP curves, as shown in Figure 11 for the two original support schemes. The SCCs of the two schemes do not intersect with the surrounding rock GRCs when using the strain-softening model. This indicates that the designed support structure of the pristine support schemes 1 and 2 cannot meet the shaft support requirements. Field investigation showed that the supporting structure of the rock generated a failure, indicating that the strain-softening model calculation results are consistent with actual breakage conditions in the field. When calculated using the ideal elastic–plastic model, the original scheme of support type 1 reached the yield state, which cannot meet the support requirements. However, the SCC of the original support scheme 2 is confluent with the GRC and the support structure does not reach the yield state. The support structure should be in the safe carrying capacity range, which indicates that the original support can meet the support requirements, but the field support structure had actually undergone a large destruction. There are some differences between the results calculated using the ideal elastic–plastic model and the actual situation in the field.

4.5.2. Damage Status and Cause Analysis of the Original Supporting Structure

The damage condition of the supporting structure notably differed with burial depth and can be mainly divided into three damage types. (1) The first damage type was local disruption of the well wall, as shown in Figure 12a. At the site, only the concrete on the inside of the shaft wall had partially peeled off, there was no large-scale crushing or cracking, and the damaged part had no tendency to develop into the surroundings. This damage form was mainly distributed in the depth range of −200 to −400 m, and shotcrete was used for repair. (2) The second destruction type was well wall extensibility damage, as shown in Figure 12b. The field well wall concrete demonstrated shedding, extrusion, and destruction phenomena, and the inner edge produced cracks that showed an expansion tendency. This destruction form was distributed mainly in the −400 to −600 m depth interval, and the field treatment mainly involved the removal of broken parts and supplementation of the high-strength anchor. The repair treatment scheme involved concrete rejetting. After the treatment, the breakage conditions in this section were considerably improved and the support structure basically reached stability. (3) The third damage type was systematic destruction of the support structure, as shown in Figure 12c, and was mainly distributed in the depth interval from −600 to −700 m. The degree of damage to the support structure in this segment was more severe than that in the two shallower depth intervals. The damage to the support structure was no longer to a single well wall, but occurred as a global disruption to the overall support structure, in which the well wall appeared to have broken and fallen out over a large area, thus creating cracks that sharply expanded. Places where the breakage and fall-off were severe caused the well circles to squeeze and be exposed on the outside. The well circles reached the yield state for the third damage type, and the supporting structure lost its overall supporting capacity. The site removed the damaged part and re-sprayed the concrete and increased its thickness to 700 mm. After the repair was completed, the supporting structure continued to show similar damage and shaft excavation could not continue under normal construction conditions. The excavation section was, therefore, backfilled, the sand was backfilled to the damage location, and the construction was stopped.
The key reasons for the failure and instability of the supporting structure based on the analysis of the damage condition, geological conditions, and current support scheme are described as follows:
(1) The so-called “three highs and one disturbance” phenomenon of three highs (i.e., high ground stress, high temperature, and high karst hydraulic pressure) and one intense mining disturbance of a deep pluton outburst is directly responsible for the destruction of support structures, which are mainly represented by high-altitude stresses;
(2) The strain-softening characteristics of deep rock mass are prominent, the strength is low, the excavation section is exceedingly deep in the shaft excavation process, the spacing between the supporting structure and working face is too small, and the stiffness of the supporting structure is too large. There is also insufficient space for stress relief in the surrounding rock, the in situ stress is too high, and the strength of the supporting structure cannot meet the support requirements and is destroyed;
(3) Lack of timely rock capping after excavation of the vertical wells causes softening by water expansion after long exposure of plutons, which considerably weakens the anchor support effect.
Zhu et al. [40] proposed that the main reasons for large deformation of surrounding rock are as follows. (1) The weathering effect occurs during excavation of a rock mass when the rock mass on the sidewall of the excavation surface is not closed in time and the rock mass is exposed to the air and oxidized, resulting in decreased compressive strength and elastic modulus of the rock mass. (2) The effect of water occurs after excavation of a rock mass if the accumulated water in the cave is not removed and causes the rock mass to soften and break. (3) The confining pressure effect occurs when the rock mass does not receive strong initial support when the strain-softening degree is less under high confining pressure. (4) The dilatancy effect of high ground stress and relaxation deformation of weak support.

4.6. Support Plan Design Optimization

Shaft excavation alters the original stress equilibrium regime of plutons, and the rock side pressure gradually decreases during excavation unloading. As the excavation surface continues to advance, the rock surface pressure decreases to zero by losing the excavation surface restraint effect. The rock stress is simultaneously realigned to depth to produce a stress concentration, and the maximum release peak can reach 30 MPa in rock stress release owing to the high ground stress nature associated with deep pluton formation. The plastic failure zone sharply expands upon the stress release. This rock stress state may not be improved by timely reinforcement of the rock without supporting measures. The rock failure extension trend, thus, cannot be controlled, which produces large deformation failure. However, in the course of shaft support, the application of the high-strength and high-stiffness support structure to the rock after excavation is a support measure to effectively restore the stress balance state of plutons and slow the extent of rock fracture extension to enhance its self-bearing capacity. Although this passive type of support can ensure rock stability, it requires inaccessible requirements for the load-bearing capacity of the adopted support structure, Thus, in the case of “three highs and one disturbance”, the support structure design should focus on the concept of high resistance and release pressure by means of reinforcement to alter the rock stress state.
It is important to effectively control the discontinuous deformation of rock and enhance rock monoliths using high-strength anchors for the release pressure support. A high-strength anchor is used to improve the extension rate of continuous rock deformation, and part of the rock stress is released to reduce the rock pressure to the support structure. In practical field situations, a high-strength anchor is used as the initial support to provide sufficient stress release space for the rock. When the surrounding rock stress reaches the appropriate release level, a well ring and shotcrete are used for high-strength and high-stiffness secondary support to meet the surrounding rock-stability requirements.
The two original care programs were optimized and improved. Building on these results, two options were proposed for optimizing the care design. The optimized supporting structure settings are shown in Table 8.

4.7. Optimization Scheme Numerical Calculation Results Analysis

The above two optimization schemes are calculated using the convergence–constraint method, and the rock support interaction curves are shown in Figure 13. The optimization of support scheme 1 using both the ideal elastic–plastic model and equivalent effect softening model shows that the obtained GRCs all intersect with the elastic part of the SCCs, and that the support structure meets the support requirements. However, it is worth noting that when adopting the strain-softening model calculation, the optimization of support scheme 1 and the junction between the GRC and SCC are very close to the end of the elastic phase of the SCC. Small safety reserves of support structures are required under the action of the natural rheology of the rock mass and the supporting structure will gradually be destroyed. The risk is, therefore, relatively high, which is not advisable in actual engineering. If optimized support scheme 1 is adopted to support the shaft-surrounding rock, the thickness of the shotcrete can be appropriately increased to provide a stronger support reaction to ensure the inner diameter of the shaft. Alternatively, the distance between anchor cables can be appropriately reduced to allow them to provide greater supporting resistance while keeping the thickness of the shotcrete unchanged. This reduces the pressure on the concrete, which meets the requirements of improved supporting structure safety.
The support scheme 2 is optimized to enhance the shaft wall structure stiffness by appropriately increasing the grade of the coagulation strength. The intersection point of the GRC and support structure occurs within the elastic part of the SCC, the support system reaches the equilibrium condition calculated by the strain-softening model, and the support system meets the stable requirements and has a large safety reserve. If optimized support scheme 2 is adopted to support the surrounding rock of the shaft, the thickness of the shotcrete can be appropriately reduced to reduce the engineering cost as much as possible and improve the economics of the support system under the requirement of meeting the stability of the surrounding rock.

4.8. Monitoring of Support Effect

Measurement points were set to monitor the construction process and deformation of the surrounding rock and supporting structure of the horizontal section between shaft depths of −600 and −700 m. The accuracy requirement of shaft construction deformation monitoring is 1 mm, the distance between the deformation monitoring lines was set to 2 m, the two original plans and optimized support plan were monitored, and the shaft lining was repaired after the original support structure was destroyed. Based on the above analysis regarding the cause of damage to the supporting structure, the height of the excavation section was reduced to 2 m during the repair process. The well wall destruction sites were eradicated and cleaned out before the initial supports with high-strength anchors, 40–50 mm thick concrete closures, and flat plutons were re-sprayed. A force of 150 kN was applied to the pre-anchoring force and the monitoring frequency was increased when the anchors were installed. The amount of rock deformation and the deformation rate were recorded, and the interaction law of the SCC and surrounding rock GRC calculated based on the strain-softening model was analyzed. Surrounding rock deformation of 100 mm is considered to apply the secondary support in a timely manner. A wooden wedge was driven between the well circle and surrounding rock to fasten the well circle. The concrete structure was poured for 6–8 h after the well circle was constructed. The concrete model was C35 grade and the jetting thickness was 700 mm.
Figure 14 indicates that the original scheme did not meet the calculation results, and instead reached its support resistance limit value and was destroyed by day 20 after installation. The rock gradually destabilized after failure and its shape variable still showed no notable convergence trend after 300 mm. This support structure, therefore, cannot meet the rock stability control requirements. The original scheme 2 satisfies the calculation results of the ideal elastic–plastic model, but the support structure still produced failure. Furthermore, the failure time was delayed by approximately 5 days compared with the original scheme 1, the amount of rock deformation was large, and the convergence trend was still small. The support structure designed based on the strain-softening model fully considers the strain-softening characteristics of plutons, and the idea of high-resistance release pressure is introduced to rationally adopt the high-strength anchor as the initial support to release the rock stress. Both optimization schemes use well coils and sprayed concrete as secondary high-stiffness supports, and can ensure that the rock stability requirements are met. For optimization scheme 2, the rock deformation convergence rate was reduced to 1 mm/day by the 35th day after setting the support structure. The surrounding rock deformation was then finally controlled at 140 mm and tended to be stable, thereby meeting the requirements for the surrounding rock stability.

5. Discussion

Two different mechanical models were used to calculate the stability of the surrounding rock under the same support scheme. The calculation accuracy of the two models and the reasons for the deviation are compared and analyzed according to the calculation results and actual monitoring data.

5.1. Comparative Analysis of Numerical Calculation Results of Original Plan and Monitoring Data of Surrounding Rock Deformation

When the strain-softening characteristics of a rock mass are not considered, the rock mass is considered to be an ideal elastoplastic body, and the failure process of the rock mass obeys the Mohr–Coulomb criterion, on the basis of which the shaft-surrounding rock-supporting structure is designed. According to the calculation results (Figure 11), only the original support scheme 2 meets the stability requirements of the surrounding rock. When radial displacement of the rock mass reaches 33–34 mm, the surrounding rock and supporting structure are in balance. On-site monitoring showed that the supporting structure of the actual original supporting plan 2 produced three different degrees of damage, and the surrounding rock had no obvious convergence trend. The supporting structure was unstable at 18 days after construction, and deformation of the rock mass continued to increase until 23 days after construction. On-site monitoring data showed that the surrounding rock deformation only started to slow down when the surrounding rock deformation reached 300 mm. The numerical calculation results deviate from the on-site monitoring results.

5.2. Deviation Analysis

There is a big difference between the environment of deep rock mass and that of shallow rock mass. Owing to the occurrence of high ground stress, deep rock mass has outstanding strain-softening characteristics, which are easy to overlook when designing supporting structures in deep rock mass engineering. This leads to unreasonable design of the supporting structure and leads to deviations.

5.3. Comparative Analysis of Calculation Results of Optimized Support Plan and Surrounding Rock Deformation Monitoring Data

Under the condition of high ground stress, the strain-softening characteristics of rock mass are outstanding. For the support design of rock mass, partial release of the high ground stress of the surrounding rock should be considered, i.e., “compression support”. When the strain-softening model is used for calculation, the calculation results (Figure 11 and Figure 13) show that the supporting structures of the original supporting scheme had all yielded, and the supporting structure of the optimized scheme is in the elastic stage. The on-site monitoring results showed that the high-strength anchor cables provided such compression support. When radial deformation of the surrounding rock reached 100 mm, high-rigidity secondary support was performed. The surrounding rock was finally stable and the convergent deformation was 140 mm.

6. Conclusions

In this study, the convergence–constraint method was adopted to calculate the stability of the surrounding rock support structure of a vertical shaft in a large deep fault crushing area using two mechanical models. The following conclusions are drawn.
(1) When the ideal elastoplastic model is used for calculation, the calculation results show that when joint deformation of the shaft-surrounding rock and the supporting structure reaches 33 mm, the surrounding rock and the supporting system are in balance. Actual monitoring results showed that the shaft wall had been damaged, and deformation of the supporting structure on the 23rd day of installation exceeded 300 mm. The result calculated by the ideal elastoplastic model differs from that of the on-site supporting effect.
(2) In this study, the displacement release of surrounding rock was 100 mm as the opportunity for secondary support of the shaft wall. The well wall secondary support parameters were a well ring (No. 28 A-shaped I-beam), shed distance d1 = 1.2 m, and C35 concrete thickness t = 700 mm. The calculation results using the strain-softening model show that the surrounding rock characteristic curve and the elastic part of the supporting structure characteristic curve intersect, indicating that the surrounding rock and the supporting system are in balance. The field application results showed that 35 days after the supporting structure was constructed, the deformation rate of the surrounding rock was less than 1 mm/day and the deformation was finally controlled at 140 mm. The calculation results were in line with actual observations.
(3) Actual application of the models shows that the strain-softening model for equivalently jointed plutons, built on the continuum media theory of plutons and the GSI rock grading system, is more realistic than conventional ideal elastic–plastic models for reflecting the post-peak non-linear mechanical properties of deep and weak plutons. Aiming at stability control of shaft-surrounding rock in deep and large fault fractured areas, the key to the support technology based on the post-peak strain-softening model of rock mass is to introduce the idea of high-resistance yielding, improve the stiffness of the primary support, reasonably release the stress of the surrounding rock, and provide high-strength secondary support in a timely manner.

Author Contributions

Conceptualization, J.Z.; data curation, Y.W. and B.Y.; formal analysis, J.Z. and C.S.; funding acquisition, J.Z.; investigation, Y.W., B.Y., D.C. and B.J.; methodology, J.Z. and Y.W.; project administration, J.Z., Y.W., B.Y. and B.J.; resources, J.Z. and Y.W.; software, Y.W., B.Y., D.C. and C.S.; supervision, J.Z. and D.C.; validation, J.Z., Y.W. and C.S.; writing—original draft, J.Z. and Y.W. All authors have read and agreed to the published version of the manuscript.

Funding

This research was funded by The Education Department of Liaoning Province (grant number LJ2017QL037), National Key R&D Projects (grant number 2017YFC1503101), National Natural Science Foundation of China (grant number 51704144), and The Discipline Innovation Team of Liaoning Technical University (grant number LNTU20TD08). The APC was funded by The Discipline Innovation Team of Liaoning Technical University.

Institutional Review Board Statement

Not applicable.

Informed Consent Statement

Not applicable.

Data Availability Statement

All data from this study are included in the submitted manuscript.

Acknowledgments

We thank Esther Posner, and Kathryn Sole for editing the language in the drafts of this manuscript.

Conflicts of Interest

The authors declare no conflict of interest.

References

  1. Zhang, G.; He, F. Deformation failure mechanism of high stress deep soft roadway and its control. J. Min. Saf. Eng. 2015, 32, 571–577. [Google Scholar] [CrossRef]
  2. Li, H.; Wang, X. Deformation and Failure Law and Control Technology of Surrounding Rock in Deep Shaft. Met. Mine 2020, 49, 11. [Google Scholar] [CrossRef]
  3. Fang, X.; Zhao, J.; Hong, M. Failure Mechanism and Control Measure of Roadway Deformation with Fractured Surrounding Rock in Deep Mine. J. Min. Saf. Eng. 2012, 29, 1–7. [Google Scholar] [CrossRef]
  4. Wang, J.; Luo, N.; Bai, Z. On the relation between interlayer glide caused by coal extraction and the shaft rupture occurring in coal mines in huanghuai area. Chin. J. Rock Mech. Eng. 2003, 22, 1072–1077. [Google Scholar] [CrossRef]
  5. Zhang, W.Q.; Lu, Y.H.; Gong, H.Y.; Meng, X.J.; Guan, Y.Z. Causes analysis of shaft wall damage in Yan-Teng Mining District and its prevention and contyolling method. Rock Soil Mech. 2004, 12. [Google Scholar] [CrossRef]
  6. Liu, J.L.; Chen, L.W.; Wang, J.L. Characteristic analysis of temperature stresses of shaft wall. Rock Soil Mech. 2011, 32, 2386–2390. [Google Scholar]
  7. Yang, H.; Jiang, X.Y. Mechanical Model and Analysis of Shaft Wall Fracture Mechanism. J. Shandong Inst. Build. Mater. 2003, 17, 383–385. [Google Scholar] [CrossRef]
  8. Sun, X.; Li, G.; Zhao, C.; Liu, Y.; Miao, C. Investigation of Deep Mine Shaft Stability in Alternating Hard and Soft Rock Strata Using Three-Dimensional Numerical Modeling. Processes 2018, 7, 2. [Google Scholar] [CrossRef] [Green Version]
  9. Cao, S.; Luo, F.; Cheng, C.; Li, G.D.; Guo, P. Surrounding rock control of shaft in water enriched fault fracture zone. Chin. J. Rock Mech. Eng. 2014, 33, 1536–1545. [Google Scholar] [CrossRef]
  10. Kang, Y.; Liu, Q.; Xi, H.; Gong, G. Improved compound support system for coal mine tunnels in densely faulted zones: A case study of China’s Huainan coal field. Eng. Geol. 2018, 240, 10–20. [Google Scholar] [CrossRef]
  11. Hu, Y.; Li, W.; Wang, Q.; Liu, S. Vertical Shaft Excavation Shaping and Surrounding Rock Control Technology Under the Coupling Action of High Ground Stress and Fracture Formation. J. Perform. Constr. Facil. 2020, 34, 04020116. [Google Scholar] [CrossRef]
  12. Gao, Y.F.; Wang, B.; Wang, J.; Li, B.; Xing, F.; Wang, Z.G.; Jin, T.L. Test on structural property and application of concrete-filled steel tube support of deep mine and soft rock roadway. Chin. J. Rock Mech. Eng. 2010, 29 (Suppl. S1), 2604–2609. [Google Scholar]
  13. Yao, Z.S.; Yu, G.H.; Cheng, H.; Rong, C.X. Research on vertical bearing capacity of shaft lining structure of high strength concrete and double steel cylinders in super-thick alluvium. Rock Soil Mech. 2010, 6. [Google Scholar] [CrossRef]
  14. Yu, W.; Wang, W.; Wu, G.; Yu, X.; Peng, W. Three Zones and Support Technique for Large Section Incline Shaft Crossing Goaf. Geotech. Geol. Eng. 2017, 35, 1921–1931. [Google Scholar] [CrossRef]
  15. Peng, W.Q.; Wang, W.J.; Yuan, C. Supporting Technology Research in Deep Well Based on Modified Terzaghi Formula. Adv. Civ. Eng. 2018, 2018 Pt 10, 9483538. [Google Scholar] [CrossRef] [Green Version]
  16. Yu, W.; Liu, Z.; An, B.; Liu, F.; Wang, Y. Numerical Calculation and Stability of the Yield and Enhanced Support Technology for Shaft. Geotech. Geol. Eng. 2019, 37, 3127–3140. [Google Scholar] [CrossRef]
  17. Chen, S.; Wu, A.; Wang, Y.; Chen, X.; Yan, R.; Ma, H. Study on repair control technology of soft surrounding rock roadway and its application. Eng. Fail. Anal. 2018, 92, 443–455. [Google Scholar] [CrossRef]
  18. Peng, R.; Meng, X.; Zhao, G.; Li, Y.; Zhu, J. Experimental research on the structural instability mechanism and the effect of multi-echelon support of deep roadways in a kilometre-deep well. PLoS ONE 2018, 13, e0192470. [Google Scholar] [CrossRef] [Green Version]
  19. Cai, M.; Kaiser, P.K.; Uno, H.; Tasaka, Y.; Minami, M. Estimation of rock mass deformation modulus and strength of jointed hard rock masses using the GSI system. Int. J. Rock Mech. Min. Sci. 2004, 41, 3–19. [Google Scholar] [CrossRef]
  20. Cai, M.; Kaiser, P.K.; Tasaka, Y.; Minami, M. Determination of residual strength parameters of jointed rock masses using the GSI system. Int. J. Rock Mech. Min. Sci. 2007, 44, 247–265. [Google Scholar] [CrossRef]
  21. Cai, M.; Kaiser, P. Visualization of rock mass classification systems. Geotech. Geol. Eng. 2006, 24, 1089–1102. [Google Scholar] [CrossRef]
  22. Alejano, L.R.; Rodríguez-Dono, A.; Veiga, M. Plastic radii and longitudinal deformation profiles of tunnels excavated in strain-softening rock masses. Tunn. Undergr. Space Technol. Inc. Trenchless Technol. Res. 2012, 30, 169–182. [Google Scholar] [CrossRef]
  23. Yang, W.; Li, G.; Ranjith, P.G.; Fang, L. An experimental study of mechanical behavior of brittle rock-like specimens with multi-non-persistent joints under uniaxial compression and damage analysis. Int. J. Damage Mech. 2019, 28, 1490–1522. [Google Scholar] [CrossRef]
  24. Hoek, E.; Brown, E.T. Empirical strength criterion for rock masses. J. Geotech. Eng. Div. 1980, 106, 1013–1035. [Google Scholar] [CrossRef]
  25. Hoek, E.; Brown E, T. The Hoek–Brown failure criterion and GSI—2018 edition. J. Rock Mech. Geotech. Eng. 2018, 11, 445–463. [Google Scholar] [CrossRef]
  26. Alejano, L.R.; Rodriguez-Dono, A.; Alonso, E.; Manín, G.F. Ground reaction curves for tunnels excavated in different quality rock masses showing several types of post-failure behaviour. Tunn. Undergr. Space Technol. Inc. Trenchless Technol. Res. 2009, 24, 689–705. [Google Scholar] [CrossRef]
  27. Lee, Y.L. Explicit analysis for the ground-support interaction of a circular tunnel excavation in anisotropic stress fields. J. Chin. Inst. Eng. 2019, 43, 13–26. [Google Scholar] [CrossRef]
  28. De La Fuente, M.; Taherzadeh, R.; Sulem, J.; Nguyen, X.S.; Subrin, D. Applicability of the Convergence-Confinement Method to Full-Face Excavation of Circular Tunnels with Stiff Support System. Rock Mech. Rock Eng. 2019, 52, 2361–2376. [Google Scholar] [CrossRef]
  29. Oreste, P.; Hedayat, A.; Spagnoli, G. Effect of Gravity of the Plastic Zones on the Behavior of Supports in Very Deep Tunnels Excavated in Rock Masses. Int. J. Geomech. 2019, 19, 04019107. [Google Scholar] [CrossRef]
  30. Hoek, E.; Brown, E.T. Underground Excavations in Rock; Institution of Mining and Metallurgy: London, UK, 1980; ISBN 9780429178122. [Google Scholar]
  31. Basarir, H.; Genis, M.; Ozarslan, A. The analysis of radial displacements occurring near the face of a circular opening in weak rock mass. Int. J. Rock Mech. Min. Sci. 2010, 47, 771–783. [Google Scholar] [CrossRef]
  32. González-Nicieza, C.; Álvarez-Vigil, A.E.; Menéndez-Díaz, A.; González-Palacio, C. Influence of the depth and shape of a tunnel in the application of the convergence–confinement method. Tunn. Undergr. Space Technol. 2008, 23, 25–37. [Google Scholar] [CrossRef]
  33. Oreste, P.P.; Pella, D. Modelling progressive hardening of shotcrete in convergence-confinement approach to tunnel design. Tunn. Undergr. Space Technol. 1997, 12, 425–431. [Google Scholar] [CrossRef]
  34. Oreste, P.P.; Peila, D. Radial passive rockbolting in tunnelling design with a new convergence-confinement model. Int. J. Rock Mech. Min. Sci. Geomech. Abstr. 1996, 33, 443–454. [Google Scholar] [CrossRef]
  35. Regulation for Testing the Physical and Mechanical Properties of Rock—Part 20: Test for Determining the Strength of Rock in Triaxial Compression. Available online: https://kns.cnki.net/kcms/detail/detail.aspx?dbcode=SCHF&dbname=SCHF&filename=SCHF201907216&uniplatform=NZKPT&v=mUzF6YZFkG_IqrMzThtGHwg3CMhC-KJzwqoiF7SVoCehKjgOKZlgeqHHKToQcy6a (accessed on 24 October 2021).
  36. Hoek, E.; Diederichs, M.S. Empirical estimation of rock mass modulus. Int. J. Rock Mech. Min. Sci. 2006, 43, 203–215. [Google Scholar] [CrossRef]
  37. Peng, J.; Rong, G.; Wang, X. An empirical model for determination of mi in Hoek−Brown failure criterion for intact rocks. J. Cent. South Univ. (Sci. Technol.) 2013, 44, 4617–4623. [Google Scholar]
  38. Yuan, L.; Xue, J.; Liu, Q. Surrounding rock stability control theory and support technique in deep rock roadway for coal mine. J. China Coal Soc. 2011, 36, 535–543. [Google Scholar]
  39. Zhang, C.; Feng, X.; Zhou, H. Study of some problems about application of stress release method to tunnel excavation simulation. Rock Soil Mech. 2008, 29, 31–37. [Google Scholar] [CrossRef]
  40. Zhu, Y.; Chen, L.; Zhang, H.; Zhou, Z.; Chen, S. Physical and Mechanical Characteristics of Soft Rock Tunnel and the Effect of Excavation on Supporting Structure. Appl. Sci. 2019, 9, 1517. [Google Scholar] [CrossRef] [Green Version]
Figure 1. Joint spacing and joint angle of rock mass.
Applsci 12 00253 g001
Figure 2. Two-dimensional visualization of the GSI system.
Applsci 12 00253 g002
Figure 3. Strain-softening behavior of plutons: (a) Roadway surrounding rock zoning; (b) The simplified piecewise linear strain-softening model.
Applsci 12 00253 g003
Figure 4. Stress release process in shaft excavation.
Applsci 12 00253 g004
Figure 5. Characteristic curves of the wall rock and supporting structure.
Applsci 12 00253 g005
Figure 6. Test specimens and experimental setup.
Applsci 12 00253 g006
Figure 7. Triaxial testing of tuffaceous mudstone under different confining pressures.
Applsci 12 00253 g007
Figure 8. Model curves and test curves of tuffaceous mudstone under different confining pressures: (a) σ3 = 0 MPa; (b) σ3 = 1 MPa; (c) σ3 = 3 MPa; (d) σ3 = 7 MPa.
Applsci 12 00253 g008
Figure 9. Vertical shaft excavation and supporting process: (a) design of well circle support; (b) design of support for well circle and anchor rod; (c) design of well circle, anchor rod, and concrete support.
Applsci 12 00253 g009
Figure 10. The numerical model; (a) Model size picture; (b) Model longitudinal section boundary conditions; (c) Model transverse section boundary conditions.
Applsci 12 00253 g010
Figure 11. Characteristic curve of the surrounding rock support action.
Applsci 12 00253 g011
Figure 12. Damaged support structures: (a) local failure of the shaft wall; (b) well wall extensibility destruction; (c) systematic damage of the supporting structure.
Applsci 12 00253 g012
Figure 13. Surrounding rock-supporting interaction curves.
Applsci 12 00253 g013
Figure 14. Timescale change of support structure convergence.
Applsci 12 00253 g014
Table 1. Compression test results for tuffaceous mudstone.
Confining Pressureσ3/MPaσ3 = 0σ3 = 1σ3 = 3σ3 = 7
Peak stress/MPa4.1565.5348.39914.305
Peak strain/10−20.8751.2892.0683.882
Residual stress/MPa0.7091.7873.8128.051
residual strain/10−21.6684.1486.13410.115
Table 2. Rock mass material parameters mi and mb.
Confining Pressure σ3/MPa0137
mi10.009.679.088.02
mb2.402.312.171.92
Table 3. Parameters of the strain-softening model for jointed rock mass.
GSIPGSIrSP
(10−3)
Sr
(10−3)
Dσc
(MPa)
E
(GPa)
φ
(°)
vC
(MPa)
η*
(10−3)
603311.740.5804.1564.4260.252.219
Table 4. Ground stress test results at the −600 m level of the shaft face.
The Depth of Measuring Point/mσH/MPaσh/MPaσv/MPaαH/(°)
2135.2328.2225.6185
2435.3028.2625.8283
Table 5. Shaft-surrounding rock model parameters.
Peak ParameterResidual Parameters
σc/MPa4.24.2
GSI6033
c/MPa2.21.4
φ2618
E/GPa4.44.4
Ψ00
v0.250.25
Pv2626
PH3636
Ph2929
Table 6. Initial support design.
Well CircleResin Anchor Rod (End Anchor)Concrete
Shed Distance d1
(m)
Diameter Φ
(mm)
Length L
(m)
Row Spacing d2 × d3
(m)
Thickness t
(mm)
Original plan one1.522.02.51.0 × 1.2600 (C30)
Original plan two1.222.02.51.0 × 1.2700 (C30)
Table 7. Characteristic curve parameters of the supporting structure.
Pmax
(MPa)
K/
(MPa·m−1)
umax/
(mm)
E/
(GPa)
Well ring (No.28 A-shaped I-beam)0.2923031210
Anchor rod0.3112150180
High-strength anchor0.4625220220
ConcreteC30t = 600 mm2.4810232830
t = 700 mm2.8812142930
C35t = 700 mm3.3612752631.5
Table 8. Optimized support design scheme.
Initial SupportSecondary Support
Resin Anchor Rod (End Anchor)Well CircleConcrete
Diameter Φ
(mm)
Row Spacing d2 × d3
(m)
Length L
(m)
Shed Distance d1
(m)
Thickness t
(mm)
Original plan one22.01.0 × 1.22.51.5600 (C30)
Original plan two22.01.0 × 1.22.51.2700 (C30)
High-strength anchor cable (steel strand)Well circleConcrete
Diameter Φ (mm)Row spacing d2 × d3 (m)Length
L1 (m)
Length of anchoring section L2 (m)Shed distance d1
(m)
Thickness t
(mm)
Optimization plan one22.01.0 × 1.28.031.5600 (C30)
Optimization plan two22.01.0 × 1.08.031.2700 (C35)
Publisher’s Note: MDPI stays neutral with regard to jurisdictional claims in published maps and institutional affiliations.

