1. Introduction
The construction of urban underground spaces is developing rapidly in China, especially the subway rail transit, which has built 22 lines. The subway stations were designed and demonstrated to have good mechanical properties during the construction process. However, the damage phenomenon observed during the Kobe earthquake in 1995 [
1], the Chi-Chi earthquake in 1999, and the Wenchuan earthquake in 2008 [
2] indicated that the damage degree of underground structures caused by an earthquake is much higher than that of surface structures. The heaviest damaged one—Daikai station—suffered the total collapse of central columns over a length of 80 m. Furthermore, the station collapse resulted in ground settlement of 2.5 m. Therefore, the seismic study of underground structures is crucial [
3,
4,
5].
Many scholars began to focus on the damage mechanism of subway stations represented by Daikai Station [
6,
7,
8], and also showed the necessity of the seismic design of underground structures. For the study of the collapse and destruction disaster of the cast-in-place station, the two-dimensional numerical model was used to analyze the mechanical properties, which showed that the collapse of the station was caused by the shear failure of the central column [
9,
10,
11]. Since the two-dimensional model can only consider the middle column as a continuous wall, it cannot reproduce the collapse process of the Daikai station. A 3D finite element numerical analysis was used to simulate reinforced concrete structure, analyze the collapse mechanism of Daikai station, and reproduce the failure process [
6,
12,
13]. Numerous analyses and investigations found that the center column was the weak location of the cast-in-place frame underground structure [
14,
15,
16]. Many scholars carried out a large number of seismic design studies of the center column by installing isolation bearings to absorb seismic energy or changing the constraint conditions [
17]. At present, the commonly used bearings mainly include rubber bearings and sliding bearings [
18,
19,
20,
21]. Up to now, the research on seismic design of cast-in-place station structures has been very detailed.
However, the construction method of cast-in-place structures has a significant influence on the environment. Meanwhile, winter construction can face a shutdown period and reduce efficiency. The construction method of fabricated structures can obviously change these situations and conform to the social and economic strategy of energy conservation, environmental protection, and sustainable development. The construction method was successfully applied in constructing subway stations in Germany, Russia, and other countries. The Kyoqiao station of the JR Kyoye Line in Japan was built using double-circle shield tunneling. The Platinum station of Tokyo Line 7 was constructed using triple-circle shield tunneling [
22,
23,
24]. The Jiangtai Station in Beijing was built using single-circle large-diameter shield tunneling and PBA [
25,
26,
27]. In recent years, China has been speeding up the construction of prefabricated station structures. Five underground stations, including Yuanjiadian station [
28] and Hongqi Street Station, were assembled and constructed in Changchun Metro Line 2. Although prefabricated station structures are in full swing, the seismic design of fabricated station structures is still lacking. Li and Su [
29,
30] conducted axial bending test research on the connected joints of prefabricated components and found that the initial stiffness of the joints was large and the flexural stiffness increased with the increase of axial force. Taking Yuanjiadian station structure as the research object, Tao and Ding [
31,
32,
33] comparatively studied the differences in internal force and deformation between the fabricated and cast-in-place structures through experimental and numerical analyses. The fabricated station structure has better energy dissipation capacity than the cast-in-place station structure, but the lateral deformation resistance is weak. Although some scholars have conducted seismic research on fabricated station structures, the existing literature [
29,
30,
31,
32,
33] does not give any research results about the weak locations and joints of fabricated station structures.
Based on the projects of Yuanjiadian station in Changchun, Fuchunjiang Road Station in Qingdao, and Longxing station in Shenzhen, China, three-dimensional finite element models of fabricated single-ring station structures assembled with seven, five, and four prefabricated components was proposed in the study. The plastic strain, interlayer relative deformation, and internal force were investigated. The joint damage index and residual strength index were offered based on the concrete damage index to evaluate the joints’ damage degree. The dynamic time history method was used to compare and analyze the dynamic response characteristics of the fabricated station structure with different joint distribution forms. The effect of the vertical seismic component on the joint damage degree of the fabricated station was studied based on the proposed evaluation method. The research provides scientific evidence for the seismic design and reinforcement of the prefabricated subway station.
2. Three-Dimensional Viscoelastic Boundary and Verification
2.1. Three-Dimensional Viscoelastic Boundary
The viscoelastic boundary could simulate the elastic recovery effect of a far-field foundation and had good stability under the action of seismic waves with low frequency and high frequency in previous studies [
34,
35,
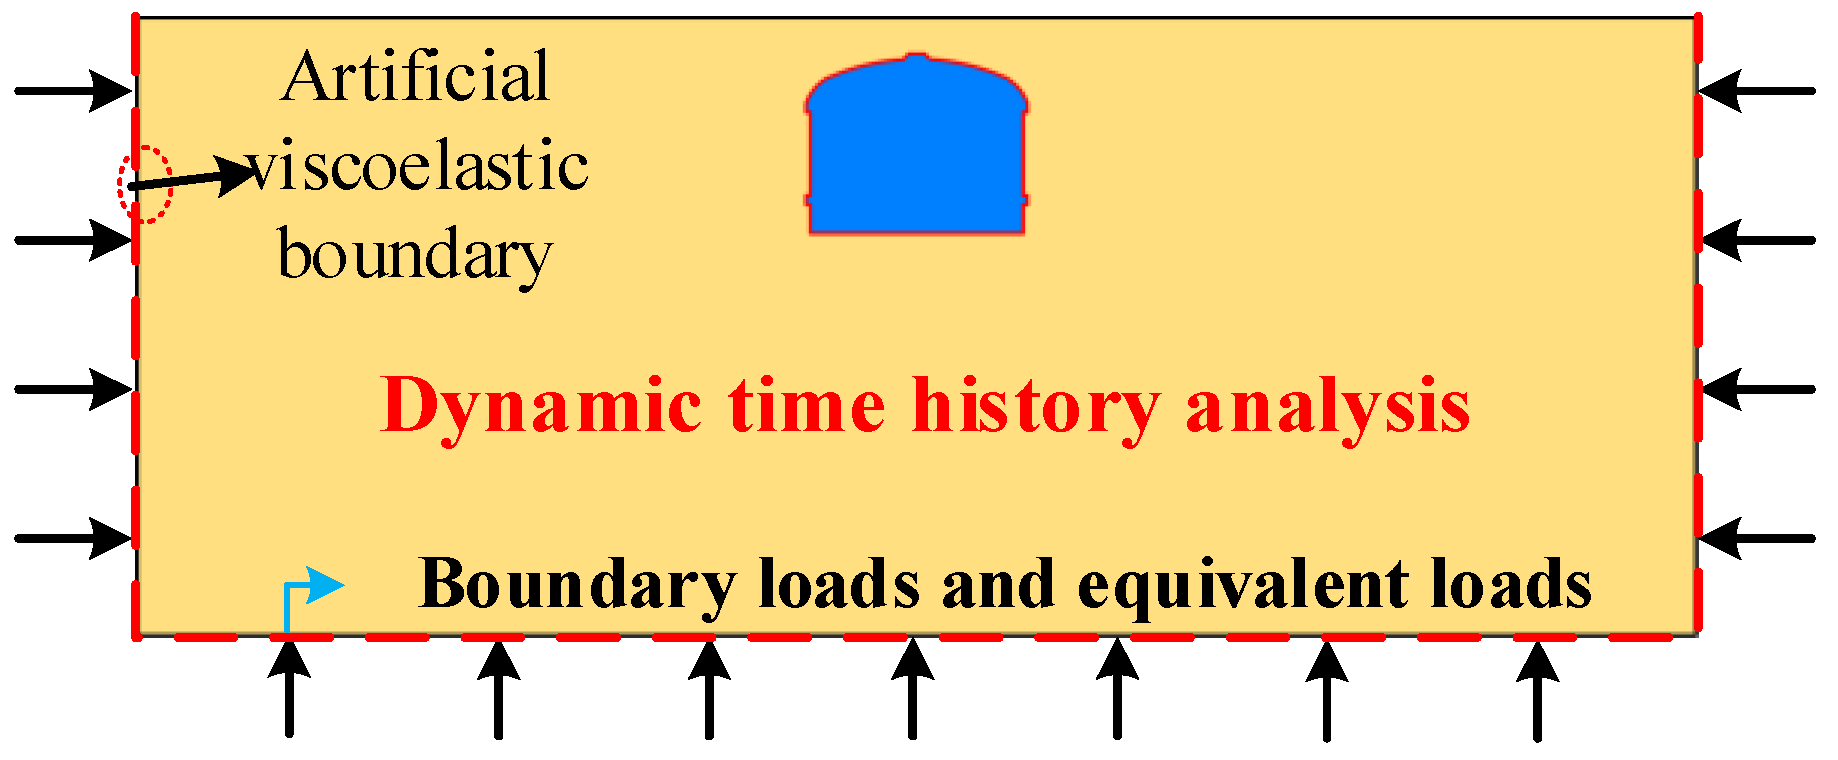
36]. In the seismic analysis of underground structures, the finite soil range is usually cut off and a reasonable artificial boundary is set to simulate the seismic reflection and damping effect of an infinite foundation. The equivalent nodal force of an artificial boundary and artificial viscoelastic boundary are combined, and the application of an equivalent nodal force on the artificial boundary is realized. The key to the artificial viscoelastic boundary is to choose a proper spring stiffness and damping coefficient.
K and
C are the spring stiffness and damping coefficients, respectively, which can be expressed as follows according to Liu and He’s research [
35,
37].
In the tangential direction:
In the normal direction:
where
KBN,
KBT,
CBN, and
CBT are the spring stiffness and damping coefficients in the normal and tangential directions of the artificial boundary when the influence area of the boundary node is 1.
E,
G, and
are the elastic modulus, shear modulus, and Poisson’s ratio of the far-field foundation;
and
are lame constants of the far-field foundation;
is the mass density of the far-field foundation;
R is the distance from the scattered wave source to the artificial boundary.
and
are the compression wave and shear wave velocities of the far-field foundation. The parameters
,
A, and
B, are 1.33, 0.67, 0.9, and 1.1, respectively.
2.2. Verification of the Artificial Viscoelastic Boundary
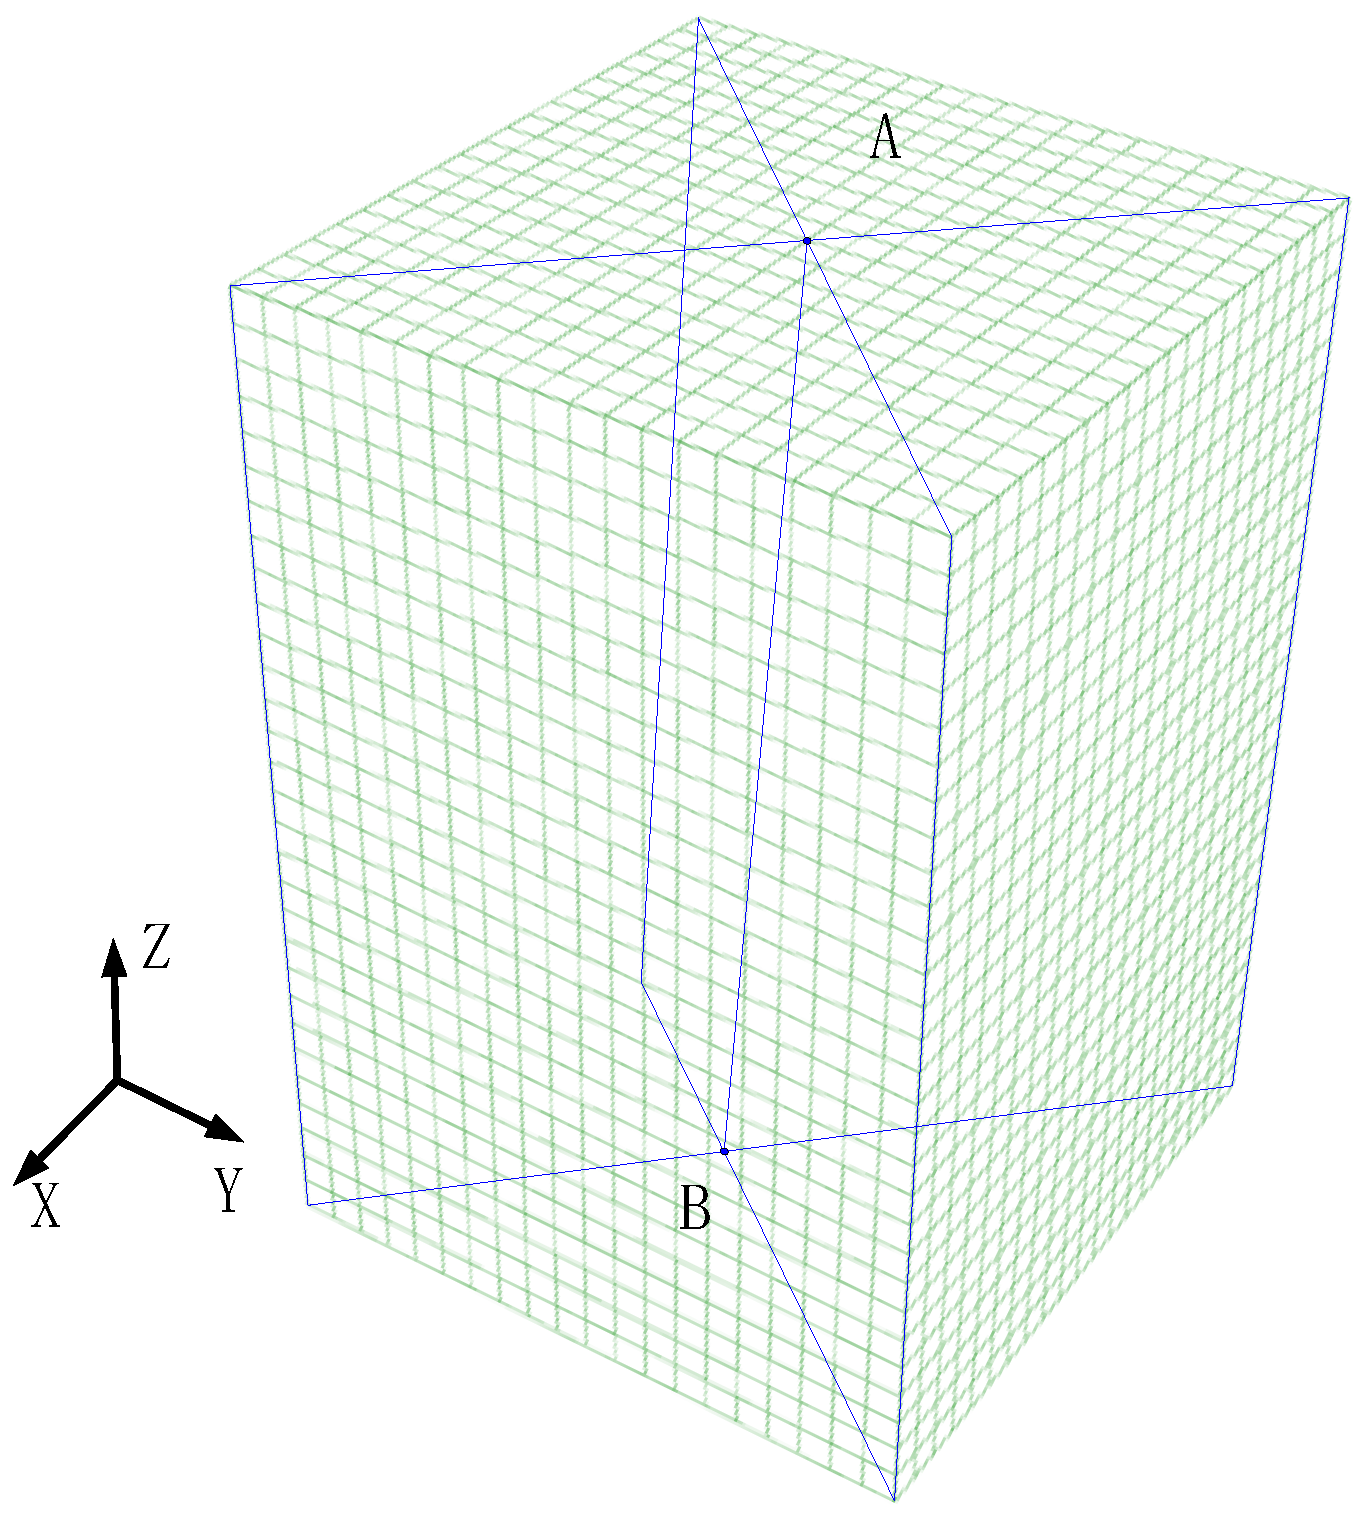
In the validation example of the artificial viscoelastic boundary, a 3D uniform semi-infinite elastic FE model is illustrated in
Figure 1. Point A is the midpoint of the top boundary and point B is the midpoint of the bottom boundary.
A finite area of 400 m in length and width and 600 m in height was cut from a uniform three-dimensional elastic half-space. The elastic modulus of the model was 4.88 GPa, the density was 2000 kg/m
3, and Poisson’s ratio was 0.22. The incident
p-wave velocity was 1669.05 m/s and the S-wave velocity was 1000 m/s. The time step was taken as 0.01 s. The grid size was 20 m in three directions, with 13,671 nodes and 12,000 hexahedral cells. In the numerical analysis, the input of seismic waves was implemented into ABAQUS [
38] using a displacement time history. The displacement time history of the Dirac impulse function was imposed on the bottom boundary of the model. The displacement time history of the Dirac impulse function can be expressed as:
where
,
,
, and
is the Heaviside function.
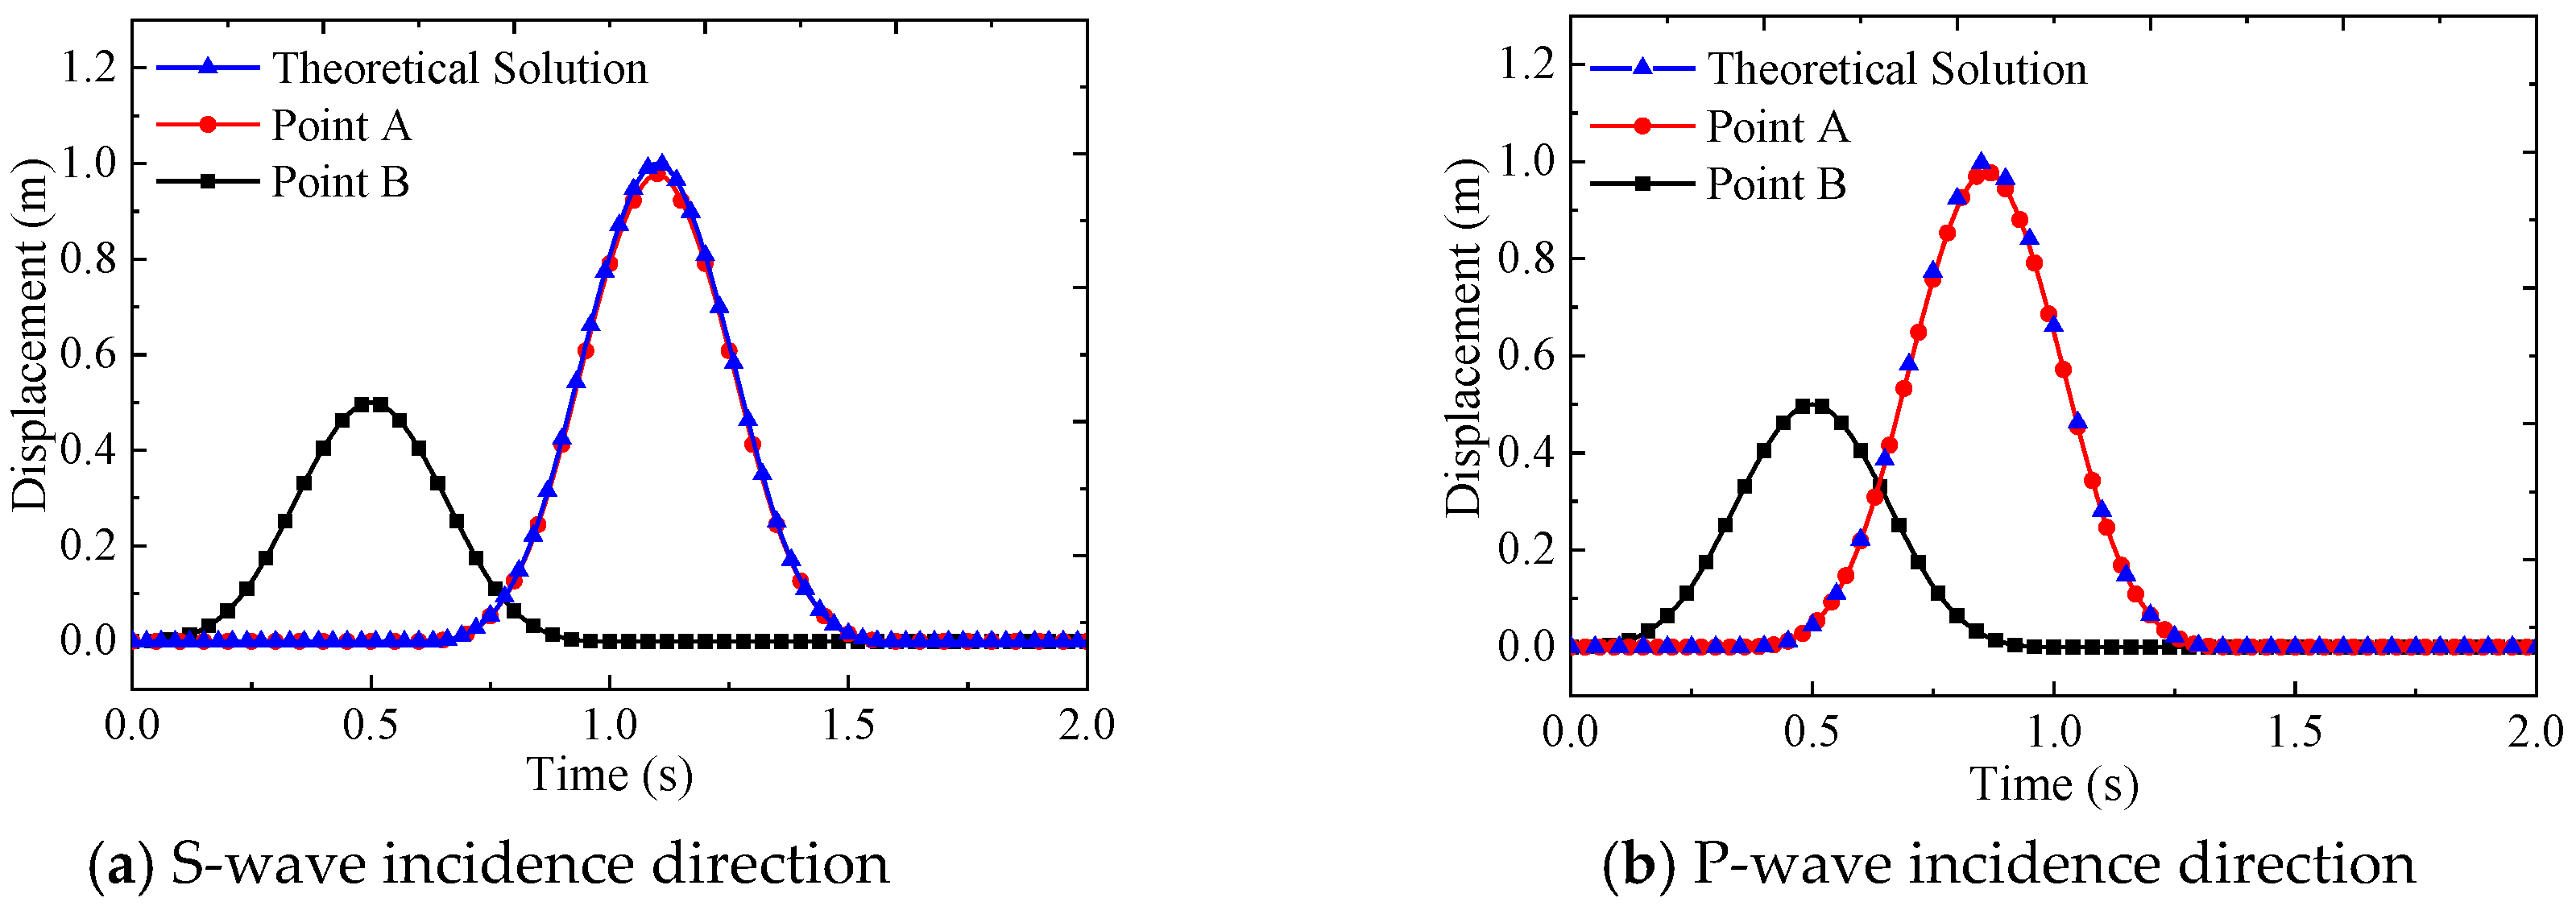
The calculated and theoretical values for points A and B are given in
Figure 2. The numerical and theoretical solutions were compared for each condition, and the results showed that they were very consistent. The time history and amplitude of the S and P waves in the numerical verification were pretty accurate, which showed the validity of the wave input method used in this study.
3. Structure Introduction and Ground Motion Input
3.1. Structure Introduction
Three FE models of underground structures were employed with three kinds of joint distribution forms and were simulated using the fabricated station structure under construction or already built. The first fully prefabricated subway station, namely, Yuanjidian Station [
28], Changchun city, Jilin province, China, is a single-arch double-layer horseshoe structure with a cover depth of 3.5 m, a total width of 20.5 m, and a total height of 17.45 m. The standard ring width of the station structure is 2 m and was assembled using seven precast components. The physical and mechanical parameters of the structures and soil are shown in
Table 1 and
Table 2.
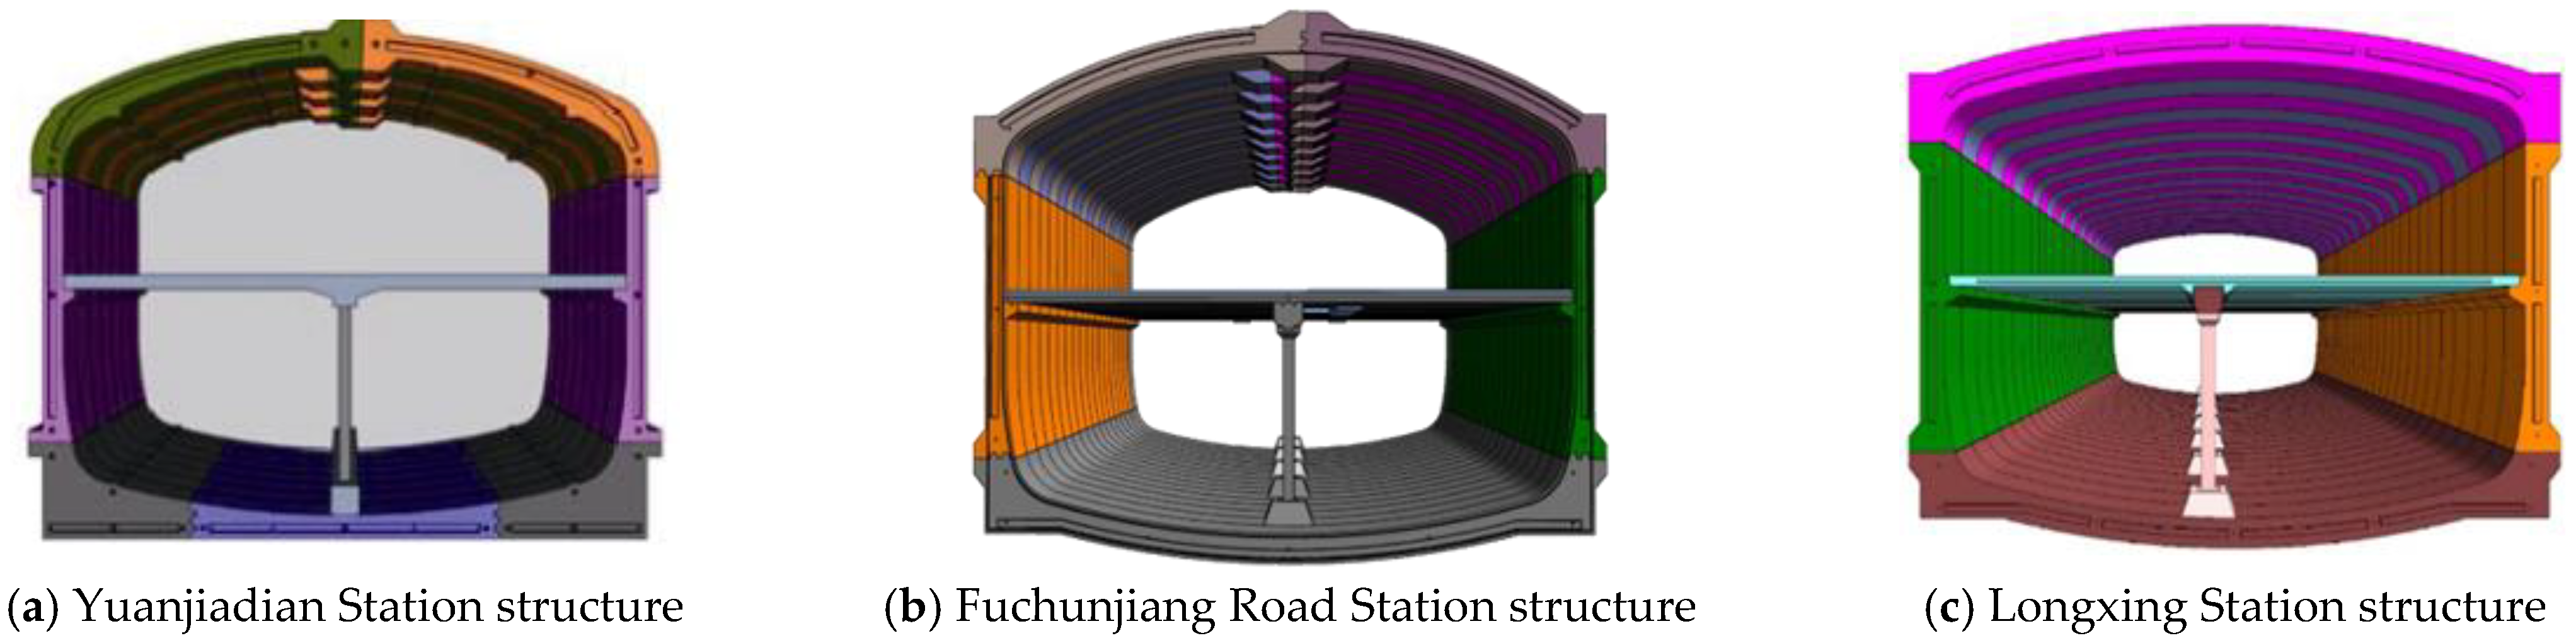
Qingdao metro station, China, was optimized and adjusted based on the prefabricated scheme of Changchun metro, as shown in
Figure 3a. The mainlining structure was composed of five precast components, among which, the bottom plate was adjusted from three to one, as shown in
Figure 3b. The design of Longxing Station of Shenzhen Metro, China, made use of further optimization based on the assembled scheme of Qingdao metro. The two components of the vault were adjusted to one, and the single ring structure was assembled using only four large prefabricated components, as shown in
Figure 3c. The construction process [
28] of Yuanjidian Station is shown in
Figure 4. The sizes of the three models are not exactly the same. However, in order to focus on the impact of the connecting joints of the vault and the bottom plate on the seismic response of the fabricated station structure, the size of Changchun subway station was taken as the prototype to model Qingdao Subway Station and Shenzhen Subway Station. The fabricated station structure is composed of single ring structures assembled using reinforcement bundles. This study only focused on the lateral seismic response of the single-ring structure and did not consider the longitudinal seismic response of the station structure.
3.2. The 3D Finite Element Models of Fabricated Station Structures
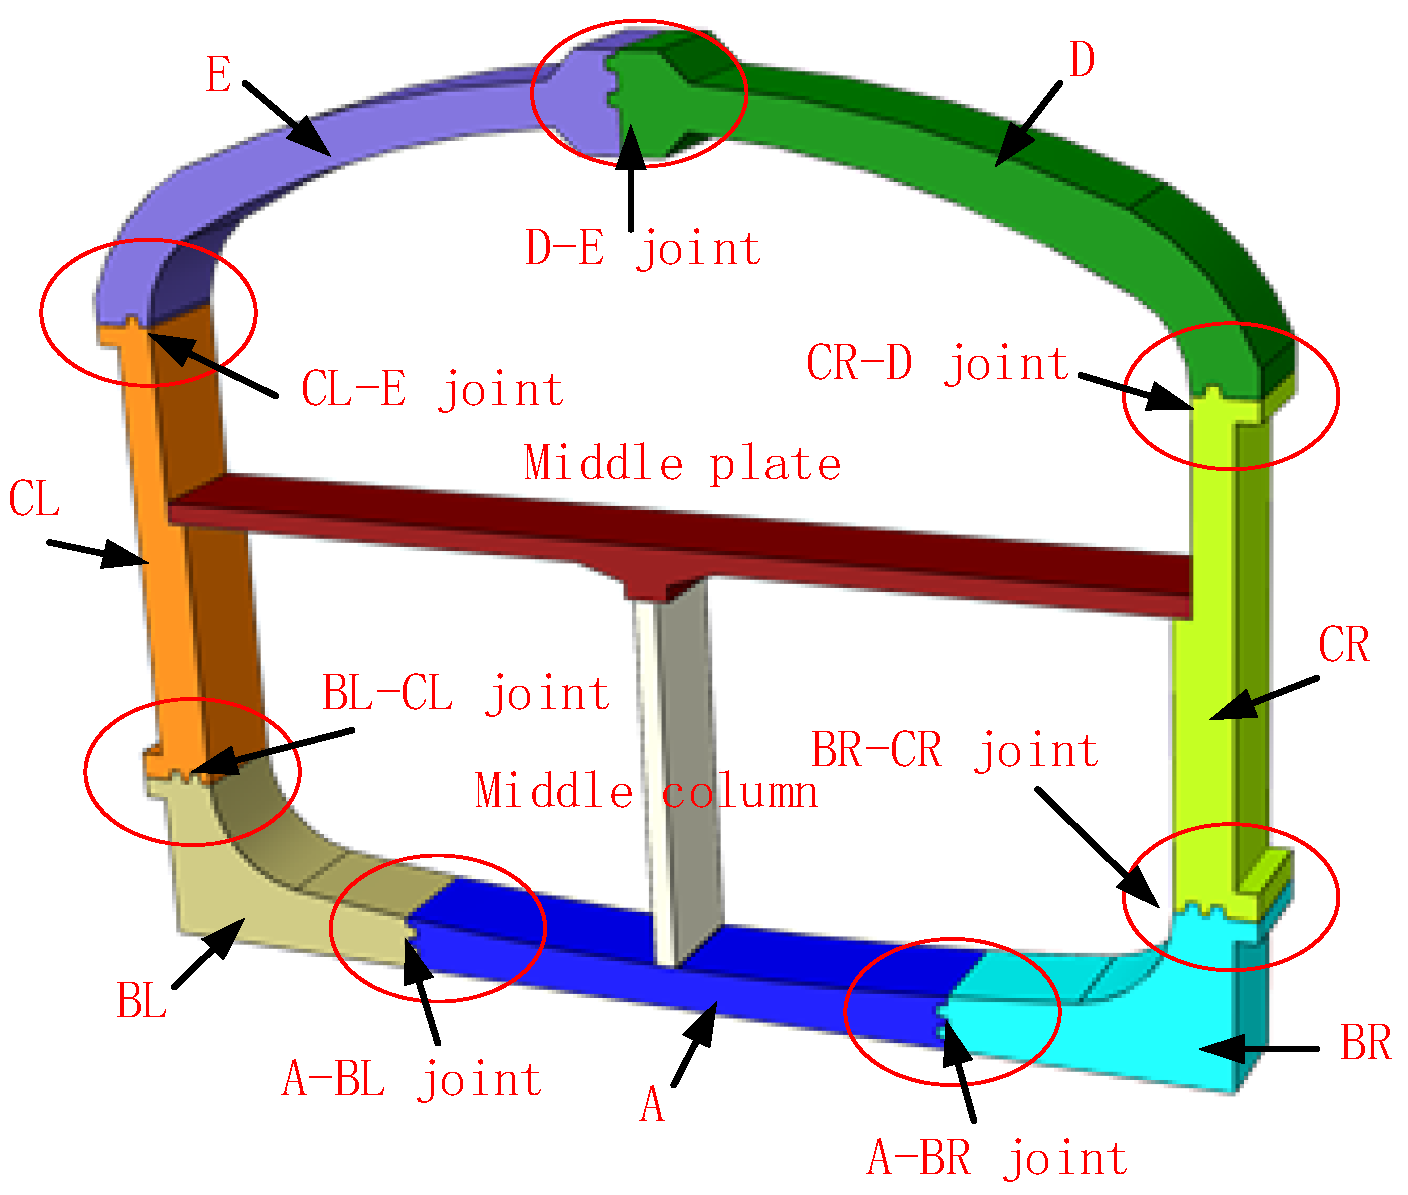
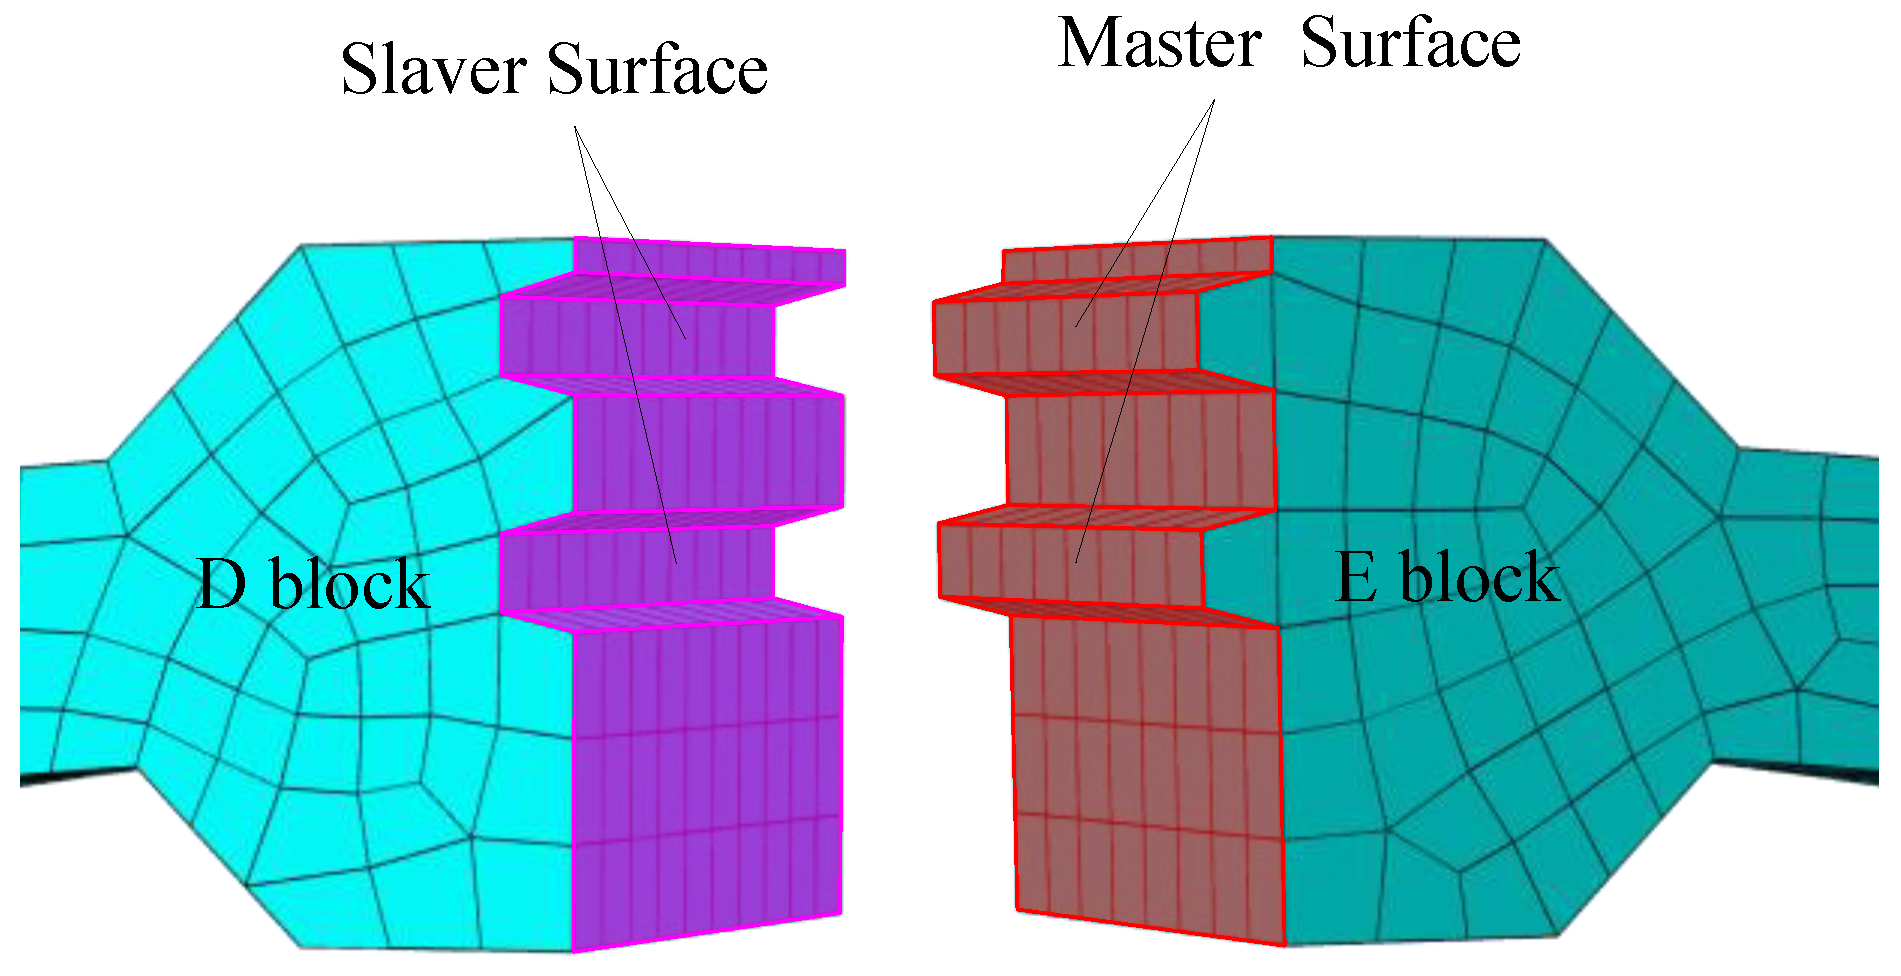
The three-dimensional finite element model of the soil–subway station structure system was established in ABAQUS. In order to pay attention to the influence of joint distributions on the fabricated station structure, the finite element model of Changchun Yuanjiadian station (defined as the CC model) was first established. Then, the contact surface of prefabricated blocks A and B was simulated with the “Tie” feature in Fuchunjiang Road Station of Qingdao (defined as the QD model). Finally, the “Tie” feature was used to simulate Shenzhen Longxing Station (defined as the SZ model) regarding the contact surface of the prefabricated blocks D and E. The CC model was used as the fundamental model, where its finite element model and prefabricated components are shown in
Figure 5. The station’s main body is a single-arch and double-layer horseshoe structure, with a total width of 20.5 m and a total height of 17.45 m. The standard ring width of the station structure is 2 m, and the single ring structure is assembled from seven blocks of A, B (left BL, right BR), C (left CL, right CR), D, and E blocks. The connection joints of the prefabricated components mainly include three parts: vault joint (D–E joint), bottom plate joints (A–BR joint, A–BL joint), and sidewall joints (BR–CR joint, BL–CL joint, CR–D joint, CL–E joint).
The hexahedral C3D8R (three-dimensional eight-node hexahedron reduced integration) element was used in the finite model of structure and soil. The thickness of the fabricated station structure was 2 m, and the damping ratio of the structure was ignored. According to the position and size of the station in the soil, the depth of the intercepted soil model was 60 m, the width of the soil was more than three times that of the station structure, and the width of the intercepted soil model was 150 m. In order to ensure calculation accuracy and efficiency, the mesh size of the soil and structure should meet the requirements:
where
is the maximum size of the grid,
is the minimum shear wave velocity, and
is the dominant frequency of the input seismic wave.
According to soil’s physical and mechanical parameters, the minimum shear wave velocity was 115 m/s, the maximum dominant frequency of input seismic wave was 3 Hz, and the maximum mesh size should be less than 4.8–6.4 m. According to previous research experience and computer performance, the size of the structure grid was 0.2 m, and the size of the soil grid was 0.5–2 m.
3.3. Contact Characteristics
The contact properties between the soil and the underground structure are not negligible when studying the seismic response of underground structures and are also widely used in the analysis of underground structures [
39,
40,
41]. More importantly, the prefabricated components of the fabricated station structure adopt dry-type connection joints, as shown in
Figure 6. The normal contact of prefabricated components adopts a “hard” contact, and the tangential contact adopts the Coulomb friction criterion.
According to Equation (6), when the tangential shear stress is greater than the critical shear stress of the contact interface, the contact surface will undergo relative sliding deformation:
where
is the normal contact stress of the contact surface and
μ is the friction coefficient of the contact surface, which is 0.2 [
29,
30,
42] for the contact surface of the prefabricated components and 0.4 [
43] for the contact surface of the structure and soil.
In order to ensure the accuracy of the boundary conditions and ground motion input, a three-dimensional viscoelastic artificial boundary was applied to the boundary of the soil finite element model, except for the top boundary. Based on such a modeling method, the finite element model is shown in
Figure 7.
3.4. The Constitutive Model Introduction of the Structure and Soil
(1) Constitutive model of the soil
Since this research focused on the dynamic characteristics of underground structures, the equivalent linearization method [
44] was adopted to consider the nonlinear behavior of soil under strong earthquakes. The same method was applied and verified by relevant studies [
45,
46]. Rayleigh damping was used to simulate the hysteresis characteristics and nonlinear characteristics of the soil under dynamic cyclic loading, and the damping matrix is shown in Equation (7), where
α0 and
α1 are the damping proportionality coefficients,
ζ is the damping ratio (5% in this study),
ωi is the ith order natural frequency of the soil layer, and
ωj is the maximum Fourier amplitude for the input ground motion. Related applications and validation are in [
47,
48].
(2) Constitutive model of the concrete
Concrete damage plastic (CDP) material is a material in the ABAQUS material library, which is used to describe the deformation behavior and strength characteristics of concrete. The CDP model is typical and widely used in the literature [
19,
39], and its stress–strain curve can be described using the damage factor and plastic strain. The CDP model parameters of the prefabricated components are shown in
Table 3.
3.5. Ground Motion Input
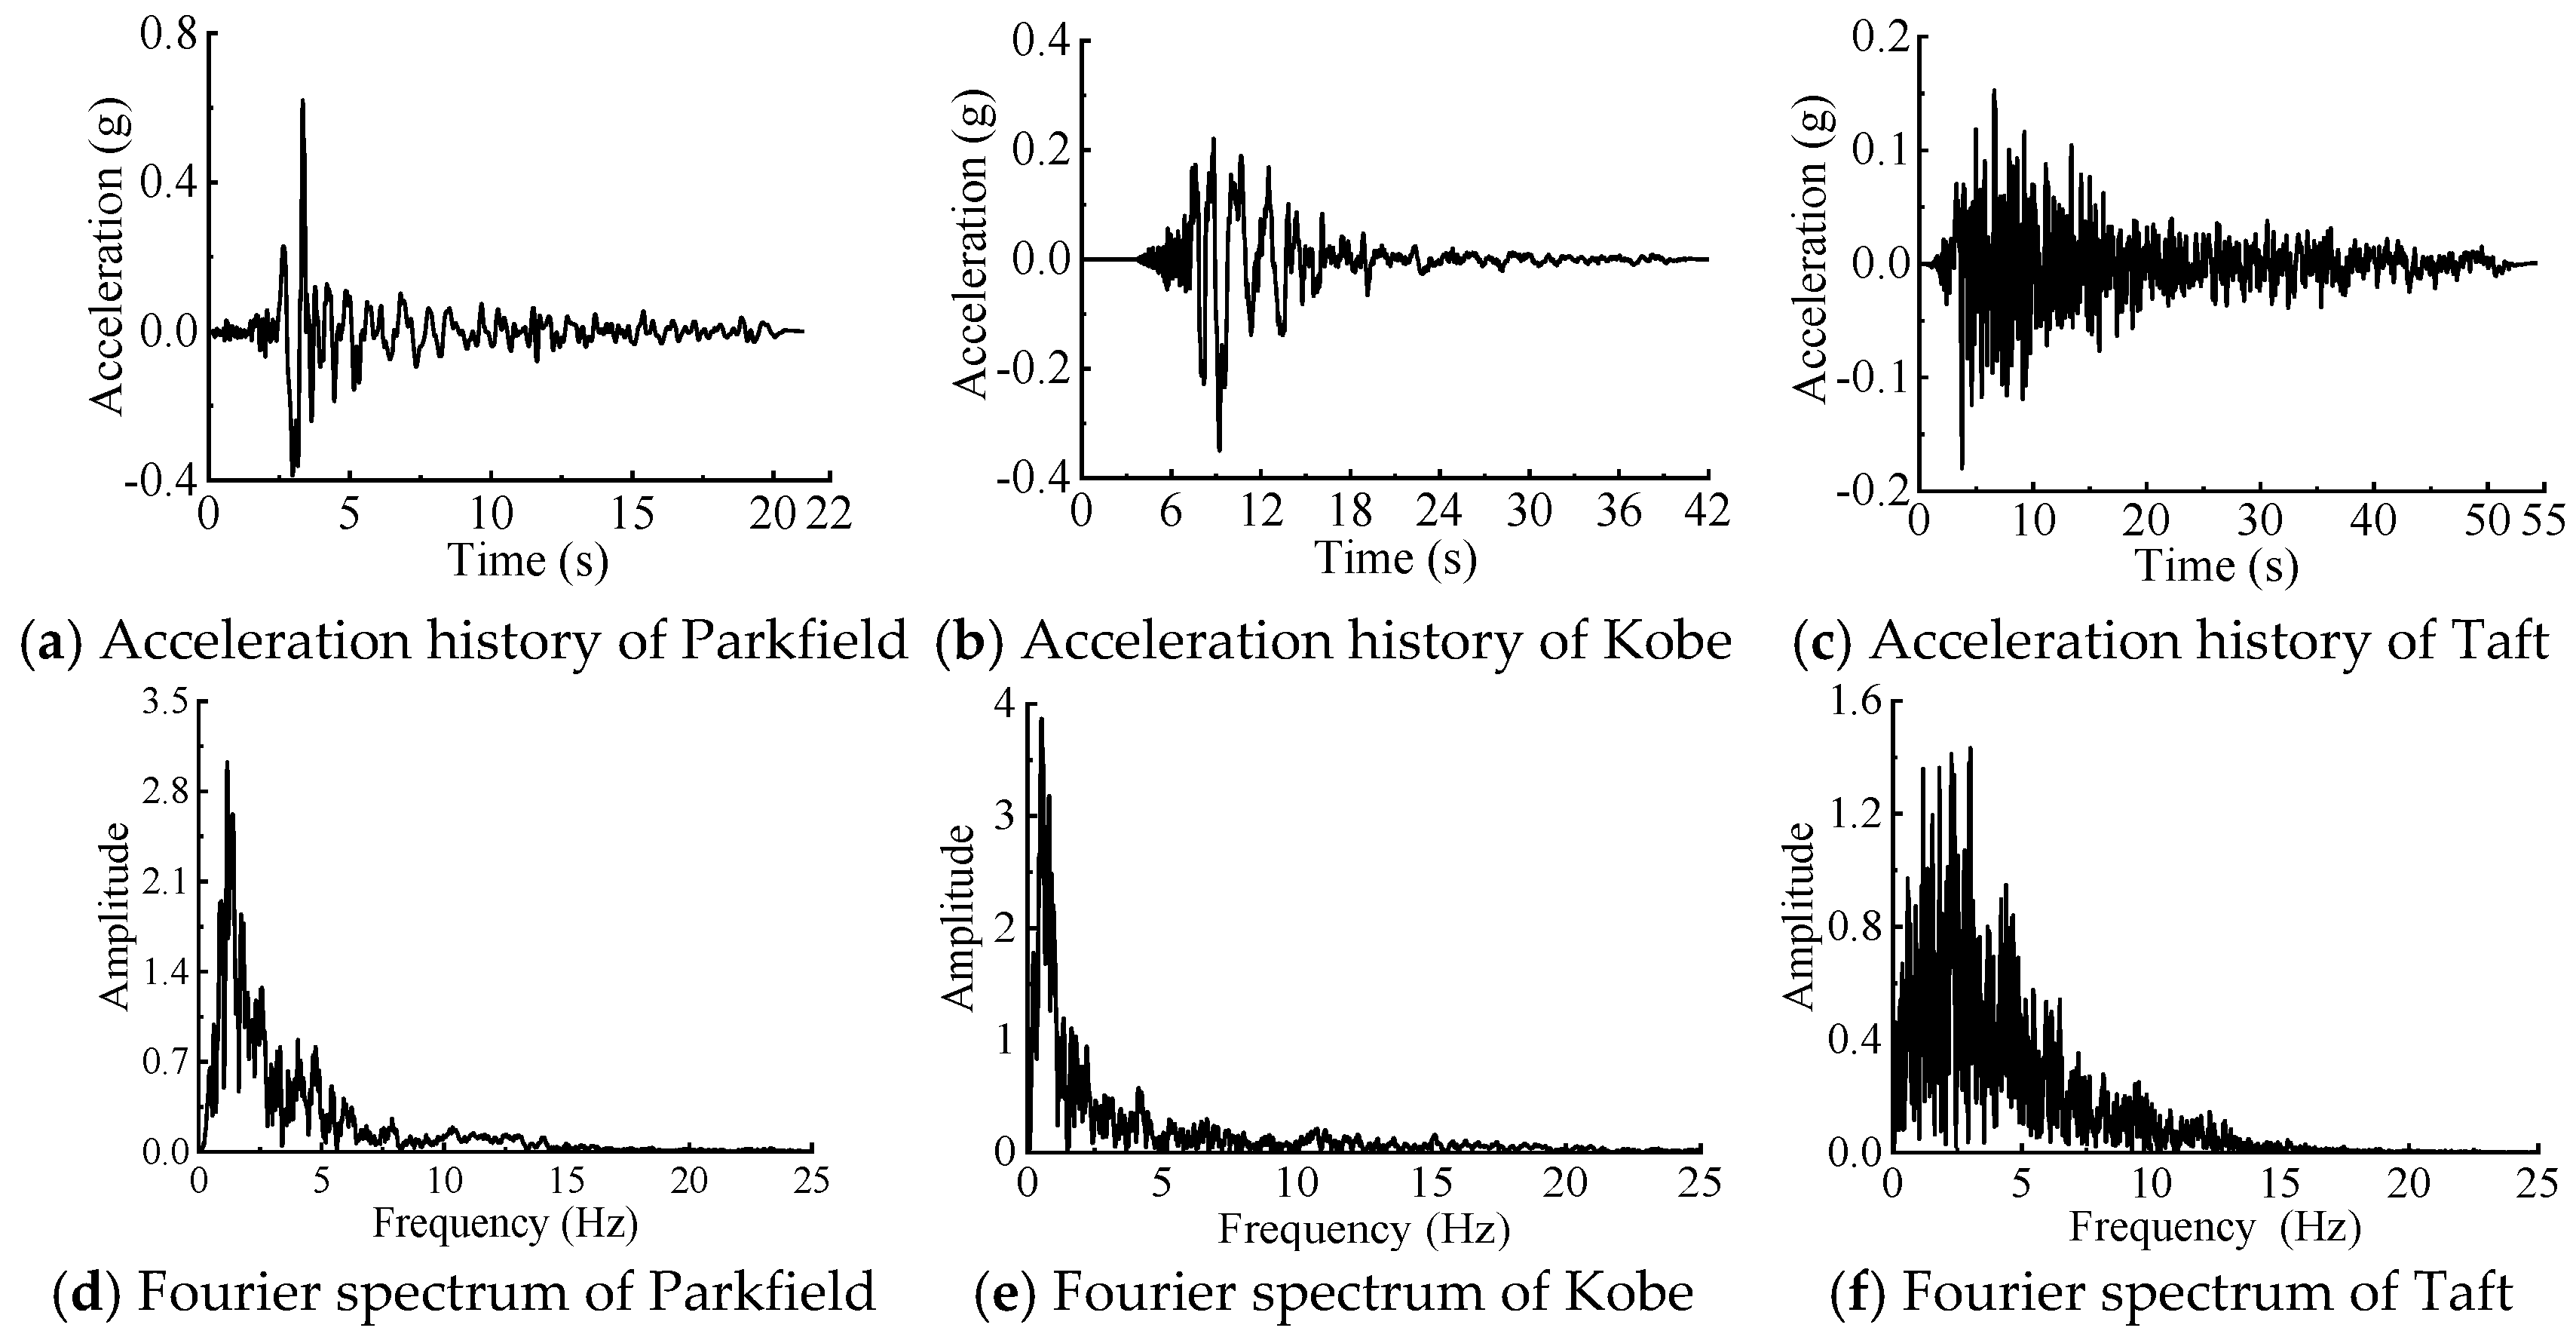
According to the soil characteristics of the site where the station is located, three real seismic waves from the PEER (Pacific Earthquake Engineering Research Center) were selected as the input ground motions, namely, the Parkfield wave, Kobe wave, and Taft wave. Usually, the peak acceleration of the vertical component is half to two-thirds of the peak acceleration of the horizontal component [
39]. The peak accelerations of different horizontal components (0.1 g, 0.2 g, 0.3 g) and seismic excitations in different directions were considered. The peak acceleration of the vertical component was two–thirds that of the horizontal component. The recorded seismic wave time history and Fourier spectrum are shown in
Figure 8.
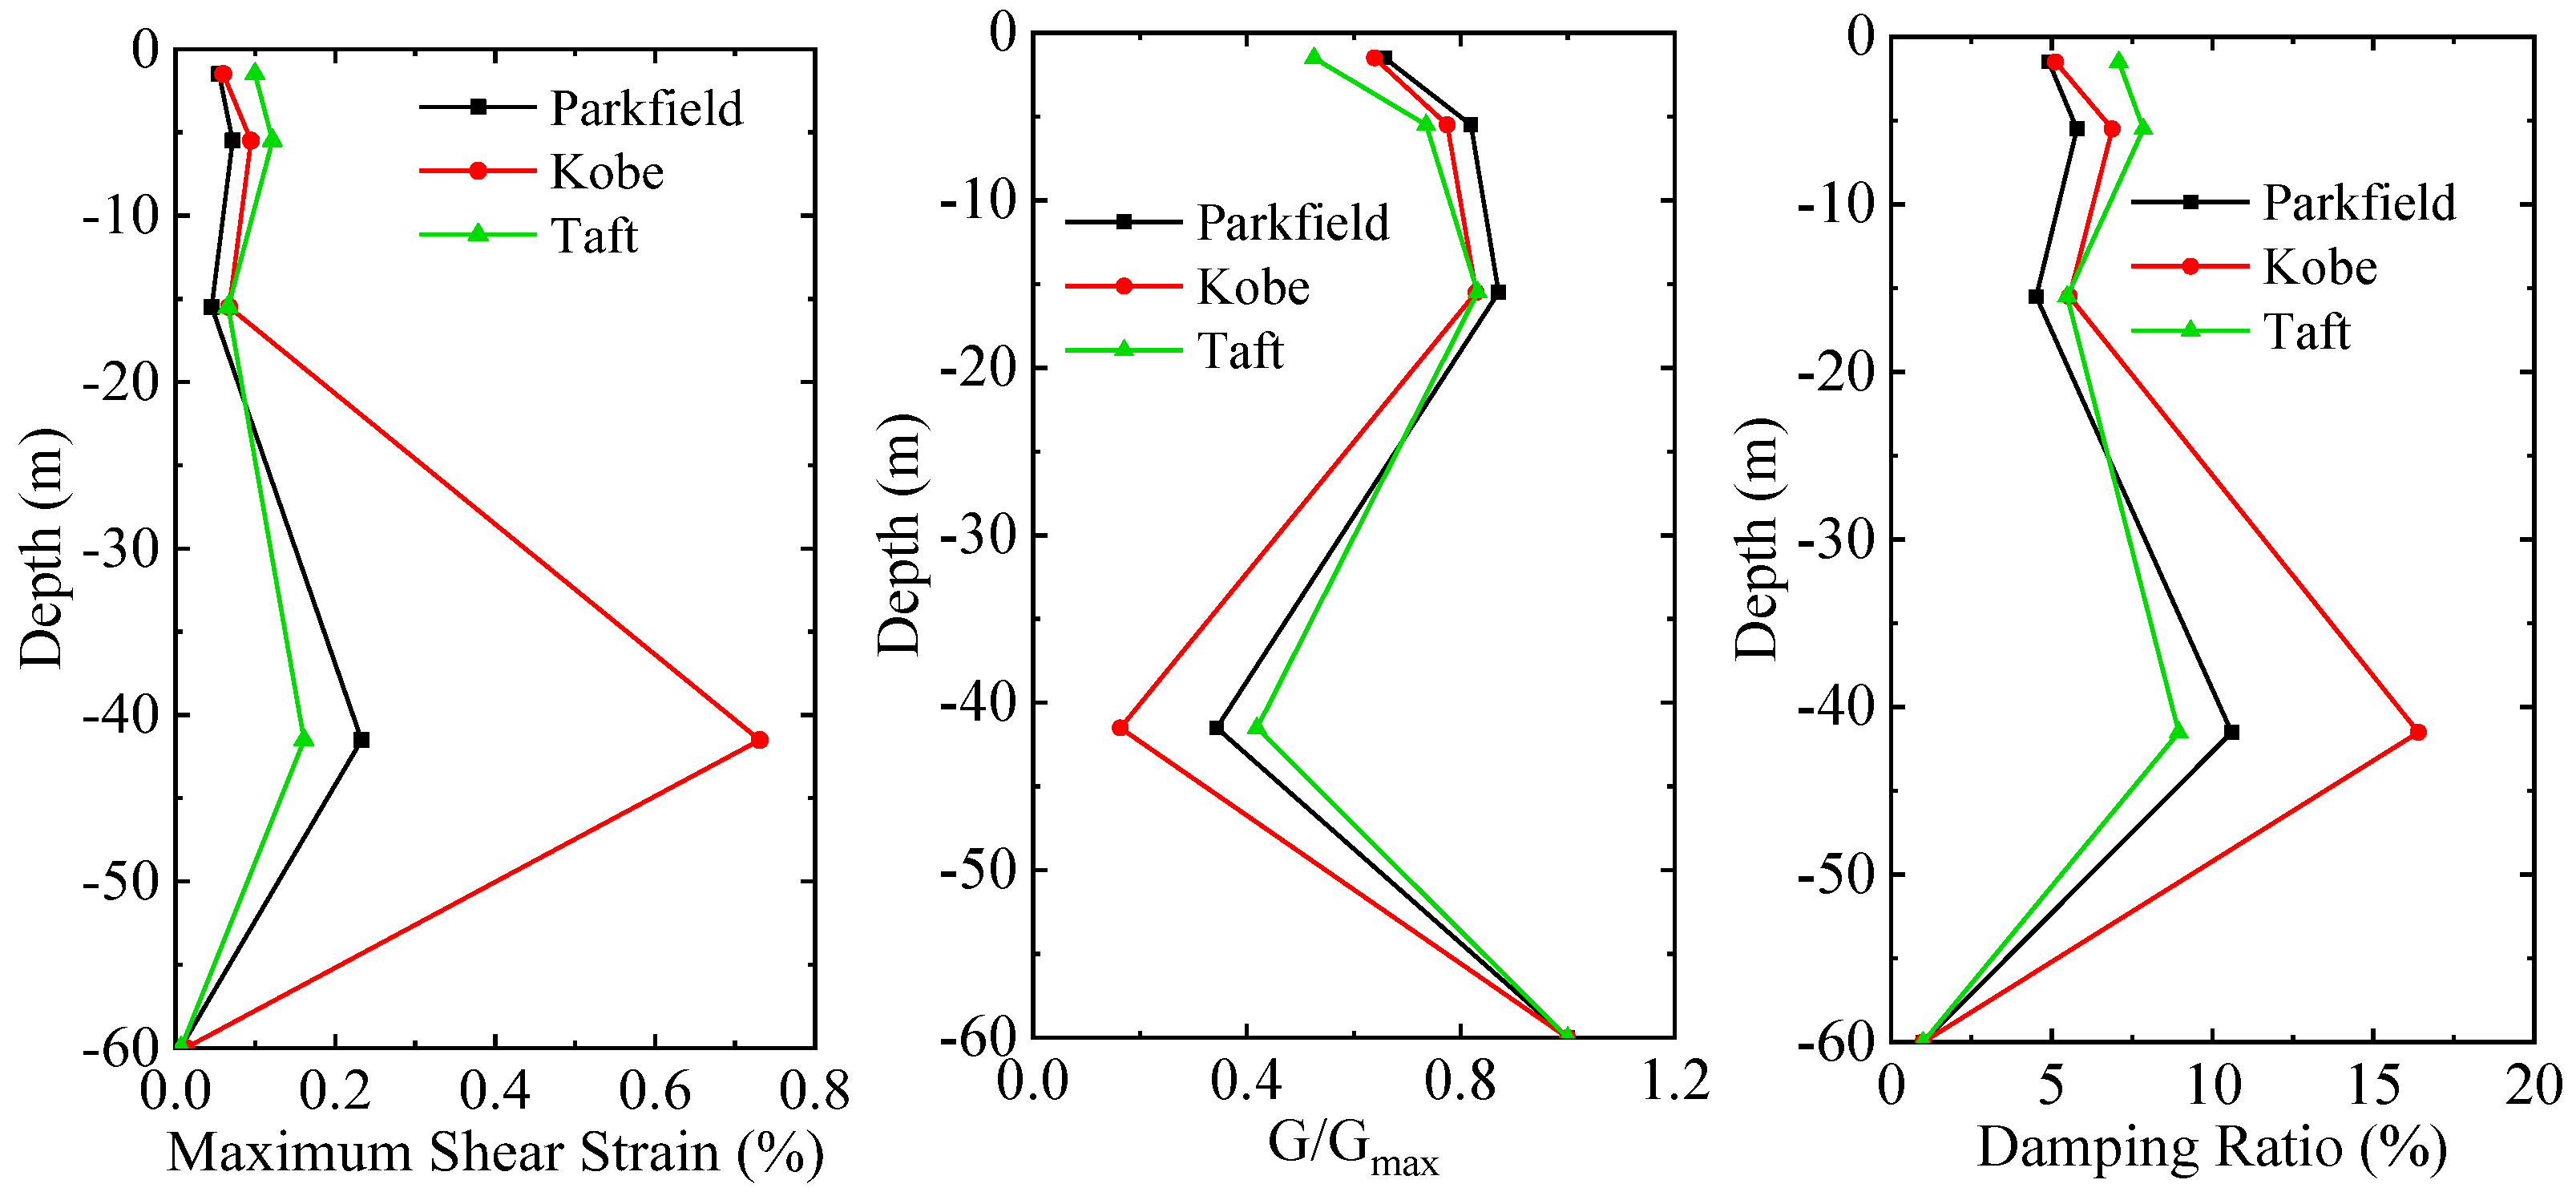
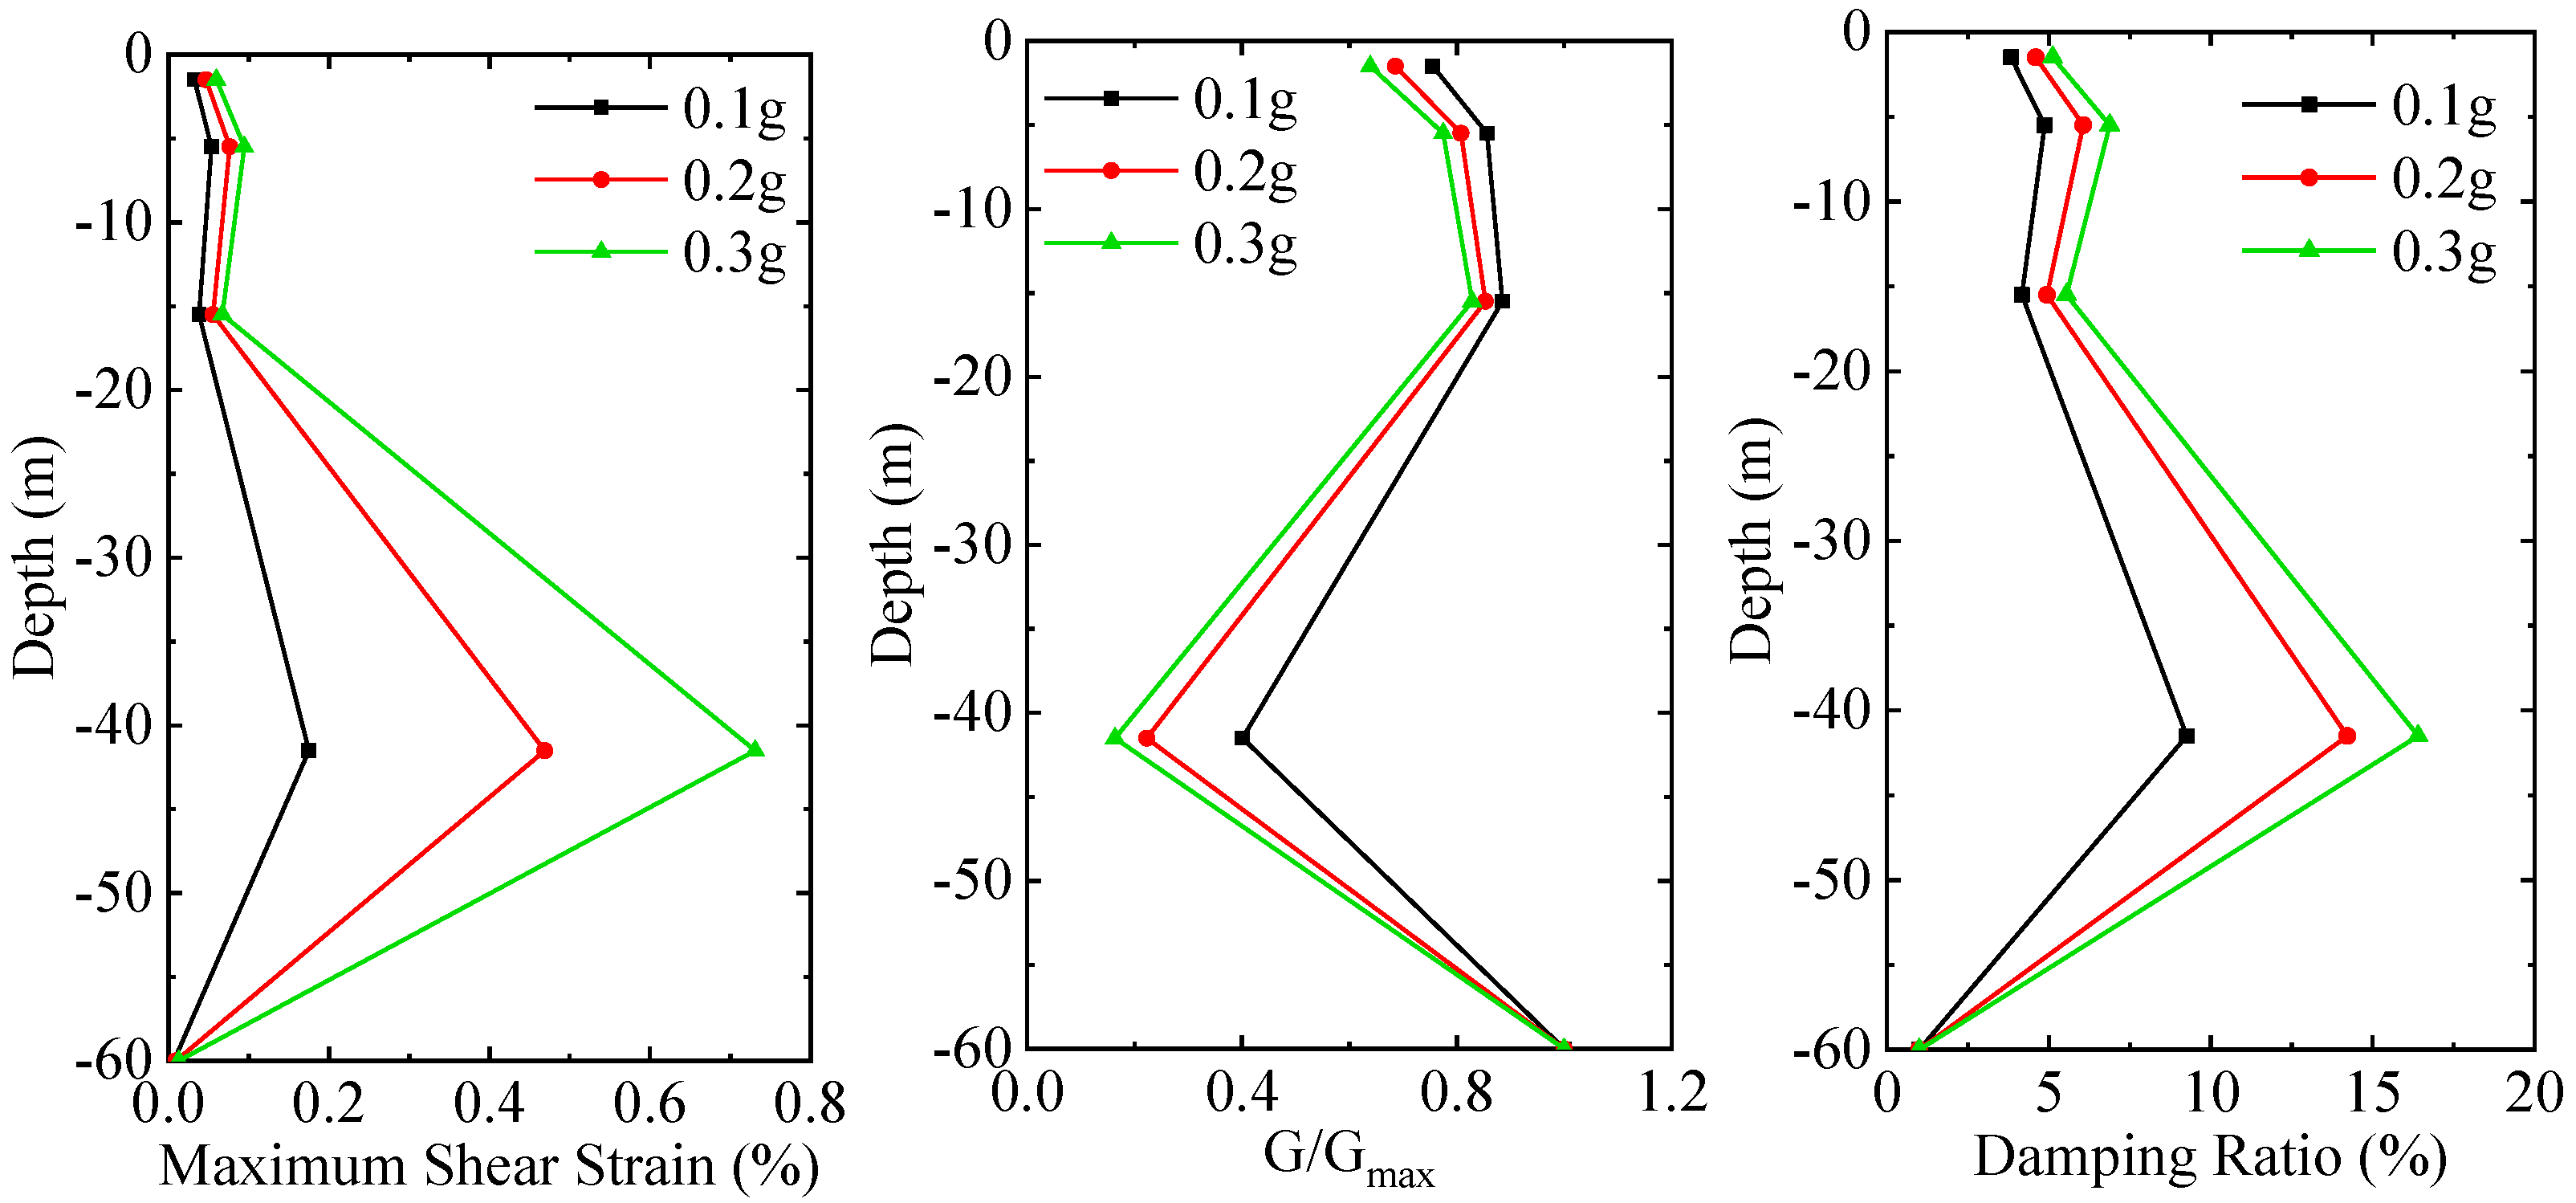
In EERA software, the equivalent linearization method was used to calculate the equivalent shear modulus and damping ratio by calculating the G
max/G–shear strain and damping ratio–shear strain relationship of soil, which were used in the dynamic time history analysis of the numerical model.
Figure 9 shows the equivalent linearization parameters of soil under different seismic motions.
Figure 10 shows the equivalent linearization parameters of soil under different seismic intensities.
Under the action of seismic waves with the same peak seismic acceleration, the frequency of the seismic waves had a greater effect on the maximum shear strain of the soil, which also showed the necessity of using different seismic waves for the seismic analysis of underground structures. As the peak acceleration of the seismic wave increased, the maximum shear strain of the soil increased, but it was not linearly related. Therefore, the seismic peak acceleration and the seismic response of the underground structure were also not linearly related.
4. Numerical Results
In order to compare the seismic responses of the fabricated subway stations with different joint distributions, the mechanical and deformation characteristics, such as plastic strain, interlayer relative deformation, and internal force, under different ground motion records (Parkfield wave, Kobe wave, and Taft wave), different seismic intensities (0.1 g, 0.2 g, 0.3 g), and different earthquake conditions (H, HV) were studied. The model named CC-Parkfield-0.3 g-H represents the seismic response of Yuanjiadian station in Changchun under the horizontal component of Parkfield wave with the peak acceleration of 0.3 g. HV represents the coupling effect of horizontal and vertical components.
4.1. Different Ground Motion Records
The deformation and mechanical characteristics of single-arch large-span fabricated station structures with different joint distributions were analyzed under different ground motions. The peak acceleration of the horizontal seismic component of 0.3 g was taken for the rest of
Section 4.1.
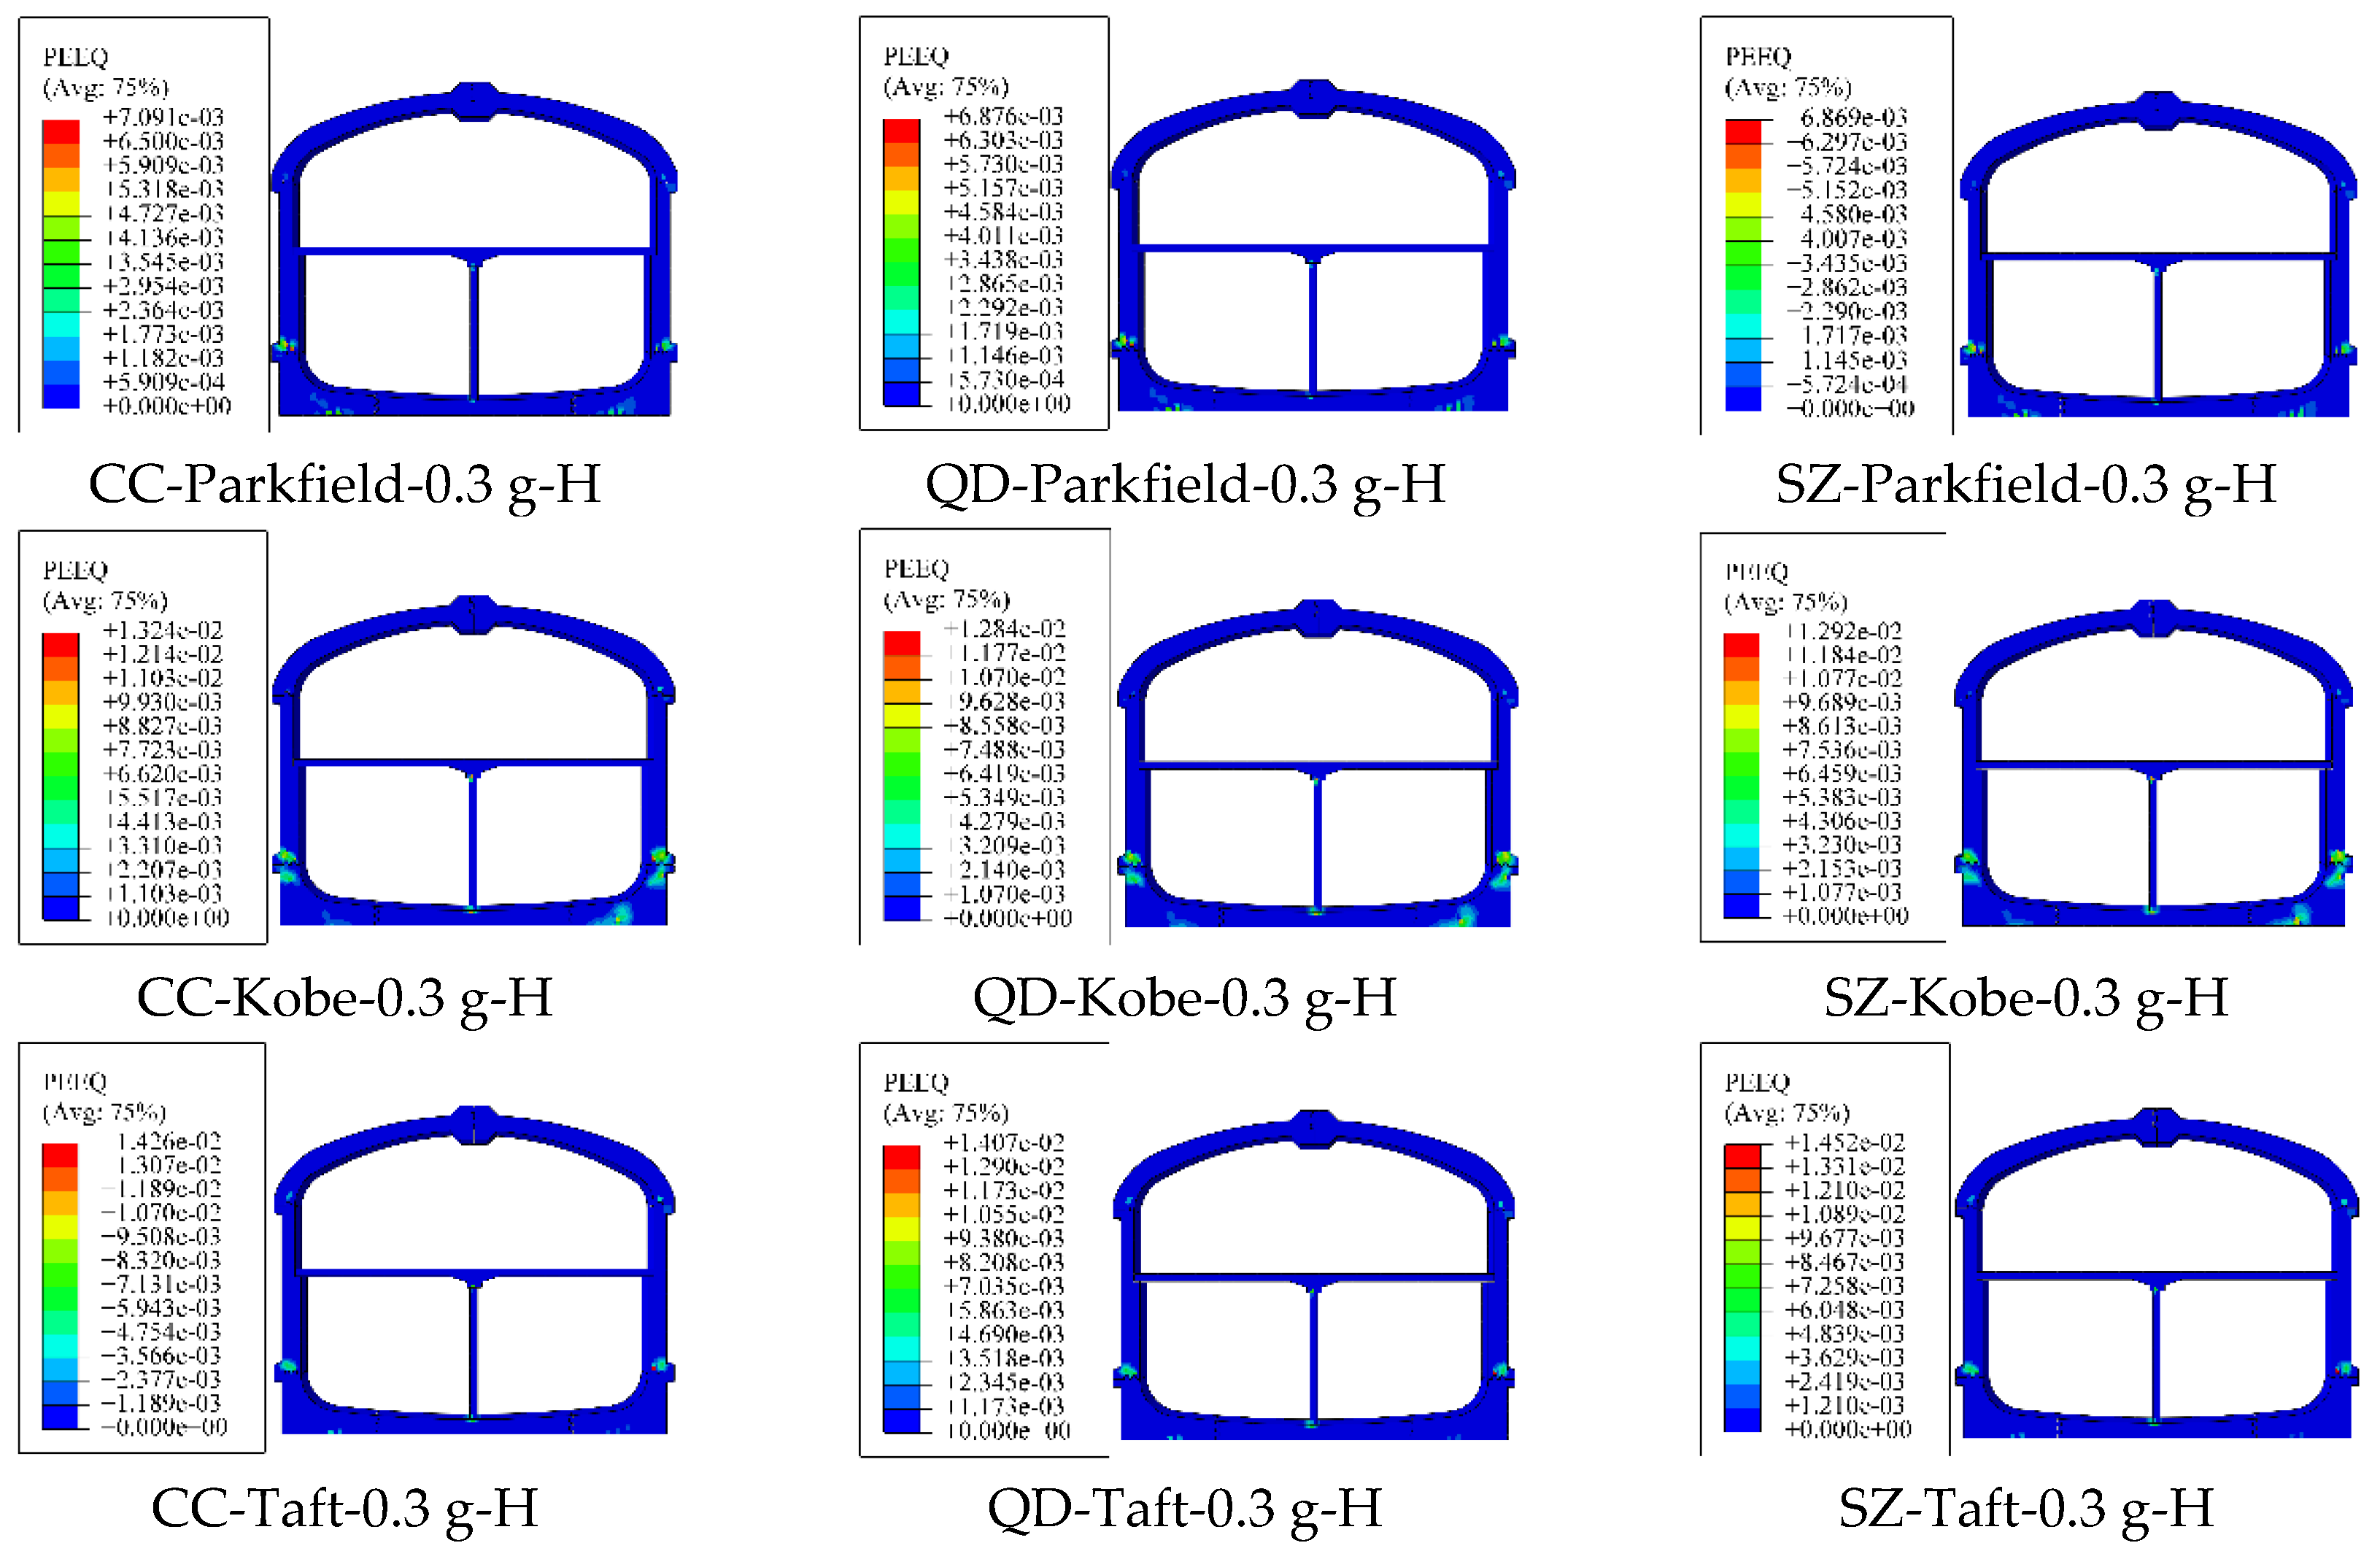
4.1.1. Plastic Strain
Compared with the cast-in-place station structure, the fabricated station structure is connected by dry-type joints and has less tensile damage. The compression damage of concrete can be used as the evaluation index of the seismic response of the fabricated station structure. The CDP model defines the compression damage to measure the structure’s compression failure state with a variation range of 0–1, corresponding to the compression plastic strain in ABAQUS. When the compressive plastic strain value is 0, the structure has no compressive damage. A value of 1 means the structure is completely destroyed.
Figure 11 shows the plastic strain cloud of the fabricated subway station structure with different joint locations.
Table 4 shows the maximum plastic strain of fabricated station structures with the different joint distributions. The plastic strain mainly occurred at the B–C joint and C–D/E joint of the sidewall, and block B under different ground motion excitations. The maximum plastic strains of the CC model, QD model, and SZ model were 0.0143, 0.0141, and 0.0145, respectively. The maximum impact rate of the vault or bottom plate joints on the structural failure was 3.2%. Under the action of an earthquake, the underground structure deforms under the constraint of the surrounding soil. The most serious damage in the prefabricated structures lay in the B–C joints. The joints of the vault and the bottom plate were always in the extrusion state, as in the cast-in-place structure. Therefore, the joint changes of the vault and bottom plate had little influence on the plastic strain of the structure.
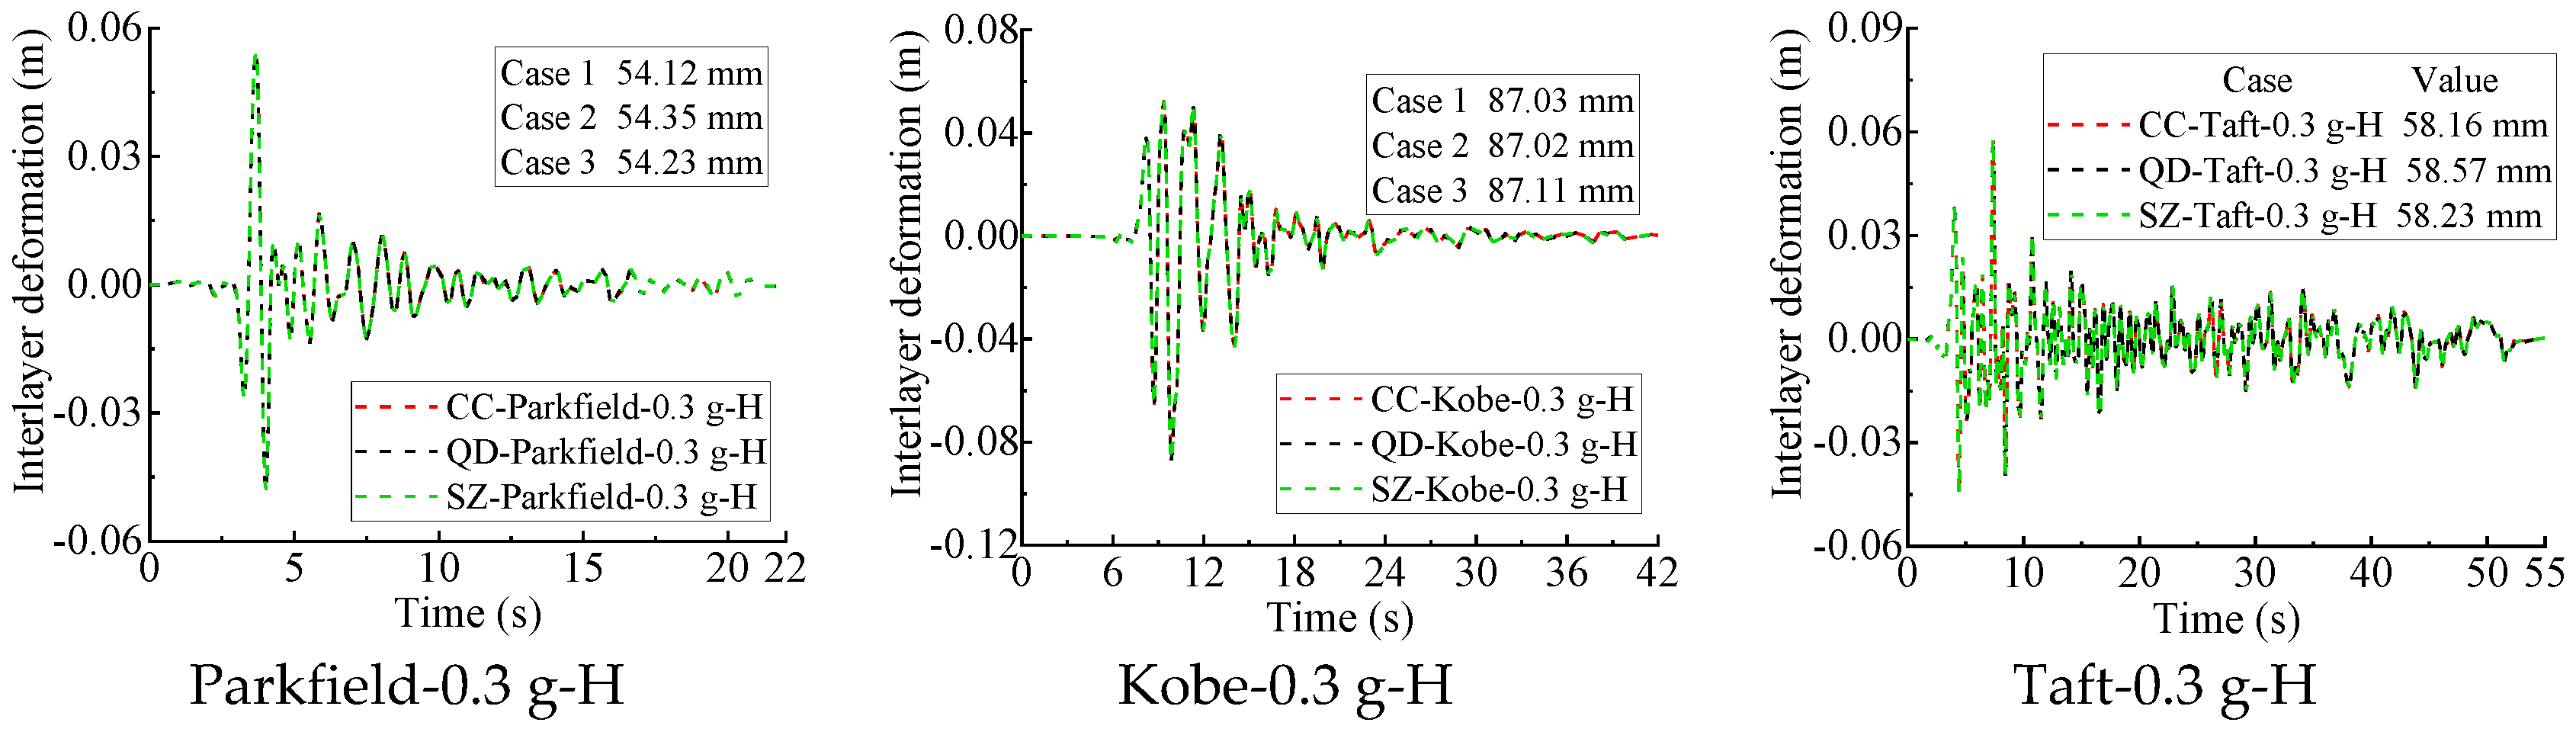
4.1.2. Deformation Analysis
Figure 12 shows the time history of the relative deformation between the vault and the bottom plate of the fabricated station structure (interlayer relative deformation).
Table 5 shows the maximum interlayer relative deformation of the fabricated station structures with the different joint distributions. Under the excitation of different ground motions, the maximum interlayer relative deformations of the CC model, QD model, and SZ model reached 87.03 mm, 87.03 mm, and 87.11 m, respectively. The maximum influence rate of the vault or bottom plate joints on the interlayer relative deformation was only 0.7%. The deformation of the structure depended on the constraint of the soil and mainly the characteristics of the seismic waves. Under the same ground motion, the interlayer relative deformation of the fabricated station structure was almost the same; therefore, the distribution form of the joints could be ignored.
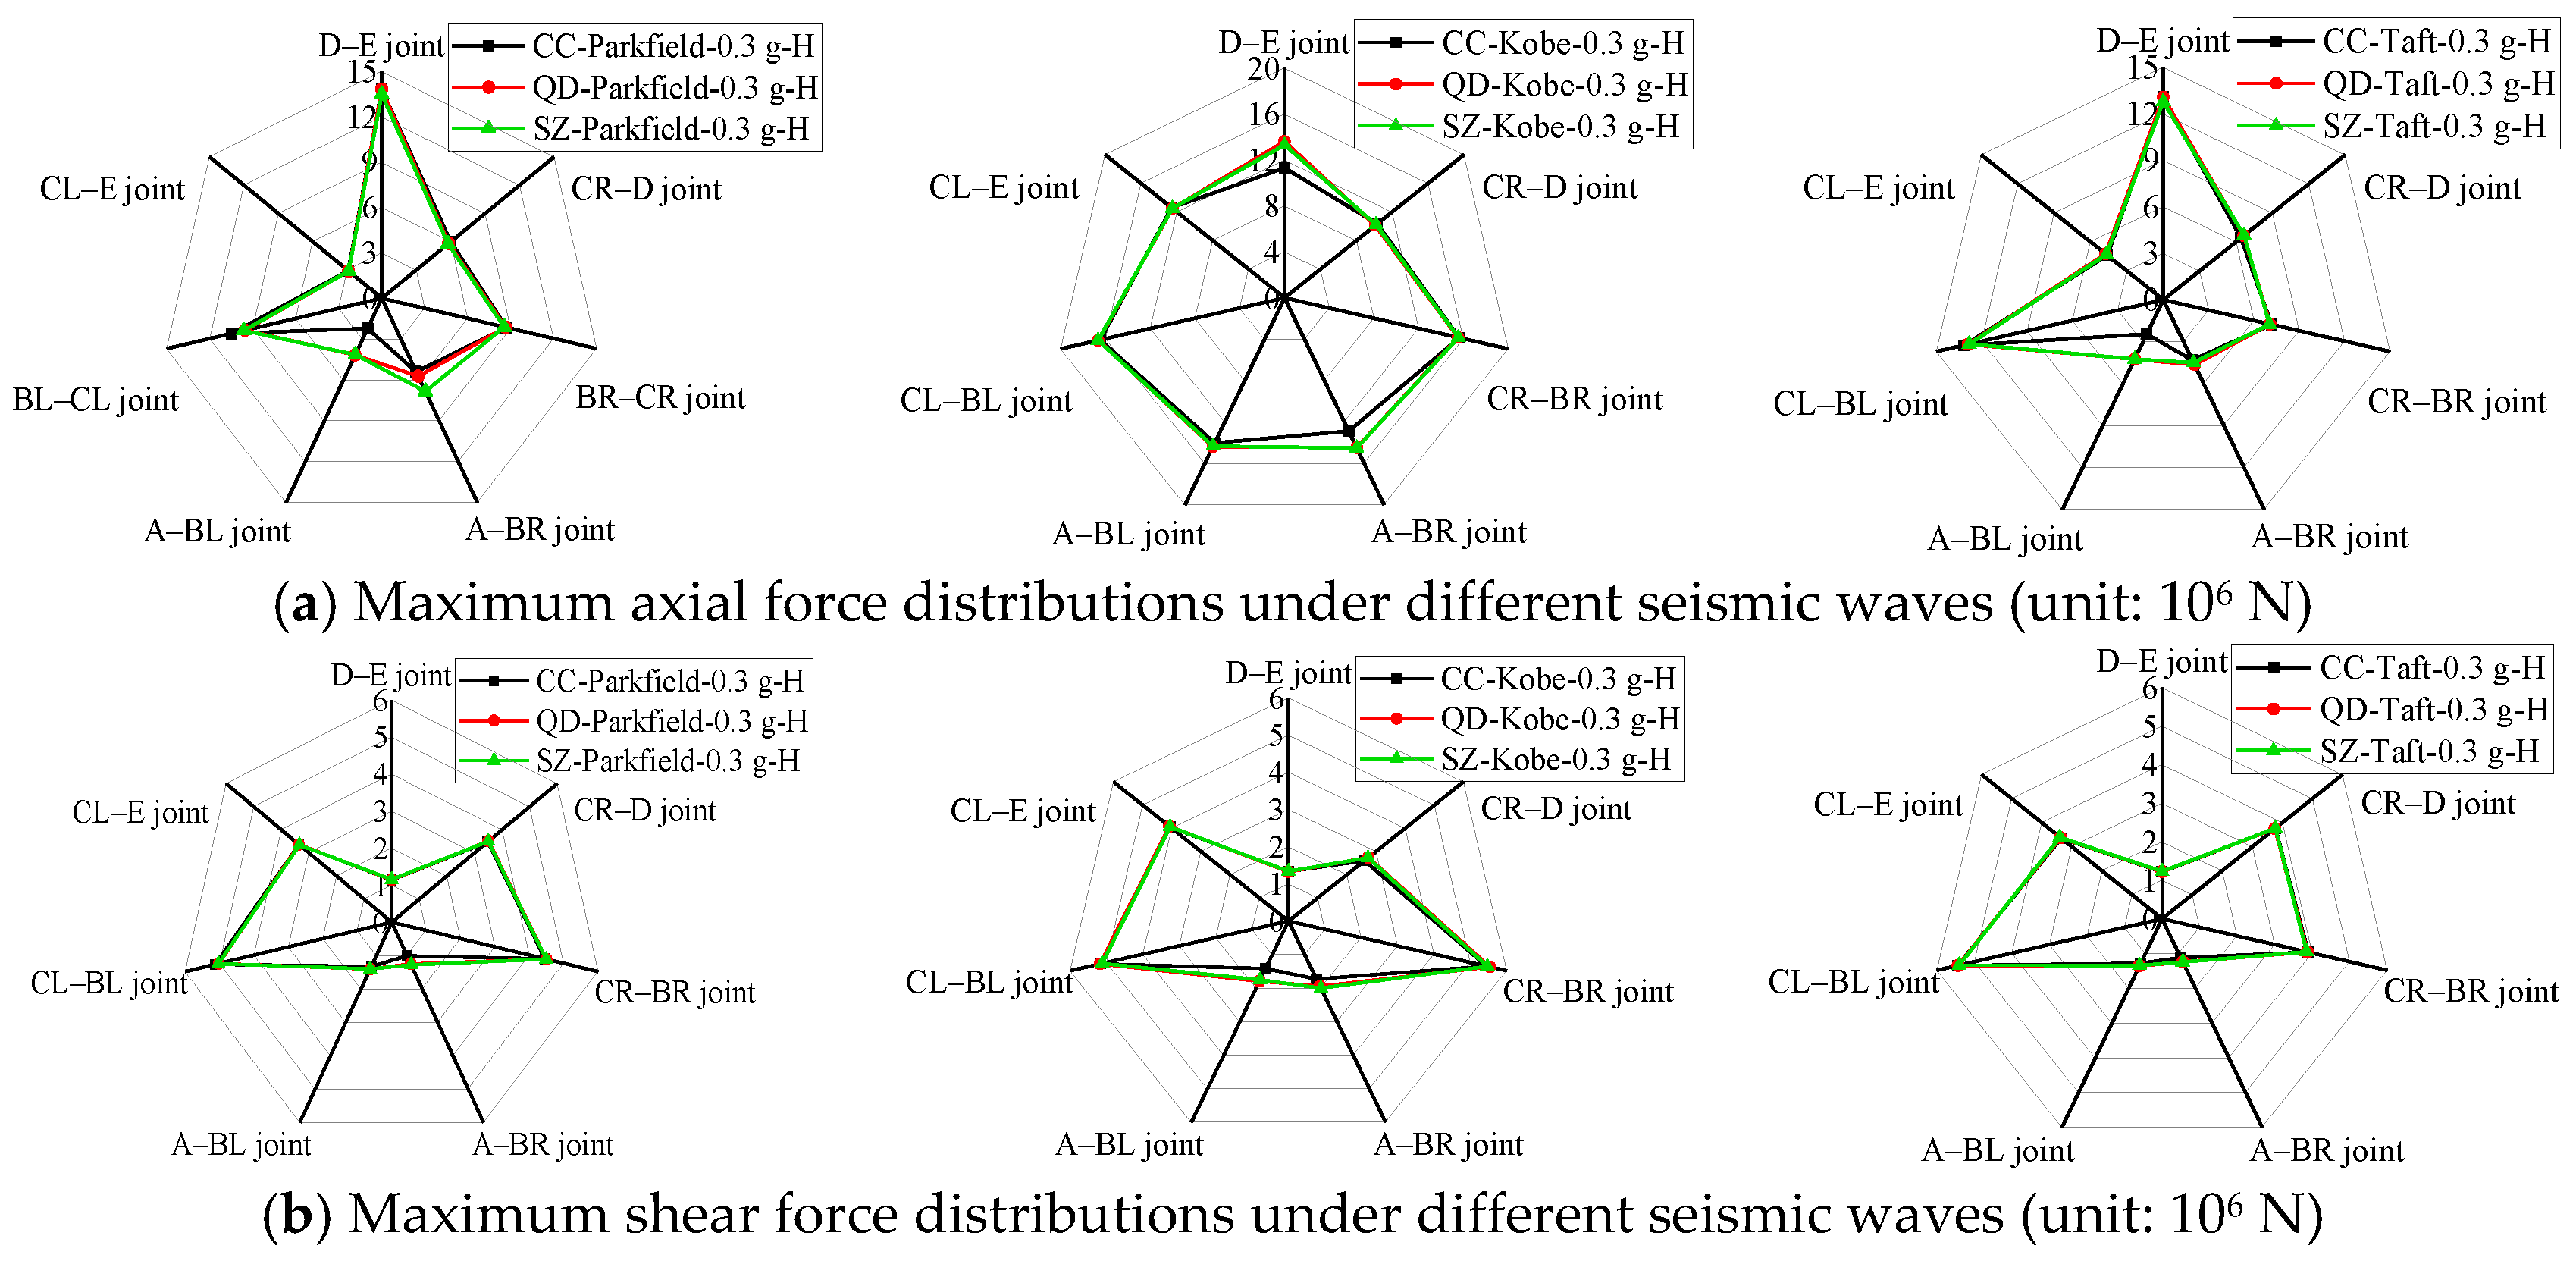
4.1.3. Internal Force
In addition to deformation and plastic strain, the internal force at the joints of the fabricated station structure is also an important index to study seismic performance.
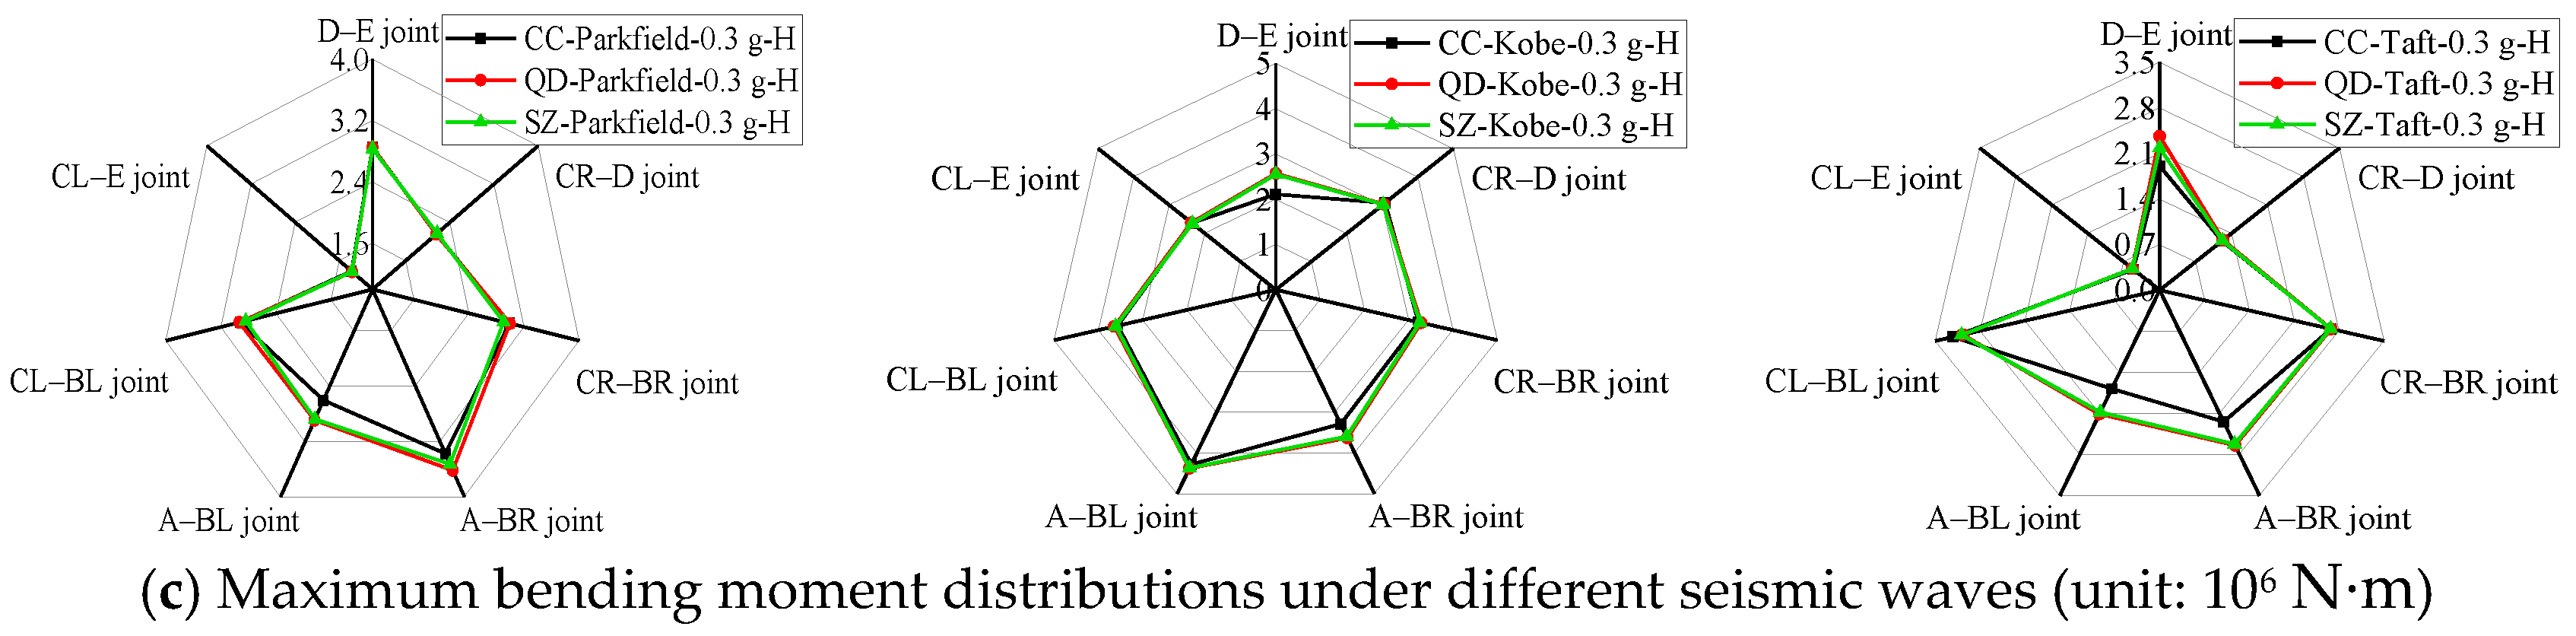
Figure 13 shows the maximum internal force distribution at the joint positions of the fabricated station structure.
Table 6,
Table 7 and
Table 8 show the maximum internal force of the fabricated station structures with the different joint distributions. According to the joint locations of Changchun Metro Station, the maximum internal forces at seven joints were extracted. The maximum internal force and distribution pattern of the CC model, QD model, and SZ model were basically the same. The maximum influence rates of the axial force, shear force, and bending moment were 2.39%, 1.93%, and 6.83%, respectively. The joint distribution position had little influence on the internal force of the fabricated station structure. The internal force difference of the fabricated station structure with different joints was mainly concentrated in the position of the vault and bottom plate, especially the axial force and bending moment. The whole assembly method of the vault and bottom plate was adopted without connection joints. Since the joints undergo coordinated deformation, the internal force of the prefabricated component without joints is greater than or equal to that with joints, which is consistent with the conclusion obtained from the comparative analysis of the internal force of cast-in-place and fabricated station structures in relevant studies [
31,
49].
According to relevant literature, the change in seismic conditions [
50,
51,
52] and peak acceleration [
53,
54,
55] of a seismic wave will increase the seismic response of underground structures and, more importantly, will obviously change the seismic response characteristics. In order to further analyze the influence of the joint distribution on the seismic response of the fabricated station structure, the seismic conditions and peak acceleration were analyzed and the results are given in
Section 4.2 and
Section 4.3 according to the research ideas of
Section 4.1.
4.2. Different Seismic Conditions
The peak accelerations of the horizontal component and vertical component were 0.3 g and 0.195 g with Kobe wave.
4.2.1. Plastic Strain
Table 9 shows the maximum plastic strain of the fabricated station structures under the coupling effect of horizontal and vertical components. The existence of vertical ground motion increased the seismic load of the overburden of the underground structure, and thus increased the axial force of B–C joint, resulting in the increase in the plastic strain of the B–C joint. The maximum plastic strains of the CC model, QD model, and SZ model reached 0.0217, 0.0219, and 0.0213, respectively, under the coupled seismic action. Compared with the horizontal seismic action, the plastic strain of the BR–CR joints on the sidewall increases obviously. The maximum impact rate of the vault or bottom plate joints on the structural failure was 3.05%.
4.2.2. Deformation Analysis
Table 10 shows the maximum interlayer relative deformation of fabricated station structures under the coupling effect of horizontal and vertical components. The time history of the interlayer relative deformation was consistent with that of the horizontal seismic component under the coupling effect of the ground motion. The vertical seismic component increased the maximum interlayer relative deformations of the CC model, QD model, and SZ model by 0.12%, 0.29%, and 0.2%, respectively. The maximum influence rate of the vault or bottom plate joints on the interlayer relative deformation was 0.17%. The joint distributions had little influence on the interlayer relative deformation of the prefabricated station structure.
4.2.3. Internal Force
Table 11 shows the maximum internal force of the fabricated station structures under the coupling effect of the horizontal and vertical components.
The maximum impact rates of the vault or bottom plate joints on the axial force, shear force, and bending moment were 0.86%, 0.43%, and 4.62%, respectively, indicating that the vertical seismic component had little influence on the joint distribution of the fabricated station structure.
The overburden load increased by the vertical seismic component could hardly overcome the axial resistance moment of the vault and the bottom plate caused by the horizontal seismic component. Under the coupling effect of the horizontal and vertical seismic components, the seismic response characteristics of the fabricated station structure with different joint distributions did not change significantly, which was consistent with the horizontal component.
4.3. Different Seismic Intensities
Peak accelerations of 0.1 g, 0.2 g, and 0.3 g of the Kobe wave were used to analyze the effect of peak acceleration of ground motion.
4.3.1. Plastic Strain
Table 12 shows the maximum plastic strain of the fabricated station structures under the different seismic intensities. The plastic strain of the fabricated station structure increased monotonically with the increase in the seismic peak acceleration. When the peak accelerations of seismic waves were 0.1 g, 0.2 g, and 0.3 g, the maximum impact rates of the vault or bottom plate joints on the structural failure were 4.74%, 11.26%, and 3.02%, respectively. The ground motion intensity negligibly affected the maximum plastic strain of fabricated station structures with different joint distributions.
Compared with that of 0.1 g and 0.3 g, the maximum plastic strain of the SZ model increased significantly with the peak acceleration of 0.2 g. The dominant frequency of the Kobe wave was very close to that of the SZ model system when the peak acceleration was 0.2 g, and the resonance resulted in a severe seismic response of the soil–structure system.
4.3.2. Deformation Analysis
Table 13 shows the maximum interlayer relative deformation of the fabricated station structures with different seismic intensities. The maximum interlayer relative deformation of the fabricated station structure increased monotonically with the increase in seismic peak acceleration. The maximum impact rates of the vault or bottom plate joints on structural failure were 0.92%, 0.13%, and 0.09% under the seismic peak accelerations of 0.1 g, 0.2 g, and 0.3 g, respectively. The effect of the seismic intensity on the interlayer relative deformation could be ignored.
4.3.3. Internal Force
Table 14,
Table 15 and
Table 16 show the maximum internal forces with different seismic intensities. The maximum impact rates of the fully prefabricated vault or bottom plate on the internal force were 5.23%, 2.96%, and 2.46% under the seismic peak accelerations of 0.1 g, 0.2 g, and 0.3 g, respectively, indicating that the peak acceleration had little influence on the joint distribution of the fabricated station structure.
With the increase in the peak acceleration, the influence rates of different joint distributions on the seismic response of the fabricated station structure decreased gradually. In other words, with the increase in the seismic intensity, the seismic response of the fabricated station structure with different joint distributions tended to be consistent.
5. Damage Assessment Method of the Joint
The damage analysis of fabricated structures can reflect the performance directly and comprehensively and is related to the structure’s performance index of deformation, stiffness, and energy. The actual earthquake disaster showed that the failure of concrete structures starts at the material level and then accumulates to cause damage to the parts and the structure, eventually leading to the breakdown of the whole structure [
56].
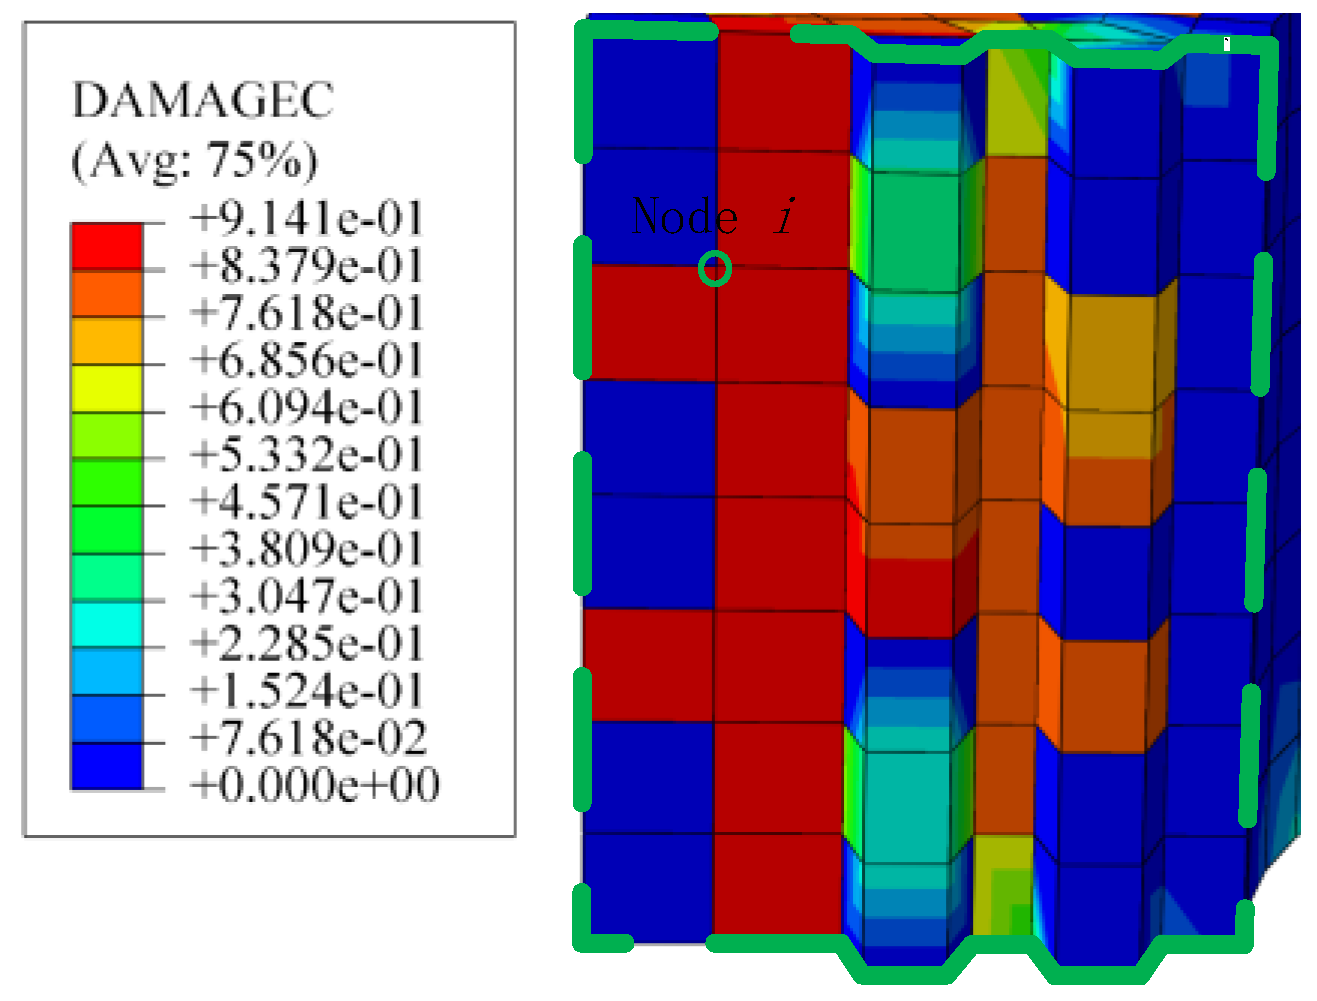
Figure 14 shows the concrete compression damage contour graph at the contact surface of the joint surrounded by the green dashed line.
The joint compression damage index (
) is the maximum value of the contact surface’s compression damage index between block S and block M.
is defined as the compression damage index of the contact surface between block S and block M, as shown in Equation (8):
where
is the compression damage factor of finite element node
i,
is the area of node
i within the contact surface, and
is the total area of the contact surface. Compressive damage represents the irreversible compressive damage of concrete (0 represents no damage and 1 represents complete damage). According to the CDP model, the joint residual strength index (
) is shown by Equation (9):
where
is the compression damage factor at the limited compression yield stress, which was taken as 0.173. The joint completely failed to have load-bearing capacity when the concrete residual strength index reached 90%.
6. Joints Damage Analysis of Fabricated Structures
The above research showed that the joint of the vault and bottom plate had little influence on the seismic response of the assembled station structure. However, it is necessary to further study the failure mechanism of the assembly station structure joints under earthquake action. The Kobe wave was used as the input seismic wave and the CC model was taken as the research object. The concrete damage indexes of the finite element nodes on the joint contact surface were obtained based on the ABAQUS finite element software. The compression damage index and the residual strength index were used to describe the compression damage degree and the residual strength of the fabricated structural joints.
Figure 13,
Figure 14,
Figure 15,
Figure 16,
Figure 17 and
Figure 18 show the histories of the compression damage index and the residual strength index of the fabricated structural joints. In the time history of the joint compression damage index, the time represents the moment the joint damage occurred and the damage ended; in the time history of the residual strength index, the time represents the moment the joint strength degradation happened.
6.1. Damage Analysis of A–B Joints
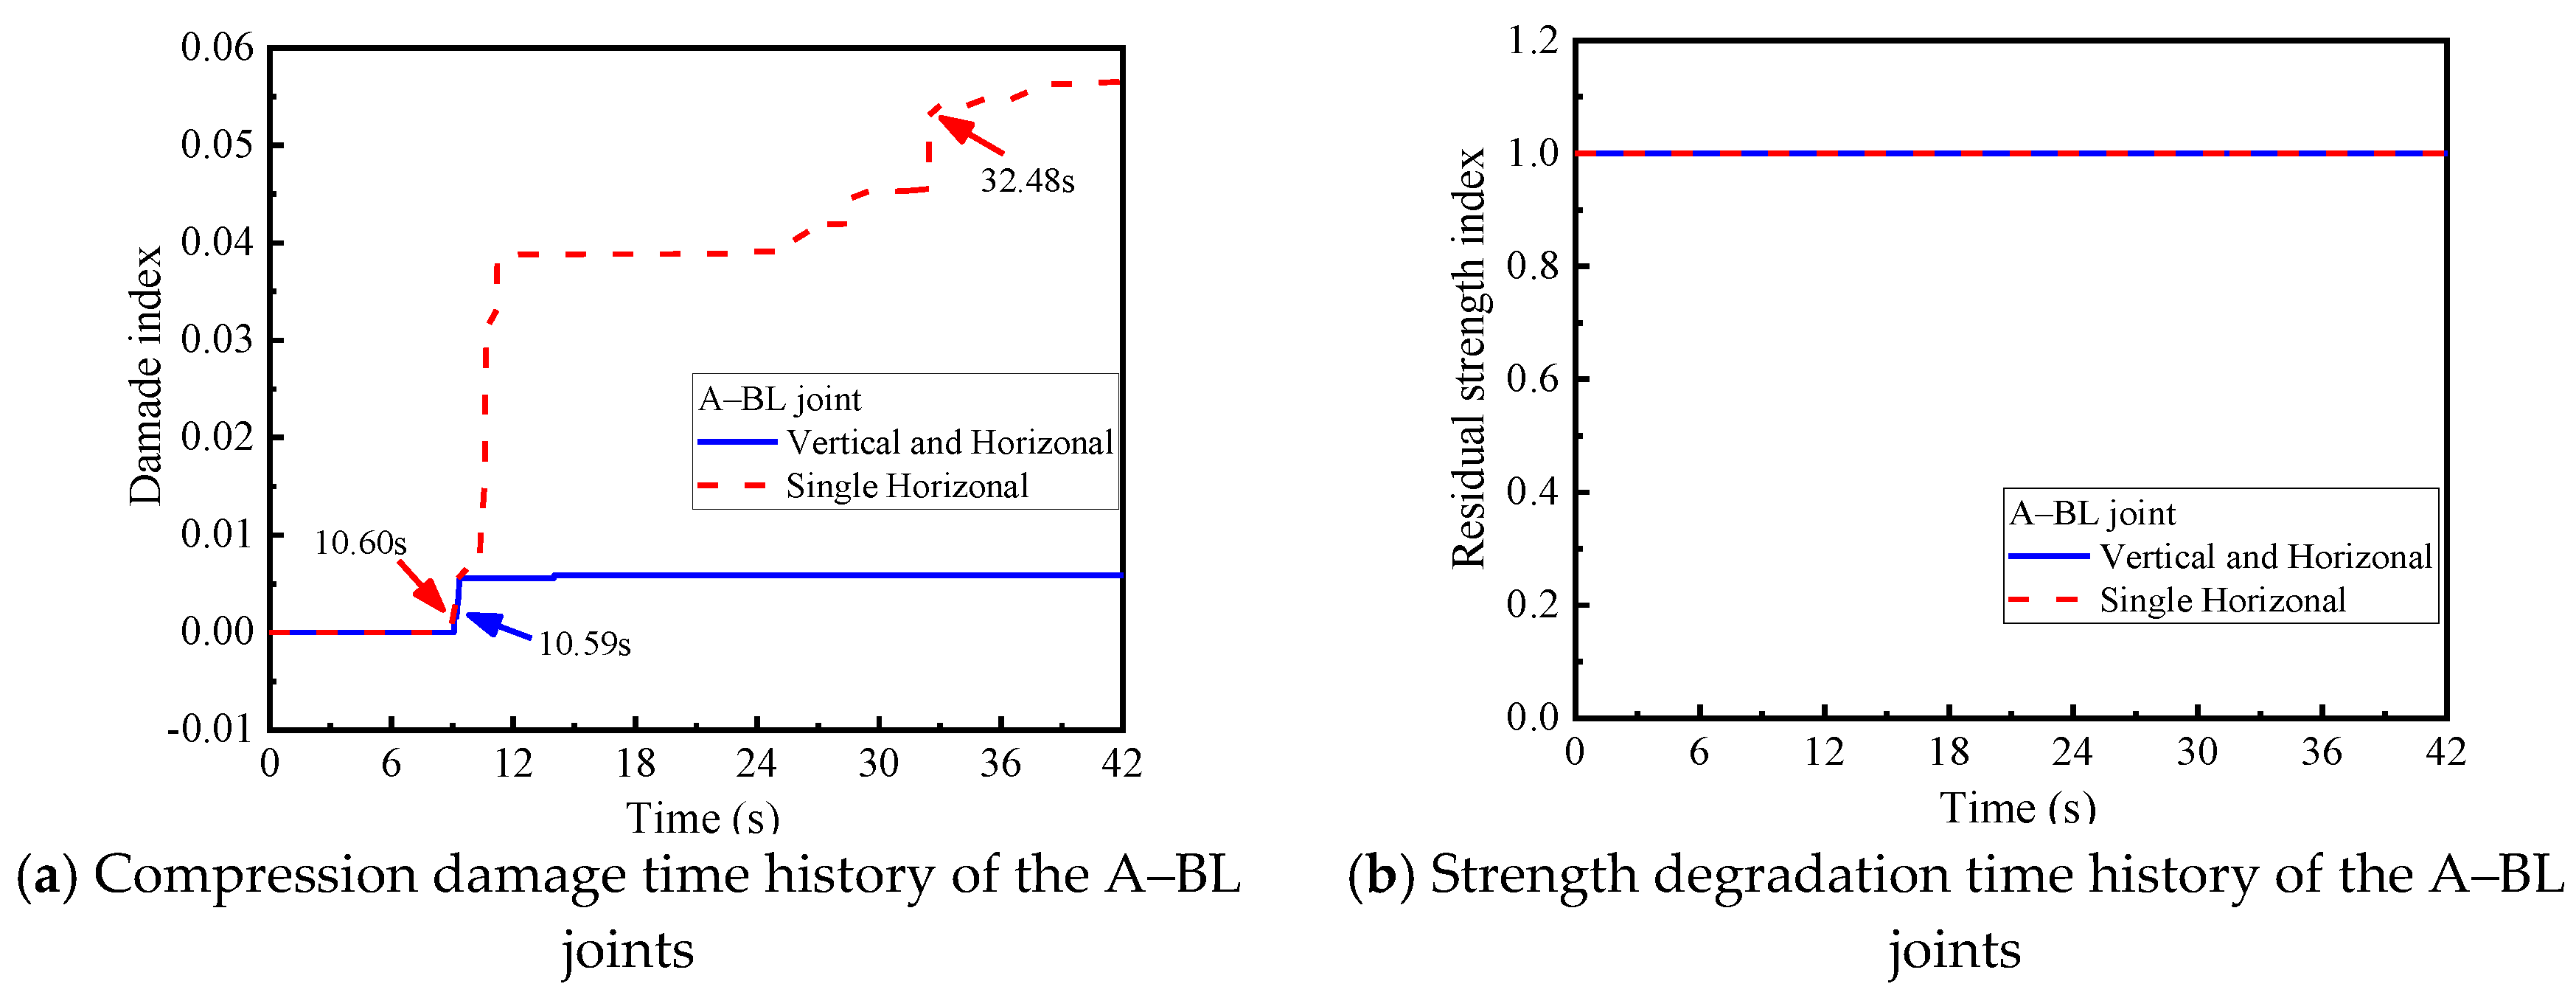
Figure 15 and
Figure 16 show the A–B joint’s damage and residual strength histories under different seismic conditions.
The horizontal seismic component mainly caused the compression damage degree in A–B joints. The vertical seismic component had a suppressive effect on the compression damage degree of concrete in A–B joints. The vertical seismic component increased the vertical inertia force of the station overburden, increasing the friction between the bottom plate and the soil layer and inhibiting the compression deformation of the bottom plate. The A–BR joints suffered a slight strength degradation phenomenon, while the bottom plate A–B joints were less affected by the earthquake. The A–B joints were extruded with less damage under seismic action, which was consistent with the conclusions obtained in
Section 4.
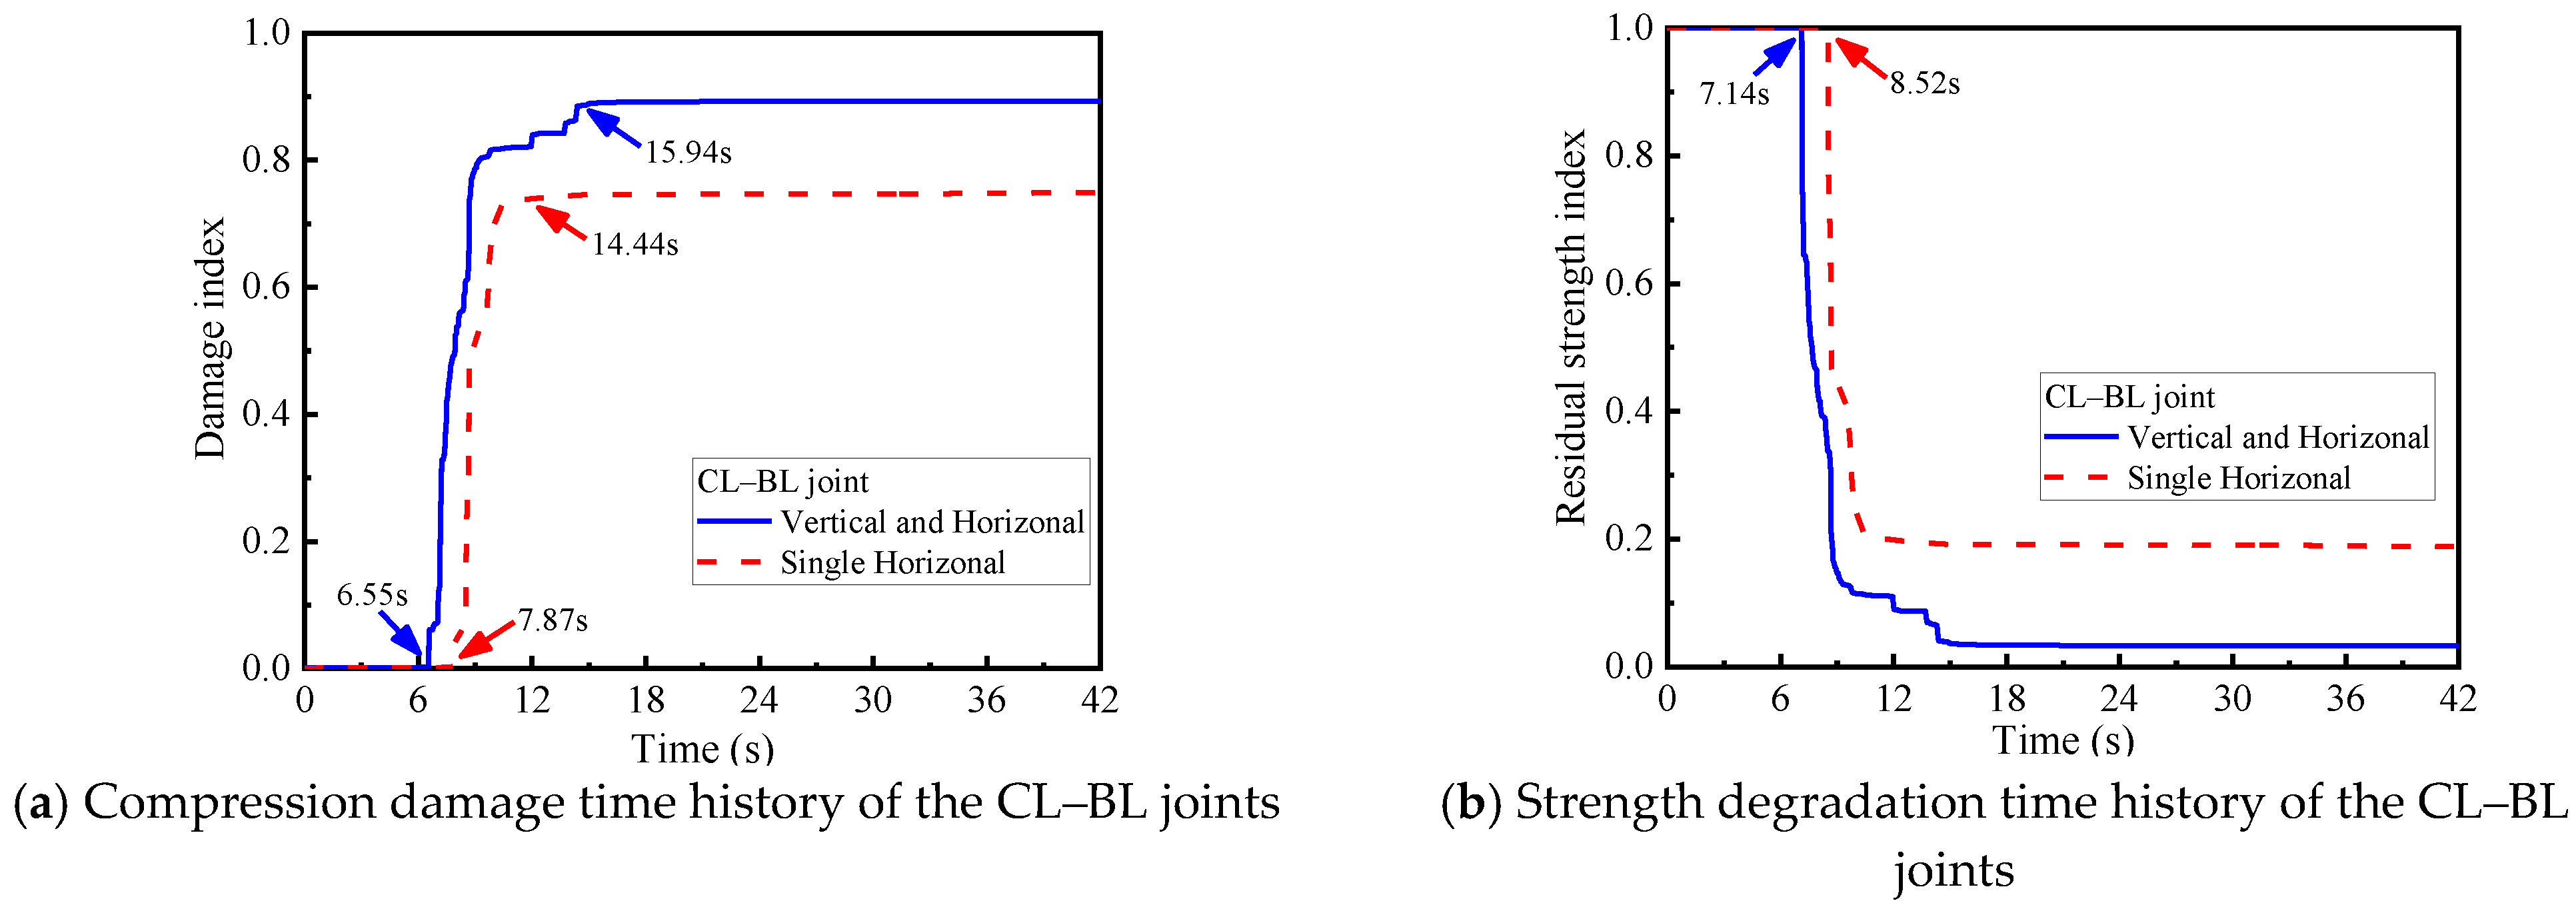
6.2. Damage Analysis of B–C Joints
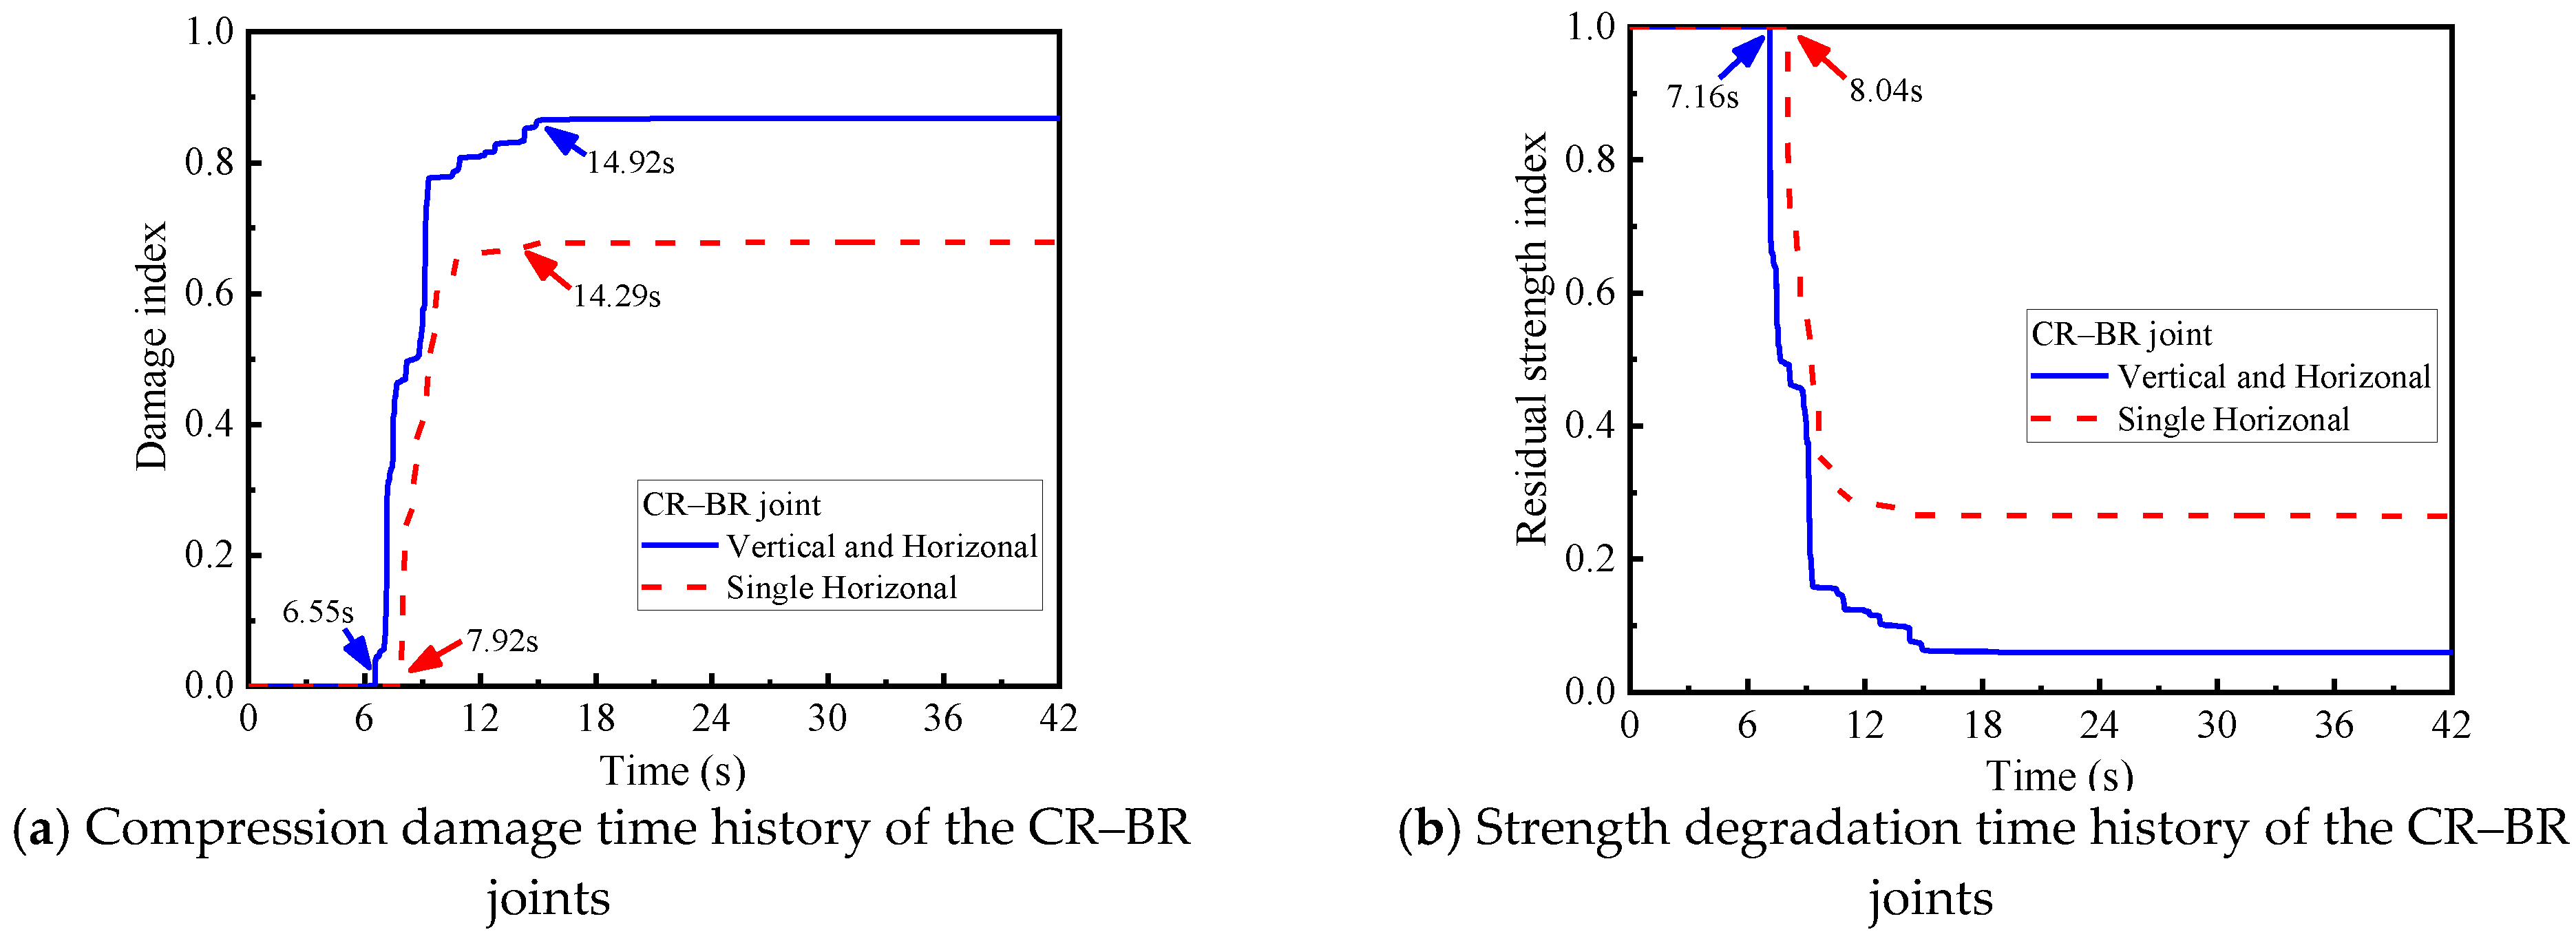
Figure 17 and
Figure 18 show the B–C joint’s damage and residual strength histories under different seismic conditions. The initial compressional damage in the B–C joints depended mainly on the vertical seismic component. The coupled ground motions damaged the fabricated structure more severe than the horizontal ground motions alone.
The vertical seismic component increased the axial compression ratio of the sidewalls, which made the damage of the joints more severe. The B–C joint received strength degradation under the horizontal ground motion but did not reach the load-bearing capacity. The existence of the vertical seismic component increased the maximum compression damage index of the CR–BR joint by 26%, which finally lost the load capacity and even became damaged. Under the seismic action, the B–C joints were severely damaged and should be reinforced. In the seismic design of underground structures, the presence of vertical seismic components should be considered.
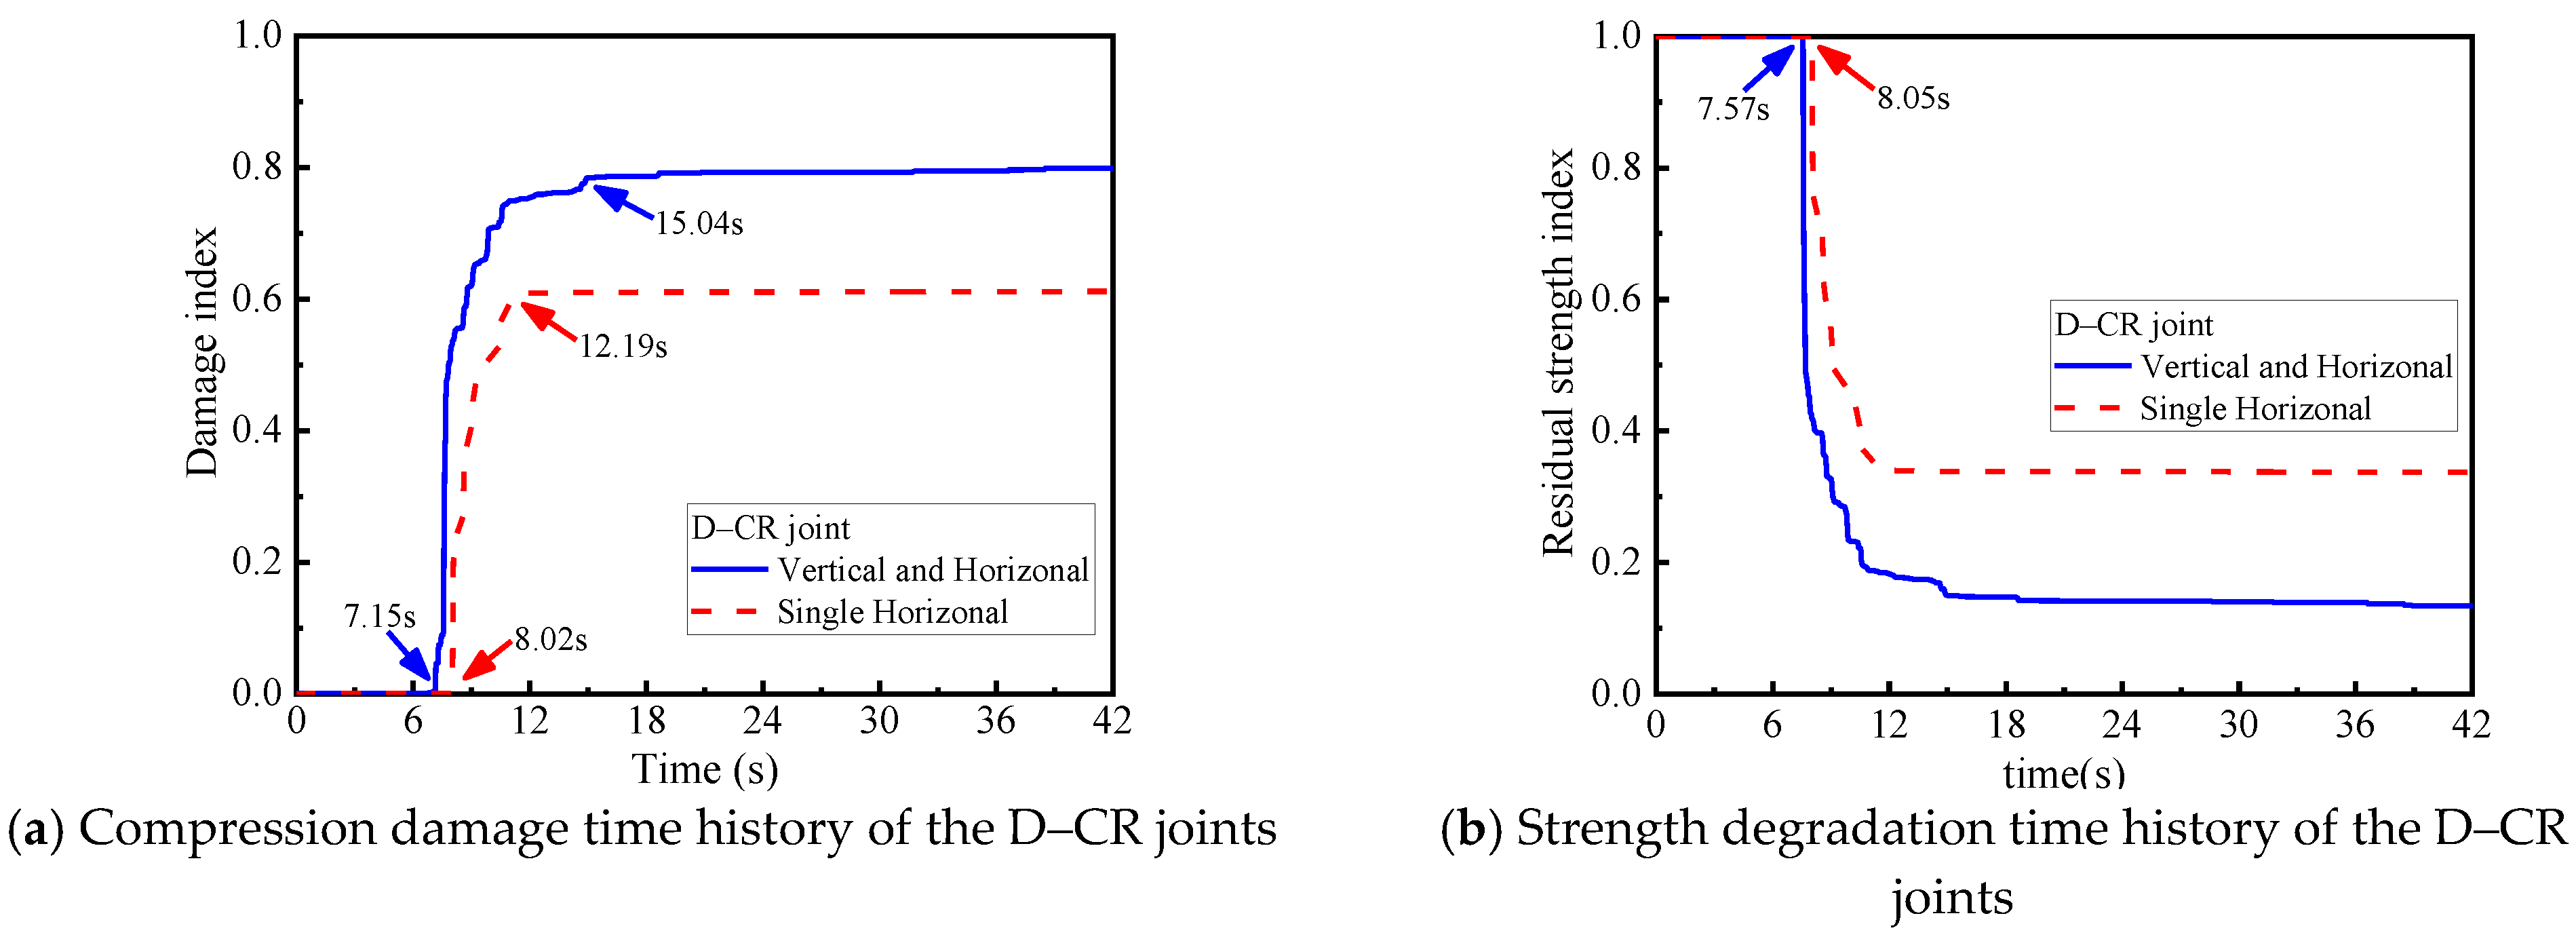
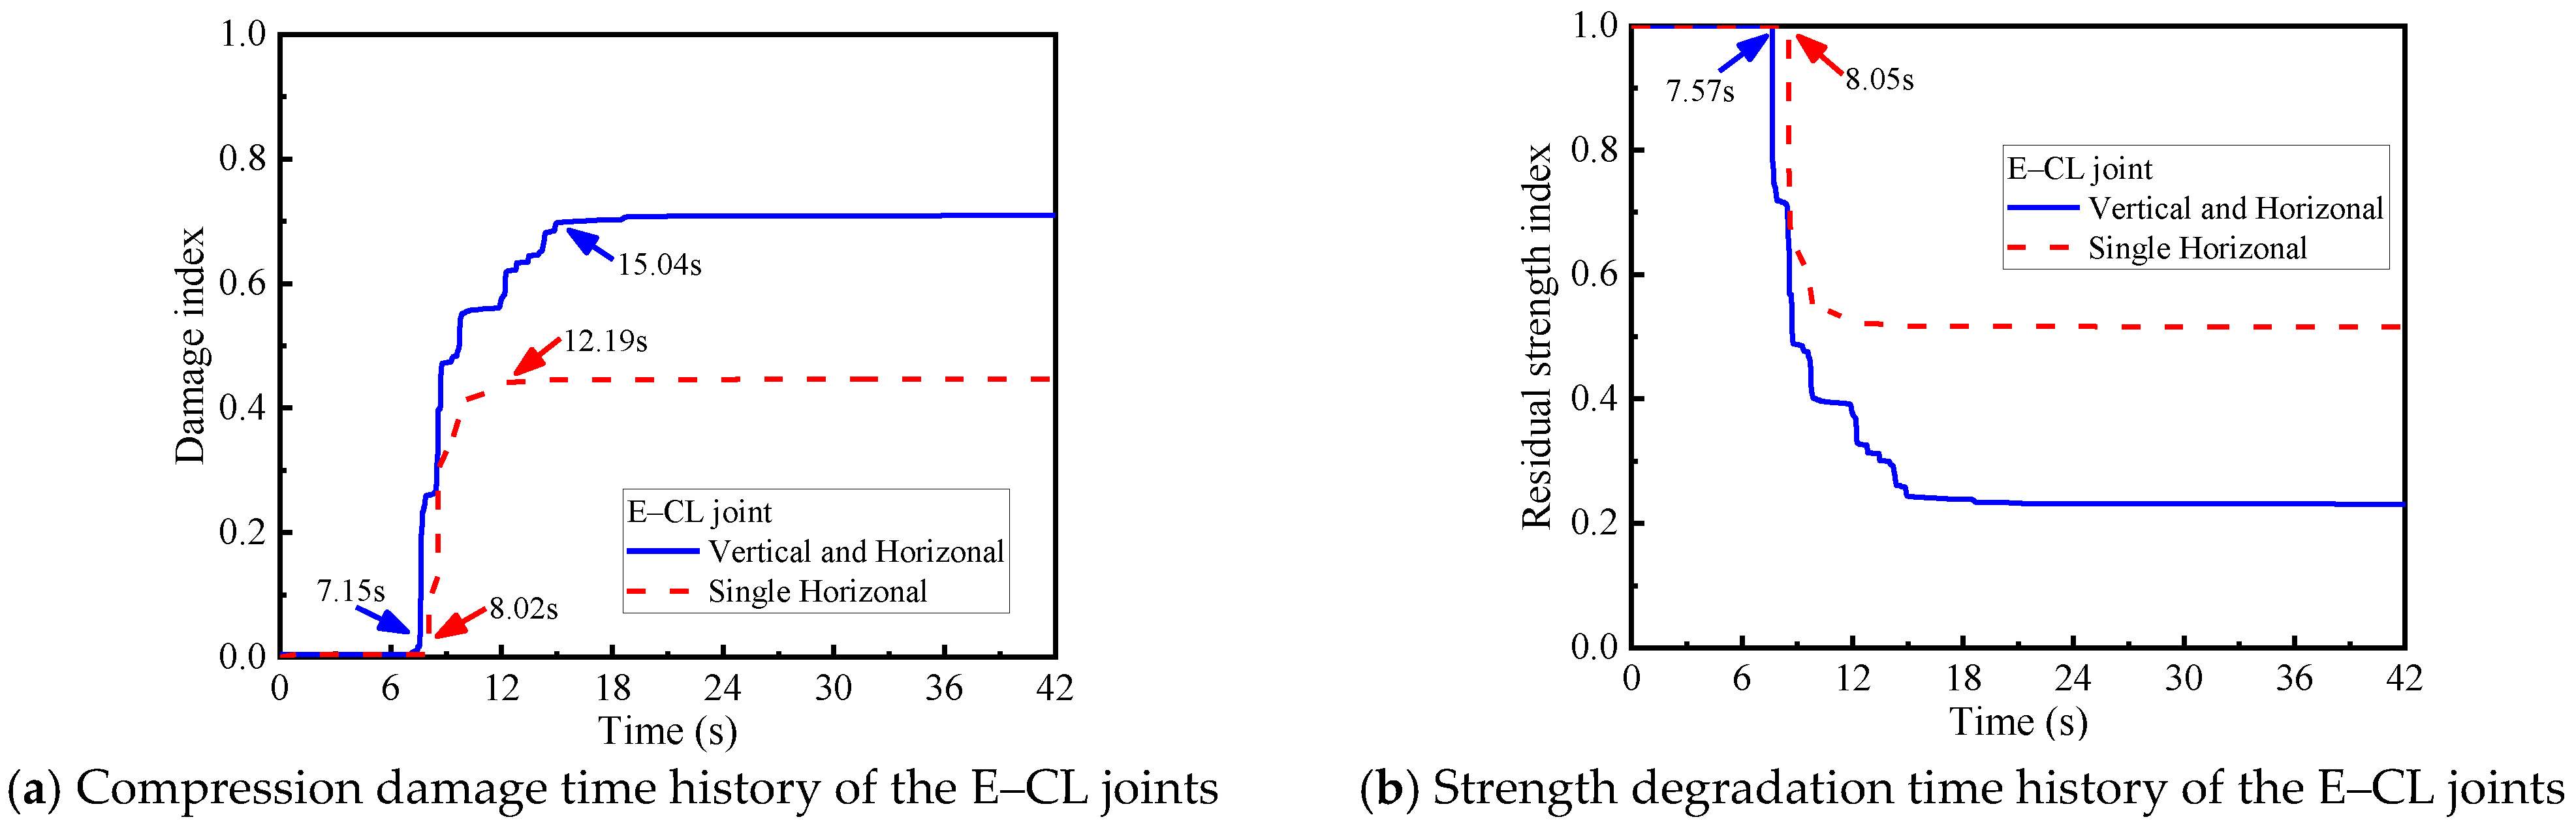
6.3. Damage Analysis of C–D/E Joints
Figure 19 and
Figure 20 show the damage and residual strength histories of the C–D/E joint under different seismic conditions. The initial damage of the C–D/E joint depended mainly on the vertical seismic excitation, and the final damage state depended on the coupled seismic effect. The strength degradation of the C–D/E joint occurred under different seismic conditions; however, the load-bearing capacity was not dissipated. The CR–D joint and CL–E joint suffered strength degradation under horizontal ground motion, but did not lose its load capacity; the vertical seismic component’s existence increased the CL–E joints’ compression damage index by 56%, which had a non-negligible effect on the seismic response of the fabricated structure. Both the C–D/E joints and the B–C joints are sidewall nodes, but the C–D/E joints had less damage than the B–C joints. The vault could provide horizontal forces to restrain the horizontal deformation of the C–D/E node and bear the overburden load. Therefore, the overburden load with a vertical seismic component reduced the horizontal deformation, as well as the damage at the C–D/E joints. The vertical seismic component should be considered in the seismic design of C–D/E joints.
7. Conclusions
The dynamic response characteristics of a fabricated station structure with different ground motion characteristics, seismic intensities, and seismic conditions were compared and analyzed. The results showed that the fabricated station structure as a new subway station structure had obvious differences in the structural characteristics compared with the cast-in-place station structure. However, the seismic response of the fabricated station structure was universal under different earthquake actions. The following conclusions were obtained from the numerical results:
(1) The maximum impact rates of the vault or bottom plate joints on structural failure, interlayer relative deformation, and internal force were 3.2%, 0.7%, and 6.83%, respectively, under the action of different seismic characteristics. The maximum impact rates of the fully prefabricated vault or bottom plate on structural failure, maximum interlayer relative deformation, and internal force of section were 3.05%, 0.17%, and 4.62%, respectively, under different seismic conditions. The maximum influence rates of the fully prefabricated vault or bottom plate on structural failure, maximum interlayer relative deformation, and internal force were 11.26%, 0.92%, and 5.23%, respectively, under the action of different earthquake intensities. The influence of the connection joints in the vault or bottom plate on the seismic response of the fabricated station structure could be ignored. Under the action of an earthquake, the underground structure deformed under the constraint of the surrounding soil. The most serious damage to the prefabricated structure lay in the B–C joints. The joints of the vault and the bottom plate were always in the extrusion state, as in the cast-in-place structure. It is recommended that the assembly scheme with fewer prefabricated components is used to improve the construction efficiency under the premise of meeting the requirements of the work site and mechanical capacity.
(2) The joint damage assessment method proposed in this study quantified the damage degree of dry-type connection joints and visually reflected the seismic response of fabricated station structures. The vertical seismic component significantly influenced the seismic response of the fabricated structures, especially the B–C joint. The vertical seismic component increased the joints’ maximum compression damage index by 19% and reduced the residual strength index by 83%. The vertical seismic component increased the axial compression ratio of the sidewalls, which made the damage of the B–C joints more severe. The vertical seismic component should be considered in the seismic design of prefabricated station structures. At the same time, the B–C joints should also be reinforced.
Although the seismic response of a fabricated station structure with different joint distribution forms was studied and the effect mechanism of connecting joints was clarified in this study, for the optimization of joint distribution, only seismic loads were considered, and the transportation conditions, field production, and mechanical equipment were not taken into account. Comprehensive optimization of the joints not only involves the performance of the joints but also needs to consider the problems of design, construction, and other professional factors, as well as firefighting, waterproofing, and other issues.


