Communication

Mapping National Mangrove Cover for Belize Using Google Earth Engine and Sentinel-2 Imagery

by
Jordan R. Cissell
1,2,*,
Steven W. J. Canty
2,3,
Michael K. Steinberg
4 and
Loraé T. Simpson
5
1
Department of Geography and Sociology, Samford University, Birmingham, AL 35229, USA
2
Smithsonian Marine Station, National Museum of Natural History, Fort Pierce, FL 34949, USA
3
Working Land and Seascapes, Smithsonian Institution, Washington, DC 20013, USA
4
Department of Geography, University of Alabama, Tuscaloosa, AL 35487, USA
5
Department of Research and Conservation, Florida Oceanographic Society, Stuart, FL 34996, USA
*
Author to whom correspondence should be addressed.
Appl. Sci. 2021, 11(9), 4258; https://doi.org/10.3390/app11094258
Submission received: 9 April 2021 / Revised: 30 April 2021 / Accepted: 5 May 2021 / Published: 8 May 2021
(This article belongs to the Section Earth Sciences)

Abstract

:
In this paper, we present the highest-resolution-available (10 m) national map of the mangrove ecosystems of Belize. These important ecosystems are increasingly threatened by human activities and climate change, support both marine and terrestrial biodiversity, and provide critical ecosystem services to coastal communities in Belize and throughout the Mesoamerican Reef ecoregion. Previous national- and international-level inventories document Belizean mangrove forests at spatial resolutions of 30 m or coarser, but many mangrove patches and loss events may be too small to be accurately mapped at these resolutions. Our 10 m map addresses this need for a finer-scale national mangrove inventory. We mapped mangrove ecosystems in Belize as of 2020 by performing a random forest classification of Sentinel-2 Multispectral Instrument imagery in Google Earth Engine. We mapped a total mangrove area of 578.54 km2 in 2020, with 372.04 km2 located on the mainland and 206.50 km2 distributed throughout the country’s islands and cayes. Our findings are substantially different from previous, coarser-resolution national mangrove inventories of Belize, which emphasizes the importance of high-resolution mapping efforts for ongoing conservation efforts.

1. Introduction

Mangroves are a diverse group of halophytic plants that are found along tropical and subtropical coastlines [1]. These highly productive ecosystems perform critical ecological functions (e.g., fish nurseries [2,3] and bird rookeries [4]), and they provide important ecosystem services to coastal communities (e.g., flood protection [5] and erosion prevention [6]). Mangroves are particularly important for their roles in climate change adaptation (e.g., coastal accretion in response to sea level rise [7]) and mitigation (e.g., carbon sequestration [8]). Within the Mesoamerican Reef (MAR) ecoregion, a transboundary resource shared by Mexico, Belize, Guatemala, and Honduras, mangrove protection averts significant flooding of land, and Belize is ranked the number one country globally for its benefits of mangroves (i.e., averted flood damages to property) relative to GDP [5].
Mangroves within the MAR are under considerable stress from both anthropogenic (e.g., coastal development [9,10,11,12]) and natural (e.g., localized eutrophication in combination with sea level rise [13]) threats, which resulted in mangrove cover declining by approximately 30% across the region between 1990 and 2010 [14]. Within the MAR, there is increasing interest to manage and conserve mangrove ecosystems, with countries looking to include mangroves in their Nationally Determined Contributions (NDCs) for the Paris Agreement [15,16,17]. Additionally, a regional strategy for the management, conservation, restoration, and monitoring of mangroves was launched in 2020 [18]. One of the main priorities identified by the management strategy and by [14]’s review of mangrove management in the region was the need for improved mangrove mapping at high spatial resolutions and with a consistent methodology implemented across the region.
Previous national-scale (e.g., [19,20] for Belize, [21] for Mexico) and global-scale (e.g., [10,22]) projects have used remote sensing to map mangrove cover for individual countries within the MAR and/or for the MAR as a whole. However, each of these studies used relatively coarse-resolution data (in most cases, 30 m Landsat data). Throughout the MAR, many mangrove cayes are too small to be accurately mapped using 30 m resolution data. These small mangrove cayes and small patches along the mainland coastal zone are among the most immediately threatened by human activity and sea level rise. Therefore, there is an urgent need to monitor changes to the MAR’s mangrove ecosystems at finer spatial resolutions. This high-resolution monitoring must be conducted using a consistent methodology throughout the region to ensure comparability among countries and locations.
In this paper, we present the first stage of our ongoing initiative to address these research needs. We used Google Earth Engine-based processing of Sentinel-2 satellite imagery to map mangrove ecosystem area in Belize as of 2020. This new map is both (a) the highest-resolution map of Belizean mangrove ecosystems currently available, and (b) the first stage of our ongoing project to map mangrove ecosystems across the entire MAR using high-resolution satellite imagery and a consistent classification methodology.
We chose Belize as the pilot country for this broader project for three reasons. First, we have a combined 40-plus years of field work experience among the mangrove ecosystems of Belize, including several recent remote-sensing based studies of local-scale mangrove changes that provided us with a “library” of georeferenced field observations with which to train our image classification algorithm. Second, the Belize Barrier Reef (BBR) hosts hundreds of the small cayes discussed above, and therefore presents an important case study for evaluating the effectiveness of Sentinel-2 imagery in the mapping of these cayes. Third, the Belizean government has included mangroves within their NDCs [15,17], and a high-resolution map of mangrove cover will assist in providing the most accurate estimate of mangrove carbon within Belizean mangroves.
Historically, high-resolution mangrove mapping has largely been limited to local-scale studies because high-resolution data can be prohibitively expensive (both financially and computationally) at broader scales. However, the relatively recent introductions of free-to-use Sentinel-2 satellite imagery and Google Earth Engine have significantly reduced the costs of acquiring and processing high-resolution data [23,24]. In recent years, Google Earth Engine and Sentinel-2 data have been widely used to map mangrove cover accurately and efficiently at a variety of scales [25,26,27].
As we discuss in more detail below, we specifically used a random forest classification algorithm. Random forest classification has also been widely used to map mangrove cover accurately and efficiently at a variety of scales [22,25,28,29,30,31].

2. Materials and Methods
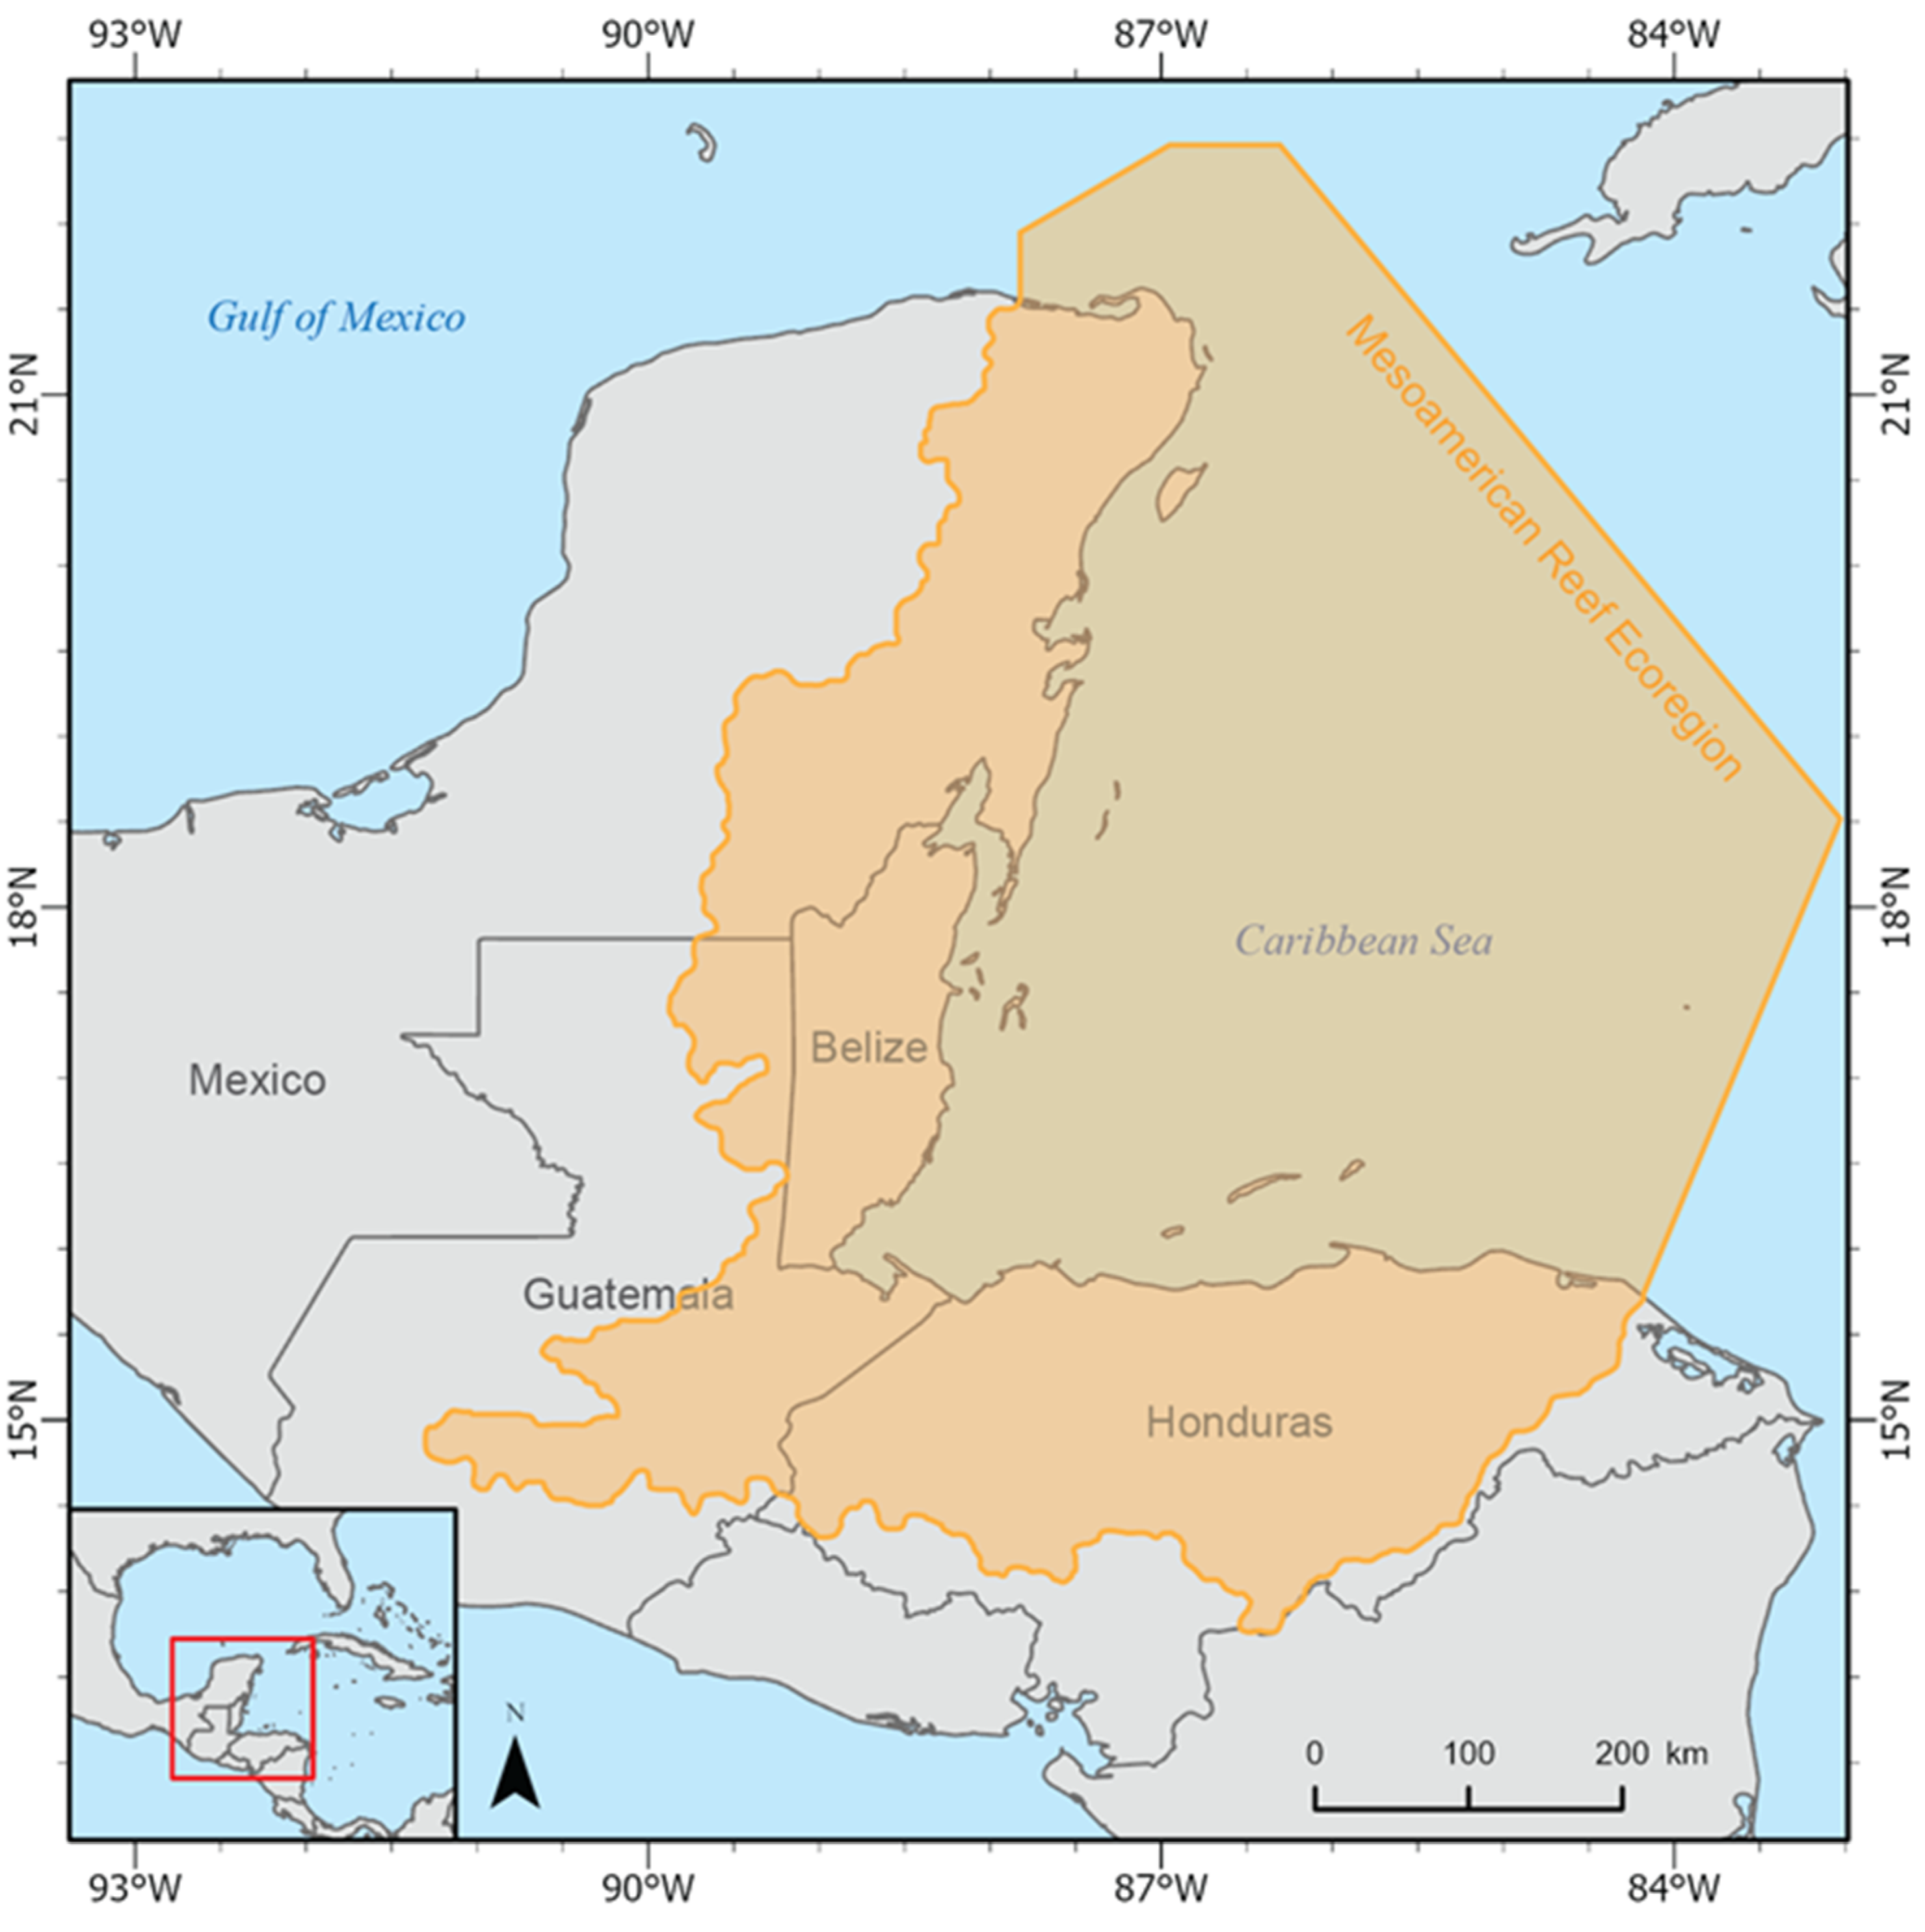
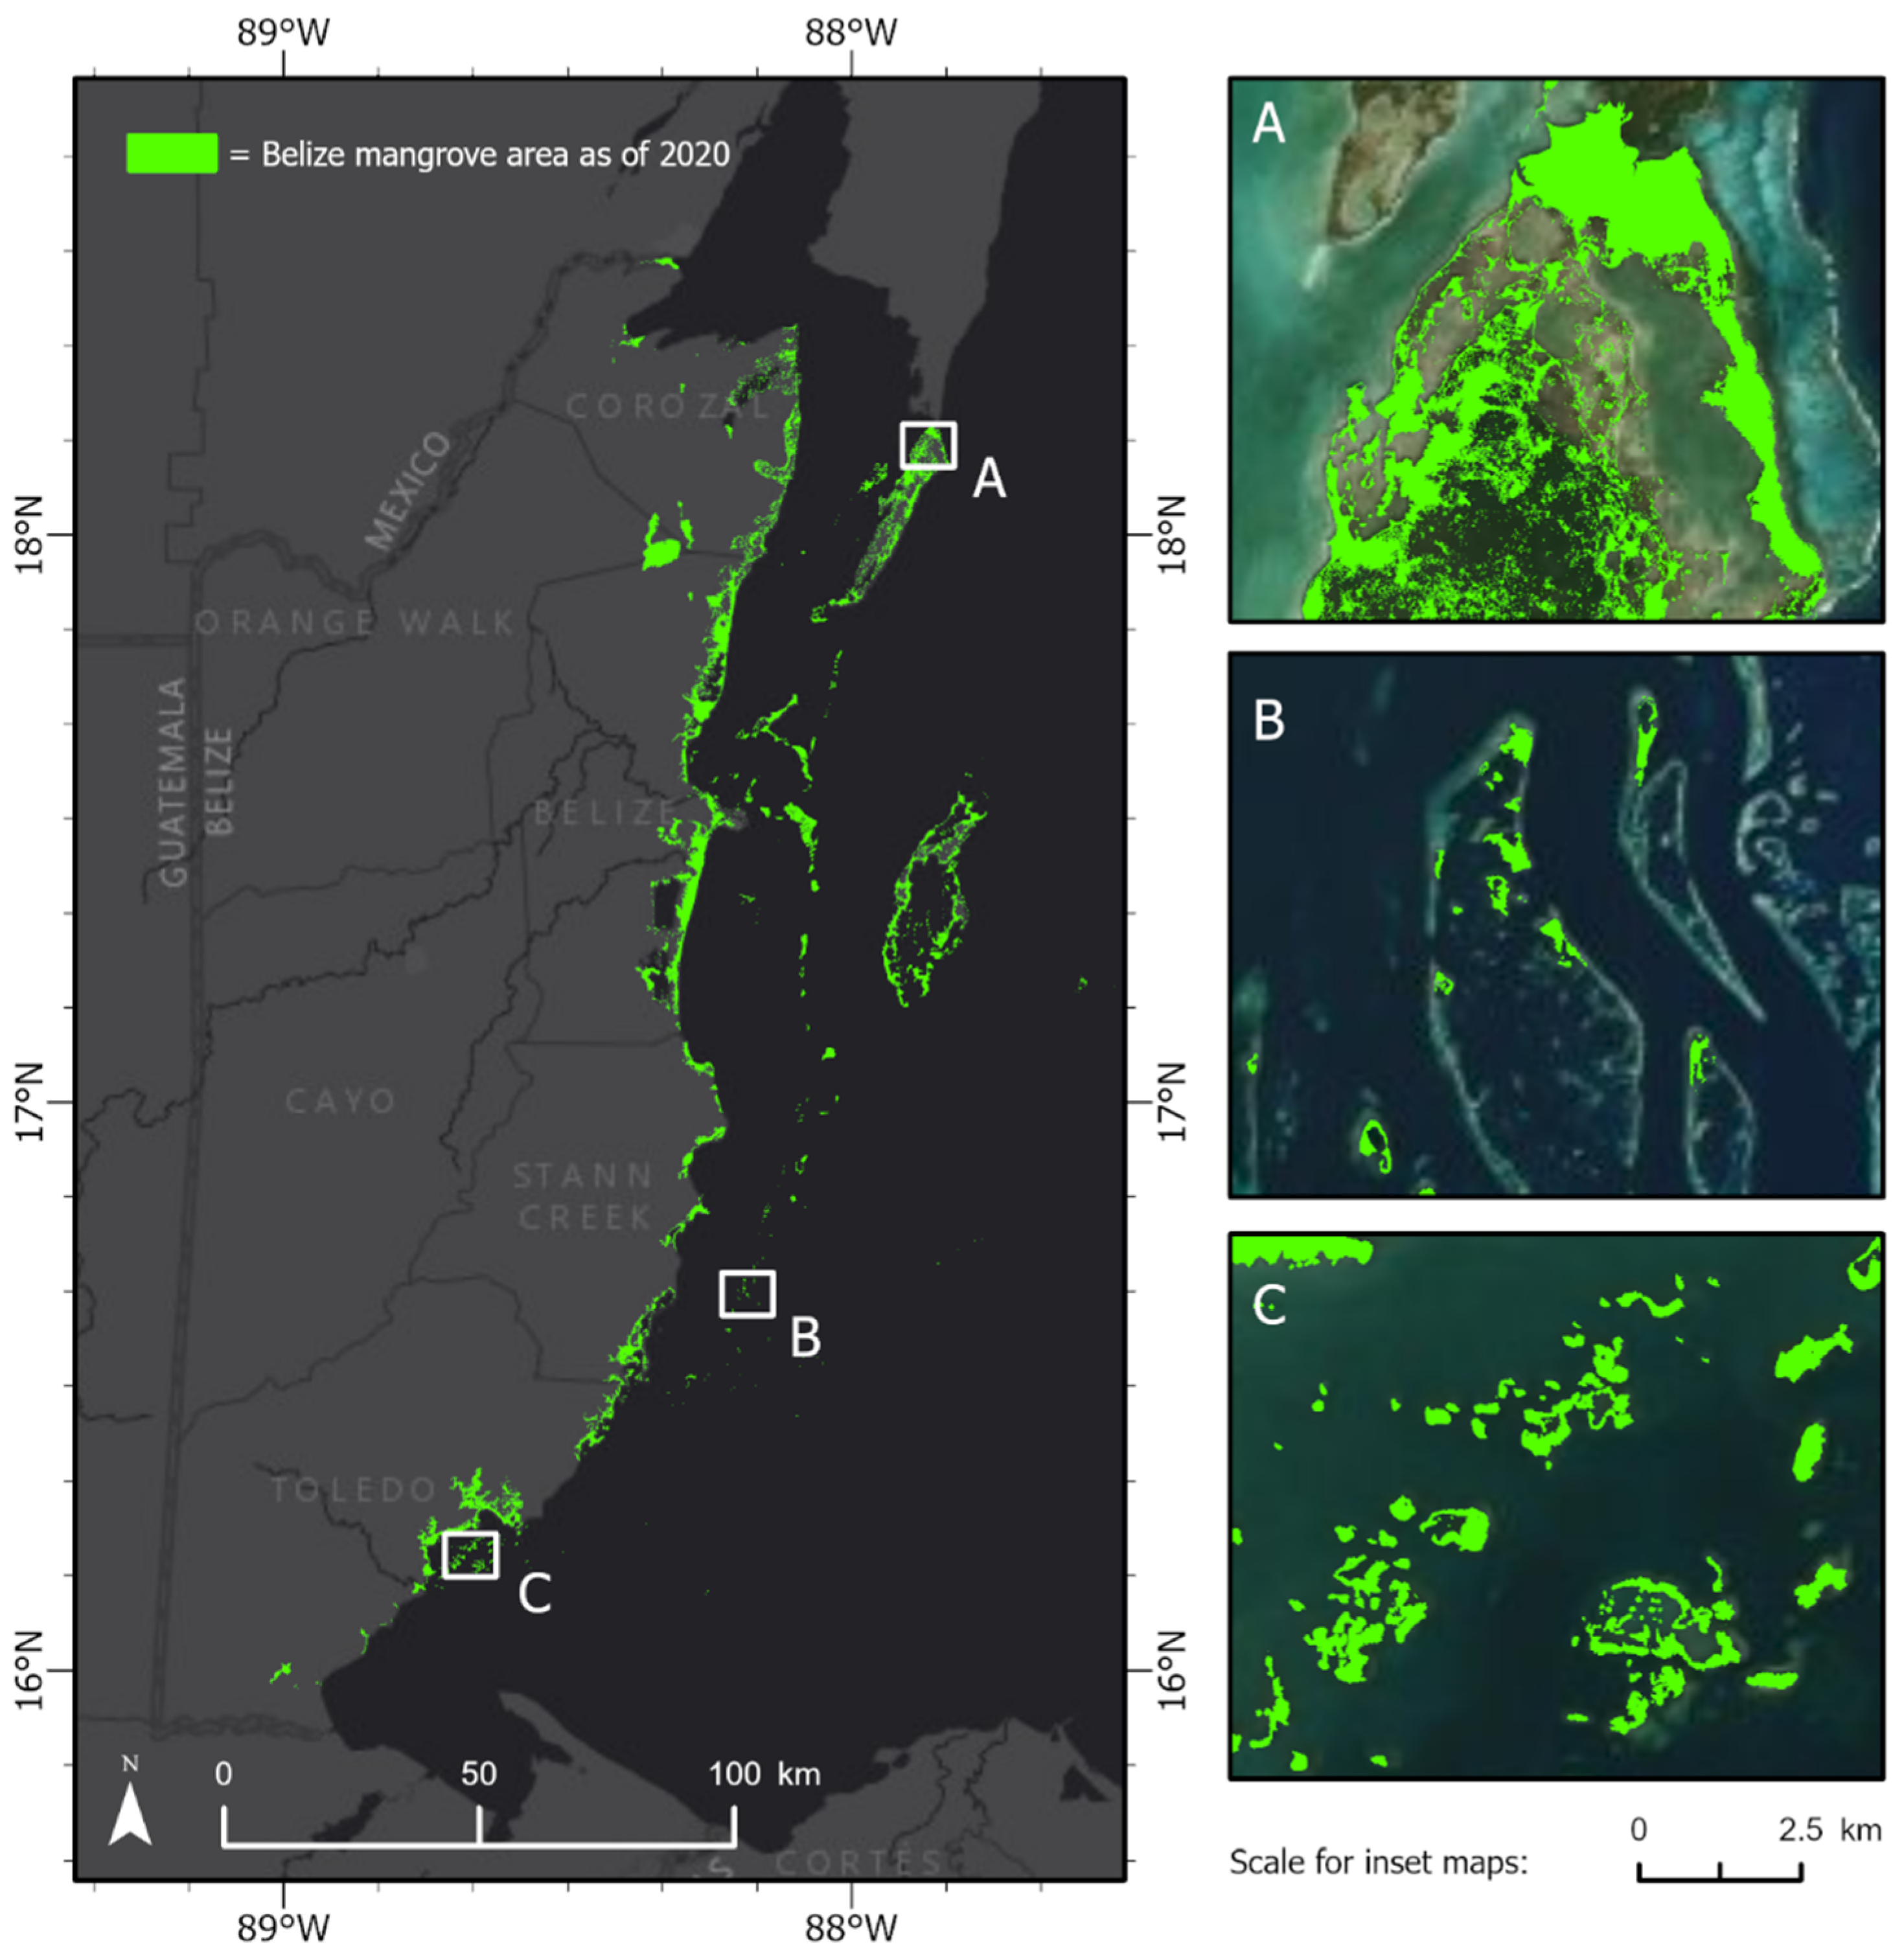
2.1. Study Area

Belize, located on the Caribbean coast of Central America between approximately 14.8° N and 18.5° N and 87.4° W and 89.3° W, has a total mainland and offshore land area of approximately 23,000 km2. Belize has mangrove ecosystems distributed along its mainland coastal zone and along the cayes of the BBR. Both the mainland and the cayes are included in the MAR ecoregion, which extends along most of the Caribbean coasts of Mexico and Honduras and the entire Caribbean coasts of Belize and Guatemala (Figure 1).

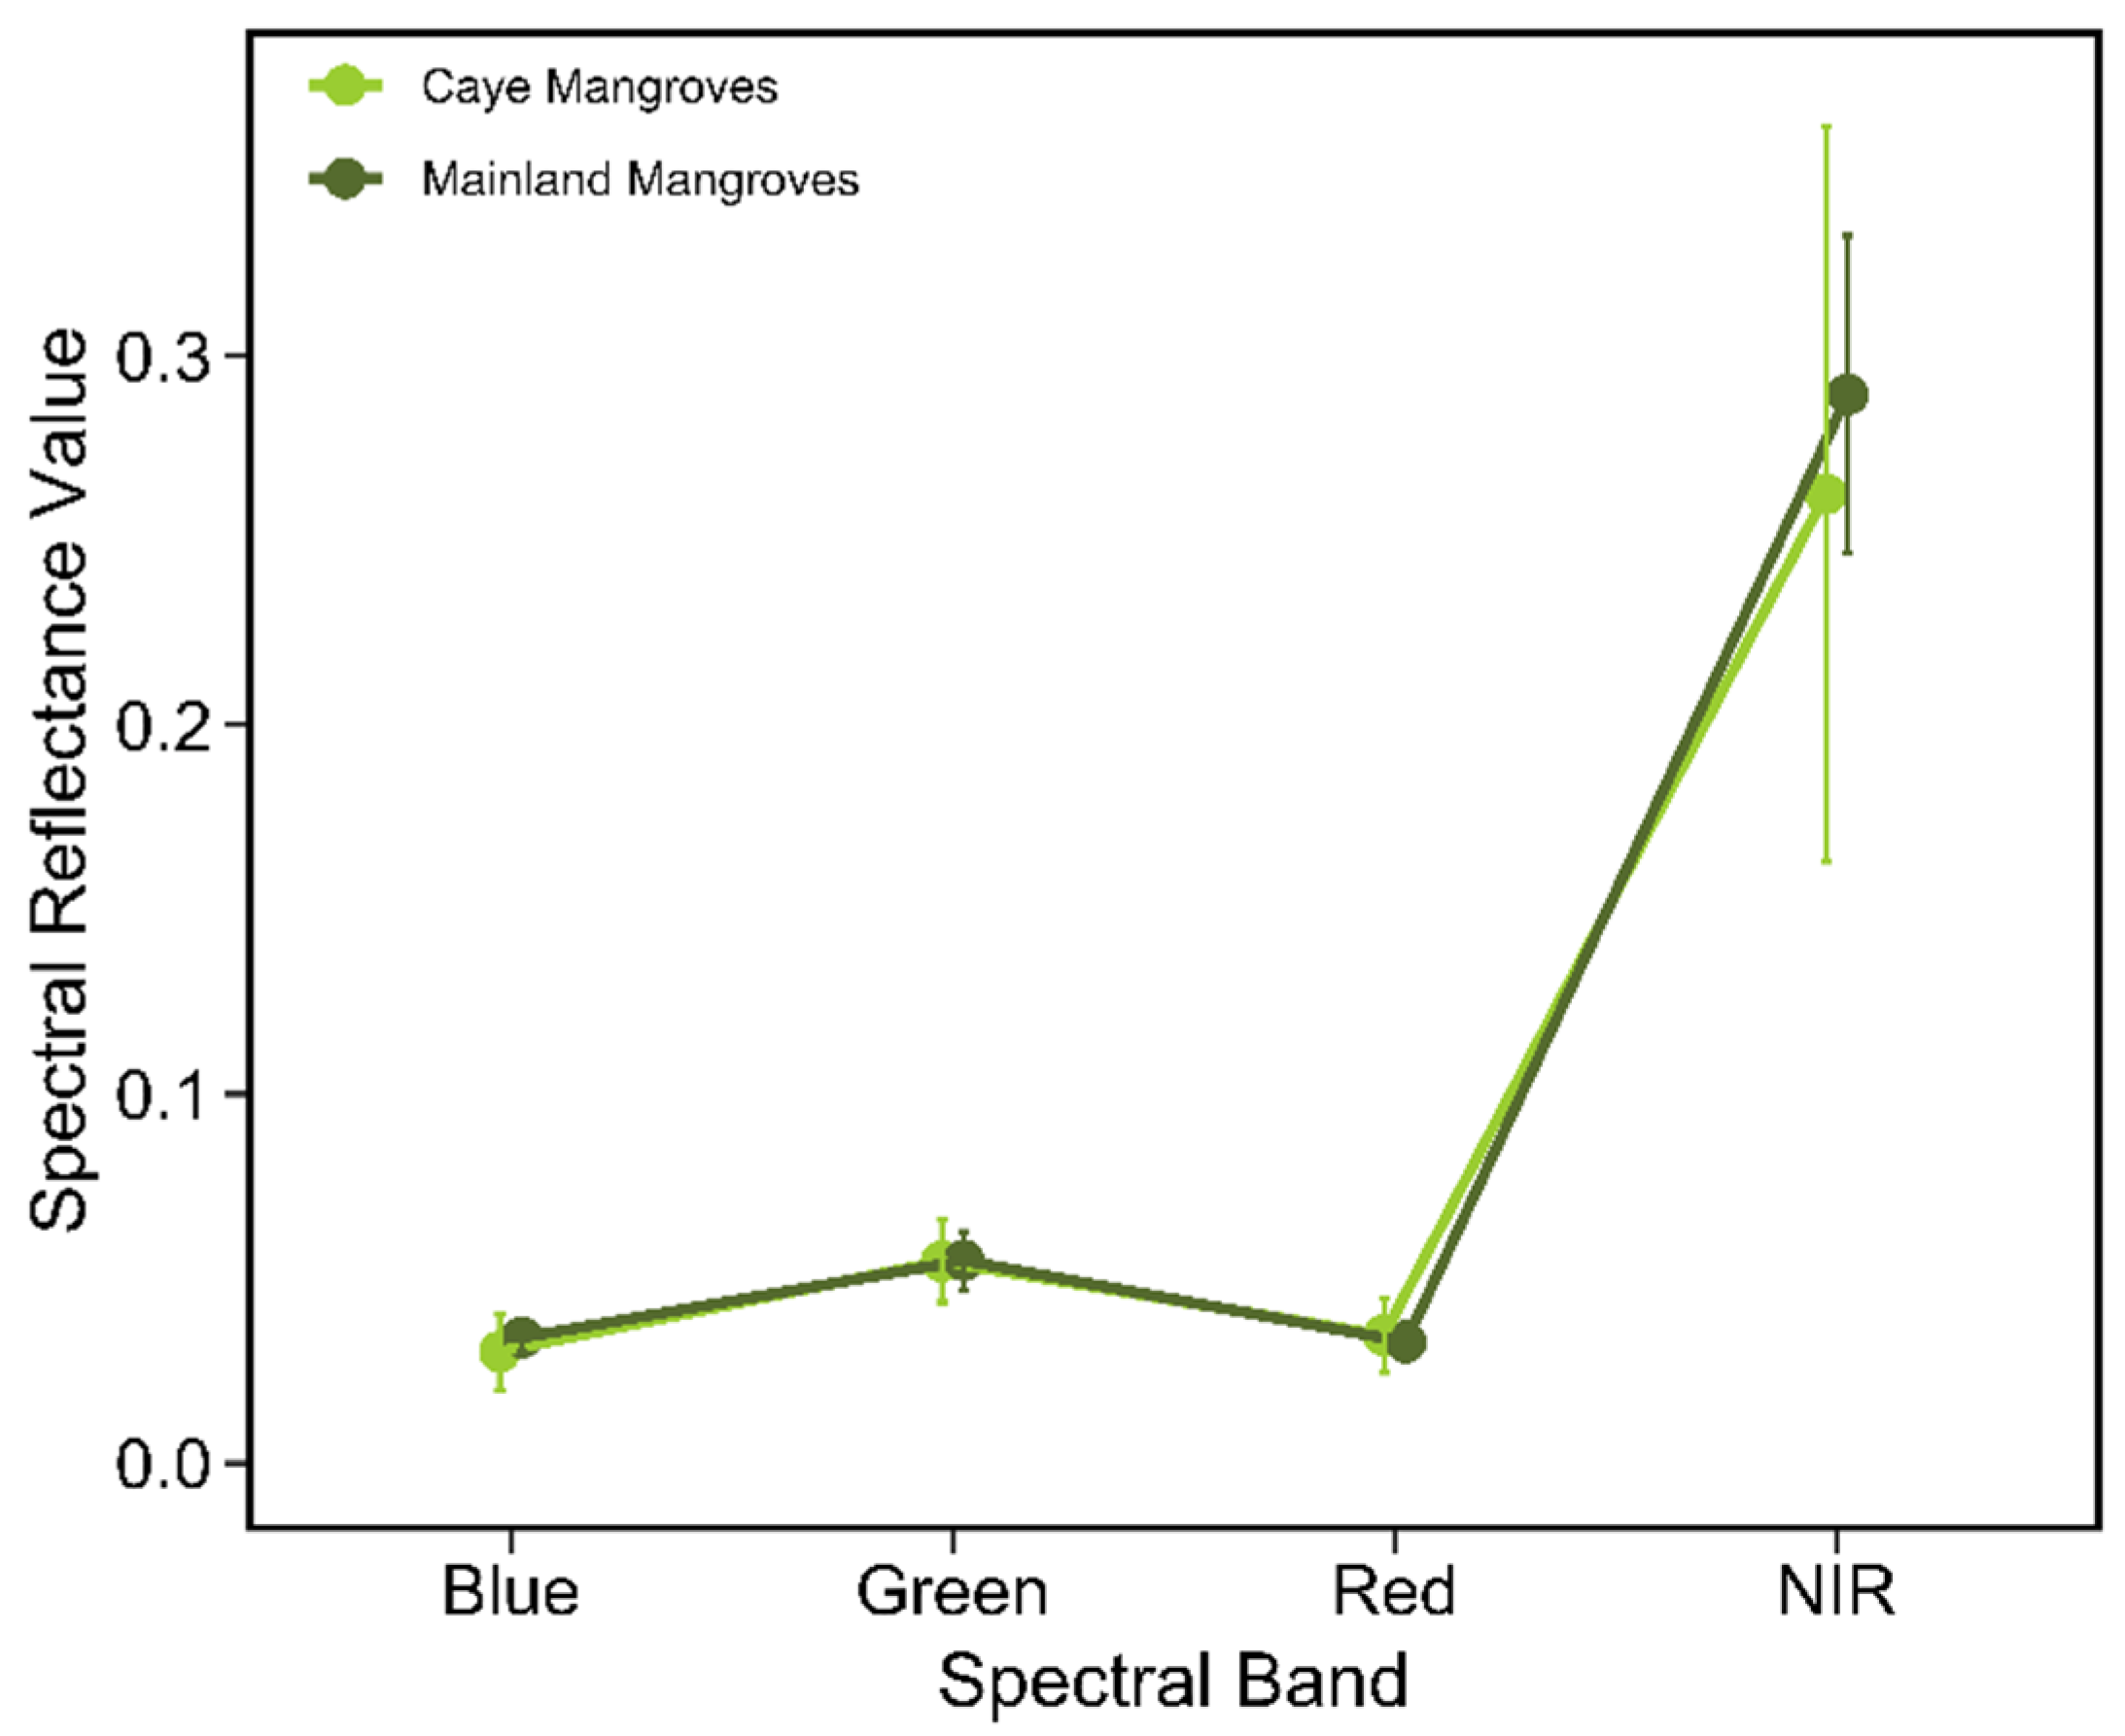
2.2. Field Observations

During three separate field campaigns in October 2017, August 2019, and October 2019, we collected ground verification data at locations throughout Northern and Southern Belize, along both the mainland coastal zone and the BBR. In total, we visited 339 ground control points throughout the country, recording the land cover type (i.e., mangrove or non-mangrove) and geographic coordinates at each point with 3 m accuracy. Using high-resolution (1 m or finer) Google Earth imagery captured in 2020, we checked each ground control point to verify that the land cover type at the point had not changed between the original collection date and 2020. We used these ground control points to “train” and refine our classification of the remotely sensed data, as outlined in further detail below.

2.3. Image Preprocessing

First, we created a 2020 study image by assembling a composite of cloud-free Sentinel-2 Multispectral Instrument (MSI) surface reflectance data, captured between 1 January 2020, and 31 May 2020. The composite included the blue (Band 2), green (Band 3), red (Band 4), and near-infrared (Band 8) spectral bands. For each of the four spectral bands, each pixel’s spectral reflectance value was the median value of that pixel across all available Sentinel-2 imagery captured between 1 January 2020, and 31 May 2020. We used the median value for each pixel to minimize the influence of potential outlier values on the classification process. We used the date range of 1 January 2020, through 31 May 2020, because the entire range falls within Belize’s dry season, reducing the potential influence of seasonality on the spectral reflectance values in the study image.
Second, we created a series of exclusion masks to eliminate portions of the study image that we knew did not contain mangroves, and therefore did not need to be included in the classification process. Eliminating extraneous portions of the study image before classification increases both the efficiency and the accuracy of the classification [32,33]. We used the Normalized Difference Water Index (NDWI) [34] to mask areas of open water (NDWI value > 0.0) out of the study image. We then used Shuttle Radar Topography Mission (SRTM) elevation data to mask areas of greater than or equal to 20 m elevation out of the study image. Finally, we used the Normalized Difference Mangrove Index (NDMI) [35] to reduce the number of non-mangrove pixels (NDMI value > 0.1) in the study image.
The SRTM data had a native resolution of 30 m. To calculate the NDMI mask, we used the shortwave-infrared band (Band 12) of the Sentinel-2 MSI surface reflectance data, which had a native resolution of 20 m. We resampled the SRTM and the Band 12 data layers to 10 m to create their respective masks, so that the masks would align properly with the 10 m study image. When integrating gridded data layers with different spatial resolutions, the conventional protocol is to resample the finer layer(s) to the coarsest resolution [36]. In this case, we resampled the coarser layers to the finest resolution because the SRTM and Band 12 data layers were not inputs to our classification algorithm. We used them solely to create masks with which to perform a “broad-stroke” reduction of the processing extent of our study image, before performing the more nuanced classification algorithm outlined below.

2.4. Image Classification

We used a random forest classification algorithm with 200 decision trees [25] to classify the masked study image into the following two land-cover classes: mangrove and non-mangrove. We used our 339 ground control points as the training data and the blue, green, red, and near-infrared spectral bands as the inputs to the classification algorithm. We used only these four bands because they (a) are of proven utility in discriminating mangrove and non-mangrove features [9,32] and (b) are the only four Sentinel-2 bands with 10 m spatial resolution. To use other, coarser-resolution bands in our analysis, we would have had to resample all bands to the coarsest resolution [36], thereby decreasing the resolution of our analysis. The algorithm collated the blue, green, red, and near-infrared spectral reflectance values at each mangrove and non-mangrove training point to determine the unique spectral signatures of mangrove and non-mangrove features in the study image [36]. Then, the algorithm assessed every other pixel in the study image and assigned it to either the mangrove or non-mangrove land-cover class, based upon which class’s spectral signature the pixel more closely matched. After the classification was complete, we masked out the non-mangrove pixels and kept the mangrove pixels to create the preliminary mangrove map.
Finally, we manually refined the preliminary mangrove map. Referencing our own knowledge of the study area, high-resolution (1 m or finer) Google Earth imagery, and the mangrove maps created by [19] and [22], we visually inspected the preliminary map and manually removed misclassified pixels. These misclassified areas were mainly low-elevation inland areas that were not filtered out by our elevation mask and water pixels that were not filtered out by our NDWI mask. We performed this refinement by drawing polygons around areas we wished to include in the finalized mangrove map. Areas not within these polygons were excluded from the finalized mangrove map. We drew these polygons directly in the Google Earth Engine user interface. The refinement polygons are integrated directly into our algorithm, so future users of our algorithm are not required to make their own further adjustments to achieve the same results. The output of this refinement process was the finalized 2020 Belize mangrove map.

2.5. Accuracy Assessment

We conducted a systematic accuracy assessment of our finalized mangrove map. We evaluated our map against reference data at a total of 2000 control points (1000 mangrove points and 1000 non-mangrove points). To create the mangrove control points, we randomly generated 1000 points within the areas classified as mangrove on our map. To create the non-mangrove control points, we randomly generated 1000 points within a 100 m buffer of the areas classified as mangrove on our map. We used high-resolution (1 m or finer) Google Earth imagery captured in 2020 as reference data [37].
We calculated the overall accuracy, Kappa coefficient, mangrove commission error, and mangrove omission error for our mangrove map [36]. Overall accuracy quantifies how accurately the classification process differentiated between mangrove and non-mangrove features. The Kappa coefficient quantifies the overall success of the classification relative to a random classification. Mangrove commission error quantifies the likelihood that a given mangrove pixel on the map is not mangrove, while mangrove omission error quantifies the likelihood that a given non-mangrove pixel on the map is mangrove.

3. Results

We identified and mapped a total of 578.54 km2 of mangrove ecosystem area as of 2020, with 372.04 km2 located along the mainland coastal zone and 206.50 km2 distributed throughout the chain of islands and cayes. Our classification was highly accurate, with an overall accuracy greater than 96% and a Kappa coefficient greater than 92% (Table 1).
We have included a static depiction of our finalized mangrove map, in which we have highlighted a selection of areas featuring small mangrove cayes (Figure 2). It was not possible to highlight every such location in the static map, and many of the finer-scale details are not visible on this map, especially the many small cayes along the Belize Barrier Reef. Therefore, we have included a supplemental KMZ layer depicting mangrove forested area (File S1). This KMZ layer can be opened in Google Earth or any other GIS program for a more detailed exploration of Belize’s mangrove extent.
Figure 3 compares the spectral reflectance curves for mangroves on the mainland and mangroves on the cayes.

4. Discussion

Our estimate of 578.54 km2 of mangrove ecosystem area is substantially different from the two most recent estimates: 478.31 km2 as of 2016 [22] and 721.69 km2 as of 2017 [20]. However, these results should not be interpreted as indicating that Belizean mangrove cover has either increased by approximately 100 km2 or decreased by approximately 140 km2 between 2016 and 2020. Instead, the discrepancies between our estimate and those of [20] and [22] are attributable primarily to differences in methodology and data resolution.
The 10 m Sentinel-2 data allowed us to map mangrove cayes that are likely too small to be identifiable in the coarser-resolution data used by [20] and [22] (see Figure 4 for a comparison). Additionally, we identified several areas of mangrove on the Belizean mainland that were not included in [22]’s estimate. The inclusion of these small cayes and large mainland stands is likely why our area estimate is substantially larger than that of [22].
The differences between our mangrove inventory and these two previous inventories underscore the importance of creating higher-resolution national mangrove maps, particularly with cloud-based geospatial processing programs such as Google Earth Engine making data- and computing-intensive efforts more feasible than ever before. Not only do high-resolution data offer the potential for more accurate estimates of national mangrove area, but they also offer the potential for maps that more accurately and explicitly depict mangrove distribution at local scales. Mangrove decline, conservation, and restoration take place in specific locations and within specific contexts [38,39]. Therefore, accurate and spatially explicit maps of local mangrove extent and distribution will be crucial components for ongoing mangrove conservation efforts. By refining previous estimates of Belizean mangrove area, our map will be of immediate use in helping Belize fulfill its NDC commitments for mangrove ecosystems. The incorporation of our new area calculation will improve estimates of the amount of carbon stored within Belize’s mangroves.
Mangroves will be increasingly threatened by both anthropogenic and natural processes in the near future [38,40,41,42]. Many of these changes take place at subtle scales [13], which 30 m resolution data may miss. Furthermore, small mangrove patches play a substantial role relative to their size in habitat connection and ecosystem service provision [43], and these small patches are the most immediately threatened. For both of these reasons, high-resolution monitoring will be essential for early detection and intervention in threatened mangrove ecosystems.
Because our methodology places the burden of data storage and computation on Google Earth Engine’s online servers, our classification methodology can be used by anyone with an internet connection. Expensive computers with advanced processing capabilities are not required. Therefore, our methodology is an affordable and accessible option that local stakeholders throughout the region can use for a quick and efficient update of mangrove maps for their area of interest, whether that area is local-, national-, or MAR-scale. We are developing workshops to train stakeholders in the use of our methodology, so that they can use it to “plug and play” high-resolution imagery to monitor future changes against our baseline.
The accuracy of our map also contributes further evidence to the effectiveness of random forest classification approaches for mangrove mapping. Prior studies that have used random forest classification [22,25,28,29,30,31] to map mangroves have usually attained overall classification accuracies between 85% and 95%, and Kappa coefficients between 80% and 90%. Our results are at the higher end of this accuracy range along with the results of [22], likely because both studies integrated manual refinement into our respective classification workflows.

5. Conclusions

Our map of mangrove ecosystem area for Belize as of 2020 is the highest-resolution and most recent national mangrove inventory currently available for the country. While this map presents a detailed snapshot of contemporary Belizean mangrove cover, we envision it being most useful as a baseline and methodology with which to monitor future mangrove changes in Belize and throughout the MAR.
This project represents the first stage of an ongoing project to map mangrove forested area for the entire MAR. The accuracy attained with this methodology offers encouraging evidence for the feasibility of the MAR-wide project. We are currently in the process of extending our Google Earth Engine-based methodology to the Mexican, Guatemalan, and Honduran portions of the MAR. Once we have established this 2020 baseline map for the entire region, we will regularly update our maps to monitor changes against this baseline in coming years. This will facilitate the monitoring of both mangrove declines in response to threats and mangrove increases through restoration.
We are also exploring options for extending our analysis by computing Normalized Difference Vegetation Index (NDVI) layers for each updated mangrove map. NDVI has been shown to correlate with mangrove health [44,45], and regularly updated NDVI maps could therefore help with earlier identification of mangrove distress or degradation before it leads to mangrove decline.

Supplementary Materials

The following are available online at https://www.mdpi.com/article/10.3390/app11094258/s1, File S1: KMZ file of the Belize mangrove map.

Author Contributions

Conceptualization, J.R.C., S.W.J.C., and M.K.S.; methodology, J.R.C., S.W.J.C., M.K.S., and L.T.S.; software, J.R.C.; writing—original draft preparation, J.R.C. and S.W.J.C.; writing—review and editing, J.R.C., S.W.J.C., M.K.S., and L.T.S.; funding acquisition, S.W.J.C. All authors have read and agreed to the published version of the manuscript.

Funding

This research was funded by the Mesoamerican Reef Fund, the Pew Charitable Trusts, and the Summit Foundation.

Institutional Review Board Statement

Not applicable.

Informed Consent Statement

Not applicable.

Data Availability Statement

The data presented in this study are available in the Supplementary Materials.

Acknowledgments

Thank you to the Toledo Institute for Development and Environment, Belize River Lodge, and the Crocodile Research Coalition for logistical support during field work. Thank you to Ethan C. Cissell for his valuable advice during the manuscript revision process. This is Smithsonian Marine Station Contribution No. 1160.

Conflicts of Interest

The authors declare no conflict of interest.

References

  1. Tomlinson, P.B. The Botany of Mangroves; Cambridge University Press: Cambridge, UK, 1994. [Google Scholar]
  2. Adams, A.J.; Murchie, K.J. Recreational fisheries as conservation tools for mangrove habitats. Am. Fish. Sci. Symp. 2015, 83, 43–56. [Google Scholar]
  3. Nagelkerken, I.; Roberts, C.M.; van der Velde, G.; Dorenbosch, M.; van Riel, M.C.; de la Cocheret, M.; Nienhuis, P.H. How important are mangroves and seagrass beds for coral-reef fish? The nursery hypothesis tested on an island scale. Mar. Ecol. Prog. Ser. 2002, 244, 299–305. [Google Scholar] [CrossRef] [Green Version]
  4. McFadden, T.N.; Kauffman, J.B.; Bhomia, R.K. Effects of nesting waterbirds on nutrient levels in mangroves, Gulf of Fonseca, Honduras. Wetl. Ecol. Manag. 2016, 24, 217–229. [Google Scholar] [CrossRef]
  5. Menéndez, P.; Iñigo, J.L.; Torres-Ortega, S.; Narayan, S.; Beck, M.W. The Global Flood Protection Benefits of Mangroves. Sci. Rep. 2020, 10, 4404. [Google Scholar] [CrossRef] [PubMed]
  6. Ewel, K.C.; Twilley, R.R.; Ong, J.E. Different kinds of mangrove forests provide different goods and services. Glob. Ecol. Biogeogr. Lett. 1998, 7, 83–94. [Google Scholar] [CrossRef]
  7. Krauss, K.W.; Cormier, N.; Osland, M.J.; Kirwan, M.L.; Stagg, C.L.; Nestlerode, J.A.; Russell, M.J.; Form, A.S.; Spivak, A.C.; Dantin, D.D.; et al. Created mangrove wetlands store belowground carbon and surface elevation change enables them to adjust to sea-level rise. Sci. Rep. 2017, 7, 1030. [Google Scholar] [CrossRef] [PubMed] [Green Version]
  8. Lovelock, C.E.; Duarte, C.M. Dimensions of Blue Carbon and emerging perspectives. Biol. Lett. 2019, 15, 20180781. [Google Scholar] [CrossRef]
  9. Cissell, J.R.; Steinberg, M.K. Human Landscape Modification in Placencia, Stann Creek District, Belize: Possible Implications for Crocodile Hybridization. J. Lat. Am. Geogr. 2020, 19, 218–242. [Google Scholar] [CrossRef]
  10. Spalding, M.; Kainuma, M.; Collins, L. World Atlas of Mangroves; Earthscan: Washington, DC, USA, 2010. [Google Scholar]
  11. Steinberg, M.K. A nationwide assessment of threats to bonefish, tarpon, and permit stocks and habitat in Belize. Environ. Biol. Fishes 2015, 98, 2277–2285. [Google Scholar] [CrossRef]
  12. Sweetman, B.M.; Cissell, J.R.; Rhine, S.; Steinberg, M.K. Land Cover Changes on Ambergris Caye, Belize: A Case Study of Unregulated Tourism Development. Prof. Geogr. 2019, 71, 123–234. [Google Scholar] [CrossRef]
  13. Simpson, L.T.; Canty SW, J.; Cissell, J.R.; Steinberg, M.K.; Cherry, J.A.; Feller, I.C. Bird Rookeries and Nutrient Over-Enrichment as Potential Accelerants of Mangrove Cay Decline in Belize. Oecologia, In Revision.
  14. Canty SW, J.; Preziosi, R.F.; Rowntree, J.K. Dichotomy of mangrove management: A review of research and policy in the Mesoamerican reef region. Ocean Coast. Manag. 2018, 157, 40–49. [Google Scholar] [CrossRef] [Green Version]
  15. Government of Belize. 2016. Nationally Determined Contribution under the United Nations Framework Convention on Climate Change. Bel-Mopan, Belize: Government of Belize. Available online: https://www4.unfccc.int/sites/ndcstaging/PublishedDocuments/Belize%20First/BELIZE%27s%20%20NDC.pdf (accessed on 23 February 2021).
  16. Kumagi, J.A.; Costa, M.T.; Ezcurra, E.; Aburto-Oropeza, O. Prioritizing mangrove conservation across Mexico to facilitate 2020 NDC ambition. Ambio 2020, 49, 1992–2002. [Google Scholar] [CrossRef]
  17. The Blue Carbon Initiative. 2020. Blue Carbon and Nationally Determined Contributions. Arlington, Virginia: Conservation International, Intergovernmen-tal Oceanographic Commission of UNESCO, International Union for Conservation of Nature. 2020. Available online: https://static1.squarespace.com/static/5c7463aaa9ab95163e8c3c2e/t/5eebd563fc0c543da1ea69ab/1592513897734/Blue_Carbon_NDC_Guidelines_spread.pdf (accessed on 23 February 2021).
  18. Rivas, A.B.; González, C.; Canty, S.; Rodríguez Olivet, C.; Flamenco, X.; González, M.J.; Escobedo, M. Regional Strategy for Mangrove Management, Conservation, Restoration and Monitoring in the Mesoamerican Reef 2020–2025; Mesoamerican Reef Fund: Guatemala City, Guatemala, 2020. [Google Scholar] [CrossRef]
  19. Cherrington, E.A.; Ek, E.; Cho, P.; Howell, B.F.; Hernandez, B.E.; Anderson, E.R.; Flores, A.I.; Garcia, B.C.; Sempris, E.; Irwin, D.E. Forest Cover and Deforestation in Belize: 1980–2010; Water Center for the Humid Tropics of Latin America and the Caribbean (CATHALAC): Panama City, Panama, 2010. [Google Scholar]
  20. Delgado, F.J.; Cherrington, E.A.; Griffin, R.; Hernandez, B.E.; Anderson, E.R.; Flores Cordova, A.I.; Muench, R.; Markert, K.N.; Adams, E.C.; Limaye, A.S.; et al. Use of Earth Observation data for assessing change in mangrove cover across the Belize Barrier Reef Reserve System-World Heritage Site. In Proceedings of the Conference abstract for American Geophysical Union Fall Meeting, San Francisco, CA, USA, 9–13 December 2019. [Google Scholar]
  21. Valderrama Landeros, L.H.; Rodriguez Zúñiga, M.T.; Troche Souza, C.; Velázquez Salazar, S.; Villeda Chávez, E.; Alcántara Maya, J.A.; Vázquez Balderas, B.; Cruz López, M.I.; Ressl, R. Manglares de México: Actualización y Exploración de los Datos del Sistema de Monitoreo 1970/1980-2015; Comisión Nacional para el Conocimiento y Uso de la Biodiversidad (CONABIO): Mexico City, México, 2017. [Google Scholar]
  22. Bunting, P.; Rosenqvist, A.; Lucas, R.M.; Rebelo, L.M.; Hilarides, L.; Thomas, N.; Hardy, A.; Itoh, T.; Shimada, M.; Finlayson, C.M. The Global Mangrove Watch—A new 2010 global baseline of mangrove extent. Remote Sens. 2018, 10, 1669. [Google Scholar] [CrossRef] [Green Version]
  23. Gorelick, N.; Hancher, M.; Dixon, M.; Ilyushchenko, S.; Thau, D.; Moore, R. Google Earth Engine: Planetary-scale geospatial analysis for everyone. Remote Sens. Environ. 2017, 202, 18–27. [Google Scholar] [CrossRef]
  24. Kumar, L.; Mutanga, O. Google Earth Engine Applications since Inception: Usage, Trends, and Potential. Remote Sens. 2018, 10, 1509. [Google Scholar] [CrossRef] [Green Version]
  25. Hu, L.; Nan, X.; Liang, J.; Li, Z.; Chen, L.; Zhao, F. Advancing the Mapping of Mangrove Forests at National-Scale Using Sentinel-1 and Sentinel-2 Time-Series Data with Google Earth Engine: A Case Study in China. Remote Sens. 2020, 12, 3120. [Google Scholar] [CrossRef]
  26. Maung, W.S.; Sasaki, J. Assessing the Natural Recovery of Mangroves after Human Disturbance Using Neural Network Classification and Sentinel-2 Imagery in Wunbaik Mangrove Forest, Myanmar. Remote Sens. 2021, 13, 52. [Google Scholar] [CrossRef]
  27. Yancho JM, M.; Jones, T.G.; Gandhi, S.R.; Ferster, C.; Lin, A.; Glass, L. The Google Earth Engine Mangrove Mapping Methodology (GEEMMM). Remote Sens. 2020, 12, 3578. [Google Scholar] [CrossRef]
  28. Chen, N. Mapping mangrove in Dongzhaigang, China using Sentinel-2 imagery. J. Appl. Remote Sens. 2020, 14, 014508. [Google Scholar] [CrossRef]
  29. Elmahdy, S.I.; Ali, T.A.; Mohamed, M.M.; Howari, F.M.; Abouleish, M.; Simonet, D. Spatiotemporal Mapping and Monitoring of Mangrove Forests Changes From 1990 to 2019 in the Northern Emirates, UAE Using Random Forest, Kernel Logistic Regression and Naïve Bayes Tree Models. Front. Environ. Sci. 2020, 8, 102. [Google Scholar] [CrossRef]
  30. Li, H.; Jia, M.; Zhang, R.; Ren, Y.; Wen, X. Incorporating the Plant Phenological Trajectory into Mangrove Species Mapping with Dense Time Series Sentinel-2 Imagery and the Google Earth Engine Platform. Remote Sens. 2019, 11, 2479. [Google Scholar] [CrossRef] [Green Version]
  31. Pimple, U.; Simonetti, D.; Sitthi, A.; Punhkul, S.; Leadprathom, K.; Skupek, H.; Som-ard, J.; Gond, V.; Towprayoon, S. Google Earth Engine Based Three Decadal Landsat Imagery Analysis for Mapping of Mangrove Forests and Its Surroundings in the Trat Province of Thailand. J. Comput. Commun. 2018, 6, 247–264. [Google Scholar] [CrossRef] [Green Version]
  32. Cissell, J.R.; Delgado, A.M.; Sweetman, B.M.; Steinberg, M.K. Monitoring mangrove forest dynamics in Campeche, Mexico, using Landsat satellite data. Remote Sens. Appl. Soc. Environ. 2018, 9, 60–68. [Google Scholar] [CrossRef]
  33. Jones, T.G.; Ratsimba, H.R.; Ravaoarinorotsihoarana, L.; Cripps, G.; Bey, A. Ecological variability and carbon stock estimates of mangrove ecosystems in Northwestern Madagascar. Forests 2014, 5, 177–205. [Google Scholar] [CrossRef] [Green Version]
  34. McFeeters, S.K. The use of the Normalized Difference Water Index (NDWI) in the delineation of open water features. Int. J. Remote Sens. 1996, 17, 1425–1432. [Google Scholar] [CrossRef]
  35. Shi, T.; Liu, J.; Hu, Z.; Liu, H.; Wang, J.; Wu, G. New spectral metrics for mangrove forest identification. Remote Sens. Lett. 2016, 7, 885–894. [Google Scholar] [CrossRef]
  36. Jensen, J.R. Introductory Digital Image Processing: A Remote Sensing Perspective, 4th ed.; Prentice Hall: Upper Saddle River, NJ, USA, 2015. [Google Scholar]
  37. Congalton, R.G.; Green, K. Assessing the Accuracy of Remotely Sensed data: Principles and Practices, 2nd ed.; CRC Press: Boca Raton, FL, USA, 2008. [Google Scholar]
  38. Feller, I.C.; Friess, D.A.; Krauss, K.W.; Lewis, R.R. The state of the world’s mangroves in the 21st century under climate change. Hydrobiologia 2017, 803, 1–12. [Google Scholar] [CrossRef] [Green Version]
  39. Zaldívar-Jiménez, A.; Ladrón-de-Guevara-Porras, P.; Pérez-Ceballos, R.; Díaz-Mondragón, S.; Rosado-Solórzano, R. US-Mexico joint Gulf of Mexico large marine ecosystem based assessment and management: Experience in community involvement and mangrove wetland restoration in Terminos Lagoon, Mexico. Environ. Dev. 2017, 22, 206–213. [Google Scholar] [CrossRef]
  40. Friess, D.A.; Rogers, K.; Lovelock, C.E.; Krauss, K.W.; Hamilton, S.E.; Lee, S.Y.; Lucas, R.; Primavera, J.; Rajkaran, A.; Shi, S. The state of the world’s mangrove forests: Past, present, and future. Annu. Rev. Environ. Resour. 2019, 44, 89–115. [Google Scholar] [CrossRef] [Green Version]
  41. Friess, D.A.; Yando, E.S.; Abuchala GM, O.; Adams, J.B.; Cannicci, S.; Canty SW, J.; Cavanaugh, K.C.; Connolly, R.M.; Cormier, N.; Dahdouh-Guebas, F.; et al. Mangroves give cause for conservation optimism, for now. Curr. Biol. 2020, 30, R135–R158. [Google Scholar] [CrossRef] [Green Version]
  42. Ward, R.D.; Friess, D.A.; Day, R.H.; Mackenzie, R.A. Impacts of climate change on mangrove ecosystems: A region by region overview. Ecosyst. Health Sustain. 2016, 2, e01211. [Google Scholar] [CrossRef] [Green Version]
  43. Curnick, D.J.; Petteroelli, N.; Aldrie Amir, A.; Balke, T.; Barbier, E.B.; Crooks, S.; Dahdouh-Guebas, F.; Duncan, C.; Endsor, C.; Friess, D.A.; et al. The value of small mangrove patches. Science 2019, 363, 239. [Google Scholar]
  44. Kuenzer, C.; Bluemel, A.; Gebhart, S.; Quoc, T.V.; Dech, S. Remote Sensing of Mangrove Ecosystems: A Review. Remote Sens. 2011, 3, 879–928. [Google Scholar] [CrossRef] [Green Version]
  45. Pham, T.D.; Yokoya, N.; Bui, D.T.; Yoshino, K.; Friess, D.A. Remote Sensing Approaches for Monitoring Mangrove Species, Structure, and Biomass: Opportunities and Challenges. Remote Sens. 2019, 11, 230. [Google Scholar] [CrossRef] [Green Version]
Figure 1. Map of Belize and its location within the Mesoamerican Reef ecoregion.
Applsci 11 04258 g001
Figure 2. Mangrove area in Belize as of 2020. Insets provide more detailed images of mangrove cover in (A) Bacalar Chico National Park and Marine Reserve, (B) South Water Caye Marine Reserve, and (C) Port of Honduras Marine Reserve.
Applsci 11 04258 g002
Figure 3. Spectral reflectance curves for mangroves on the mainland and mangroves on the cayes. Error bars represent 1 standard deviation from the mean.
Applsci 11 04258 g003
Figure 4. Comparison of mangrove cover in cayes identified by (A) this study and (B) Bunting et al. [22], demonstrating the advantage of higher-resolution data for mapping small mangrove cayes.
Applsci 11 04258 g004
Table 1. Summary of accuracy assessment results.
Accuracy Assessment Error Matrix
Reference Data
MangroveNon-MangroveRow Total
Finalized mangrove mapMangrove960401000
Non-mangrove349661000
Column total99410062000
Overall accuracy:96.30%
Kappa coefficient:92.60%
Mangrove commission error:4.00%
Mangrove omission error:3.42%
Publisher’s Note: MDPI stays neutral with regard to jurisdictional claims in published maps and institutional affiliations.

