Article

SLLB-DEVS: An Approach for DEVS Based Modeling of Semiconductor Lithography Load Balance

1
Frontier College, Inha University, 100 Inha-ro, Michuhol-gu, Incheon 22212, Korea
2
Department of Computer Engineering, Inha University, 100 Inha-ro, Michuhol-gu, Incheon 22212, Korea
3
Department of Software Convergence Engineering, Inha University, 100 Inha-ro, Michuhol-gu, Incheon 22212, Korea
*
Authors to whom correspondence should be addressed.
Appl. Sci. 2021, 11(9), 4235; https://doi.org/10.3390/app11094235
Submission received: 14 April 2021 / Revised: 2 May 2021 / Accepted: 5 May 2021 / Published: 7 May 2021
(This article belongs to the Section Applied Industrial Technologies)

Abstract

:
In industrial applications, software related to computational lithography using a DP system method, which refers to how efficiently hardware resources are used, has a significant impact on performance. Because the amount of data to be processed per unit of time is comparatively large in the current semiconductor industry, the efficiency of hardware should be increased through job 12 scheduling by using the most efficient load balancing techniques possible. For efficient scheduling of the load balancer, these are necessary to predict the end time of a given job; this is calculated based on the performance of computing resources and the development of effective traffic distribution algorithms. Due to the high integration of semiconductor chips, the volume of mask exposure data has increased exponentially, the number of slave nodes is increasing, and most EDA tools require one license per DP node to perform a simulation. In this paper, in order to improve efficiency and reduce cost through more efficient load balancing scheduling, a new type of DEVS load balancing method was studied based on the existing industrial E-beam cluster model. The designed DEVS model showed up to four times the throughput of the existing legacy model for medium and large clusters when the BSF policy was applied.

1. Introduction

The lithography process refers to an exposure technique in which light is exposed on a circuit diagram-drawn mask pattern plate, following which a circuit pattern is reduced and drawn on a wafer with a photoresistor.
As the lithography process develops, a smaller chip can be implemented, which is a key process in semiconductor design. The core equipment of the process is a scanner, a device that exposes light to the wafer. The better the scanner, the less scattering, diffusion, and diffraction of light when using light of a smaller wavelength, enabling sophisticated circuits to be drawn.
As semiconductor manufacture processes increasingly require precise and complex nano-patterns, E-beam lithography technology is being mainly used. Electron beam wavelengths are much smaller than light.
Currently, the industry utilizes a scanner using a light source of 193 nm ArF (argon fluoride) wavelength and an EUV (extreme ultra-violet) light source with a wavelength of 13.5 nm. However, as EUV devices are very expensive and stability issues are often discussed, technologies such as immersion, double patterning (DPT), and computational lithography, that can expose highly integrated circuits using a light source of 193 nm ArF wavelength, have been developed [1,2].
Of these, the technology of computation lithography is actively utilized, but its limitation is that the data volume to be calculated for exposure is very large, which leads to an increase in the TAT (turnaround time) of the mask process [3]. Turnaround time is the total amount of time between the process coming into a ready state for the first time and its completion. To improve this, related research fields are trying to solve the delay problems in various forms, such as scaling up, which invests large computing resources into computation lithography, distributing the processing system scale-out. However, because commercial EDA tools (E-beam) set a license price per computing core, parallel computing leads to an enormous increase in hardware and software cost. As a result, a management and operation methodology that reduces TAT using minimal computing resources is becoming especially important in the field [4,5].
In this study, we utilized a default DEVS model; its modeling E-beam cluster operational form in the field is shown in Figure 1. We propose a new simulation-based DEVS load balancing method based on the studied model, which applies characteristics of the E-beam cluster.
Load balancing is a computer server clustering service that solves bottlenecks by appropriately distributing processing across multiple servers. When an excessive workload is input, a load balancer should predict the optimal job distribution and then load the calculated jobs onto a distributed processing server. The effect of optimized load balancing makes it possible to expand the server without expensive new equipment. Therefore, if a failure occurs in the operating server, packets are automatically distributed to the prepared operating server using a predefined algorithm without service interruption to provide a normal service. When a bottleneck occurs, the load balancer automatically detects this, and distributes the workload without service interruption [6,7].
DEVS (discrete event system specification) is a methodology that describes the dynamic change of a system by changing the state according to the occurrence of an event [8]. In the early manufacturing field, a hardware-in-the-simulation technology was proposed to create a simulation model for a manufacturing system using DEVS methodology and link it with the control system [9]. The DEVS methodology has been gradually extended to various simulation fields. It has been influential in a wide range of fields related to simulation [10]. DEVS can be used to perform a double verification with the existing simulator, or to add functions not included in original solution; this approach is termed HDEVS [11]. This methodology can also be applied to very large-scale problems, and not only at a small research level [12].
Our studies were conducted to decrease the delay and improve the verification structure by applying DEVS to solve various problems in the semiconductor field [13,14]. Furthermore, we propose an improved load balancing method for management and operation using a model simulation with an analysis of the characteristics and the performance of various load balancing policies.

2. Methodology

2.1. The Legacy Load Balancer Model

As shown in Figure 2, the E-beam cluster currently used in the industrial field initially checks whether all work nodes are in an idle state when exposure work enters the master server. When all nodes are idle, the master server allocates jobs to each computing node and processes them in parallel [15]. When tasks are performed on each computing node, license fees and hardware resource costs are incurred. The structure of the current architecture makes it easy to understand the order of the jobs in the central server and to easily predict the processing time. However, unnecessary hardware and license costs are incurred as a result. This model can be modeled using an FIFO (first in first out) design, which is a traditional scheduling method. FIFO is a load balancing policy that assigns E-beam jobs to all computing nodes, in order to perform tasks when all computing nodes are idle for E-beam jobs.

2.2. Load Balancer Policy
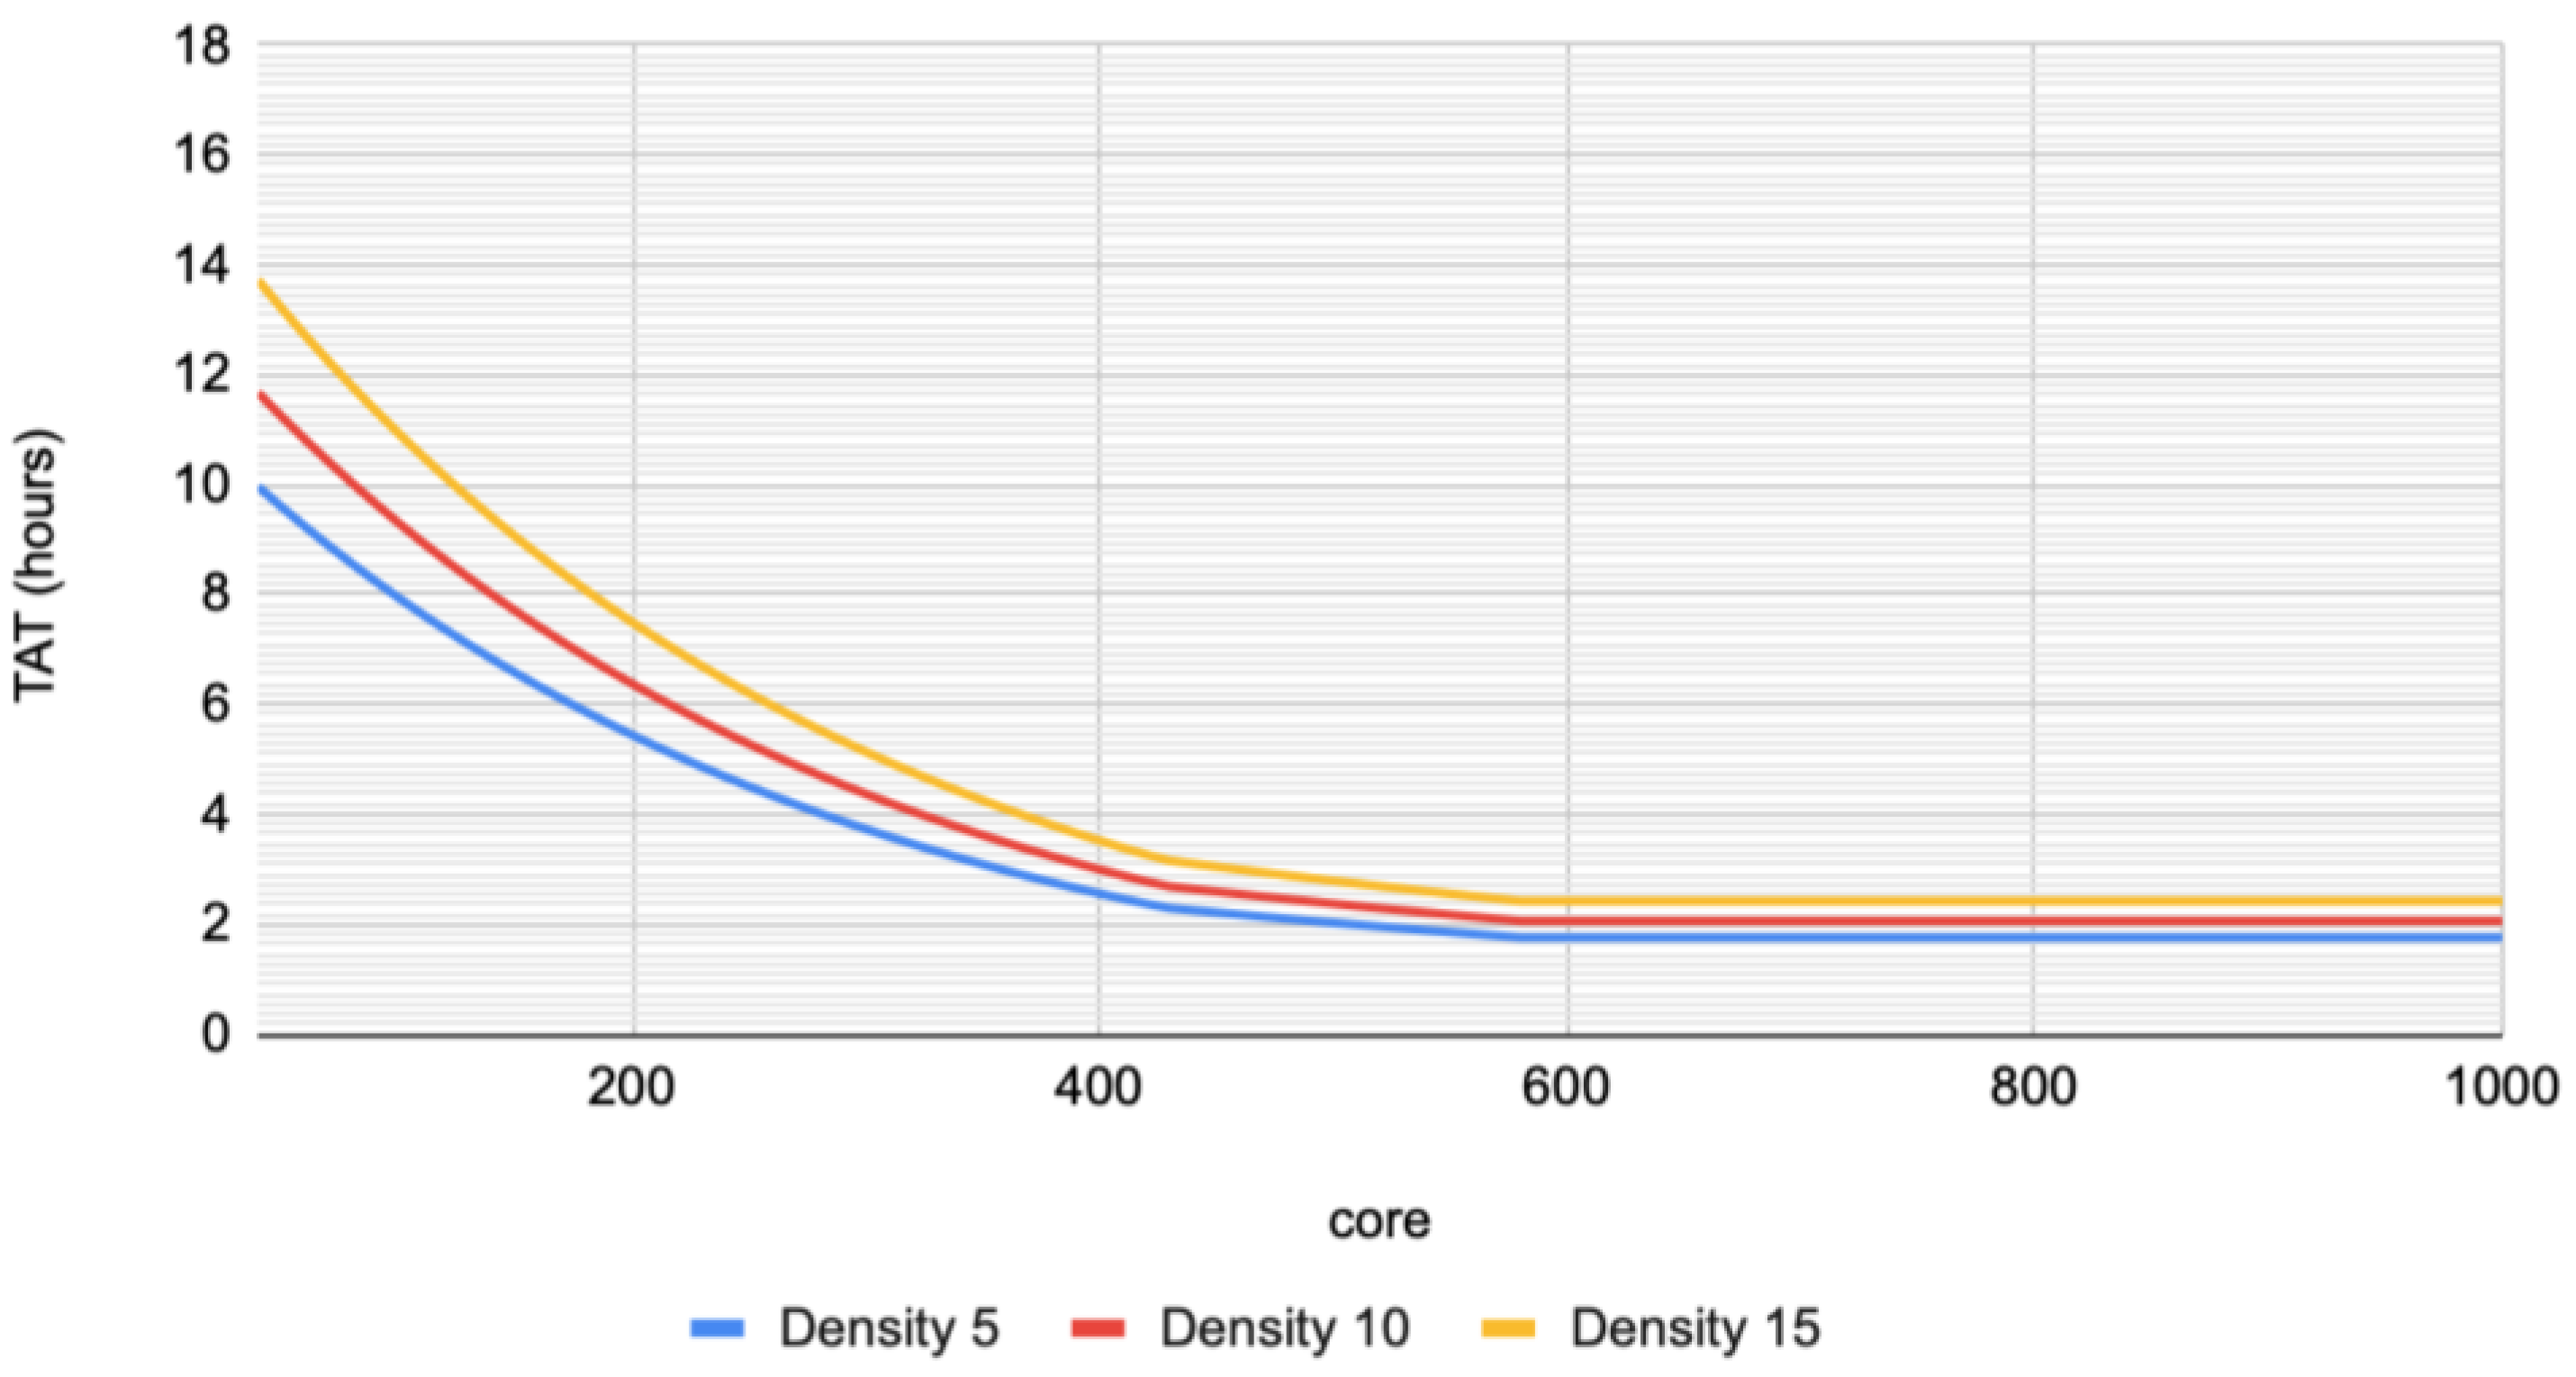
Scale-out and scale-up are methodological approaches to improve the processing power of the server. Scale-out is a method of increasing the absolute number of servers, and scale-up is a method of improving each computing power through component upgrades. In a scale-out distributed environment, the load balancer always emphasizes scalability and the overspecification problem. The E-beam cluster architecture should then also consider a new load balancer design to find a compromise between s/w cost and h/w cost charged per computing node.
  • The scalability problem
    Most of the computation workload performs parallel processing on multiple computing nodes for fast processing. However, due to the saturation core point, performance does not increase linearly according to the number of computing nodes. Then saturation core point is easily reached. An E-beam job has the same limitations as a computation workload, and the allocation of computation nodes above the saturation core point causes an unnecessary waste of computing resources [16].
  • The overspecification problem
    If the load balancer operates ineffectively, the architecture designer favors the system hardware power over necessary performance. In this case, there is an advantage of providing a quick response, compared to the expected response time of the user. However, as a result, the actual usage time of the system is very low compared to the total time, which incurs unnecessary costs.
The following section analyzes each problem in the E-beam architecture and proposes a solution that can effectively utilize resources in a scaled-out environment.

2.2.1. The Saturation Point Policy

By analyzing the behavior of the existing E-beam cluster, it is possible to find a saturation core point that does not significantly change TAT, even if the number of allocations increases from a specific number of computation nodes independently of density. This means that when the software is operated under the existing FIFO policy, computing performance decreases in comparison to computational resources, from the saturation core point. The total amount of data that can be calculated in a single license can then be established. As a result, this leads to a cost increase due to purchasing additional licenses and hardware.
To improve this problem, this study analyzed the saturation core point of the E-beam job according to the number of computation nodes, and designed a core model based on the results. This model prevents the allocation of unnecessary computing resources to process the E-beam job by calculating the saturation core point of the E-beam job, and allocating the appropriate number of computation nodes.

2.2.2. The Mission Time Policy

When allocating the computation node to the E-beam job based on the saturation core point, the operation completes as quickly as possible regardless of the characteristics of the E-beam job. However, this is an optimal model from a performance standpoint. From the standpoint of costs, there is a possibility of over-specification beyond the user’s requirements. The resource costs of hardware and software should be appropriately determined, with the costs optimized to the user’s actual requirements. However, there is a high possibility that the cluster has been configured with a higher performance capacity than necessary. If the actual user’s requirements for the model were not applied, it can incur unnecessary license and hardware costs. Users of exposure software in the field typically have a deadline for job completion. According to related data, the industry standard deadline is known to be 3–4 h. Assigning a computation node to the job in order to match the TAT as closely as possible to the deadline allows for the allocation of the optimal number of computation nodes for the user’s requirements.
The graph in Figure 3 shows the change of TAT in relationship to the density parameter of the E-beam data in the real system. The graph illustrates that as TAT decreases, the number of cores increases. On the other hand, TAT is maintained above 600 cores, which indicates that the appropriate saturation core point of E-beam data is 600. In addition, the TAT increases proportionally to the density in a specific number of core sections. Therefore, the TAT can be modeled as a function determined by the number and density of cores. Regardless of the density, the graph shows a logarithmic trend based on the number of cores. This indicates that density and core number can be modeled as independent variables for the TAT. Core and density can be modeled mathematically as follows, using the above-described graphical characteristics.
An empirical model of the TAT’s mathematical model and real data yields a high correlation of 0.9982 on average. Therefore, in this model, the TAT formula model was used instead of the empirical model in order to improve the simulation time. The density and the TAT can be determined by the E-beam’s input and the user’s requirements, which allows for an appropriate number of computation nodes to be obtained. The obtained number of nodes can be applied to load balancing. Equations (1) and (2) below are the empirical model equations, which are based on experimental data [5].
The core model equation.
11.1 × e 0.00378 × c o r e         ( c o r e 400 ) 5.45 × e 0.00177 × c o r e         ( c o r e 600 ) 5.45 × e 1.602         ( c o r e > 600 )
The density model equation:
0.000633 × D e n s i t y 2 + 0.0225 × D e n s i t y + 0.804
The TAT model equation:
C o r e   M o d e l ( c o r e ) × D e n s i t y   M o d e l ( d e n s i t y )

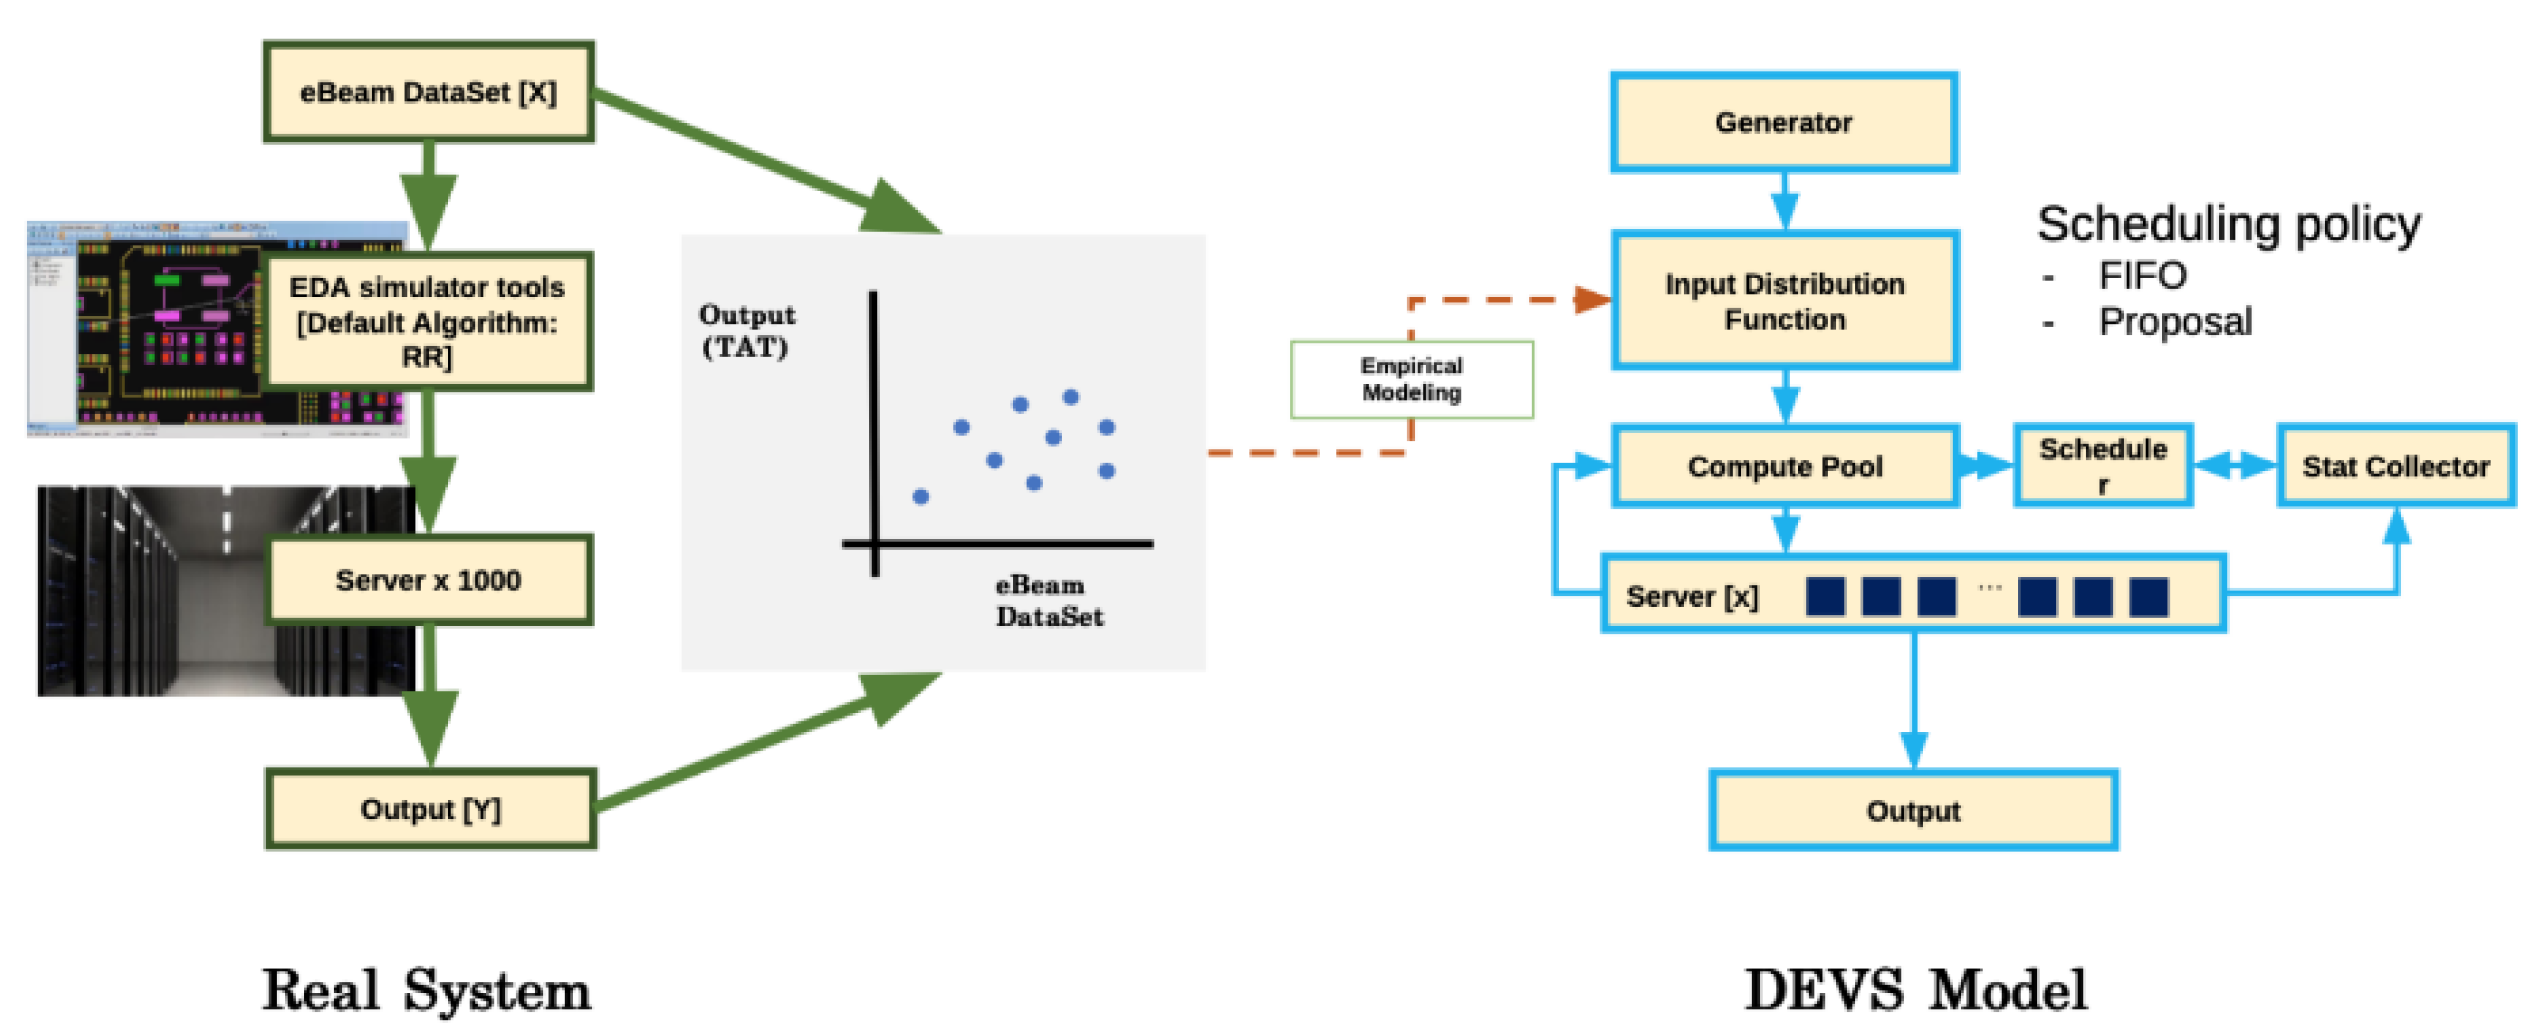
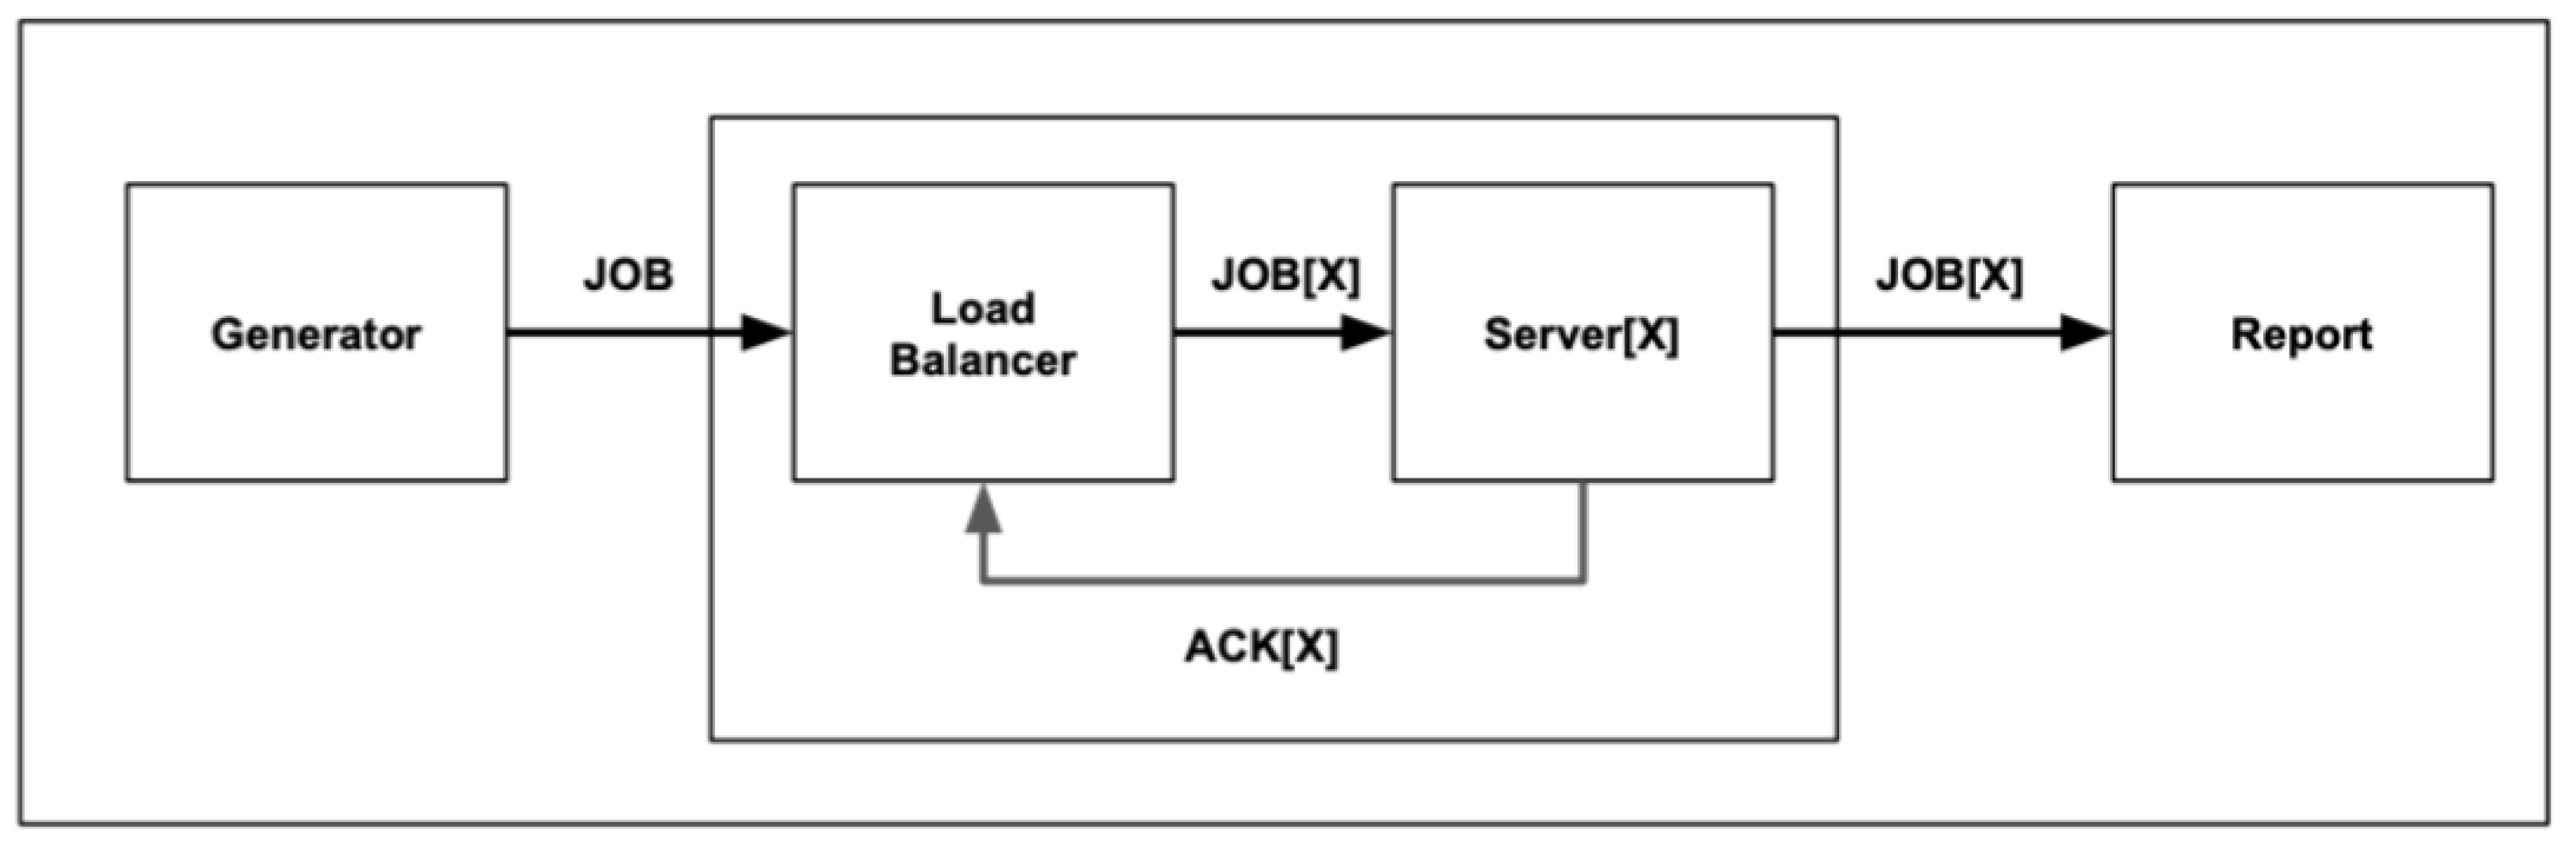
2.3. Default DEVS Model Design

The designed DEVS model in Figure 4 is a model of a single E-beam cluster operation type. We propose an extended DEVS model for a multi-type E-beam work cluster: a new load balancing method for improved management and operation.
  • The generator
    The generator creates E-beam jobs according to the distribution of jobs generated in the E-beam cluster. The E-beam job includes the attribute of the value of density. The density attribute value follows the Gaussian distribution. The load balancing simulation experiment for the E-beam job applies an empirical model, which requires a higher TAT for higher-density jobs. In order to facilitate the delay analysis in the experiment, each job density attribute should follow a Gaussian distribution.
  • The load Balancer
    The load balancer queues the job and observes the status of the idle server. It then performs the task of allocating the queued task to the appropriate server.
  • The server
    The server performs the actual processing of the incoming job. Processing time follows the Gaussian distribution according to the number of core allocations and the density of the job. When the task is finished and becomes idle, it relays the current status to the load balancer.
  • The report
    The report collects jobs that have finished working, and collects statistical information such as the TAT, the wait time, and the time to job completion in all assigned servers.

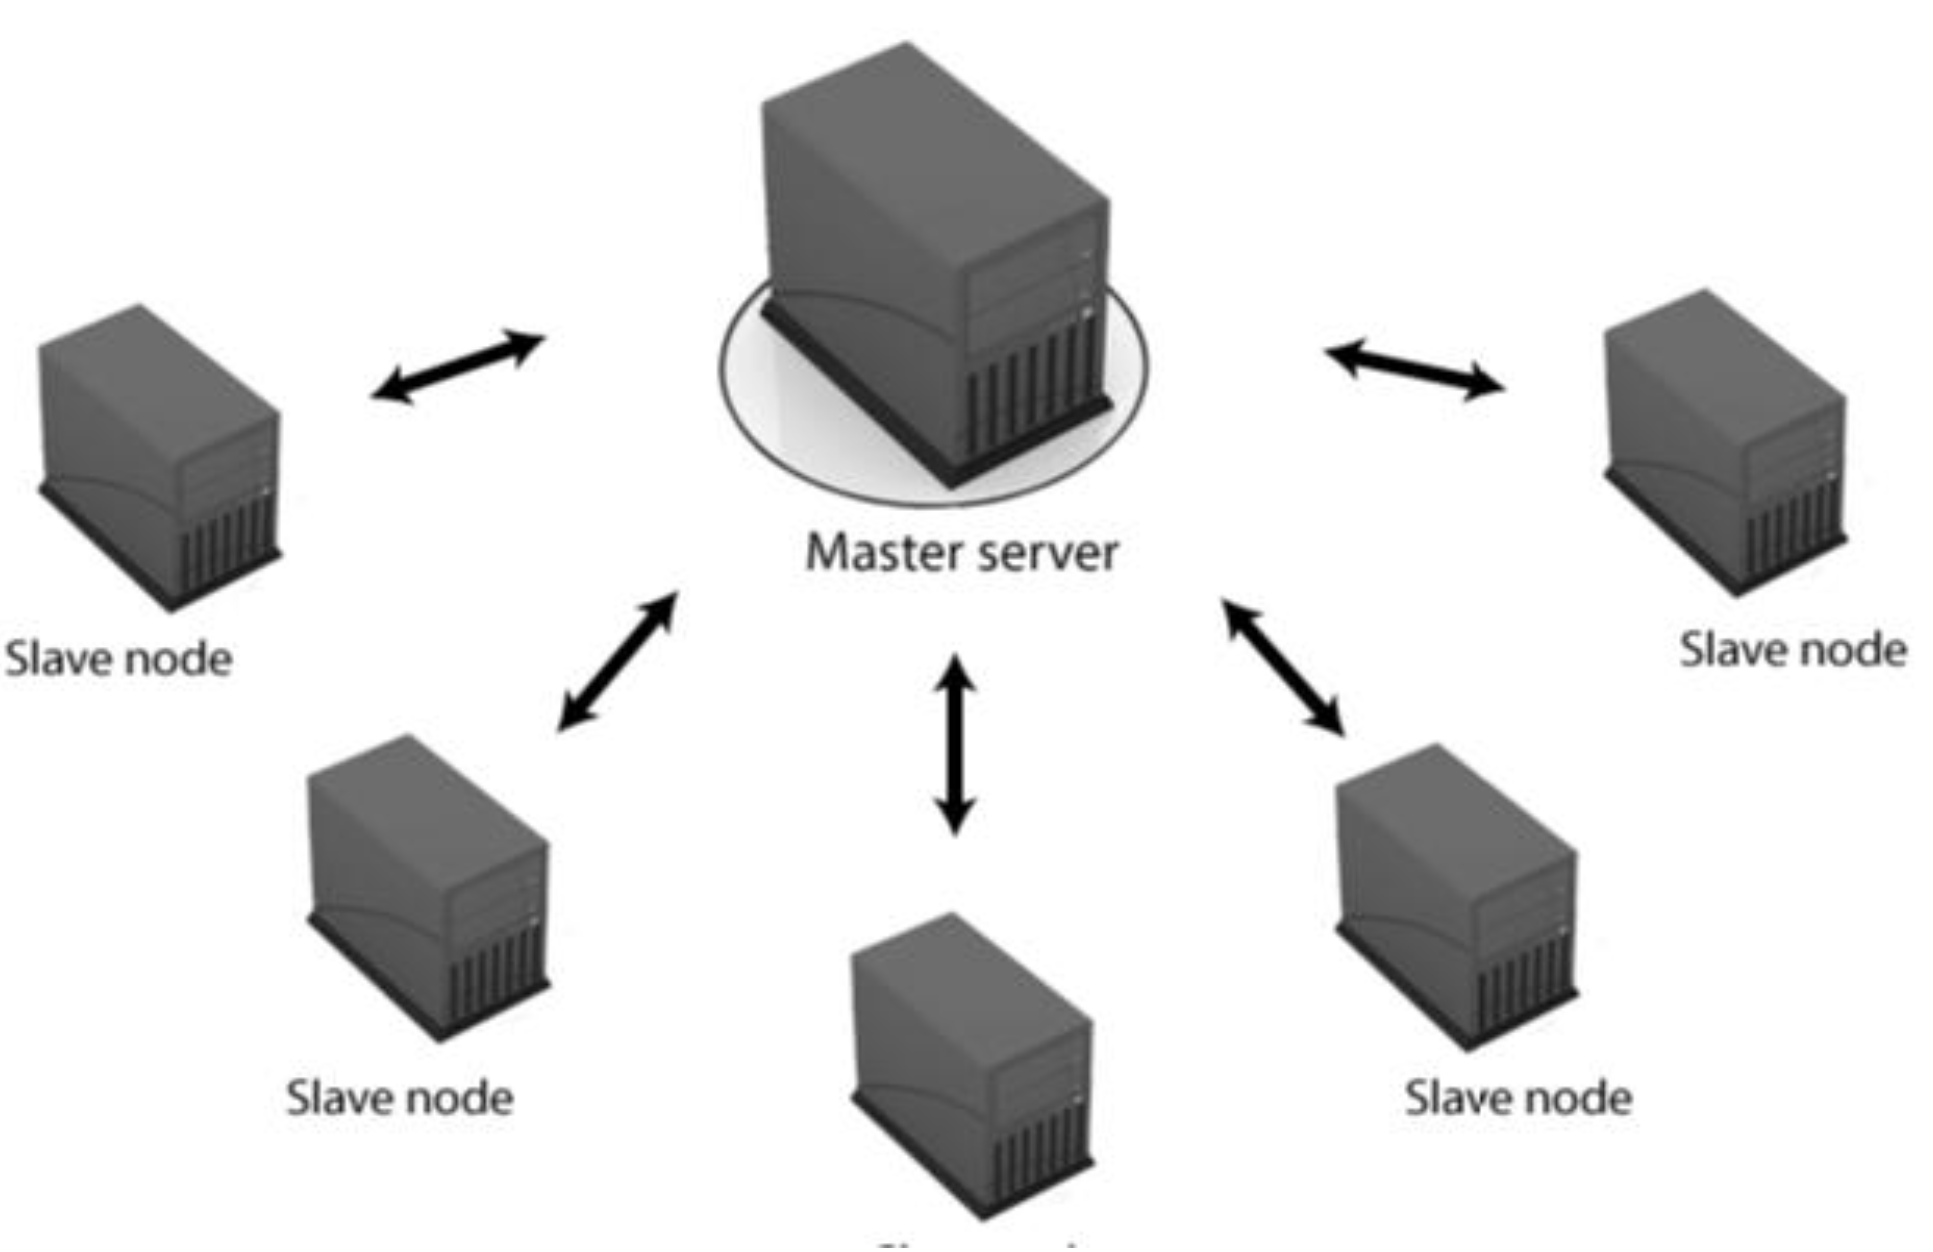
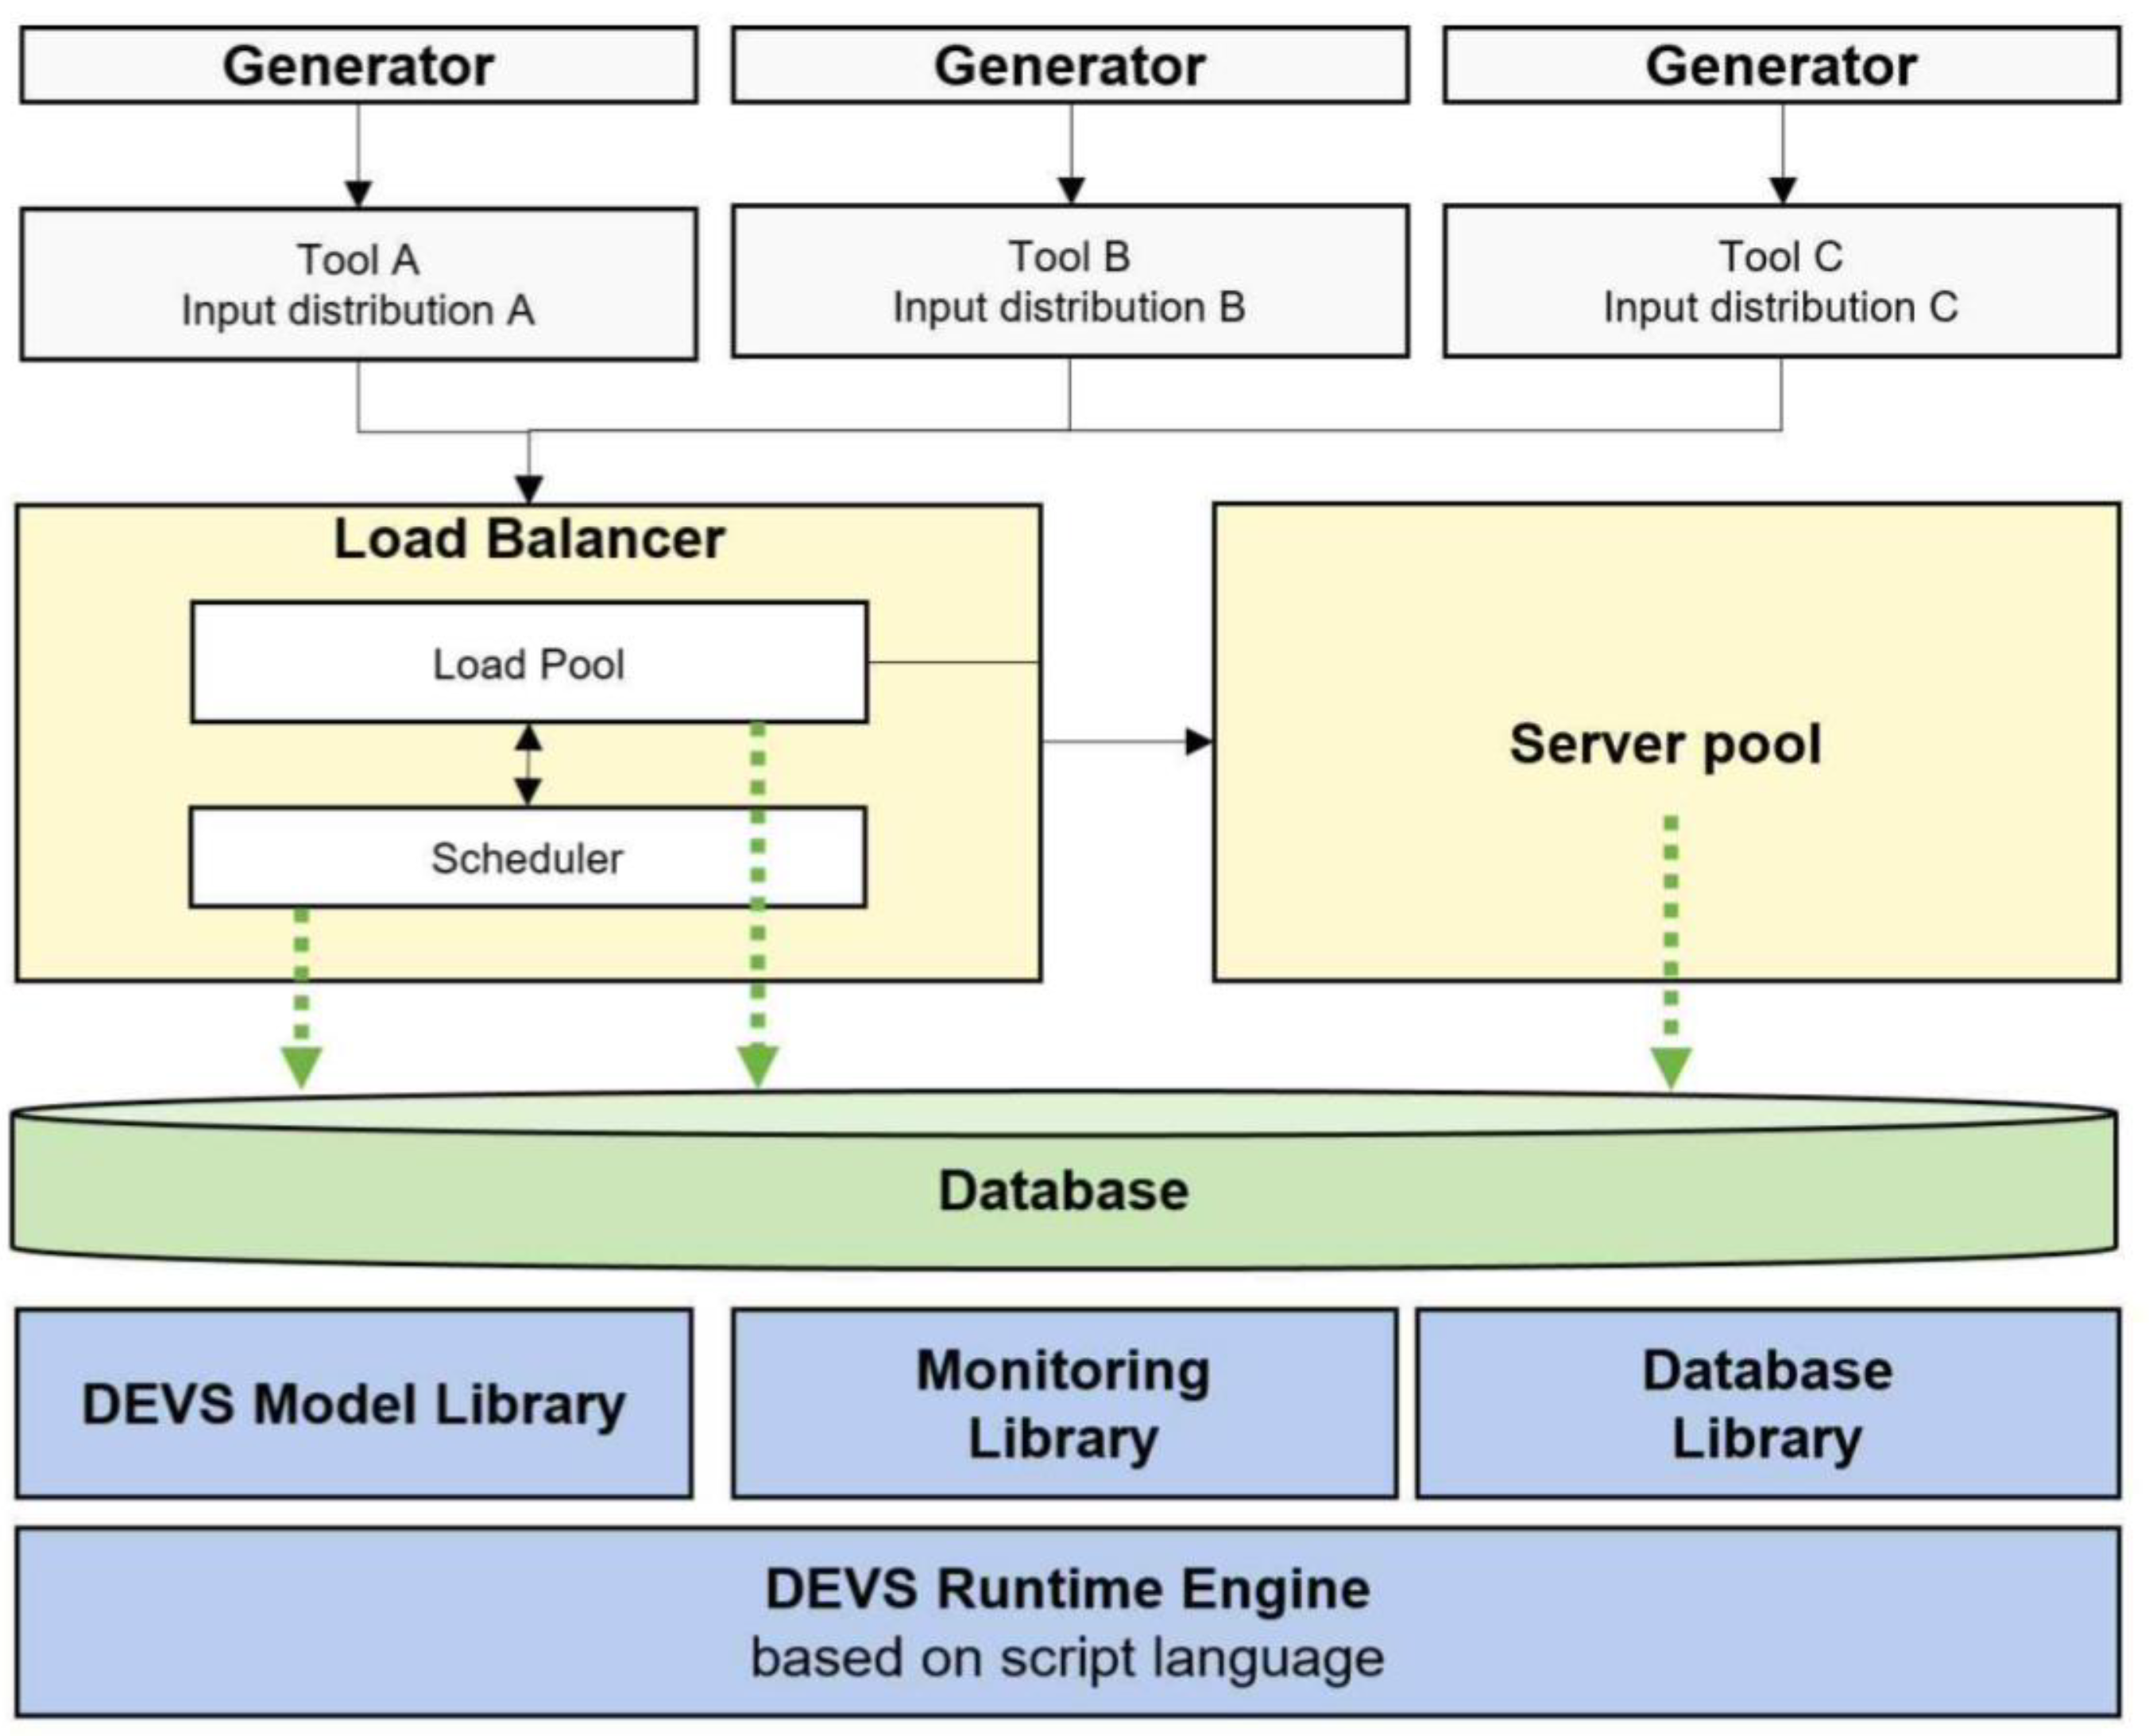
2.4. The Simulation Architecture

The simulation for multiple inputs is composed as follows.
  • First, various tasks with different characteristics are created and requested from the load balancer.
  • The load balancer schedules a work order based on the current work, the idle resources of the server cluster, and the saturation point model.
  • When the resources of the server cluster reach the scheduling condition, the next task is requested from the server cluster.
  • The server cluster simulates the corresponding task and records the result in the form of a database or file.
  • The result is analyzed using an analyzing tool.
In Figure 5, tools A, B, and C create jobs with different characteristic parameters and deliver them to the load balancer. For rapid prototyping, the model was first verified in the script language-based runtime. However, in a large-scale simulation, it is necessary to parallelize the existing DEVS engine. For this, we used a rapid experimental model, which has been verified with the go runtime-based multi thread-based DEVS engine.

3. Results and Discussion

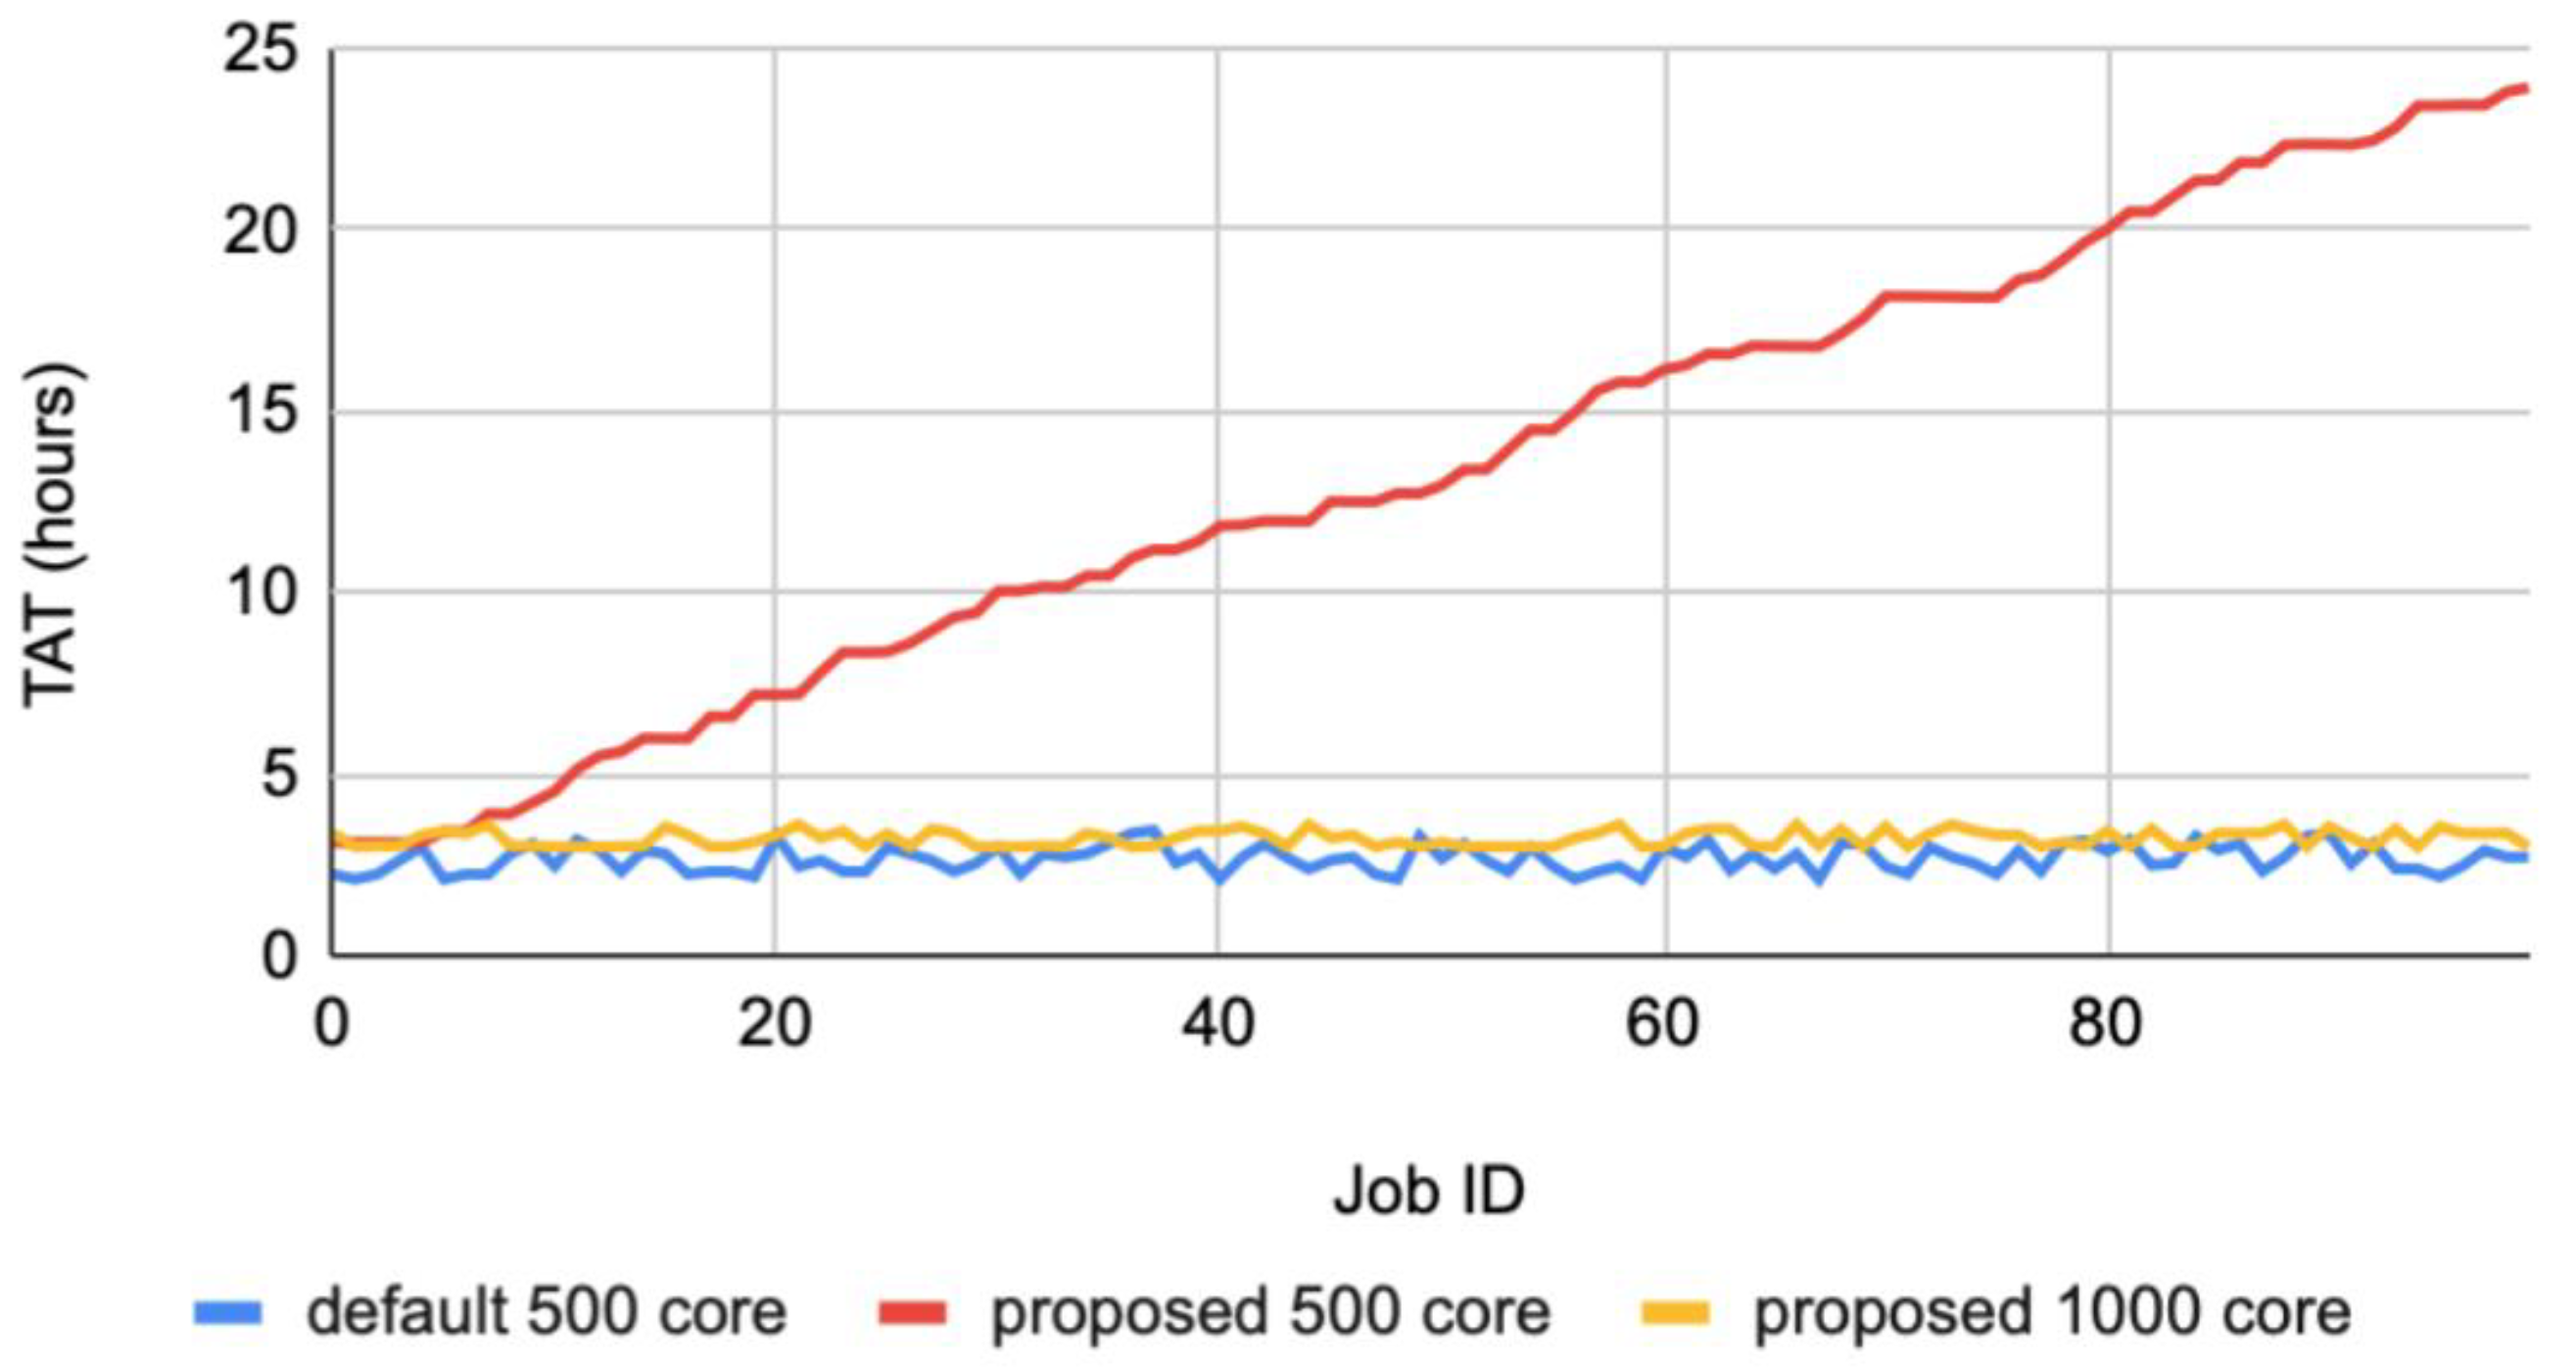
3.1. The Default DEVS Model Simulation

Figure 6 is a graph illustrating how the TAT changes based on the number of cores (computation nodes) in an input interval of 3 h. This is consistent with the default (FIFO) policy, with a TAT of 3 to 4 h in a cluster of 500 cores. However, in the proposed policy, the TAT continues to increase in clusters of 500 cores. This means that the number of computation nodes is insufficient compared to the requested operation. If the same experiment is repeated by increasing the number of cores to 1000 in the proposed policy, it satisfies a TAT of 3 to 4 h with a default policy cluster of 500 cores.
The 1.5-h graph in Figure 7 shows how the TAT changes based on the number of cores (computation nodes) in the input interval. In the default (FIFO) policy, the TAT continues to increase in cluster sizes of 1000, 1500, and 2000. This indicates that the default policy never achieves the target TAT in the 1.5-h input interval environment even if the cluster size is extended. In other words, TAT requirements that cannot be achieved with the existing FIFO policy can be achieved by expanding the cluster size. As shown in Figure 7, it was confirmed through the simulation that the policy that satisfies the TAT varies based on the cluster size and the input interval. Therefore, it is necessary to verify how the maximum input interval that satisfies the TAT changes based on the number of cores and the load balancing policies.
The graph in Figure 8 illustrates the minimum input interval that the existing load balancer (default) and the newly proposed load balancer (proposed) can handle in an environment that satisfies the TAT when the number of cores increases. For the default policy, compared to the proposed policy, the input interval is relatively short, with an approximate duration of 0.5 h in a 500-core environment. This is because the E-beam cluster has 600 saturation core points. Therefore, if the number of cores is less than 600, it is optimal to use as many cores as possible as the default policy. However, when the number of cores increases, the default policy unnecessarily allocates more than 600 cores, which is the saturation core point. As a result, the input interval does not improve, and the input interval that can be processed by the cluster converges to 2.2 h. Conversely, the proposed policy allocates an appropriate core in order to consider the saturation core point and the project deadline. Therefore, as the number of cores increases, the E-beam job can be calculated much more effectively. As a result, the input interval that can be processed by the individual cluster decreases.
The hybrid policy is applied to both of the above characteristics. In clusters smaller than the saturation core point, the default policy is used. In clusters larger than the saturation core point, the proposed policy is modeled. The results in Figure 8 demonstrate that proposed load balancing model operates with a minimum input interval for the entire cluster size. When configuring an E-beam cluster for computation lithography, FIFO-type load balancing should be used in clusters with a size smaller than the saturation core point. When the size of the cluster is larger than the saturation core point, cost optimization can be achieved by using the proposed type of load balancing, which is modeled based on the saturation core.

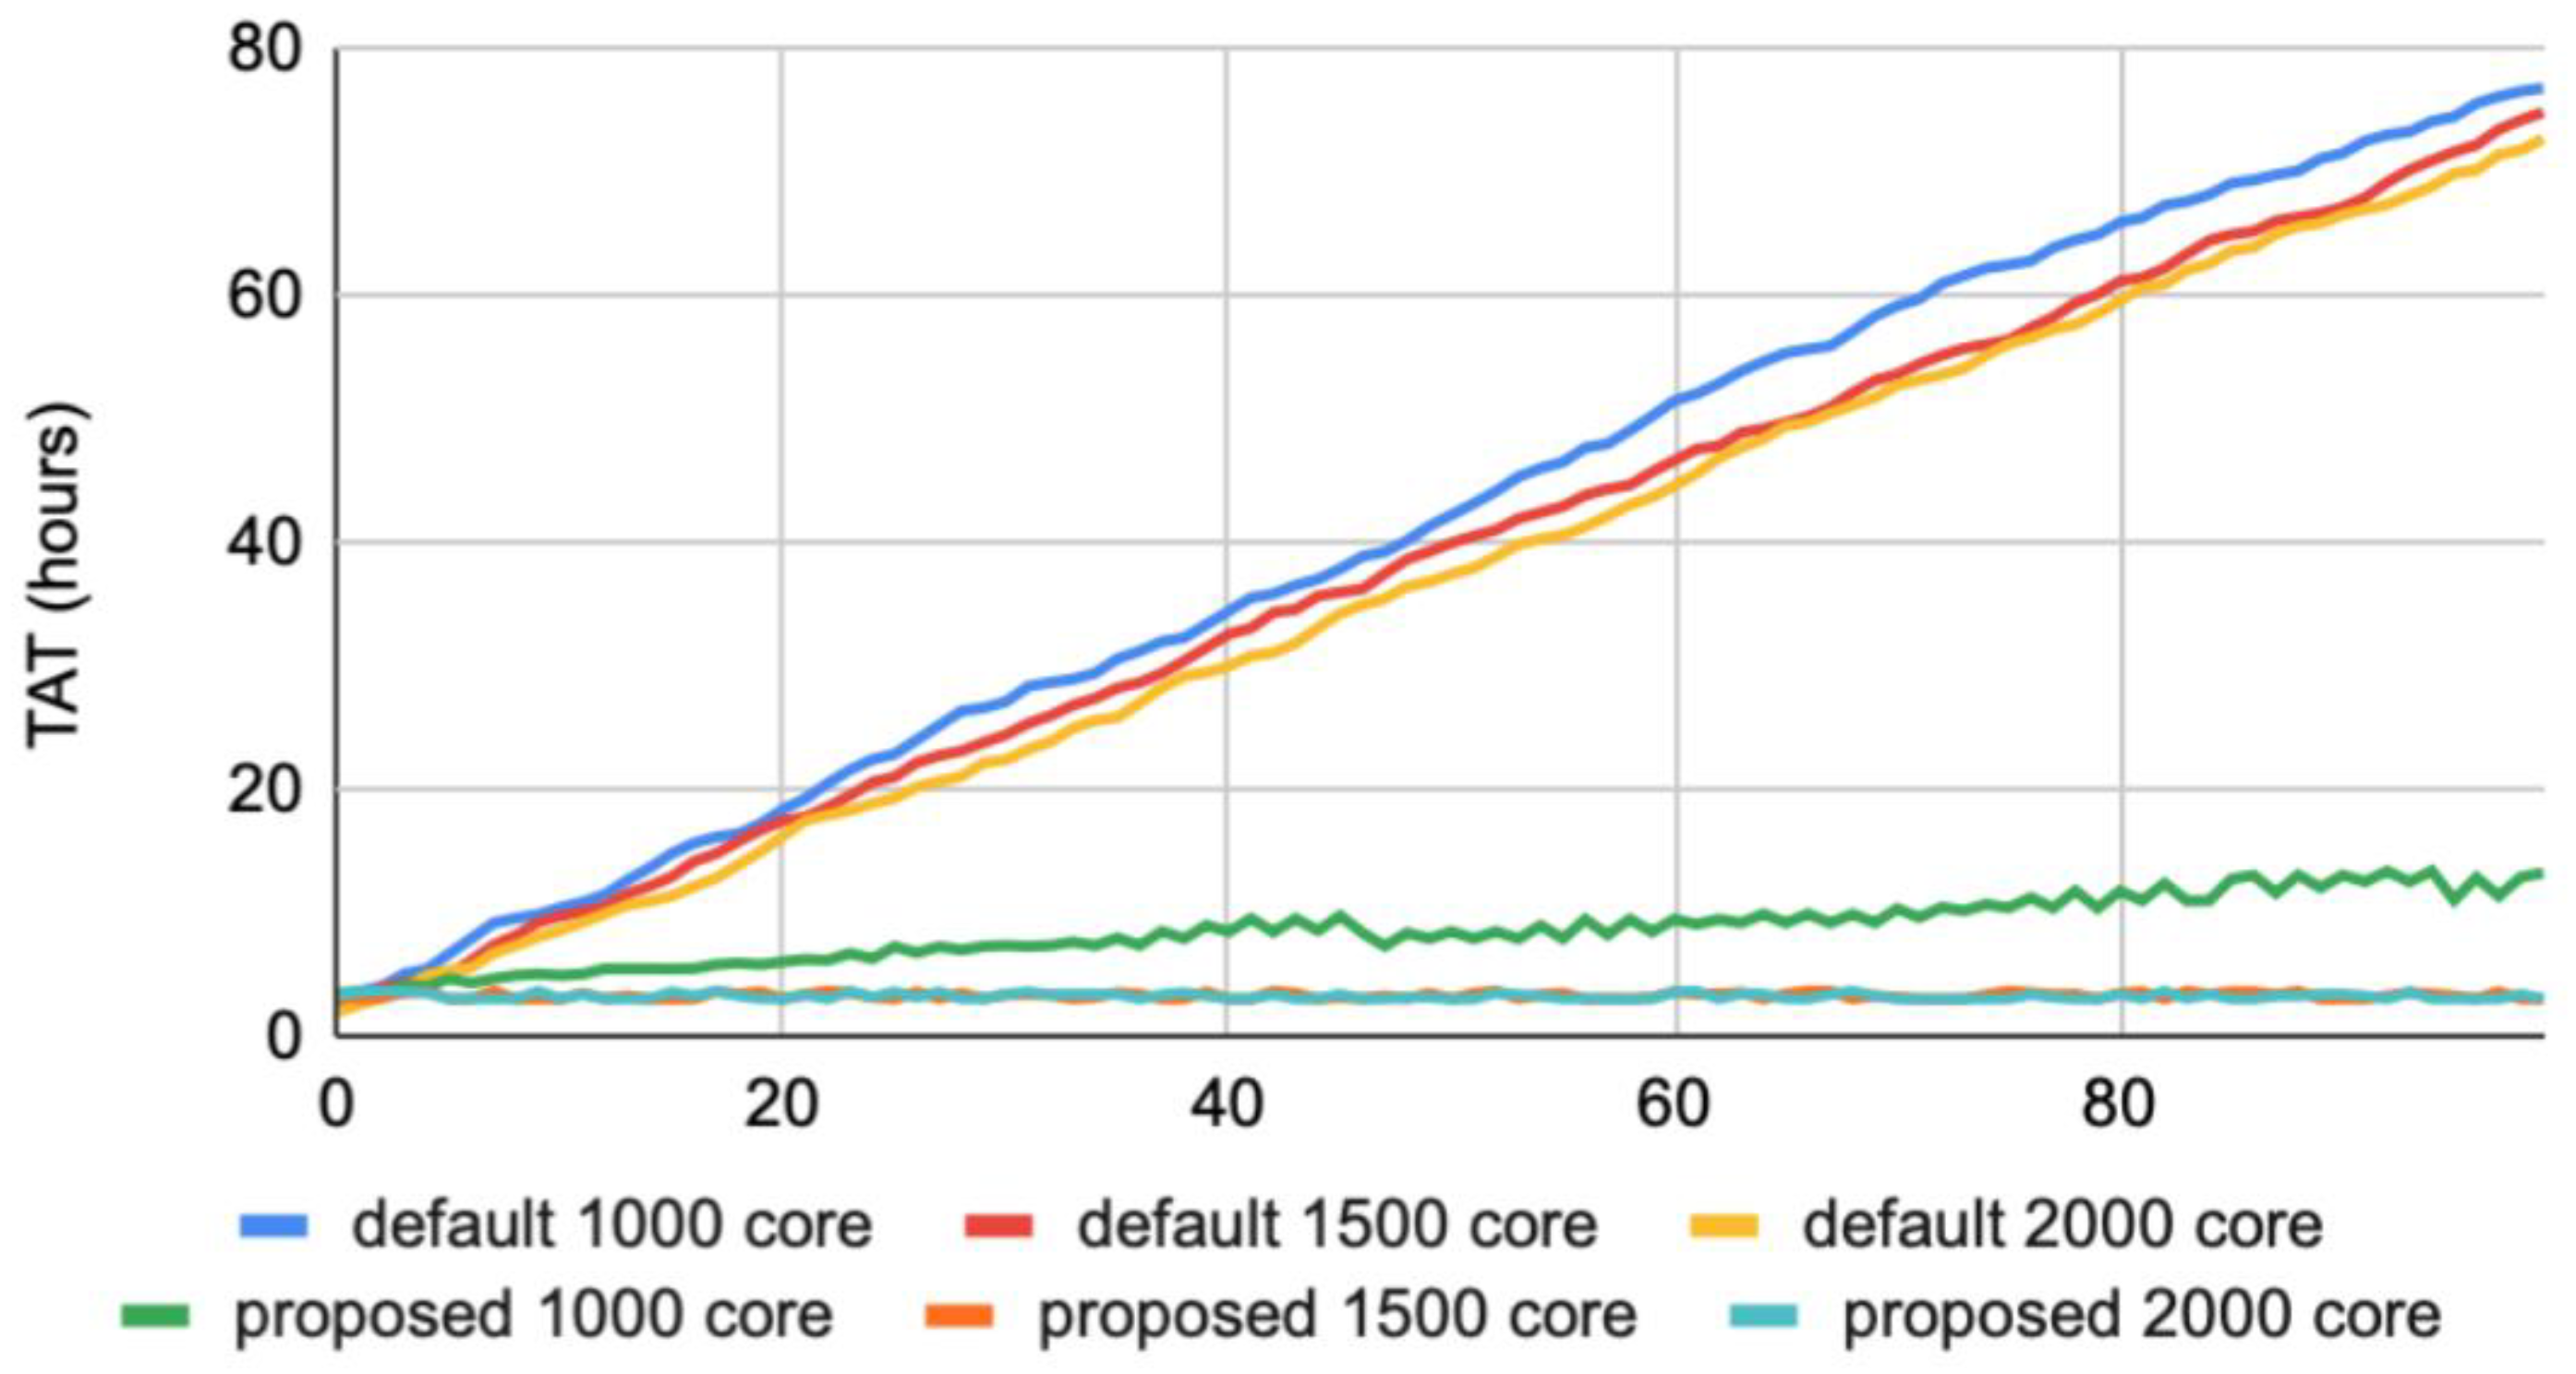
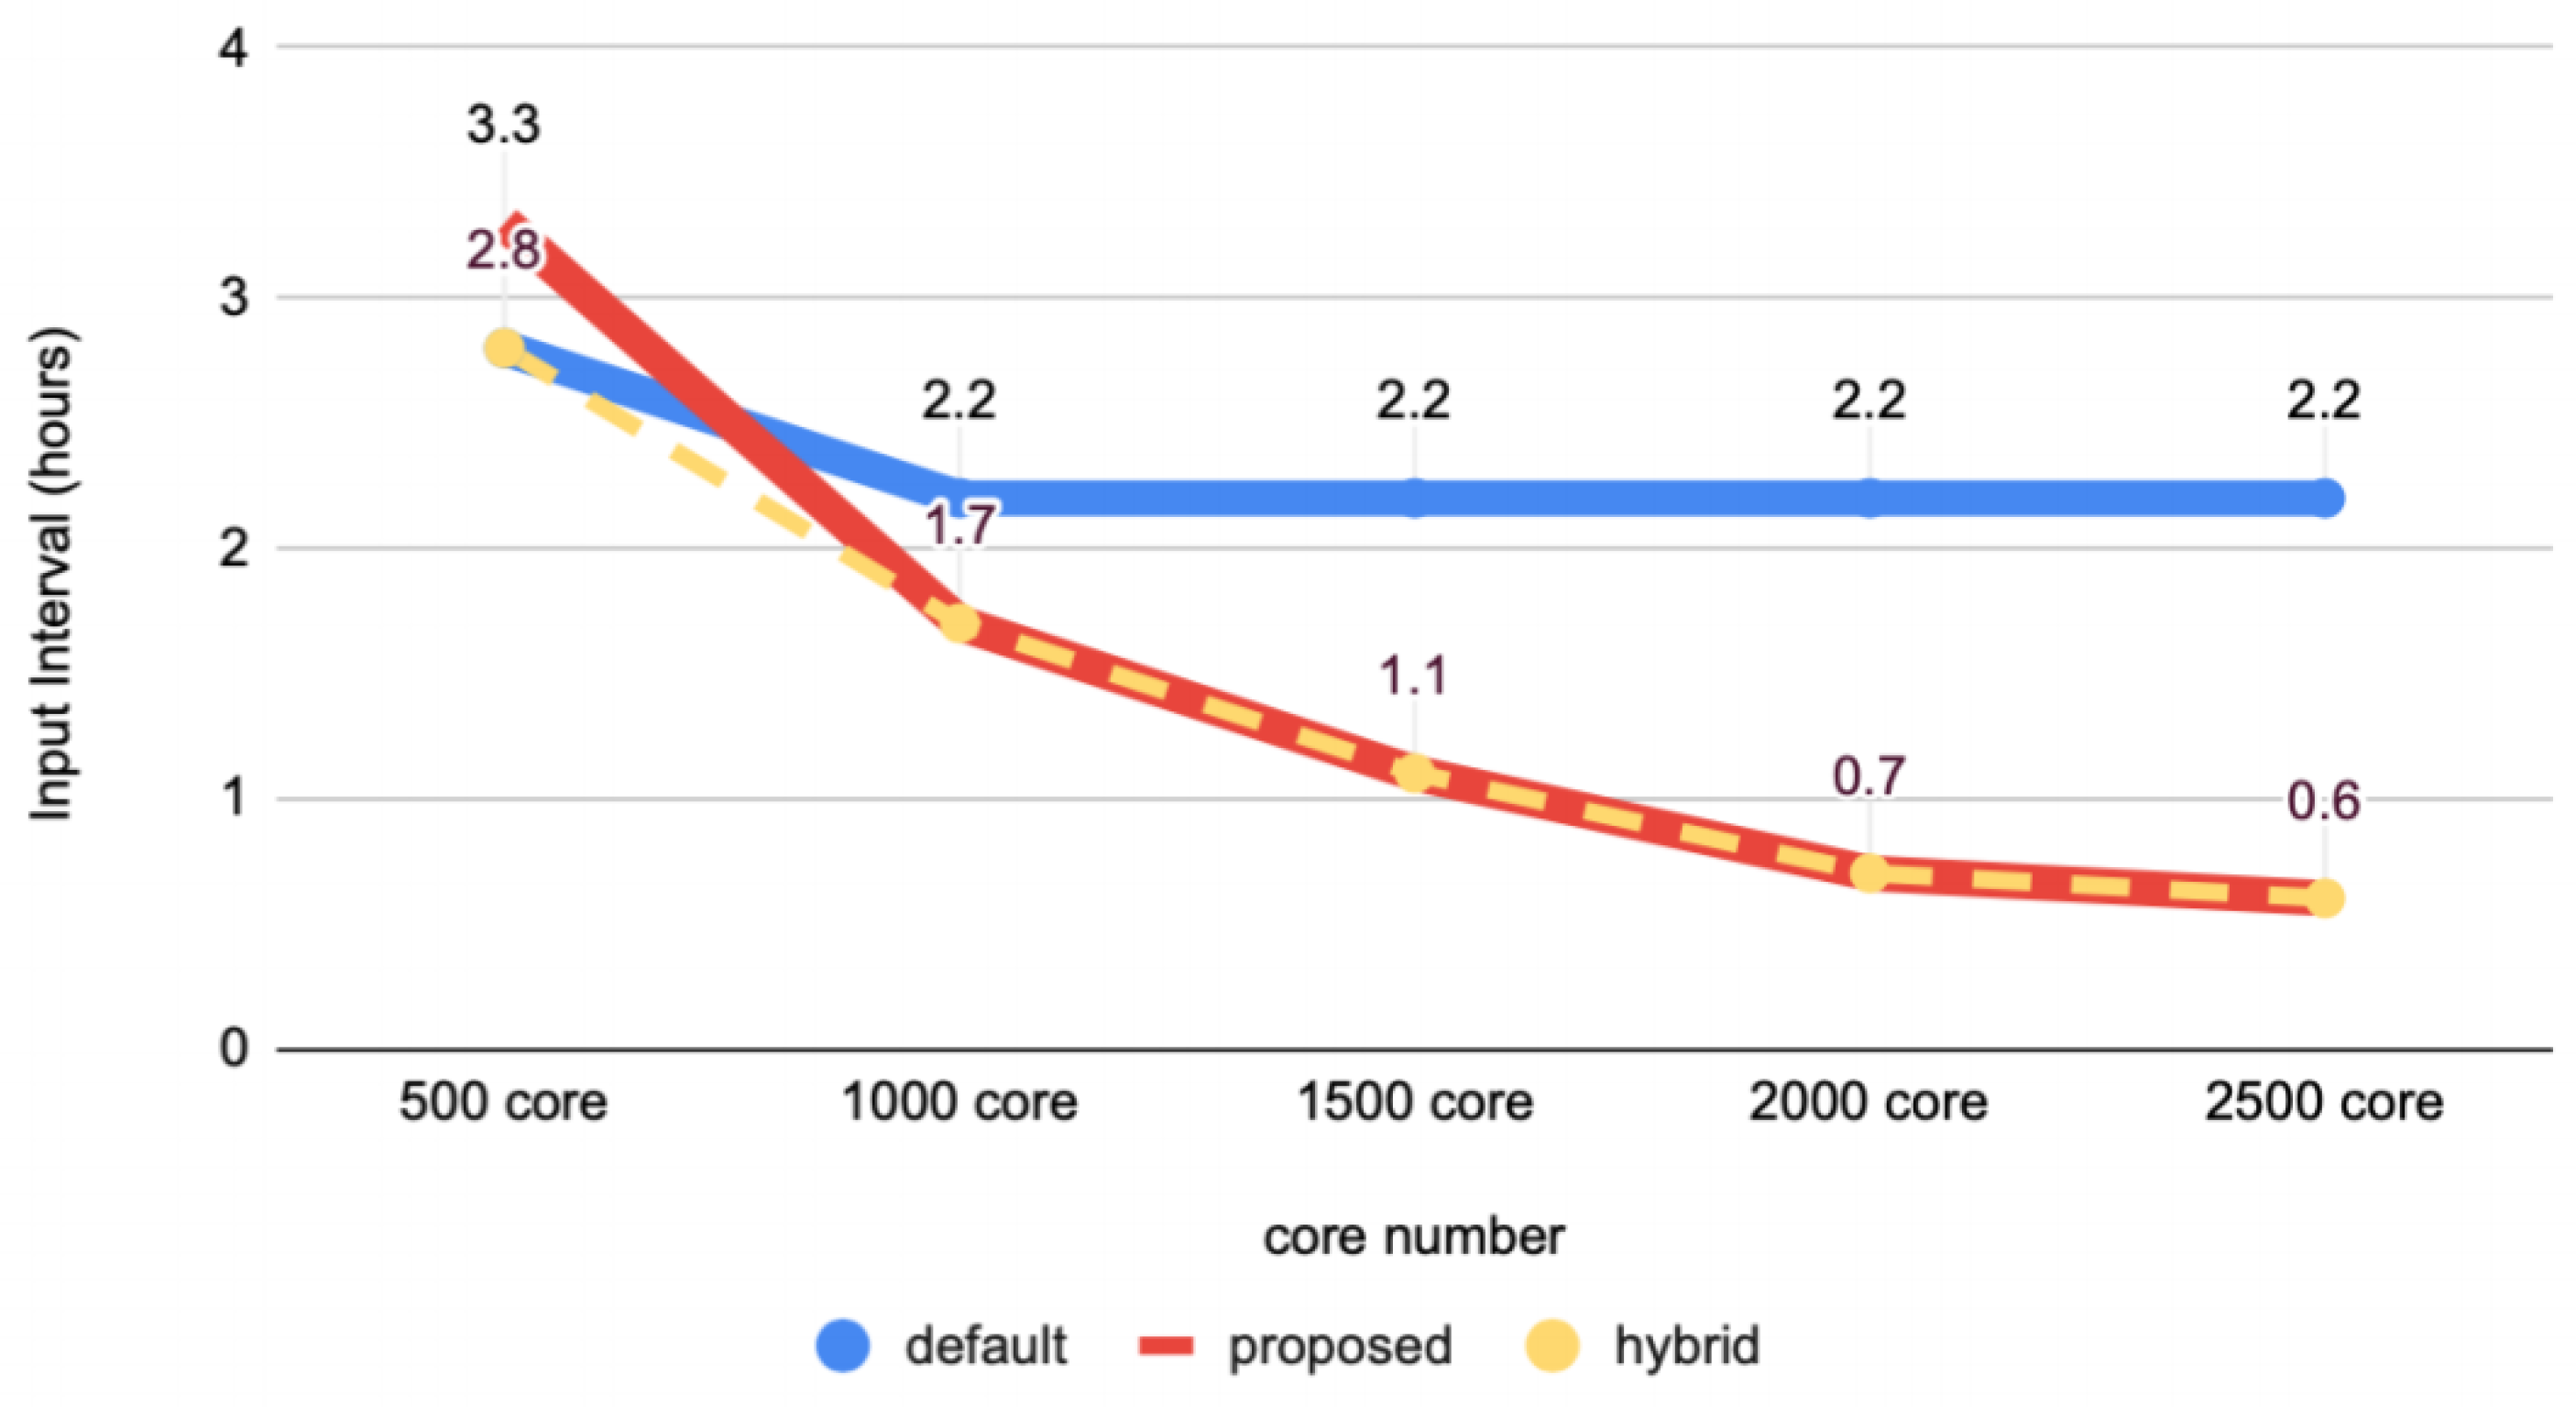
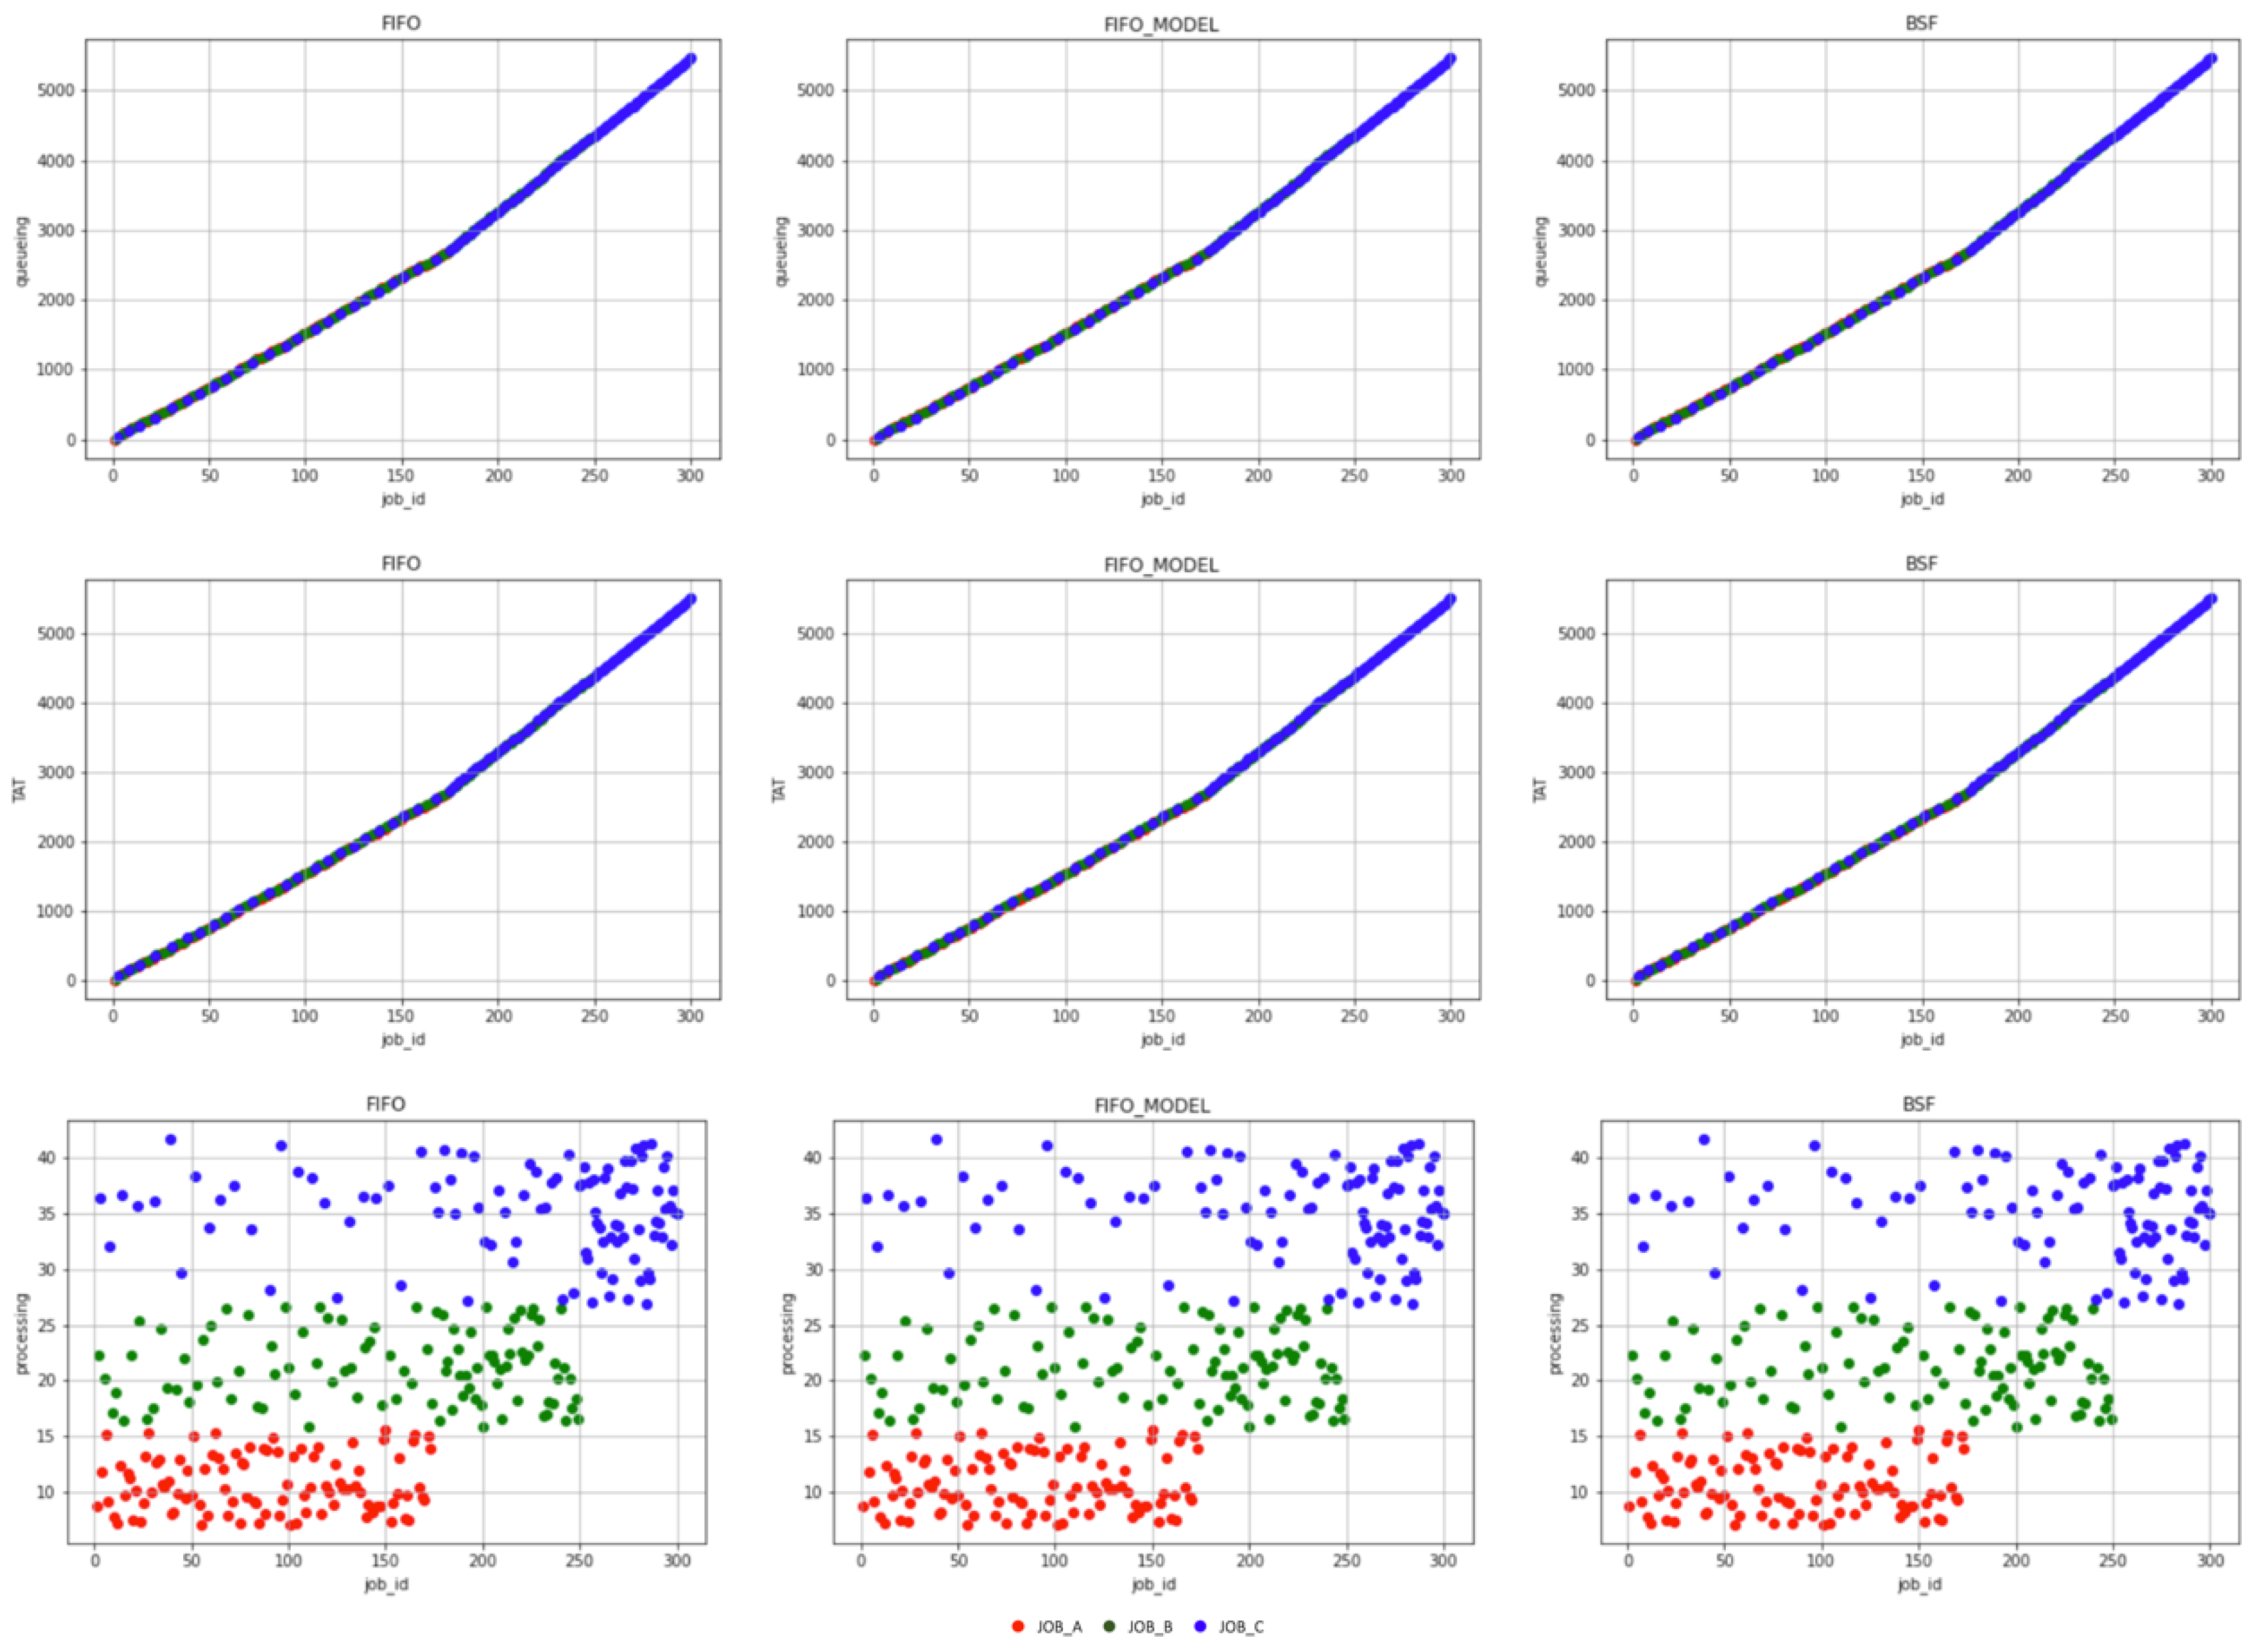
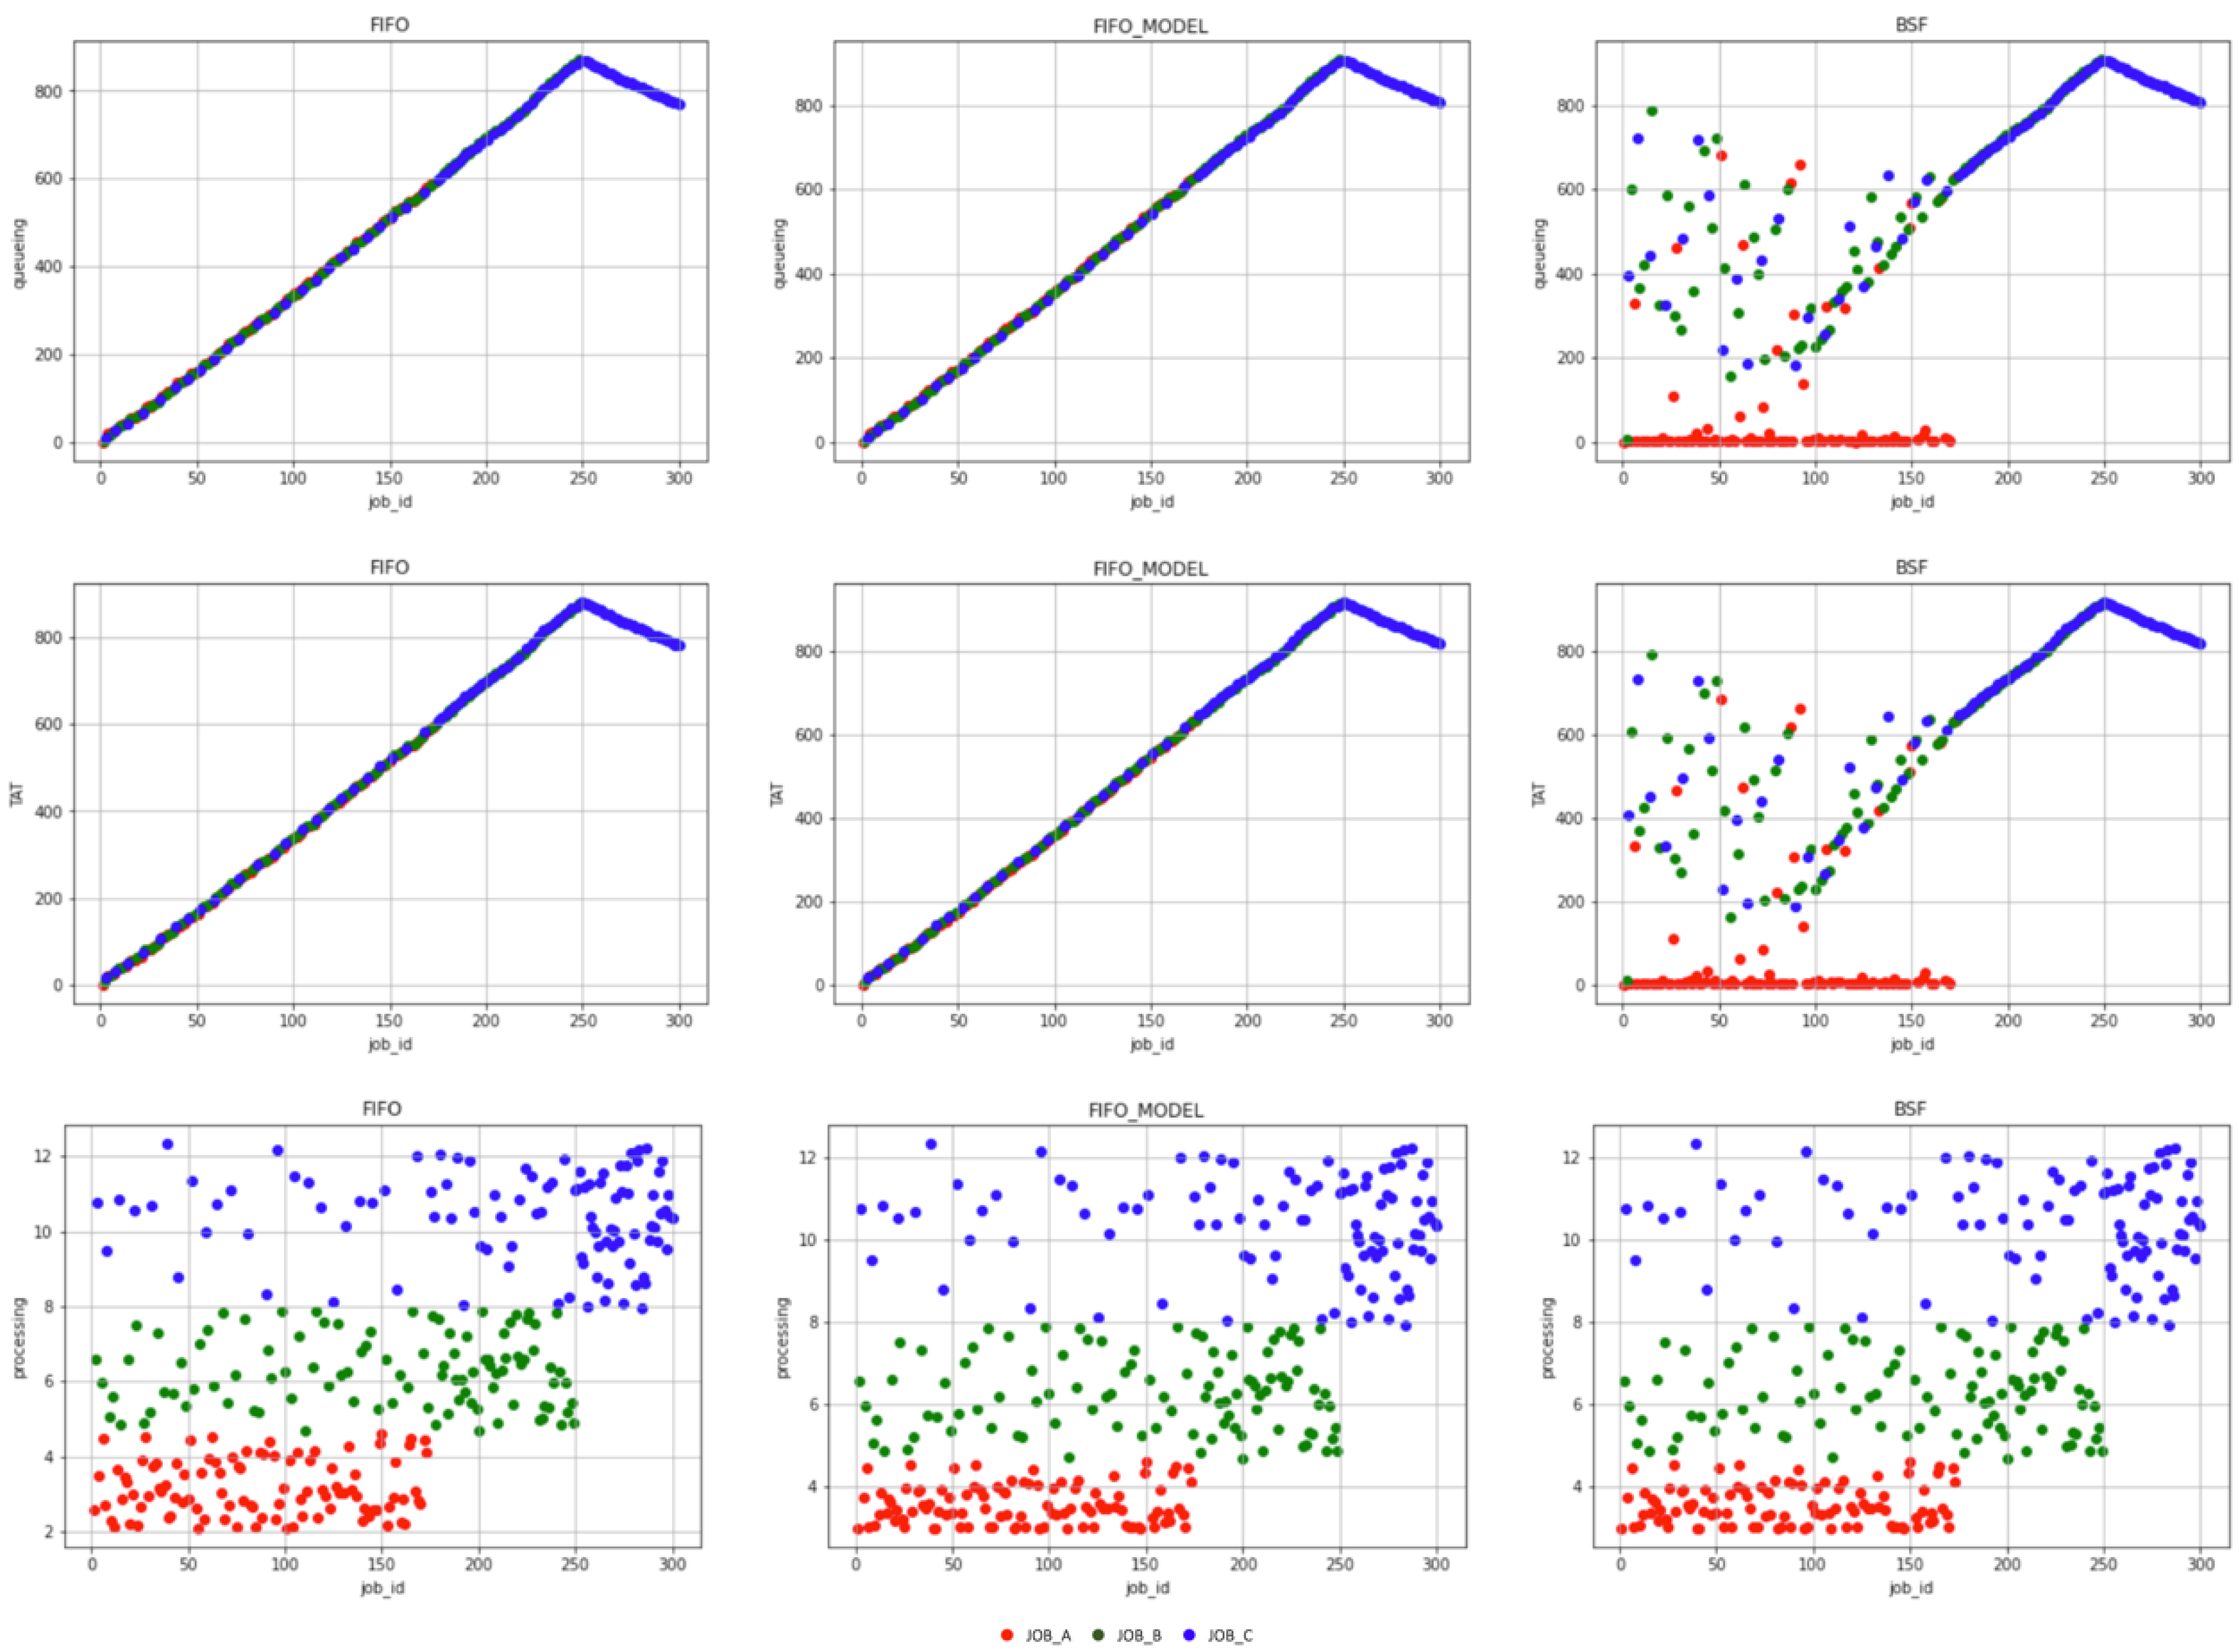
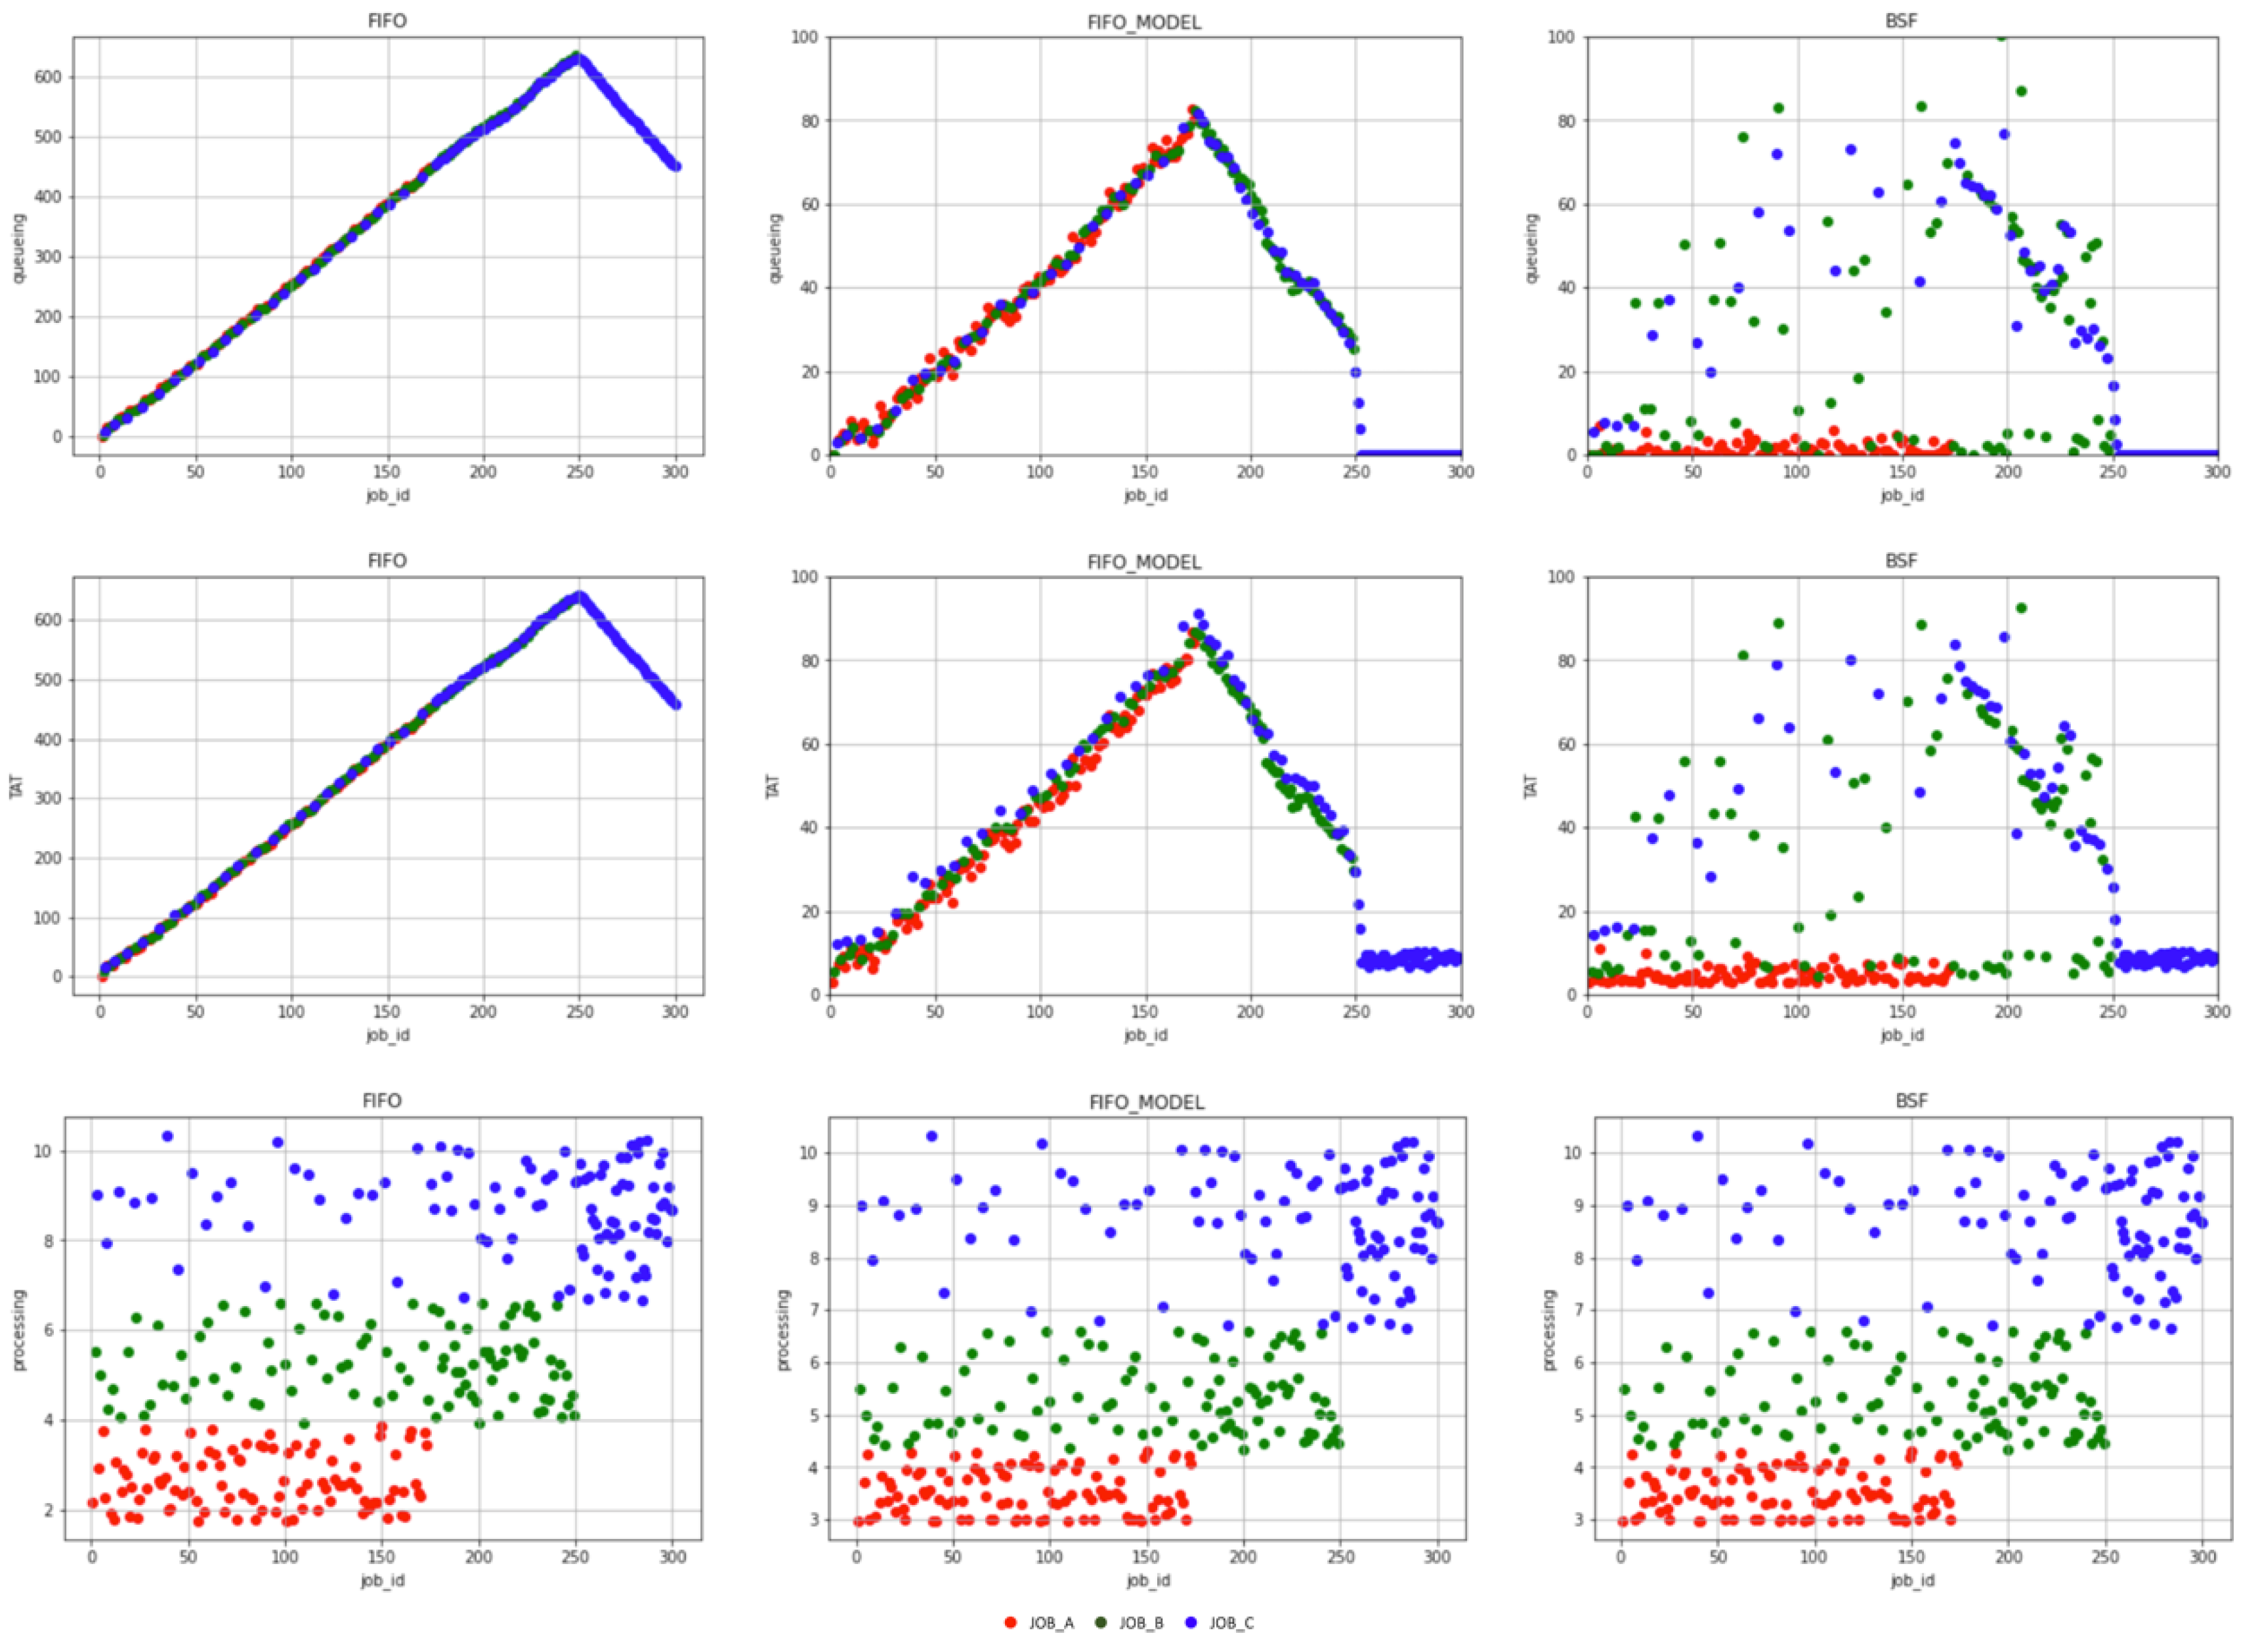
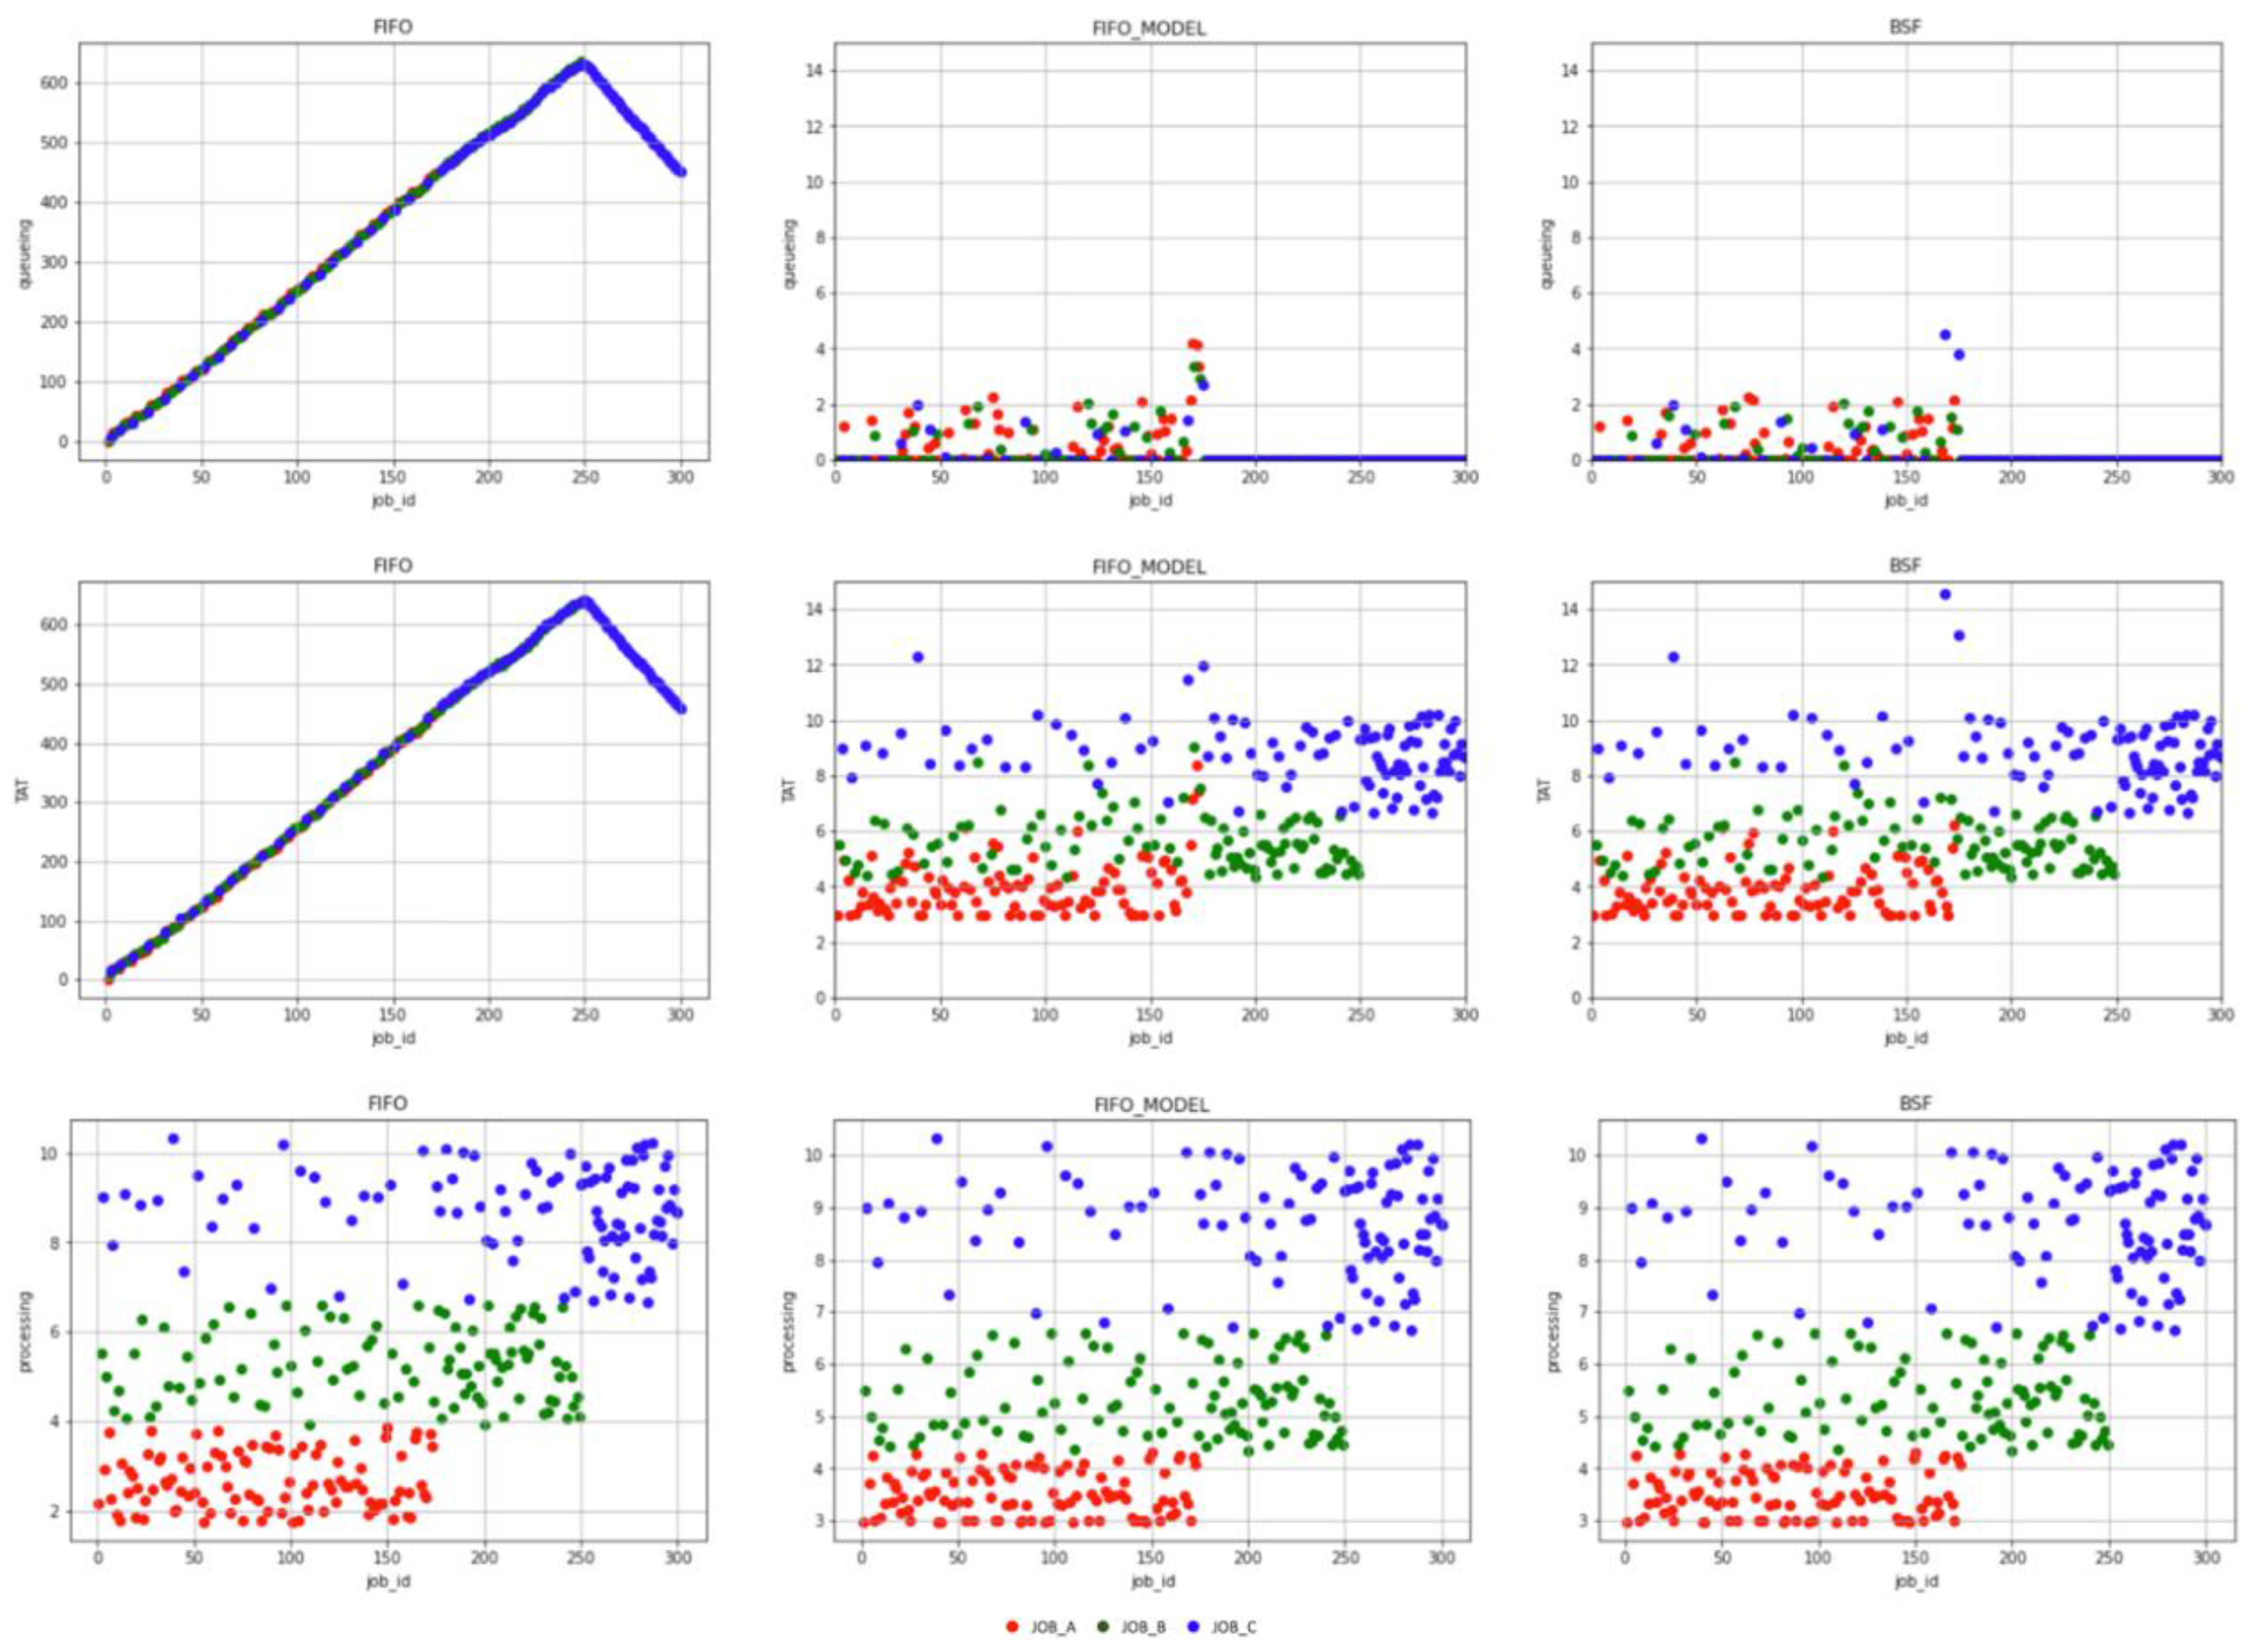
3.2. Multi-Input DEVS Model Simulation

This experiment is designed to assess whether the three load balancing algorithms, the FIFO-legacy model, the FIFO_MODEL saturation point model, and the BSF saturation point and mission time-based model, satisfy the TAT condition in a multiple input model environment according to the number of cores. First, the single input model of the existing E-beam job, which was introduced in the previous section, was used. For multiple models, three types were designed using an empirical model that requires a higher TAT for higher-density work. Table 1 contains the type setting values of the actual jobs.
The colors associated with the job type in Table 1 correspond to the colors in Figure 9. The experiment was conducted by changing the core from 100 to 100 units, and measuring the queuing time, the TAT, and the processing time. The graph in Figure 9 illustrates the four points, 100, 500, 1500, and 2000, where significant inflection occurred among the changes based on the number of cores.
  • Core 100
Figure 9 shows the results of the queuing time, the TAT (in hours), and the processing time by job ID in an environment of 100 cores. The slope of the TAT for each type indicates the degree of divergence of the task. The larger the slope, the greater the number of requests compared to the throughput. The below graph shows that the FIFO, the FIFO_MODEL, and the BSF had more requests compared to throughput for all types, all of which did not satisfy the TAT.
  • Core 500
Figure 10 shows the results of the queuing time, the TAT (in hours), and the processing time by job ID in an environment of 500 cores. Neither the FIFO nor the FIFO_MODEL satisfied the TAT because of the large number of requests compared to the throughput. In the case of the BSF policy, the TAT was satisfied for JOB_A. JOB_B did not emit, so in the long run the throughput versus the request was balanced. However, it did not satisfy the TAT. JOB_C of the BSF tended to diverge, and the TAT was therefore also not satisfied.
  • Core 1500
Figure 11 shows the results of the queuing time, the TAT (in hours), and the processing time by job ID in an environment of 1500 cores. Neither the FIFO nor the FIFO_MODEL, satisfied the TAT because of the large amount of requests compared to the throughput. Under the BSF policy, the TAT was satisfied for JOB_A. JOB_B did not emit, so in the long run, the throughput and the request were balanced. The variance value of the TAT decreased compared to the 1000-core environment. However, it was still not satisfied with the TAT. For JOB_C under the BSF policy, the number of requests compared to the throughput began to maintain balance in the long term, but the TAT was not yet satisfied.
  • Core 2000
Figure 12 shows the result of the queuing time, the TAT (in hours), and the processing time by job ID in an environment of 2000 cores. For FIFO, none of the types satisfied the TAT because of the large number of requests compared to the throughput. On the other hand, it was confirmed that the FIFO_MODEL and the BSF satisfied the TAT for all tasks.
The existing legacy load balancing method, FIFO, could not effectively handle heterogeneous tasks despite the increase in the number of cores, because all computing resources are used sequentially for incoming tasks. On the other hand, using the FIFO_MODEL, applying the saturation point policy, and additionally applying the BSF mission time policy, satisfied the TAT for heterogeneous work even with a small number of cores compared to the FIFO model. The FIFO_MODEL satisfied the TAT when a sufficient number of cores are used. Furthermore, the BSF model satisfied the TAT first for small-scale tasks in a 500-core experimental environment, as illustrated in Figure 10. It can be said that the BSF operates as a linear function and the FIFO_MODEL operates as a step function. A small task is a mission critical task; the BSF satisfies the requirements in fewer resources for large tasks with a batch nature, but the FIFO_MODEL indicates that more resources are needed for the requirements. The BSF works most effectively if it is necessary to separate the work hours by type in a multi-input situation.

4. Conclusions

Computational lithography technology makes it possible to advance the mask process using an existing exposure device. In addition to purchasing an expensive EUV device, it can be useful as an alternative technology in the mask process because the existing exposure device can be used without replacement. In general, for computation lithography, a distributed architecture consists of one central load balancer, with thousands of adopted computing nodes. In this architecture, each computation node must use a commercial software tool to support the operation. Therefore, in order to build a related cluster, not only is the hardware cost proportional to the number of nodes, but license costs for the tool are also incurred. Due to these cost issues, a team that operates computation lithography must build a cluster that enables optimal computation lithography in the smallest cluster.
In this study, the optimal computation lithography problem was redefined as a problem for load balancing. The load balancing problem for a single job was extended to multiple jobs, and the system was modeled using the DEVS methodology. We designed a model function that operates based on the data used in the actual E-beam cluster. By utilizing this approach, it was possible to verify node allocation problems and scheduling problems which occur in various software patterns within minutes, without actually configuring a cluster. Through simulation, it was confirmed that the proposed load balancer operated efficiently in terms of resource separation between heterogeneous tasks.
The DEVS model, which was used in the study, can be used to solve the complex cost-appropriateness of various computing clusters used in the industry. Furthermore, it is possible to propose an optimized cluster type and algorithm between multiple tasks. In addition, it is possible to classify mission-critical tasks and batch-type tasks in the actual environment, and to enhance the algorithm for effective scheduling at the level of load balancing. It allows for the system’s resource separation to be applied to multiple industries that require resource distribution in multiple tasks. Such a system’s resource separation can be expanded and optimized.

Author Contributions

Conceptualization, Y.S.H.; methodology, Y.S.H.; software, Y.S.H.; validation, Y.S.H.; formal analysis, Y.S.H.; investigation, B.S.K.; resources, Y.S.H.; data curation, Y.S.H.; writing original draft preparation, Y.S.H.; writing, Y.S.H.; review and editing, Y.S.H.; supervision, C.S.N.; project administration, J.S.L.; funding acquisition, Y.S.H.; All authors have read and agreed to the published version of the manuscript.

Funding

This research was supported by Basic Science Research Program through the National Research Foundation of Korea (NRF) funded by the Ministry of Education (NRF-2018R1D1A1B07041663)

Institutional Review Board Statement

Not applicable.

Informed Consent Statement

Not applicable.

Data Availability Statement

Not applicable.

Conflicts of Interest

The authors declare no conflict of interest.

References

  1. Bjorkholm, J. EUV Lithography-The Successor to Optical Lithography? Intel Technol. J. 2001, 3, 98. [Google Scholar]
  2. Stulen, R.H.; Sweeney, D.W. Extreme Ultraviolet Lithography. IEEE J. Quantum Electron. 1999, 35, 694–699. [Google Scholar] [CrossRef]
  3. Lee, J.J.; Jang, W.S. Nanoscale 3d shape patterning technology. Phys. High Technol. J. Korean Phys. Soc. 2004, 13, 14–19. [Google Scholar]
  4. Kim, J.; Lee, J.S.; Han, Y.S. Fault Detection Prediction Using a Deep Belief Network-Based Multi-Classifier in the Semiconductor Manufacturing Process. Int. J. Softw. Eng. Knowl. Eng. 2019, 29, 1125–1139. [Google Scholar] [CrossRef]
  5. Ji, M.K. The Method of Run Time Prediction Simulation-Based Load Balancing. Master’s Thesis, Sungkyunkwan University, Suwon, Korea, 2015. [Google Scholar]
  6. Cortes, A.; Ripoll, A.; Senar, M.; Luque, E. Performance Comparison of Dynamic Load Balancing Strategies for Distributed Computing. In Proceedings of the 32nd Annual Hawaii International Conference on Systems Sciences. 1999. HICSS-32. Abstracts and CD-ROM of Full Papers, Maui, HI, USA, 5–8 January 1999; pp. 170–177. [Google Scholar] [CrossRef] [Green Version]
  7. Alakeel, A. A Guide to Dynamic Load Balancing in Distributed Computer Systems. Int. J. Comput. Sci. Netw. Secur. (IJCSNS) 2009, 10, 153–160. [Google Scholar]
  8. Zeigler, B.P. Multifaceted Modeling and Discrete Event Simulation; Academic Press: Orland, CA, USA, 1984. [Google Scholar]
  9. Park, S.C.; Chang, M.H. Hardware-in-the-loop simulation for a production system. Int. J. Prod. Res. 2011, 50, 2321–2330. [Google Scholar] [CrossRef]
  10. Chang, D.S.; Cho, K.H.; Cheon, S.; Lee, S.J.; Park, S.C. Effective Simulation Modeling Formalism for Autonomous Control Systems. J. Korean Soc. Qual. Manag. 2018, 46, 973–982. [Google Scholar] [CrossRef]
  11. Kwon, S.; Sung, C.; Song, H.; Kim, T.G. Integrated Hybrid Modeling Methodology and Simulation Engine Design Based on HDEVS Formalism. J. Korea Soc. Simul. 2013. [Google Scholar] [CrossRef] [Green Version]
  12. Inostrosa-Psijas, A.; Wainer, G.; Gil-Costa, V.; Marin, M. DEVS modeling of large scale Web Search Engines. In Proceedings of the Winter Simulation Conference 2014, Savannah, GA, USA, 7–10 December 2014; pp. 3060–3071. [Google Scholar] [CrossRef]
  13. Alshareef, A.; Sarjoughian, H.S.; Zarrin, B. An Approach for Activity-based DEVS Model Specification. In Proceedings of the 2016 Symposium on Theory of Modeling and Simulation (TMS-DEVS), Pasadena, CA, USA, 3–6 April 2016; pp. 1–8. [Google Scholar] [CrossRef]
  14. Han, Y.S.; Kim, J.M.; Lee, C. DEVS-based semiconductor process scheduling using the multifacetted system modelling and discrete event simulation. In Proceedings of the 2014 Winter Simulation Conference. General Modeling Methodologies I, Savannah Georgia, Savannah, GA, USA, 7–10 December 2014. [Google Scholar]
  15. Song, H.S.; Lee, J.Y.; Kim, T.G. DEVS-based Modeling Simulation for Semiconductor Manufacturing Using an Simulation-based Adaptive Real-time Job Control Framework. J. Korea Soc. Simul. 2010, 19, 45–54. [Google Scholar]
  16. Ray, S.; Das, A. Execution Analysis of Load Balancing Algorithms in Cloud Computing Environment. Int. J. Cloud Comput. Serv. Archit. 2012, 2, 1–13. [Google Scholar] [CrossRef]
Figure 1. E-beam cluster operation in industries and DEVS modeling.
Applsci 11 04235 g001
Figure 2. The structure of the legacy E-beam cluster load balancer.
Applsci 11 04235 g002
Figure 3. The TAT based on density which represents the change of Turnaround time for the E-Beam data density parameter in the real system.
Applsci 11 04235 g003
Figure 4. The DEVS model largely designed with 4 components.
Applsci 11 04235 g004
Figure 5. The DEVS-based simulator for multiple inputs.
Applsci 11 04235 g005
Figure 6. The 3-h input interval TAT graph
Applsci 11 04235 g006
Figure 7. The 1.5-h input interval TAT graph.
Applsci 11 04235 g007
Figure 8. The minimum input interval in which the default and proposed load balancer satisfied TAT.
Applsci 11 04235 g008
Figure 9. The experiment results in a 100-core environment.
Applsci 11 04235 g009
Figure 10. Experiment results in a 500-core environment.
Applsci 11 04235 g010
Figure 11. Experiment results in a 1500-core environment.
Applsci 11 04235 g011
Figure 12. Experiment results in 2000-core environment.
Applsci 11 04235 g012
Table 1. Multiple E-beam input data table for a multi-input DEVS-based simulation.
TypeTAT (Hours)Min DensityMax DensityCount
JOB_A3530100
JOB_B63050100
JOB_C125070100
Publisher’s Note: MDPI stays neutral with regard to jurisdictional claims in published maps and institutional affiliations.

