Featured Application
This study is meaningful for the design and flight safety of the wing–in–ground craft.
Abstract
Wing–in–ground crafts will face waves with different amplitudes when flying over the ocean, and the high amplitude situations are especially lack of exploration. Hence, the aerodynamic characteristics of the NACA 4412 airfoil in proximity to the wavy water surface for various wave amplitudes are inspected in this paper. By solving Navier–Stokes equations, the lift coefficients of the airfoil when the angle of attack ranges from 0° to 4° are obtained. The results show that the fluctuation amplitudes of aerodynamic coefficients increase remarkably with successive increases in the wave amplitude and might threaten flight safety. The flow fields at 0° with low and high wave amplitudes are investigated. It is revealed that the upward movement of the water surface is the critical factor for the change of aerodynamics, and the mechanism varies with different wave amplitudes. Comparison of the flow fields at 0° and 2° further indicates that the influence of high amplitude waves depends on the distance between the leading edge of the airfoil and the water surface. This study discovers the reasons for the different aerodynamic characteristics under various wave amplitudes and angles of attack, and is of great value for the design of wing–in–ground crafts.
1. Introduction
When the aircraft flies in close proximity to an underlying surface, its lift–to–drag ratio will increase due to the ground effect. Wing–in–ground (WIG) crafts are designed to utilize the favorable influence of the ground effect for higher operating efficiency and have been developed by many countries [1]. Compared to the conventional aircraft, the WIG craft has some unique features in the application environment and aerodynamic characteristics. The flow physics is also more complicated. To fully exploit the benefit of the ground effect on the WIG craft, a considerable number of studies have been conducted such as the research on two–dimensional airfoils in the static ground effect [2,3,4,5], airfoils in the dynamic ground effect [6,7] and three–dimensional aircrafts or wings in proximity to the ground [8,9,10,11].
Although extensive researches on the ground effect have been carried out, most of them considered the underlying surface as a rigid flat ground. However, considering that the WIG craft is designed to fly at a fairly low altitude, the ocean is a more proper environment for application without the danger of encountering hills, trees, or other obstacles on the land. Therefore, WIG crafts usually cruise on the water surface for transportation. The water surface is deformable and free, therefore it cannot be substituted absolutely by ground for research. When the WIG craft flies over the ocean surface, waves often occur and sometimes have high amplitudes. Therefore, it is necessary to explore the aerodynamics of WIG crafts in proximity to the wavy water surface, especially for various wave amplitudes.
To eliminate the inconsistency between the actual flight situation and the theoretical research, numerous studies have attempted to explore the impact of the free surface on the ground effect. Among them, Barber [12] investigated the deformation of the water surface under WIG crafts and showed that the deformation was negligible in the two–dimensional situation. However, three–dimensional CFD results suggested that the water surface deformation behind the wing could not be neglected, which was probably caused by wingtip vortices instead of the pressure distribution beneath the wing. Zong [13] and Liang [14] took use of the lifting line theory to reveal lifting mechanisms of two–dimensional and three–dimensional WIG crafts. The results showed that the free surface deformation significantly affects the WIG craft aerodynamics at a low Froude number, especially for the low altitude. But when the Froude number is high enough, the water free–surface can be regarded as a rigid wall. Bal [15] proposed a modified iterative boundary element numerical method for two–dimensional airfoils and three–dimensional wings moving steadily over the water free–surface. It was demonstrated that the free surface generated Kelvin wave deformation due to the ground effect, which might cause substantial effects on the WIG craft performance. Therefore, it is necessary to consider the free surface effects during the design of the WIG craft.
Since waves over the ocean surface complicate the flow field around WIG crafts, more recent attention has been focused on the ground effect over the wavy ground. Im and Chang [16] investigated aerodynamics of a NACA 6409 airfoil over the wavy ground by solving the Euler equations. Numerical simulations were conducted under various ride heights, wave amplitudes and wavelengths, and the results showed that the wavelength affects the slope of aerodynamic phase curves. By adopting the sliding mesh technology, Qu et al. [17] conducted a series of numerical simulations for a three–dimensional WIG craft flying over the wavy ground. Their work argued that although the aerodynamic coefficients are periodic under the wavy ground circumstance, the average values of the coefficients vary in the same manner as the flat ground case when the flight height varies. It was also found that lower flight height leads to higher aerodynamic coefficient amplitudes and strengthens the flow separation at high angles of attack. Gao et al. [18] examined a transonic airfoil over the wavy ground and observed different shock behaviors. Results of different Mach numbers and ground clearances showed that the lower surface shock can either remain attached to the ground or detach from the ground surface, which depends on the flow conditions. In addition to numerical simulations, other authors also conducted experiments. Lee and Tremblay–Dionne [19] used surface pressure and particle image velocimetry measurements to obtain the aerodynamics and the flow field of a NACA 0015 airfoil over the wavy ground. It revealed that the peak values of aerodynamic coefficients were larger than those in the flat ground case especially when the ground distance is small, and the variation trend of different aerodynamic coefficients was not consistent. In 2019, they further studied the effect of the trailing–edge flap under the same experimental conditions and reported that the fluctuation of aerodynamic coefficients is weakened due to the deflected flap [20].
It should be noted that the heaving motion exists in water waves and the wavy behavior is unsteady compared with the rigid wavy ground. There were only a few researchers focusing on the numerical studies on the ground effect over the wavy water surface. Liang et al. established the nonlinear lifting theory with the discrete vortex method for two–dimensional airfoils [21] and three–dimensional wings [22] near the wavy water surface. The method was further extended to the research on the heaving airfoils over progressive water waves [23] in 2014. Kaneko [24] numerically surveyed the aerodynamics of a heaving airfoil over an air–water interface and highlighted the impact of the water surface on the lift force. Zhi et al. [25] compared the ground effect over the wavy wall with the wavy water surface and reported that the wavy water disturbance velocity results in the differences in aerodynamics, especially in a small ground clearance. They demonstrated that the flow properties change due to the interaction between the water wave and the airflow under the airfoil but did not expound the mechanism of such interaction. Hu et al. [26] discovered that the fluctuation of the wing aerodynamic coefficients in the wavy water surface case is much more extensive than that in the wavy ground case. Analysis of the flow field clarified that the air compression caused by the vertical movement of the water surface is the critical factor for the significant lift increase. There are also some studies focusing on the design of new vertical taking off and landing WIG crafts, such as the work conducted by Mi [27], which studied the ducted fan performance over the ground, static water and dynamic waves respectively. He demonstrated that the wave with a large wave height affected the aerodynamic performance greatly and the wave surface was impacted by the jet flow.
Despite that a great deal of work has been carried out for the exploration of the ground effect, the research on the airfoils over the wavy water surface is very limited. Some researchers have attempted to clarify the interaction mechanism between the airfoil and the wavy water surface, but the impact of the wave amplitude on the aerodynamics of the airfoil has not been discussed adequately. Consequently, it is essential to investigate the aerodynamics of the airfoil moving over the wavy water surface with various wave amplitudes. The aim of the paper is to present guidance for the design of WIG crafts which may face different sea conditions.
The remainder of this paper is organized as follows: Firstly, the numerical calculation model is introduced, and the accuracy is verified. Then, the aerodynamic characteristics of the NACA 4412 airfoil in proximity to the wavy water surface are numerically calculated for different wave amplitudes. The lift coefficients of different angles of attack and wave amplitudes are discussed according to the result. Moreover, the interaction mechanism between the airfoil and the wavy water surface is clarified by analysis of the flow field.
2. Numerical Method and Validation
In this research, the NACA4412 airfoil of the chord length c = 0.5 m is investigated. The freestream velocity V∞ is 30 m/s, and the Reynolds number Re based on the chord length is 3 × 10⁵. The lift coefficient of the airfoil in proximity to the wavy water surface is the main concern, and it is calculated at four angles of attack: α = 0°, 1°, 2° and 4°.
The calculation domain is presented in Figure 1. The inlet, upper, and lower boundaries are positioned 20c away from the airfoil, and the outlet boundary is located at 25c from the trailing edge of the airfoil. A pressure outlet boundary condition is set for the upper and outlet boundaries. The inlet boundary and lower boundary are set as velocity inlet condition and nonslip wall condition respectively. In addition, the airfoil surface is set as nonslip wall condition. Figure 1 also gives the definition of the ride height h and wave parameters. The ride height is defined as the distance from the trailing edge of the airfoil to the still water level and set as 0.2c. The wavelength λ is 5c which refers to existing studies and for each angle, the wave amplitude a varies from 0.05c to 0.1c. The numerical wave is generated by using the volume of fluid (VOF) technique [28]. Based on the first–order linear wave theory [29], the wave propagating along the x–axis is generated by applying the inflow wave making method based on the stream function [30]. The wave surface elevation and the velocity components are specified at the velocity inlet, and they can be calculated as
where k = wave number, with k = 2π/λ; ω = wave frequency; t = time after the wave crest passes through the original point; and d = water depth.
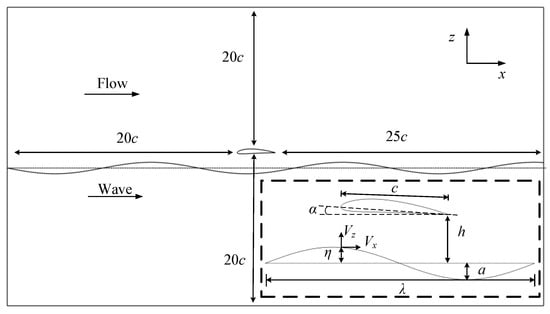
Figure 1.
Sketch of the computational domain.
The structural grid method is employed for numerical simulations, as shown in Figure 2. When simulating the high–amplitude wave, refinement of the grids around the water surface is required to achieve better computational accuracy. The grid sizes around the water surface in the wavelength and wave height directions are 1/10a and 1/25a, respectively. There are 405 nodes on the airfoil, and the y+ value for the first mesh point away from the airfoil is approximately 1. The total number of mesh cells is 0.39 million.

Figure 2.
Grids around the airfoil.
The numerical simulations are conducted by using the commercial software STAR–CCM + ©. The unsteady flow is numerically simulated by solving the unsteady incompressible Reynolds averaged Navier–Stokes equations (RANS) with the k–ω shear stress transport (SST) turbulence model. The transport equations of the model are
where fβ* represents the free–shear modification factor, fβ represents the vortex–stretching modification factor, k0 and ω0 are the ambient turbulence values that counteract turbulence decay, Gk represents the turbulent production, Gnl represents the “non–linear” production, Gb represents the buoyancy production, Gω represents the specific dissipation production, Dω represents the cross–diffusion term, Sk and Sω are source terms. The adaptable constants have the following values: β* = 0.09, β1 = 0.075, β2 = 0.0828, σk1 = 0.85, σk2 = 1.0, σω1 = 0.5, σω2 = 0.856, and a1 = 0.31.
A second–order implicit scheme is used for time discretization and a second–order upwind scheme is applied for space discretization. The time step ∆t for unsteady computation is 0.0001 s to satisfy Equation (6),
where ∆x is the minimum grid size. The SIMPLE algorithm is used for the segregated flow solver, with the under–relaxation factor set as 0.8 and 0.2 for the velocity solver and the pressure solver respectively. The momentum residual and the periodicity of the aerodynamic coefficient are selected as the convergence standard. If the residuals of the momentum, turbulent kinetic energy, and continuity are less than 1 × 10⁻⁶, and the lift coefficient changes periodically simultaneously, the convergence of the numerical calculation is considered to be reached.
To verify the accuracy of the computational result, a validation for computational fluid dynamics (CFD) method is conducted. The aerodynamic characteristics of the NACA4412 airfoil under the ground effect are calculated using the CFD method, and then compared with the experimental data obtained from the existing research [3,6,12,31]. The angle of attack is 4°, the ground clearance is h/c = 0.15, and the Reynolds number is 3.0 × 10⁵. These conditions are consistent with those in the experiment performed by Ahmed et al. [32]. The calculation results are presented in Figure 3, and it can be observed that the calculation results are consistent with the experiment results. At the same time, the grid independence is verified by constructing two new grids with additional refinement. Table 1 presents the calculation results under different grid numbers. The relative errors of the lift coefficient for these meshes are 1.25%, 1.25%, and 1.25% respectively, and the relative errors of the drag coefficient for these meshes are 6.61%, 4.86%, and 5.14% respectively. It can be noted that the maximum difference between the medium grid and the fine grid is 0.26%, which indicates that the medium grid can basically ensure the simulation accuracy. Therefore the medium grid is selected to perform the numerical calculations. In addition, the fluctuation amplitude of the lift coefficient and drag coefficient is less than 1 × 10⁻⁶ when the result is convergent. Hence the unphysical oscillation caused by numerical dispersion can be ignored during the simulation.
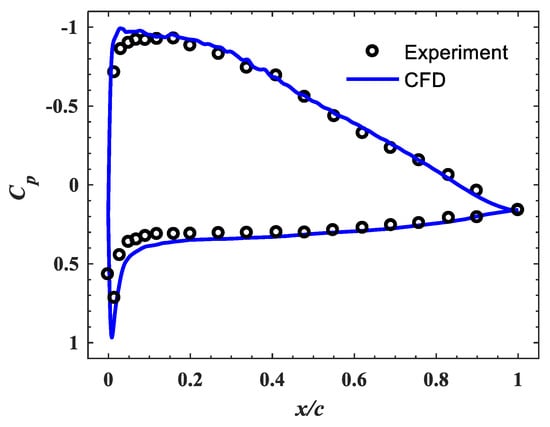
Figure 3.
Comparison of the computed and experimental pressure coefficient for NACA 4412 airfoil.

Table 1.
Grid independence study.
According to the wave theory, the first–order linear wave is based on the inviscid hypothesis. However, the k–ω SST turbulence model is used for CFD simulation. Therefore, it is necessary to ensure that the numerical wave is in agreement with the theoretical wave. A wave with the wavelength λ = 5c and the amplitude a = 0.12c is simulated in the range of the computational domain. As shown in Figure 4, the wave generated by the VOF method matches well with the theoretical wave.

Figure 4.
Comparison of the computed and theoretical wave elevation at t = 1.2 s.
In this study, the wavy ground effects were evaluated as a contrast. The NACA 0015 airfoil is chosen to verify the numerical method for predicting aerodynamics of an airfoil over the wavy ground. The simulation is conducted to compare with the wind tunnel data from Lee and Tremblay–Dionne [19]. The simulation conditions are consistent with the experiment, including the chord length of the airfoil set as 25.4 mm, the Reynolds number set as 1.61 × 10⁵, the angle of attack set as 12°, and the ground clearance set as h/c = 0.05. Besides, the wave parameters are a = 0.05c and λ = c. Figure 5 shows the comparison of pressure coefficient distributions under the wavy ground condition with those under the free stream condition. It reveals that the numerical calculation produces the similar pressure distribution to the experimental data.
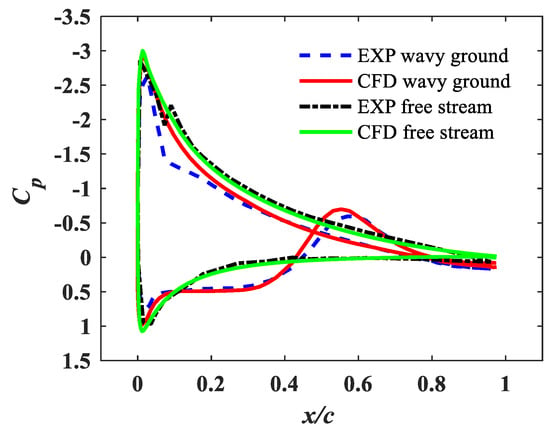
Figure 5.
Comparison of experimental and computed pressure coefficient distributions for NACA 0015 airfoil. EXP = experimental.
3. Results and Discussion
3.1. Lift Behavior
The aerodynamics of the airfoil flying over the wavy water surface is periodic. For clearer analysis, a relative time t* is defined to describe the relative position between the airfoil and wave. Supposing that T represents a wave period which is the time of the airfoil moving past one wavelength, the relative time is defined as t* = t/T. At the initial moment of one period, the trailing edge of the airfoil is directly above the wave crest. For each angle of attack, the lift coefficients of various amplitudes are shown in Figure 6. For comparison, the lift coefficients under the case of free stream and flat ground effect at the corresponding angle are calculated as well.
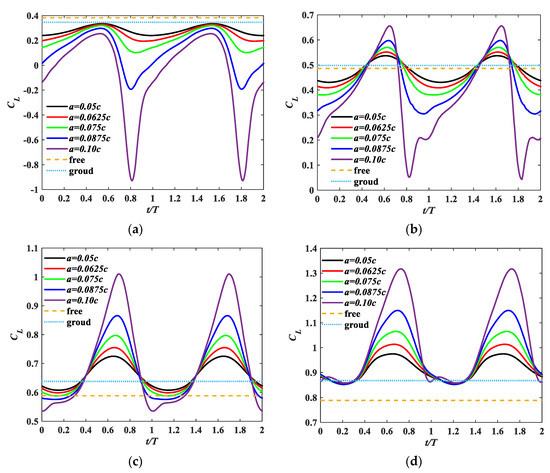
Figure 6.
Change in lift coefficients in two periods at different wave amplitudes: (a) α = 0°; (b) α = 1°; (c) α = 2°; (d) α = 4°. free = free stream; ground = flat ground.
As can be seen from Figure 6, the shape of the lift coefficient curves at low wave amplitudes is similar to sinusoidal waves. With the wave amplitude increasing, the fluctuation amplitude of the lift coefficient curves increases remarkably and the shape of the curve changes. It is also revealed that the trend of aerodynamics varying with the wave amplitude is inconsistent at different angles. When α = 0°, the most significant change occurs at the valley of the lift coefficient curve, with the minimum value decreasing considerably as the wave amplitude increases. When the wave amplitude is larger than 0.0875c, the minimum value of the lift coefficient is even less than zero, and this will threaten flight safety seriously. While the fluctuation amplitude at the peak increases as well, the maximum value of the lift coefficient still decreases. For the case of α = 1°, the amplitudes of both the wave crest and the trough increase, but the minimum value decreases more. As for the case of α = 2° and 4°, the maximum value of the lift coefficient increases notably, and the wave trough value decreases rarely especially for α = 4°. It can be concluded that as the angle of attack increases, the enhancing effect caused by the amplitude increase transfers from the valley of the lift curve to the crest, in the range of low attack angles.
The time–averaged lift coefficients of different angles are then calculated and presented in Figure 7, and the result matches with the aforementioned analysis. For α = 0° and 1°, the time–averaged lift coefficients decreases as the wave amplitude increases and those of α = 2° and 4° change inversely. The significant increase in the lift coefficient at α = 4° when the airfoil moves in proximity to the wavy water surface has been discovered in our previous research and explained in detail [26]. The flow mechanism is that the air under the airfoil is compressed by the particles on the water surface due to their vertical movement, and the hydrodynamic force is then transmitted to the airfoil. According to this theory, the vertical disturbance of the wavy water enhances as the amplitude increases, and hence the time–averaged lift coefficient rises. However, the theory cannot directly explain the lift loss at α = 0° and 1°. Compared the dashed line with the dotted line in Figure 6a, the lift coefficient in the ground effect case is lower than that in the free stream case at α = 0°. It is apparent that there exists a negative ground effect at α = 0°, and the increase of the wave amplitude seems to enhance the effect. Therefore, the influence of the wavy water at low angles of attack needs more clarification.

Figure 7.
Variation in the time–averaged lift coefficients with wave amplitudes for different angles of attack. a/c = 0 means flat ground.
3.2. Flow Field Analysis and Discussion
Based on the foregoing analysis, the trend of the lift coefficient curve varying with the wave amplitude is similar for α = 0° and 1°. Since the lift loss phenomenon is more prominent at 0°, the aerodynamics of this angle is taken as an example. We first choose a low wave amplitude case where a is 0.05c for analysis. In this case, the amplitude is limited compared with the ride height. For clearer clarification of the flow mechanism, the airfoil is divided into upper and lower surfaces through the leading and trailing edge points and the lift coefficients of these two parts are defined as CL,up and CL,low. Figure 8 shows the lift coefficient curves in two periods. It can be seen that the fluctuation amplitudes of CL,up and CL,low are similar in this case, and therefore the influence of the wavy water vertical movement on the lower surface is limited.

Figure 8.
Lift coefficients of the upper and lower surfaces at a = 0.05c and α = 0°.
For detailed analysis, one period of the airfoil moving over the wavy water surface is divided into four time points, with the state at t* = 0 and t* = 1 being the same. Figure 9 shows the velocity contours at different moments and Figure 10 shows the pressure coefficient distributions on the airfoil at corresponding moments. V* is defined as the ratio of the local velocity to the stream velocity. Further, the pressure coefficient Cp is defined as Equation (7),
where p is the local pressure, p∞ and V∞ are the pressure and velocity of the incoming flow far ahead respectively, and ρ is the air density.
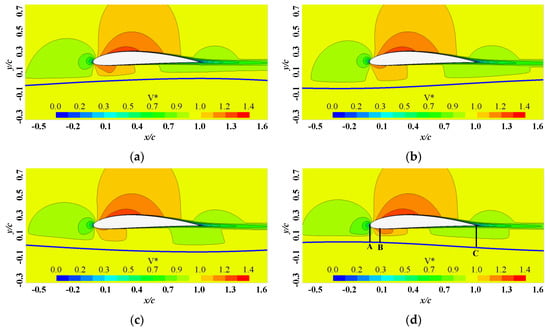
Figure 9.
Velocity contours of different moments at a = 0.05c and α = 0°: (a) t* = 0.0; (b) t* = 0.25; (c) t* = 0.5; (d) t* = 0.75.

Figure 10.
Pressure coefficient distributions on the airfoil at different moments at a = 0.05c and α = 0°.
As shown in Figure 9, the leading edge of the airfoil at α = 0° is close to the water surface. Therefore the cambered leading edge will lead to shrinkage at the flow channel inlet under the lower surface. For instance, the flow channel in Figure 9d is similar to a 2–D Venturi tube, which is first convergent from the inlet—Section A to the throat—Section B, and then divergent to the outlet—Section C. In this case, the incoming flow will first accelerate to a maximum velocity at the throat section and then decelerate gradually. However, under the circumstance of the wavy water surface, the vertical movement of the wave influences the flow channel. To illustrate this phenomenon, the case of the airfoil flying over the rigid wavy ground with the same wave parameters is conducted as a comparison. Figure 11 shows the velocity contours of the airfoil moving over the wavy water surface and wavy ground at t* = 0.75. Compared with Figure 11b, whether the high velocity region at the throat section or the low velocity regions near the leading edge and trailing edge in Figure 11a do not expand to the underlying surface. It is apparent that the actual flow channel in the wavy water case is not the exact shape formed by the lower surface of the airfoil and water surface. The reason is that the particles on the water surface move vertically, leading to the air near the water surface moving with them. The outline of the actual flow channel is drawn in Figure 11a and is compressed compared with Figure 11b. The throat—Section B moves rearward, and the width of it is narrower. Therefore the high velocity region is larger, and the maximum value of the velocity increases.

Figure 11.
Velocity contours around the airfoil at t* = 0.75: (a) wavy water surface; (b) wavy ground.
During the period from t* = 0 to t* = 0.25, the wave trough moves towards the leading edge, and the distance between the leading edge of the airfoil and the water surface increases. With the cross section getting widen, the shrinkage at the inlet decreases correspondingly and weakens the acceleration effect of the airflow in the flow channel. Due to the deceleration of the airflow, the pressure on the lower surface of the airfoil increases, and the corresponding pressure coefficient gets higher in the range from x/c = 0.1 to x/c = 0.5 in Figure 10. The lift coefficient of the lower surface consequently increases. From t* = 0.25 to t* = 0.5, the distance between the leading edge of the airfoil and the water surface decreases and enhances the blocking effect, while the shrinkage at the inlet does not change significantly. Thus, the maximum velocity of the airflow under the lower surface declines at the leading edge, and a significant pressure coefficient increase can be observed from the range of x/c = 0 to x/c = 0.1 in Figure 10. Therefore, the lift coefficient still increases. From t* = 0.5 to t* = 0.75, the wave crest moves towards the airfoil, and the distance between the leading edge of the airfoil and the water surface decreases. Monitoring the movement of the water surface, we can see that there exists an upward velocity component for particles on the water surface, as shown in Figure 12. The movement of particles on the water surface forces the air near the water surface to move vertically and consequently enhances the shrinkage of the flow channel further. Owing to this phenomenon, the acceleration of the airstream enhances, and the pressure of the lower surface as well as the lift coefficient decreases. Besides, from t* = 0.25 to t* = 0.75, the upward actuation by the water surface and the blocking effect at the inlet of the flow channel cause more air to flow above the upper surface. The velocity of the airflow on the upper surface thereby increases, with an extension of high velocity regions in Figure 9c,d. Therefore, a lower pressure distribution occurs on the upper surface with more suction. Finally, the wave moves downward at the leading edge of the airfoil, and the width of the throat section begins to increase in the period of t* = 0.75~1.0. Consequently, the shrinkage of the flow channel decreases, and the acceleration effect weakens. The stream velocity under the lower surface decreases, and the pressure increases, resulting in an increase in the lift coefficient. The combined effect of the blocking effect weakening and the upward force by the wave movement decreasing leads to the decline of the airflow over the upper surface. The velocity of the airflow then decreases, and the suction on the upper surface also decreases.

Figure 12.
Vertical velocity of the particles on the water surface below the airfoil.
The case of the same angle of attack and a higher amplitude a = 0.1c, is discussed in the following. Likewise, the change of CL,up and CL,low is presented in Figure 13. Under the situation of the high amplitude, the fluctuation of CL,up and CL,low both enhances, but it is clear that the dramatic decrease of CL,low dominates the lift change. The lift coefficient of the lower surface reaches the maximum at around t* = 0.5 and then reaches the minimum at t* = 0.8. Velocity contours at four different moments and the corresponding pressure coefficient distributions are shown in Figure 14 and Figure 15 respectively. Comparing Figure 14a,d, we can see that the high velocity region on the lower surface of the airfoil at t* = 0 is larger than that at t* = 0.8. The maximum value of the velocity at t* = 0 is also higher. However, Figure 15 indicates that the pressure coefficient of the corresponding region at t* = 0.8 is lower than that at t* = 0, and an unusual low pressure peak occurs at t* = 0.8 from the range of x/c = 0.1 to x/c = 0.4 on the lower surface. The result is in contradiction with the theory of the Venturi tube, which suggests that a higher velocity corresponds to lower pressure. Moreover, the maximum pressure coefficient on the airfoil surface usually occurs at the leading edge stagnation point, and the value is equal to 1 according to the definition, in the case of single–phase incompressible airflow. While for the two–phase wave with a high amplitude, there exists a pressure peak where the maximum pressure coefficient exceeds 1 at t* = 0.8 on the lower surface, as shown in Figure 15. These abnormal phenomena reveal that under high wave amplitude situations, the airflow velocity change caused by the flow channel variation is not the only factor that should be considered when analyzing the pressure distribution.

Figure 13.
Lift coefficients of the upper and lower surfaces at a = 0.1c and α = 0°.
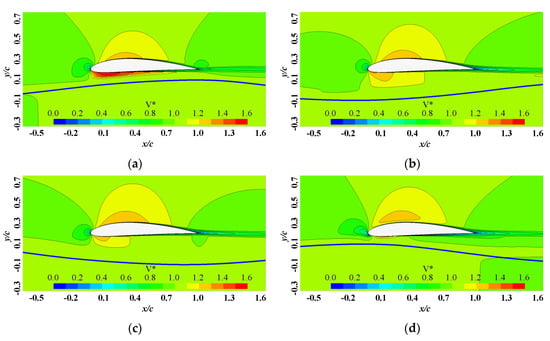
Figure 14.
Velocity contours of different moments at a = 0.1c and α = 0°: (a) t* = 0.0; (b) t* = 0.25; (c) t* = 0.5; (d) t* = 0.8.
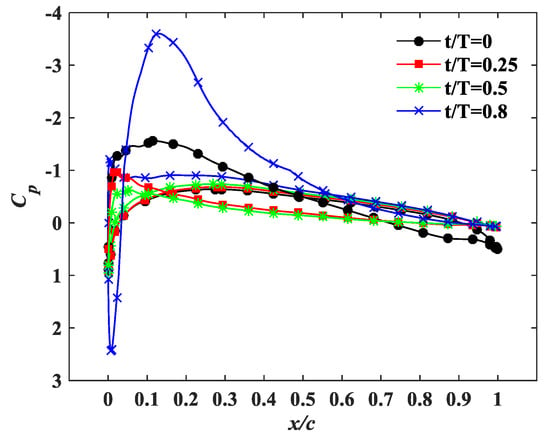
Figure 15.
Pressure coefficient distributions on the airfoil at different moments at a = 0.1c and α = 0°.
When the wave amplitude is higher, the distance between the wave crest and airfoil is closer. The former analysis implies that the upward movement of the particles on the water surface might directly impact on the pressure distribution on the airfoil besides the shape of the flow channel. This is instructive for the analysis of the lift change at different moments, especially the abrupt decline near t* = 0.8. Therefore, we exhibit the vertical velocity of the particles on the water surface below the airfoil at different moments in Figure 16. At t* = 0, although the water surface under the airfoil starts to move downward according to Figure 16, the influence when the wave crest passes the lower surface of the airfoil on the airflow still exists. It is shown that the flow channel is compressed considerably in Figure 14a. Therefore, a large high velocity region appears and the pressure coefficients in this region are fairly low. At the same time, the peak of the wave locates at the trailing edge of the airfoil, and the particles on the water surface still move upward in this area (see Figure 16) and compress the air. Thus, there is a high pressure region near the trailing edge in Figure 15. During the period from t* = 0 to t* = 0.5, the distance between the airfoil and the water surface increases, and the shrinkage of the flow channel at entry decreases. The wavy water surface under the airfoil mainly moves downward, and the interaction between it and the air weakens. Therefore, the change of the velocity and pressure is similar to the case of lower amplitude. In the period of t* = 0.5~0.8, the crest of the wave moves towards the leading edge, and the distance between the wave and the airfoil decreases. Figure 16 shows that the particles on the water surface have a fairly high vertical velocity towards the airfoil. As the position of the stagnation point is close to the wave crest, the compression of the particles on the water surface leads to a high pressure peak at the leading edge of the lower surface. Therefore, in Figure 15, we can see the pressure coefficient of the leading edge at t* = 0.8 is larger than 1. This sharp pressure increase enhances the shrinkage of the flow channel entry, and thus, the air flowing under the airfoil is blocked. Simultaneously, the air which have passed the leading edge accelerates towards the trailing edge because of the compression by the wavy water surface. A peak of negative pressure then comes into existence on the lower surface, and CL,low falls into the minimum value rapidly. Figure 17 shows the pressure contour around the airfoil at t* = 0.8, where the high pressure region at the leading edge and the following low pressure region can be clearly observed. Additionally, the obstruction at the flow channel under the airfoil forces more air to flow above the airfoil. The velocity of the airflow above the upper surface increases consequently, causing the low pressure peak at the leading edge of the upper surface and the increase of CL,up. In the period of t* = 0.8~1, the wave crest moves past the leading edge stagnation point. The blocking at the entry of the flow channel is relieved, and the airflow accelerates to flow into. The pressure coefficient on the lower surface returns to the normal value which is caused by the high velocity. In addition, the suck peak on the upper surface disappears as the airflow over the upper surface decreases, and CL,up decreases sharply.

Figure 16.
Vertical velocity of the particles on the water surface below the airfoil at different moments.
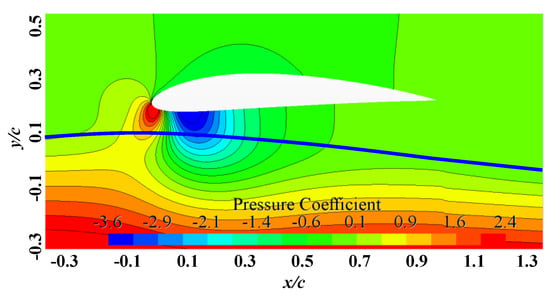
Figure 17.
Pressure contour around the airfoil at t* = 0.8.
To clarify the difference between the low and high amplitudes for the wavy water surface, the velocity of the particles on the water surface in a larger region at t* = 0.8 is given in Figure 18. For different wave amplitudes, the magnitude of the velocity component in the horizontal direction is similar, while that in the vertical direction is in approximate proportion to the wave amplitude. Consequently, the influence of the high amplitude wave on the air under the airfoil enhances markedly when the wave moves upward. Besides, the airfoil locates between the dashed lines in Figure 18. For the case where the amplitude is a = 0.05c, the wave is scarcely affected by the pressure distribution beneath the airfoil. Whereas for the high amplitude wave, it shows that the velocity distributions below the airfoil are different from those at a wavelength ahead of the airfoil. At the leading edge of the airfoil, the high pressure region on the lower surface is so powerful that it puts off the upward movement of the wave and accelerates the wave in the horizontal direction. Hence, there exists strong interaction between the airfoil and the wavy water surface when the wave amplitude is higher, and it is the main reason for the unusual change of lift coefficient.
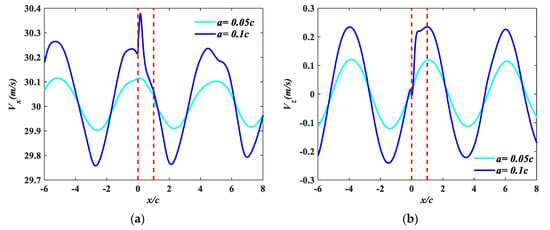
Figure 18.
Velocity of particles on the water surface: (a) horizontal velocity; (b) vertical velocity. Vx = velocity component in the horizontal direction; and Vz = velocity component in the vertical direction.
It can be concluded that the flow mechanism of the airfoil moving over the wavy water surface with a higher amplitude is different from that with a lower amplitude. For the high amplitude wave where the wave peak is close enough to the airfoil, the vertical movement of the water surface directly affects the pressure distributions on the airfoil apart from the compression effect on the flow channel. When the wave crest moves below the leading edge stagnation, the compression by the wave creates a high pressure region and prevents air from flowing under the lower surface. Thus a large low pressure region with low speed occurs at the lower surface and leads to lift loss. The velocity contour and pressure coefficient distribution of α = 1° with the same wave amplitude are shown in Figure 19 and Figure 20. Similar phenomena can be found at α = 1°, except that the peak magnitude of the high pressure at the leading edge and the following low pressure declines. This is because that the leading edge at α = 1° is higher than that at α = 0°, and the larger distance weakens the blocking effect.
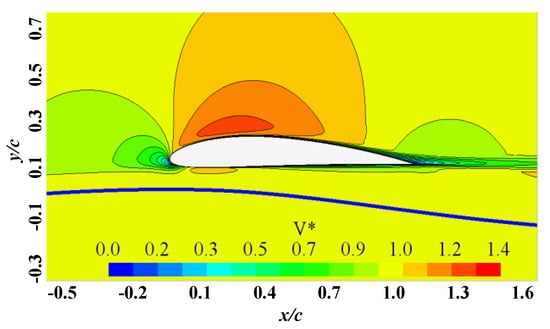
Figure 19.
Velocity contour of α = 1° at a = 0.1c and t* = 0.8.

Figure 20.
Pressure coefficient distribution on the airfoil of α = 1° at a = 0.1c and t* = 0.8.
After clarifying the unusual lift loss at α = 0° and 1° under the case of high amplitudes, the flow mechanism of higher angles of attack is explained briefly. Taking the result of α = 2° and a = 0.1c as an example, the velocity contour at t* = 0.8 is shown in Figure 21, the pressure coefficient distributions of different moments are shown in Figure 22 and the change of lift coefficients is shown in Figure 23. Figure 21 shows that the distance between the airfoil leading edge and the wave crest is larger than that at α = 0° and 1°. Compared with Figure 14d or Figure 19, the blocking effect disappears. Thus, the low velocity area expands to nearly the whole lower surface of the airfoil instead of assembling at the leading edge. The high pressure region near the stagnation point and the following low pressure region in Figure 15 and Figure 20 do not occur. Instead, a high pressure region occurs at the area near the trailing edge as shown in Figure 22, which is the result of the air compressed by the upward movement of the particles on the water surface. The high pressure area agrees with the lift increase of the lower surface in Figure 23, which starts at t* = 0.4 as the wave under the airfoil begins to move upward and ends at t* = 1 as the wave crest passes the airfoil completely. The comparison of various angles further corroborates the conclusion that the upward movement of the wavy water surface can directly affect the pressure distribution on the lower surface of the airfoil. Besides, the distance between the leading edge and the wave crest is the critical factor which determines whether the influence will generate a blocking effect or transmit extra lift.

Figure 21.
Velocity contour of α = 2° at a = 0.1c and t* = 0.8.
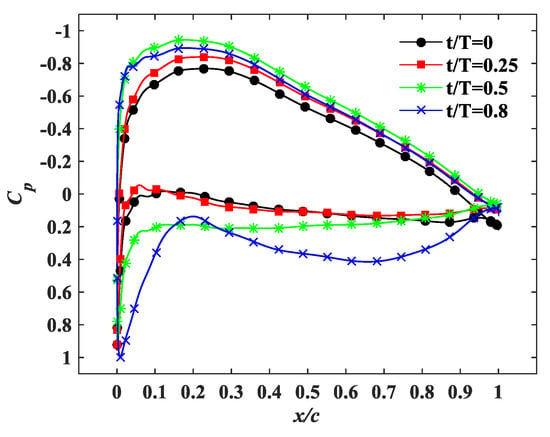
Figure 22.
Pressure coefficient distributions on the airfoil at different moments at a = 0.1c and α = 2°.
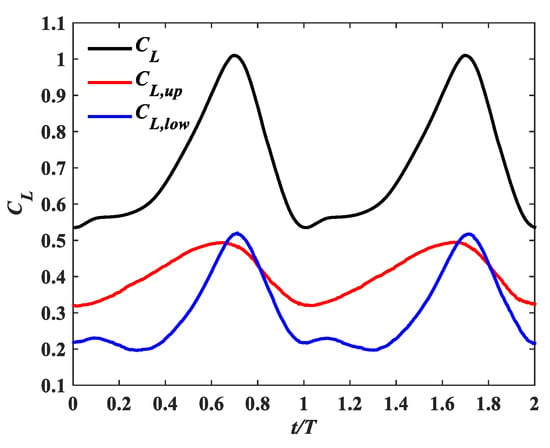
Figure 23.
Lift coefficients of the upper and lower surfaces at a = 0.1c and α = 2°.
4. Conclusions
The aerodynamics and flow fields of the NACA 4412 airfoil moving over the wavy water surface with various wave amplitudes are numerically investigated in this paper. The calculations are conducted in the range of low angles of attack (α = 0°~4°), and for each angle, the wave amplitude varies from 0.05c to 0.1c. Based on the result of this study, the following conclusions can be drawn.
- (1)
- The wavy water surface will cause the lift coefficient of the airfoil to fluctuate periodically. The fluctuation amplitude of the lift coefficient curves increases remarkably with successive increases in the wave amplitude and sharp peaks occur in the curves. WIG crafts flying over the ocean with high waves will generate severe oscillation.
- (2)
- During the periodical change of lift, a high wave amplitude will lead to sudden lift loss at α = 0° and 1°, which even causes negative lift in some cases and threats flight security for WIG crafts. With the increase of the angle of attack, the significant decrease in lift will gradually turn to the increase in lift. Therefore, WIG crafts should avoid cruising at small angles of attack.
- (3)
- At α = 2° and 4°, the time–averaged lift coefficient of the airfoil in proximity to the wavy water surface is larger than that of the flat ground, and it increases as the wave amplitude increases. This is consistent with the former research, which indicated that the vertical movement of wavy water surface would compress the air and lead to a significant increase. While at α = 0° and 1°, the time–averaged lift coefficient decreases as the wave amplitude increases, and the lift loss caused by the ground effect enhances.
- (4)
- For a lower wave amplitude at α = 0° and 1°, the wavy water surface affects the flow field indirectly by driving the air to move vertically, thereby changing the shape of the actual flow channel. Under this situation, the change in the lift coefficient is mainly influenced by the contraction and expansion of the flow channel as the airfoil moves over wavy water.
- (5)
- For a higher wave amplitude at α = 0° and 1°, the pressure distributions on the airfoil are directly impacted by the vertical movement of particles on the wavy water surface. When the wave crest moves below the leading edge stagnation, the compression by the wave creates a high pressure region and prevents air from flowing under the lower surface. A low pressure region consequently occurs after the leading edge and decreases the lift coefficient significantly. This phenomenon is caused by the close distance between the leading edge stagnation and the wave crest, and disappears at higher angles of attack.
- (6)
- The upward movement of high amplitude waves can transmit hydrodynamic force to the airfoil by compressing the air under the airfoil. This is the reason for the significant lift increase at α = 2° and 4°. The distance between the leading edge and the wave crest is the critical factor which determines whether the impact will be blocked and results in the inconsistent lift change at different angles of attack.
This paper studies the influence of wave amplitudes on the aerodynamics of the airfoil moving over the wavy water surface, providing a new understanding of the ground effect in the case of wavy water surface. These findings are instructive for the design and application of WIG aircrafts, especially under high grade sea conditions.
Author Contributions
Conceptualization, X.L., D.M. and H.H.; methodology, Y.G. and H.H.; software, X.L.; validation, X.L. and H.H.; formal analysis, Y.G. and H.H.; investigation, X.L. and Y.G.; resources, D.M..; data curation, X.L.; writing—original draft preparation, X.L.; writing—review and editing, M.Y. and H.H.; visualization, X.L.; supervision, D.M. and M.Y.; project administration, D.M. and M.Y. All authors have read and agreed to the published version of the manuscript.
Funding
This research received no external funding.
Institutional Review Board Statement
Not applicable.
Informed Consent Statement
Not applicable.
Data Availability Statement
The data presented in this study are available on request from the corresponding author.
Conflicts of Interest
The authors declare no conflict of interest.
References
- Rozhdestvensky, K.V. Wing-in-ground effect vehicles. Prog. Aerosp. Sci. 2006, 42, 211–283. [Google Scholar] [CrossRef]
- Hsiun, C.-M.; Chen, C.-K. Aerodynamic Characteristics of a Two-Dimensional Airfoil with Ground Effect. J. Aircr. 1996, 33, 386–392. [Google Scholar] [CrossRef]
- Ockfen, A.E.; Matveev, K.I. Aerodynamic characteristics of NACA 4412 airfoil section with flap in extreme ground effect. Int. J. Nav. Arch. Ocean Eng. 2009, 1, 1–12. [Google Scholar] [CrossRef]
- Jung, J.H.; Yoon, H.S.; Chun, H.H.; Hung, P.A.; Elsamni, O.A. Mean flow characteristics of two-dimensional wings in ground effect. Int. J. Nav. Arch. Ocean Eng. 2012, 4, 151–161. [Google Scholar] [CrossRef]
- Qu, Q.; Wang, W.; Liu, P.; Agarwal, R.K. Airfoil Aerodynamics in Ground Effect for Wide Range of Angles of Attack. AIAA J. 2015, 53, 1048–1061. [Google Scholar] [CrossRef]
- Qu, Q.; Jia, X.; Wang, W.; Liu, P.; Agarwal, R.K. Numerical study of the aerodynamics of a NACA 4412 airfoil in dynamic ground effect. Aerosp. Sci. Technol. 2014, 38, 56–63. [Google Scholar] [CrossRef]
- Qin, Y.; Liu, P.; Qu, Q.; Guo, H. Numerical study of aerodynamic forces and flow physics of a delta wing in dynamic ground effect. Aerosp. Sci. Technol. 2016, 51, 203–221. [Google Scholar] [CrossRef]
- Lange, R.H.; Moore, J.W. Large Wing-in-Ground Effect Transport Aircraft. J. Aircr. 1980, 17, 260–266. [Google Scholar] [CrossRef]
- Zhang, X.; Zerihan, J. Off-Surface Aerodynamic Measurements of a Wing in Ground Effect. J. Aircr. 2003, 40, 4. [Google Scholar] [CrossRef]
- Jamei, S.; Maimun, A.; Mansor, S.; Azwadi, N.; Priyanto, A. Numerical Investigation on Aerodynamic Characteristics of a Compound Wing-in-Ground Effect. J. Aircr. 2012, 49, 1297–1305. [Google Scholar] [CrossRef]
- Jung, J.H.; Kim, M.J.; Yoon, H.S.; Hung, P.A.; Chun, H.H.; Park, D.W. Endplate effect on aerodynamic characteristics of three-dimensional wings in close free surface proximity. Int. J. Nav. Arch. Ocean Eng. 2012, 4, 477–487. [Google Scholar] [CrossRef][Green Version]
- Barber, T.J. A Study of Water Surface Deformation Due to Tip Vortices of a Wing-in-Ground Effect. J. Ship Res. 2007, 51, 182–186. [Google Scholar] [CrossRef]
- Zong, Z.; Liang, H.; Zhou, L. Lifting line theory for wing-in-ground effect in proximity to a free surface. J. Eng. Math. 2012, 74, 143–158. [Google Scholar] [CrossRef]
- Liang, H.; Zhou, L.; Zong, Z.; Sun, L. An analytical investigation of two-dimensional and three-dimensional biplanes operating in the vicinity of a free surface. J. Mar. Sci. Tech. 2013, 18, 12–31. [Google Scholar] [CrossRef]
- Bal, S. Free surface effects on 2-D airfoils and 3-D wings moving over water. Ocean Syst. Eng. 2016, 6, 245–264. [Google Scholar] [CrossRef]
- Im, Y.; Chang, K. Unsteady Aerodynamics of a Wing-in-Ground-Effect Airfoil Flying over a Wavy Wall. J. Aircr. 2000, 37, 690–696. [Google Scholar] [CrossRef]
- Qu, Q.; Lu, Z.; Liu, P.; Agarwal, R.K. Numerical Study of Aerodynamics of a Wing-in-Ground-Effect Craft. J. Aircr. 2014, 51, 913–924. [Google Scholar] [CrossRef]
- Gao, B.; Qu, Q.; Agarwal, R.K. Aerodynamics of a Transonic Airfoil above Wavy Ground. In Proceedings of the 2018 AIAA Aerospace Sciences Meeting, Kissimmee, FL, USA, 8–12 January 2018. [Google Scholar] [CrossRef]
- Lee, T.; Tremblay-Dionne, V. Experimental Investigation of the Aerodynamics and Flowfield of a NACA 0015 Airfoil over a Wavy Ground. J. Fluid Eng. 2018, 140, 071202. [Google Scholar] [CrossRef]
- Tremblay-Dionne, V.; Lee, T. Effect of Trailing-Edge Flap Deflection on a Symmetric Airfoil over a Wavy Ground. J. Fluid Eng. 2019, 141, 064501. [Google Scholar] [CrossRef]
- Liang, H.; Zong, Z.; Zou, L. Nonlinear lifting theory for unsteady WIG in proximity to incident water waves. Part 1: Two-dimension. Appl. Ocean Res. 2013, 43, 99–111. [Google Scholar] [CrossRef]
- Liang, H.; Zong, Z.; Zou, L. Nonlinear lifting theory for unsteady WIG in proximity to incident water waves. Part 2: Three-dimension. Appl. Ocean Res. 2013, 43, 88–98. [Google Scholar] [CrossRef]
- Liang, H.; Wang, X.; Zou, L.; Zong, Z. Numerical study of two-dimensional heaving airfoils in ground effect. J. Fluid Struct. 2014, 48, 188–202. [Google Scholar] [CrossRef]
- Kaneko, Y.; Omori, T.; Kajishima, T. Numerical study on the aerodynamics of an airfoil moving close to an air-water interface. Trans. JSME 2016, 82, 16-00112. (In Japanese) [Google Scholar] [CrossRef][Green Version]
- Zhi, H.; Xiao, T.; Chen, J.; Wu, B.; Tong, M.; Zhu, Z. Numerical Analysis of Aerodynamics of a NACA4412 Airfoil above Wavy Water Surface. In AIAA Aviation 2019 Forum; American Institute of Aeronautics and Astronautics: Reston, VA, USA, 2019. [Google Scholar] [CrossRef]
- Hu, H.; Ma, D.; Guo, Y.; Yang, M. Airfoil Aerodynamics in Proximity to Wavy Water Surface. J. Aerosp. Eng. 2021, 34, 04020119. [Google Scholar] [CrossRef]
- Mi, B. Numerical investigation on aerodynamic performance of a ducted fan under interferences from the ground, static water and dynamic waves. Aerosp. Sci. Technol. 2020, 100, 105821. [Google Scholar] [CrossRef]
- Hirt, C.W.; Nichols, B.D. Volume of fluid (VOF) method for the dynamics of free boundaries. J. Comput. Phys. 1981, 39, 201–225. [Google Scholar] [CrossRef]
- Sundar, V. Ocean Wave Mechnics: Applications in Marine Structures, 1st ed.; John Wiley & Sons, Ltd.: Chichester, UK, 2015; pp. 41–52. [Google Scholar] [CrossRef]
- Elhanafi, A.; Fleming, A.; Leong, Z.; Macfarlane, G. Effect of RANS-based Turbulence Models on Nonlinear Wave Generation in a Two-Phase Numerical Wave Tank. Prog. Comput. Fluid Dyn. Int. J. 2017, 17, 141–158. [Google Scholar] [CrossRef]
- Firooz, A.; Gadami, M. Turbulence Flow for NACA 4412 in Unbounded Flow and Ground Effect with Different Turbulence Models and Two Ground Conditions: Fixed and Moving Ground Conditions. In Proc. Conf. on Boundary and Interior Layers; University of Gottingen: Lower Saxony, Germany, 2006; Volume 98, pp. 161–164. [Google Scholar]
- Ahmed, M.R.; Takasaki, T.; Kohama, Y. Aerodynamics of a NACA4412 Airfoil in Ground Effect. AIAA J. 2007, 45, 37–47. [Google Scholar] [CrossRef]
Publisher’s Note: MDPI stays neutral with regard to jurisdictional claims in published maps and institutional affiliations. |
© 2021 by the authors. Licensee MDPI, Basel, Switzerland. This article is an open access article distributed under the terms and conditions of the Creative Commons Attribution (CC BY) license (https://creativecommons.org/licenses/by/4.0/).