Article

The Use of Right Angle Fluorescence Spectroscopy to Distinguish the Botanical Origin of Greek Common Honey Varieties

by
Marinos Xagoraris
1,
Panagiota-Kyriaki Revelou
1,
Eleftherios Alissandrakis
2,
Petros A. Tarantilis
1 and
Christos S. Pappas
1,*
1
Laboratory of Chemistry, Department of Food Science and Human Nutrition, Agricultural University of Athens, 75 Iera Odos, 11855 Athens, Greece
2
Laboratory of Quality and Safety of Agricultural Products, Landscape and Environment, Department of Agriculture, Hellenic Mediterranean University, Stavromenos PC, Heraklion, 71410 Crete, Greece
*
Author to whom correspondence should be addressed.
Appl. Sci. 2021, 11(9), 4047; https://doi.org/10.3390/app11094047
Submission received: 14 April 2021 / Revised: 26 April 2021 / Accepted: 28 April 2021 / Published: 29 April 2021
(This article belongs to the Special Issue Authentication of Honey)

Abstract

:
The standardization of the botanical origin of honey reflects the commercial value and quality of honey. Nowadays, most consumers are looking for a unifloral honey. The aim of the present study was to develop a novel method for honey classification using chemometric models based on phenolic compounds analyzed with right angle fluorescence spectroscopy, coupled with stepwise linear discriminant analysis (LDA). The deconstructed spectrum from three-dimensional-emission excitation matrix (3D-EEM) spectra provided a correct classification score of 94.9% calibration and cross-validation at an excitation wavelength (λex) of 330 nm. Subsequently, a score of 81.4% and 79.7%, respectively, at an excitation wavelength (λex) of 360 nm was achieved. Each chemometric model confirmed its power through the external validation with a score of 82.1% for both. Differentiation could be correlated with hydroxycinnamic and hydroxybenzoic acids, which absorb in this region of the spectrum. Fluorescence spectroscopy constitutes a rapid and sensitive technique, which, when combined with the stepwise algorithm and LDA method, can be used as a reliable and predictive authentication tool for honey. This study indicates that the developed methodology is a promising technique for determination of the botanical origin of common Greek honey varieties. Our long-term ambition is to support producers and suppliers to remain in a competitive national and international market.

1. Introduction

In the European Union (EU), beekeeping remains an ever-expanding sector, with the EU establishing itself as the second largest global producer of honey after China, producing 280,000 tons every year [1].
Based on their botanical origins, each variant of unifloral honey commands a premium price due to its organoleptic properties; particularly related to the interest of consumers regarding correctly labeling a honey’s origin. The EU safeguards authenticity by enforcing strict legislation establishing physicochemical characteristics [2], which Greece reinforces by enacting stricter physicochemical characteristics and melissopalynological analyses [3]. Irrespective of these enforced regulations to ascertain the exact origin via scientific means, a number of these parameters are somewhat correlated with large-scale dispersion. Therefore, the resulting chemometric models, using LDA, which are based on physicochemical parameters, are unreliable [4]. Furthermore, it should be considered that these types of analyses are both expensive and time-consuming, and, in the case of melissopalynological analyses, require specialized staff. Honey from pine, fir, thyme, and citrus are commercially available in Greece and their demand from consumers worldwide is constantly increasing. They represent about 60–65%, 15%, 10%, and 5% of the country’s total annual honey production, respectively. In recent years, numerous spectroscopic methods have been proposed to determine honey types of different botanical origins. The most frequently cited spectroscopic techniques include Fourier-transform infrared spectroscopy (FTIR) [5,6], near-infrared (NIR) [7], Raman spectroscopy [6,8], and nuclear magnetic resonance (NMR) [9].
Fluorescence spectroscopy is simple and 100 to 1000 times more sensitive than other spectroscopical techniques [10]. It has been utilized for the determination of honey adulteration [11,12,13], botanical discrimination [14,15,16,17], geographical differentiation [18], and fluorescence marker detection [19,20]. Various statistical methods have been used in factorial discriminant analysis [15], principal component analysis (PCA) [13,16,17,18], partial least squares (PLS) [21], partial least squares discriminant analysis (PLS-DA) [22,23], soft independent modeling of class analogy (SIMCA) [16], and hierarchical cluster analysis (HCA) [17] based on fluorescence spectra data.
Fluorescence excitation-emission matrix (EEM) spectra contain information about a variety of intrinsic fluorochrome compounds, including aromatic amino acids, phenolics, flavins, and Maillard reaction products [13,14,24]. EEM includes spectra regions often complicated due to both Raman and Rayleigh scattering. Nevertheless, honey contains phenolic compounds (phenyl carboxylic acids) that do not coincide with scattering, and their concentrations vary depending on their botanical origins [25,26,27,28]. The abovementioned dispersion can be overcome by subtracting a blank EEM or by using the interpolation method [29]. Thus, the right-angle fluorescence spectroscopic technique can be used.
The aim of this study was the development of an alternative novel method to distinguish honey, based on fluorophore compounds, mainly hydroxycinnamic and other phenyl carboxylic acids. For this purpose, four confirmed unifloral Greek honey varieties were selected.

2. Materials and Methods

2.1. Honey Samples

The honey samples used in this study were provided directly from beekeepers during the 2018 and 2019 harvest years. The botanical origins were confirmed based on physicochemical and mellisopalynological analyses, as defined by European and Greek legislation. A total of 87 unifloral honey samples were derived from the four separate botanical sources (32 thyme, 18 pine, 21 fir, and 16 citrus). The samples were stored in dark at 23 ± 1 °C and their fluorescence spectra were recorded within one month.

2.2. Reagents and Solutions

Standards of phenolics, including kaempferol, catechin, chrysin, hesperetin, isorhamentin, naringenin, and phenolic acids (gallic, chlorogenic, ellagic, gentisic, homogentisic, p-coumaric, protocatechuic, sinapic) were purchased from Extrasynthese (Genay, France). Methyl syringate, caffeic, ferulic, syringic, and vanillic acids were purchased from Sigma-Aldrich (Steinheim, Germany). The purities of the standards were 98–99%. The chemical structures are shown in Table S1. All solutions were prepared by dissolving the abovementioned phenolic compounds in MS-grade acetonitrile (0.01 mg/mL) (Sigma-Aldrich Merck KGaA, Darmstadt, Germany).

2.3. Fluorescence Spectroscopy

Three-dimensional-emission excitation matrices (3D-EEMs) were acquired using a FluoroMate FS-2 spectrometer (CE Mark. Scinco Nieuwegein, NLD) equipped with a continuous wave xenon-arc lamp light source with 500 W of output power. The type of electronic transition was S1 → S0 with a timescale of 10−9 to 10−6 s. Honey samples were homogenized in a water bath at 50 °C for 10 min and introduced into a quartz cuvette (10 mm, 3.5 mL). EEM spectra were recorded in duplicate using a right-angle sample holder. Following optimization of the spectrum acquisition, the emission wavelength (λem) was set from 270 to 620 nm at 5 nm intervals and the excitation wavelength (λex) was set from 240 to 500 nm at 5 nm intervals. The fluorescence spectra were obtained on a computer supported by FluoroMasterPlus software (CE Mark. Scinco, Nieuwegein, The Netherlands).
Each 3D-EEM spectrum was saved as a CSV file and pre-treatment was performed using XLSTAT-3DPlot (XLStat ver 2019.2.2, Addinsoft Inc., New York, NY, USA). Then, all data were normalized using software (The Unscrambler X ver.10.4, CAMO Software AS., Oslo, Norway) before statistical analyses.

2.4. Physicochemical and Melissopalynological Analysis

Regarding physicochemical parameters, sugars (fructose, glucose, and sucrose), electrical conductivity, and moisture content were determined according to Association of Official Analytical Chemists (AOAC) [30] and International Honey Commission (IHC) protocols [31]. Specifically, determination of honey sugars was performed using an HPLC Shimadzu CTO-10A, equipped with a Shimadzu RID-20A detector (Shimadzu Corporation, Kyoto, Japan), and electrical conductivity was determined with a Consort C3010 multi-parameter analyzer (Consort bvba, Turnhout, Belgium). Moisture was measured with a refractometer (Bellingham and Stanley Ltd., Kent, UK).
Melissopalynological analyses were performed with a Kruss microscope (A. Kruss Optronic GmbH, Hamburg, Germany) according to Louveaux et al. [32].

2.5. Statistical Analysis

A total of 87 unifloral honey samples were randomly separated into calibration and test sets. The first group was comprised of 59 honey samples (18 thyme, 13 pine, 16 fir, and 12 citrus) and was named as “standards”; the second group was made up of 28 samples (14 thyme, 5 pine, 5 fir, and 4 citrus) and was named as “unknown”. This was subsequently followed by the development of two chemometric models, based on λex = 330 and 360 nm, using the stepwise-LDA statistical technique. Botanical classification was based on EEM spectra of fluorophore phenolic compounds. Before the development of the discriminant analysis, the homogeneity of the covariance matrices was ensured since the ratio of the largest group (thyme, n = 18) divided by the smallest group (citrus, n = 12) was equal or less than 1.5. [33]. Each chemometric model was examined using cross-validation and external validation. The statistical analyses were performed using SPSS v.25 (IBM, SPSS Inc., Statistics, New York, NY, USA) software.

3. Results and Discussion

3.1. Physicochemical and Melissopalynological Analysis

The physicochemical parameters of all samples were in line with legislation. The amount of fructose and glucose was found to be 60.1 and 66.2 (%w/w) for thyme and citrus honey and 46.4 and 46.3 (%w/w) for pine and fir honey, respectively. Sucrose content was no more than 5 (%w/w) for any of the selected honey varieties. Values of electrical conductivity were ≤600 μS cm−1 and ≤324 μS cm−1 for thyme and citrus honey and ≥911 μS cm−1 and ≥1041 μS cm−1 for pine and fir honey, respectively. Finally, regarding moisture content, legislation demands were met, as the moisture content was less than 20 (%w/w) for thyme, citrus, and pine honey, whilst for fir honey, it was less than 18.5 (%w/w). Table 1 shows a summary of the results of the physicochemical analyses.
The results of the melissopalynological analyses agree with the botanical origin of the honey samples (Table S2).

3.2. 3D-EEM Spectra of Standards Phenolic Compounds

Standard phenolic compounds exhibited excitation with λex ranging between 260 and 360 nm and emission with λem ranging from 315 to 420 nm. Moreover, some flavonoids presented a low fluorescence intensity [24]. Detailed results are shown in Table 2 and the spectra of the standard phenolic compounds are presented in Figure S1.

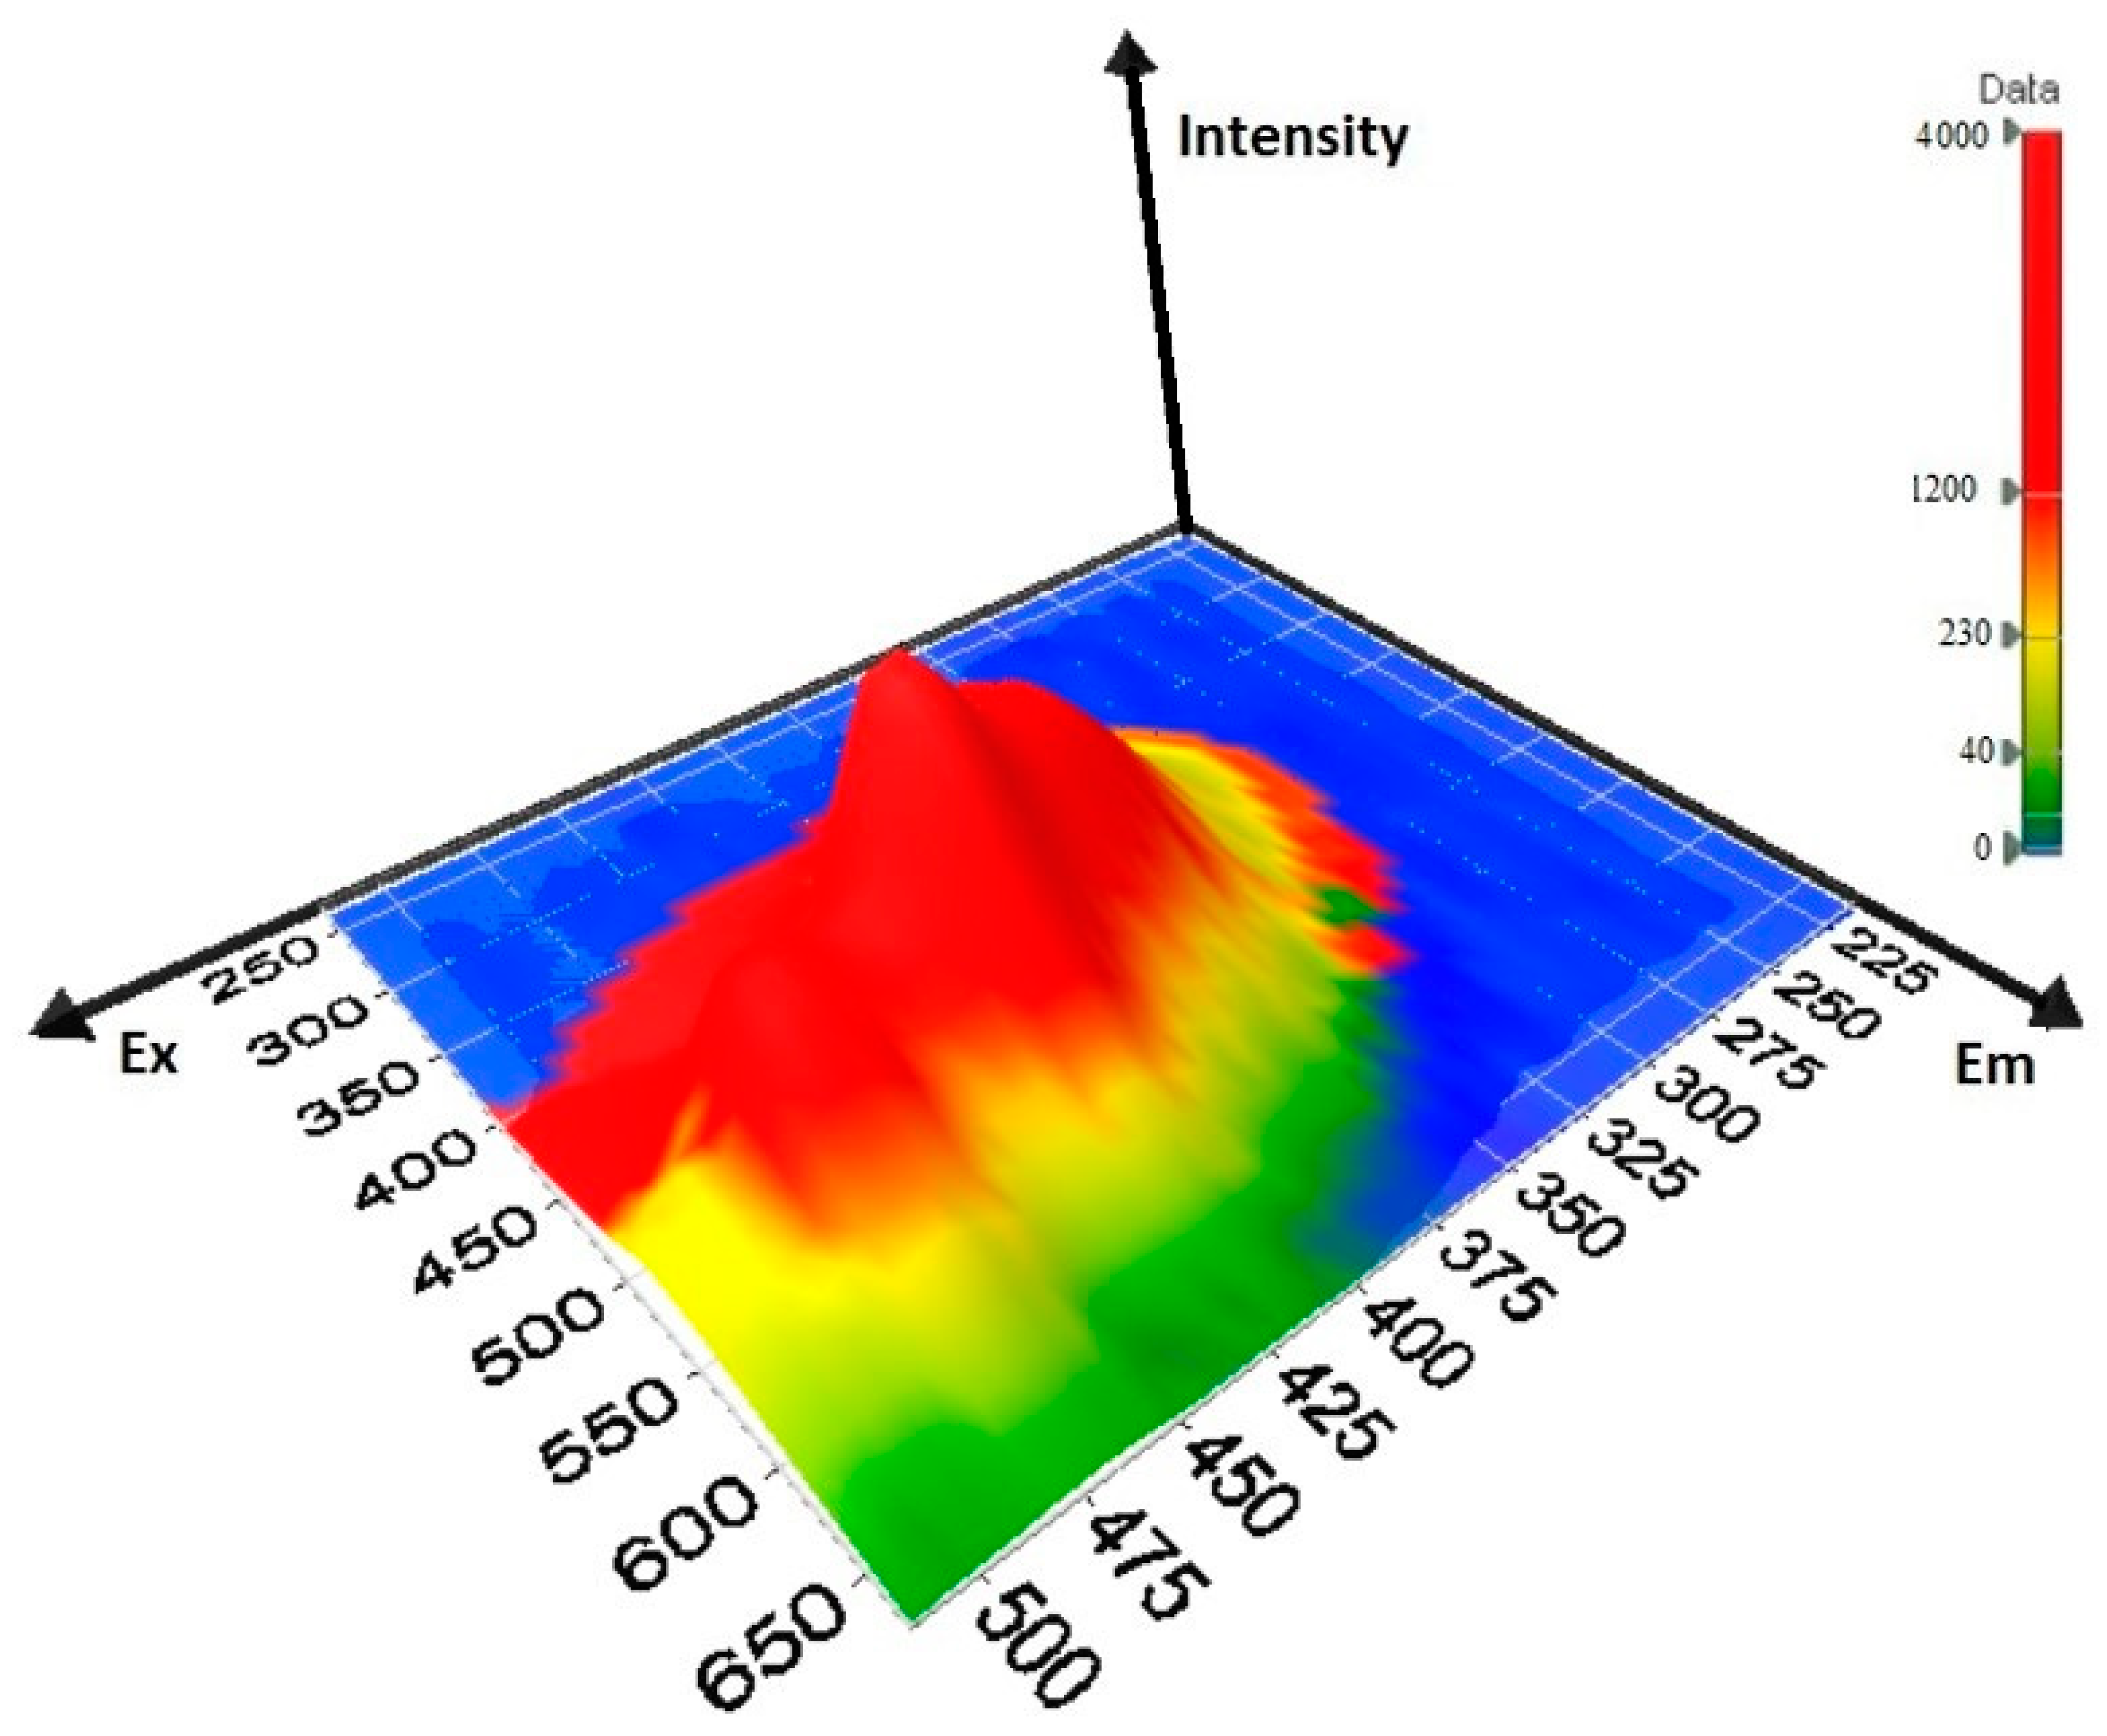
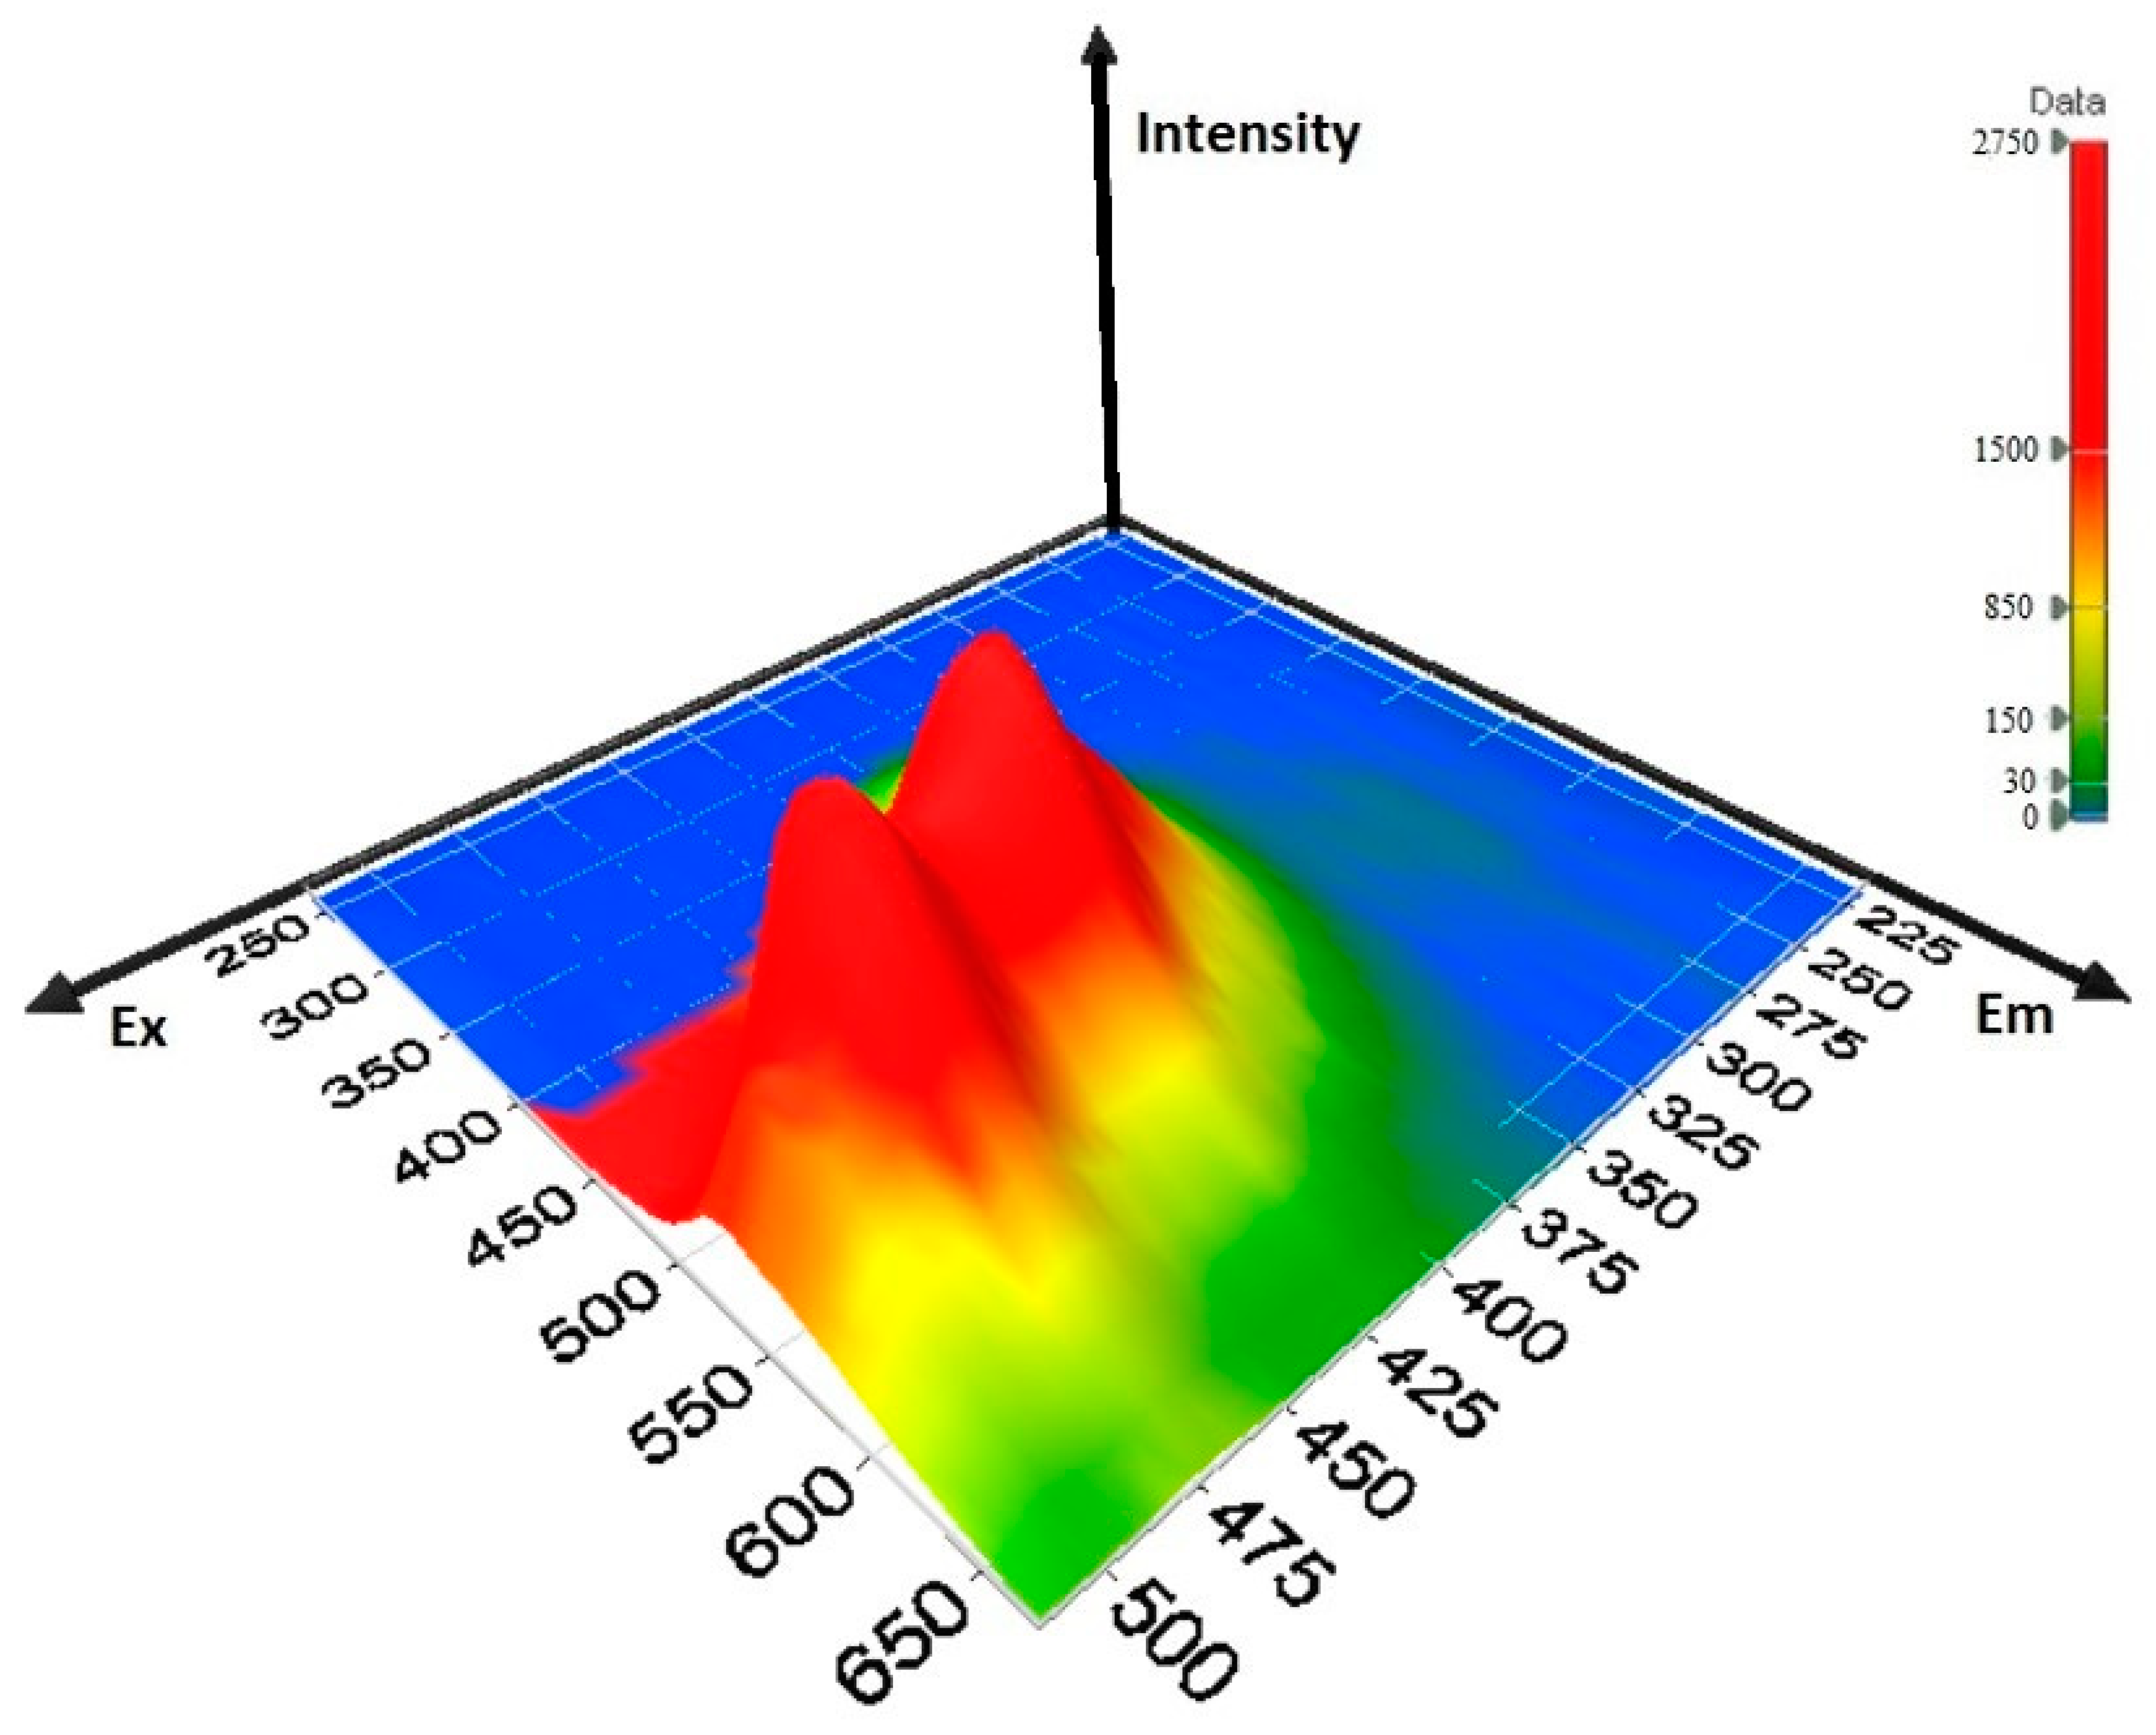
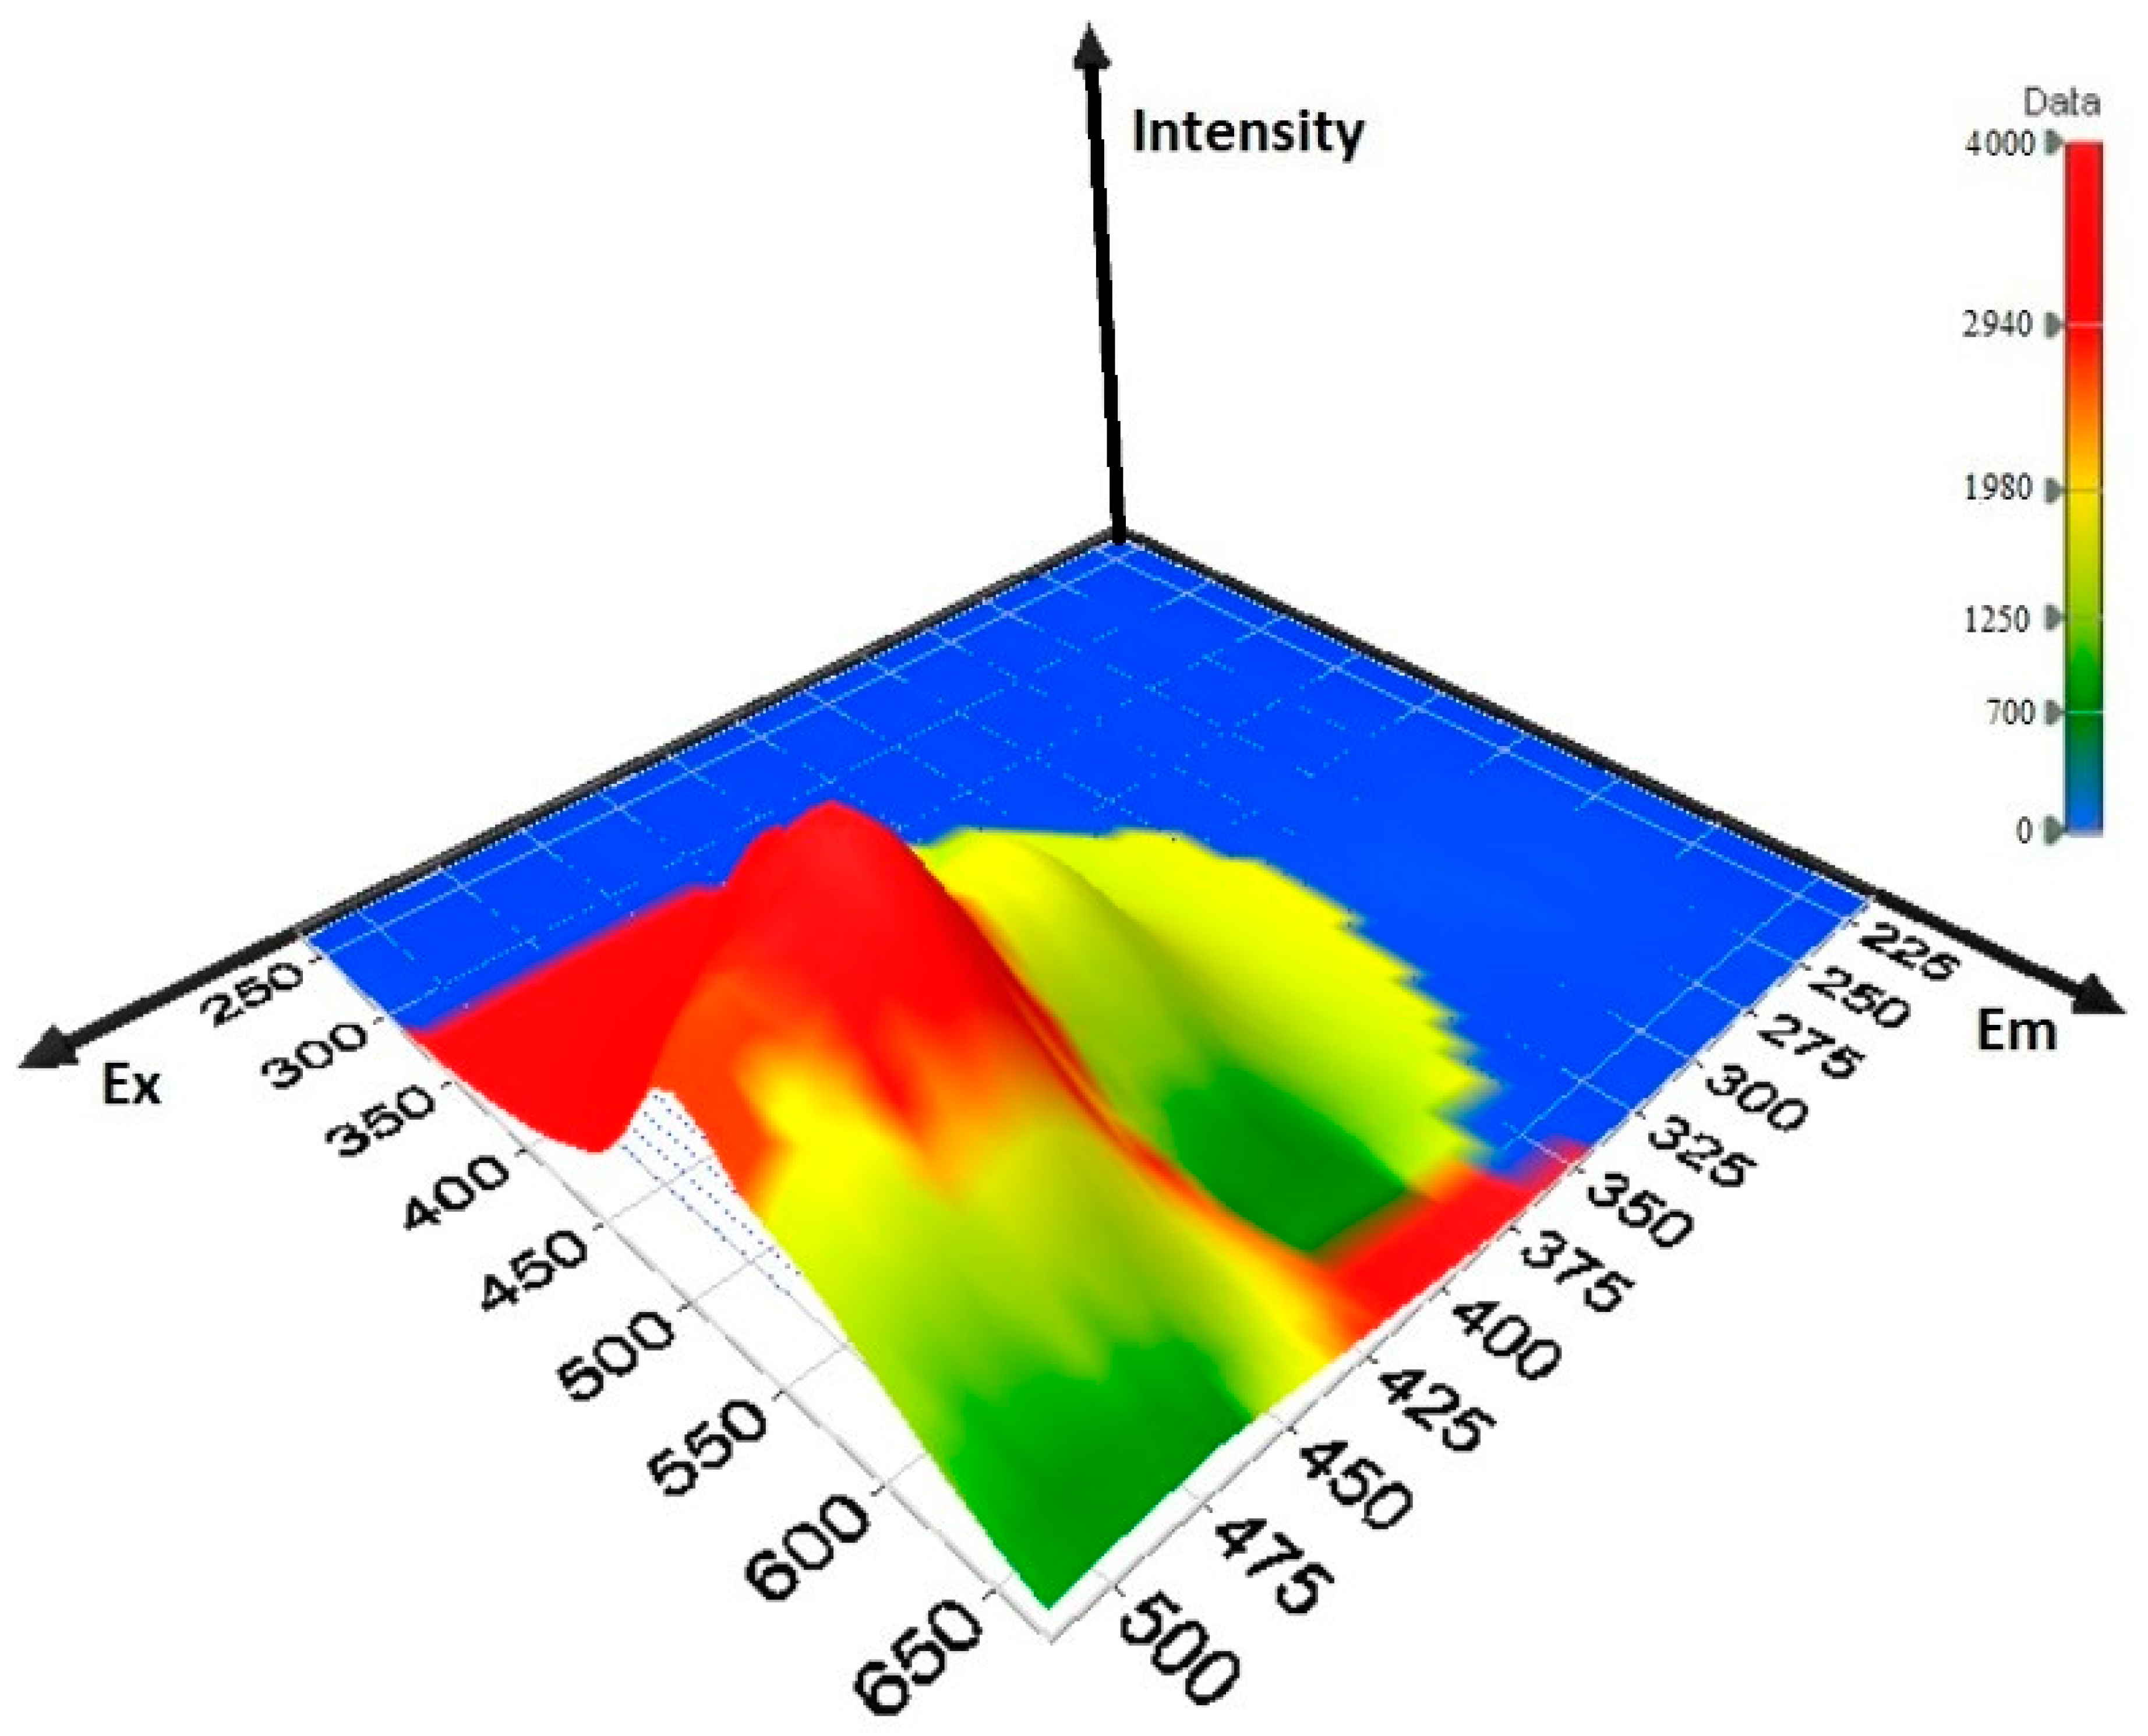
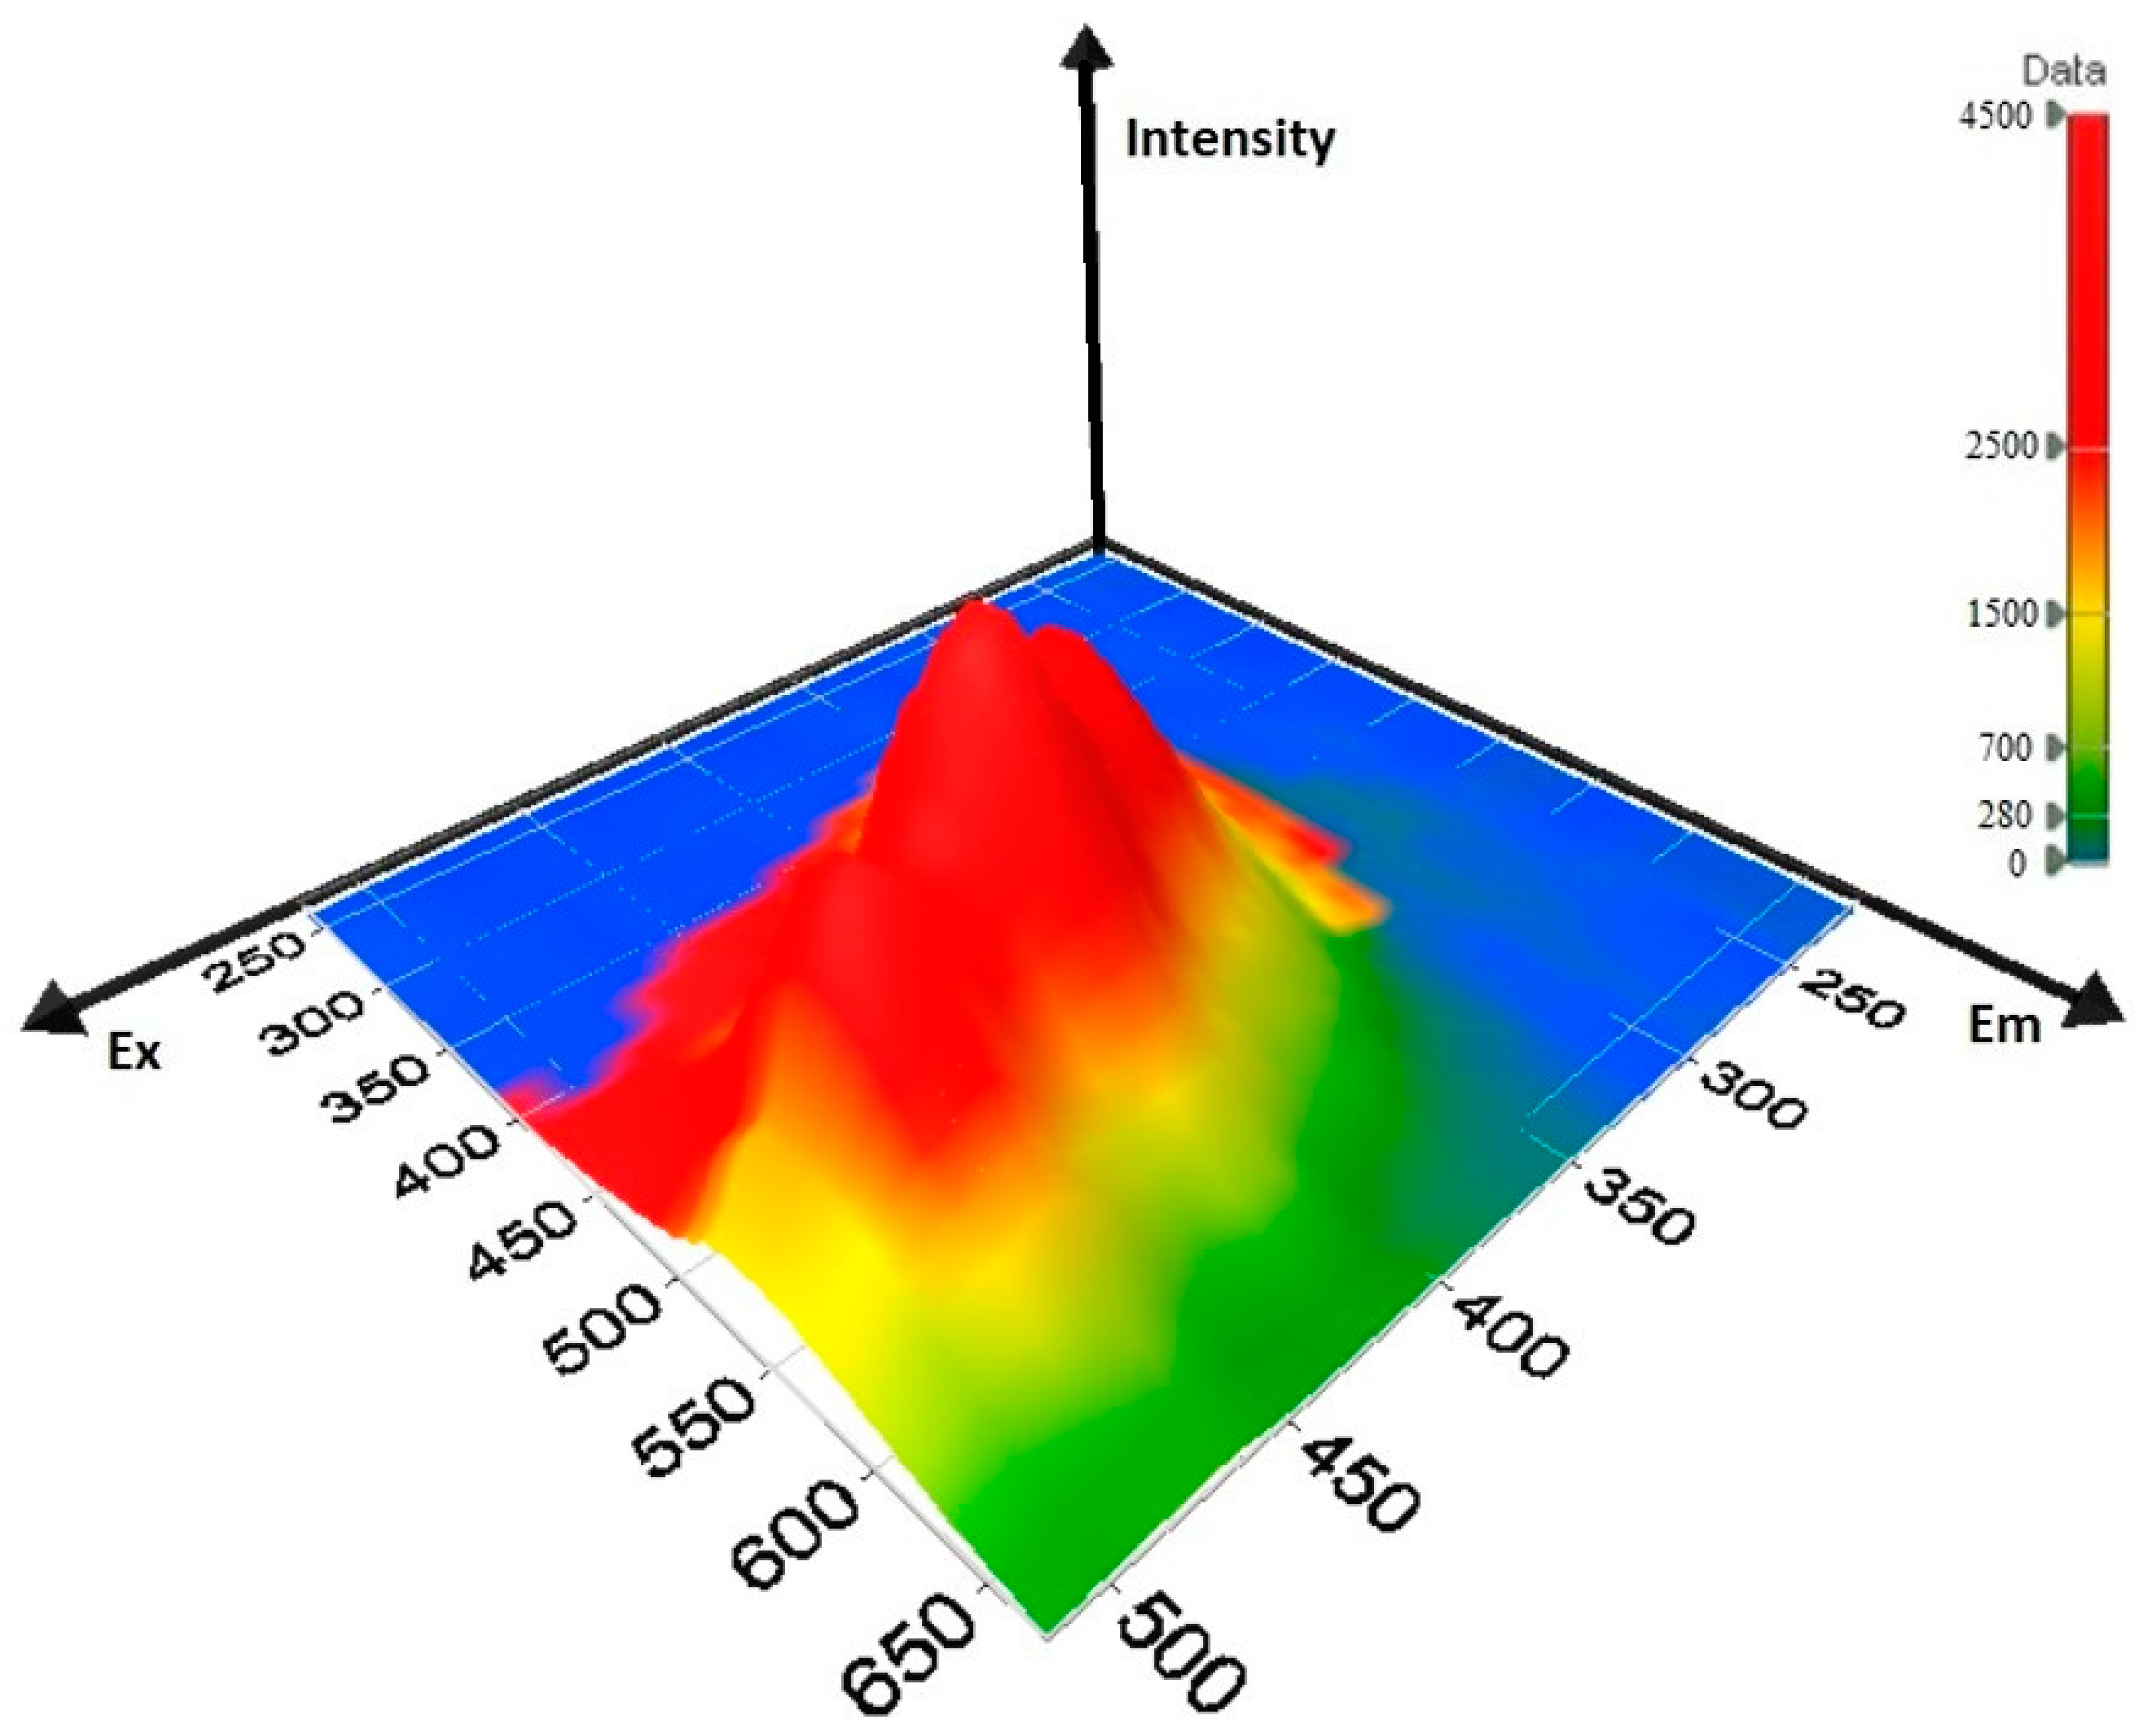
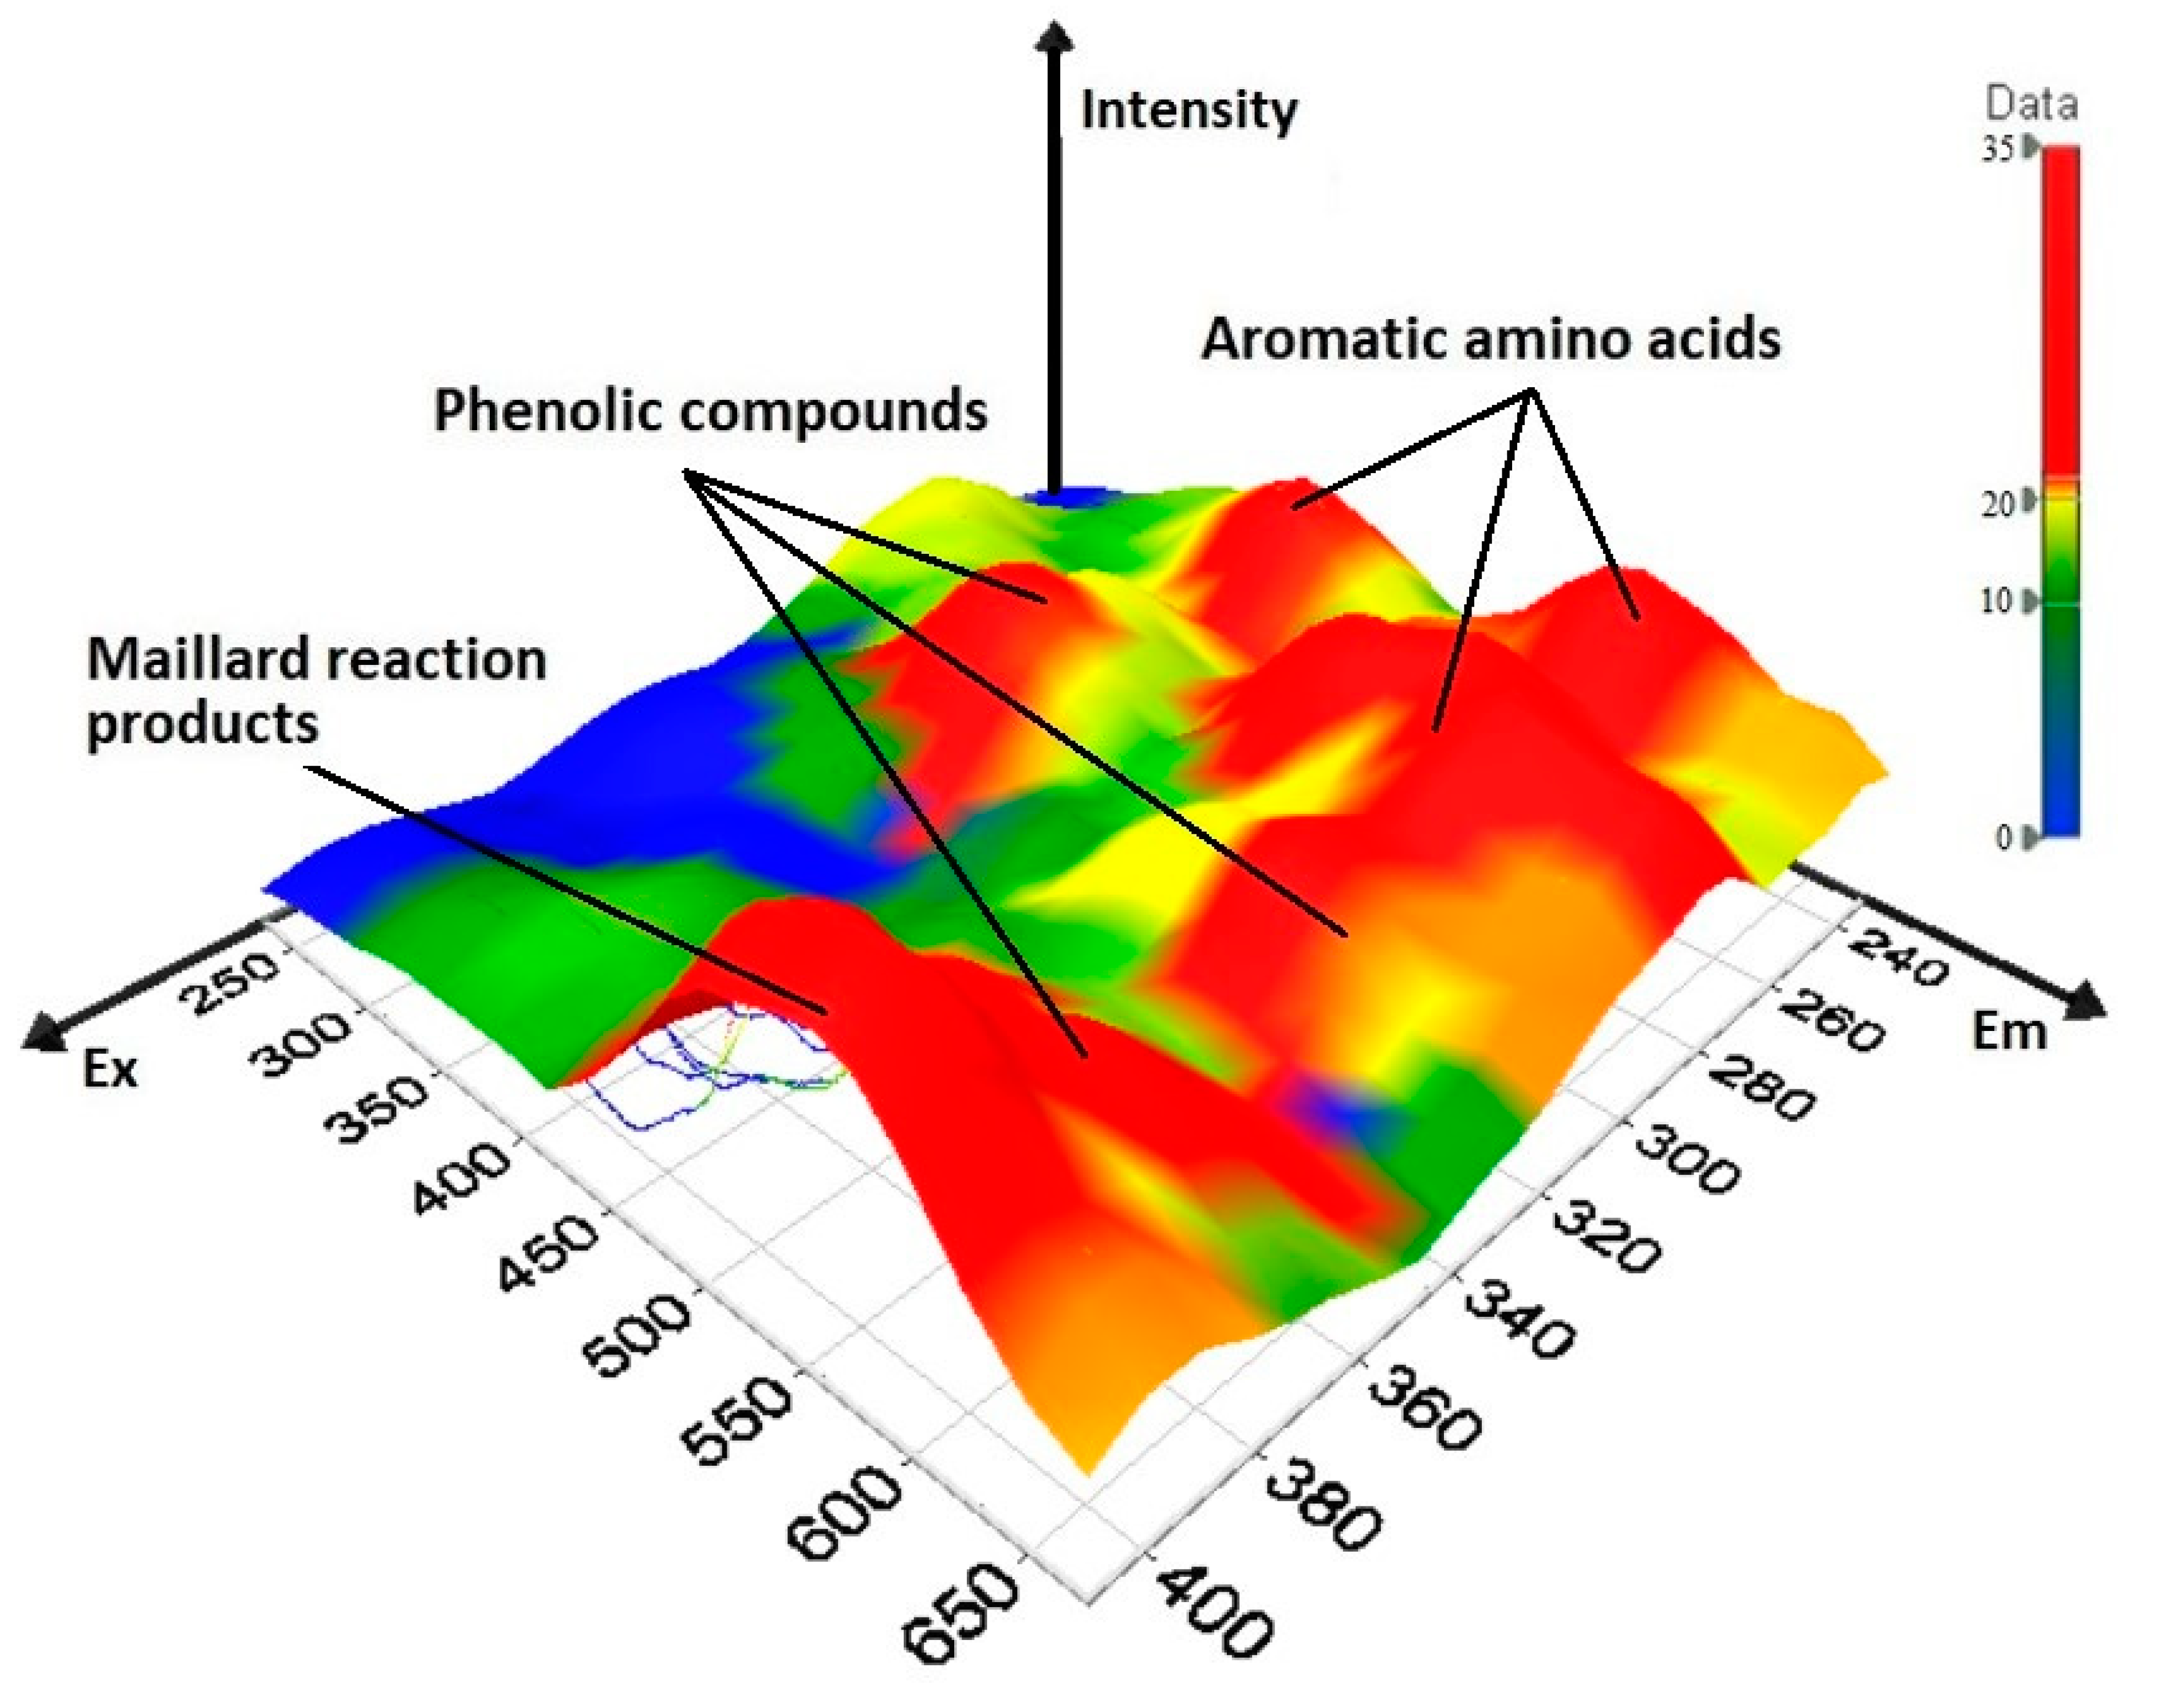
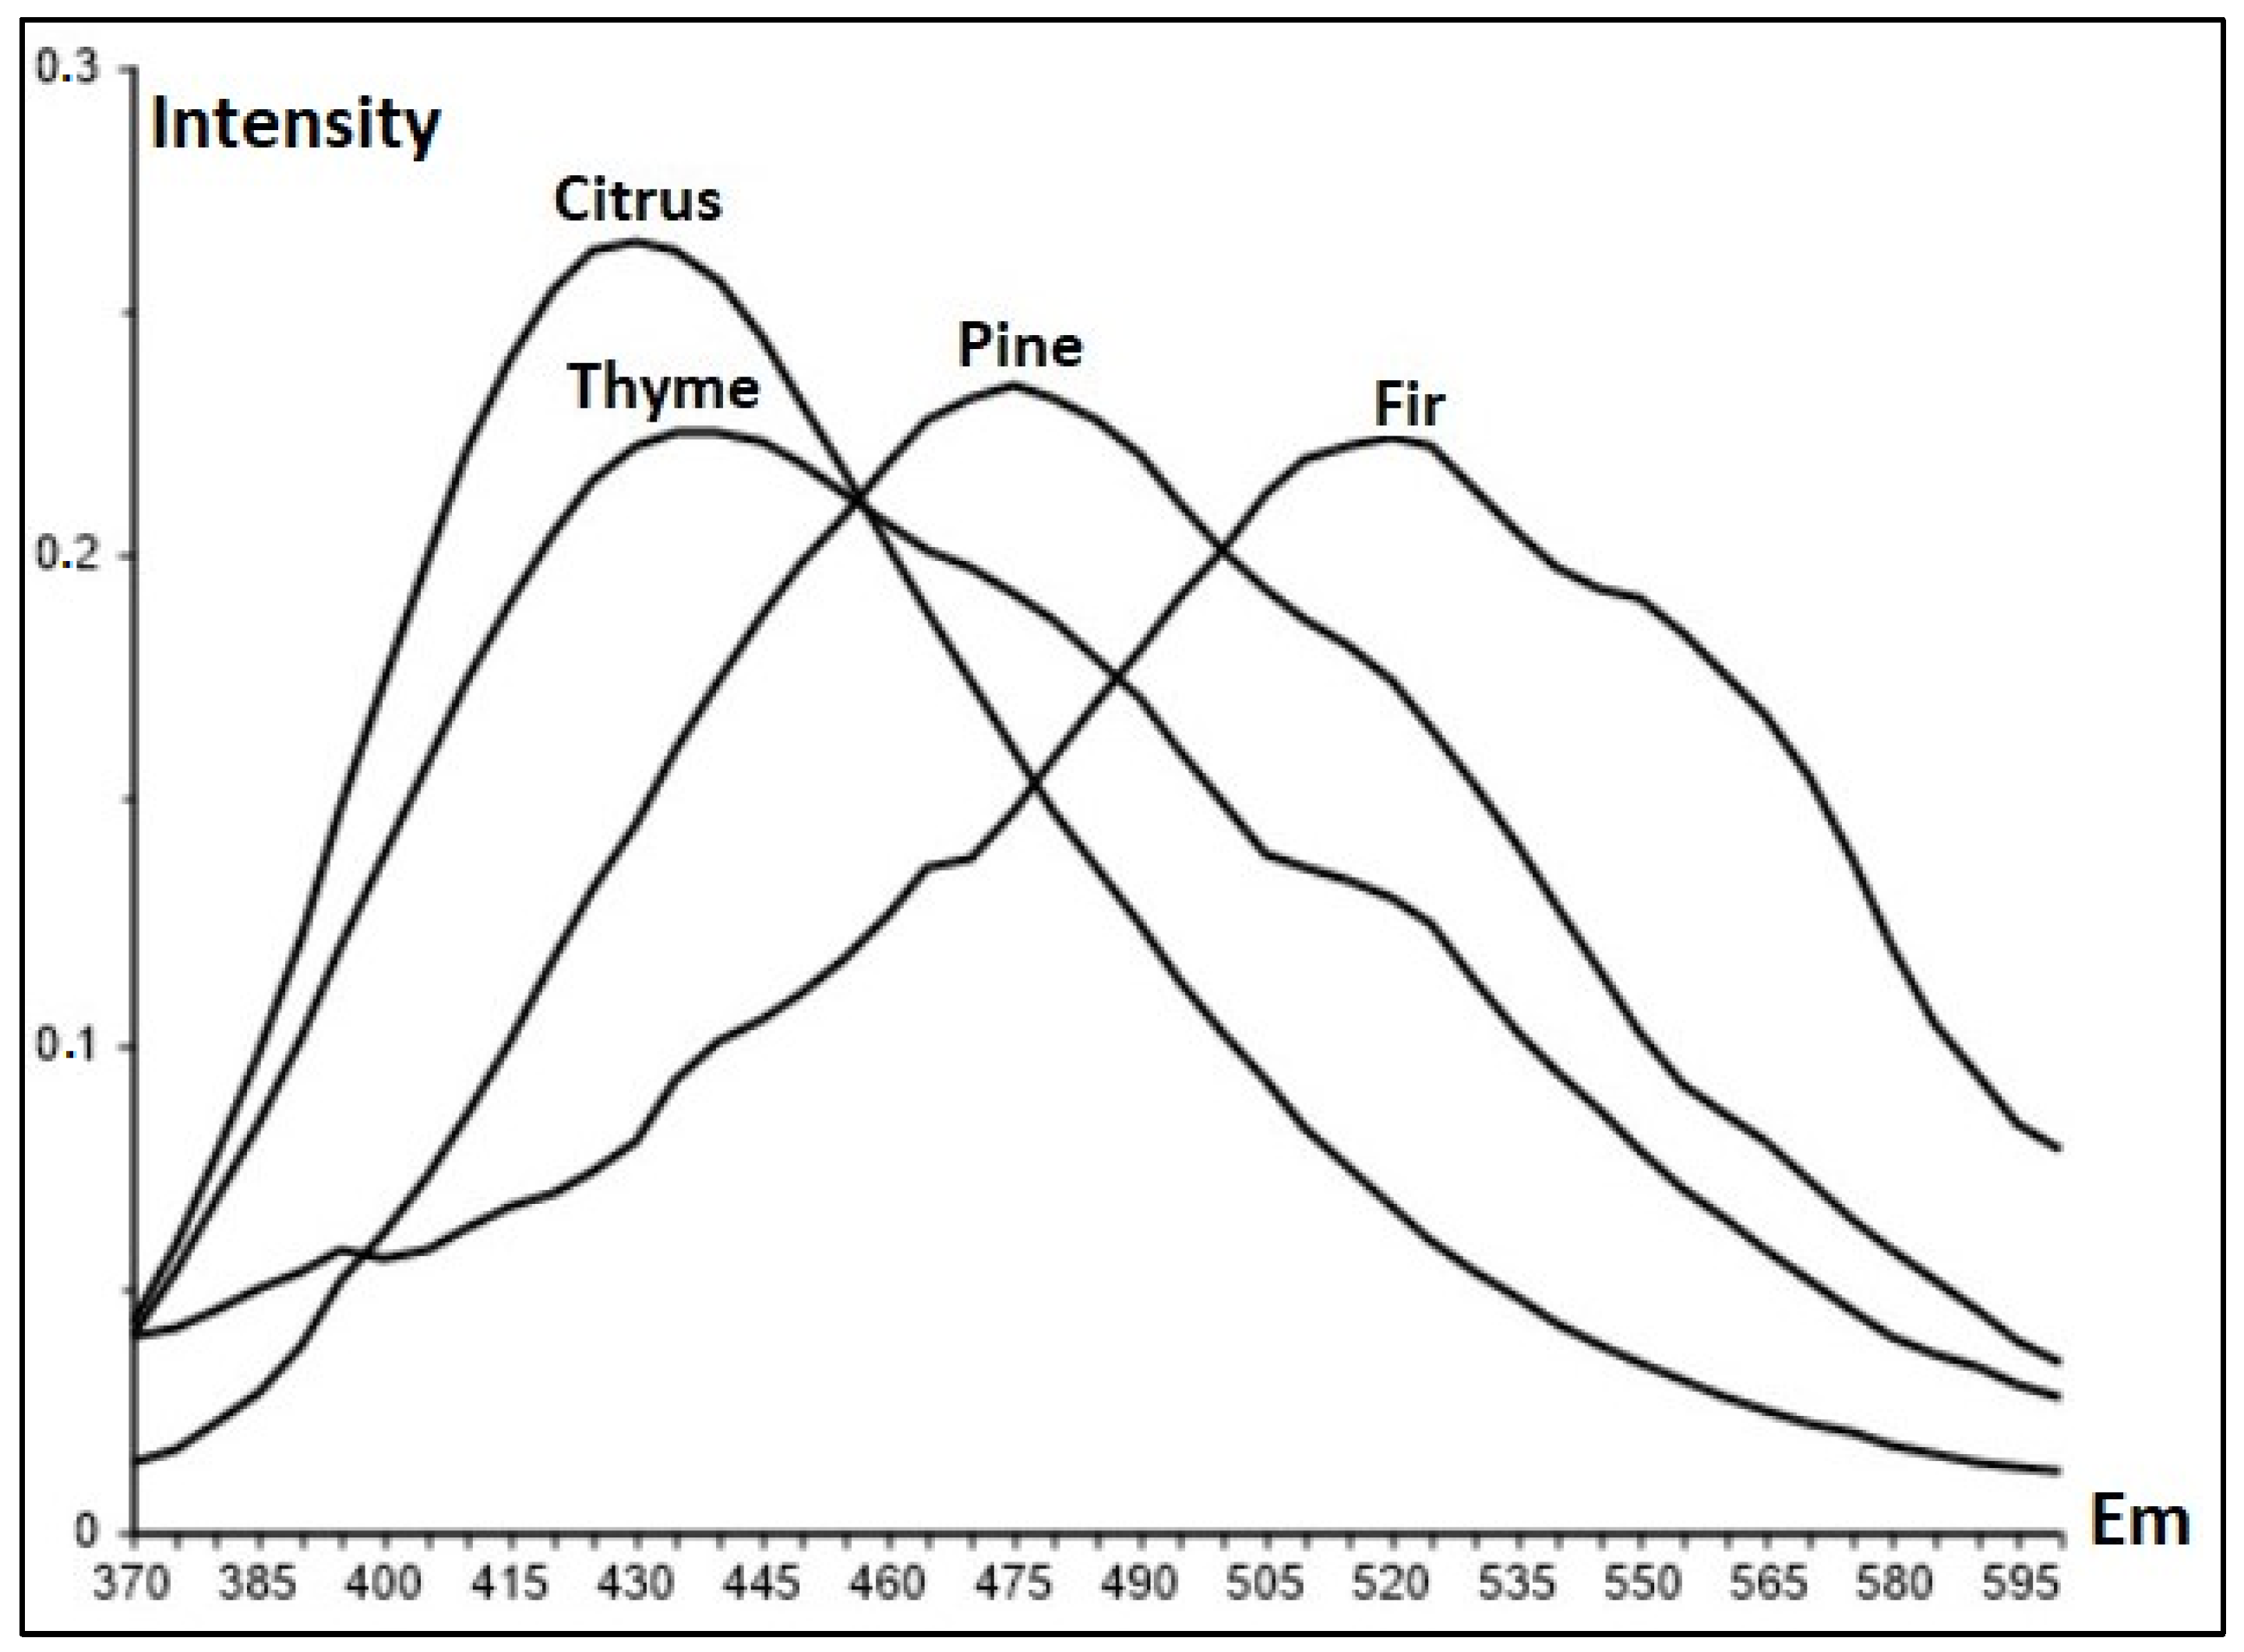
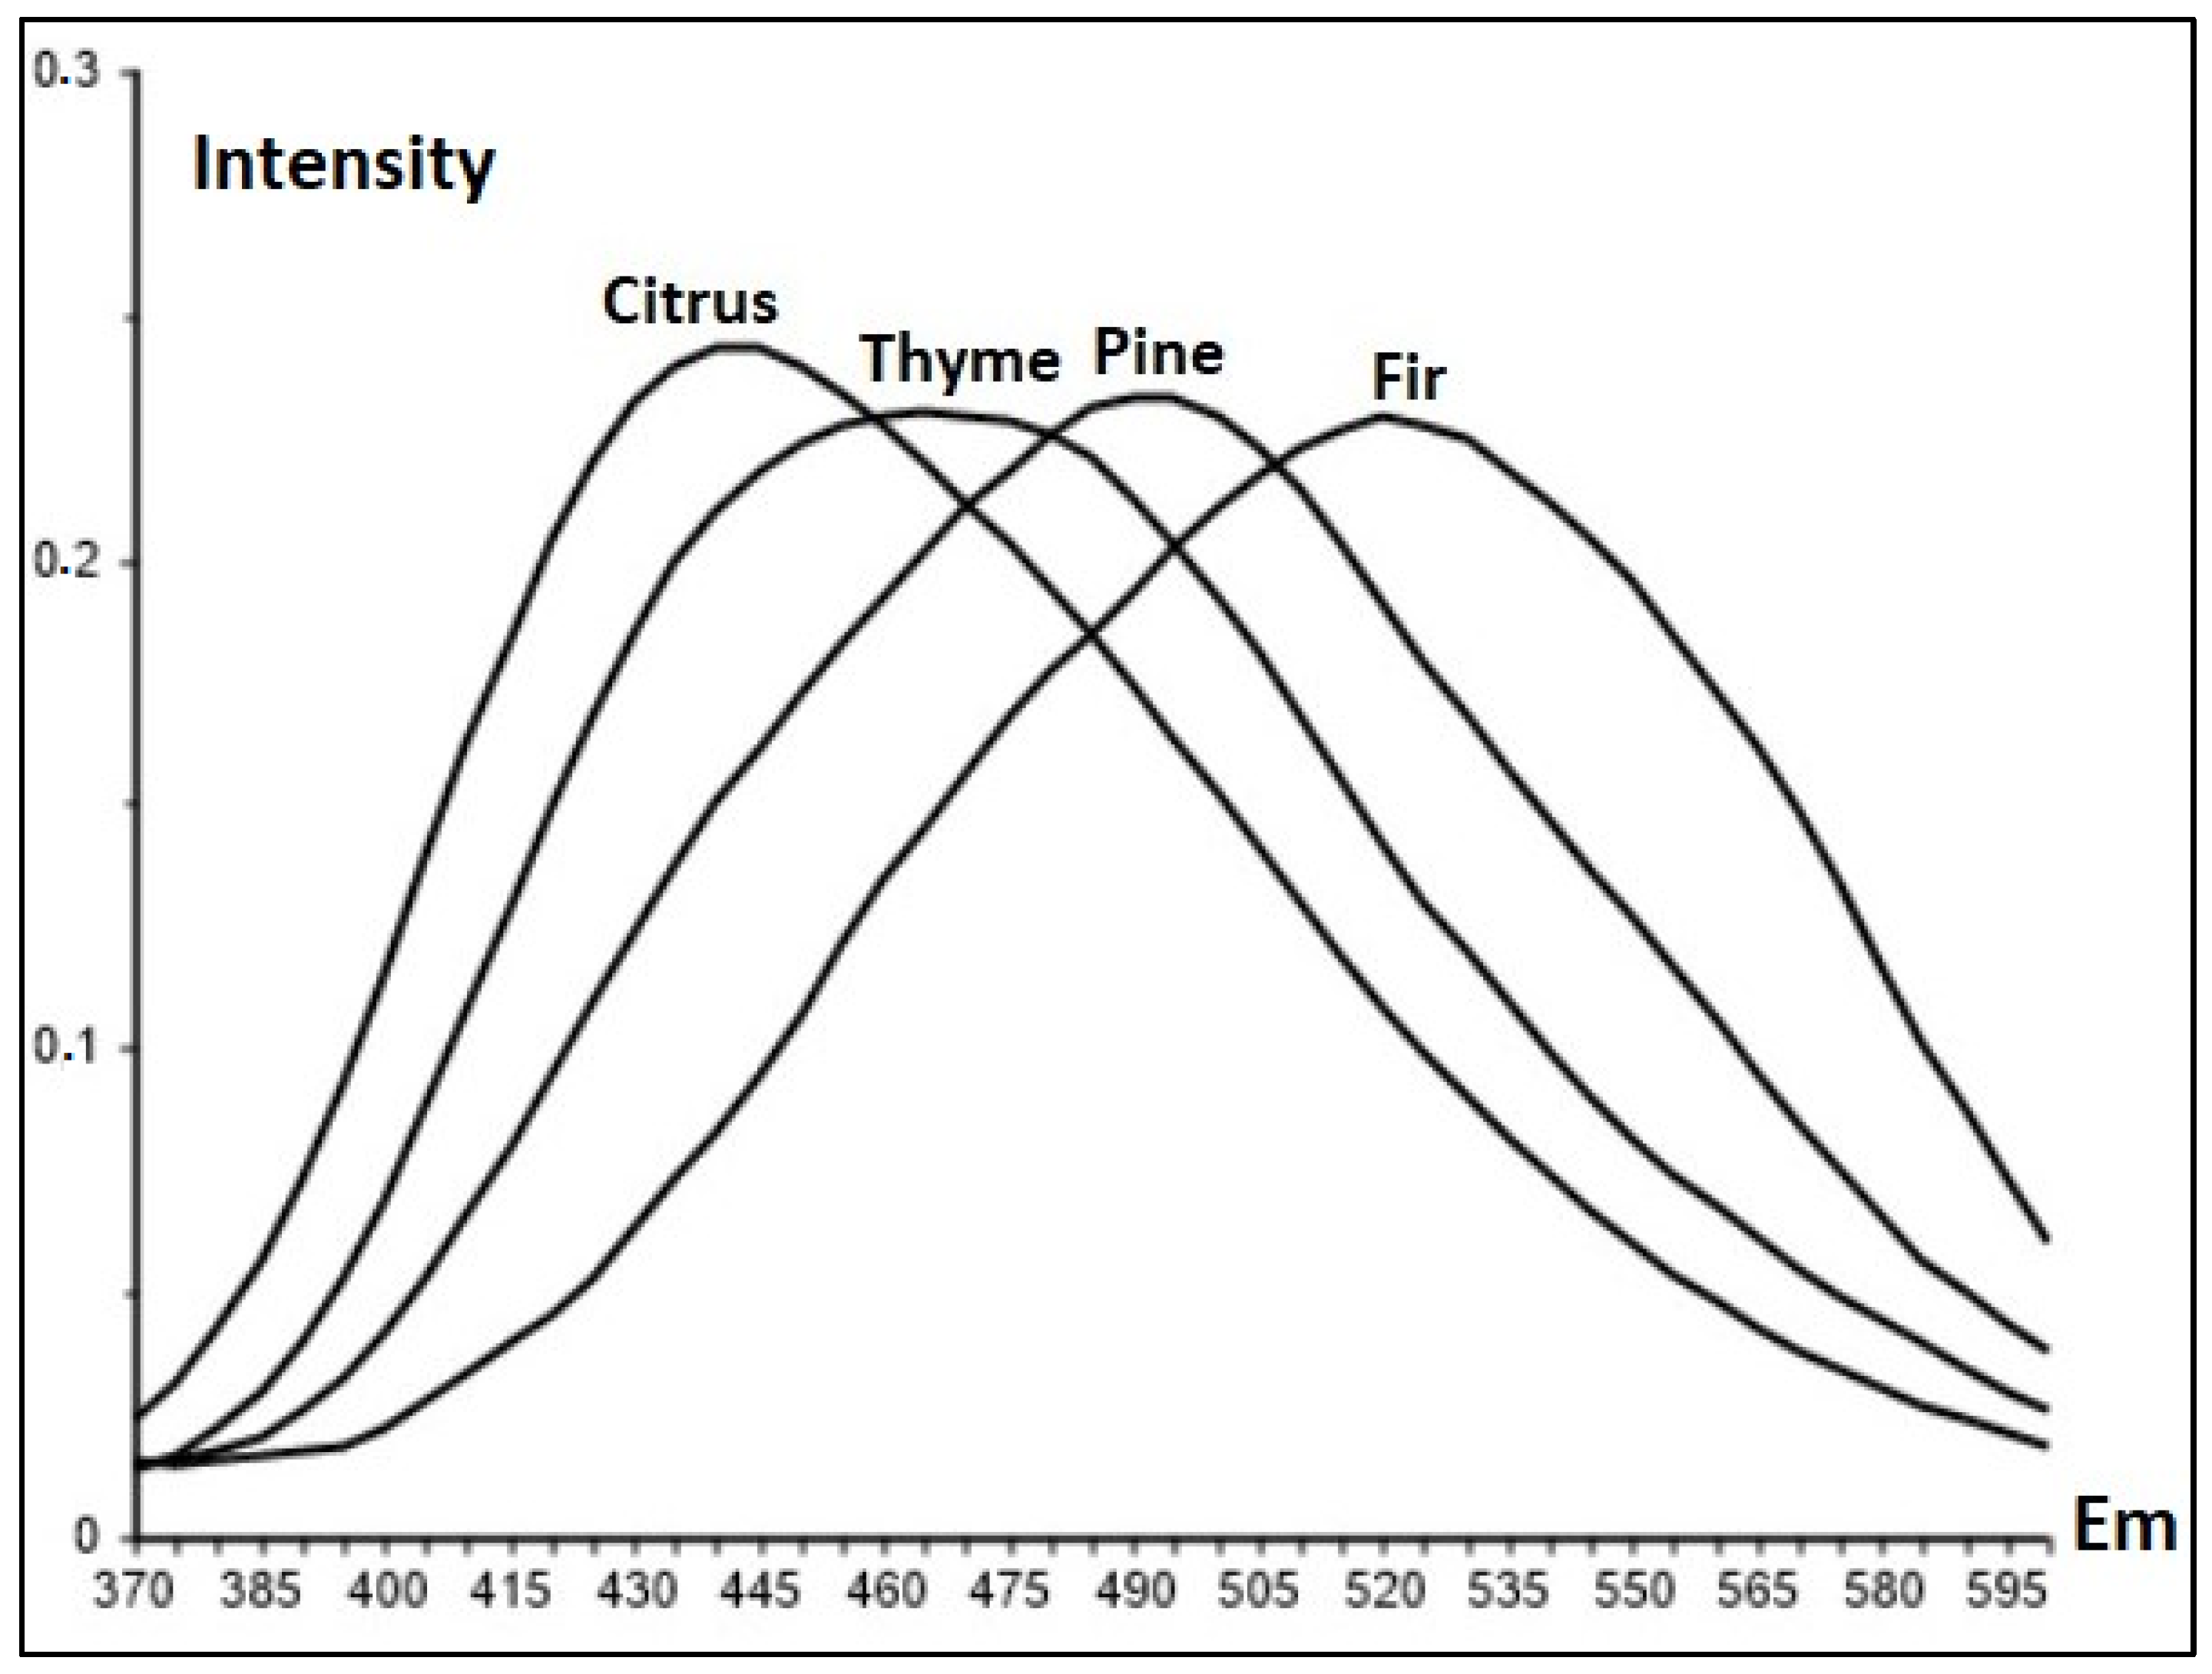
3.3. 3D-EEM Spectra of Honey Samples

Characteristic 3D-EEM spectra for each honey type are presented in Figure 1, Figure 2, Figure 3 and Figure 4. Honey spectra showed intensities at different λex values as follows (Figure 5): aromatic amino acids, including phenylalanine, tryptophan and tyrosine residues (λex = 240–280 nm) [17,23,34], phenolic compounds (λex = 280–330 nm and λex = 310–380 nm) [13,17,18,24], Maillard reaction compounds such as furosine and hydroxymethylofurfural (HMF) (λex = 380–440 nm) [13,22], and flavins (λex = 440–500 nm) [11,23,24].
Fluorescence spectra of thyme, pine, fir, and citrus honey highlight similar 3D-EEM patterns. Samples were complex due to the presence of several fluorophore compounds with overlapping regions. Therefore, raw fluorescence EEMs spectra cannot lead to the determination of phenolic compounds. Some researchers overcame this difficulty by simultaneously scanning excitation and emission wavelengths (Δλ) with synchronous fluorescence spectroscopy [35]. In this study, from 3D-EEM, only the 2D spectra that correspond to phenolic compounds were chosen.
Figure 6 and Figure 7 show the emission spectra at λex = 330 and 360 nm, respectively. These regions were attributed to phenolic compounds and apparent differences were observed among the different honey varieties. Each emission spectrum from a honey sample can be considered as a fingerprint of phenolic substances. These spectra consisted of concomitant high or low concentrations of heterogeneous phenolic compounds accordingly to the honey’s nature. Fluorescence spectra of the phenolic standard compounds provided more details. More specifically, λex between 330 to 360 nm was attributed mainly to hydroxycinnamic acids while (λex) 330 nm had a significant contribution of other phenyl carboxylic acids.
Generally, specific phenolic compounds, particularly hydroxycinnamic and phenyl carboxylic acid derivatives, have been detected in several types of blossom honey, as in the case of thyme honey from Italy [36], Greece [37], and citrus honey from China [38], Italy [39,40], Iran [41] and Greece [37]. Similar results were obtained for honeydew honey from Germany [42], pine honey from Poland [43] and Greece [37,44], and fir honey from Greece [37,44].
Several studies have suggested possible correlations between the botanical origin and certain hydroxycinnamic and other phenyl carboxylic acids. Kıvrak et al. [45] reported a notable variation in the content of phenolic compounds of 19 types of honey from Turkey, with ferulic, homogentisic, gentisic, and protocatechuic acids being the most abundant compared to other phenolics. Specifically, the highest levels of homogentisic acid were obtained from thyme, citrus, and protocatechuic acid from pine honey. In addition, pine honey had a high content of syringic acid. Furthermore, all samples contained a significant amount of gentisic, syringic, 3,4-dihydroxybenzoic, caffeic, and ferulic acids. Tsiapara et al. [44] found differences in phenolic acid fractions among Greek honey extracts. Fir and pine honey were richer in protocatechuic acid, whereas the vanillin acid content was found to be higher in thyme honey. Spilioti et al. [37] observed that protocatechuic, p-hydroxybenzoic, vanillic, caffeic, and p-coumaric acid were the major phenolic acids in 12 honey variants (thyme, pine, fir, citrus) from Greece. Thyme and citrus honey had a lower content of protocatechuic and caffeic acid than pine and fir, and p-hydroxybenzoic acid was the dominant compound in thyme honey.
From the above, it can be inferred that the qualitative and quantitative profiles of phenolics, especially phenolic acids, in unifloral honeys, undoubtedly provide key information about their botanical origins.

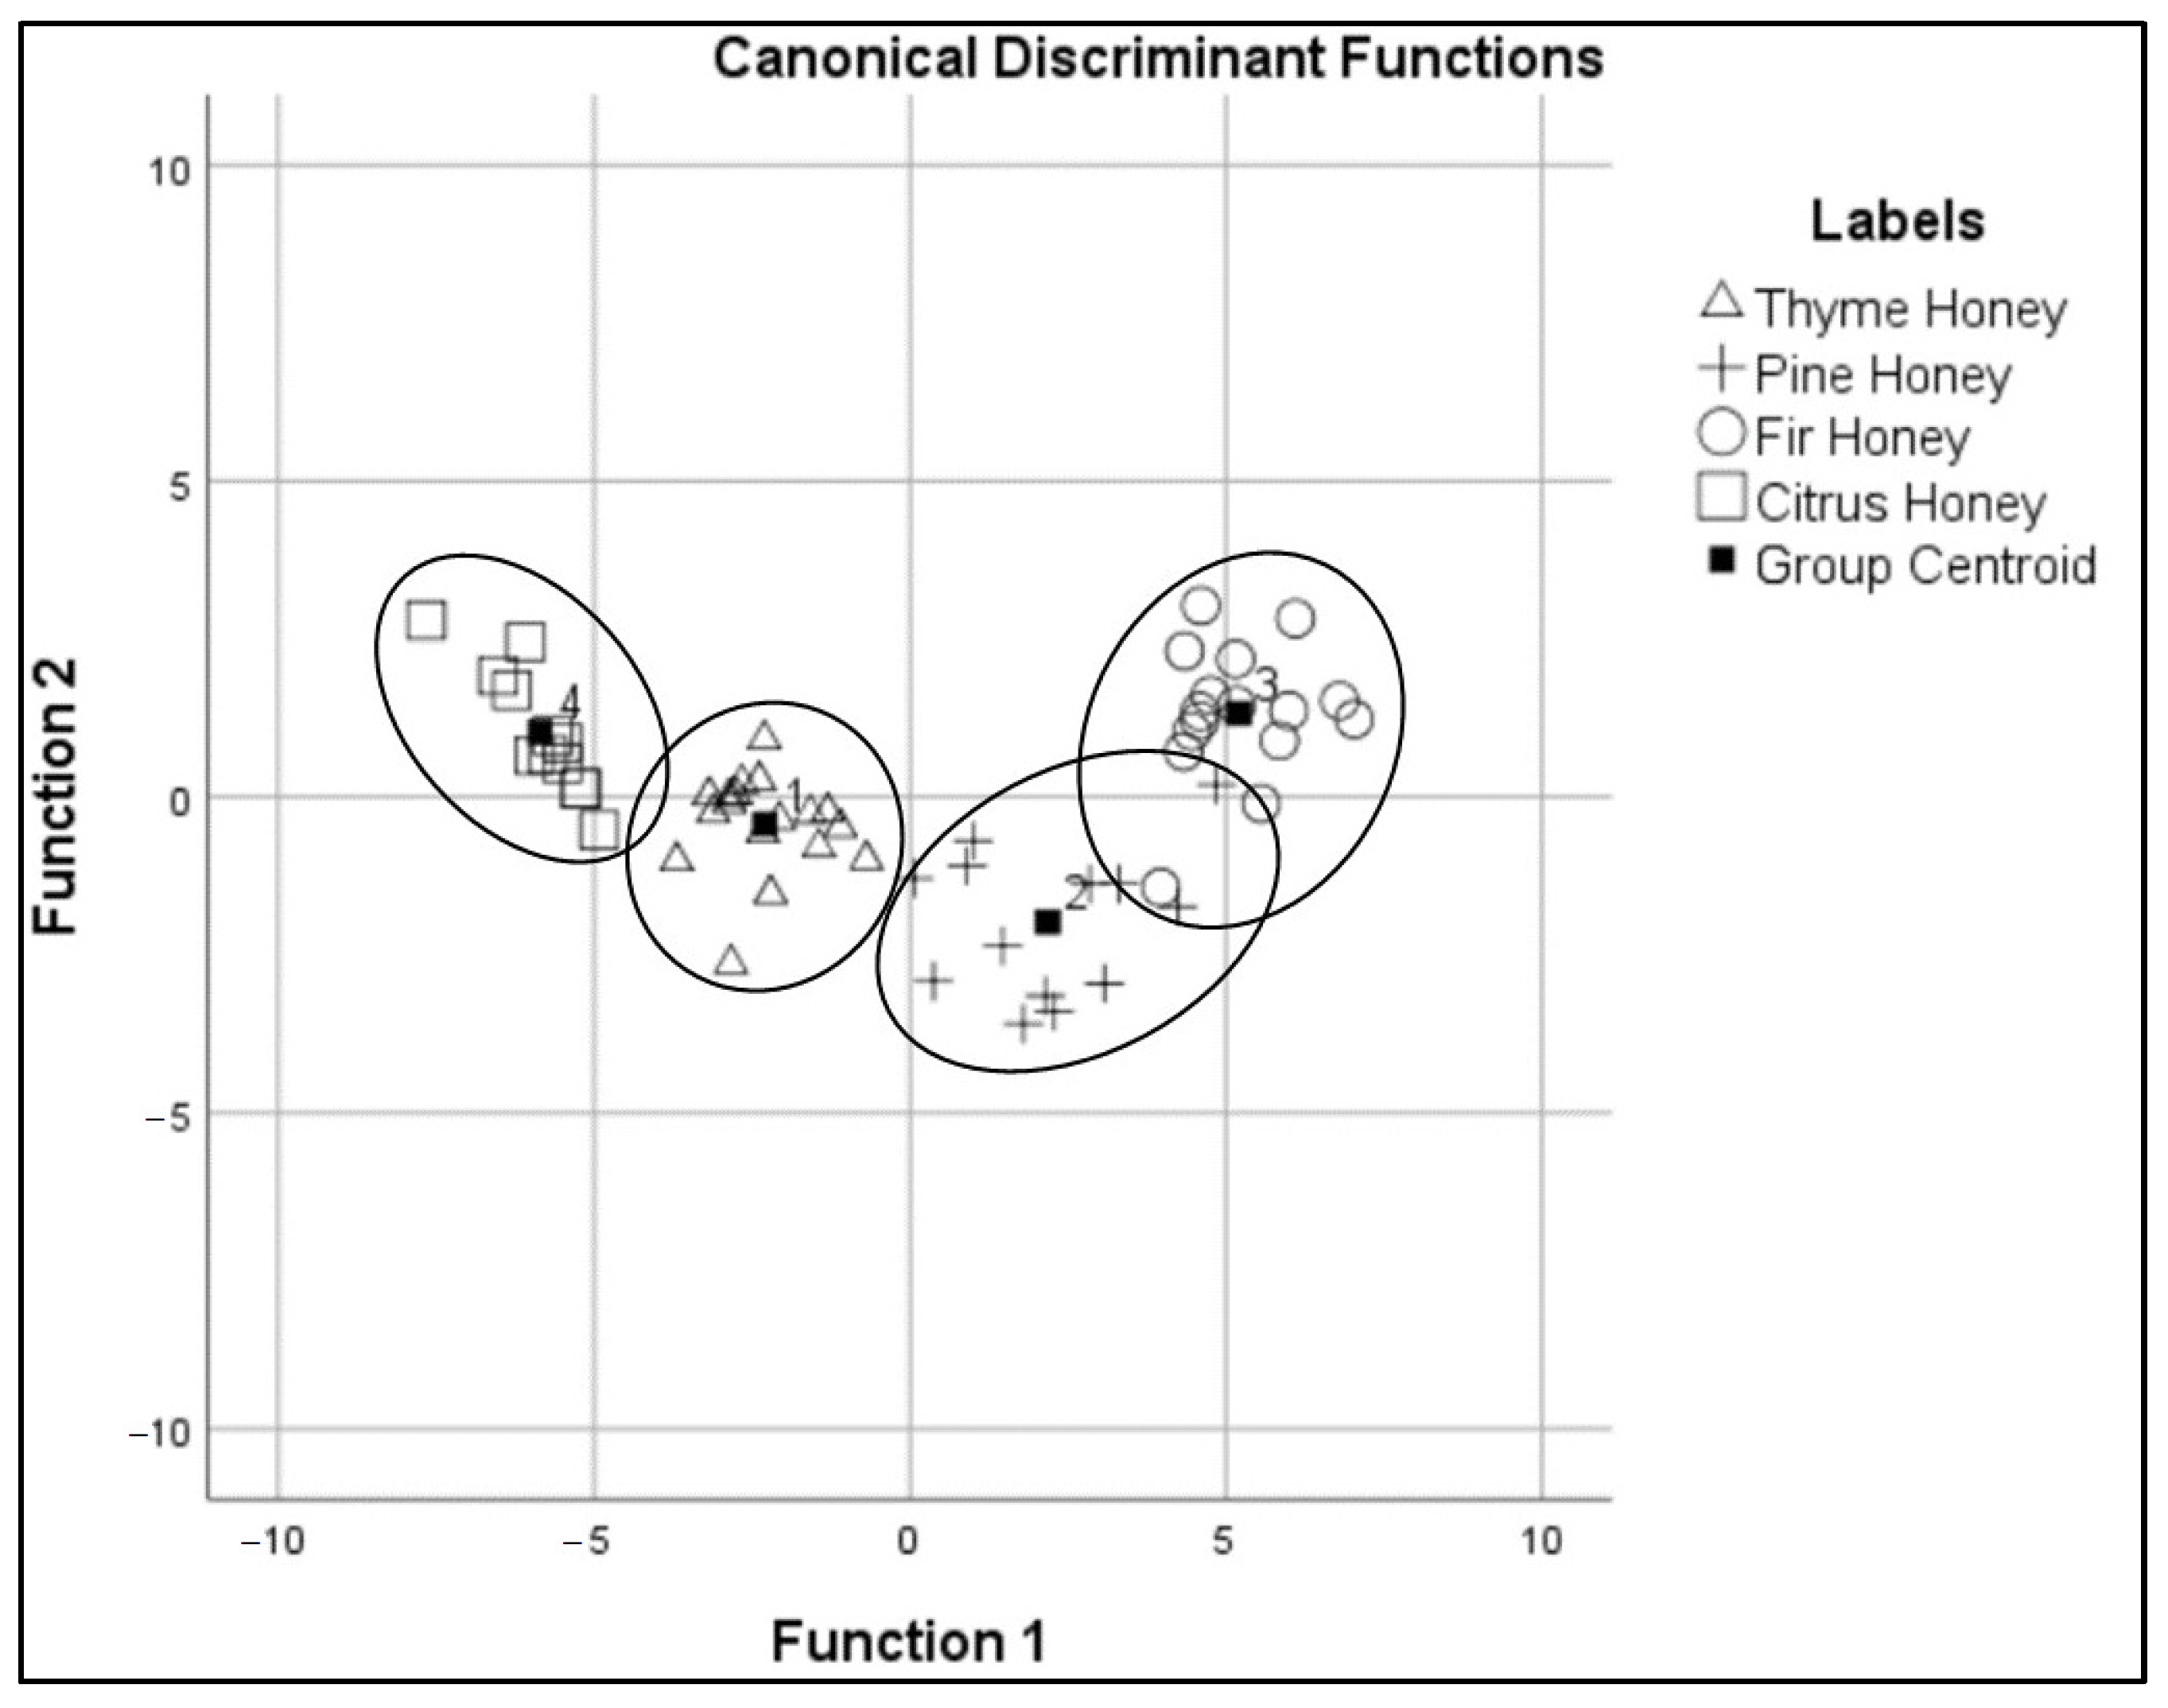
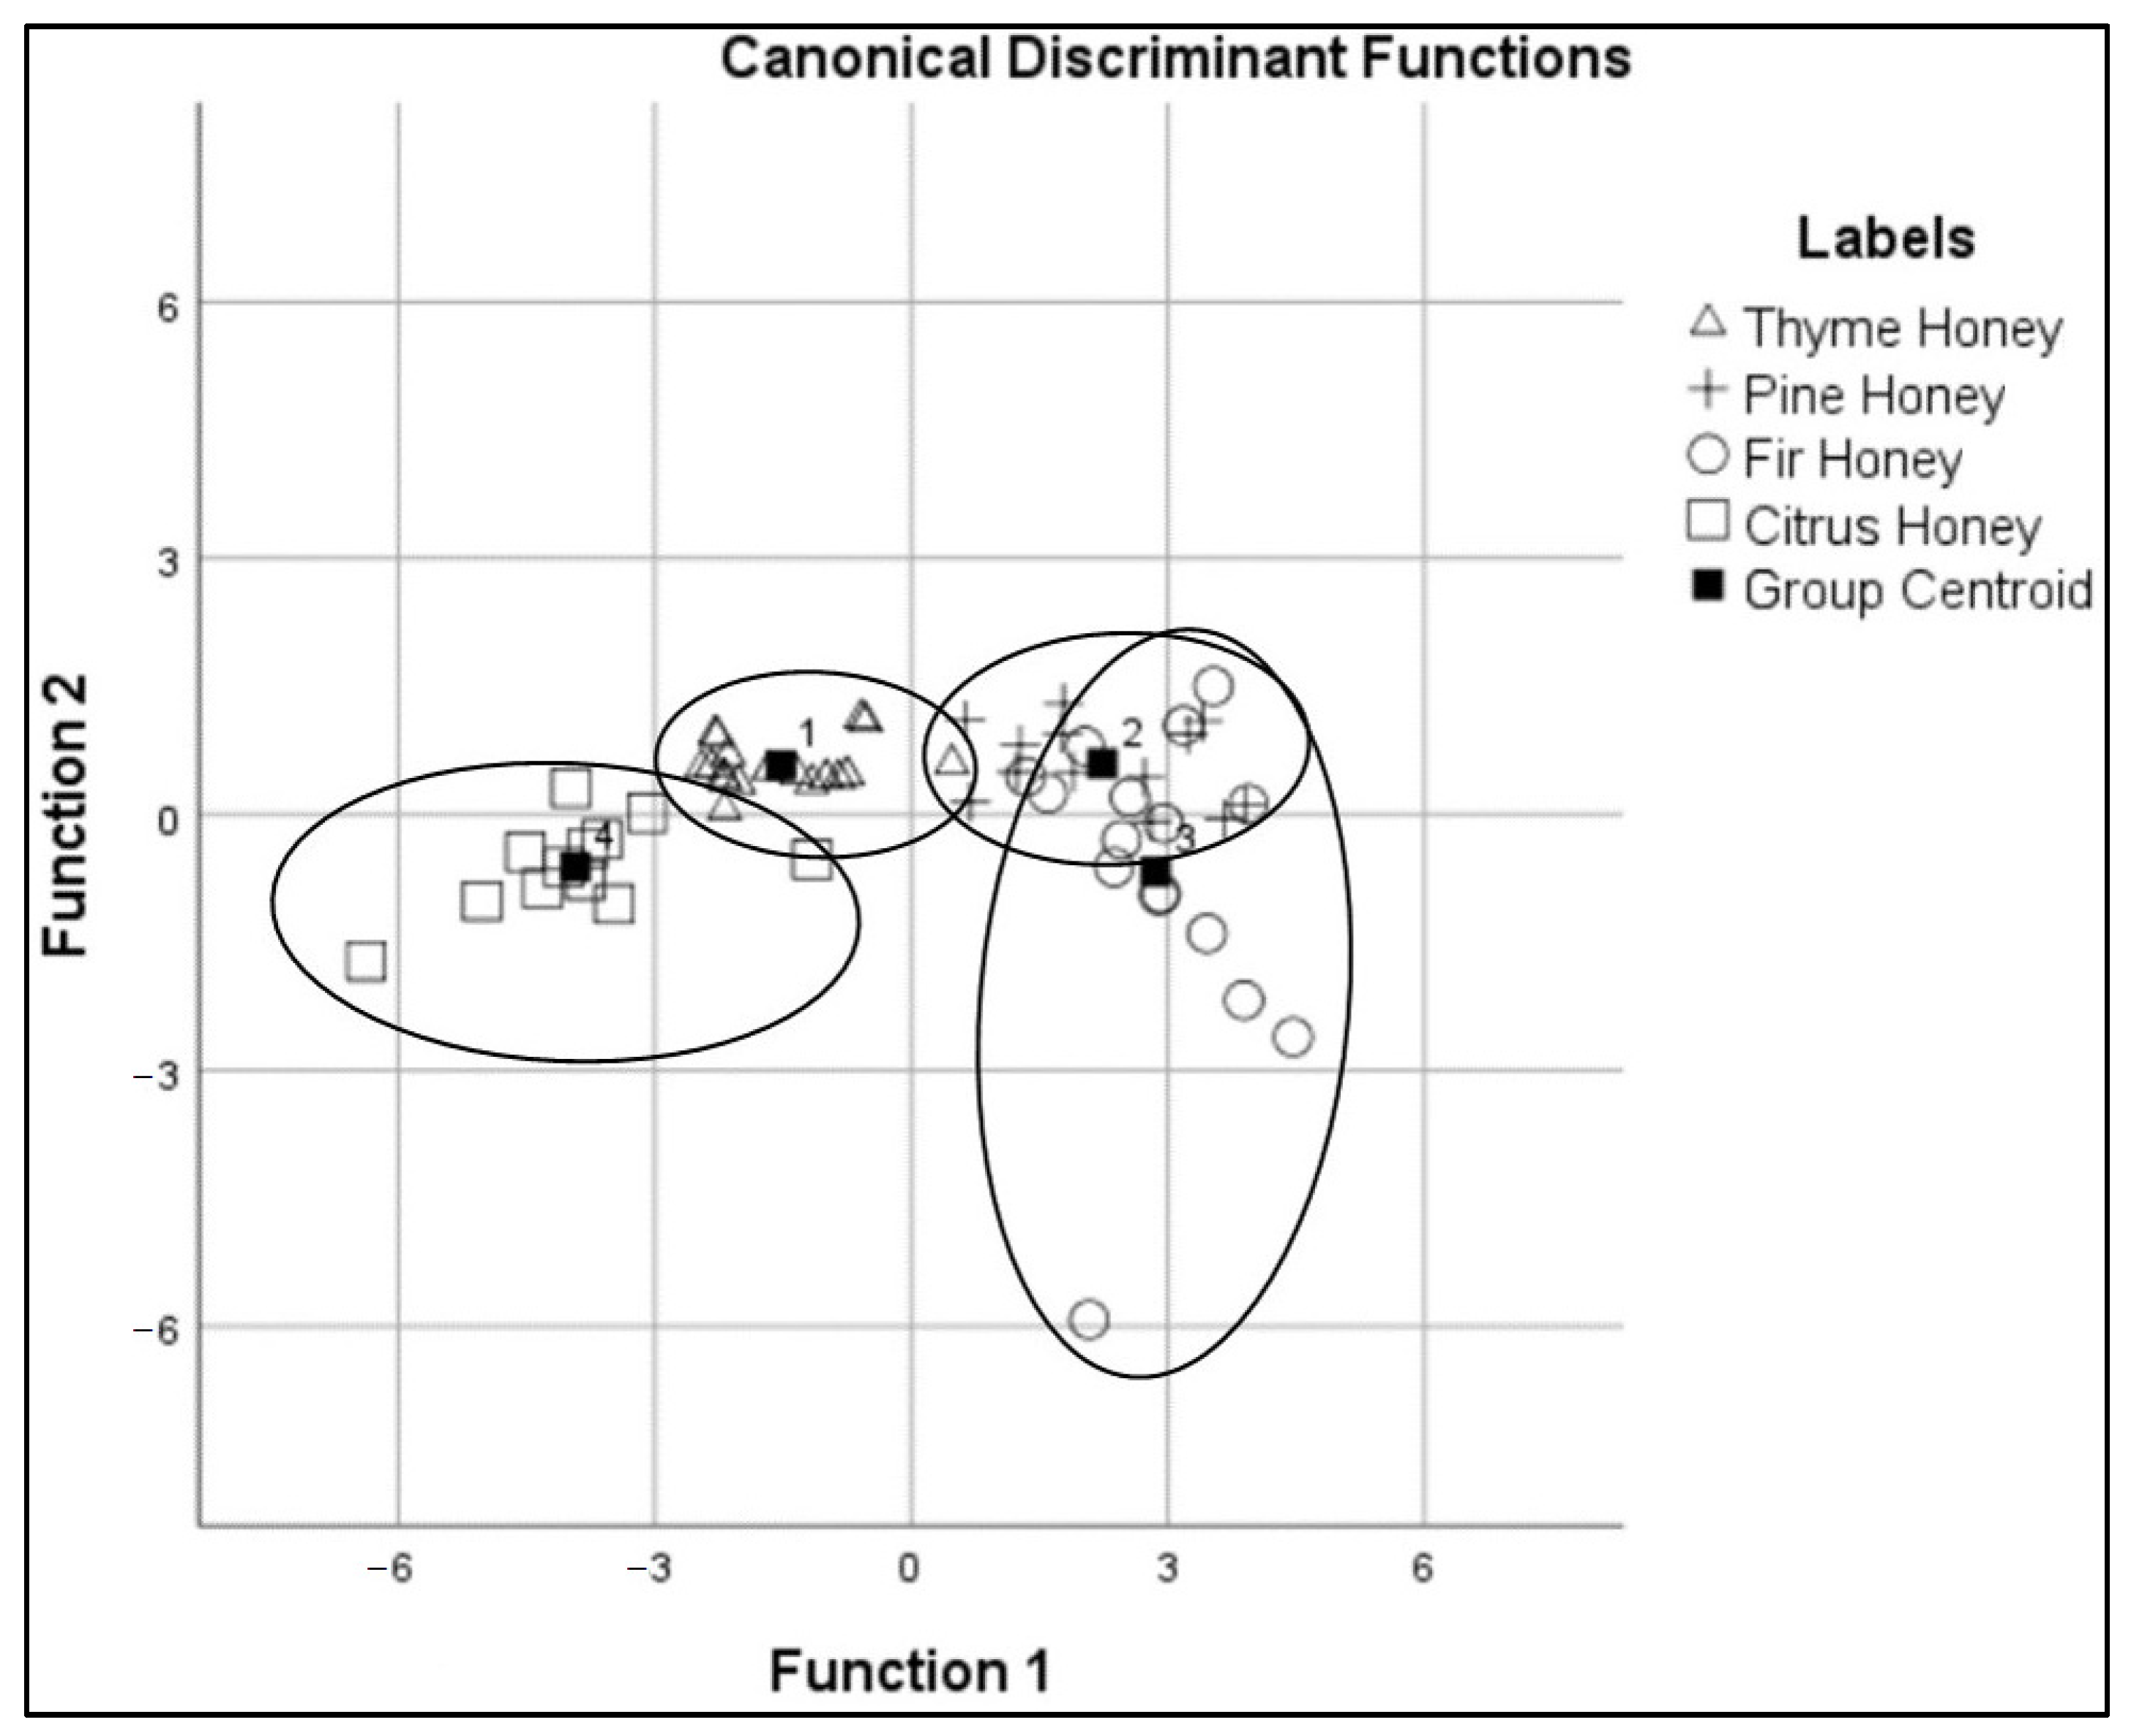
3.4. Stepwise-LDA of Fluorescence Spectra

The chemometric analysis of fluorescence spectra (λex = 330 and 360 nm) for the classification of thyme, pine, fir, and citrus honey was performed using the stepwise-LDA algorithm. After random separation of the samples, the ratio of the largest group (thyme honey) divided by the smallest group (citrus honey) was calculated at 1.5, confirming the homogeneity of the covariance matrices. Subsequently, the calibration set (n = 59) was subjected to a stepwise algorithm under the Mahalanobis distance method. Following the development of LDA models, their performance was evaluated using the cross-validation method. Furthermore, a test set (n = 28) was used for external validation to examine the robustness of the models.
The chemometric model, based on λex = 330 nm, demonstrated that nine stepwise steps (p < 0.05) were formed. The score values for both calibration and cross-validation were 94.9%. The group centroid values are also plotted in Figure 8.
The results of the Wilks’s lambda (Λ) of the canonical functions (first: 0.120, p < 0.05; second: 0.240, p < 0.05; third: 0.653, p < 0.05) indicated a significant difference between the mean vectors of the four honey botanical origins. Additionally, the eigenvalues and canonical correlation of the discriminant functions (first: 18.213, 97.4%; second: 1.724, 79.6%; third: 0.531, 58.9%) confirmed the calibration model. After, external validation of “unknown” samples evaluated the ability of the discrimination. A total of 82.1% were correctly classified while 17.9% were misclassified. Hence, a low variation between the cross-validation and external validation indicates good performance of the chemometric model to predict new data (Table 3).
When applying the stepwise algorithm on λex = 360 nm spectra three steps were formed (p < 0.05). The separation of the four honey botanical origins are shown in Figure 9.
Group centroids of pine and fir honey failed to display the same clear separation as was evident between the thyme and citrus honey. Specifically, the rate of samples that were classified correctly was 81.4%, while cross-validation was 79.7%. The statistical test of Λ was 0.081, 0.707m and 0.992 (p < 0.05) for the first, second, and third discriminant functions, respectively. Furthermore, the eigenvalues of these functions were estimated at 7.685 with canonical a correlation at 94.1% for the first, 0.403 with 53.6% for the second, and 0.008 with 0.9% for the third. Finally, the correct classification of external validation (82.1%) further confirmed the reliability of the model. More detailed results are presented in Table 4.
Classification results and case-wise statistics from both chemometric models were similar, though the first chemometric model based at λex = 330 provided a slightly higher discriminant score (94.9%) compared to the second model (81.4%) based at λex = 360. Additionally, group centroids for both chemometric models can be explained. Specifically, as observed from the discriminant scatter plot, pine and fir honey are located near each other and are somewhat distinct from thyme and even more so from citrus honey. These findings are confirmed by the literature, as pine and fir honey is honeydew honey and, therefore, share several similarities [46]. Standardized canonical discriminant function coefficients responded to phenolic compounds and specifically to hydroxycinnamic and other phenyl carboxylic acids. Despite the presence of several fluorophore phenolics in this spectra region, the development of robust models remained unaffected by overlaps. No research on Greek honey using fluorescence spectroscopy has been previously conducted. Although the stepwise-LDA has not been applied for the classification of honey botanical origins, fluorescence spectroscopy studies from other researchers confirm the successful distinguishing of honey samples using the spectral region of phenolic compounds. Ruoff et al. [14] differentiated honey with an average score from 70% to 100% using PCA-LDA, while noting that spectra region λex 290–440 nm was the most useful region. Furthermore, in another study, Karoui et al. (2007) suggested a PCA-FDA method to discriminate seven botanical origins. Recent studies also utilized the spectral region of phenolic compounds coupled with SIMCA [16] and HCA [17] for the botanical authentication of honey. The results of the present study confirmed that the fluorophore phenolic profile is related to the botanical origin of monofloral honeys, so it can be used as a robust tool for honey authentication. Consequently, the novel methodology developed in this study is robust and can be successfully applied for the authentication of honey botanical sources.

4. Conclusions

In this study, two chemometric models based on fluorescence spectra (λex = 330; 360 nm) and the LDA statistical method were developed to distinguish the botanical origins of four well-known and commercial honey varieties (thyme, pine, fir, and citrus). Chemometric models are considered successful. The first (λex = 330) was found to be more effective, providing a reliable score of 94.9% against the 81.4% of the second model (360 nm). Cross and external validations reinforced these results, verifying the high robustness of the chemometric models. Furthermore, the proposed chemometric models are non-time-consuming, economical, and do not alter the environmental fingerprint. The novel methodology based on right-angle fluorescence spectroscopy and the stepwise-LDA algorithm can be used for routine analyses in the industry for the differentiation of honey botanical origins, thereby enhancing the competitiveness of producers and suppliers in national and international markets.

Supplementary Materials

The following are available online at https://www.mdpi.com/article/10.3390/app11094047/s1, Table S1: The structure of the standard phenolic compounds. Table S2: Results of melissopalynological analysis. Figure S1: Emission spectra of caffeic acid; clorogenic acid; p-coumaric acid; ferulic acid; sinapic acid and ellagic acid at λex 330. Emission spectra of homogentisic acid; gallic acid; protocatechuic acidl syringic acid; vanillic acid; methyl syringate; gentisic acid; keampferol and catechin at λex 300.

Author Contributions

Conceptualization, M.X.; methodology, M.X. and C.S.P.; software, M.X.; validation, E.A.; investigation, M.X., P.-K.R. and E.A.; resources, P.-K.R.; data curation, M.X.; writing—original draft preparation, M.X.; writing—review and editing, P.-K.R., C.S.P., E.A. and P.A.T.; supervision, C.S.P. and P.A.T.; project administration, P.A.T. All authors have read and agreed to the published version of the manuscript.

Funding

This research received no external funding.

Institutional Review Board Statement

Not applicable.

Informed Consent Statement

Not applicable.

Data Availability Statement

Not applicable.

Conflicts of Interest

The authors declare no conflict of interest.

References

  1. Greek Ministry of Rural Development and Food. 2020. Available online: https://ec.europa.eu/info/food-farming-fisheries/animals-and-animal-products/animal-products/honey_en (accessed on 2 April 2021).
  2. EU. Council Directive 2001/110/EC of 20 December 2001 Relating to Honey. Off. J. Eur. Communities 2002, 10, 47–52. Available online: https://eur-lex.europa.eu/LexUriServ/LexUriServ.do?uri=OJ:L:2002:010:0047:0052:EN:PDF (accessed on 2 April 2021).
  3. Government Gazette B-239/23-2-2005 Annex II article 67 of Greek Food Code. 2005. Available online: http://www.minagric.gr/images/stories/docs/agrotis/MeliMelissokomia/KYA_Taytopoiisi.pdf (accessed on 2 April 2021).
  4. Xagoraris, M.; Lazarou, E.; Kaparakou, E.H.; Alissandrakis, E.; Tarantilis, P.A.; Pappas, C.S. Botanical origin discrimination of Greek honeys: Physicochemical parameters versus Raman spectroscopy. J. Sci. Food Agric. 2021. [Google Scholar] [CrossRef]
  5. Gok, S.; Severcan, M.; Goormaghtigh, E.; Kandemir, I.; Severcan, F. Differentiation of Anatolian honey samples from different botanical origins by ATR-FTIR spectroscopy using multivariate analysis. Food Chem. 2015, 170, 234–240. [Google Scholar] [CrossRef] [PubMed]
  6. Xagoraris, M.; Revelou, P.-K.; Dedegkika, S.; Kanakis, C.D.; Papadopoulos, G.K.; Pappas, C.S.; Tarantilis, P.A. SPME-GC-MS and FTIR-ATR spectroscopic study as a tool for unifloral common Greek honeys’ botanical origin identification. Appl. Sci. 2021, 11, 3159. [Google Scholar] [CrossRef]
  7. Chen, L.; Wang, J.; Ye, Z.; Zhao, J.; Xue, X.; Heyden, Y.V.; Sun, Q. Classification of Chinese honeys according to their floral origin by near infrared spectroscopy. Food Chem. 2012, 135, 338–342. [Google Scholar] [CrossRef] [PubMed]
  8. Corvucci, F.; Nobili, L.; Melucci, D.; Grillenzoni, F.-V. The discrimination of honey origin using melissopalynology and Raman spectroscopy techniques coupled with multivariate analysis. Food Chem. 2015, 169, 297–304. [Google Scholar] [CrossRef] [PubMed]
  9. Zheng, X.; Zhao, Y.; Wu, H.; Dong, J.; Feng, J. Origin identification and quantitative analysis of honeys by nuclear magnetic resonance and chemometric techniques. Food Anal. Methods 2015, 9, 1470–1479. [Google Scholar] [CrossRef]
  10. Strasburg, G.M.; Ludescher, R.D. Theory and applications of fluorescence spectroscopy in food research. Trends Food Sci. Technol. 1995, 6, 69–75. [Google Scholar] [CrossRef]
  11. Ghosh, N.; Verma, Y.; Majumder, S.K.; Gupta, P.K. A fluorescence spectroscopic study of honey and cane sugar syrup. Food Sci. Technol. Res. 2005, 11, 59–62. [Google Scholar] [CrossRef] [Green Version]
  12. Nikolova, K.; Eftimov, T.; Aladjadjiyan, A. Fluorescence spectroscopy as method for quality control of honey. Adv. Res. 2014, 2, 95–108. [Google Scholar] [CrossRef]
  13. Dramićanin, T.; Lenhardt Acković, L.; Zeković, I.; Dramićanin, M.D. Detection of adulterated honey by fluorescence excitation-emission matrices. J. Spectrosc. (Hindawi) 2018, 1–6. [Google Scholar] [CrossRef] [Green Version]
  14. Ruoff, K.; Karoui, R.; Dufour, E.; Luginbühl, W.; Bosset, J.-O.; Bogdanov, S.; Amadò, R. Authentication of the botanical origin of honey by front-face fluorescence spectroscopy. A preliminary study. J. Agric. Food Chem. 2005, 53, 1343–1347. [Google Scholar] [CrossRef]
  15. Karoui, R.; Dufour, E.; Bosset, J.-O.; De Baerdemaeker, J. The use of front face fluorescence spectroscopy to classify the botanical origin of honey samples produced in Switzerland. Food Chem. 2007, 101, 314–323. [Google Scholar] [CrossRef]
  16. Mehretie, S.; Al Riza, D.F.; Yoshito, S.; Kondo, N. Classification of raw Ethiopian honeys using front face fluorescence spectra with multivariate analysis. Food Control 2018, 84, 83–88. [Google Scholar] [CrossRef]
  17. Ali, H.; Khan, S.; Ullah, R.; Khan, B. Fluorescence fingerprints of Sidr honey in comparison with uni/polyfloral honey samples. Eur. Food Res. Technol. 2020. [Google Scholar] [CrossRef]
  18. Ruoff, K.; Luginbühl, W.; Künzli, R.; Bogdanov, S.; Bosset, J.O.; von der Ohe, K.; von der Ohe, W.; Amadò, R. Authentication of the botanical and geographical origin of honey by front-face fluorescence spectroscopy. J. Agric. Food Chem. 2006, 54, 6858–6866. [Google Scholar] [CrossRef]
  19. Bong, J.; Loomes, K.M.; Schlothauer, R.C.; Stephens, J.M. Fluorescence markers in some New Zealand honeys. Food Chem. 2016, 192, 1006–1014. [Google Scholar] [CrossRef]
  20. Stephens, J.M.; Loomes, K.M.; Braggins, T.J.; Bong, J.; Lin, B.; Prijic, G. Fluorescence: A novel method for determining manuka honey floral purity. In Honey Analysis; de Toledo, V.d.A.A., Ed.; Intech: Rijeka, Croatia, 2017; pp. 95–113. [Google Scholar] [CrossRef] [Green Version]
  21. Lastra-Mejías, M.; Torreblanca-Zanca, A.; Aroca-Santos, R.; Cancilla, J.C.; Izquierdo, J.G.; Torrecilla, J.S. Characterization of an array of honeys of different types and botanical origins through fluorescence emission based on LEDs. Talanta 2018, 185, 196–202. [Google Scholar] [CrossRef]
  22. Lenhardt, L.; Zeković, I.; Dramićanin, T.; Dramićanin, M.D.; Bro, R. Determination of the botanical origin of honey by front-face synchronous fluorescence spectroscopy. Appl. Spectrosc. 2014, 68, 557–563. [Google Scholar] [CrossRef]
  23. Lenhardt, L.; Bro, R.; Zeković, I.; Dramićanin, T.; Dramićanin, M.D. Fluorescence spectroscopy coupled with PARAFAC and PLS DA for characterization and classification of honey. Food Chem. 2015, 175, 284–291. [Google Scholar] [CrossRef]
  24. Parri, E.; Santinami, G.; Domenici, V. Front-face fluorescence of honey of different botanic origin: A case study from Tuscany (Italy). Appl. Sci. 2020, 10, 1776. [Google Scholar] [CrossRef] [Green Version]
  25. Ramanauskiene, K.; Stelmakiene, A.; Briedis, V.; Ivanauskas, L.; Jakštas, V. The quantitative analysis of biologically active compounds in Lithuanian honey. Food Chem. 2012, 132, 1544–1548. [Google Scholar] [CrossRef] [PubMed]
  26. Sergiel, I.; Pohl, P.; Biesaga, M.; Mironczyk, A. Suitability of three-dimensional synchronous fluorescence spectroscopy for fingerprint analysis of honey samples with reference to their phenolic profiles. Food Chem. 2014, 145, 319–326. [Google Scholar] [CrossRef]
  27. Mattonai, M.; Parri, E.; Querci, D.; Degano, I.; Ribechini, E. Development and validation of an HPLC-DAD and HPLC/ESI-MS 2 method for the determination of polyphenols in monofloral honeys from Tuscany (Italy). Microchem. J. 2016, 126, 220–229. [Google Scholar] [CrossRef]
  28. Cheung, Y.; Meenu, M.; Yu, X.; Xu, B. Phenolic acids and flavonoids profiles of commercial honey from different floral sources and geographic sources. Int. J. Food Prop. 2019, 22, 290–308. [Google Scholar] [CrossRef]
  29. Bahram, M.; Bro, R.; Stedmon, C.; Afkhami, A. Handling of Rayleigh and Raman scatter for PARAFAC modeling of fluorescence data using interpolation. J. Chemom. 2006, 20, 99–105. [Google Scholar] [CrossRef]
  30. Helrich, K. Official Methods of Analysis of Association of Official Analytical Chemists, 15th ed.; Helrich, K., Ed.; Association of Official Analytical Chemists: Arlington, VA, USA, 1990; Volume 1. [Google Scholar]
  31. Harmonides Methods of the International Honey Commission. ICH Responsible for the Methods; Bee Product Science; Harmonides Methods of the International Honey Commission; Bogdanov, S., Ed.; Swiss Bee Research Centre FAM: Bern, Switzerland, 2009; Available online: https://www.ihc-platform.net/ihcmethods2009.pdf (accessed on 2 April 2021).
  32. Louveaux, J.; Maurizio, A.; Vorwohl, G. Methods of melissopalynology. Bee World 1978, 59, 139–157. [Google Scholar] [CrossRef]
  33. Stevens, P.J. Applied Multivariate Statistics for the Social Sciences, 3rd ed.; Lawrence Erlbaum: Mahwah, NJ, USA, 1996. [Google Scholar]
  34. Kivima, E.; Seiman, A.; Pall, R.; Sarapuu, E.; Martverk, K.; Laos, K. Characterization of Estonian honeys by botanical origin. Proc. Est. Acad. Sci. 2014, 63, 183. [Google Scholar] [CrossRef]
  35. Li, Y.-Q.; Li, X.-Y.; Shindi, A.A.F.; Zou, Z.-X.; Liu, Q.; Lin, L.-R.; Li, N. Synchronous fluorescence spectroscopy and its applications in clinical analysis and food safety evaluation. In Reviews in Fluorescence; Geddes, C.D., Lakowicz, J.R., Eds.; Springer: New York, NY, USA, 2011; pp. 95–117. [Google Scholar] [CrossRef]
  36. Pichichero, E.; Canuti, L.; Canini, A. Characterisation of the phenolic and flavonoid fractions and antioxidant power of Italian honeys of different botanical origin. J. Sci. Food Agric. 2009, 89, 609–616. [Google Scholar] [CrossRef]
  37. Spilioti, E.; Jaakkola, M.; Tolonen, T.; Lipponen, M.; Virtanen, V.; Chinou, I.; Kassi, E.; Karabournioti, S.; Moutsatsou, P. Phenolic acid composition, antiatherogenic and anticancer potential of honeys derived from various regions in Greece. PLoS ONE 2014, 9, e94860. [Google Scholar] [CrossRef] [Green Version]
  38. Liang, Y.; Cao, W.; Chen, W.; Xiao, X.; Zheng, J. Simultaneous determination of four phenolic components in citrus honey by high performance liquid chromatography using electrochemical detection. Food Chem. 2009, 114, 1537–1541. [Google Scholar] [CrossRef]
  39. Perna, A.; Intaglietta, I.; Simonetti, A.; Gambacorta, E. A comparative study on phenolic profile, vitamin C content and antioxidant activity of Italian honeys of different botanical origin. Int. J. Food Sci. Technol. 2013, 48, 1899–1908. [Google Scholar] [CrossRef]
  40. Mannina, L.; Sobolev, A.P.; Di Lorenzo, A.; Vista, S.; Tenore, G.C.; Daglia, M. Chemical composition of different botanical origin honeys produced by Sicilian black honeybees (Apis mellifera ssp. sicula). J. Agric. Food Chem. 2015, 63, 5864–5874. [Google Scholar] [CrossRef] [PubMed]
  41. Hadjmohammadi, M.R.; Nazari, S.S.S.J. Separation optimization of quercetin, hesperetin and chrysin in honey by micellar liquid chromatography and experimental design. J. Sep. Sci. 2010, 33, 3144–3151. [Google Scholar] [CrossRef] [PubMed]
  42. Trautvetter, S.; Koelling-Speer, I.; Speer, K. Confirmation of phenolic acids and flavonoids in honeys by UPLC-MS. Apidologie 2009, 40, 140–150. [Google Scholar] [CrossRef] [Green Version]
  43. Socha, R.; Juszczak, L.; Pietrzyk, S.; Fortuna, T. Antioxidant activity and phenolic composition of herbhoneys. Food Chem. 2009, 113, 568–574. [Google Scholar] [CrossRef]
  44. Tsiapara, A.V.; Jaakkola, M.; Chinou, I.; Graikou, K.; Tolonen, T.; Virtanen, V.; Moutsatsou, P. Bioactivity of Greek honey extracts on breast cancer (MCF-7), prostate cancer (PC-3) and endometrial cancer (Ishikawa) cells: Profile analysis of extracts. Food Chem. 2009, 116, 702–708. [Google Scholar] [CrossRef]
  45. Kıvrak, Ş.; Kıvrak, İ. Assessment of phenolic profile of Turkish honeys. Int. J. Food Prop. 2016, 20, 864–876. [Google Scholar] [CrossRef] [Green Version]
  46. Pita-Calvo, C.; Vázquez, M. Differences between honeydew and blossom honeys: A review. Trends Food Sci. Technol. 2017, 59, 79–87. [Google Scholar] [CrossRef]
Figure 1. Characteristic 3D-EEM spectra of thyme honey.
Applsci 11 04047 g001
Figure 2. Characteristic 3D-EEM spectra of pine honey.
Applsci 11 04047 g002
Figure 3. Characteristic 3D-EEM spectra of fir honey.
Applsci 11 04047 g003
Figure 4. Characteristic 3D-EEM spectra of citrus honey.
Applsci 11 04047 g004
Figure 5. The 3D-EEM spectra intensities at λex = 240–400 and λem = 250–640.
Applsci 11 04047 g005
Figure 6. Emission spectrum at λex 330 nm.
Applsci 11 04047 g006
Figure 7. Emission spectrum at λex 360 nm.
Applsci 11 04047 g007
Figure 8. Discrimination results based on λex = 330 nm.
Applsci 11 04047 g008
Figure 9. Discrimination results based on λex = 360 nm.
Applsci 11 04047 g009
Table 1. Results of physicochemical analysis.
Botanical SourceAggregate
Functions
Fructose + Glucose (%w/w)Sucrose (%w/w)Electrical Conductivity (μS cm−1)Moisture (%w/w)
Thyme honeyMin60.10.025114.3
Max86.43.760017.9
Average68.20.743515.8
Pine honeyMin46.40.091114.6
Max77.21.0143117.7
Average58.90.1112216.1
Fir honeyMin46.30.0104113.7
Max64.52.4200018.4
Average55.00.2152615.5
Citrus honeyMin66.20.018115.3
Max76.24.832418.7
Average71.91.027517.0
Table 2. The wavelengths of λex and λem of standards phenolic compounds.
Phenolic Compoundλex (nm)λem (nm)
Caffeic acid310–360410
Chlorogenic acid300–360416
p-Coumaric acid320–340380
Ferulic acid310–360400
Sinapic acid300–360415
Ellagic acid280–380400
Homogentisic acid280–320335
Gallic acid265–315345
Protocatechuic acid265–315335
Syringic acid250–315335
Vanillic acid260–315330
Methyl syringate250–320340
Gentisic acid290–360400 and 475
Kaempferol280–320430 and 500
Catechin250–310315
ChrysinLow intensity
HesperetinLow intensity
IsorhamentinLow intensity
NaringeninLow intensity
Table 3. Discrimination results based on fluorescence at λex = 330 nm.
Predicted Group Membership
LabelsThyme HoneyPine HoneyFir HoneyCitrus HoneyTotal
Original aCountThyme honey1800018
Pine honey1111013
Fir honey0115016
Citrus honey0001212
%Thyme honey100.00.00.00.0100.0
Pine honey7.784.67.70.0100.0
Fir honey0.06.393.80.0100.0
Citrus honey0.00.00.0100.0100.0
Cross-validated b,cCountThyme honey1800018
Pine honey1111013
Fir honey0115016
Citrus honey0001212
%Thyme honey100.00.00.00.0100.0
Pine honey7.784.67.70.0100.0
Fir honey0.06.393.80.0100.0
Citrus honey0.00.00.0100.0100.0
External Validation dCountThyme honey1103014
Pine honey14005
Fir honey01405
Citrus honey00044
%Thyme honey78.60.021.40100.0
Pine honey20.080.00.00100.0
Fir honey0.020.080.00100.0
Citrus honey0.00.00.0100.0100.0
a 94.9% of original grouped cases correctly classified; b 94.9% of cross-validated grouped cases correctly classified; c cross validation is done only for those cases in the analysis. In cross validation, each case is classified by the functions derived from all cases other than that case; d 82.1% of external validated test set correctly classified.
Table 4. Discrimination results based on fluorescence at λex = 360 nm.
Predicted Group Membership
LabelsThyme HoneyPine HoneyFir HoneyCitrus HoneyTotal
Original aCountThyme honey1710018
Pine honey0103013
Fir honey0610016
Citrus honey1001112
%Thyme honey94.45.60.00.0100.0
Pine honey0.076.923.10.0100.0
Fir honey0.037.562.50.0100.0
Citrus honey8.30.00.091.7100.0
Cross-validated b,cCountThyme honey1710018
Pine honey0103013
Fir honey0610016
Citrus honey2001012
%Thyme honey94.45.60.00.0100.0
Pine honey0.076.923.10.0100.0
Fir honey0.037.562.50.0100.0
Citrus honey16.70.00.083.3100.0
External Validation dCountThyme honey1040014
Pine honey05005
Fir honey01405
Citrus honey00044
%Thyme honey71.428.60.00.0100.0
Pine honey0.0100.00.00.0100.0
Fir honey0.020.080.00.0100.0
Citrus honey0.00.00.0100.0100.0
a 81.4% of original grouped cases correctly classified; b 79.7% of cross-validated grouped cases correctly classified; c cross validation is done only for those cases in the analysis. In cross validation, each case is classified by the functions derived from all cases other than that case; d 82.1% of external validated test set correctly classified.
Publisher’s Note: MDPI stays neutral with regard to jurisdictional claims in published maps and institutional affiliations.

