Article

Experimental Research on Reinforced Concrete Columns Strengthened with Steel Jacket and Concrete Infill

by
Aleksandar Landović
* and
Miroslav Bešević
Faculty of Civil Engineering, University of Novi Sad, Kozaračka 2a, 24000 Subotica, Serbia
*
Author to whom correspondence should be addressed.
Appl. Sci. 2021, 11(9), 4043; https://doi.org/10.3390/app11094043
Submission received: 12 April 2021 / Revised: 23 April 2021 / Accepted: 27 April 2021 / Published: 29 April 2021

Abstract

:
Experimental research on axially compressed columns made from reinforced concrete (RC) and RC columns strengthened with a steel jacket and additional fill concrete is presented in this paper. A premade squared cross-section RC column was placed inside a steel tube, and then the space between the column and the tube was filled with additional concrete. A total of fourteen stub axially compressed columns, including nine strengthened specimens and five plain reinforced concrete specimens, were experimentally tested. The main parameter that was varied in the experiment was the compressive strength of the filler concrete. Three different concrete compression strength classes were used. Test results showed that all three cross-section parts (the core column, the fill, and the steel jacket) worked together in the force-carrying process through all load levels, even if only the basic RC column was loaded. The strengthened columns exhibited pronounced ductile behavior compared to the plain RC columns. The influence of the test parameters on the axial compressive strength was investigated. In addition, the specimen failure modes, strain development, and load vs. deformation relations were registered. The applicability of three different design codes to predict the axial bearing capacity of the strengthened columns was also investigated.

1. Introduction

A large number of reinforced concrete (RC) structures over time have their usage altered, and they experience deterioration or damage caused by different causes. RC elements are often degraded by enlarged loads, inadequate maintenance, a more aggressive environment, etc. Raised demands by renewed seismic codes often cause an older RC structure to have insufficient earthquake resistance. In all of the mentioned situations, forces in structures are increased, so it is necessary to strengthen the load-bearing elements. In the case of the columns, a steel tube, also called a jacket, can be placed over the entire height of the column, while the remaining space between the column and jacket is filled with additional concrete. Strengthened in this way, the RC column has increased load-bearing capacity to all additional permanent and live loads on the structure. The load-bearing capacity of the strengthened column is affected by the level of engagement of the composite cross-section parts, e.g., steel jacket, concrete fill, and basic RC column.
Due to the coupling effect with concrete, the steel jacket enables the formation of a hoop stress state, which significantly increases the composite action and column load-bearing strength. The effect of the hoop stress causes the biaxial stress state in the steel tube and the triaxial state of stress in the concrete core. In addition to these states, the concrete core prevents any inward local buckling of the steel jacket. When the force simultaneously acts on the concrete core and the steel tube at exploitation load levels (usually up to 50% of ultimate load), different lateral expansion of concrete and steel can occur due to their different Poisson ratios. Then, the steel tube will have greater lateral strains compared to concrete, which can decrease the desired composite action of the steel–concrete cross-section. If the load is applied only on the concrete part of the composite cross-section, the influence of different Poisson ratios can be diminished [1].
Over time, a great number of studies have been conducted on composite columns made as concrete-filled steel tubes (CFST). Static and dynamic behavior of stub and slender specimens was investigated on rectangular, square, or circular sections in order to determine their response to compression and to investigate the influence of the cross-section shape on the lateral confining stresses development, such as in [2,3]. Giakoumelis and Lam [4] studied the effects of the concrete compressive strength and steel tube wall thickness on the behavior of concrete-filled steel tubes. Sakino, et al. [5] presented results of the extensive research of the influence of the physical and mechanical properties of steel tubes in CFST members. In recent times, usage of high-strength and ultrahigh-strength concrete as filler of steel tubes was investigated [6,7,8,9]. In those papers, researchers showed a linear relationship between the concrete compressive strength and the bearing capacity of the CFST columns. The ductility and strength of the specimens grow by increasing the concrete strength and confinement index. Usage of the high-strength steel was investigated in [10,11,12], while usage of stainless steel in CFST members was presented in [13,14,15]. Stainless steel composite members showed larger ductile behavior when compared with regular carbon steel CFST columns, and stainless steel members had higher residual strength. Innovative usage of composite columns, such as double skin CFST members [16,17,18], bimetallic tubes [19], or fiber-reinforced plastic tubes [20], is considered today. The investigation of the behavior of CFST stub columns with circular, square, and rectangular sections with the partially loaded cross-section was presented by Han, et al. [21,22,23], Yang [24], and Ding [25]. The behavior of composite columns with the partially loaded area was considerably different from the fully loaded members, mainly due to the early development of the confining stresses in concrete. The simplified calculation models to determine the ultimate strength of CFST columns loaded on a partially stressed cross-sectional area were presented in [23,24,25].
Usage of the steel tube as an external jacket in the strengthening of RC bridge columns was investigated by Priestley, et al. [26,27]. Strengthened members showed increased axial and shear capacity and greater ductility compared to plain RC columns. Sakino and Sun [28] showed the results of an experimental analysis of square RC columns retrofitted by the steel jacket. Tsai and Lin [29] investigated axially loaded RC columns strengthened with various jacketing methods. Jackets made from steel or carbon fiber composites with circular, square, and octagonal shapes were used on square RC columns. It was found that the steel-jacketed specimens showed greatly enhanced load carrying capacity and pronounced ductile behavior. Sezen and Miller [30] studied the axial behavior of circular reinforced concrete columns strengthened by steel jackets and fiber-reinforced polymer composites. Moreover, they investigated a method of strengthening columns with concrete jackets reinforced with spiral steel rebar, premade welded steel wire fabric, and special steel reinforcement. All considered strengthening methods effectively increased the column’s capacity and stiffness compared to the reference specimen. Ro et al. [31] presented a study of a seismic retrofitting of RC frames using welded concrete-filled steel tubes. The RC frames strengthened with the CFST system showed increased bearing load, effective stiffness and capacity to dissipate energy, with values approximately two to three times greater than those obtained on the unstrengthened RC frame. Lately, there have been some innovative usage of fabric reinforced cementitious mortar as a way to confine concrete columns [32].
From the presented literature review, it can be noticed a lack of information on rectangular cross-section reinforced concrete columns strengthened with a steel jacket. This paper is, thus, an attempt to investigate the behavior of strengthened axially compressed RC columns. The main objectives of this paper are: to present experimental results of the behavior of the stub RC columns strengthened with the steel tube jacket and the concrete filling; to analyze the influence of compressive strength of the filling material on the behavior of strengthened specimens; and to predict the load-bearing capacity of the strengthened stub RC columns by using existing codes or sets of simplified expressions. The novelty of the study is the applicability of the presented method for strengthening the RC columns and confirmation of Eurocode 4 results in determining plastic resistance of the strengthened column.
The paper is structured as follows: in Section 2, test specimens from the experimental program are presented. Next, experimental studies to determine the properties of the used materials are conducted, and the test setup was defined. In Section 3, results of the experimental testing on plain RC and strengthened column are presented. A discussion of the experimentally obtained results is provided in Section 4. The applicability of three different design codes to predict the axial bearing capacity of the strengthened columns is presented in Section 5. Section 6 summarizes the final remarks and the conclusions of the paper.

2. Experimental Program
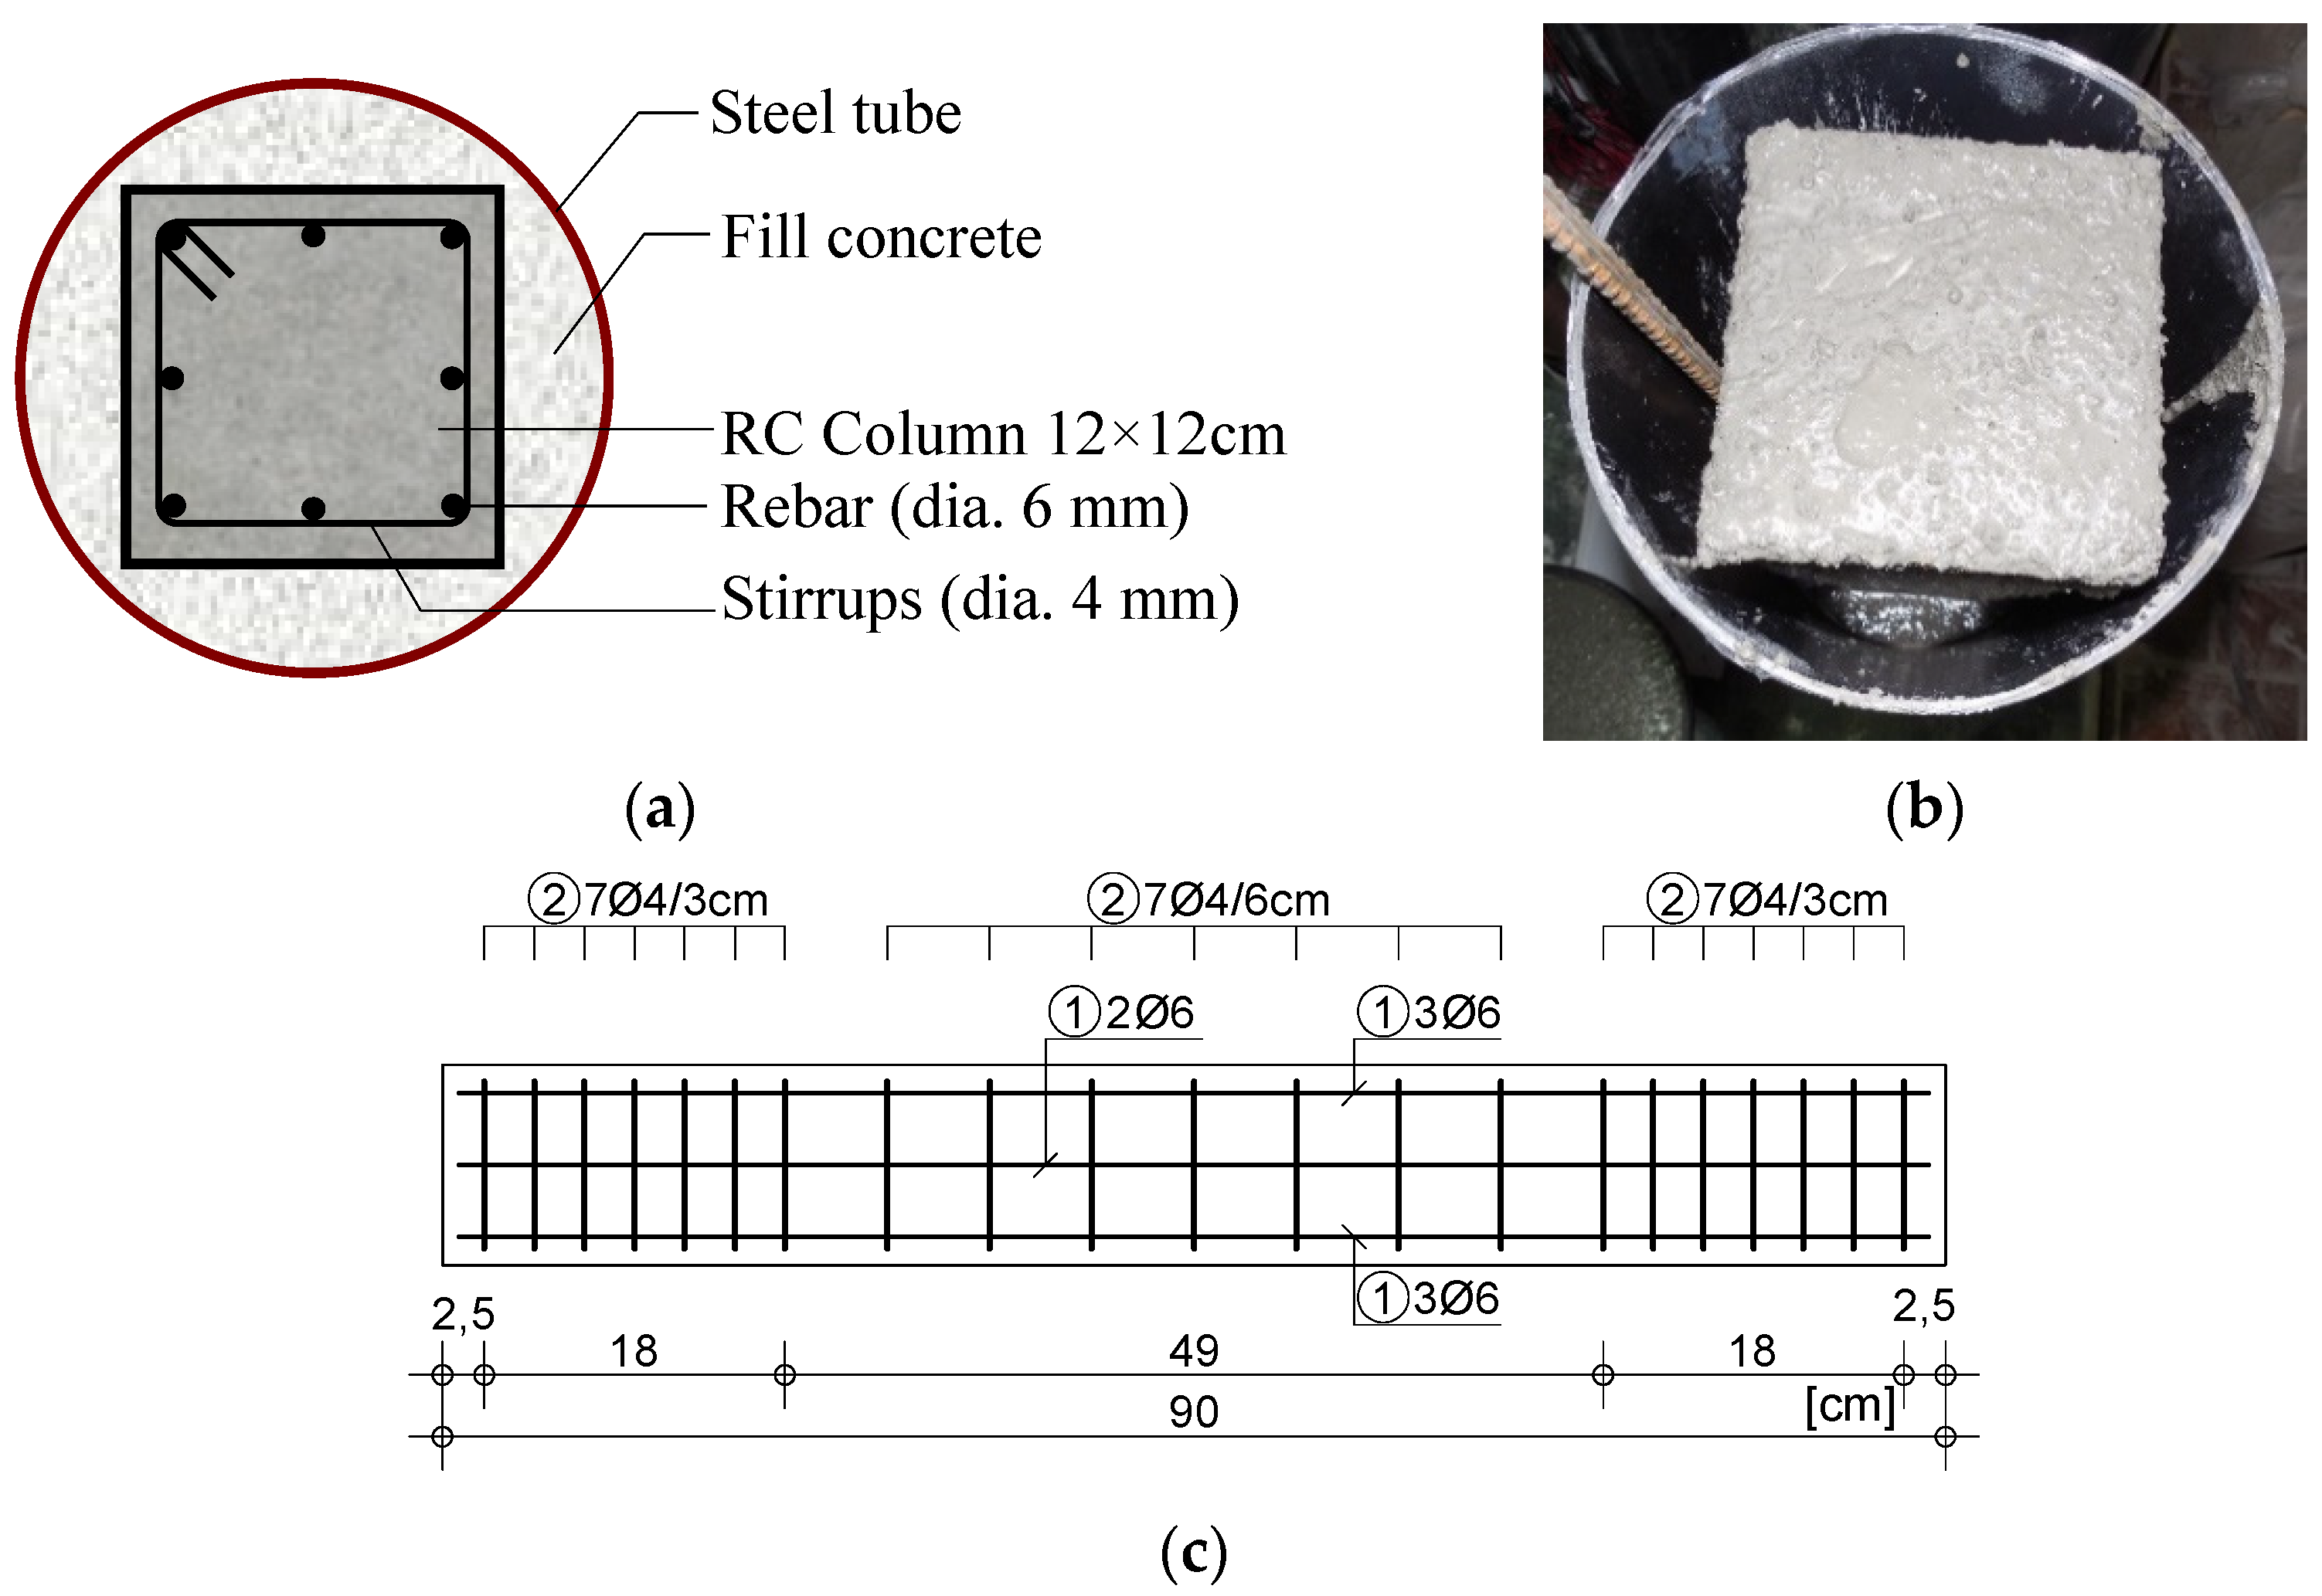
2.1. Test Specimens

The experimental part of the presented research was carried out on a model of a reinforced concrete column, which was then strengthened with a steel tube jacket. Strengthening was achieved on a premade RC column placed in the steel tube, and the remaining empty space was then filled with fresh concrete (Figure 1). Column models with their dimensions correspond to real structure with an aspect ratio of 1 by 3.3, i.e., 3.3 times smaller than a column of a real structure. The scale of the test models was chosen in consideration of the limitations of the laboratory testing equipment, in which the largest model could be around 90 cm high. Then, an aspect ratio of 1 by 3.3 was obtained by considering that a typical RC building has a 300 cm high story. Other parameters of the test specimens, such as the column’s cross-section dimensions, the steel tube wall thickness, the rebar diameter, and the aggregate sizes, were scaled appropriately. The height to diameter ratio of 4.6 for the test models was chosen, which is within the interval from three to five, as it is common in literature (e.g., [19,21,29]).
A total of 14 stub axially compressed columns were tested; among those, nine were strengthened specimens, and five were plain RC specimens. Column models were divided into four groups. The first group of five models consisted of control specimens of plane RC columns (Label S0x, where x, in all series, represents the specimen number). The next three groups of three models were RC columns strengthened with steel tubes and infilled with fine-grain concrete (Labels B2x, B4x, and P0x). The columns without strengthening and the columns that were strengthened had a square cross-section with dimensions of 12 by 12 cm and a height of 90 cm. All columns were made from class C35/45 concrete. The main reinforcements in columns were 8 bars with a diameter of 6 mm and closed stirrups with a 4 mm diameter. Stirrups were spaced 3 cm at the top and the bottom 20 cm of the column length and spaced 6 cm in the middle (Figure 1c).
The compression strength of filler concrete was the main parameter that was varied in tests. Three different strength classes were used. In the first group of strengthened columns, specimens were filled with class C20/25 concrete, which is approximately half of the core RC column concrete class. The second group of specimens was filled with class C40/50 concrete, which is close to the strength class of the core RC column concrete. The specimens of the third group were filled with special, commercially available premade two-component, high-quality mortar named Polimag®HK-04, which had compressive strength as class C70/85 concrete.
The main characteristics of all tested specimens are summarized in Table 1, where B is the width of the square section, D and t are the outside diameter and the wall thickness of the steel tube, respectively, and L is the length of the specimen.

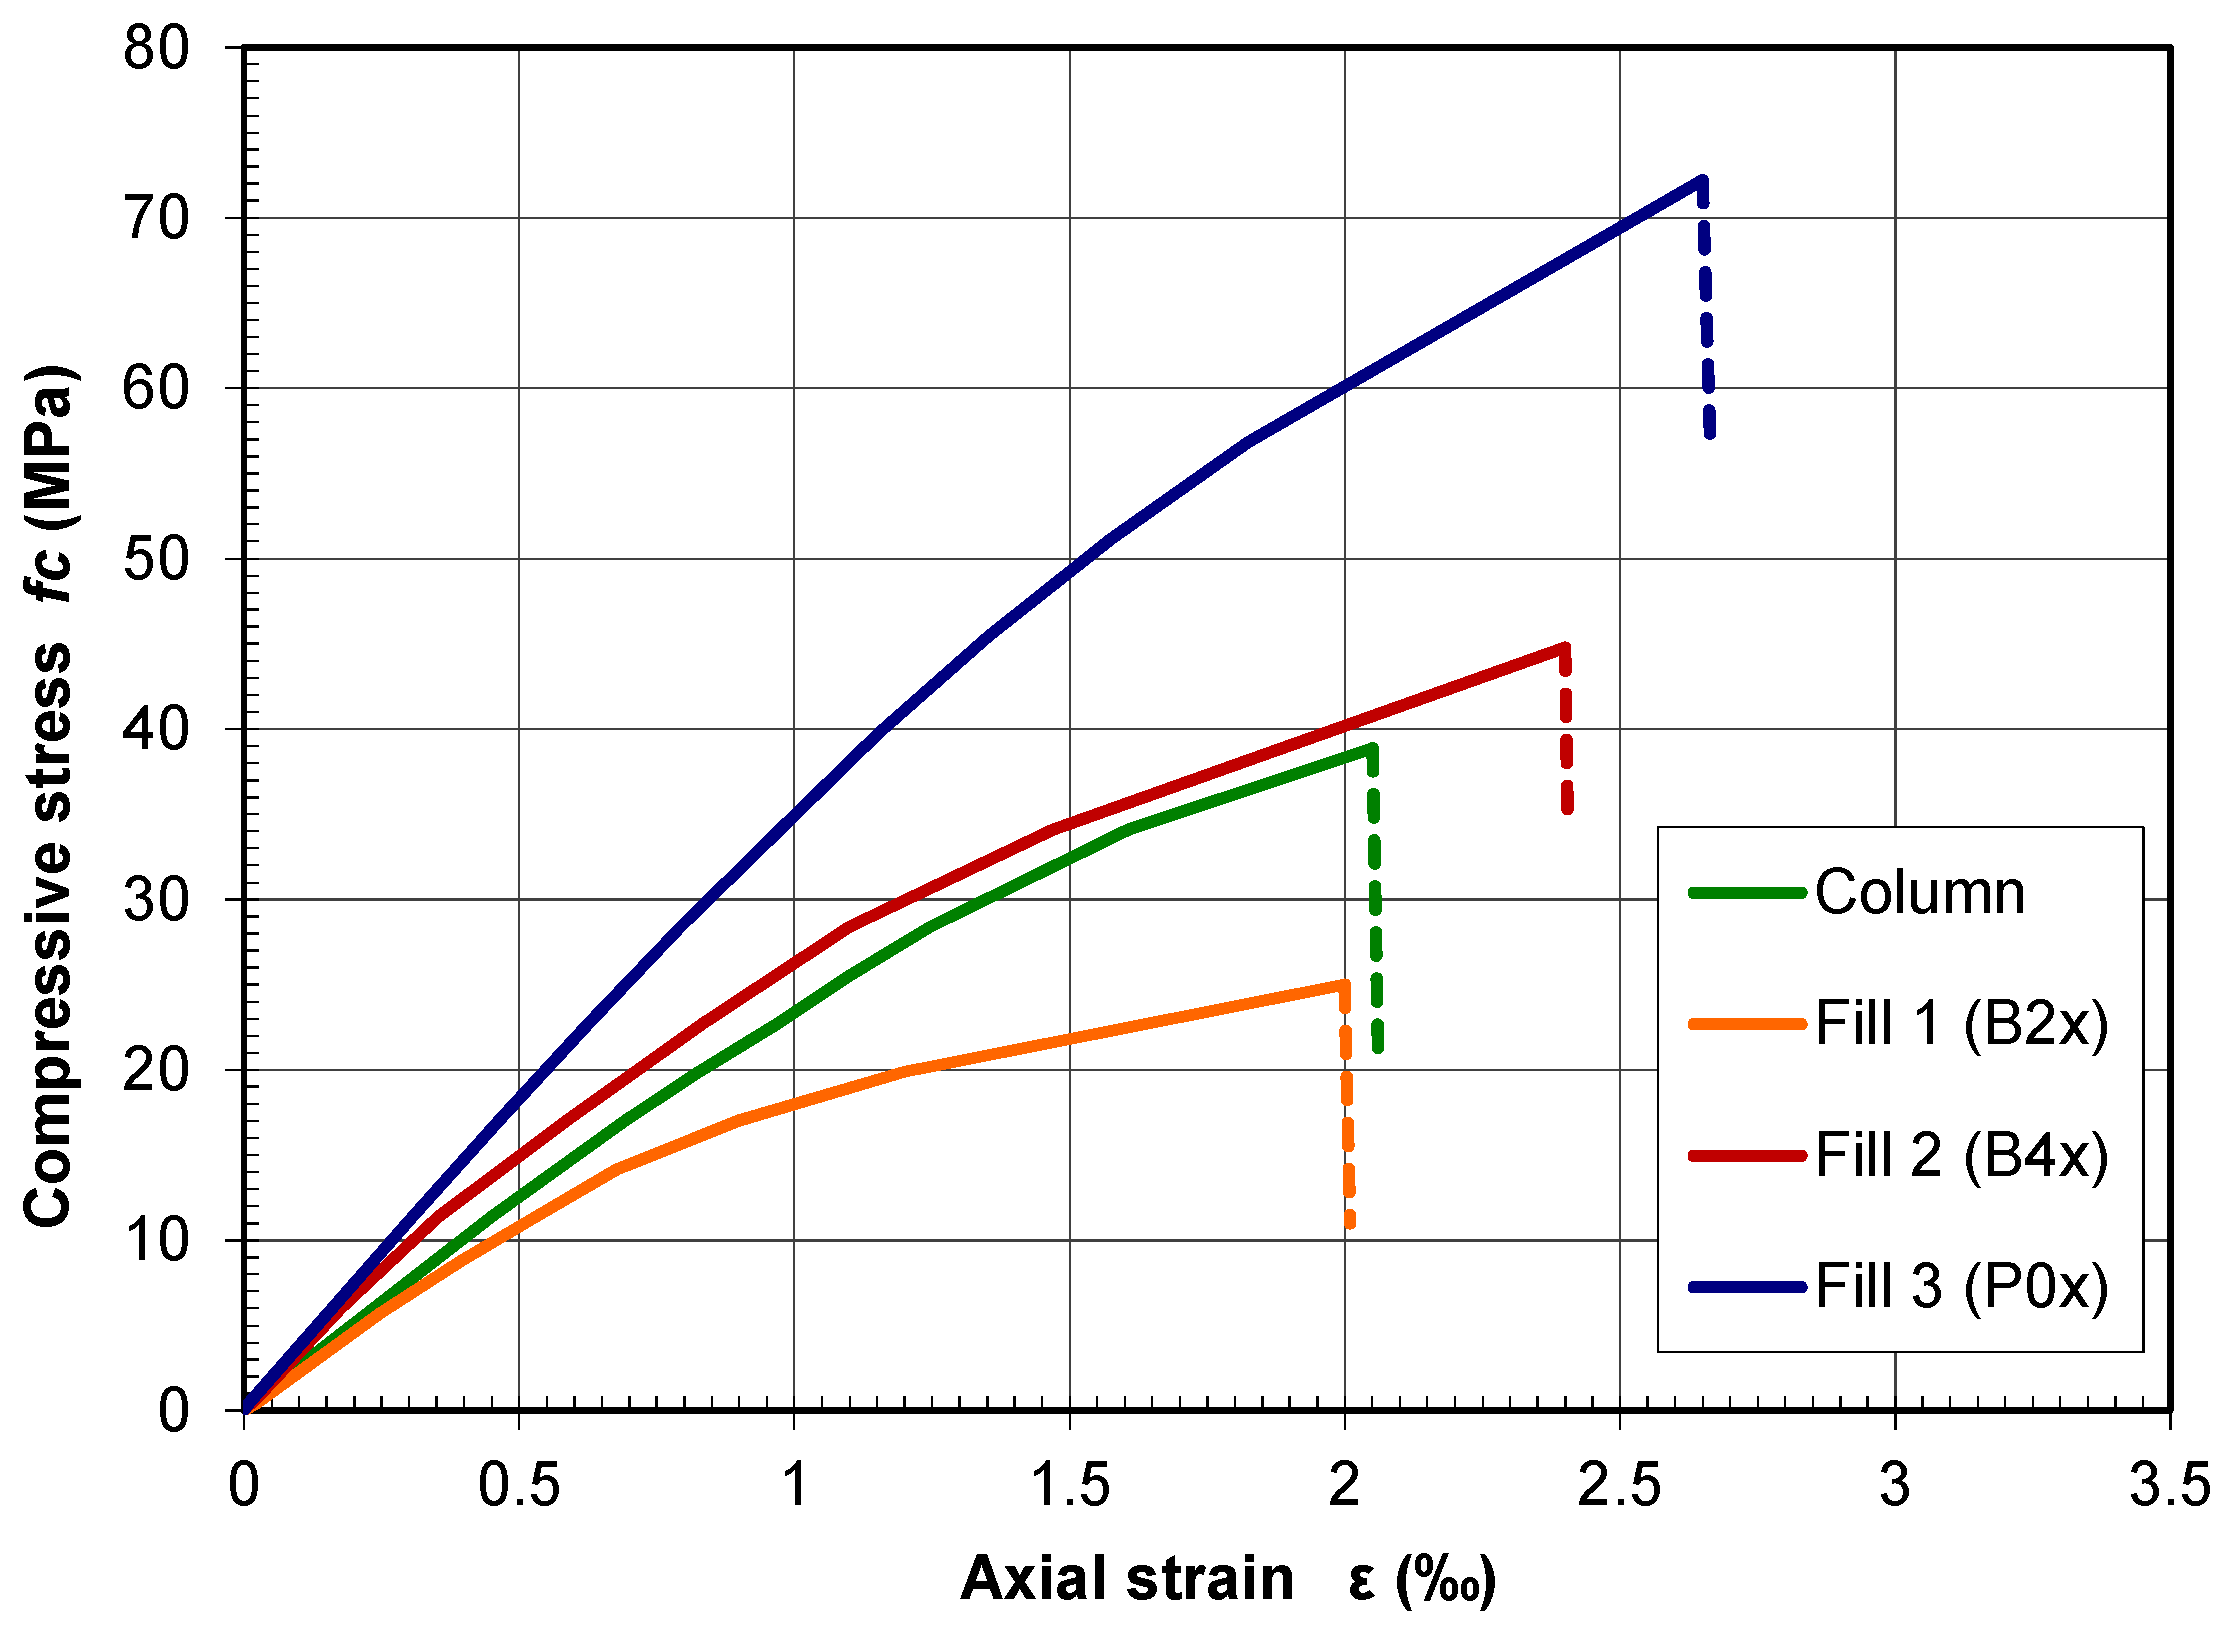
2.2. Material Properties
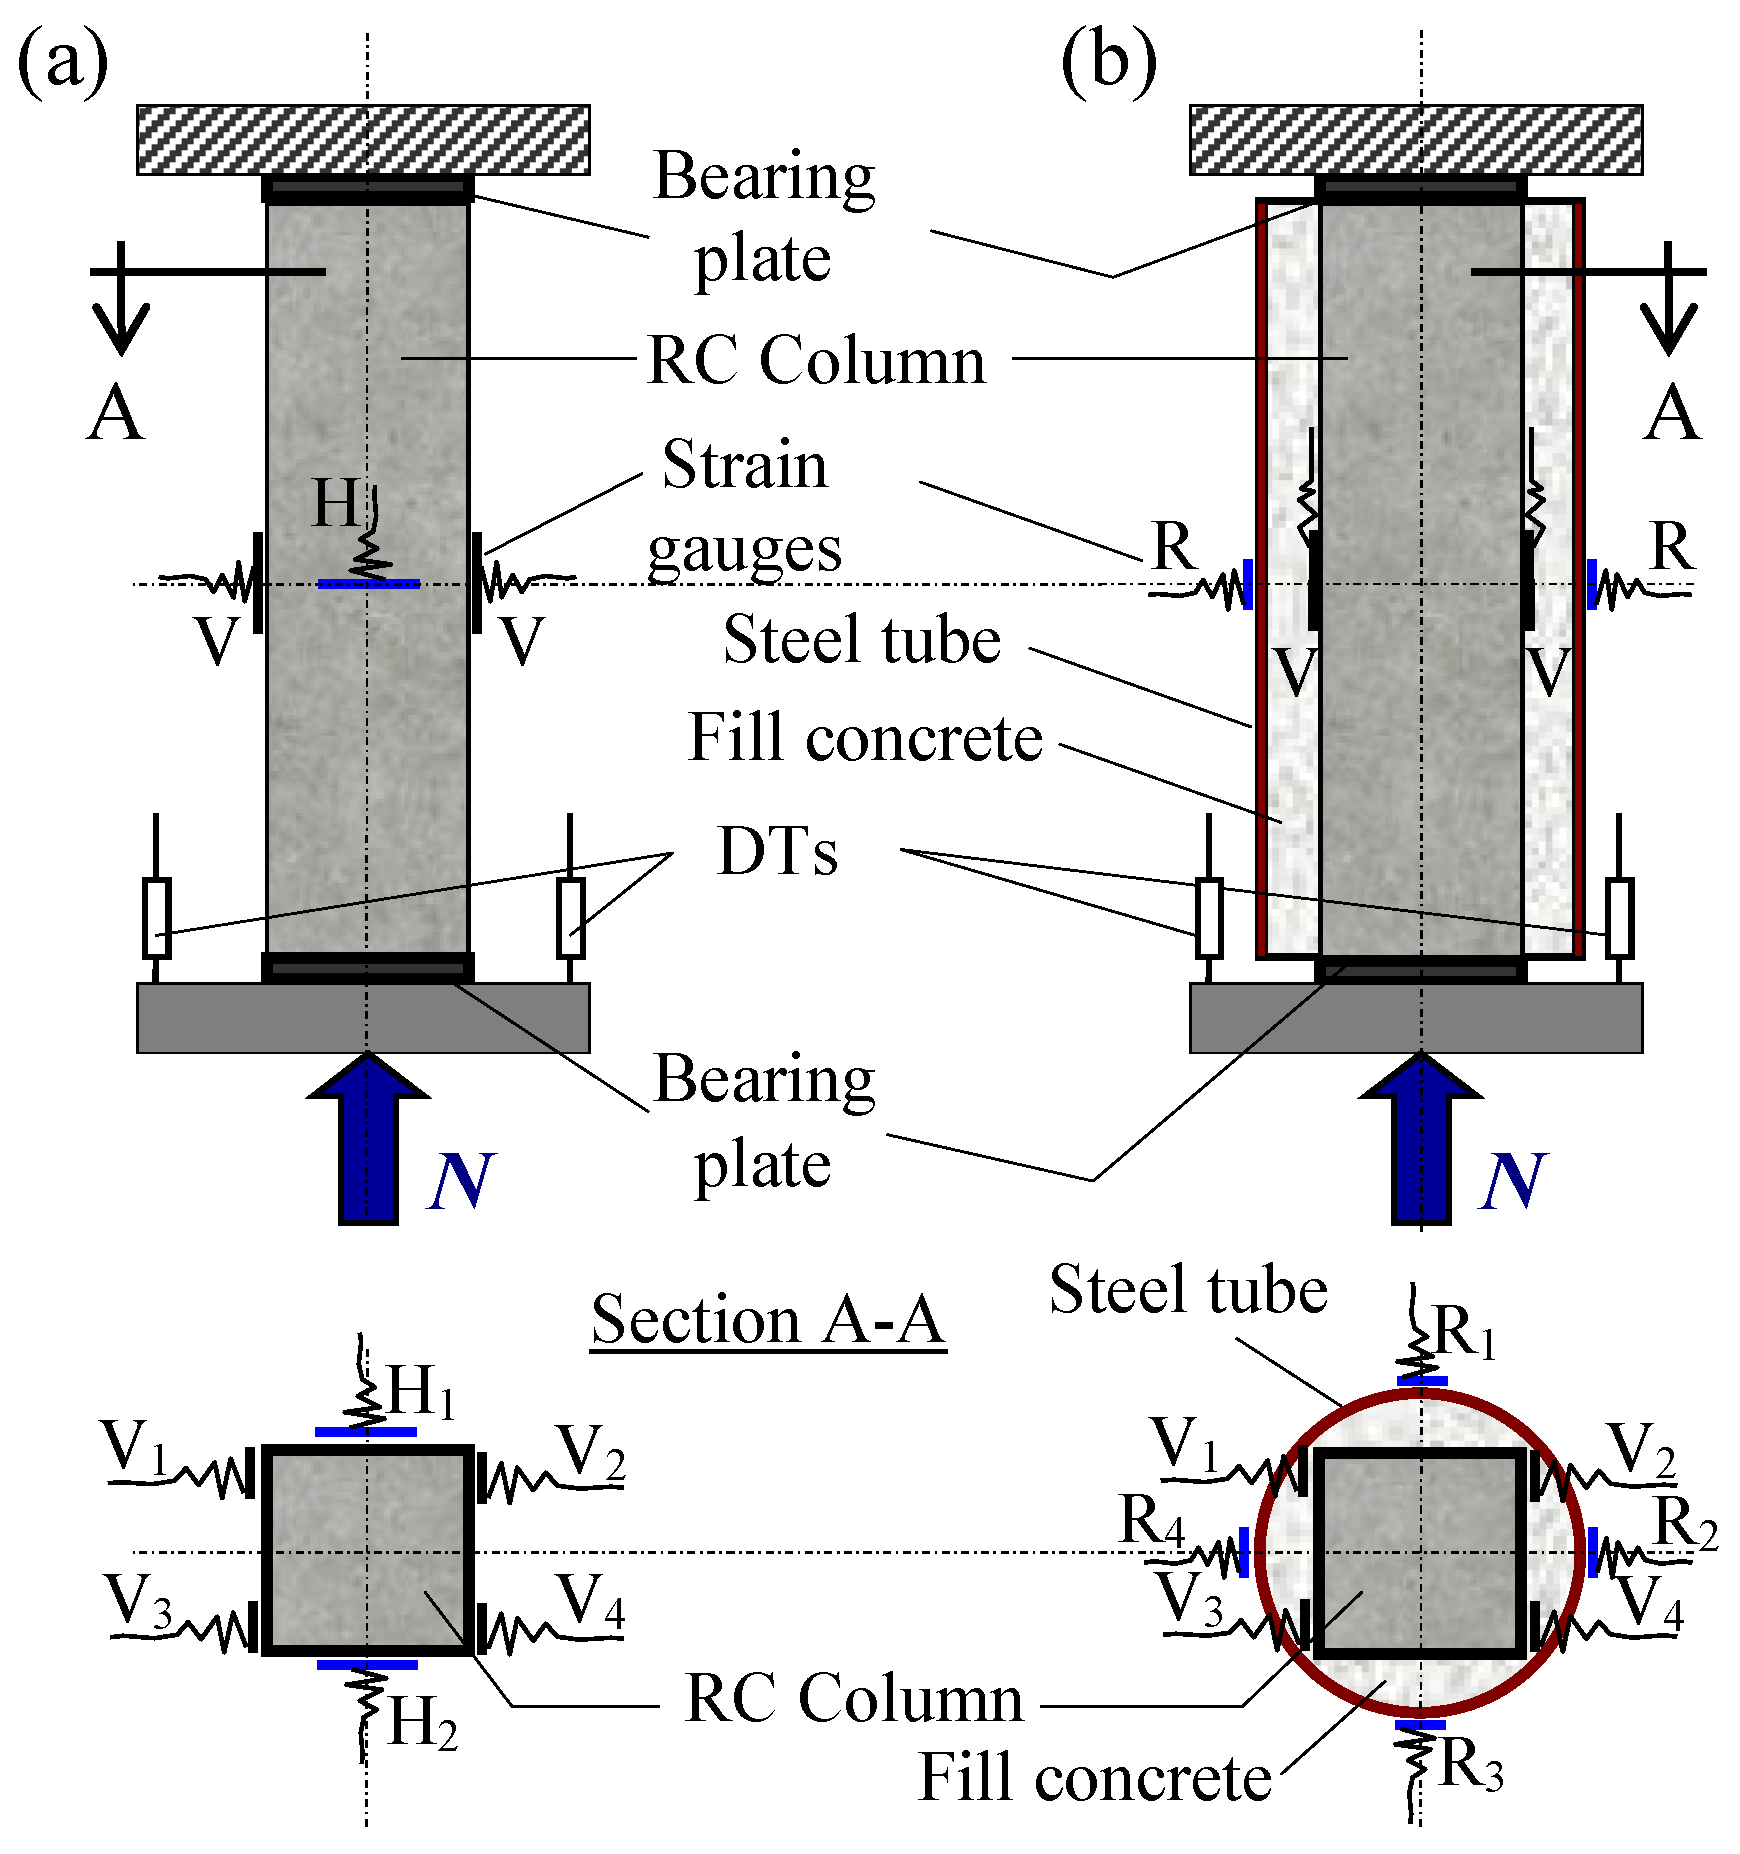
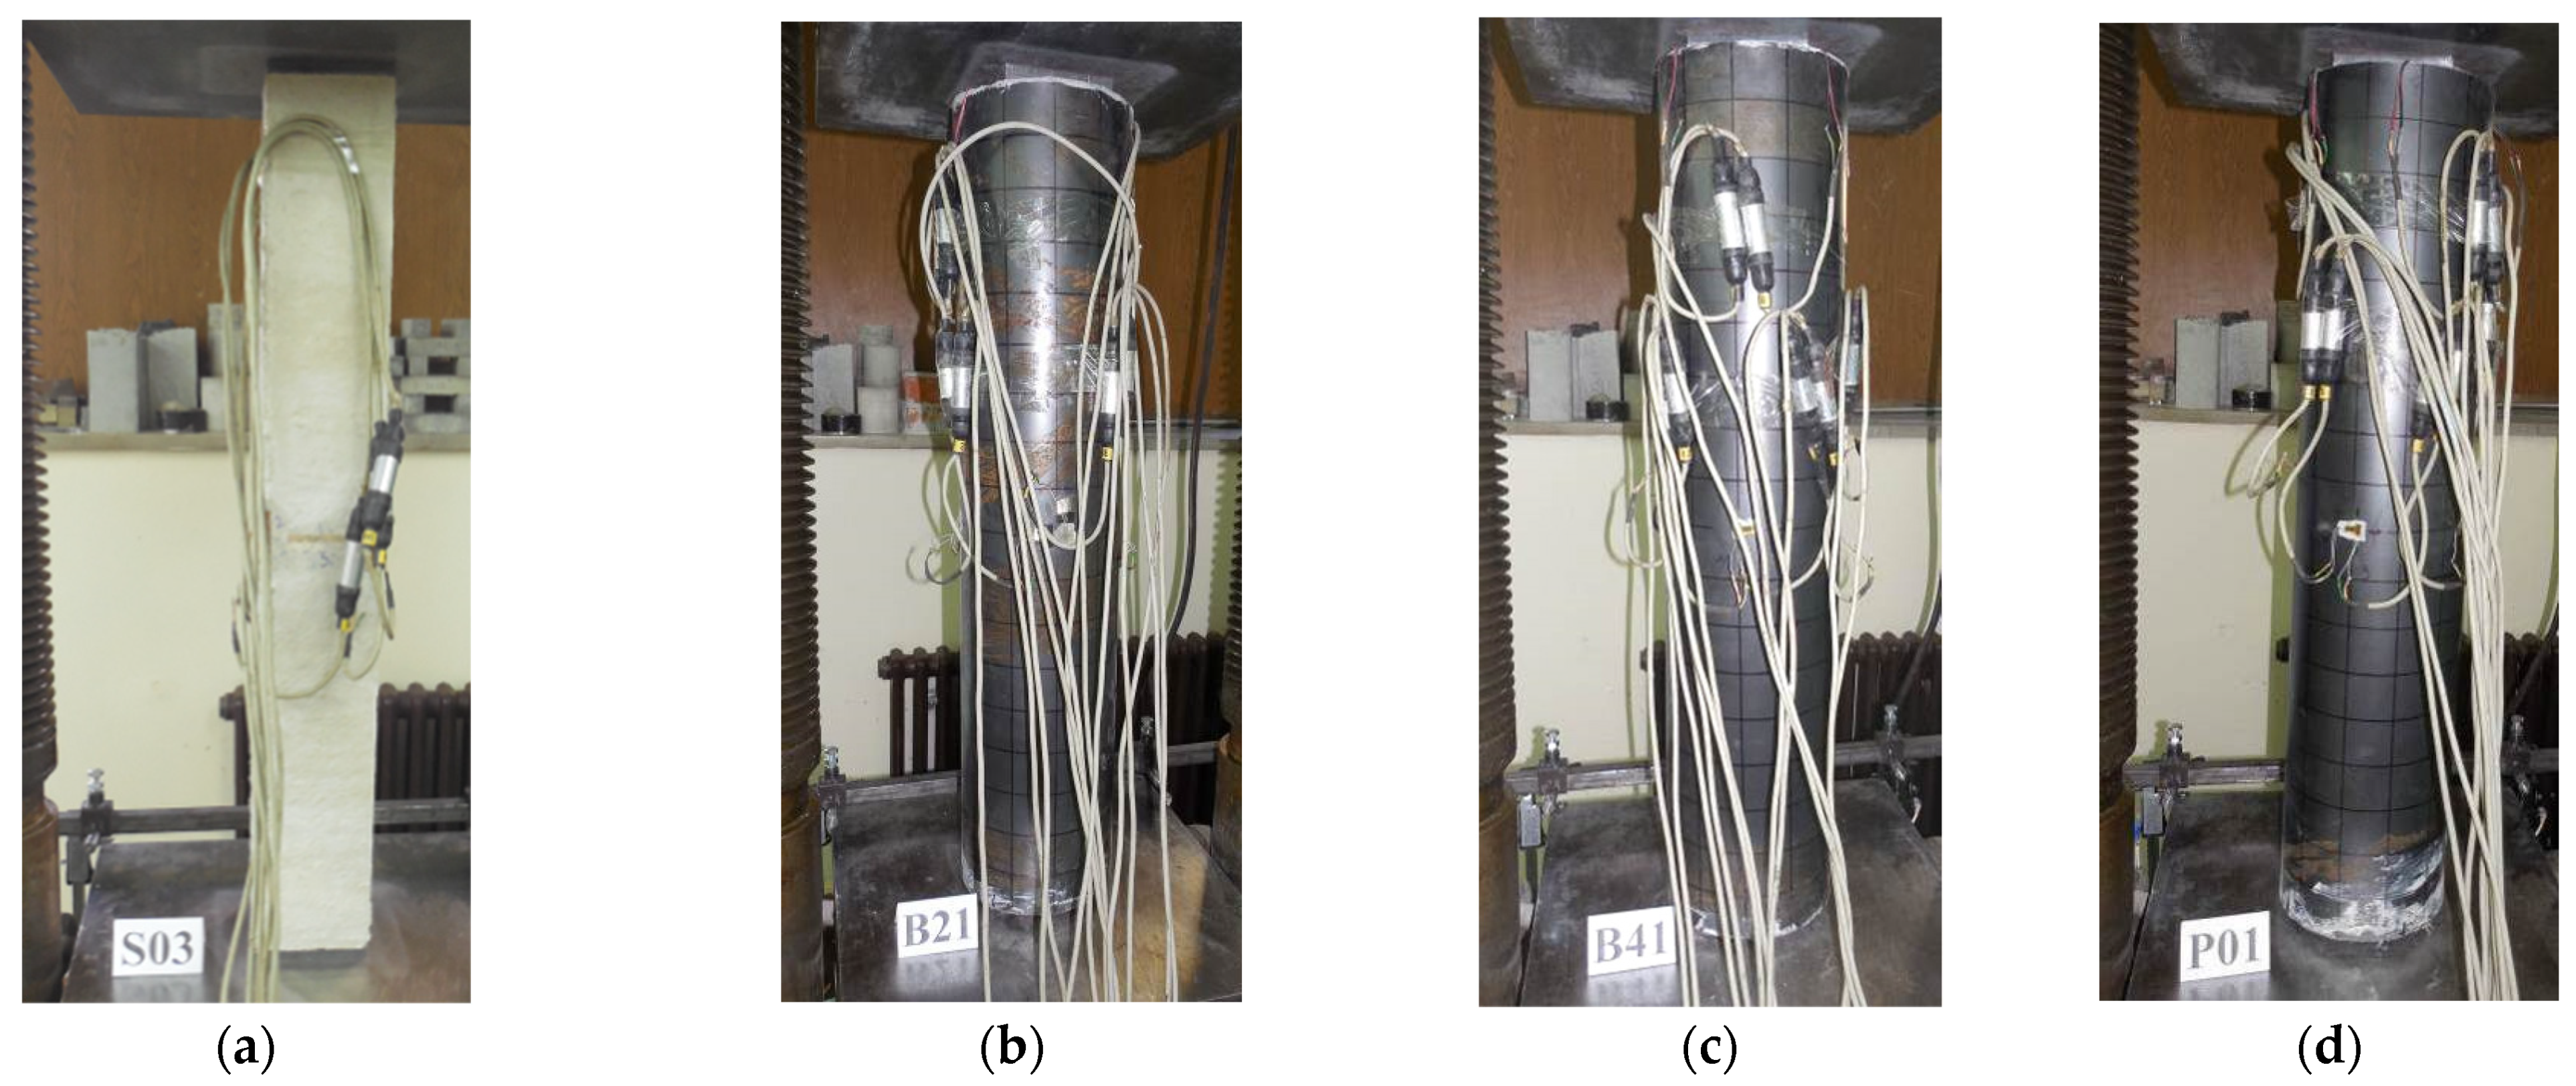
Mixes of the fresh concrete were designed for the required compressive strength. The mixture proportions of the fresh concrete are summarized in Table 2. In all of the used concrete mixes, the coarse aggregate was crushed carbonaceous rock, and the fine aggregate was pure siliceous sand. Cement used for basic RC columns and for making fill concrete 2 was CEM II/A-M 42.5R, while fill concrete 1 was made with CEM II/B-M 32.5R cement. A water reduction superplasticizer was used to provide adequate viscosity for pouring fresh concrete in the tube and around the basic RC column. For each type of concrete mix, six 15 cm cubes and three cylinders with a diameter of 15 cm and length of 30 cm were also cast. Standard test specimens were cured in conditions similar to the column specimens. All tests for determining mechanical properties of hardened concrete were conducted according to EN 12390 standards [33,34]. The average values of the compressive cylinder and cube strength, splitting tensile cube strength, as well as the static elastic modulus, Poisson’s ratio, and density in hardened state of all concrete types, are listed in Table 3. These characteristics were determined two days before the main testing of the column models so that the properties of used concrete were exactly known at the time of the experiment. The representative compressive stress–strain curves of all used concrete obtained from the load-displacement relationships that were measured during the cylinder tests are presented in Figure 2.
The steel quality of reinforcement corresponds to a cold-formed steel wire with an average yield strength (fsk) of 550 MPa, tensile strength (fusk) of 650 MPa, and a modulus of elasticity (Esr) of 200 GPa. These characteristics were experimentally determined on three test specimens.
The tubes used for strengthening were manufactured from a 3 mm thick mild steel sheet. The plate was cut out from the sheet, cold-folded into a circular shape, and welded with a square weld. Full penetration welds were made continuously over the entire length of the tubes. Strips from the steel sheet were tested in tension on three standard testing coupons. From these tests, the average yield strength (fy), ultimate tensile strength (fu), and elastic modulus (Es) were determined as 230 MPa, 340 MPa, and 210 GPa, respectively. Initial specimen imperfections and residual stresses are minimized in steel tubes by the concrete infill, and therefore, the effect of residual stress was not considered in the value of yield strength, as noted in [35]. Tubes were 90 cm long (same as basic concrete columns), with an outside diameter of 19.4 cm. Dimensions of the tube were chosen to reduce the effects of global buckling and end conditions, as suggested by Han et al. [36]. The ratio of the tube’s outer diameter to wall thickness was chosen as D/t = 65. In that way, the limit conditions for compressed circular tube filled with concrete defined in Eurocode 4 [37] and AISC 360 [38] standards were met. Limits according to standards are D/t ≤ 96 for Eurocode and D/t ≤ 137 for AISC. The cross-section of steel tube was classified, according to Eurocode 3 [39], as Class 2. For that class, the cross-section can achieve plastic moment resistance, but it has limited rotational capacity because of local tube buckling.
The insides of the tubes were cleaned with solvent in order to remove any rust and deposits of oil or grease. The concrete in tubes and around the basic RC column was filled in layers and was compacted by poker rod, as shown in Figure 1b. The specimens were left inside a laboratory at a constant temperature of 20 °C and 50% humidity to air-dry until testing, which occurred 120 days after filling. At the time of tests, the basic RC columns were 672 days old.

2.3. Test Setup

The experimental part of the presented research included registering two types of deformation, namely measuring strains (local deformation) and measuring column shortening (global deformation). Strain gauges were used to measure the variation of strains at a section located in the middle of model height and were placed symmetrically, due to the longitudinal column axis. Figure 3a shows the plain RC specimen, while Figure 3b shows a strengthened specimen. Strain gauges used to register axial strains were marked as V (vertical), while strain gauges used to register lateral strains were marked as H (horizontal). In strengthened specimens, four vertical strain gauges were placed on the basic RC column before fill concreting. Strain gauges were protected by a special ABM75 elastic cover manufactured by HBM. Conductive cables from the strain gauges to the acquisition equipment were guided to the top of the specimens through fill concrete. Four 0–90° degree T-rosette strain gauges were placed on the steel tube outer wall, marked by R (rosette), shown in Figure 3b. Two symmetrically placed displacement transducers (DTs) were used to measure the axial deformations (shortening) of specimens, as shown in Figure 3. Readings from all instruments were automatically recorded during the loading process. In all tested columns, registering and analysis included: changes in stress and deformation state for all parts of the composite cross-section, ultimate strength, shape of global deformation in failure, engagement of the individual parts of the composite cross-section. In RC models, besides ultimate force and deformation, registering included: the value of the force at which cracking of concrete started, fracture development, and propagation. In this research, the emphasis was made on short-term loading, and the long-term effects, such as creep and shrinkage of the concrete or temperature changes, were not considered.
All tests were performed on a 2000 kN capacity hydraulic testing press. The specimen was placed on the rigid steel bed of the machine, and the load was applied from the bottom of the specimen. Figure 3 presents a schematic view of the test arrangements (not to scale). The passive composite column loading method was used, which means that the concentric loads on the specimens were applied over top and bottom steel bearing plates. The bearing plates were 12 by 12 cm so that, on strengthened specimens, only the basic RC column was directly loaded. In that way, simulation of a real structure was possible, since, in a real strengthened column, a beam administers load only to an existing (basic) column.
Every specimen was loaded continuously until failure. A force control technique was used to operate the hydraulic press with a load step interval of around one-tenth of the estimated load-bearing capacity. All load steps were maintained for about 5 min. The development of deformations, the failure mode, and the capacity load of the specimens were recorded. Loading was terminated when the applied axial force dropped below 20% of the peak value or when the weld failure of the steel tube happened. Figure 4 shows the column specimen of each group just before experimental testing.

3. Experimental Results and Specimen Behavior

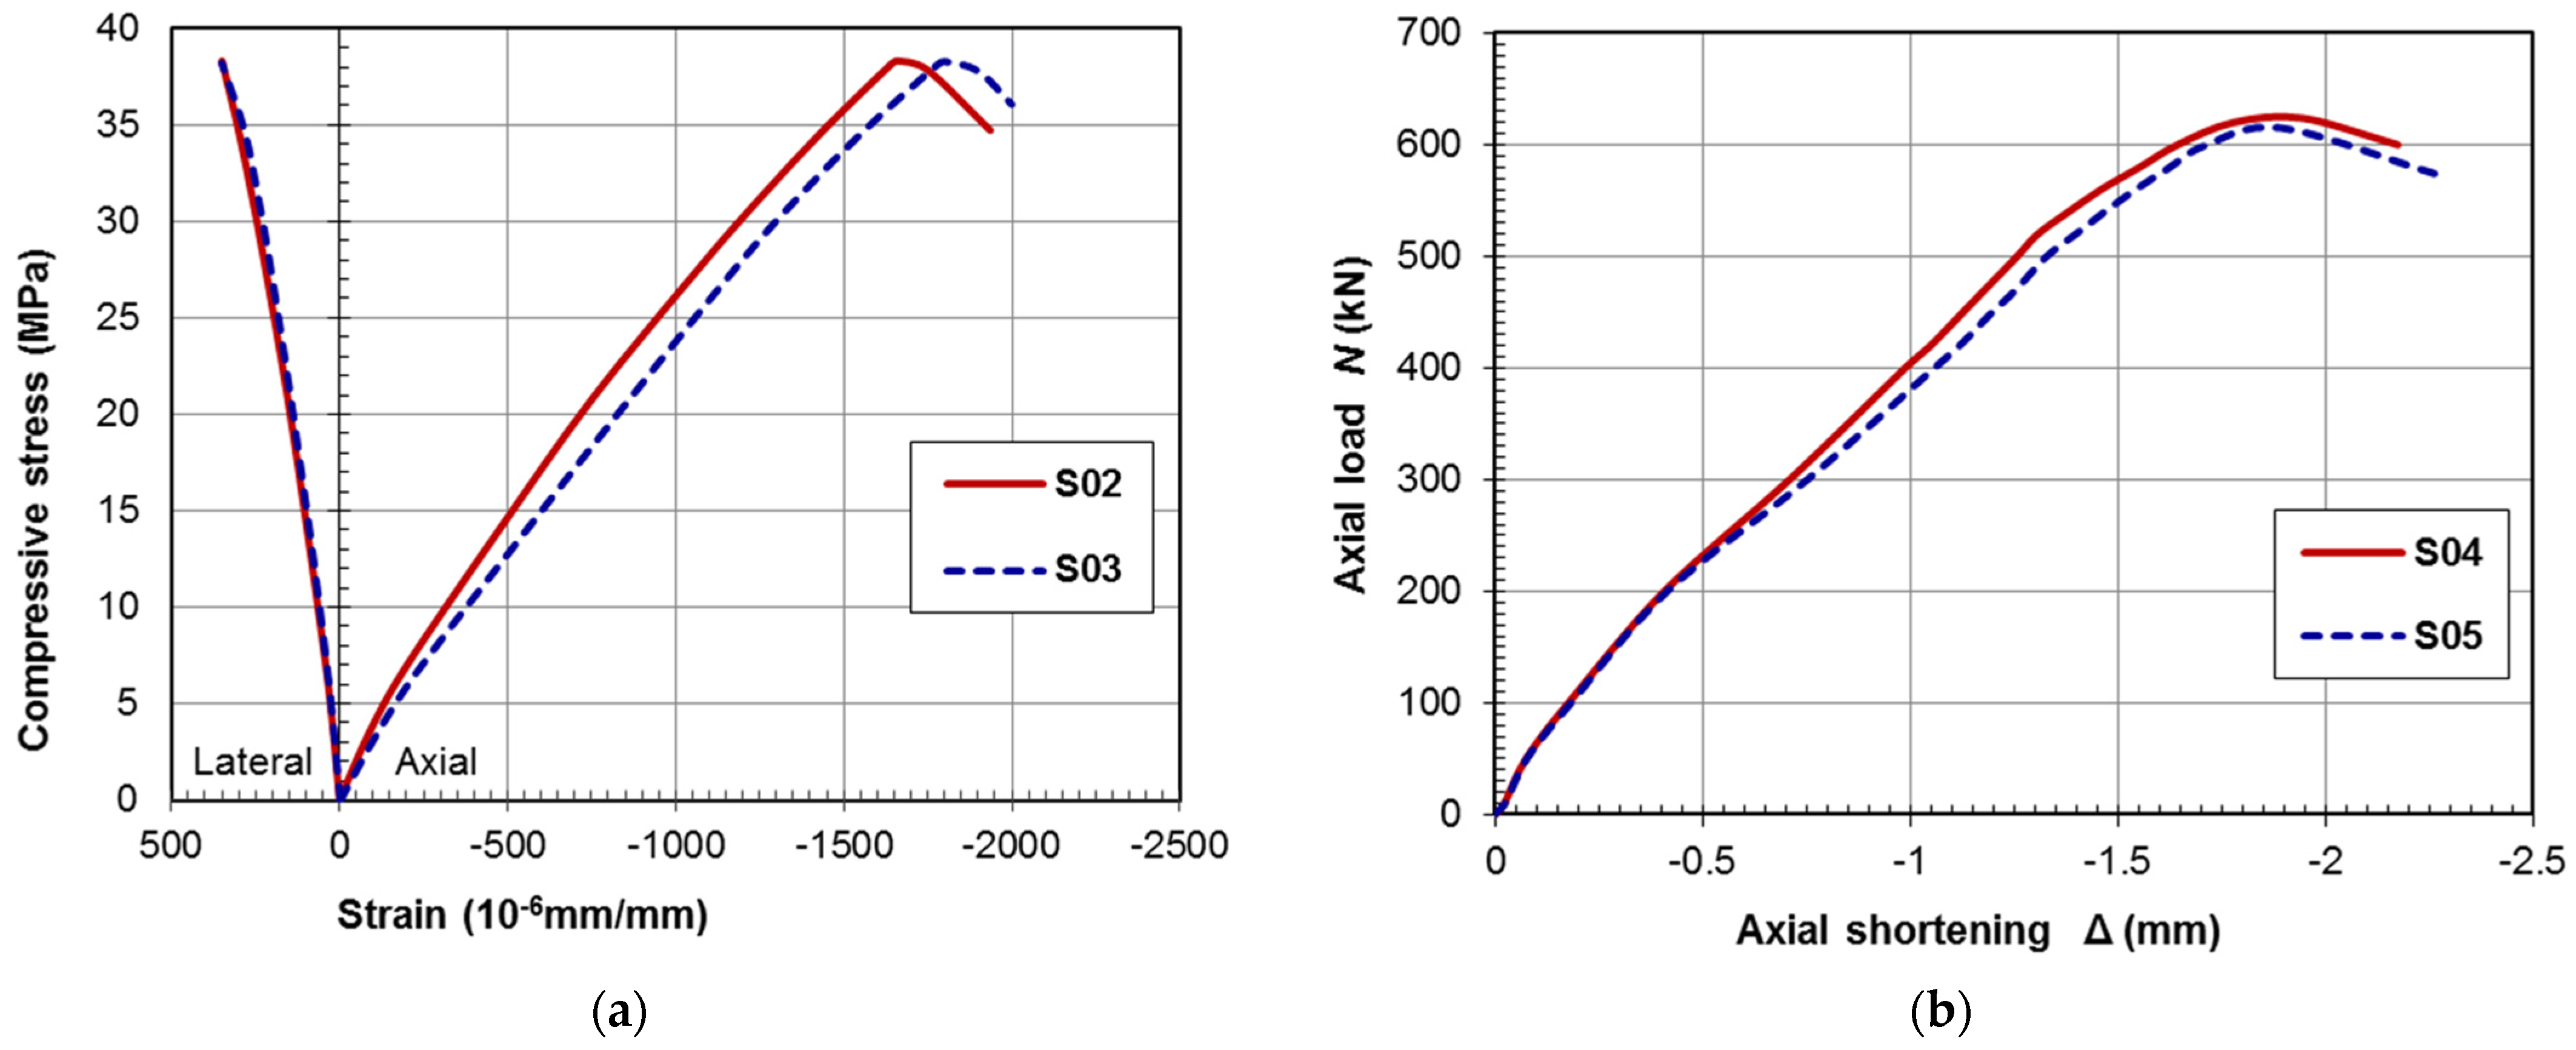
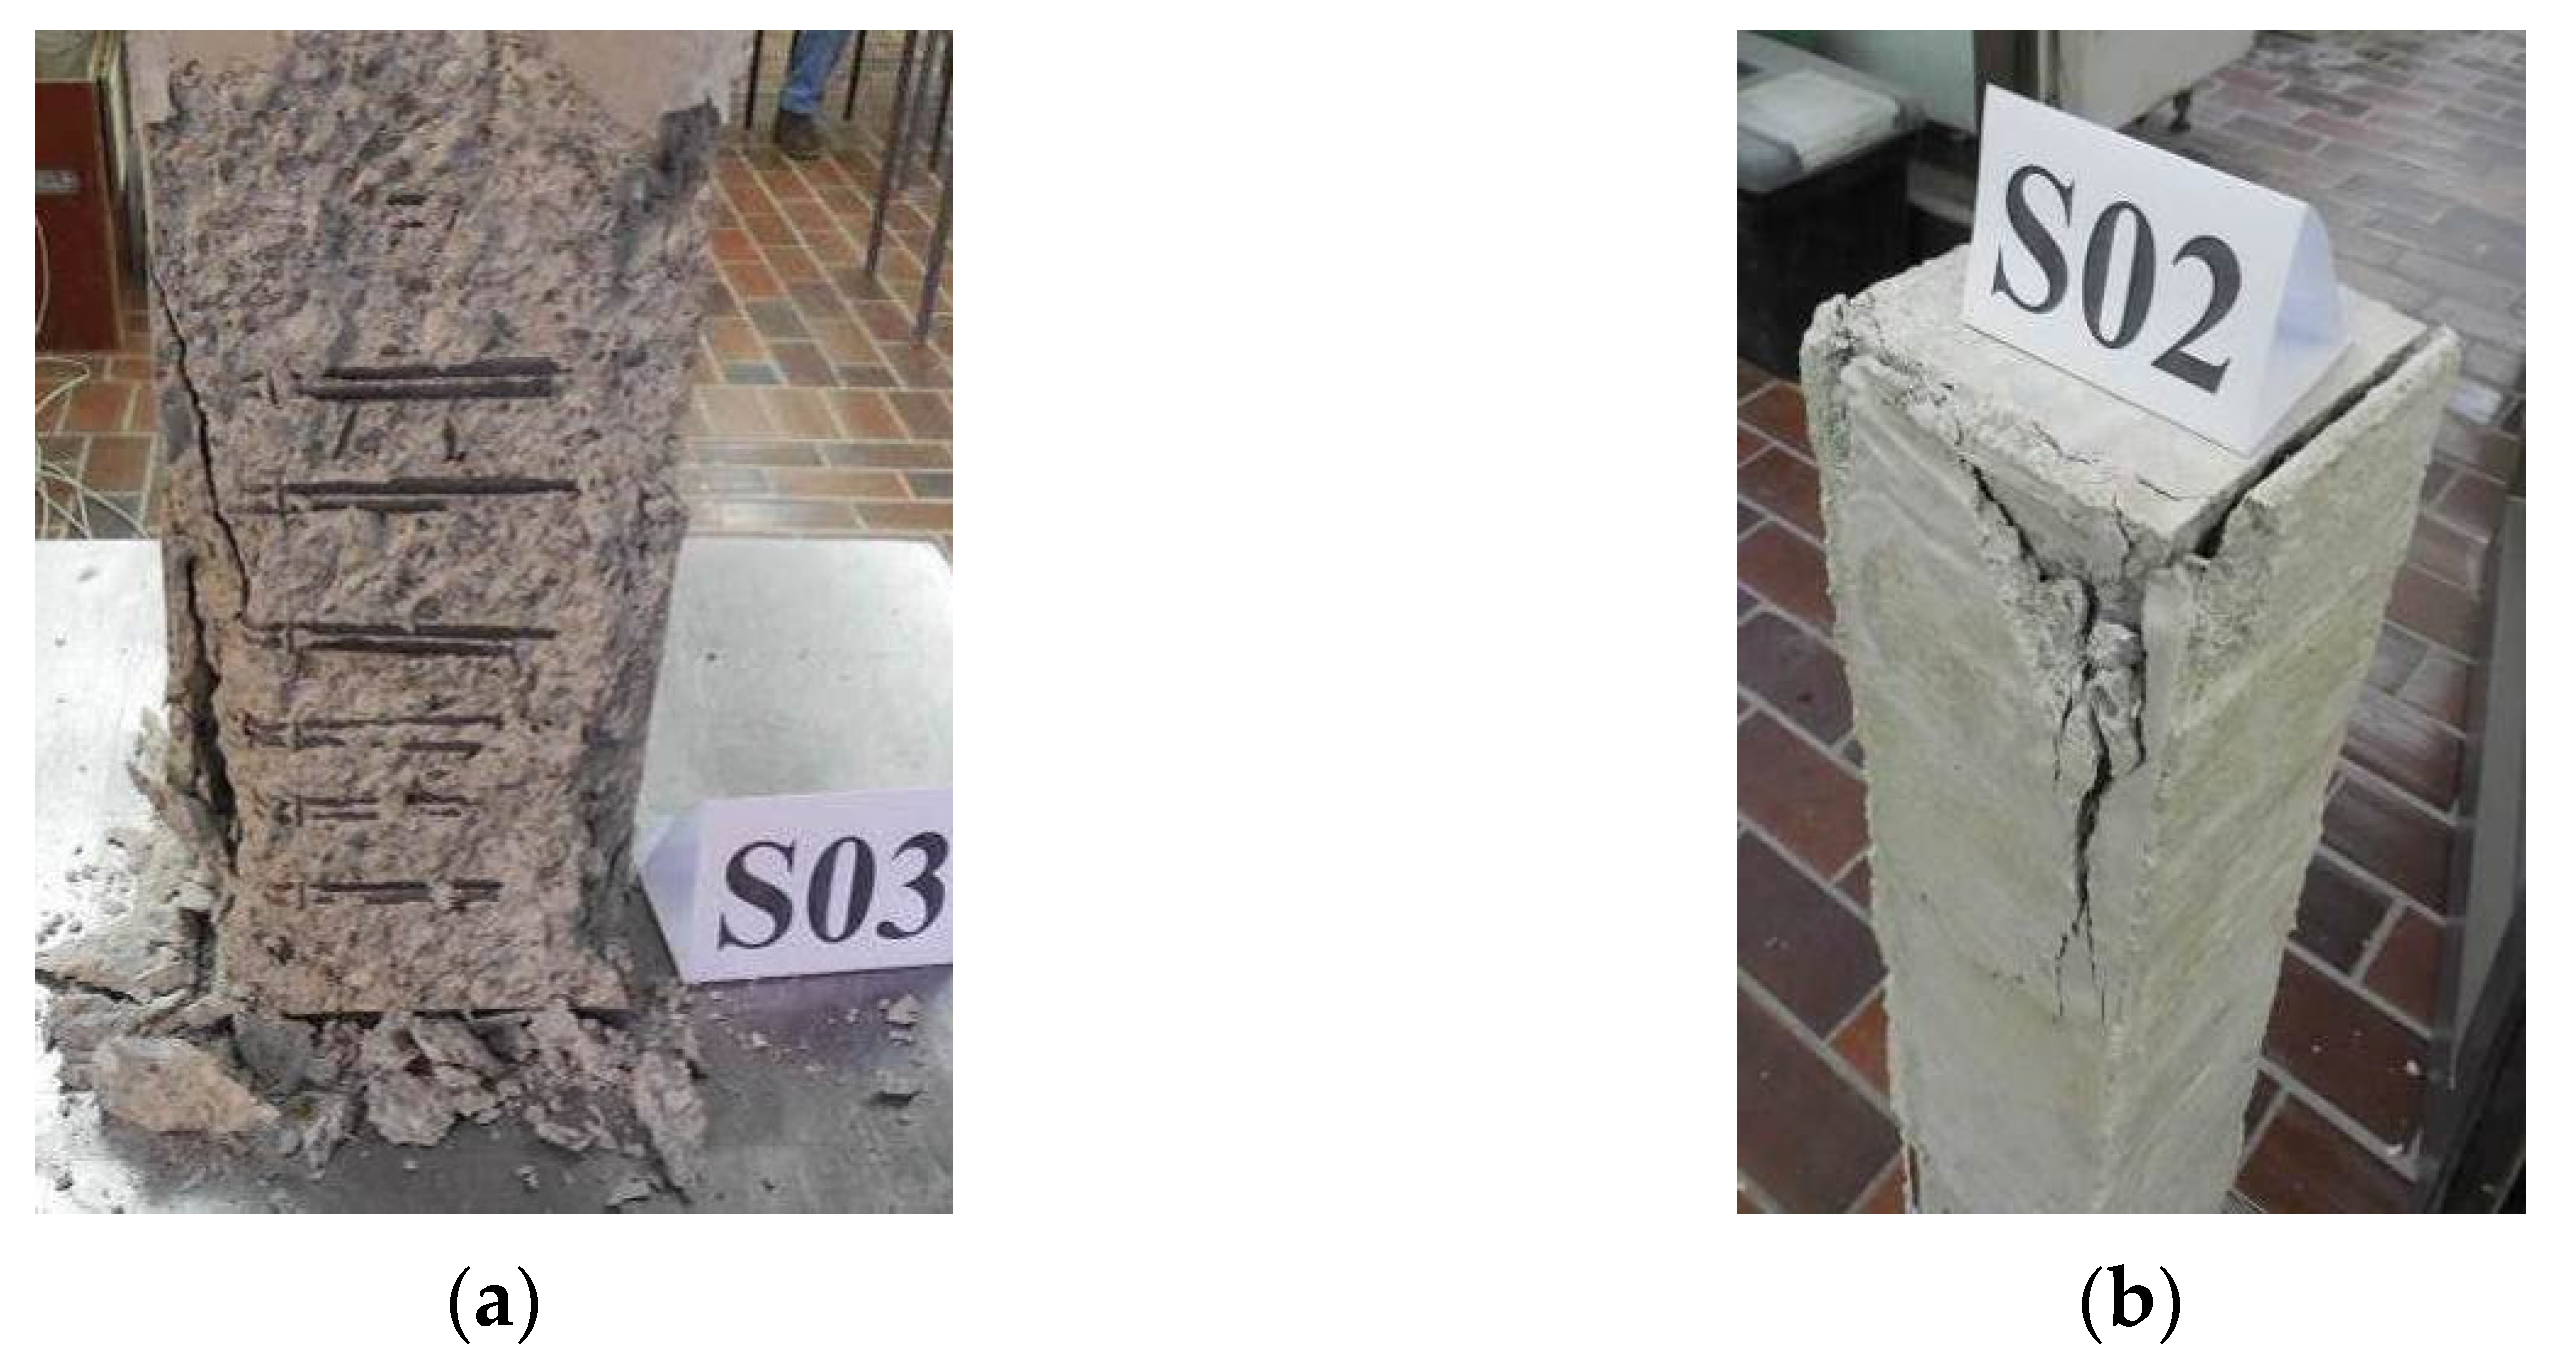
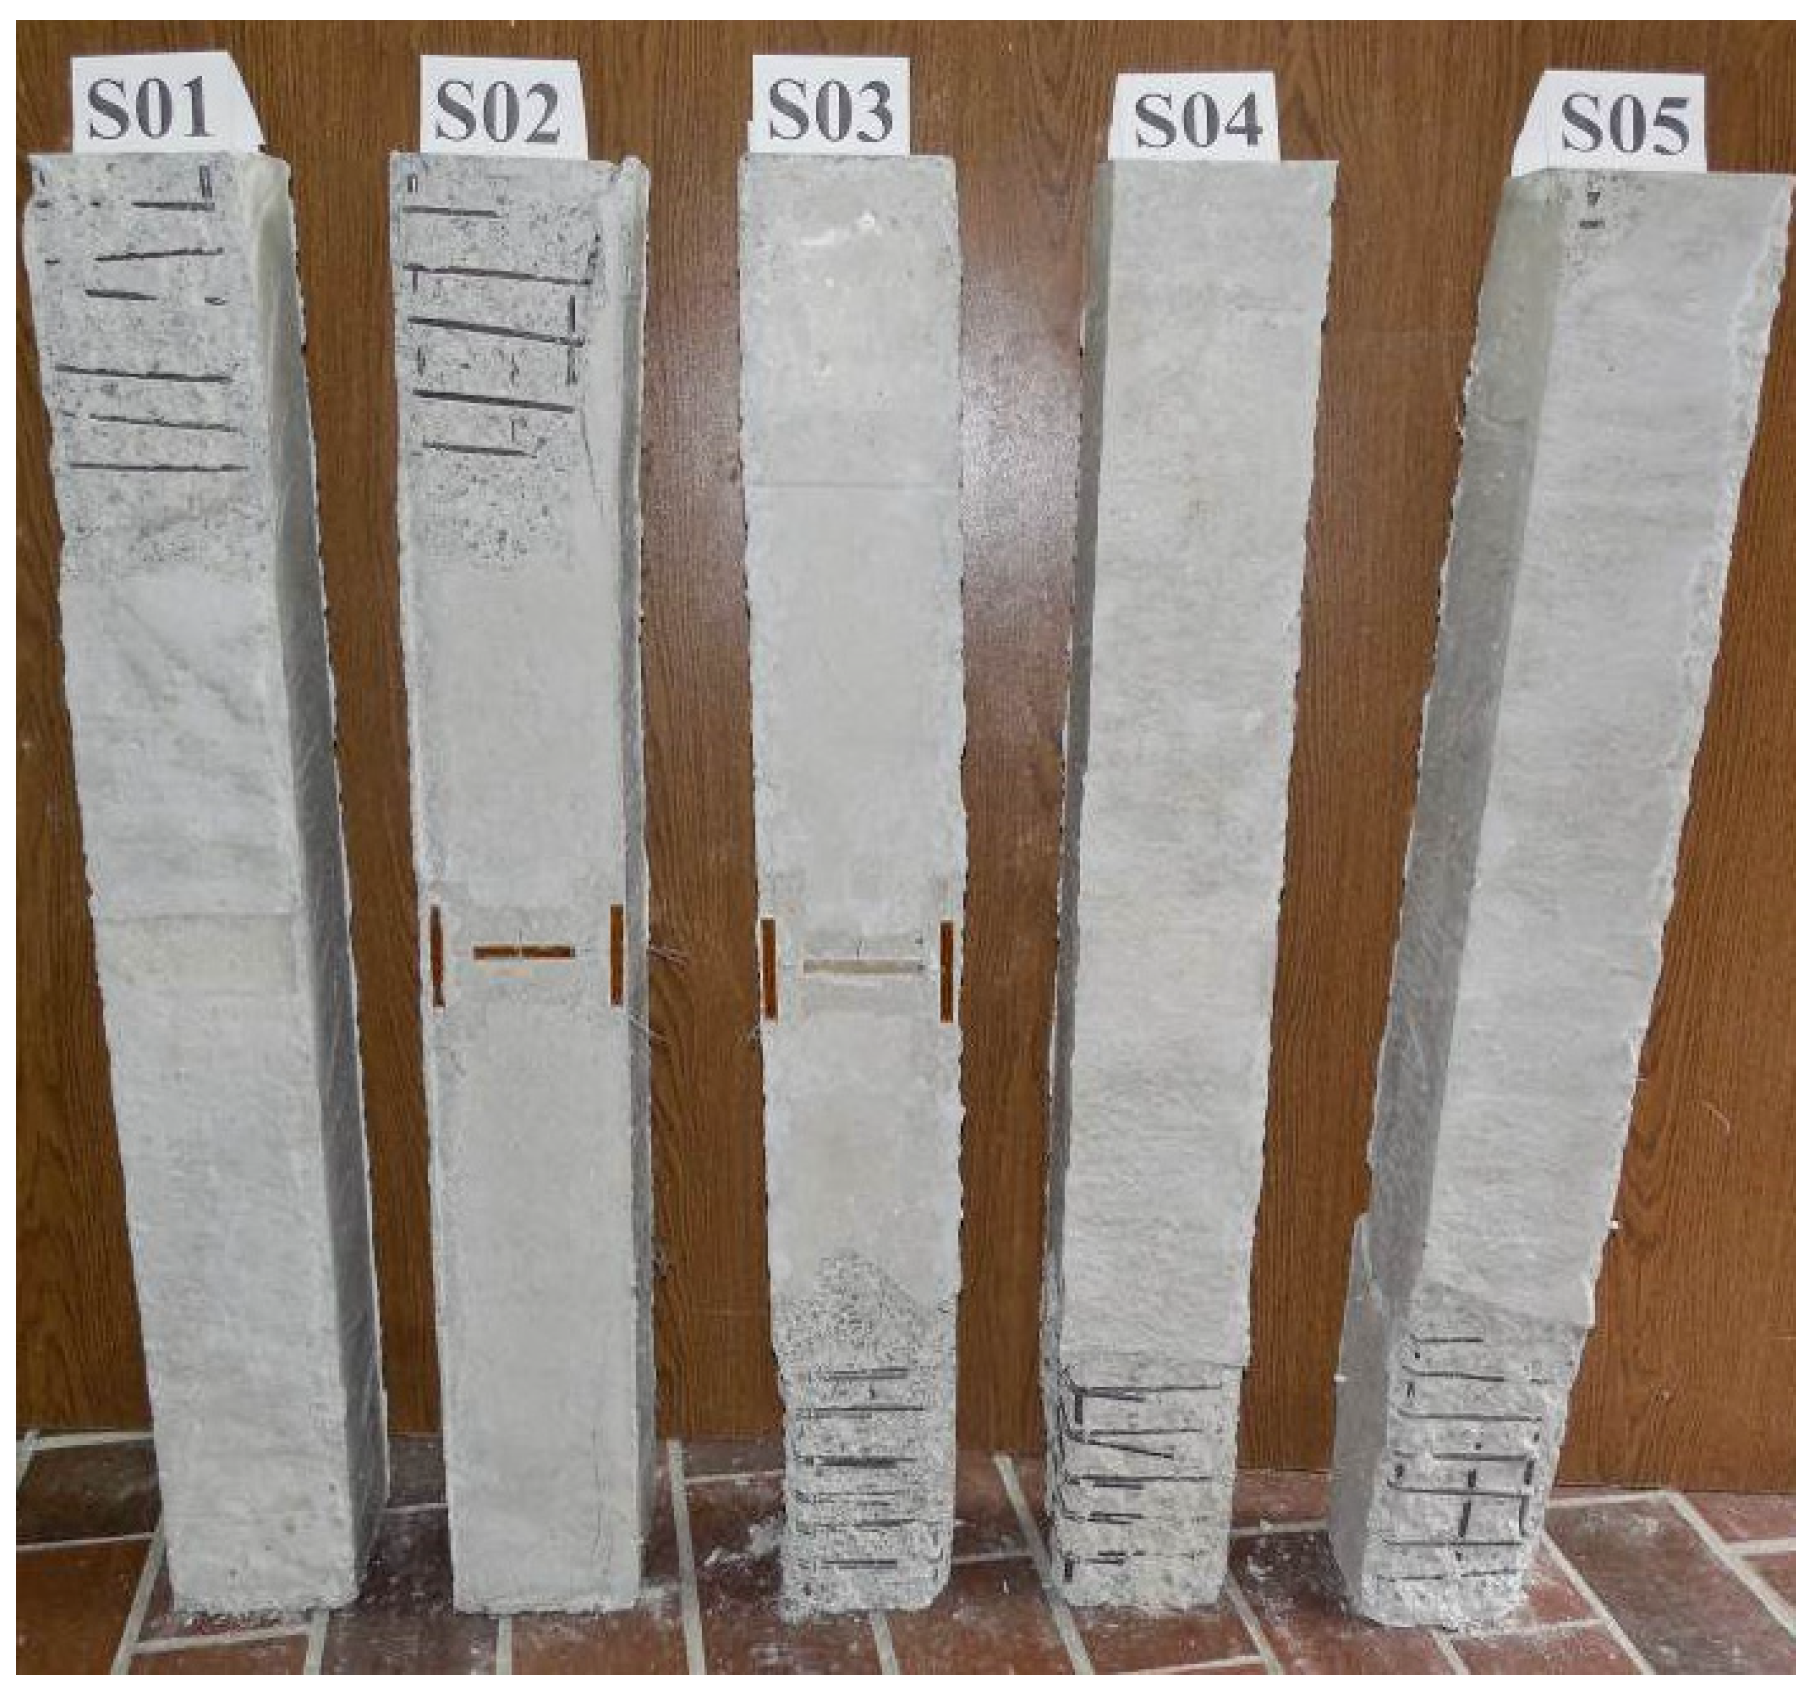
3.1. Columns without Strengthening

For the purpose of comparisons of the results, five axially loaded, plain reinforced concrete specimens were also tested. All columns of this group showed very similar behavior. The diagrams in Figure 5 show the measured load versus strains and load versus displacement curves. Analyzing the diagram from Figure 5a, it can be noticed that column models showed almost linear behavior throughout the entire loading process up until failure. Registered behavior is typical for axially compressed columns made from high-strength concrete, and it shows that their stress–strain diagram is an almost straight line up to the ultimate strength. The longitudinal strains in concrete at failure were between 1.9‰ and 2.1‰.
For the plain RC specimens, first longitudinal cracks were detected at the ends of columns at loading around 90% of the ultimate force. At that load level, lateral strains in concrete were in axial tension limit value of 0.25‰. Failure of the plain RC specimens was a result of the crack development and splitting of the concrete near the location of force application, as can be seen in Figure 6a,b. The cracks passed through the aggregate and cement in the zones of high stresses close to the steel bearing plates. Splitting cracks were not detected under the steel loading plate because of the frictional confinement. Under the steel bearing plate, an inverse pyramid was formed, and the column failed. Cracking on all specimens started at both ends of the column, but pronounced crack development and loss of cross-section due to concrete splitting and breaking in failure were registered only at one end, as seen in Figure 7. The ultimate load forces of columns from the control group registered during experimental testing are presented in Table 1, while the mean value of registered forces is given in Table 4.

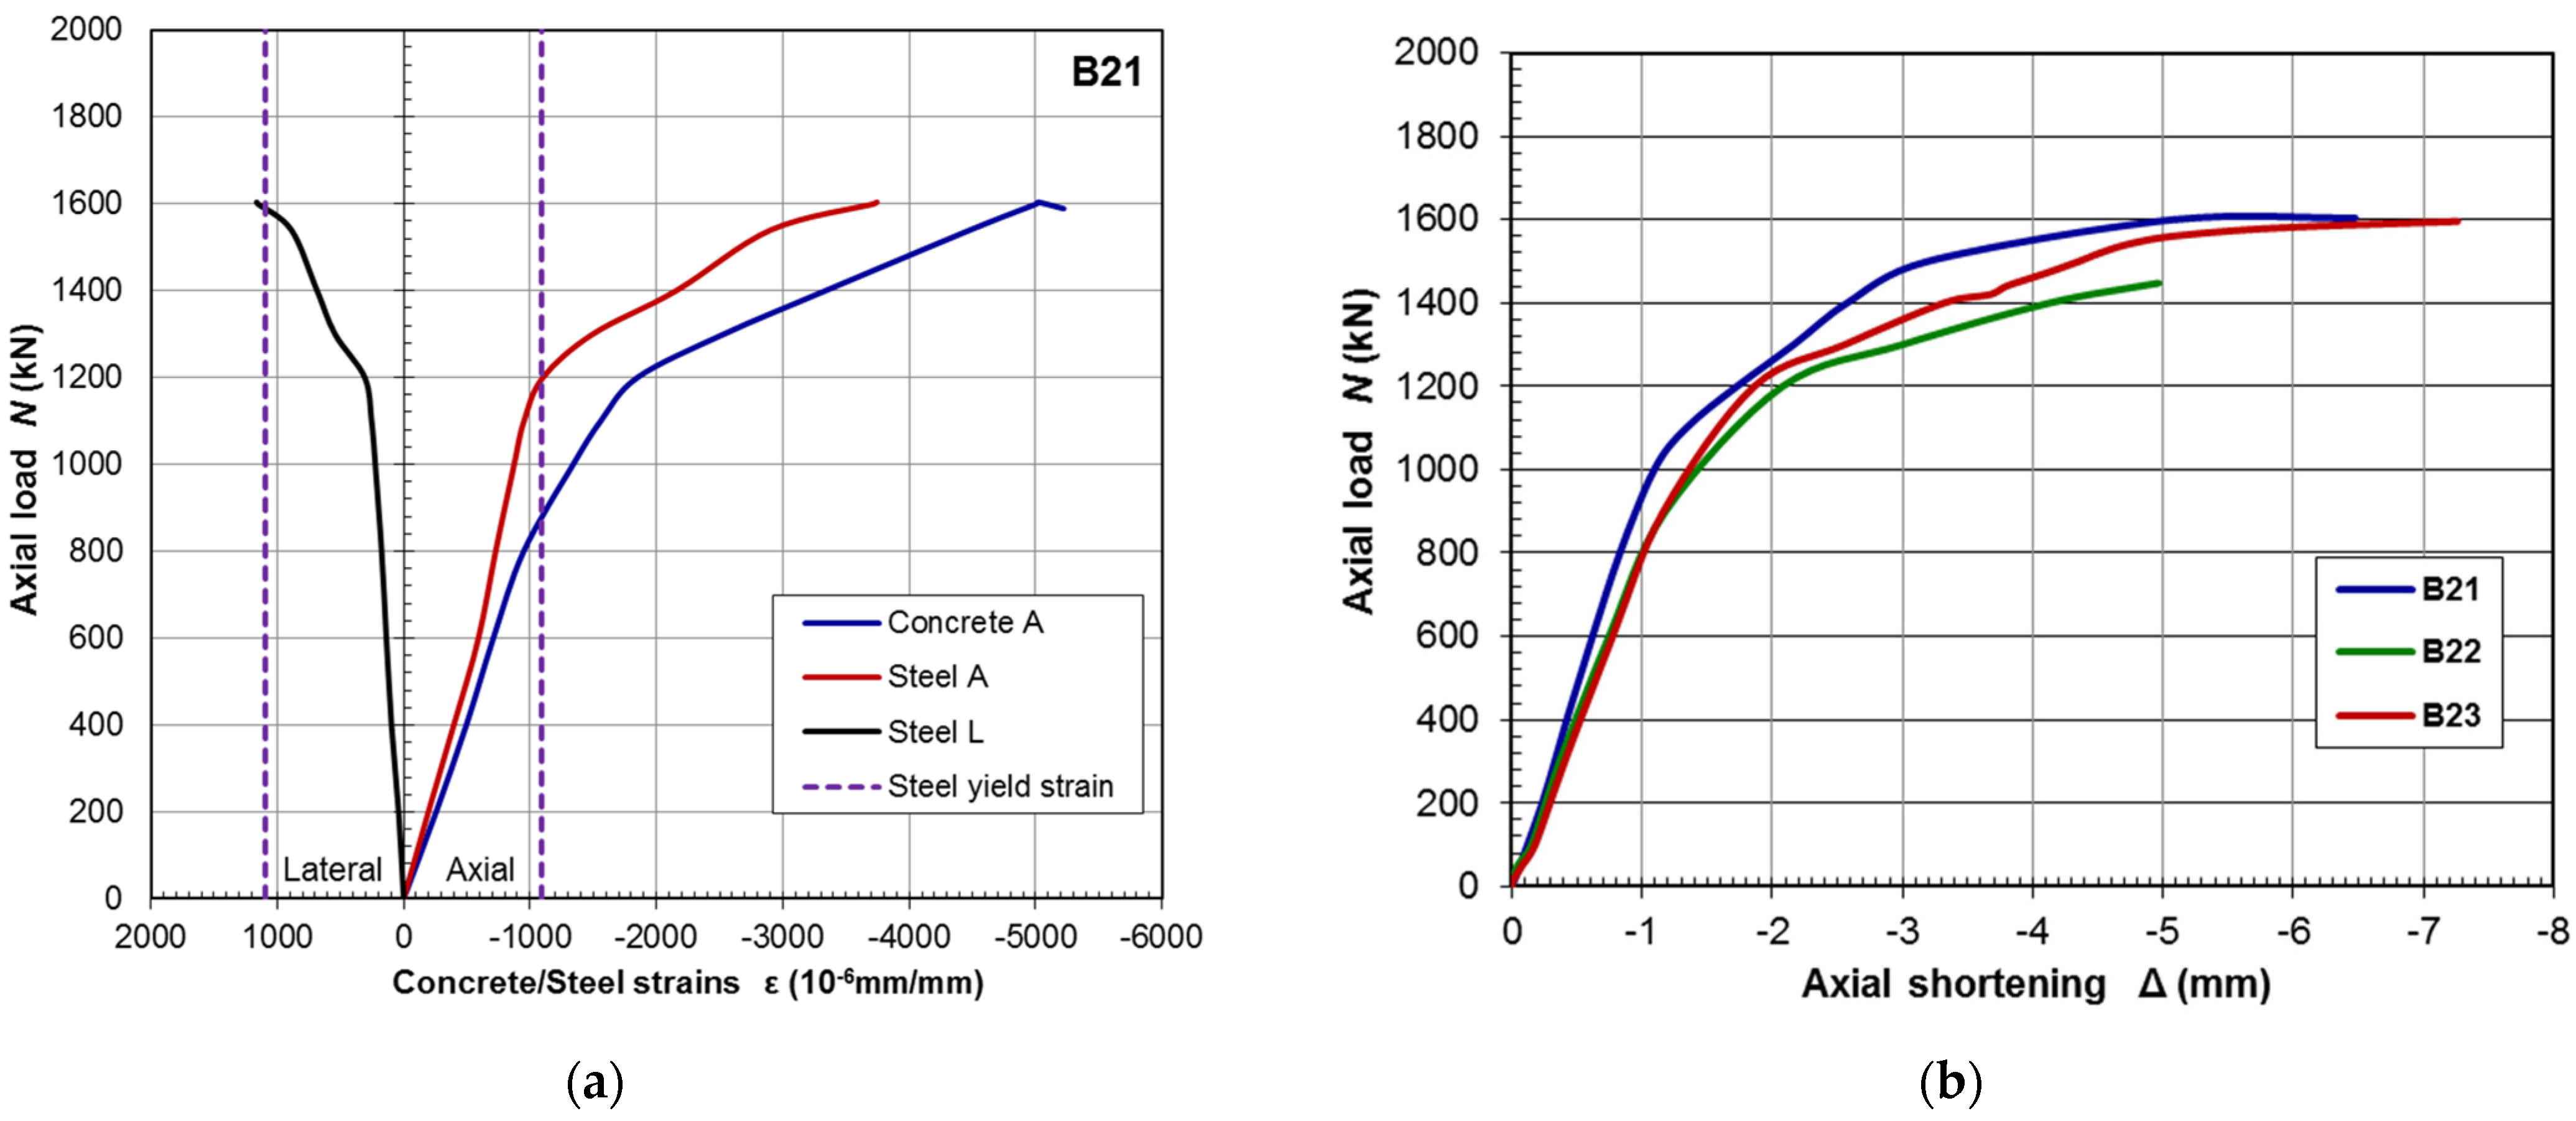
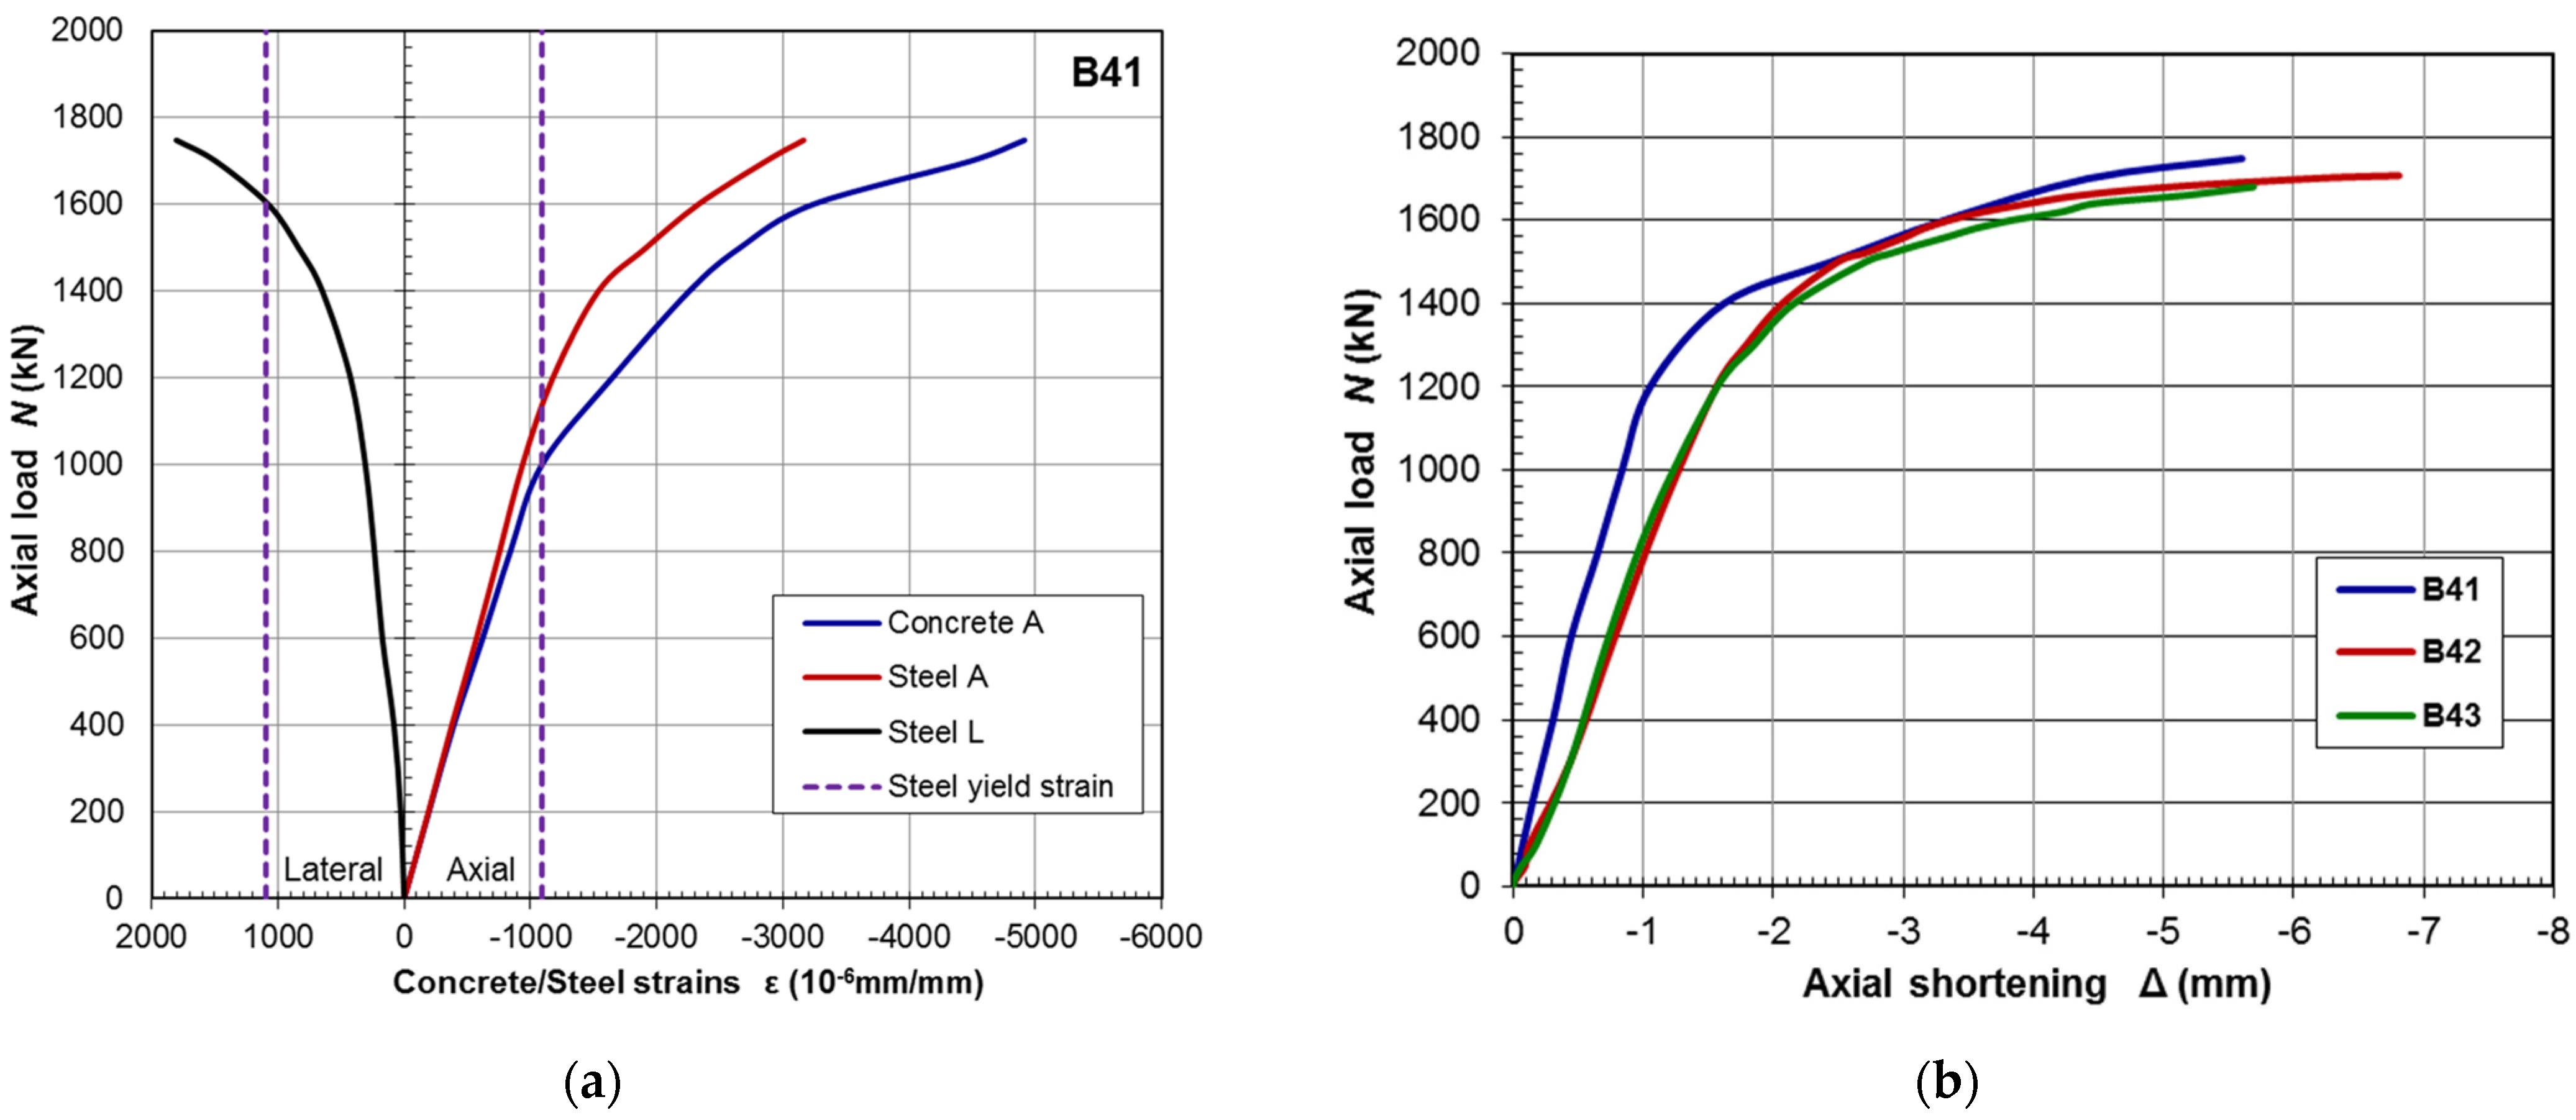
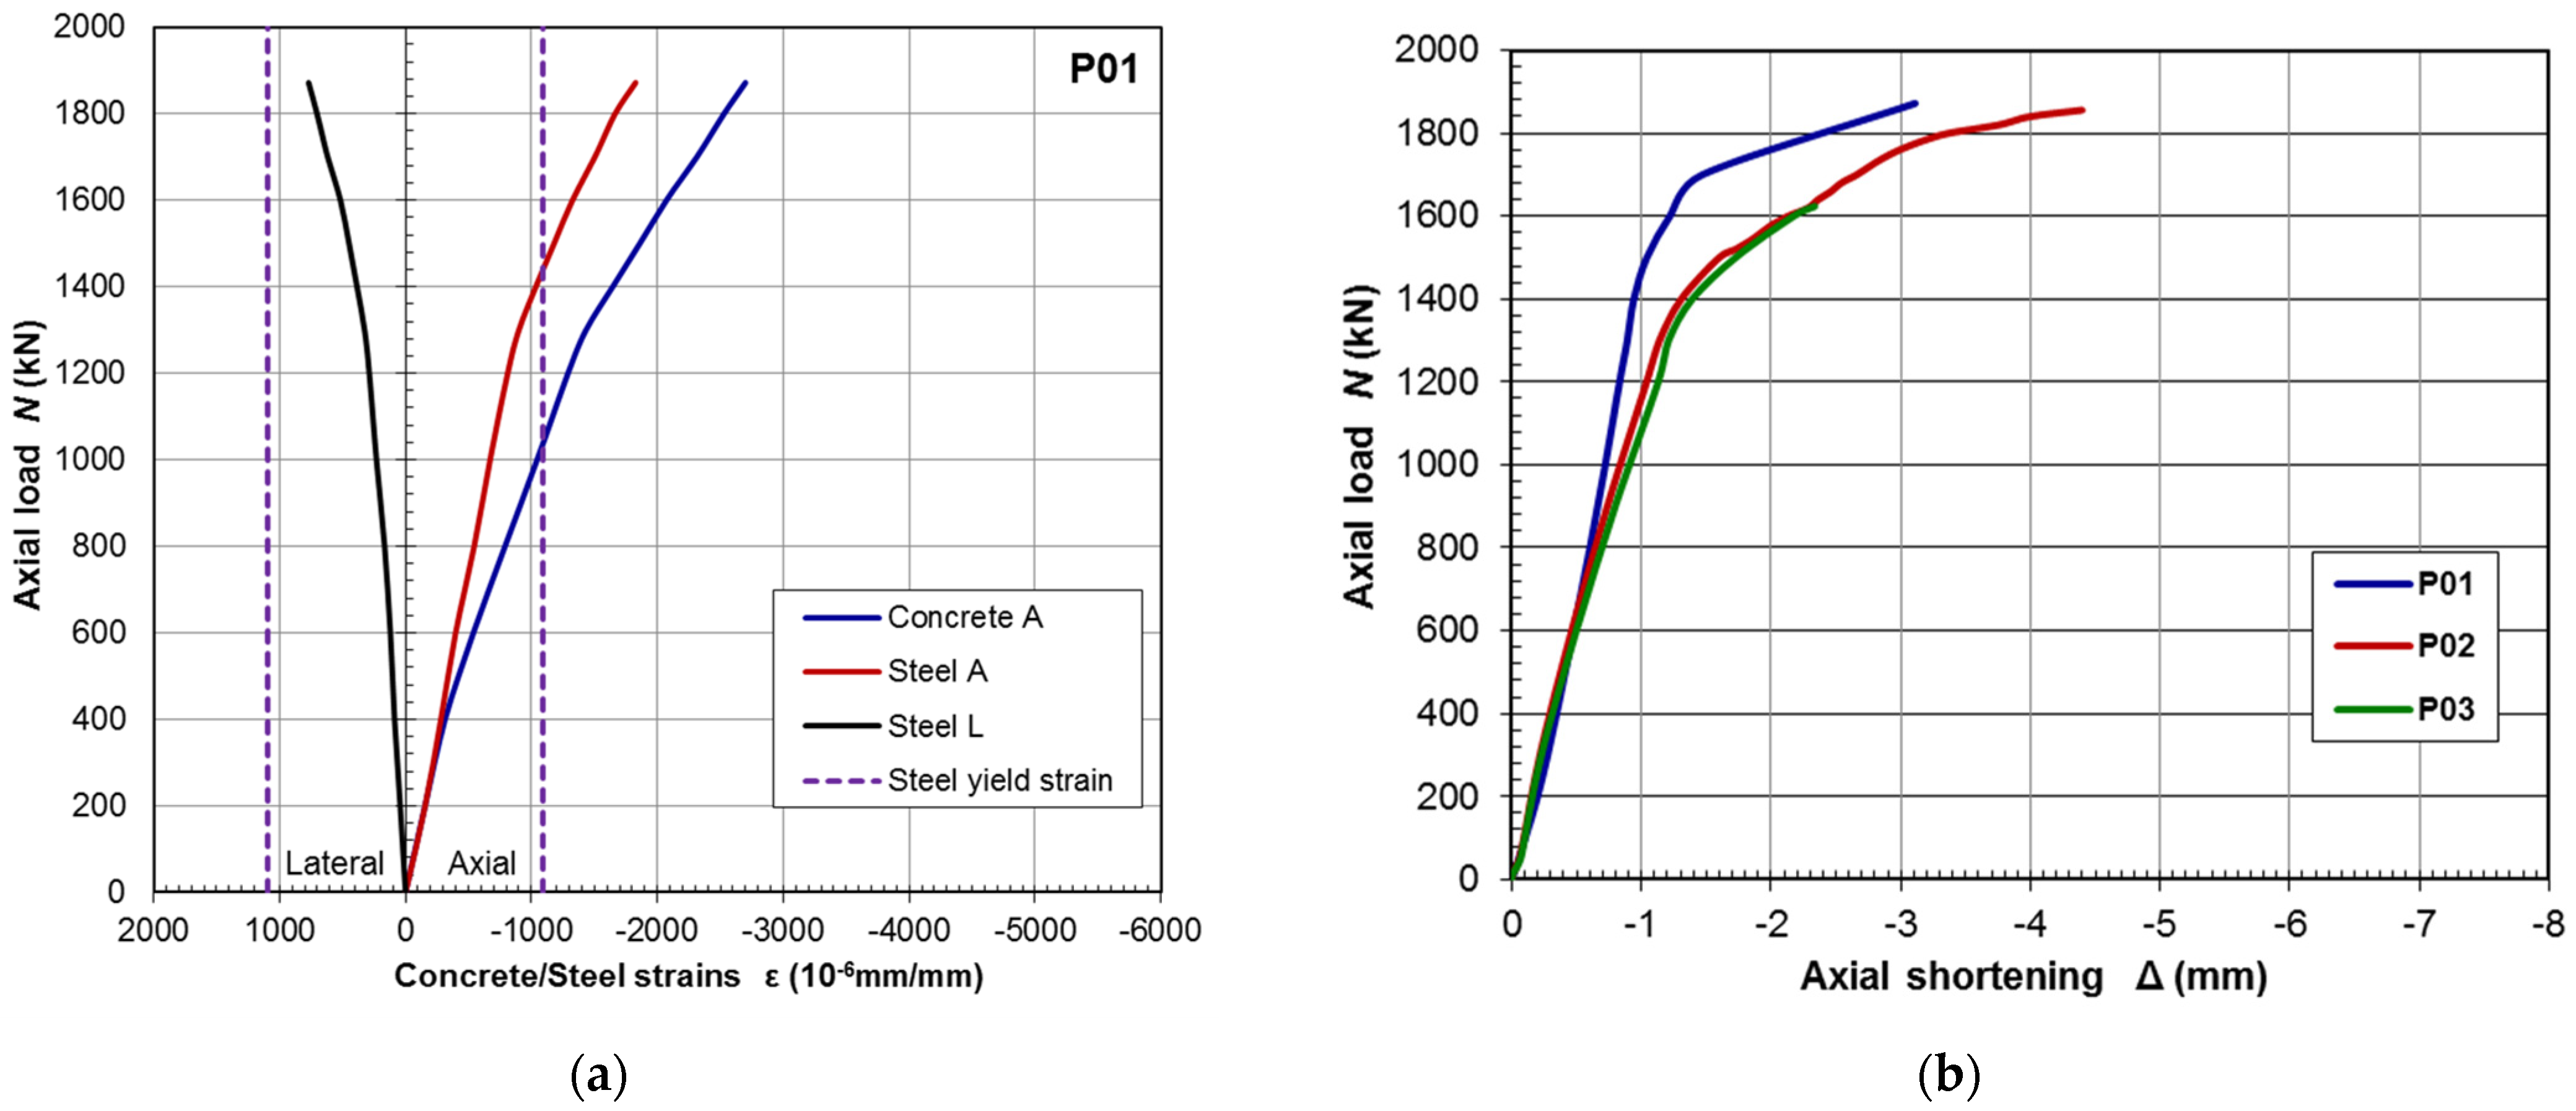
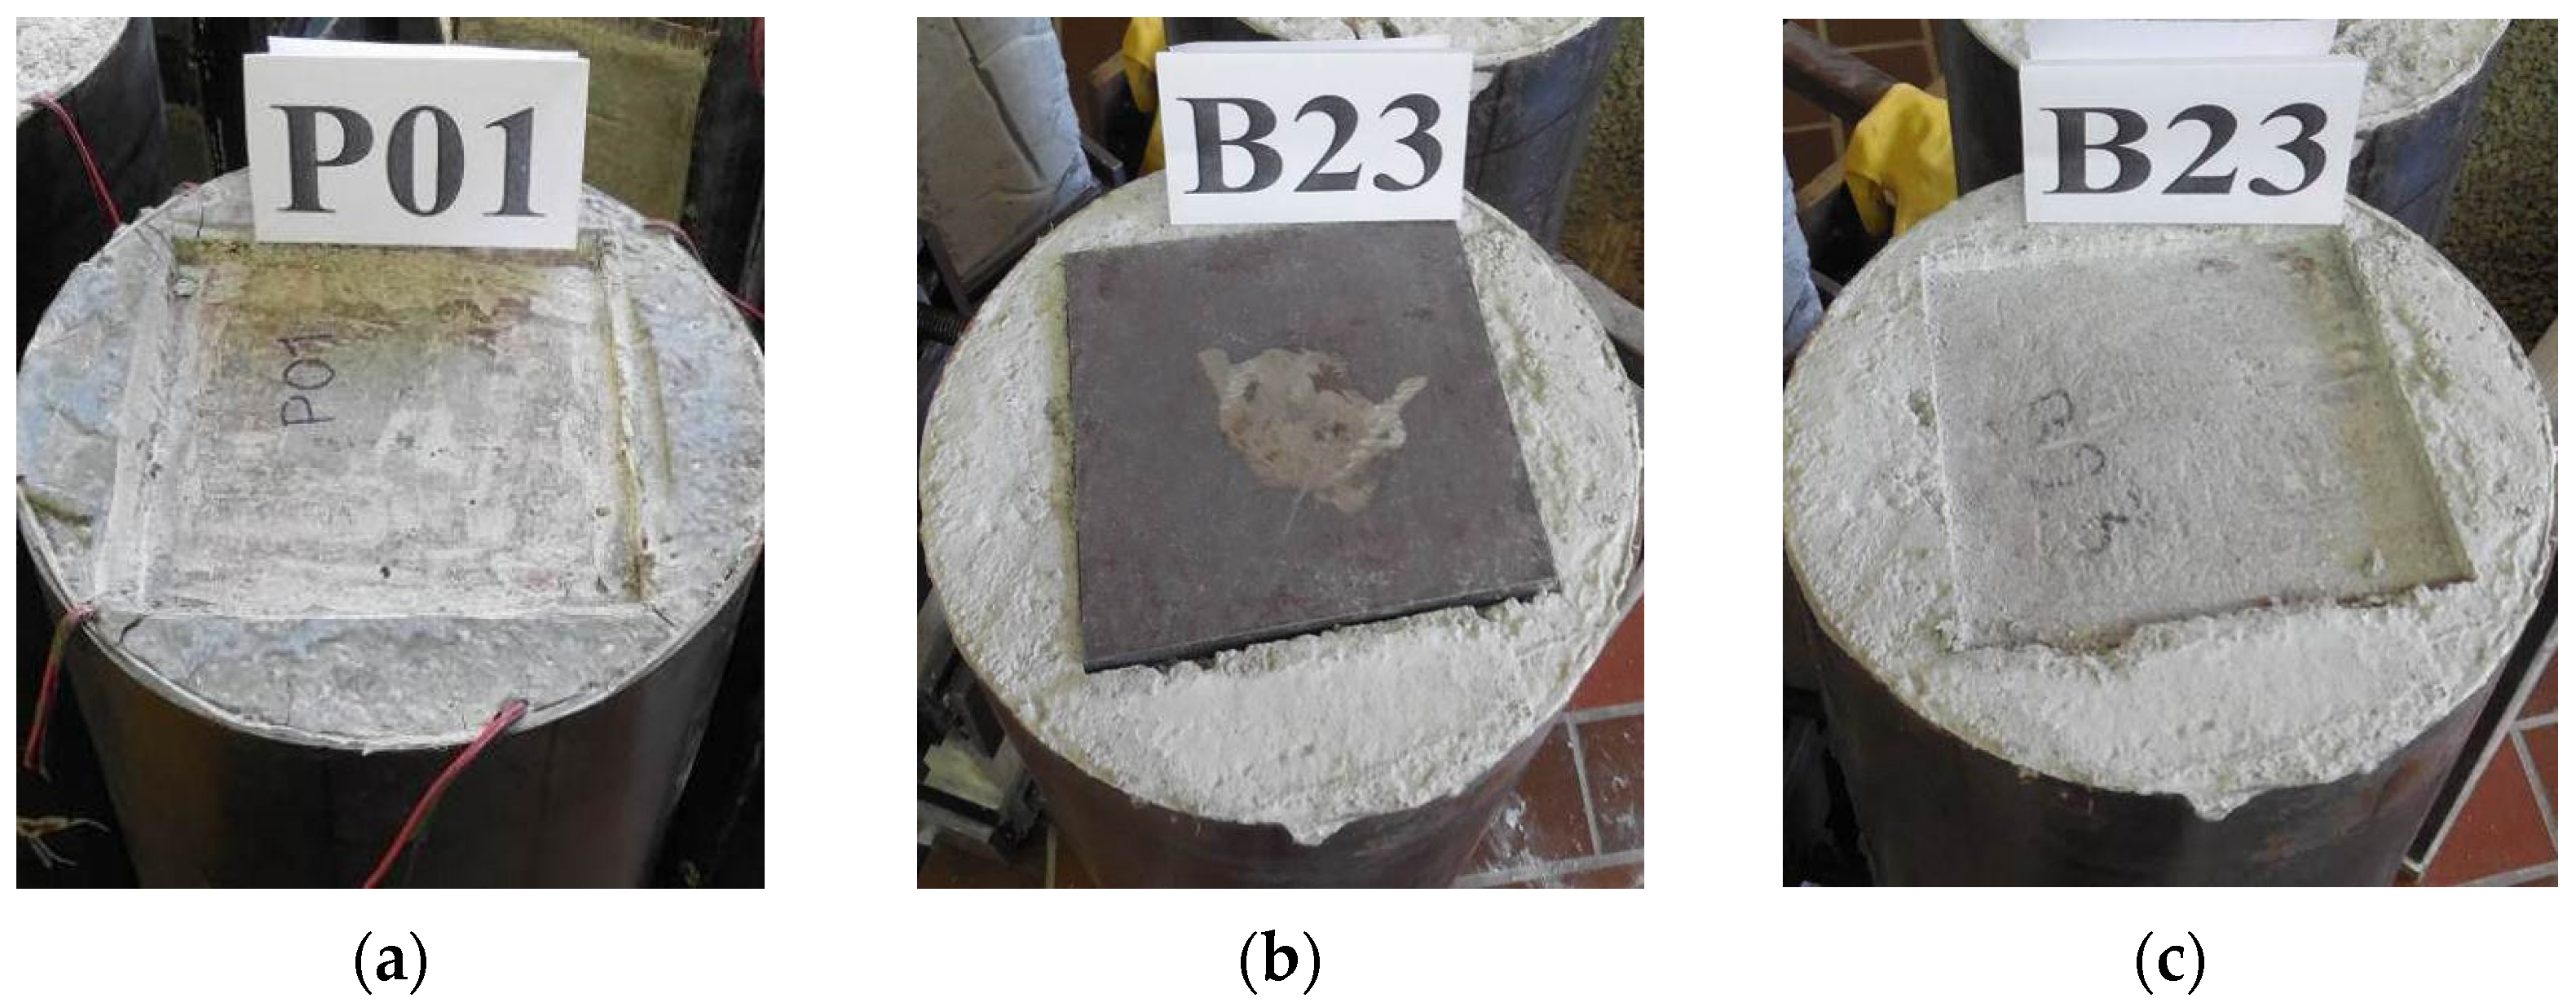
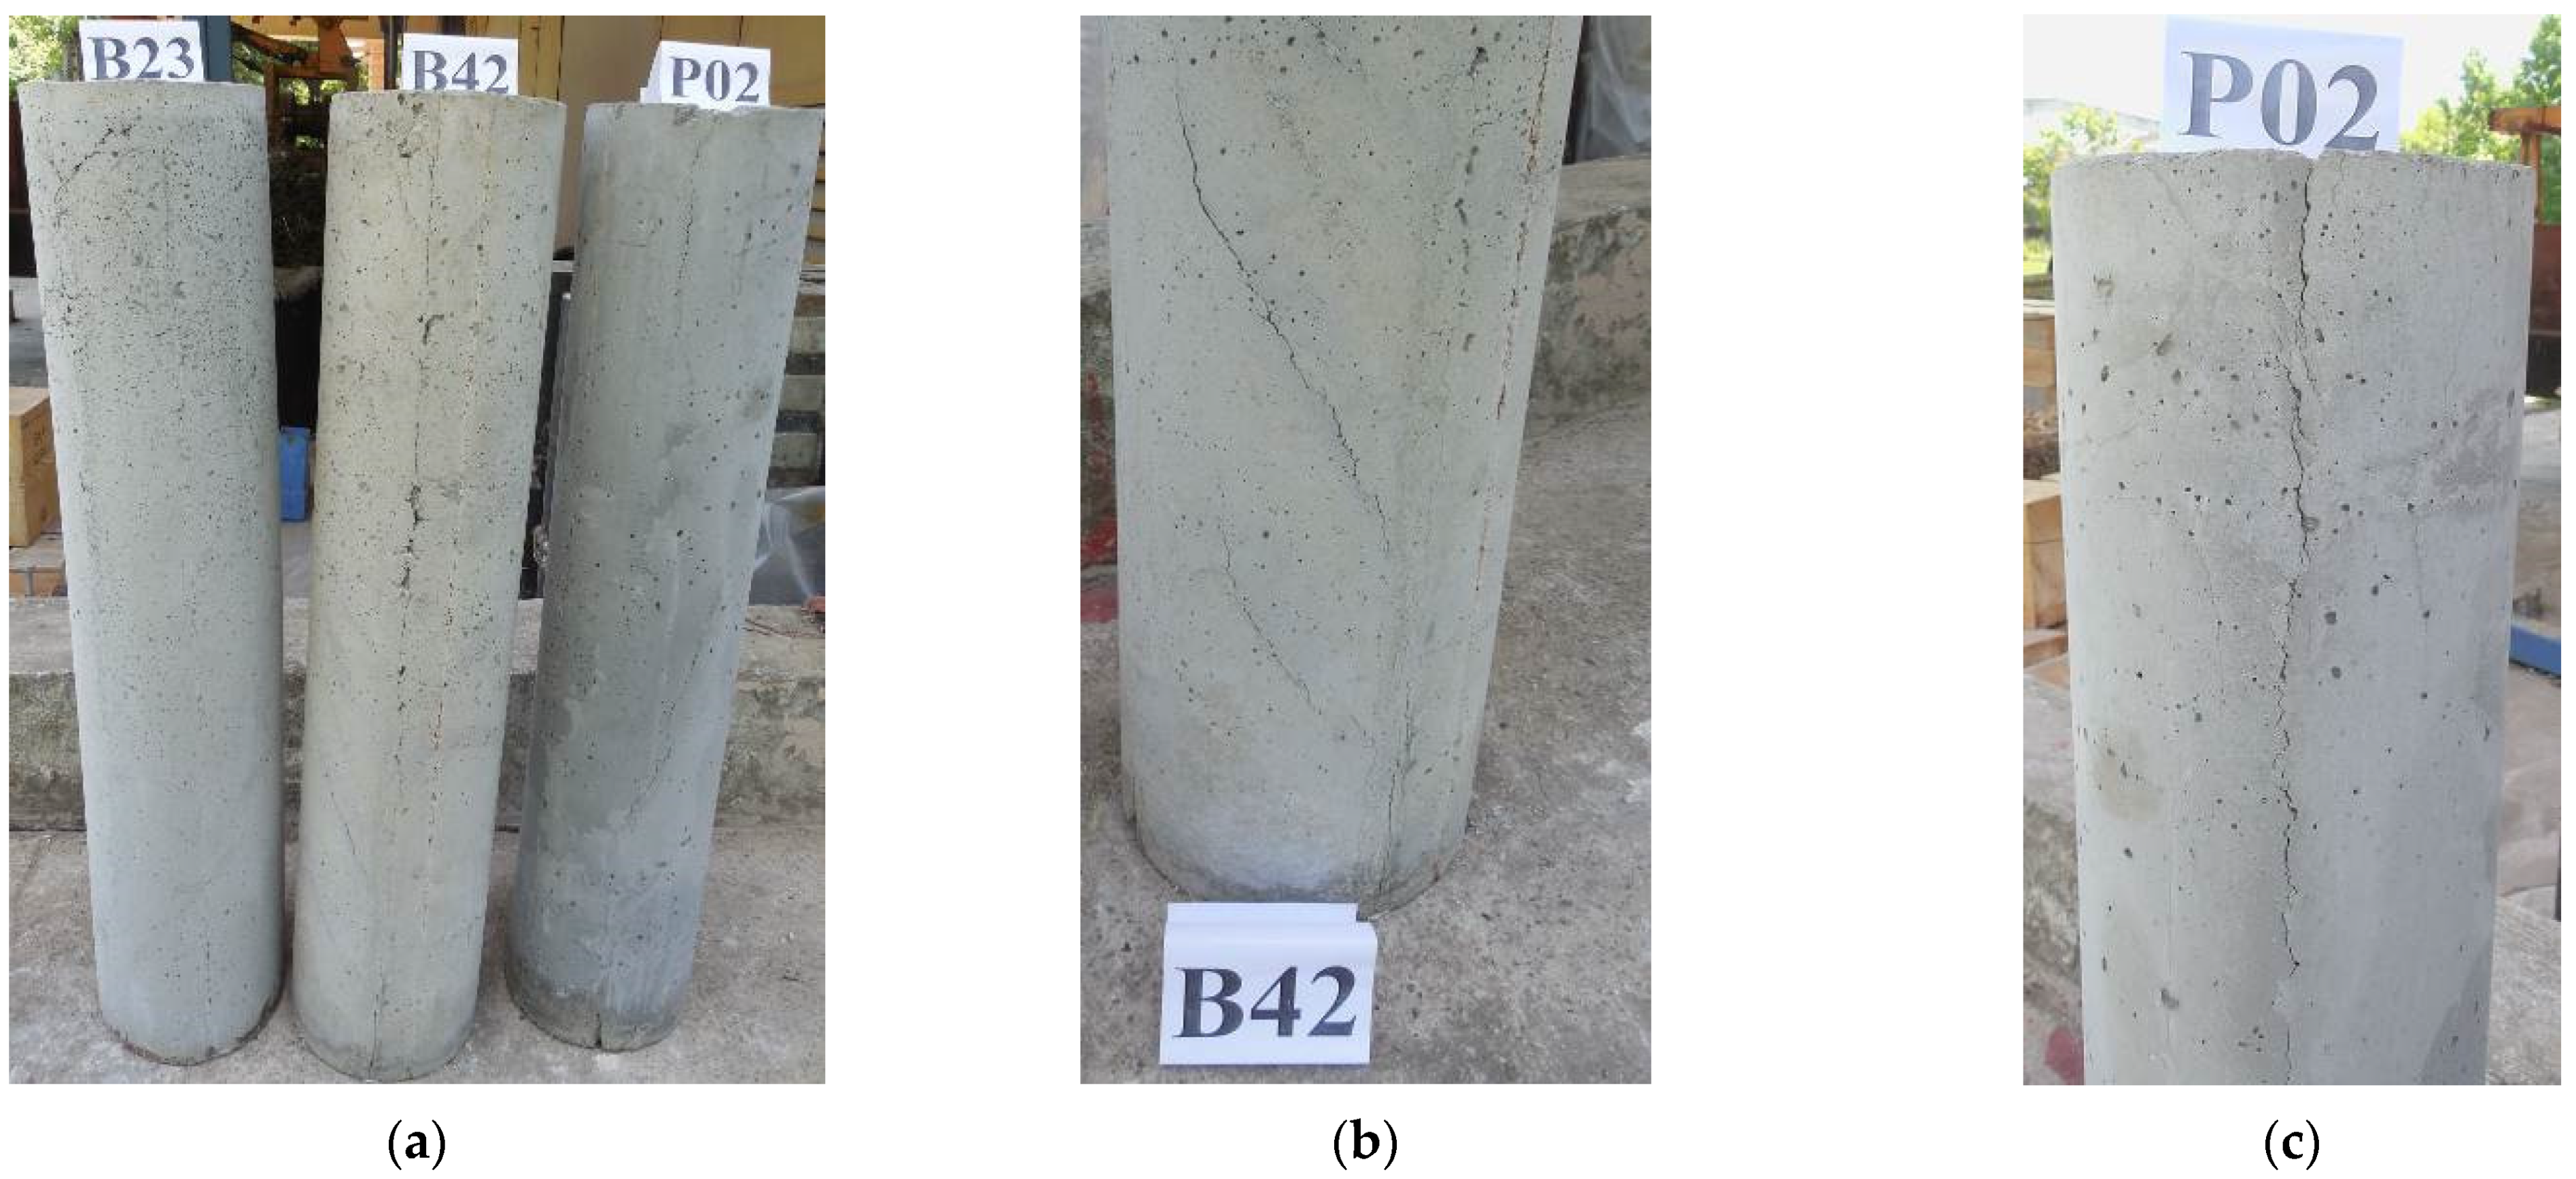
3.2. Strengthened Columns

Testing of all strengthened models has been conducted according to similar experiment program phases for control group models to ensure that results could be directly compared. In that way, a direct assessment of the success of the method for strengthening RC columns with a steel tube jacket was possible. In addition, it was possible to cross-compare strengthened models, so the influence of different quality of fill concrete was evaluated. Figure 8, Figure 9 and Figure 10 show a diagram of the dependence of compression axial force to the longitudinal and to the lateral strains, and diagrams of force to axial shortening for strengthened specimens are presented. The labels Concrete A, Steel A, and Steel L on diagrams mark the directions of main strains on the vertical column. Notation A means axial, and L means lateral. The steel yield strain limits (εy) are also shown.
From the presented diagrams, it can be seen that, in the domain of exploitation loads or for forces up to 50% of crushing load, the behavior of all parts of the composite cross-section is linear. Pronounced nonlinear increase of deformations in relation to increasing of the loading was registered for forces above 80% of the crushing load. From diagrams, it can also be noticed that longitudinal strains on the steel tube (Steel A) and on the RC column (Concrete A) are equal for forces from 25% to 40% of ultimate force, and therefore, the full composite action is preserved in that load range. At higher stress states, different values of strains in concrete and steel yielded a conclusion that some slippage between parts of the composite cross-section parts had occurred.
All strengthened specimens showed similar behavior; therefore, for one of them, the characteristic states are presented in Figure 11. It can be observed that the stress–strain curves showed a linear increase of deformations from the beginning of loading until the steel yielding started. Axial strains in strengthened specimens reached the steel yield strain before the specimen attained its ultimate strength, which indicates that the steel strength was fully utilized. The elastic steel limit was reached at around 1 mm of specimen shortening. That state was marked with point A. Further increase of the load caused stretching of the steel jacket, which had a consequence on the bonds between the steel tube, the concrete fill, and the basic RC column. Subsequently, the steel jacket could not provide efficient confinement to the fill concrete, which resulted in the crushing of the basic RC column, and the load-bearing steel plates started to push down into the concrete. When the load-bearing plates were fully embedded in the concrete, the top and bottom hydraulic press steel plates came into contact with the specimen. At that time, the load was applied to the column’s full cross-section, which is marked with point B. The ultimate load on the specimen is marked with point C. After the load was applied to the whole cross-section, the specimen was only able to take a relatively small increase of the force and had great development of deformation, before reaching its ultimate load (range from point B to point C).
Figure 12 shows the end plane of strengthened specimens. It was found that the steel tubes had some buckling in the outward direction and small cracks in the fill concrete. Cracks were located around the corners of the RC column in the radial direction, as shown in Figure 12a. No cracks were detected in the core RC column. Dissimilar to the crushing failure of plain RC columns, shown in Figure 6a,b, the concrete in strengthened columns can keep its integrity because of the confinement pressure produced by the steel jacket [21]. Therefore, the strengthened column can keep a great part of its load-bearing capacities following the failure of the basic RC column. The confinement of the steel jacket to the fill concrete and onto the RC column is fairly even over the entire height of the specimen, and the entire section of the concrete core is efficiently confined. The embedded bearing plate on top of specimen B23 is shown in Figure 12b.
All strengthened column models after finished testing are presented alongside in Figure 13. Failure of the composite column models was a combination of outward buckling of the steel jacket and concrete crushing due to excess of its compressive strength.
Ultimate load forces of strengthened columns registered during experimental testing are listed in Table 1. It was found that the bearing capacity of strengthened columns increases with the increase of the fill concrete compressive strength.

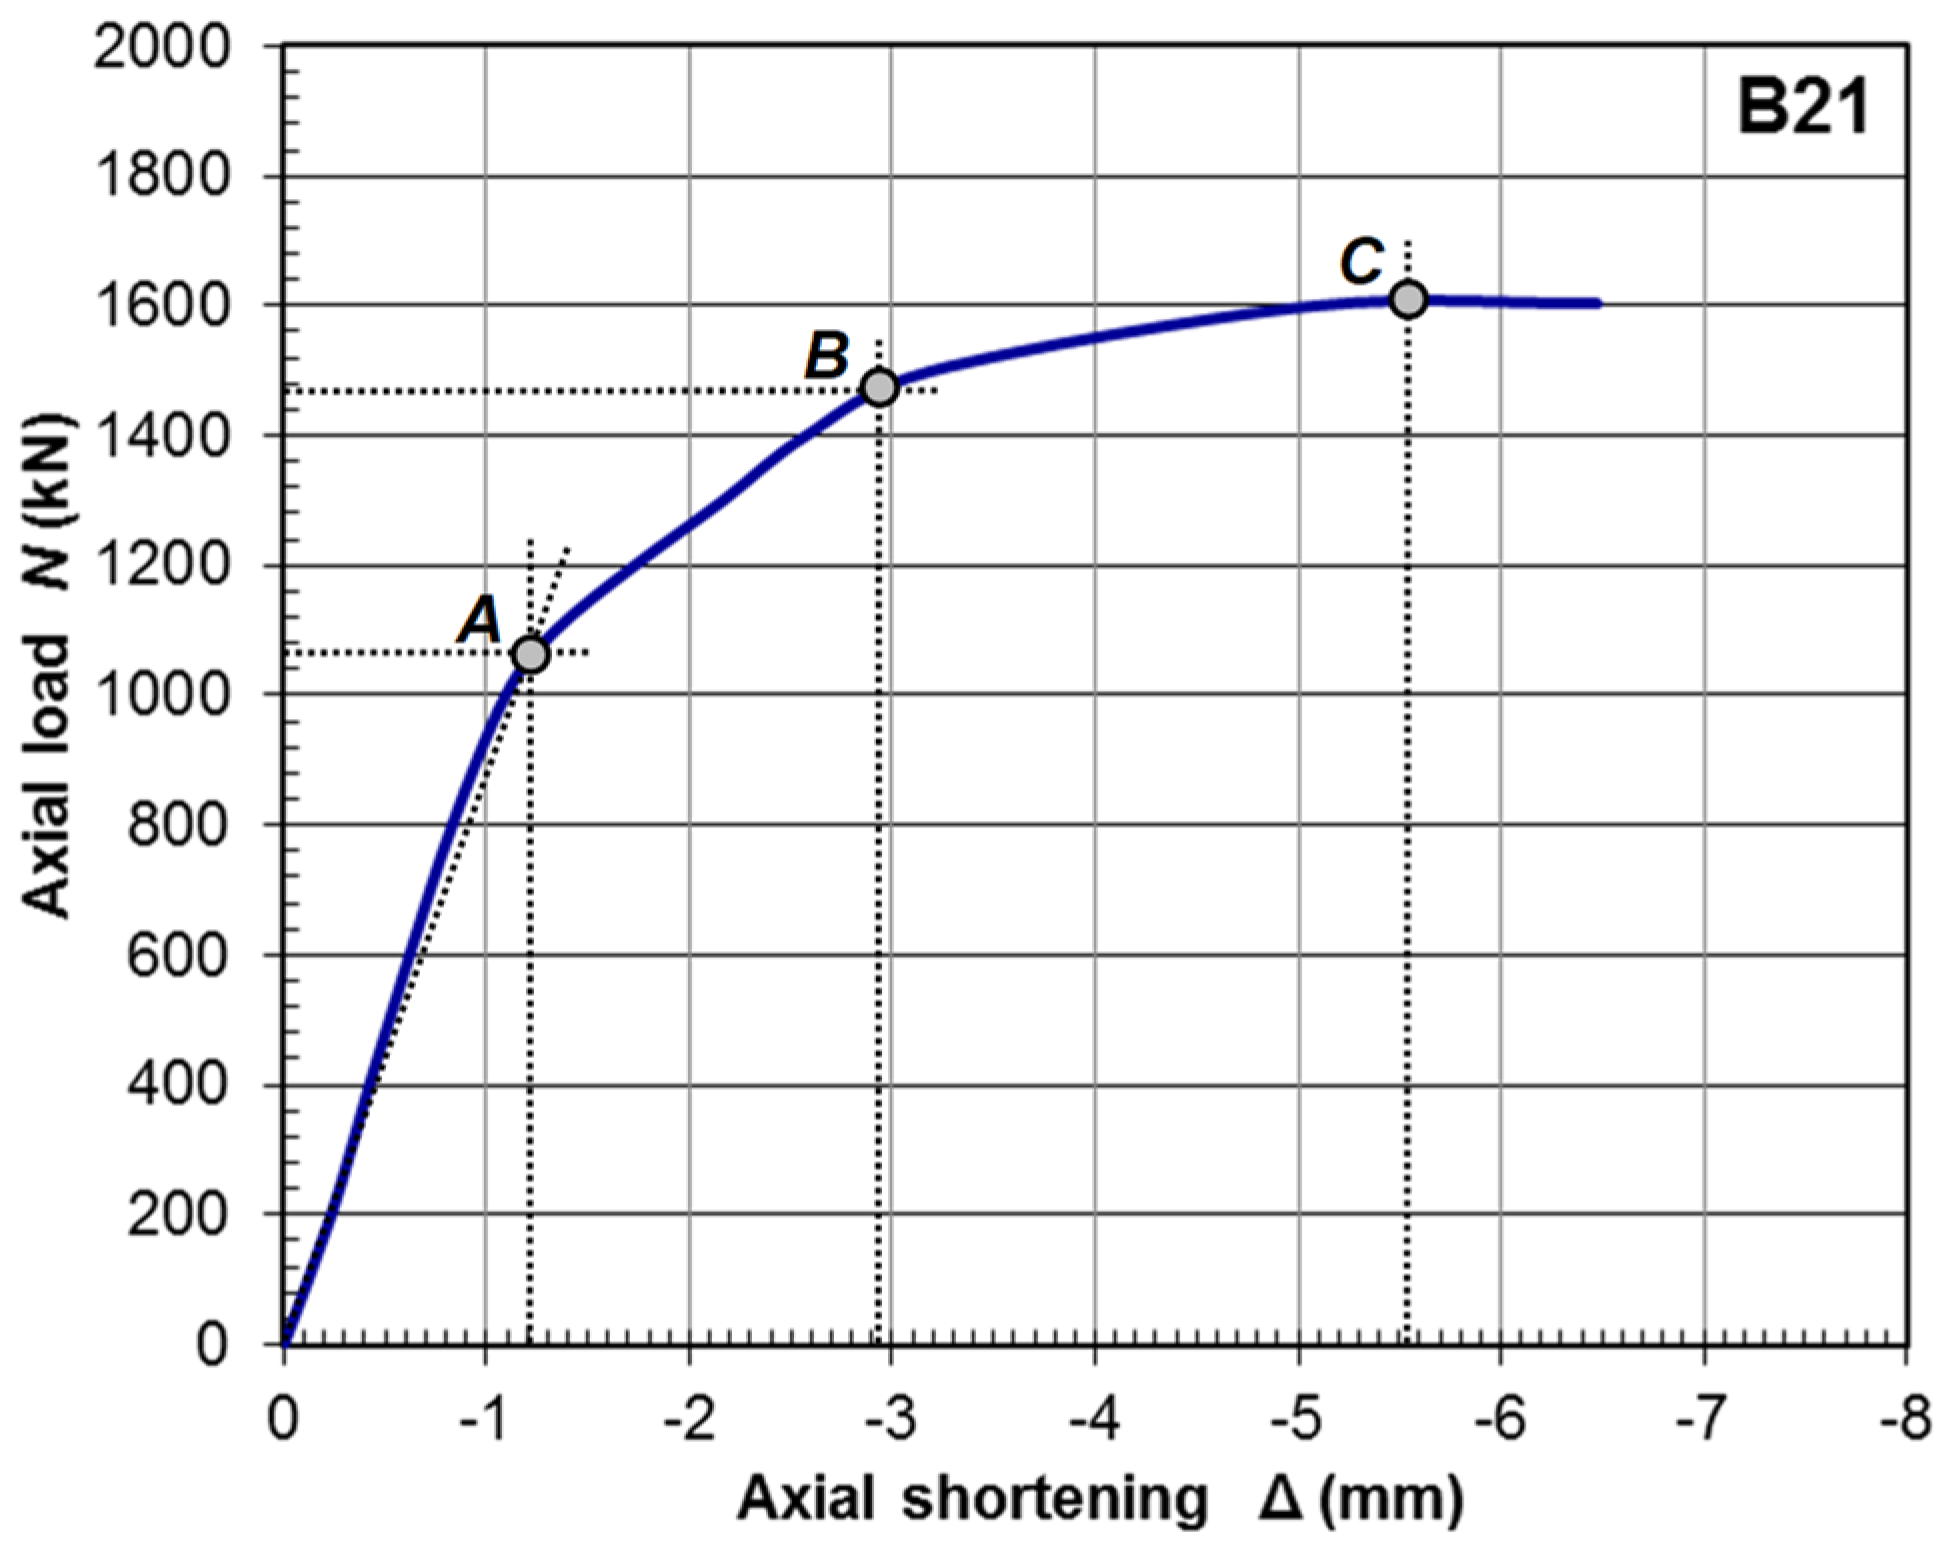
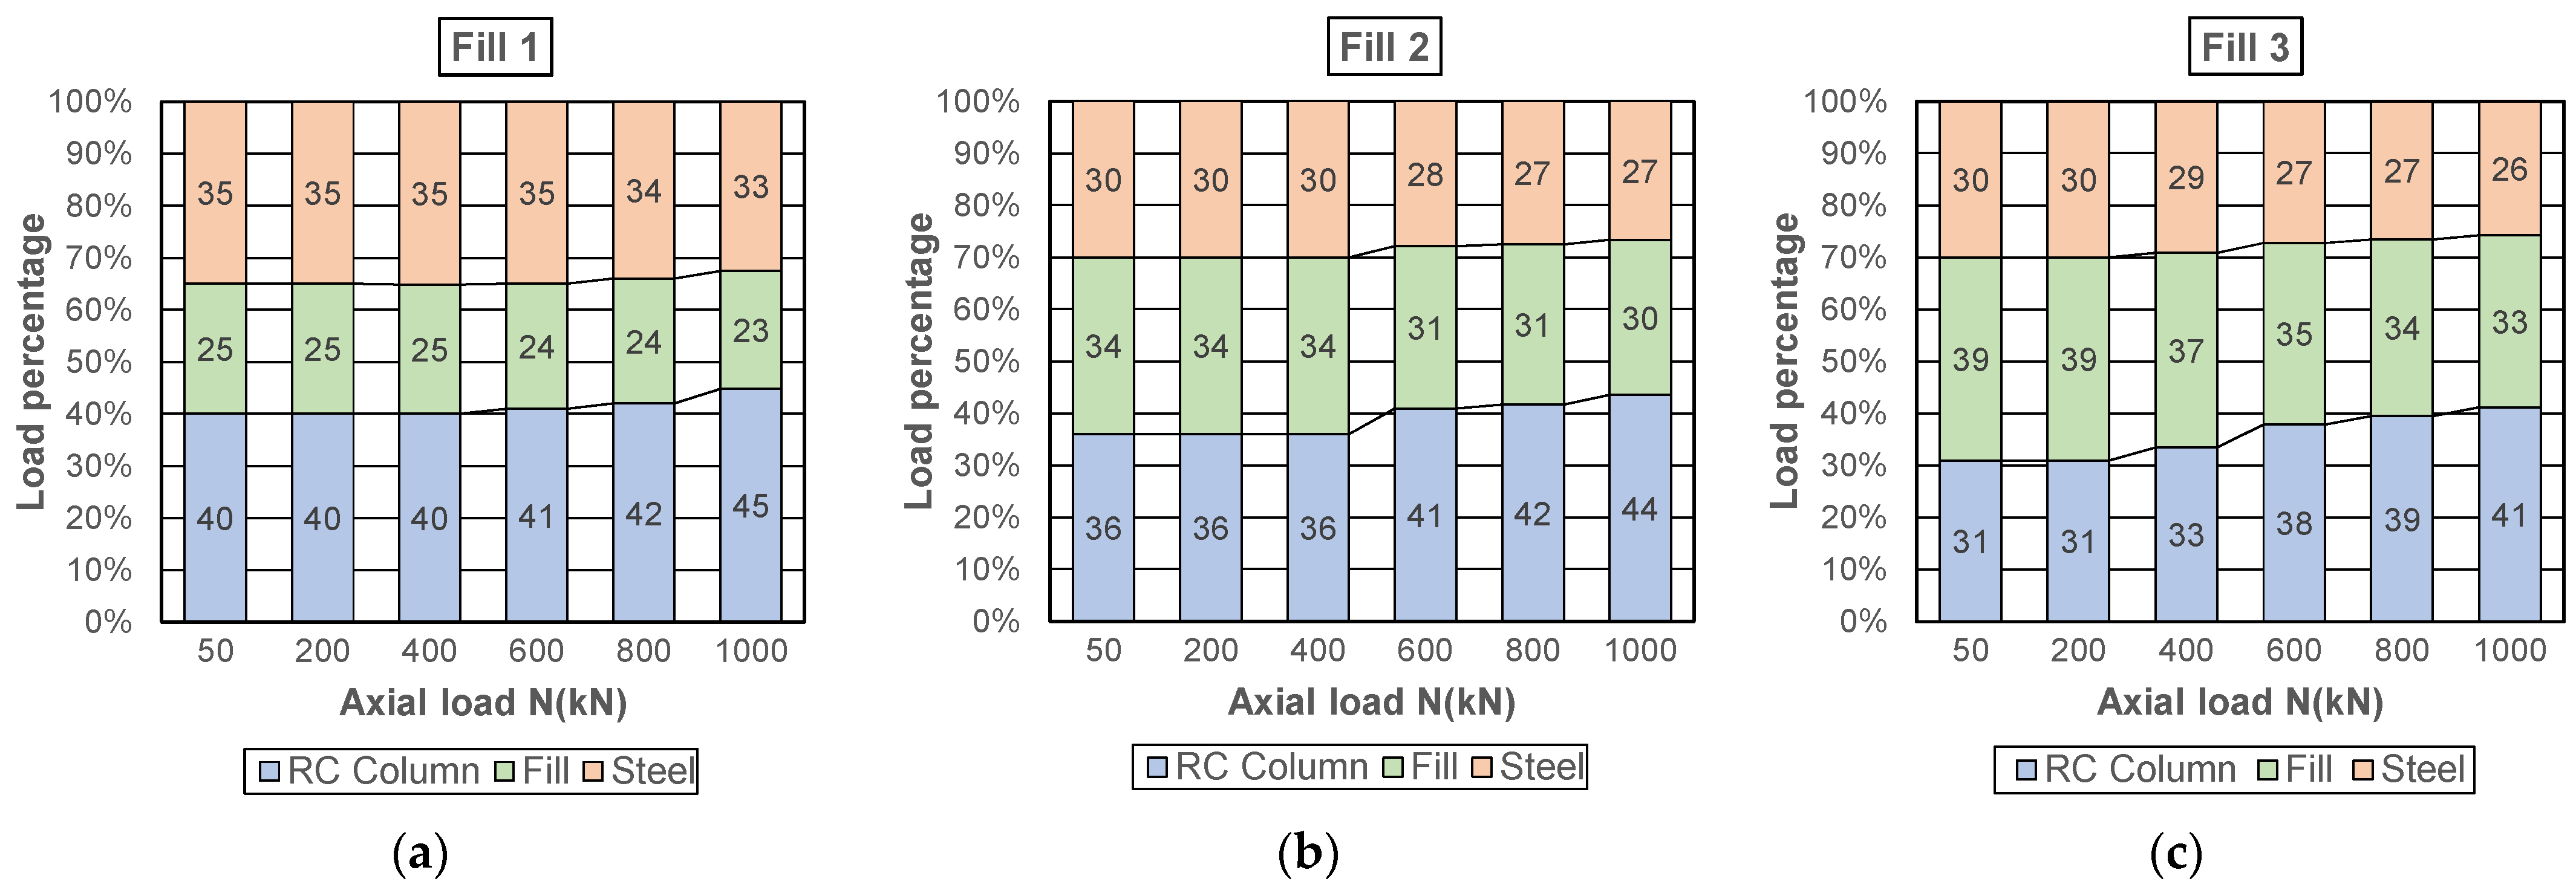
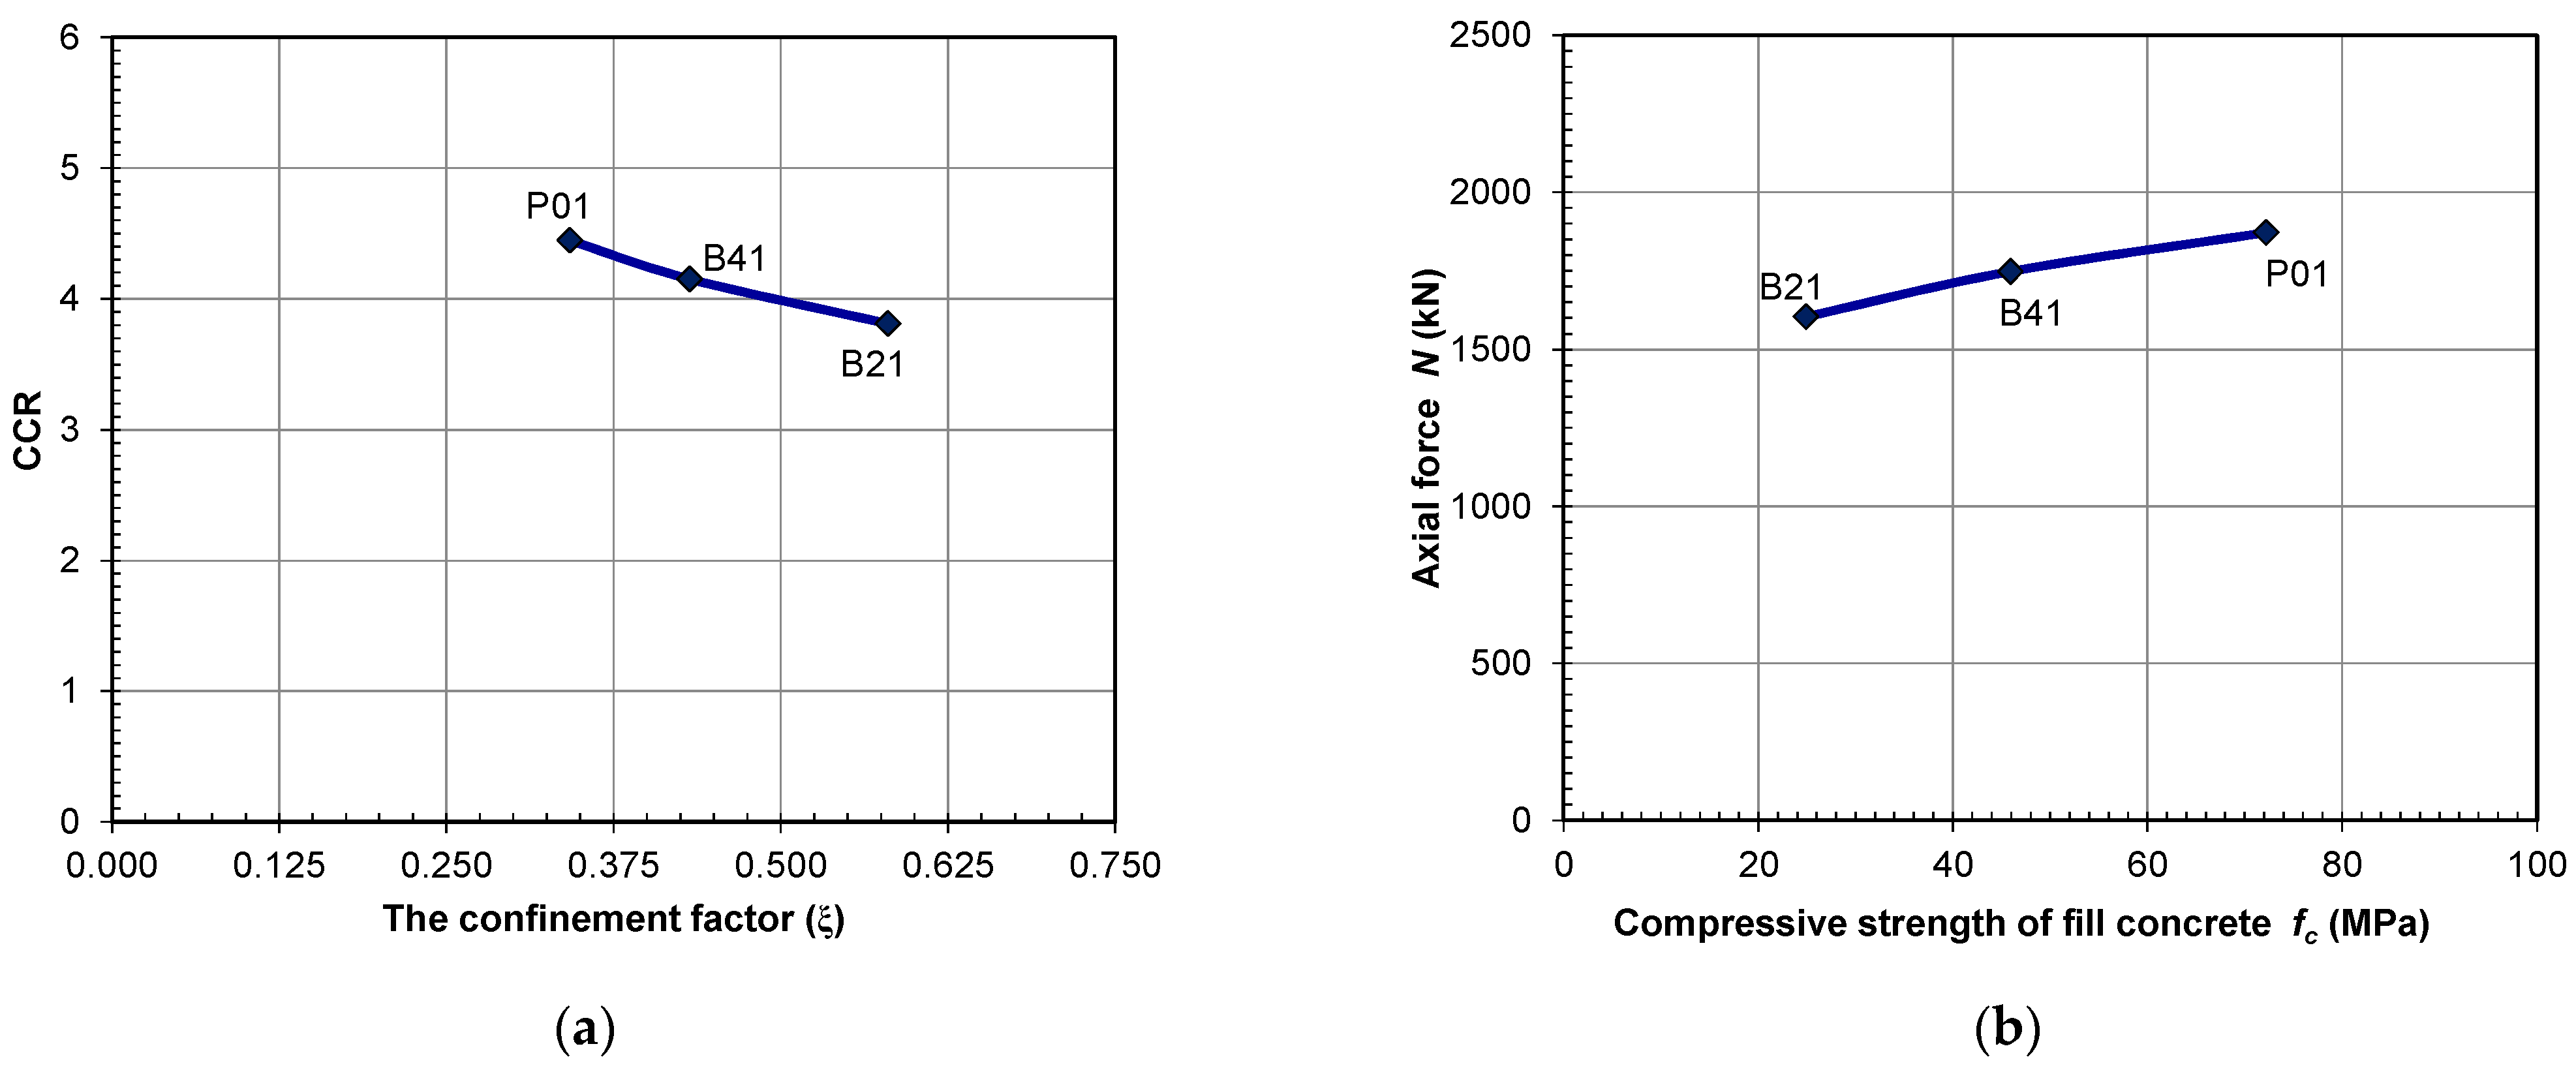
4. Analysis of the Test Results

The reinforced concrete columns were strengthened with a steel jacket, while the compressive strength class of the fill concrete was varied in three types. Comparative relationships of load versus strains on test specimens are presented in Figure 14. Diagram of axial strains in the concrete of the core RC column for all three groups of strengthened models are presented in Figure 14a. The strains of a plain RC model are also shown. The steel yield strain (εy) limits are marked with vertical dashed lines. The reinforced concrete column of the control group (S02) had nearly linear behavior up to failure load. In composite models, for all three model groups, the longitudinal strains in concrete for the last load phase are much larger compared to specimens of the control group. That behavior was expected because of the greater ductility of the composite cross-sections. Column models filled with regular fine-grain concrete (B21 and B41) showed almost identical behavior through all load phases, and they had very close ultimate strains. The specimens filled with special high-quality concrete (P01) showed much stiffer behavior and had lower ultimate deformation compared to the other two strengthen group models. The ultimate strains were almost half as low, which can be explained by properties of high-strength concrete, especially a lesser ductility behavior and a sudden loss of load-bearing capacity.
The main difference between square and circular columns, besides greater strength, was ductility. The strengthened column had a large deformation capacity and the ability to restrain the pronounced development of cracks in concrete. Similar behavior was observed on columns strengthened by carbon fiber-reinforced polymer jacket [29] and on columns retrofitted with a steel jacket [26,27,28].
Figure 14b gives the comparative relationships of axial force versus axial and lateral strain relationships of steel jacket in strengthened specimens. All models showed almost linear behavior until reaching yield stresses in steel. The behavior of specimens beyond the elastic stage mainly depends on the fill concrete compressive strength. In the exploitation load domain, which corresponds to forces up to around 800–900 kN (or 0.5 Nu), it can be seen that the difference between all strengthened models is relatively low.
The relationships of a measured axial force (N) versus axial deformation (Δ) for a typical specimen from all of the groups are shown in Figure 15. As from previous diagrams, it can be noticed that strengthened specimens filled with regular-strength concrete had greater deformation and ductility compared to strengthened models filled with high-strength concrete. The characteristic points noted in Figure 15 are marked by Ai, Bi, and Ci, where i = 1, 2, 3. Points are A—steel tube yielding; B—inner core column crushing; and C—load-bearing capacity, the same as in Figure 11.
The mean value of ultimate load forces for models of the control group and three groups of strengthened models are presented in Table 4. In addition, the standard deviation of results (Sn) and the coefficient of variation of results (COV) are presented. The specimens that suffered a welding fracture were excluded from statistical analysis. The coefficient of enhanced bearing capacity of a strengthened column (ks) compared to the column without strengthening is also shown. Coefficient ks is defined by:
k s = N u , S t r N u , R C
where Nu,Str is the ultimate load force of the strengthened column, while Nu,RC is the ultimate load force of the plain reinforced concrete column. It can be seen from coefficients ks that RC columns coupled with steel tube filled with special high-strength concrete (Fill 3) have 3.2 times greater load-bearing capacity, while specimens filled with regular fine-grain concrete have 2.9 (Fill 2) and 2.7 (Fill 1) times higher ultimate load. A relatively small difference between the ultimate forces of all strengthened models yields the conclusion that the quality of fill concrete has a relatively low impact on increasing the column strength. A possible reason for such low impact is the similarity of Poisson’s ratio for all of the used concrete; moreover, in all models, the steel tube was similar. Usage of high-mechanical characteristics concrete for the fill will not contribute to considerably higher strength compared to the usage of concrete that has similar characteristics as concrete of the unstrengthened column. In addition, the high mechanical properties will probably never be reached during exploitation; on the other hand, the brittleness of the structure would be unnecessarily increased.
Axial force (Ni) applied on a column in one load increment is divided between its structural components. The theoretical force distribution on the column’s cross-section parts can be determined from the equality of axial strains. The stress theory of composite structural elements assumes that all parts of the cross-sections have equal longitudinal deformations. Therefore, force in the individual part of the cross-section (Pi) is calculated as:
P i = E i ε i A i
where Ei, εi, and Ai are elastic modulus, axial strain, and cross-section area of a single part, respectively. Since all parts have equal strains (ε1 = ε2 = … = εn), the load distribution can be determined as a ratio:
P i N i = Ã i A *
The modified cross-section area of the individual part (Ãi) and the ideal cross-sectional area of the composite section (A*) are:
à i = E i E * A i A * = i = 1 n à i
The comparative elastic modulus of the composite cross-section (E*) is usually chosen to be the elastic modulus of concrete. Theoretical force distribution between three parts of the composite column is presented in Figure 16 in terms of load percentage. From the presented values, it can be observed that the fill concrete compressive strength has a significant influence on the load distribution. In the case of the specimens filled with low strength of concrete, the fill carries around 29% of the applied load. The increase of the compressive strength of fill concrete yields higher percentages (to 36% and 39%). For individually considered cases, the steel jacket and the core RC column shared a similar percentage of the axial load.
During the experimental testing, the axial force was applied only to the core RC column, and the load was transferred on other column parts over the bond between materials. Because of that, longitudinal strains in steel, fill, and core RC column were not equal during all load phases. The individual axial loads carried by the steel jacket, core RC column, and concrete fill in strengthened short columns under compression are determined from measured longitudinal strains using Equation (2). Since strains were registered on the RC core column and on the outer part of the steel tube, the strains of the fill concrete were chosen to have the same values as strains of the steel jacket. The presented analysis is limited to the exploitation load states, which, in this case, are loads up to 1000 kN. The distribution of axial force between parts of the composite column is presented in Figure 17 in the values of load percentage (Pi/Ni).
Presented values of the force distribution deviate from the theoretical values because of the differences in values of longitudinal strains in concrete and steel (εc ≠ εs). Results show that load transfer from the core RC column to the fill concrete and onto the steel tube starts to disrupt as a consequence of the slippage on the contact between two concrete. That means that the basic core column starts to carry more of the axial force, while both steel tube and fill concrete carry less of the applied load. The same behavior was registered in all three groups.
After the experimental testing, the steel jacket was removed from the specimen to observe the failure mode and to record the cracks in fill concrete, as shown in Figure 18a. In general, there were two failure modes for the strengthened columns: (A) the failure with a pronounced shear plane and diagonal cracks, as shown in Figure 18b, and (B) the failure with longitudinal cracks and indistinguishable shear plane, as shown in Figure 18c. The different modes of failure were attributed to the strength of fill concrete and to the level of confinement stresses which the steel jacket provides to the concrete core. Change of the failure mode from type (A) to type (B) contributed to the increase of fill concrete compressive strength and to the reduction of the confinement factor.
For column models filled with concrete types 1 and 2, the column strength loss was determined by the compression failure, which occurred at the principal shear planes in the places where the shear stresses reached their maximum. After that, major diagonal cracks were formed, as seen in Figure 18b, which led to a decrease in the specimen load-bearing capacity. In addition, the steel jacket reached its yield stress and was not effective in restraining the relative slipping among formed shear planes. For specimens filled with high-strength concrete (Fill 3), which had the lowest confinement factor, the possible movement among the opposite shear slipping planes was restricted by the lateral confining pressure induced by the steel jacket. Therefore, fill concrete showed only the longitudinal cracks formed under high confining pressure.
The confinement factor (ξ), also called the constraining factor, is commonly used to evaluate the compressive performance of steel tubes filled with concrete [21,22,23,24]. It is believed to be one of the major factors affecting the composite interactions between the concrete core and the steel tube. The confinement factor for CFST was defined by Han et al. [36] as:
ξ = A s f y A c f c k
Similarly, to include the expected composite action between the two different concrete types, confinement factor was defined in the expanded term as:
ξ = A s f y A c , c f c k , c + A c , f f c k , f
where As, Ac,c, and Ac,f are the areas of steel jacket, basic (core) column concrete, and fill concrete, respectively; fy is the steel yield strength; and fck,c, and fck,f are the characteristic compressive strength of basic column concrete and fill concrete, respectively. The characteristic compressive strength of the concrete is related to the average compressive cube strength as:
f c k , c = 0.88 α 1 α 2 f c u , c   and   f c k , f = 0.88 α 1 α 2 f c u , f
The values of concrete compressive strength presented in Table 3 are determined using the compressive strength of cubes. Detailed expressions for coefficients used in Equation (7) are given in [40]. The values of the confinement factor are presented in Table 1. The concrete contribution ratio (CCR) was used as a way to estimate the effect of enhanced strength of the core concrete in CFST, as in [40], and it is defined as:
C C R = N u N u s
where Nu is the test ultimate force of the composite column, while Nus is the test ultimate force of a hollow steel tube. Since the hollow steel column was not tested experimentally, its ultimate force was calculated from expression: N u s = f y A s .
The relationship between the confinement factor and the concrete contribution ratio is shown in Figure 19a. From the presented values, it was observed that the values of CCR in strengthened columns filled with high-strength concrete were greater than values for specimens filled with lower strength concrete. Oppositely, with the rise of the confinement factor, the contribution of the core concrete strength on values of the CCR decreased. A lower degree of confinement provided to the concrete by the steel tube was caused by high concrete strength, and in general, a composite column with a greater confinement factor tends to have pronounced ductile behavior, as it was described in [41]. The influence of the test parameters for strengthened columns in this research is presented in Figure 19b. The column crushing load tends to increase as the compressive strength of fill concrete increases.

5. Comparison with the Design Codes

Reinforced concrete columns strengthened with the steel jacket may be treated as a special form of CFST. A check to determine if available design codes developed for CFST elements were suitable for RC columns strengthened with steel jacket was performed in this paper. The axial load-bearing capacity of strengthened columns determined by experimental testing was compared with the ultimate bearing loads calculated by Eurocode 4 [37], ANSI/AISC-360 [38], and DBJ/T13-51-2010 [19] design codes. The ultimate plastic strength of the columns was calculated without the materials’ partial safety factors. In all code formulas, terms are expanded to include the simultaneous use of two concrete strength classes.

5.1. The Design Codes Description

5.1.1. Eurocode 4

The plastic resistance of steel–concrete composite members subjected to axial compression can be estimated with increased core concrete strength caused by the confinement stresses achieved by the steel tube. The axial strength according to EC4 (Nu,EC4) of a CFST is determined as:
N u , E C 4 = η a A s f y + A c , c f c , c ( 1 + η c t D f y f c , c ) + A c , f f c , f ( 1 + η c t D f y f c , f ) + A s r f s k
where t is the steel tube wall thickness, D is the outer diameter, and Asr and fsk are the area and the yield strength of the steel reinforcing bars, respectively. Coefficients ηa and ηc are expressed as η a = 0.25 ( 3 + 2 λ ¯ ) 1.0 and η c = 4.9 18.5 λ ¯ + 17 λ ¯ 2 0 . Relative slenderness can be calculated from λ ¯ = ( N p l , R k / N c r ) 0.5 , where the characteristic value of the plastic resistance to compression is N p l , R k = A s f y + A c , c f c , c + A c , f f c , f + A s r f s k , and the critical elastic normal force for the appropriate buckling mode is N c r = π 2 ( E I ) e f f / L 2 . The effective cross-section stiffness is defined as ( E I ) e f f = E s I s + 0.6 ( E c , c I c , c + E c , f I c , f ) + E s r I s r , where Is, Ic,c, Ic,f, and Isr are the second moments of area of the steel tube section, the core and the fill concrete section, and the steel reinforcement bars, respectively. Eurocode 4 approach is limited to members made from steel with strength classes between S235 to S460 and concrete of strength classes between C20/25 to C50/60.
In this research, Eurocode 4 approach is extended over the concrete strength limits. Therefore, due to [42], the concrete strength reduction factor η is used. The effective compressive strength (fc,eff) of high-strength concrete (fc > 50 MPa) is determined from:
f c , e f f = η f c
with the reduction factor η = 1 ( f c 50 ) / 200 . This method is limited to the concrete classes with a compressive strength of fc < 90 MPa. In this way, the compressive cylinder strength of Fill 3 concrete was reduced from fc = 72.2 MPa to fc,eff = 64.2 MPa.

5.1.2. ANSI/AISC 360

American standard ANSI/AISC 360-16 gives the compressive strength of compact axially loaded doubly symmetric filled composite members with a round cross-section, so the axial load-bearing capacity (Nu,AISC) of the CFST member is calculated as a sum of the strength of its individual parts:
N u , A I S C = f y A s + 0.95 f c , f A c , f + 0.95 f c , c ( A c , c + A s r E s E c , c )
The composite action between the concrete fill and the steel jacket was not taken into account in Equation (11). The reinforcing bars are included in column strength calculation as part of the basic RC column.

5.1.3. DBJ/T13-51-2010

According to code DBJ/T13-51-2010, the axial load-bearing capacity (Nu,DBJ) of CFST member with circular section is calculated as:
N u , D B J = ( 1.14 + 1.02 ξ ) f c k A t
where A t = A s + A c , c + A c , f is the cross-section total area. Increasing the concrete compressive strength because of the confinement stresses caused by the steel tube is considered over the confinement factor calculated by Equation (6). The characteristic compressive strength of concrete (fc), needed in order to calculate the strength of the columns, was determined from:
f c = A c , c f c , c + A c , f f c , f A c , c + A c , f
In that way, two concrete strength classes were replaced with a single value. The reinforcing bars were not included in the column strength calculation.

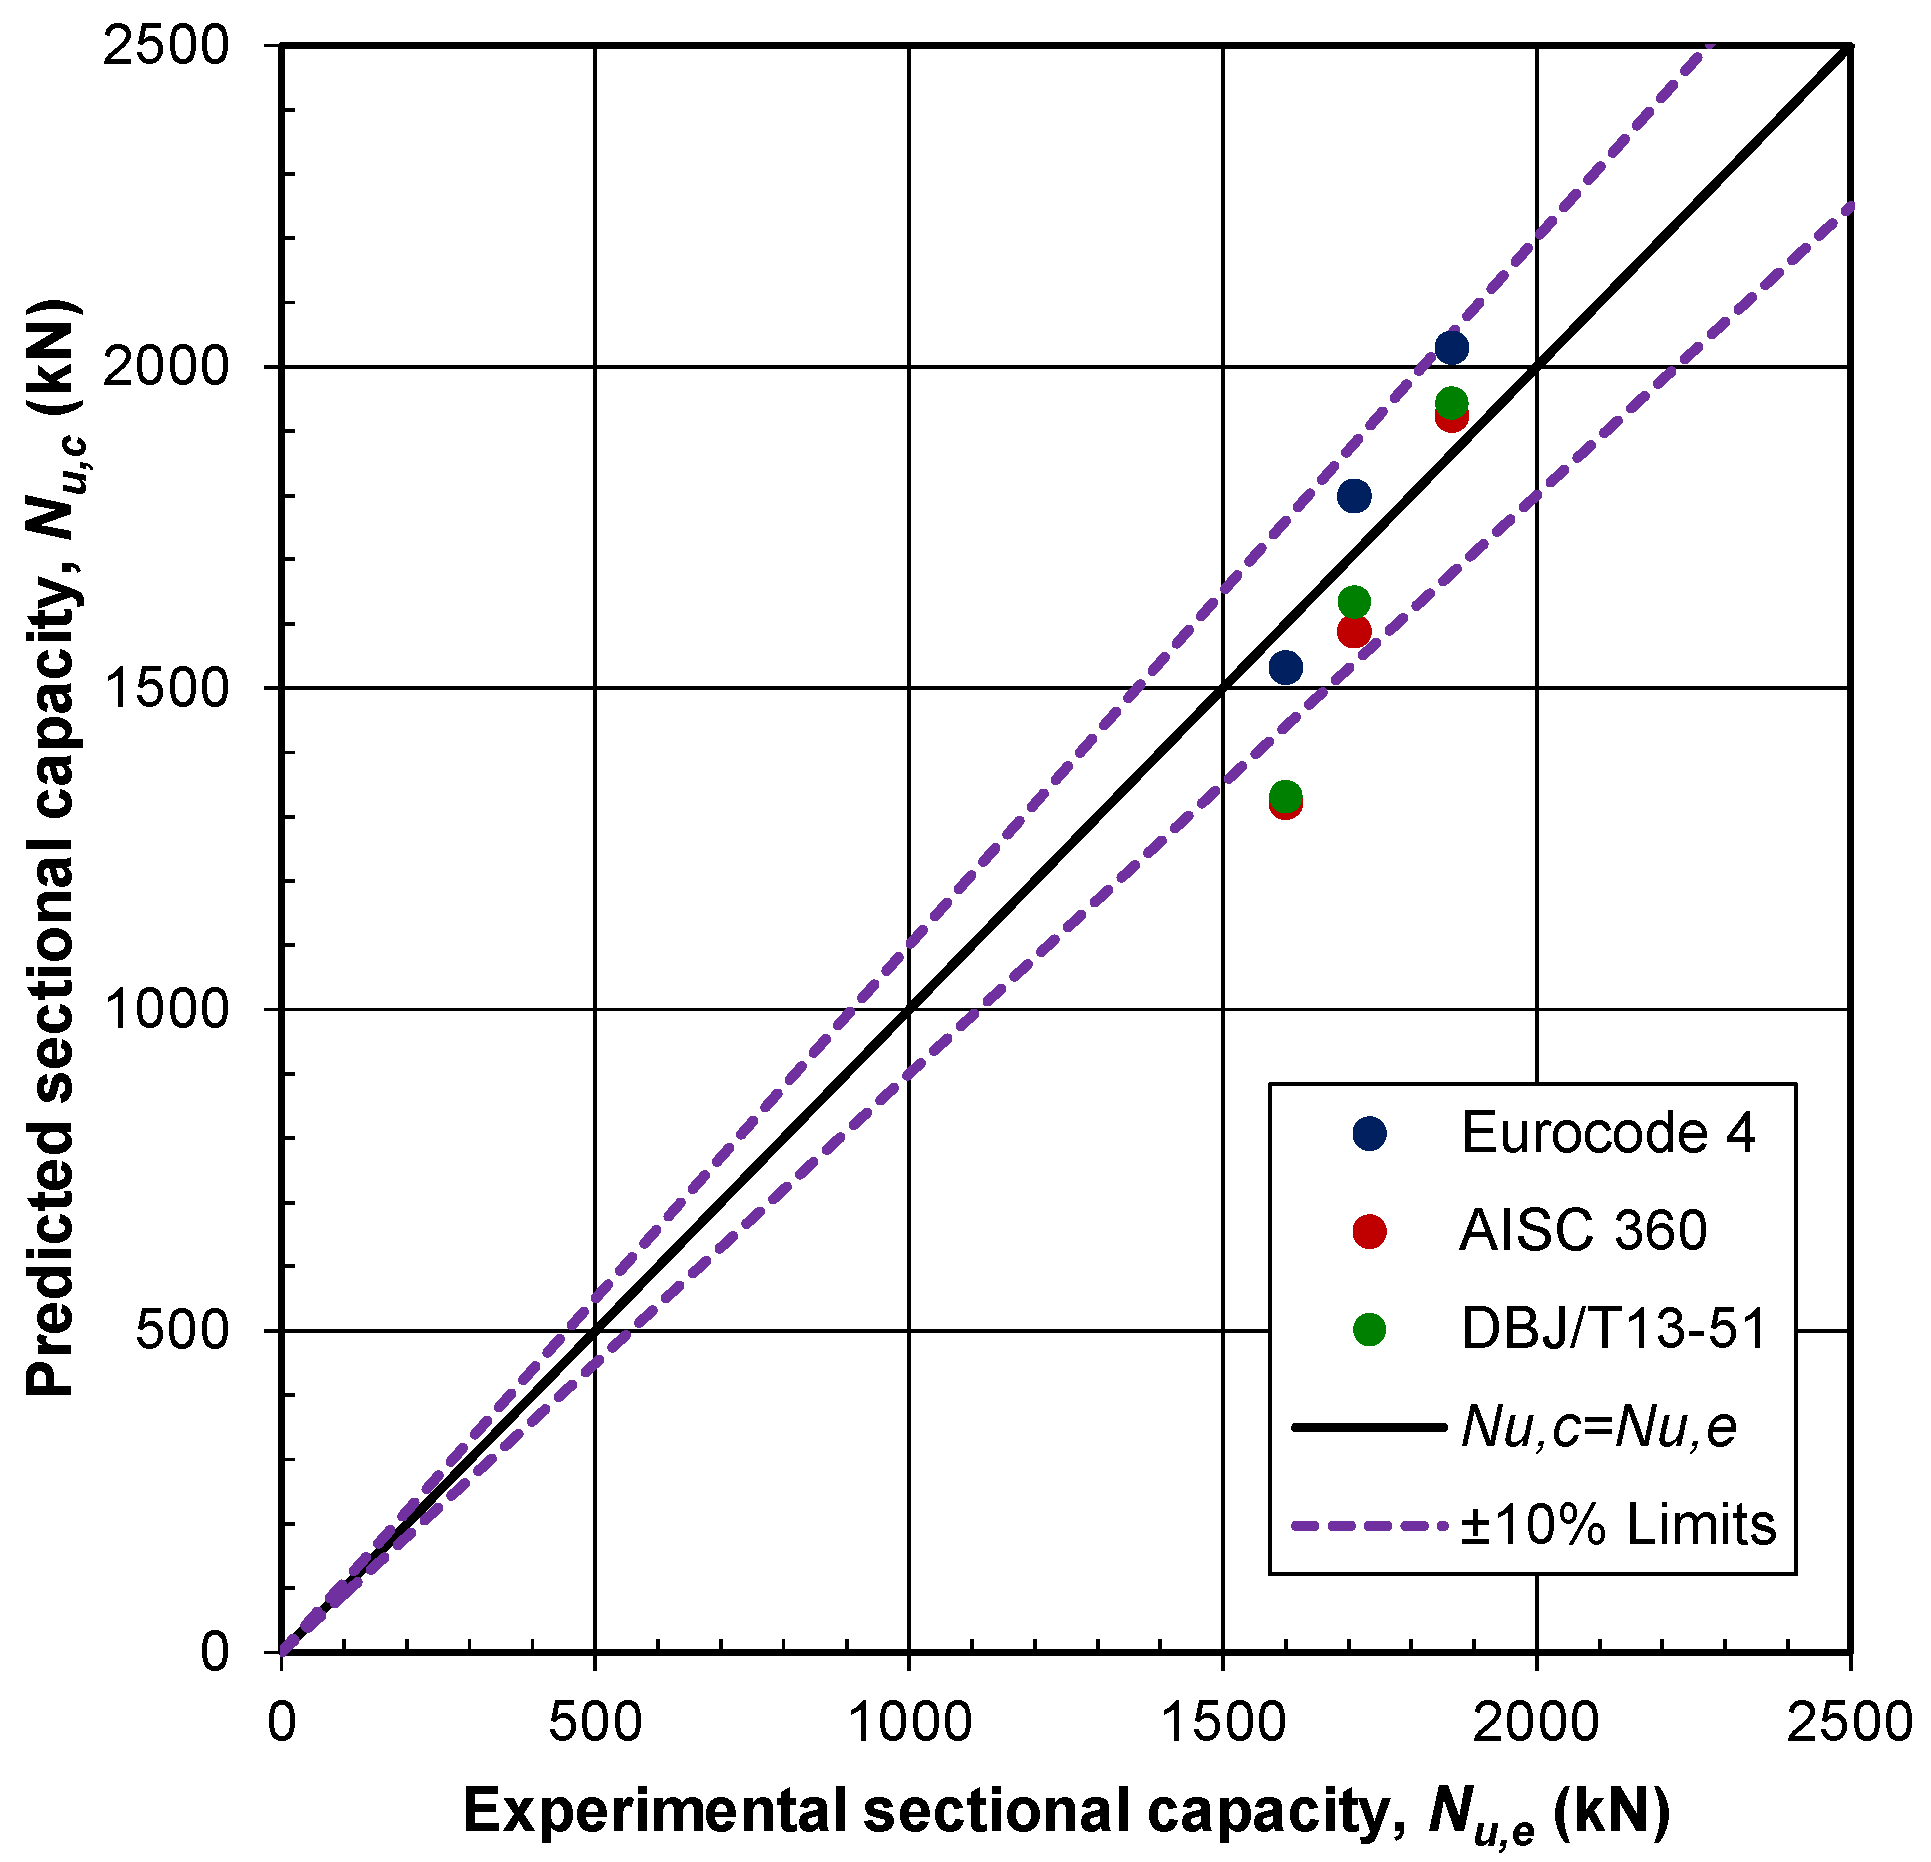
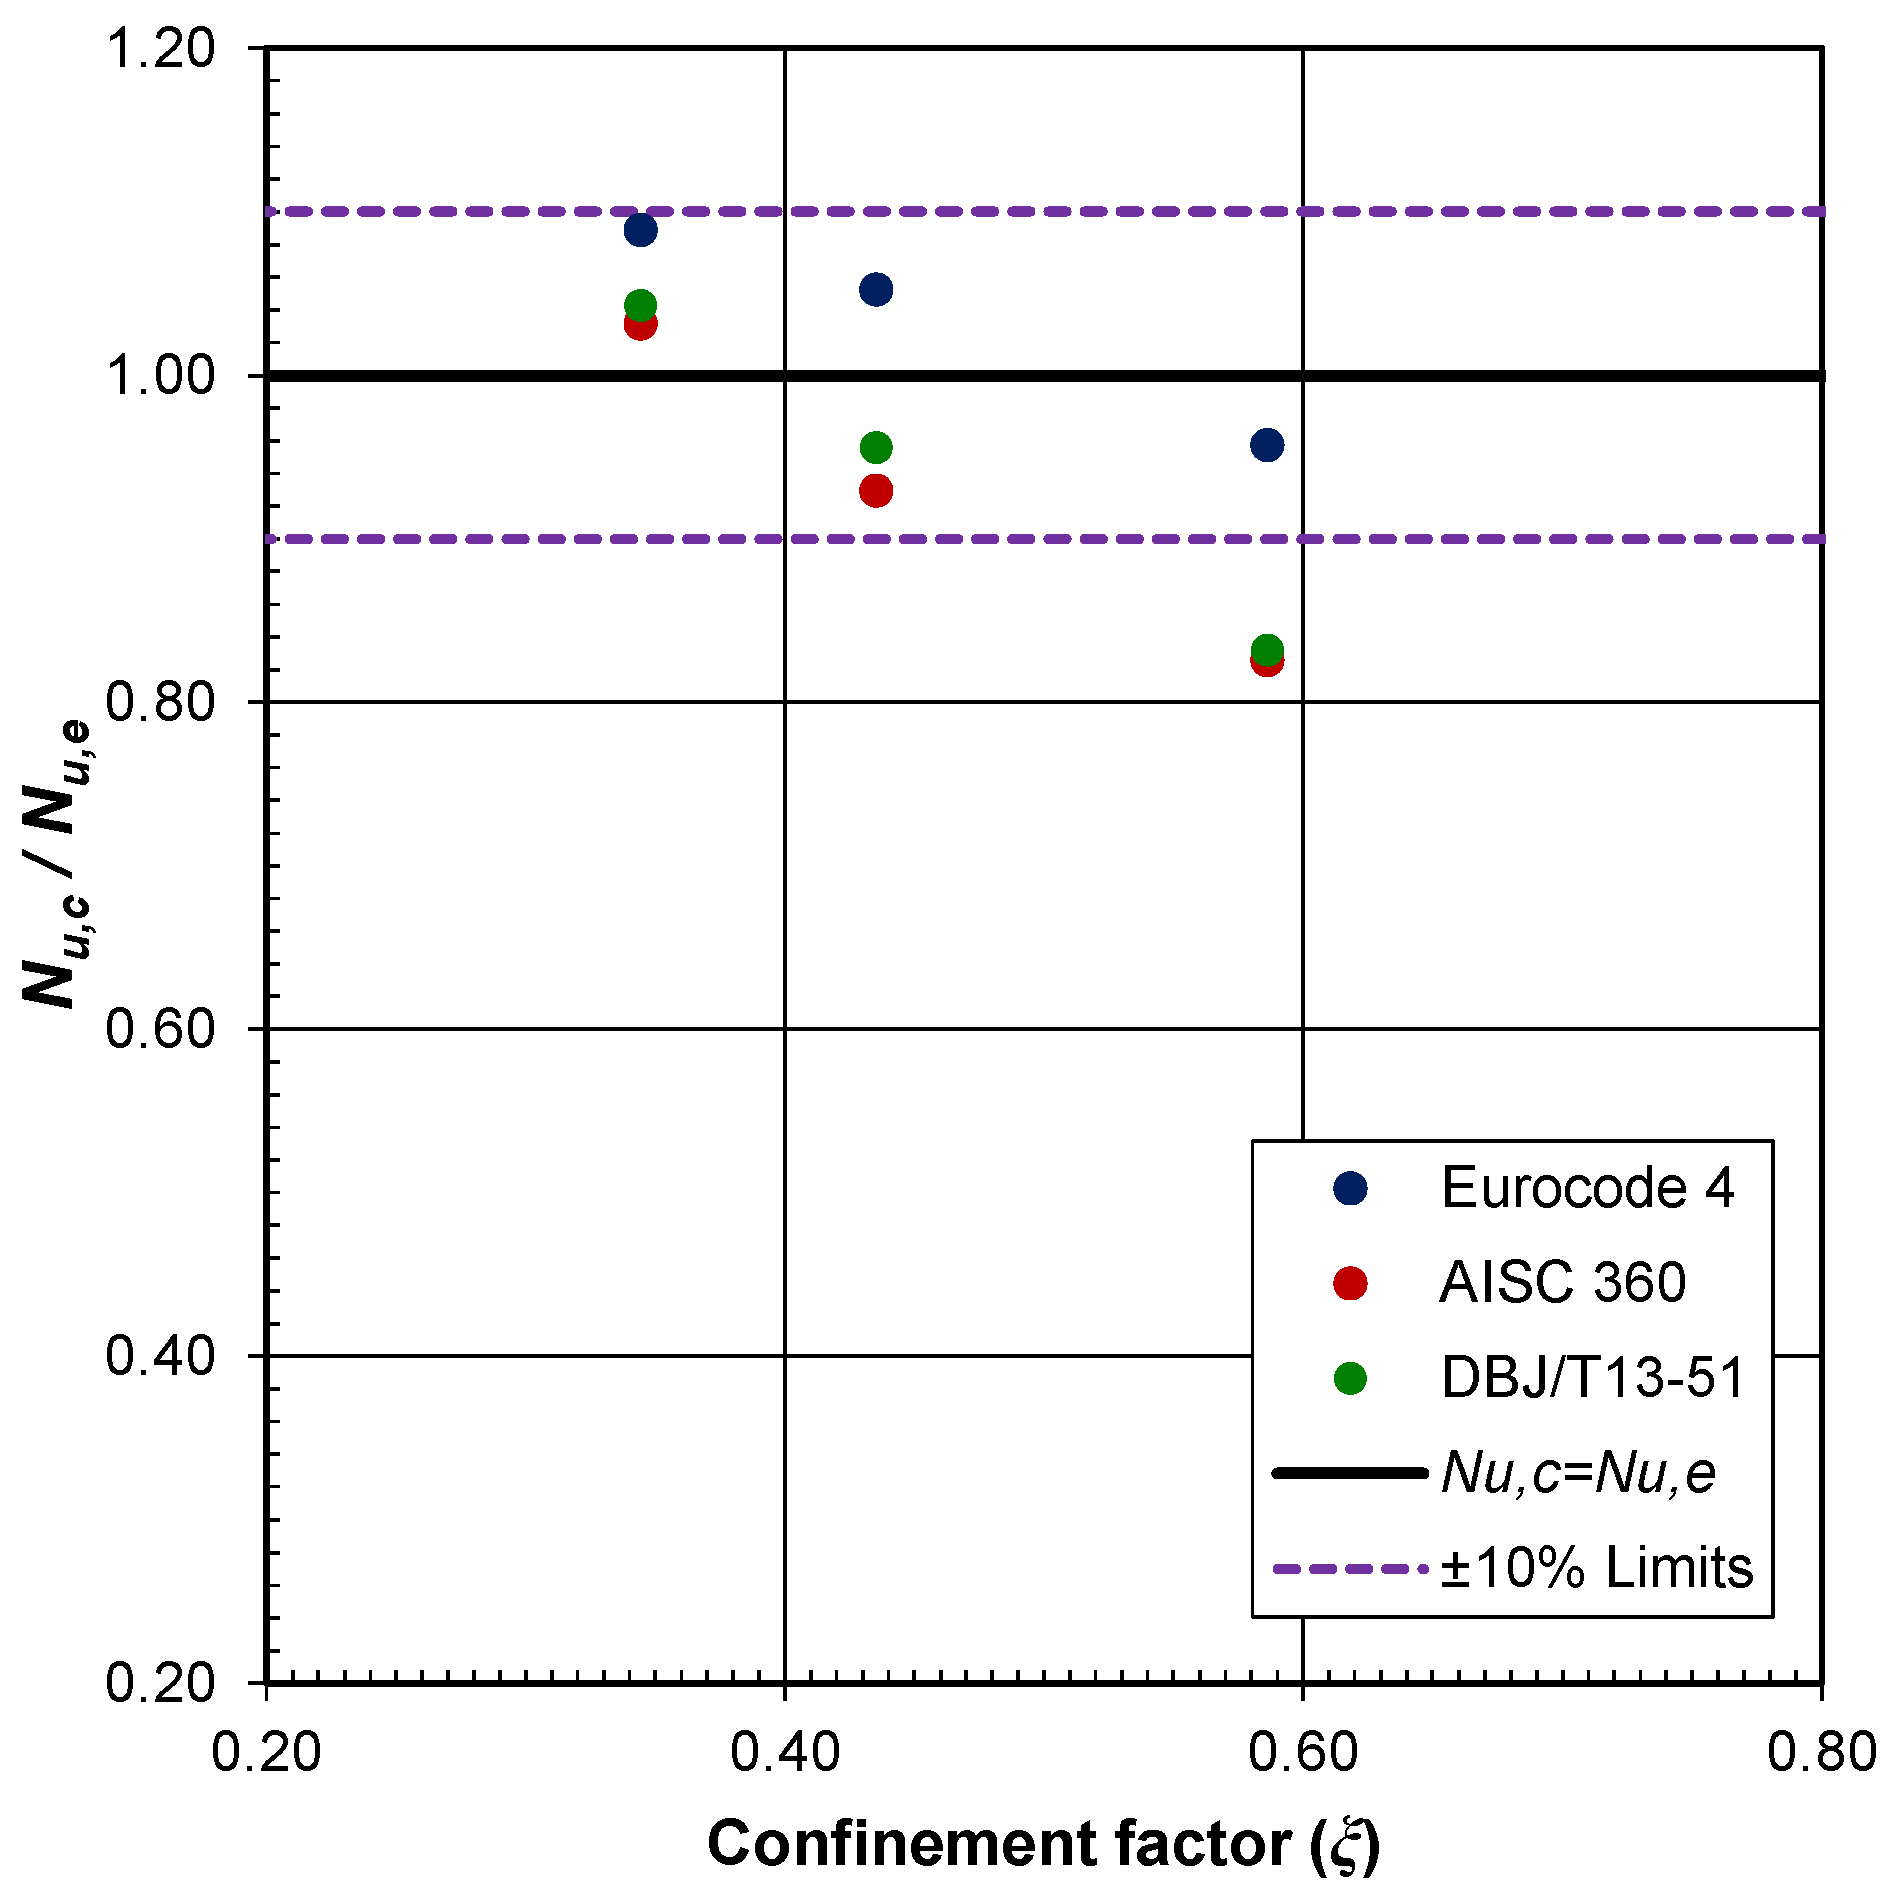
5.2. Results Discussion

The possibility of adopting the mentioned design codes to predict the axial bearing-capacity (Nu) of the RC column strengthened with the steel jacket and fill concrete was examined. Comparisons between the predicted (Nu,c) and the experimental (Nu,e) compressive strengths are given in Table 5 in terms of the forces and the Nu,c/Nu,e ratios. Code AISC-360 gives conservative predictions, mainly because it does not consider the enhanced compressive strength of the concrete induced by the lateral confinement provided by the steel jacket. The mean value of Nu,AISC/Nu,e ratio is 0.929, and its standard deviation is 10.3%. Code DBJ/T13-51-2010, also gives conservative predictions, where the mean value of Nu,DBJ/Nu,e ratio is 0.943, and the standard deviation is 10.6%. Compared to the AISC and DBJ codes, EC4 yields the best predictions, with 1.033 as the mean value of Nu,EC4/Nu,e ratio and 6.8% as the standard deviation. That advantage probably arises since it takes into account the enhanced concrete compressive strength as a result of the confinement effect provided by the steel jacket. It has to be noted that EC4 overestimates some of the results, as was registered by Wu et al. [43].
The comparison of sectional capacity between predicted and test results are presented in Figure 20. It can be noticed from the diagram that, for the columns filled with low-strength concrete (Fill 1), code AISC-360 and DBJ/T13-51-2010 both gave conservative predictions that were outside the ±10% limits. For the columns filled with regular-strength concrete (Fill 2) and with high-strength concrete (Fill 3), all considered codes gave a good prediction, with results inside the ±10% limits. When considering the high-strength concrete, all three codes overestimated the column plastic capacity. The dispersion of results was expected, mainly because all codes consider composite members made from one type of concrete, but in the presented research, the core column concrete and the fill concrete have different properties.
The behavior and bearing capacity of concrete-filled tube members are highly dependent on the relative strength ratio, as demonstrated by Ye et al. [19], Han et al. [36], and Chen et al. [40]. The comparison of axial strengths predicted by the mentioned codes to the experimental results from this paper is presented in Figure 21. All three considered codes provide more conservative predicted results within the experimental range as the value of the confinement factor increases. The enhanced strength of the concrete core in a CFST column is less obvious as the compressive strength of fill concrete increases. That can be explained by the fact that the concrete with higher compressive strength shows much stiffer behavior than the concrete with lower compressive strength.
As a result of the presented analysis, the mentioned design codes could be applied directly, in order to calculate the compressive axial load-bearing capacity of RC columns strengthened with the steel jacket and the fill concrete. The superposition of the concrete and the steel tube strength, used by those codes, to estimate the section capacity of CFST stub columns gives a reasonable estimation of the ultimate section capacity, but the ductility of the composite section is usually underestimated. Further investigation is needed to improve the predicted column strength, mainly on the strength of the RC core column and the fill concrete, both under the confinement by the steel jacket and on the load-bearing capacity of the steel tube in the ultimate stress state.

6. Conclusions

Results of the initial experimental and theoretical investigation on the axial compressive behavior of reinforced concrete columns strengthened with steel tube jacket and fill concrete are presented in this paper. The results of the experimental research greatly depend on the prior assumptions made before the design and creation of test samples, which imply that the reached conclusions refer to those defined boundaries. Based on the above results and within the chosen test parameters range, the following conclusions are drawn:
(1) The strengthened column models had a ductile behavior and showed larger deformation capacity compared to plain RC column models. The failure of the strengthened columns was a result of the local buckling of the steel jacket in an outward direction and the crush of the basic RC column concrete. In the specimens with a higher confinement factor, the failure with the shear plane and diagonal cracks in fill concrete was observed.
(2) The strain analysis revealed that the steel tube and the infill concrete are engaged for load-carrying, even if the load is only applied onto the core RC column. The load distribution on all three parts of the cross-section is achieved over the bond layer through the friction of adjacent materials. Strains observed on the core RC column and the steel tube are almost identical in the domain of exploitation loads, which implies that the composite action of the cross-section is preserved. Moreover, in the range of exploitation loads, hoop stress effects were registered and observed, i.e., biaxial state of stress formed in the steel jacket and triaxial state of stress formed within the concrete core.
(3) The axial force versus axial deformation relationships for the strengthened column can be separated by three distinctive points: steel tube yielding, inner core column crushing, and ultimate load-bearing capacity. The shape of the force–deformation curve is directly related to the specimen’s behavior and to the compressive strength of the fill concrete.
(4) The compressive axial load-bearing capacity of a strengthened column increases almost linearly with the increase of the fill concrete compressive strength. The ultimate strength of the RC columns strengthened by the steel jacket is improved by 2.7 to 3.2 times, relative to the ultimate strength of the plain nonstrengthened RC column. The compressive strength of the fill concrete has a relatively low impact on the increased column’s strength.
(5) All three considered codes give very good predictions of the compressive axial strengths of strengthened columns. Eurocode 4 predictions have proven to be the best; therefore, it could be recommended for the design strength calculation, but the effective compressive strength of high-strength concrete must be used with the reduced value.

Author Contributions

Conceptualization, M.B. and A.L.; methodology, M.B. and A.L.; software, A.L.; validation, M.B. and A.L.; formal analysis, A.L.; investigation, A.L.; resources, A.L.; data curation, A.L.; writing—original draft preparation, A.L.; writing—review and editing, A.L.; visualization, A.L.; supervision, M.B.; project administration, M.B.; funding acquisition, A.L. All authors have read and agreed to the published version of the manuscript.

Funding

This research received no external funding.

Institutional Review Board Statement

Not applicable.

Informed Consent Statement

Not applicable.

Data Availability Statement

Data sharing is not applicable to this article.

Acknowledgments

For the support in the realization of the experimental research, the authors are thankful to the colleagues from the Laboratory for Material and Structure Testing at the Faculty of Civil Engineering Subotica, University of Novi Sad, Republic of Serbia.

Conflicts of Interest

The authors declare no conflict of interest.

References

  1. Johansson, M.; Gylltoft, K. Mechanical Behavior of Circular Steel–Concrete Composite Stub Columns. J. Struct. Eng. 2002, 128, 1073–1081. [Google Scholar] [CrossRef]
  2. Schneider, S.P. Axially Loaded Concrete-Filled Steel Tubes. J. Struct. Eng. 1998, 124, 1125–1138. [Google Scholar] [CrossRef]
  3. Roeder, C.W.; Cameron, B.; Brown, C.B. Composite Action in Concrete Filled Tubes. J. Struct. Eng. 1999, 125, 477–484. [Google Scholar] [CrossRef]
  4. Giakoumelis, G.; Lam, D. Axial capacity of circular concrete-filled tube columns. J. Constr. Steel Res. 2004, 60, 1049–1068. [Google Scholar] [CrossRef]
  5. Sakino, K.; Nakahara, H.; Morino, S.; Nishiyama, I. Behavior of Centrally Loaded Concrete-Filled Steel-Tube Short Columns. J. Struct. Eng. 2004, 130, 180–188. [Google Scholar] [CrossRef]
  6. Ellobody, E.; Young, B.; Lam, D. Behaviour of normal and high-strength concrete-filled compact steel tube circular stub columns. J. Constr. Steel Res. 2006, 62, 706–715. [Google Scholar] [CrossRef]
  7. Xiong, M.-X.; Xiong, D.-X.; Liew, J.R. Behaviour of steel tubular members infilled with ultra high-strength concrete. J. Constr. Steel Res. 2017, 138, 168–183. [Google Scholar] [CrossRef]
  8. Xiong, M.-X.; Xiong, D.-X.; Liew, J.R. Axial performance of short concrete filled steel tubes with high- and ultra-high- strength materials. Eng. Struct. 2017, 136, 494–510. [Google Scholar] [CrossRef]
  9. Yan, Y.; Xu, L.; Li, B.; Chi, Y.; Yu, M.; Zhou, K.; Song, Y. Axial behavior of ultra-high performance concrete (UHPC) filled stocky steel tubes with square sections. J. Constr. Steel Res. 2019, 158, 417–428. [Google Scholar] [CrossRef]
  10. Yu, Q.; Tao, Z.; Wu, Y.-X. Experimental behaviour of high performance concrete-filled steel tubular columns. Thin-Walled Struct. 2008, 46, 362–370. [Google Scholar] [CrossRef]
  11. Liew, J.R.; Xiong, M.; Xiong, D. Design of Concrete Filled Tubular Beam-columns with High-strength Steel and Concrete. Structures 2016, 8, 213–226. [Google Scholar] [CrossRef]
  12. Li, G.; Chen, B.; Yang, Z.; Feng, Y. Experimental and numerical behaviour of eccentrically loaded high-strength concrete filled high-strength square steel tube stub columns. Thin-Walled Struct. 2018, 127, 483–499. [Google Scholar] [CrossRef]
  13. Uy, B.; Tao, Z.; Han, L.-H. Behaviour of short and slender concrete-filled stainless steel tubular columns. J. Constr. Steel Res. 2011, 67, 360–378. [Google Scholar] [CrossRef]
  14. He, A.; Wang, F.; Zhao, O. Experimental and numerical studies of concrete-filled high-chromium stainless steel tube (CFHSST) stub columns. Thin-Walled Struct. 2019, 144, 106273. [Google Scholar] [CrossRef]
  15. He, A.; Zhao, O. Experimental and numerical investigations of concrete-filled stainless steel tube stub columns under axial partial compression. J. Constr. Steel Res. 2019, 158, 405–416. [Google Scholar] [CrossRef]
  16. Tao, Z.; Han, L.-H. Behaviour of concrete-filled double skin rectangular steel tubular beam–columns. J. Constr. Steel Res. 2006, 62, 631–646. [Google Scholar] [CrossRef]
  17. Han, L.-H.; Li, Y.-J.; Liao, F.-Y. Concrete-filled double skin steel tubular (CFDST) columns subjected to long-term sustained loading. Thin-Walled Struct. 2011, 49, 1534–1543. [Google Scholar] [CrossRef]
  18. Lia, W.; Cai, Y.X. Performance of CFDST stub columns using high-strength steel subjected to axial compression. Thin-Walled Struct. 2019, 141, 411–422. [Google Scholar] [CrossRef]
  19. Ye, Y.; Han, L.-H.; Sheehan, T.; Guo, Z.-X. Concrete-filled bimetallic tubes under axial compression: Experimental investigation. Thin-Walled Struct. 2016, 108, 321–332. [Google Scholar] [CrossRef] [Green Version]
  20. Kang, I.K.; Kim, S.H. Compressive Strength Testing of Hybrid Concrete-Filled Fiber-Reinforced Plastic Tubes Confined by Filament Winding. Appl. Sci. 2021, 11, 2900. [Google Scholar] [CrossRef]
  21. Han, L.-H.; Liu, W.; Yang, Y.-F. Behavior of thin walled steel tube confined concrete stub columns subjected to axial local compression. Thin-Walled Struct. 2008, 46, 155–164. [Google Scholar] [CrossRef]
  22. Han, L.-H.; Liu, W.; Yang, Y.-F. Behaviour of concrete-filled steel tubular stub columns subjected to axially local compression. J. Constr. Steel Res. 2008, 64, 377–387. [Google Scholar] [CrossRef]
  23. Han, L.H.; Liu, W.; Yang, Y.F. Design calculations on concrete-filled thin-walled steel tubes subjected to axially local com-pression. In Proceedings of the 12th International Symposium on Tubular Structures, Shanghai, China, 8–10 October 2008; pp. 85–91. [Google Scholar]
  24. Yang, Y.-F.; Han, L.-H. Experiments on rectangular concrete-filled steel tubes loaded axially on a partially stressed cross-sectional area. J. Constr. Steel Res. 2009, 65, 1617–1630. [Google Scholar] [CrossRef]
  25. Ding, F.-X.; Liu, J.; Liu, X.-M.; Yu, Z.-W.; Li, D.-W. Mechanical behavior of circular and square concrete filled steel tube stub columns under local compression. Thin-Walled Struct. 2015, 94, 155–166. [Google Scholar] [CrossRef] [Green Version]
  26. Priestley, N.M.J.; Seible, F.; Xiao, Y.; Verma, R. Steel jacket retrofitting of reinforced concrete bridge columns for enhanced shear strength—Part 1: Theoretical considerations and test design. ACI Struct. J. 1994, 91, 394–405. [Google Scholar]
  27. Priestley, N.M.J.; Seible, F.; Xiao, Y.; Verma, R. Steel jacket retrofitting of reinforced concrete bridge columns for enhanced shear strength—Part 2: Test results and comparison with theory. ACI Struct. J. 1994, 91, 537–551. [Google Scholar]
  28. Sakino, K.; Sun, Y. Steel jacketing for improvement of column strength and ductility. In Proceedings of the 12th World Conference on Earthquake Engineering, Auckland, New Zealand, 30 January–4 February 2000; p. 2525. [Google Scholar]
  29. Tsai, K.; Lin, M. Seismic jacketing of RC columns for enhanced axial load carrying performance. J. Chin. Inst. Eng. 2002, 25, 389–402. [Google Scholar] [CrossRef]
  30. Sezen, H.; Miller, E.A. Experimental Evaluation of Axial Behavior of Strengthened Circular Reinforced-Concrete Columns. J. Bridge Eng. 2011, 16, 238–247. [Google Scholar] [CrossRef]
  31. Ro, K.M.; Kim, M.S.; Lee, Y.H. Experimental Study on Seismic Retrofitting of Reinforced Concrete Frames Using Welded Concrete-Filled Steel Tubes. Appl. Sci. 2020, 10, 7061. [Google Scholar] [CrossRef]
  32. Ombres, L.; Verre, S. FRCM confined reinforced concrete columns: Experimental behavior and modeling. In Proceedings of the Symposium SP-345: Materials, Analysis, Structural Design and Applications of Textile Reinforced Concrete/Fabric Reinforced Cementitious Matrix. ACI Committee 549, Cincinnati, OH, USA, 20–24 October 2019; pp. 102–116. [Google Scholar]
  33. Testing Hardened Concrete Part 3: Compressive Strength of Test Specimens; EN 12390-3:2009 (2011); CEN-CENELEC Management Centre: Brussels, Belgium, 2011.
  34. Testing Hardened Concrete Part 13: Determination of Secant Modulus of Elasticity in Compression; EN 12390-13:2013; CEN-CENELEC Management Centre: Brussels, Belgium, 2013.
  35. Han, L.-H.; Li, W.; Bjorhovde, R. Developments and advanced applications of concrete-filled steel tubular (CFST) structures: Members. J. Constr. Steel Res. 2014, 100, 211–228. [Google Scholar] [CrossRef]
  36. Han, L.H.; Zhao, X.L.; Tao, Z. Tests and mechanics model of concrete filled SHS stub columns, columns and beam-columns. Steel Compos. Struct. 2001, 1, 51–74. [Google Scholar] [CrossRef]
  37. Eurocode 4. Design of Composite Steel and Concrete Structures Part 1-1: General Rules and Rules for Building; (EN 1994-1-1:2004); European Committee for Standardization: Brussels, Belgium, 2004. [Google Scholar]
  38. ANSI/AISC 360-10. Specification for Structural Steel Buildings; American Institute of Steel Construction: Chicago, IL, USA, 2010. [Google Scholar]
  39. Eurocode 3. Design of Steel Structures. Part 1-1: General Rules and Rules for Building; (EN 1993-1-1:2005); European Committee for Standardization: Brussels, Belgium, 2005. [Google Scholar]
  40. Chen, B.; Lai, Z.; Yan, Q.; Varma, A.H.; Yu, X. Experimental Behavior and Design of CFT-RC Short Columns Subjected to Concentric Axial Loading. J. Struct. Eng. 2017, 143, 04017148. [Google Scholar] [CrossRef]
  41. Hoang, A.L.; Fehling, E. A review and analysis of circular UHPC filled steel tube columns under axial loading. Struct. Eng. Mech. 2017, 61, 417–430. [Google Scholar] [CrossRef]
  42. Chiew, S.-P.; Cai, Y.-Q. Design of high-strength steel reinforced concrete columns—A Eurocode 4 approach. Steel Constr. 2018, 11, 306–314. [Google Scholar] [CrossRef]
  43. Wu, B.; Peng, C.W.; Zhao, X.Y.; Zhou, W.J. Axial loading tests of thin-walled circular steel tubes infilled with cast-inplace concrete and precast segments containing DCLs. Thin-Walled Struct. 2018, 127, 275–289. [Google Scholar] [CrossRef]
Figure 1. A schematic view of the strengthened column (a), a picture of pouring fresh concrete in a steel tube (b), and the reinforcement arrangement (c).
Applsci 11 04043 g001
Figure 2. Compressive stress–strain curves of used concrete.
Applsci 11 04043 g002
Figure 3. A schematic view of the test setup: plain RC column (a) and strengthened column (b).
Applsci 11 04043 g003
Figure 4. Column specimens before the experiment. Plain RC column (a) and strengthened columns (bd).
Applsci 11 04043 g004
Figure 5. Measured axial load versus strains (a) and load versus deformation (b) relationships of plain reinforced concrete specimens (S0x series).
Applsci 11 04043 g005
Figure 6. Failure modes of plain RC columns. The bottom part of specimen S03 (a), and the top part of specimen S02 (b).
Applsci 11 04043 g006
Figure 7. Column models after the experiment.
Applsci 11 04043 g007
Figure 8. Measured axial load versus strains (a) and load versus deformation (b) relationships of the first group of strengthened specimens (B2x series).
Applsci 11 04043 g008
Figure 9. Measured axial load versus strains (a) and load versus deformation (b) relationships of the second group of strengthened specimens (B4x series).
Applsci 11 04043 g009
Figure 10. Measured axial load versus strains (a) and load versus deformation (b) relationships of the third group of strengthened specimens (P0x series).
Applsci 11 04043 g010
Figure 11. Typical axial force versus deformation curves for strengthened columns.
Applsci 11 04043 g011
Figure 12. Failure modes of strengthened columns at the top end plane. Cracks in specimen P01 (a), embedded top bearing plate (b), and removed top bearing plate (c).
Applsci 11 04043 g012
Figure 13. Strengthened column models after the experiment.
Applsci 11 04043 g013
Figure 14. Comparative relationships of load versus strains on test specimens. Registered strains on concrete (a) and on steel jacket (b).
Applsci 11 04043 g014
Figure 15. Comparative relationships of load versus deformation of specimens.
Applsci 11 04043 g015
Figure 16. Comparative relationships for theoretical load distribution between three parts of the composite column.
Applsci 11 04043 g016
Figure 17. Experimental load distribution for strengthened specimens: B2x-Fill 1 (a), B4x-Fill 2 (b), and P0x-Fill 3 (c).
Applsci 11 04043 g017
Figure 18. Strengthened specimens after removing steel tubes (a) and cracks in fill concrete—diagonal (b) and longitudinal (c).
Applsci 11 04043 g018
Figure 19. (a) Confinement factor versus concrete contribution ratio relationship. (b) Effects of test parameters for strengthened columns.
Applsci 11 04043 g019
Figure 20. Comparison of the plastic sectional capacity between predicted and test results.
Applsci 11 04043 g020
Figure 21. Comparison of axial compressive strengths ratios of the predicted and the test results within the experimental range 0.344–0.586 of ξ.
Applsci 11 04043 g021
Table 1. Specimen labels and summary of test information.
No.Specimen LabelB or D (cm)t (mm)L (cm)D/tξNu (kN)
1S0112-90--610
2S0212-90--558
3S0312-90--552
4S0412-90--624
5S0512-90--616
6B2119.4390650.5861604
7B2219.4390650.5861448 *
8B2319.4390650.5861596
9B4119.4390650.4351748
10B4219.4390650.4351708
11B4319.4390650.4351672
12P0119.4390650.3441872
13P0219.4390650.3441856
14P0319.4390650.3441624 *
Note: “ξ”, confinement factor; “Nu”, test ultimate bearing capacity; *, welding fracture.
Table 2. Composition of concrete mixture.
LabelCement (kg/m3)Fine Aggregate (kg/m3)Coarse Aggregate (kg/m3)Water (kg/m3)Plasticizer (kg/m3)
Column–S0x4434661098250-
Fill 1–B2x3948387472781.35
Fill 2–B4x5477846822701.76
Fill 3–P0xCommercially available premade mixture
Table 3. Properties of concrete—mean values.
LabelClassfc (MPa)fcu (MPa)fct (MPa)fck (MPa)Ec (GPa)υ (−)ρ (kg/m3)
Column–S0xC35/4538.650.72.2932.827.40.162229
Fill 1–B2xC20/2524.928.31.4718.923.30.172138
Fill 2–B4xC40/5045.958.42.4937.532.10.182211
Fill 3–P0xC70/8572.290.03.7056.536.80.182305
Note: “fc”, cylinder compressive strength; “fcu”, cube compressive strength; “fct”, cube splitting tensile strength; “fck”, characteristic compressive strength; “Ec”, static modulus of elasticity, “υ”, Poisson ratio; “ρ”, density.
Table 4. Ultimate load forces of column models.
Control GroupFill 1Fill 2Fill 3
S0xB2xB4xP0x
Nu,exp (kN)59216001709.31864
Sn (kN)36.75.6638.0211.3
COV (%)6.20.352.20.6
ks (−)2.72.93.2
Table 5. Comparison between calculated member bearing capacities and test results.
LabelNu,eNu,EC4Nu,EC4/Nu,eNu,AISCNu,AISC/Nu,eNu,DBJNu,DBJ/Nu,e
Column–S0x1600.01531.60.9571321.20.8261330.90.832
Fill 1–B2x1709.31798.91.0521588.50.9291633.80.956
Fill 2–B4x1864.02029.51.0891923.31.0321943.41.043
Fill 3–P0x1600.01531.60.9571321.20.8261330.90.832
Publisher’s Note: MDPI stays neutral with regard to jurisdictional claims in published maps and institutional affiliations.

