
Shear Resistance Assessment of the Y-Type Perfobond Rib Shear Connector under Repeated Loadings

Abstract
:1. Introduction
2. Details of Monotonic and Repeated Loading Test Program
2.1. Specimen Details
2.2. Fabrication of Specimens and Material Properties
2.3. Strain Gauge Plan
3. Monotonic and Repeated Loading Tests
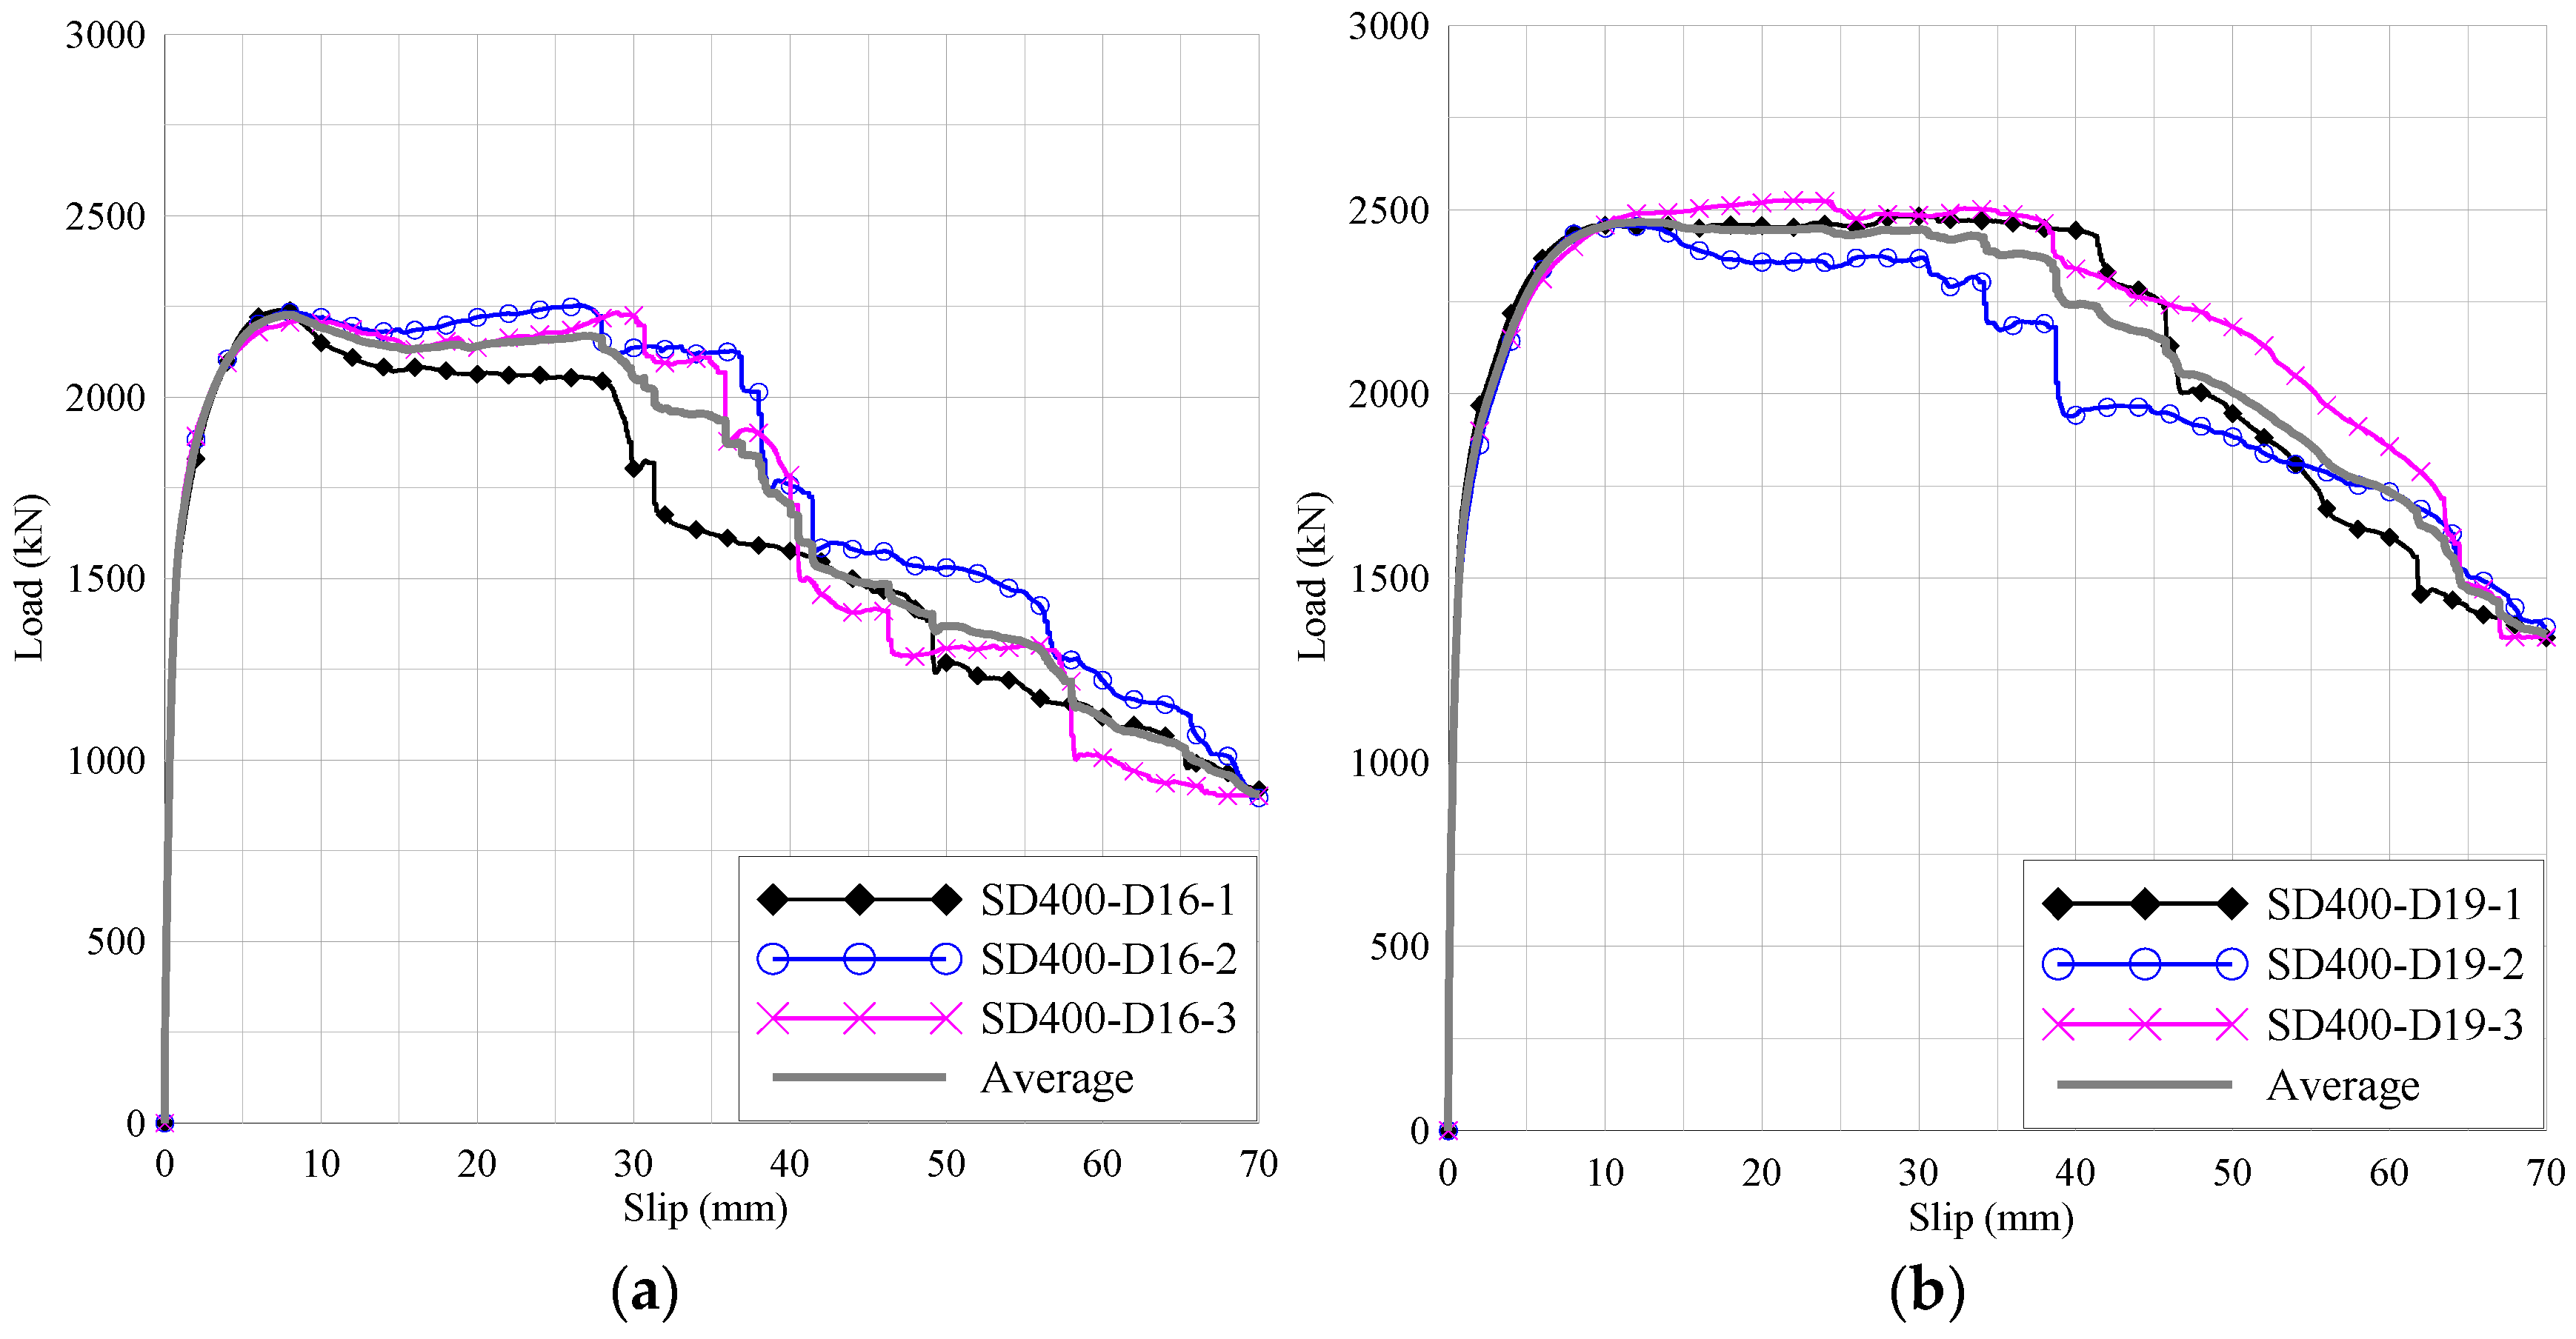
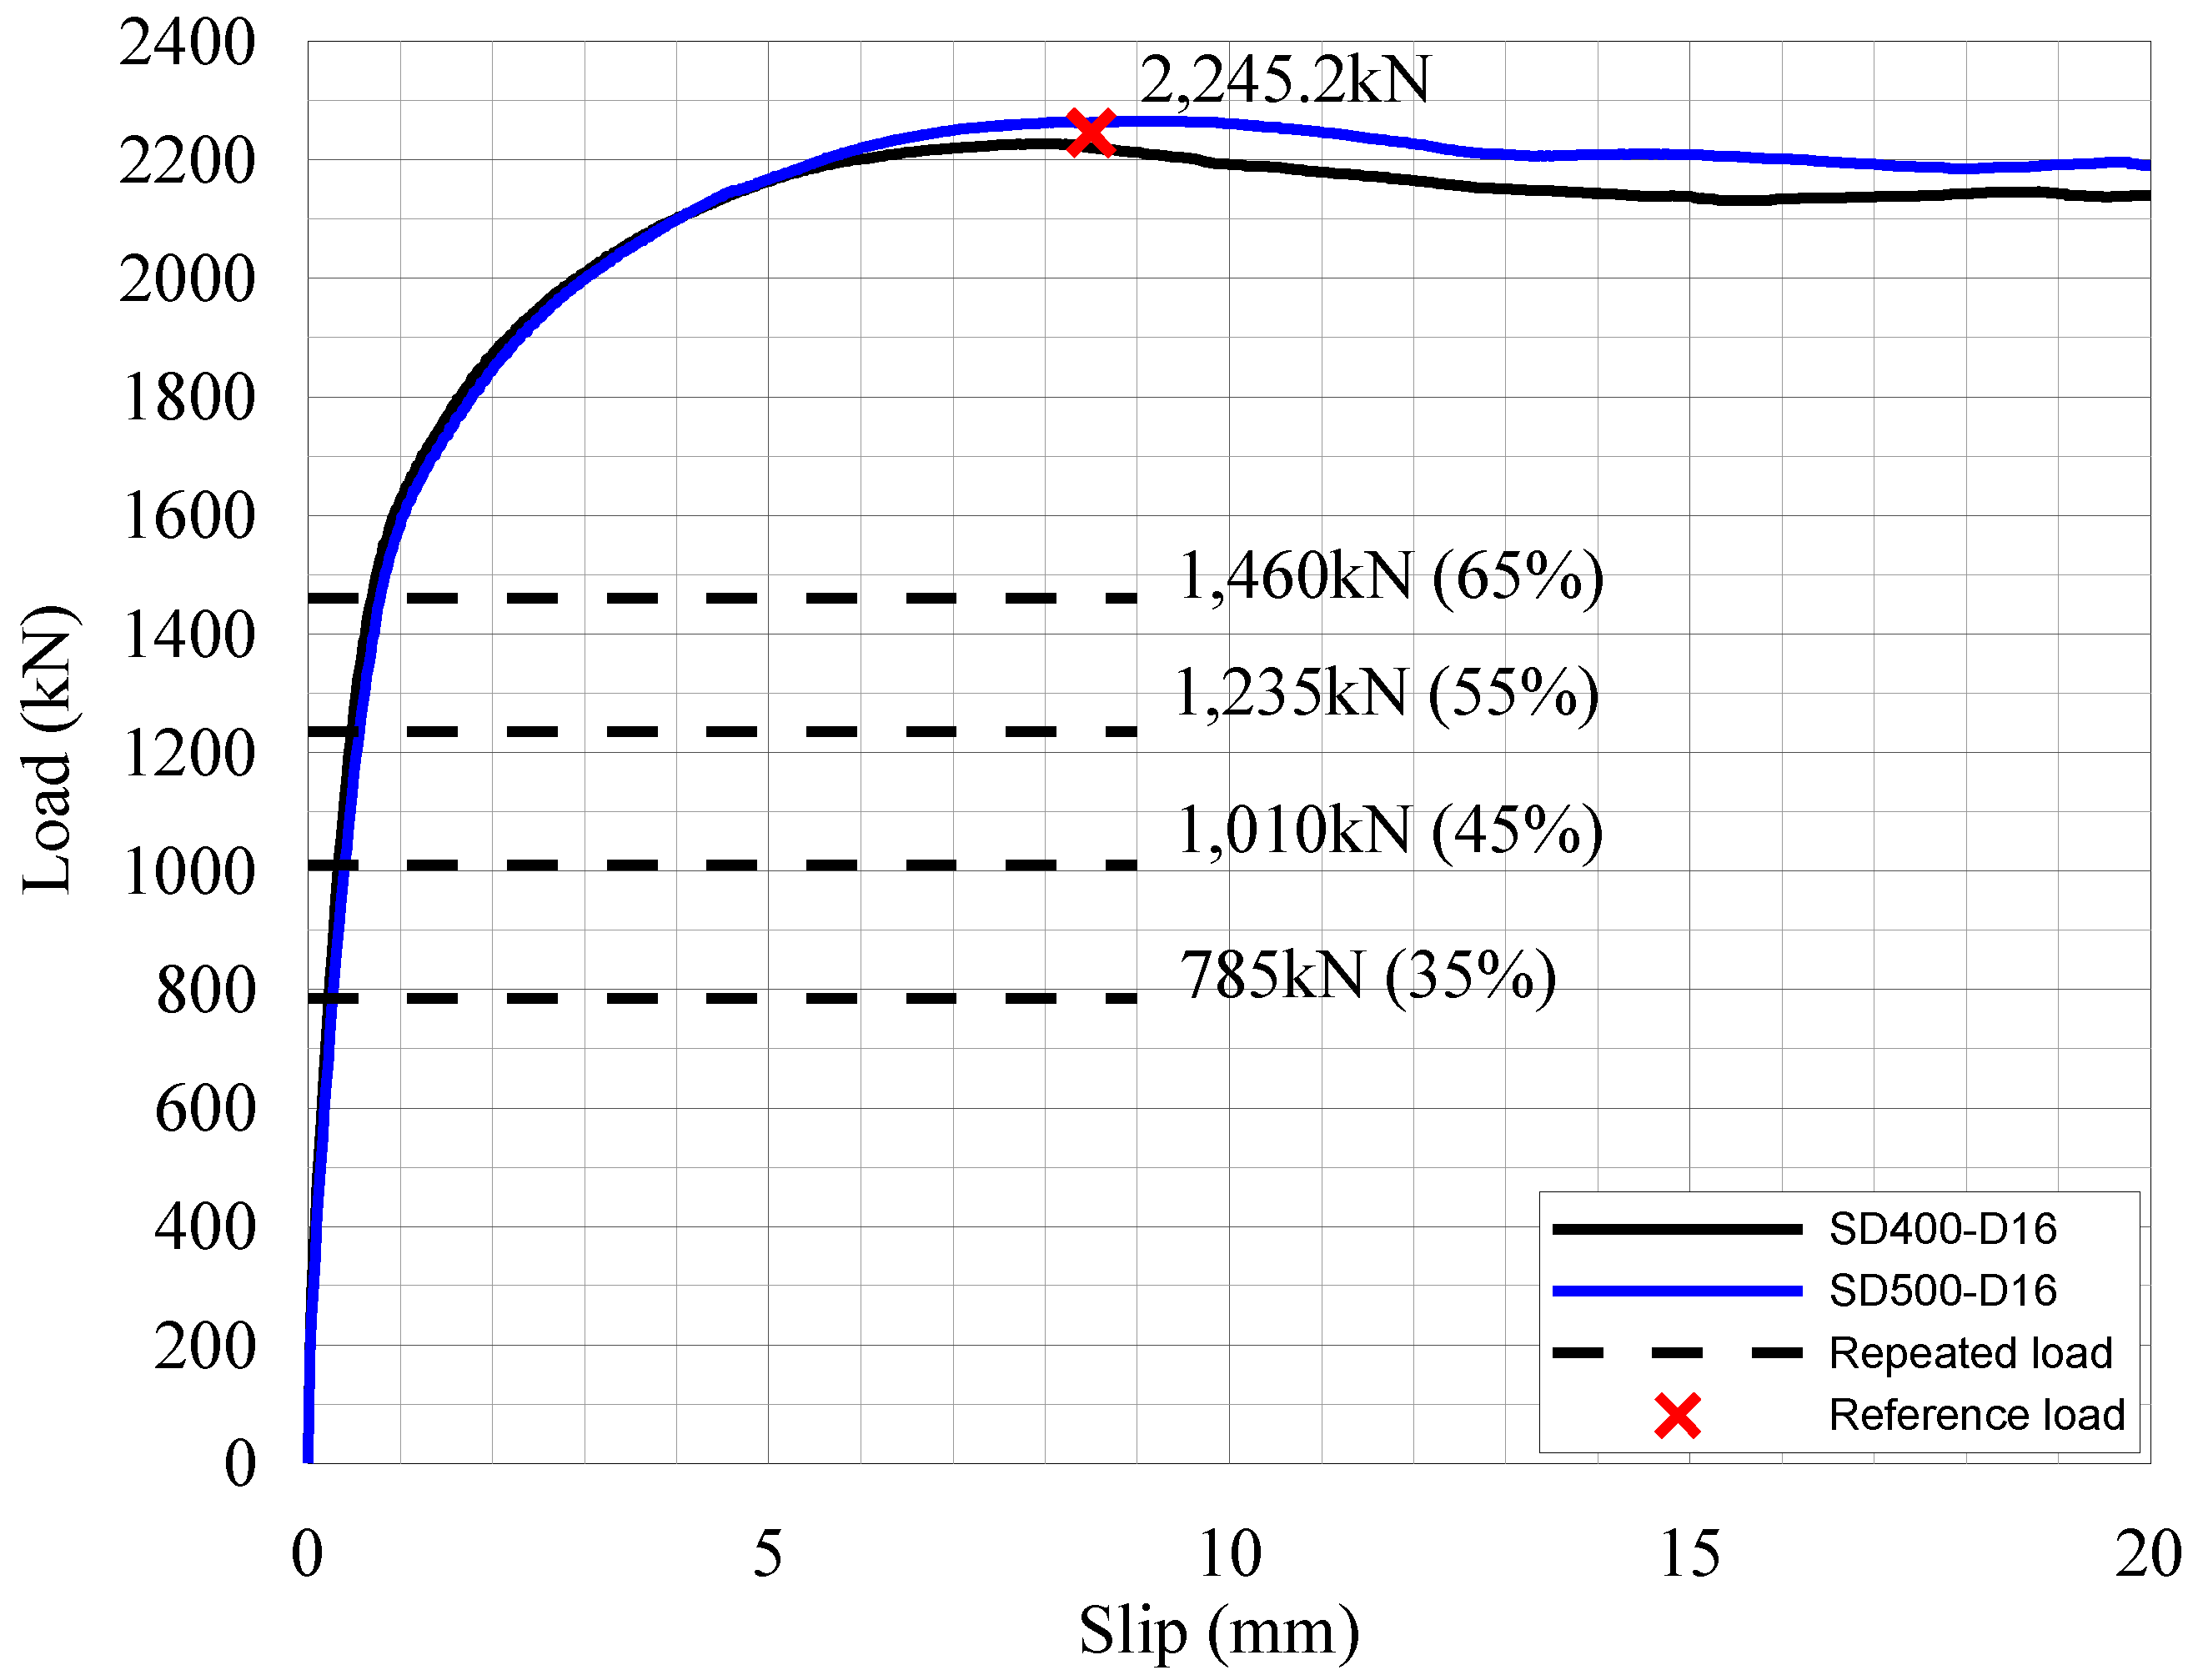
3.1. Monotonic Loading Test
3.1.1. Test Procedure
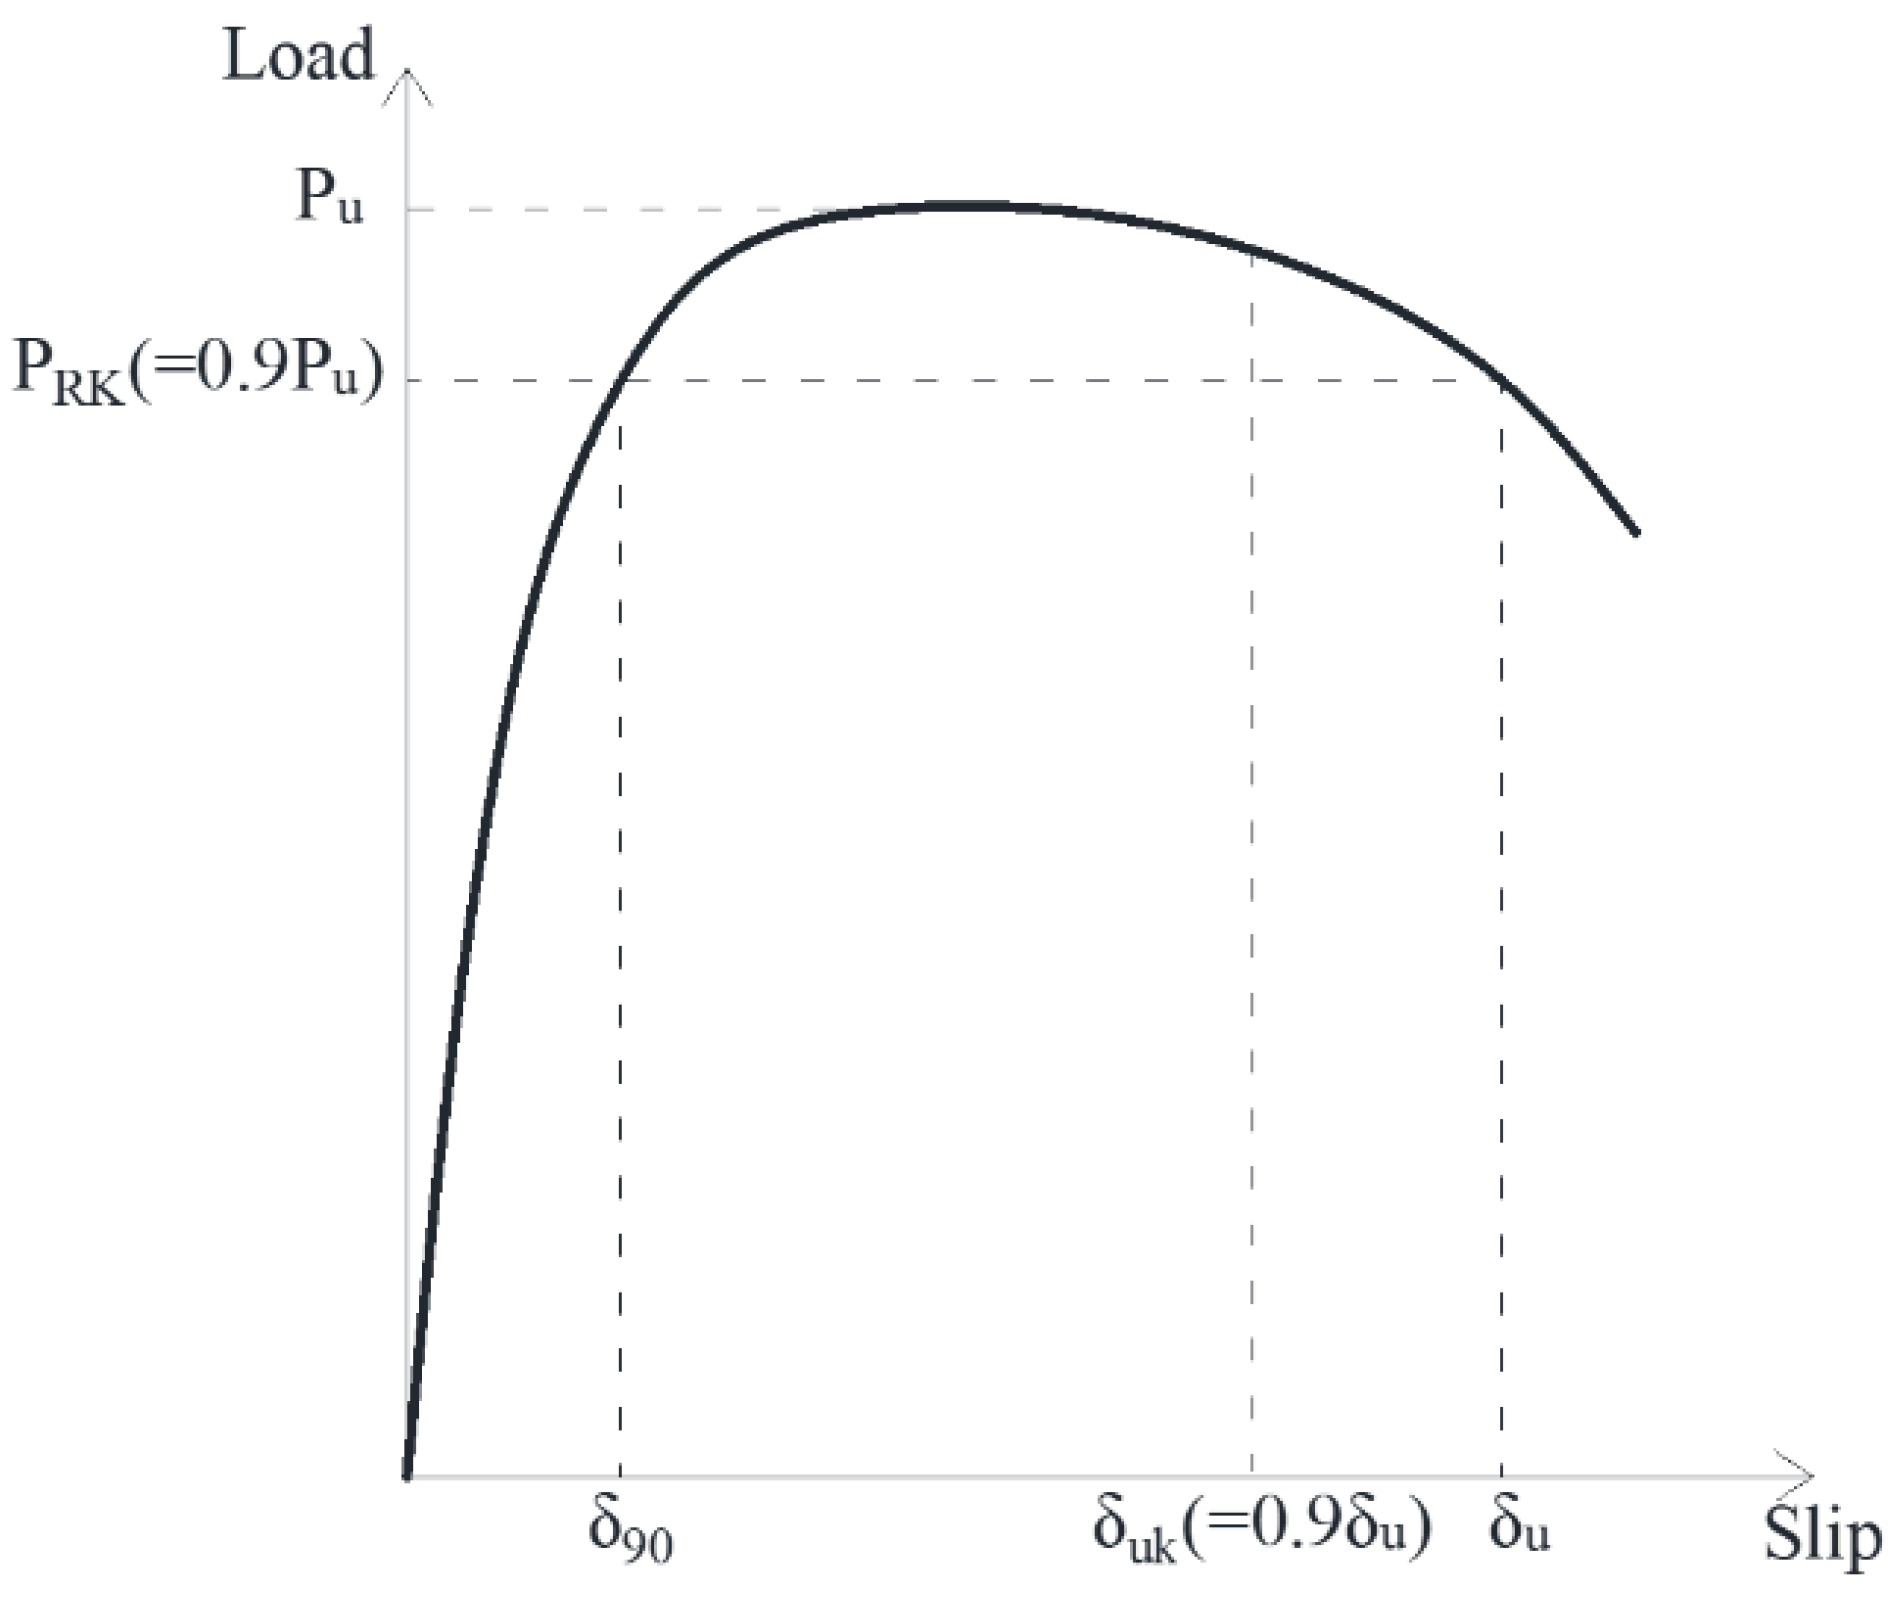
3.1.2. Shear Resistance and Ductility
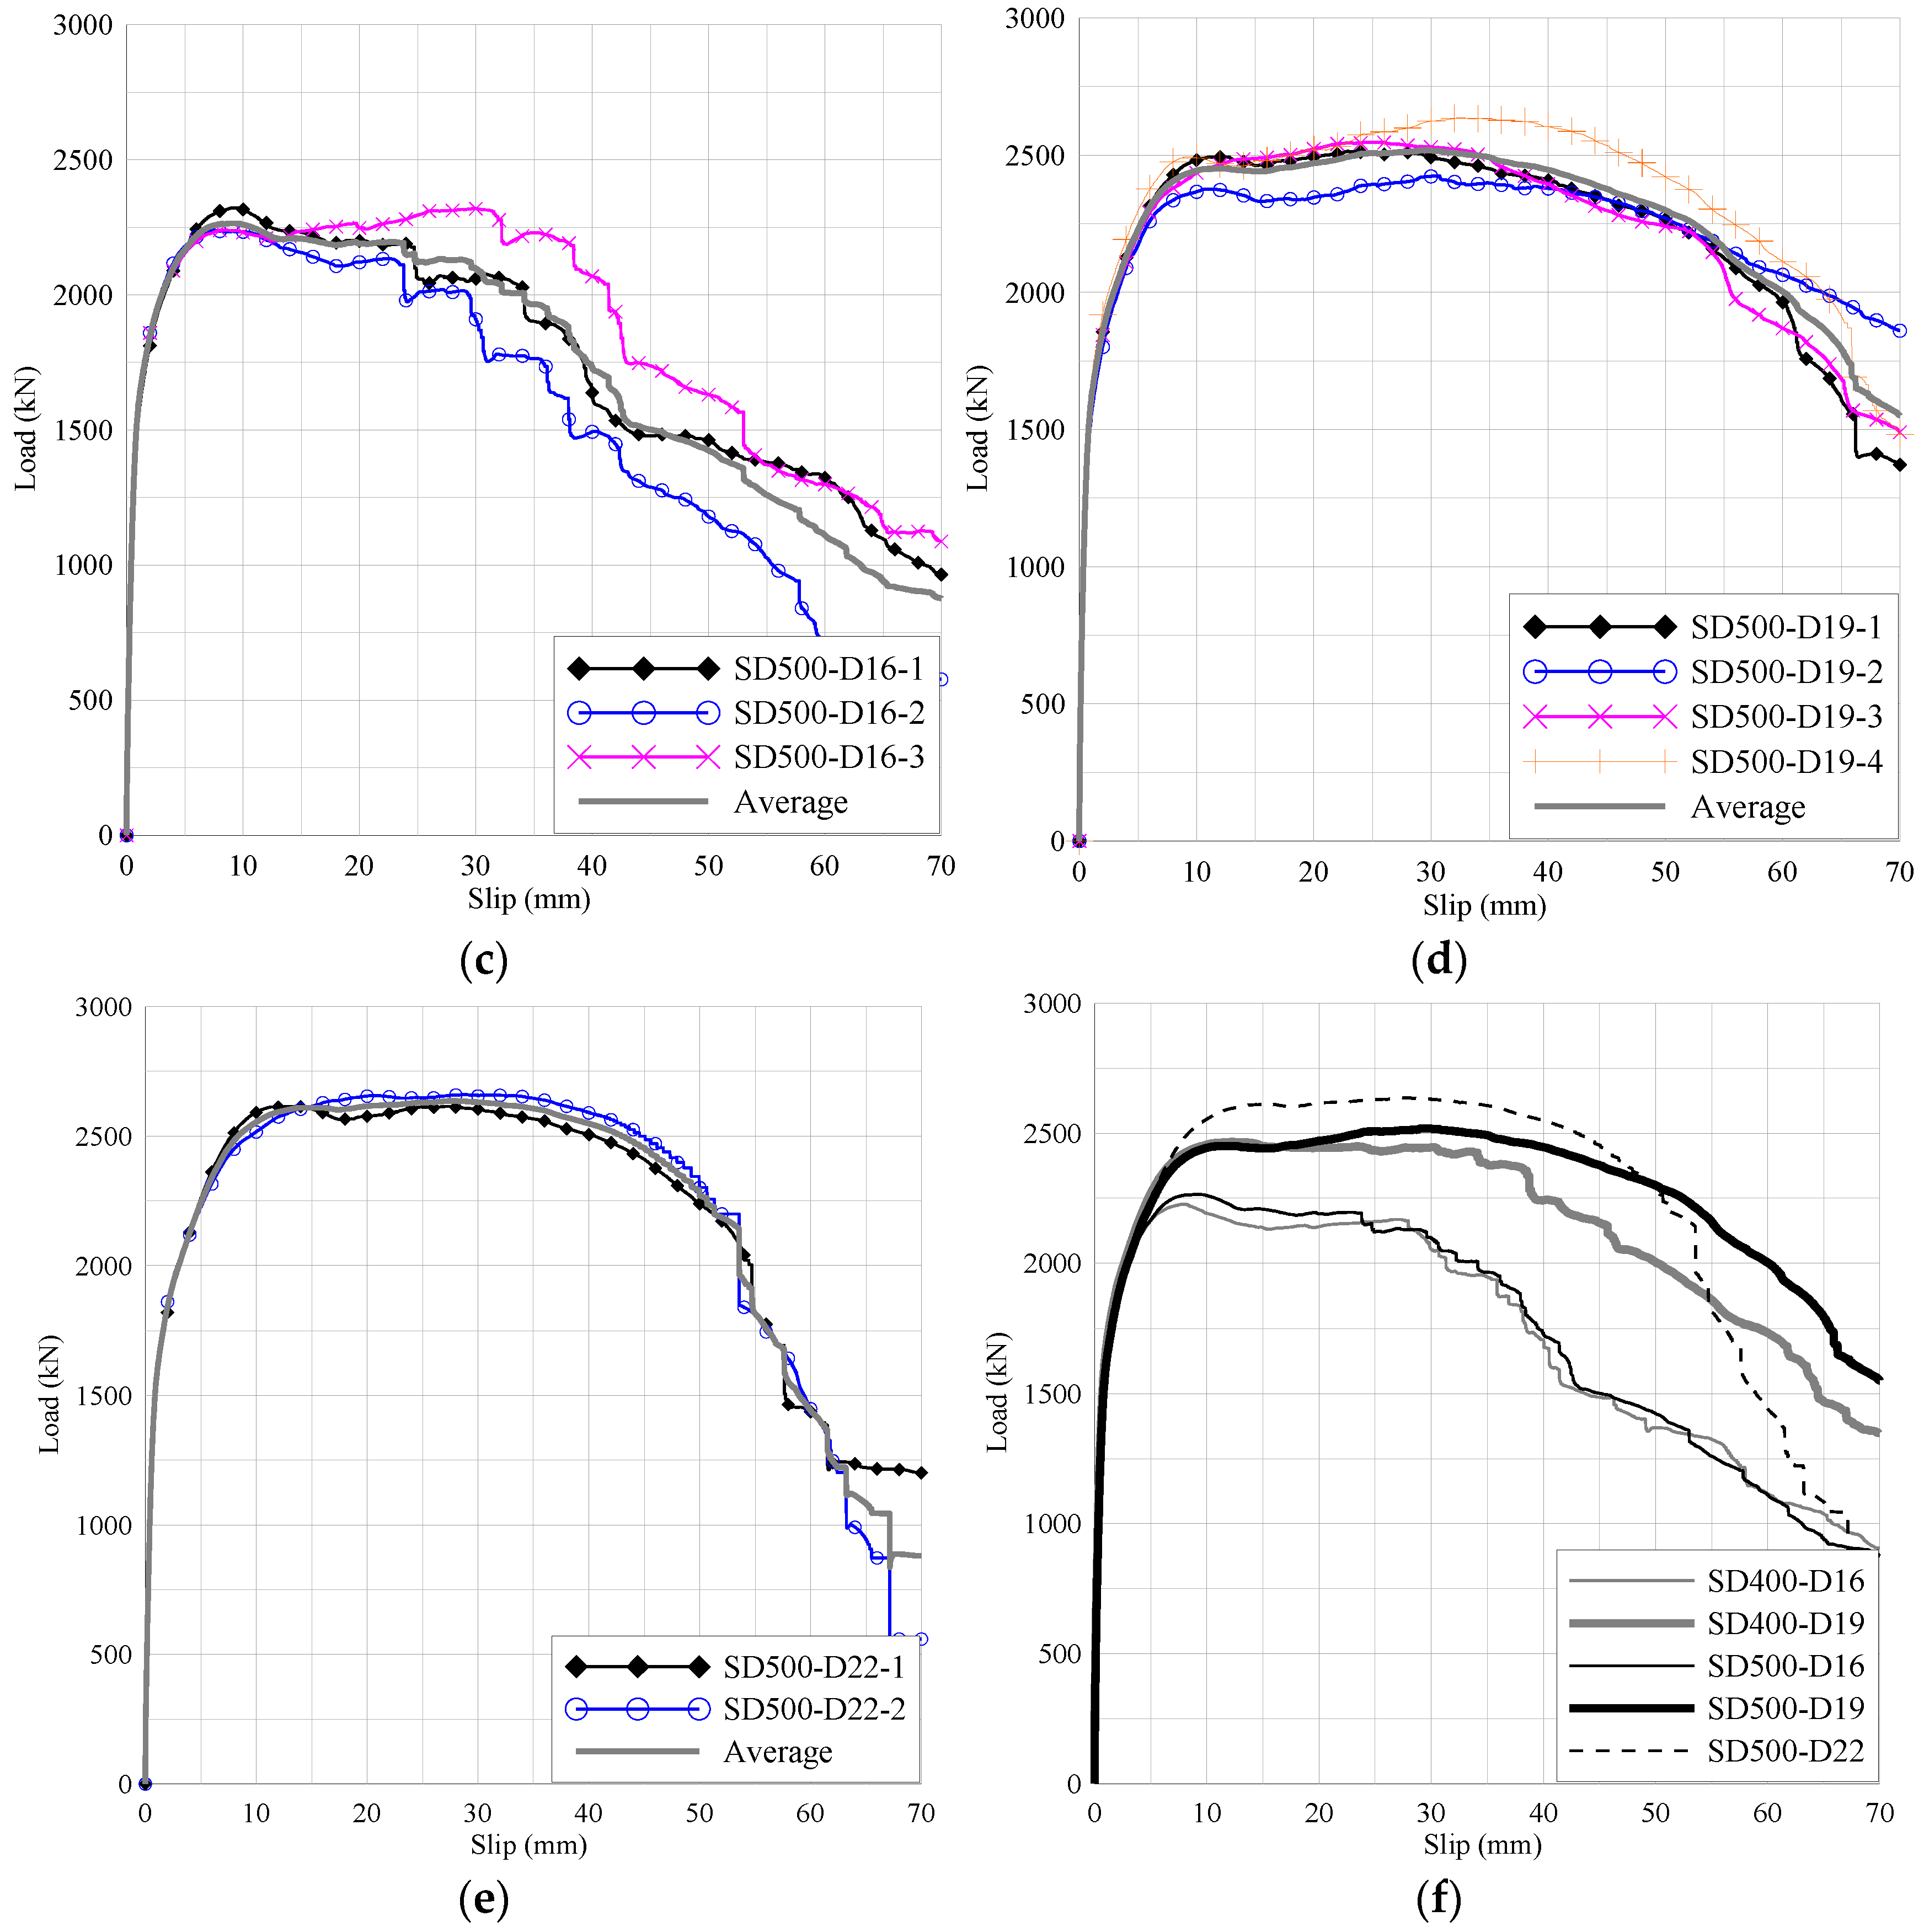
3.1.3. Load–Strain Curve
3.2. Repeated Loading Test
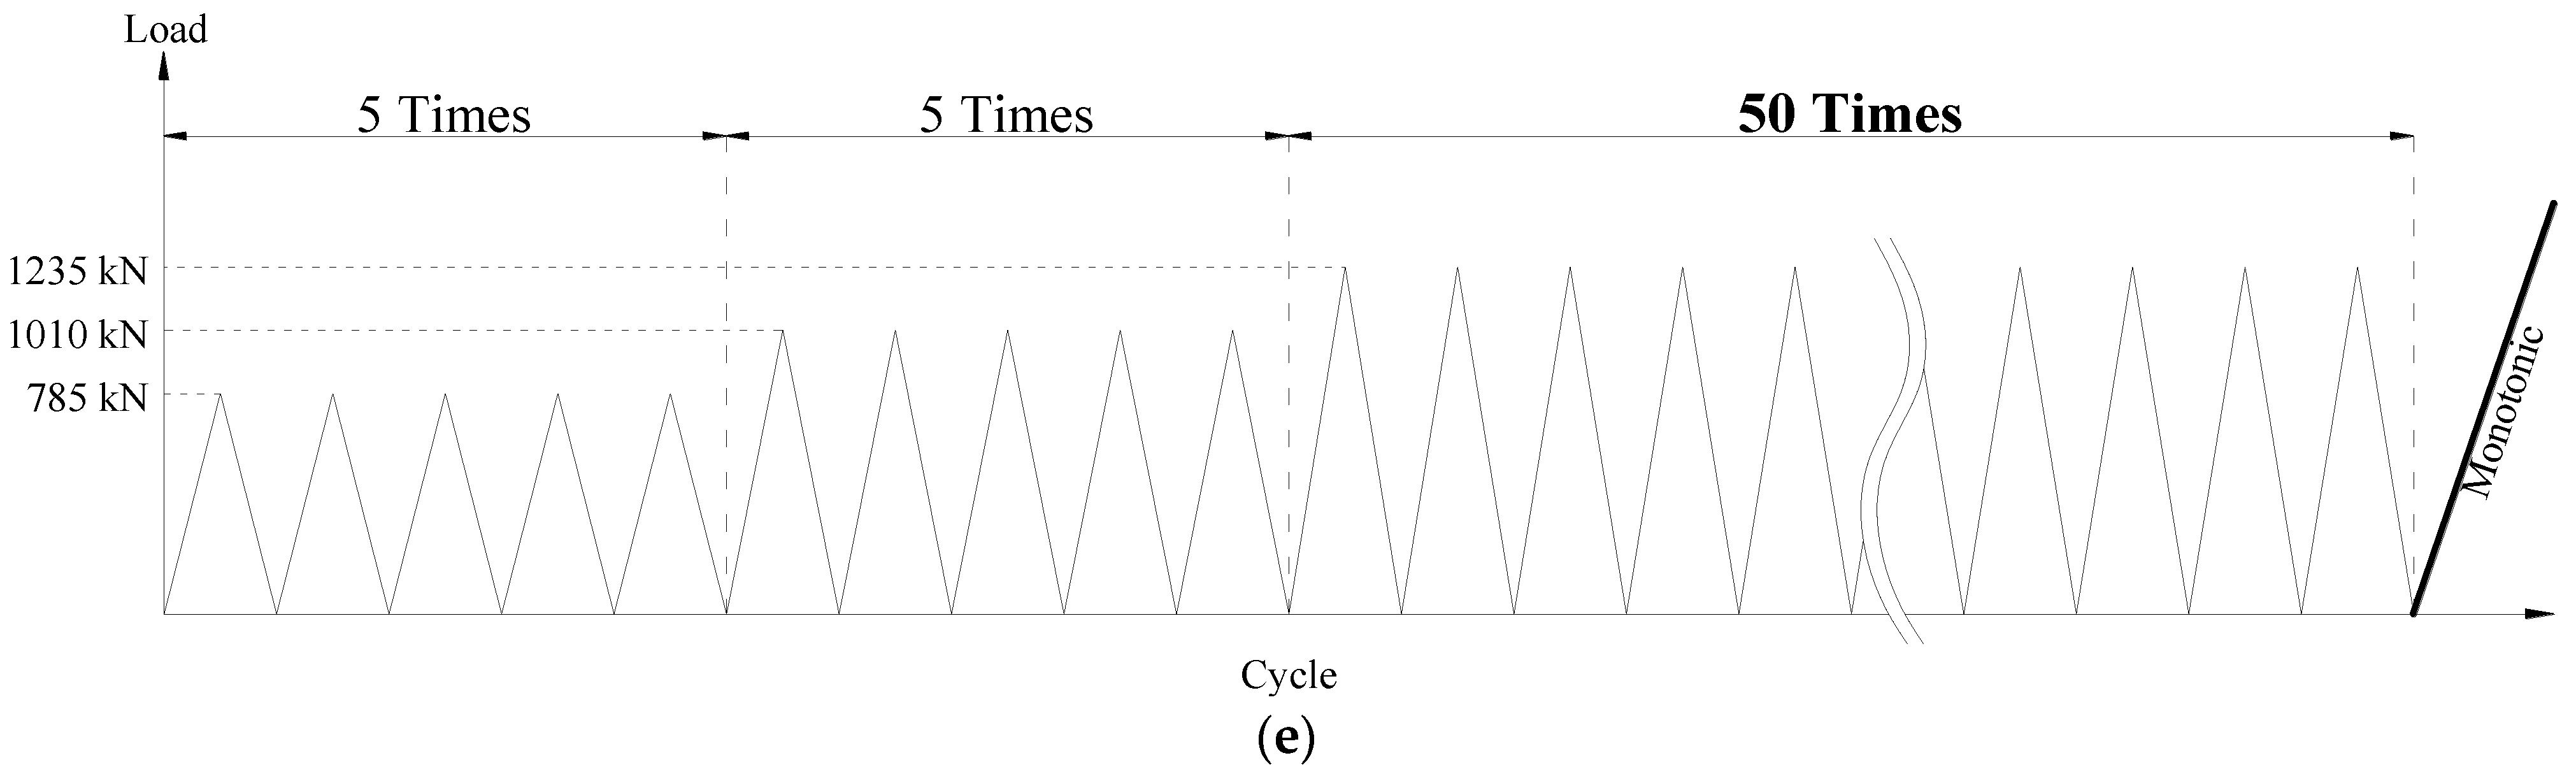
3.2.1. Test Procedure
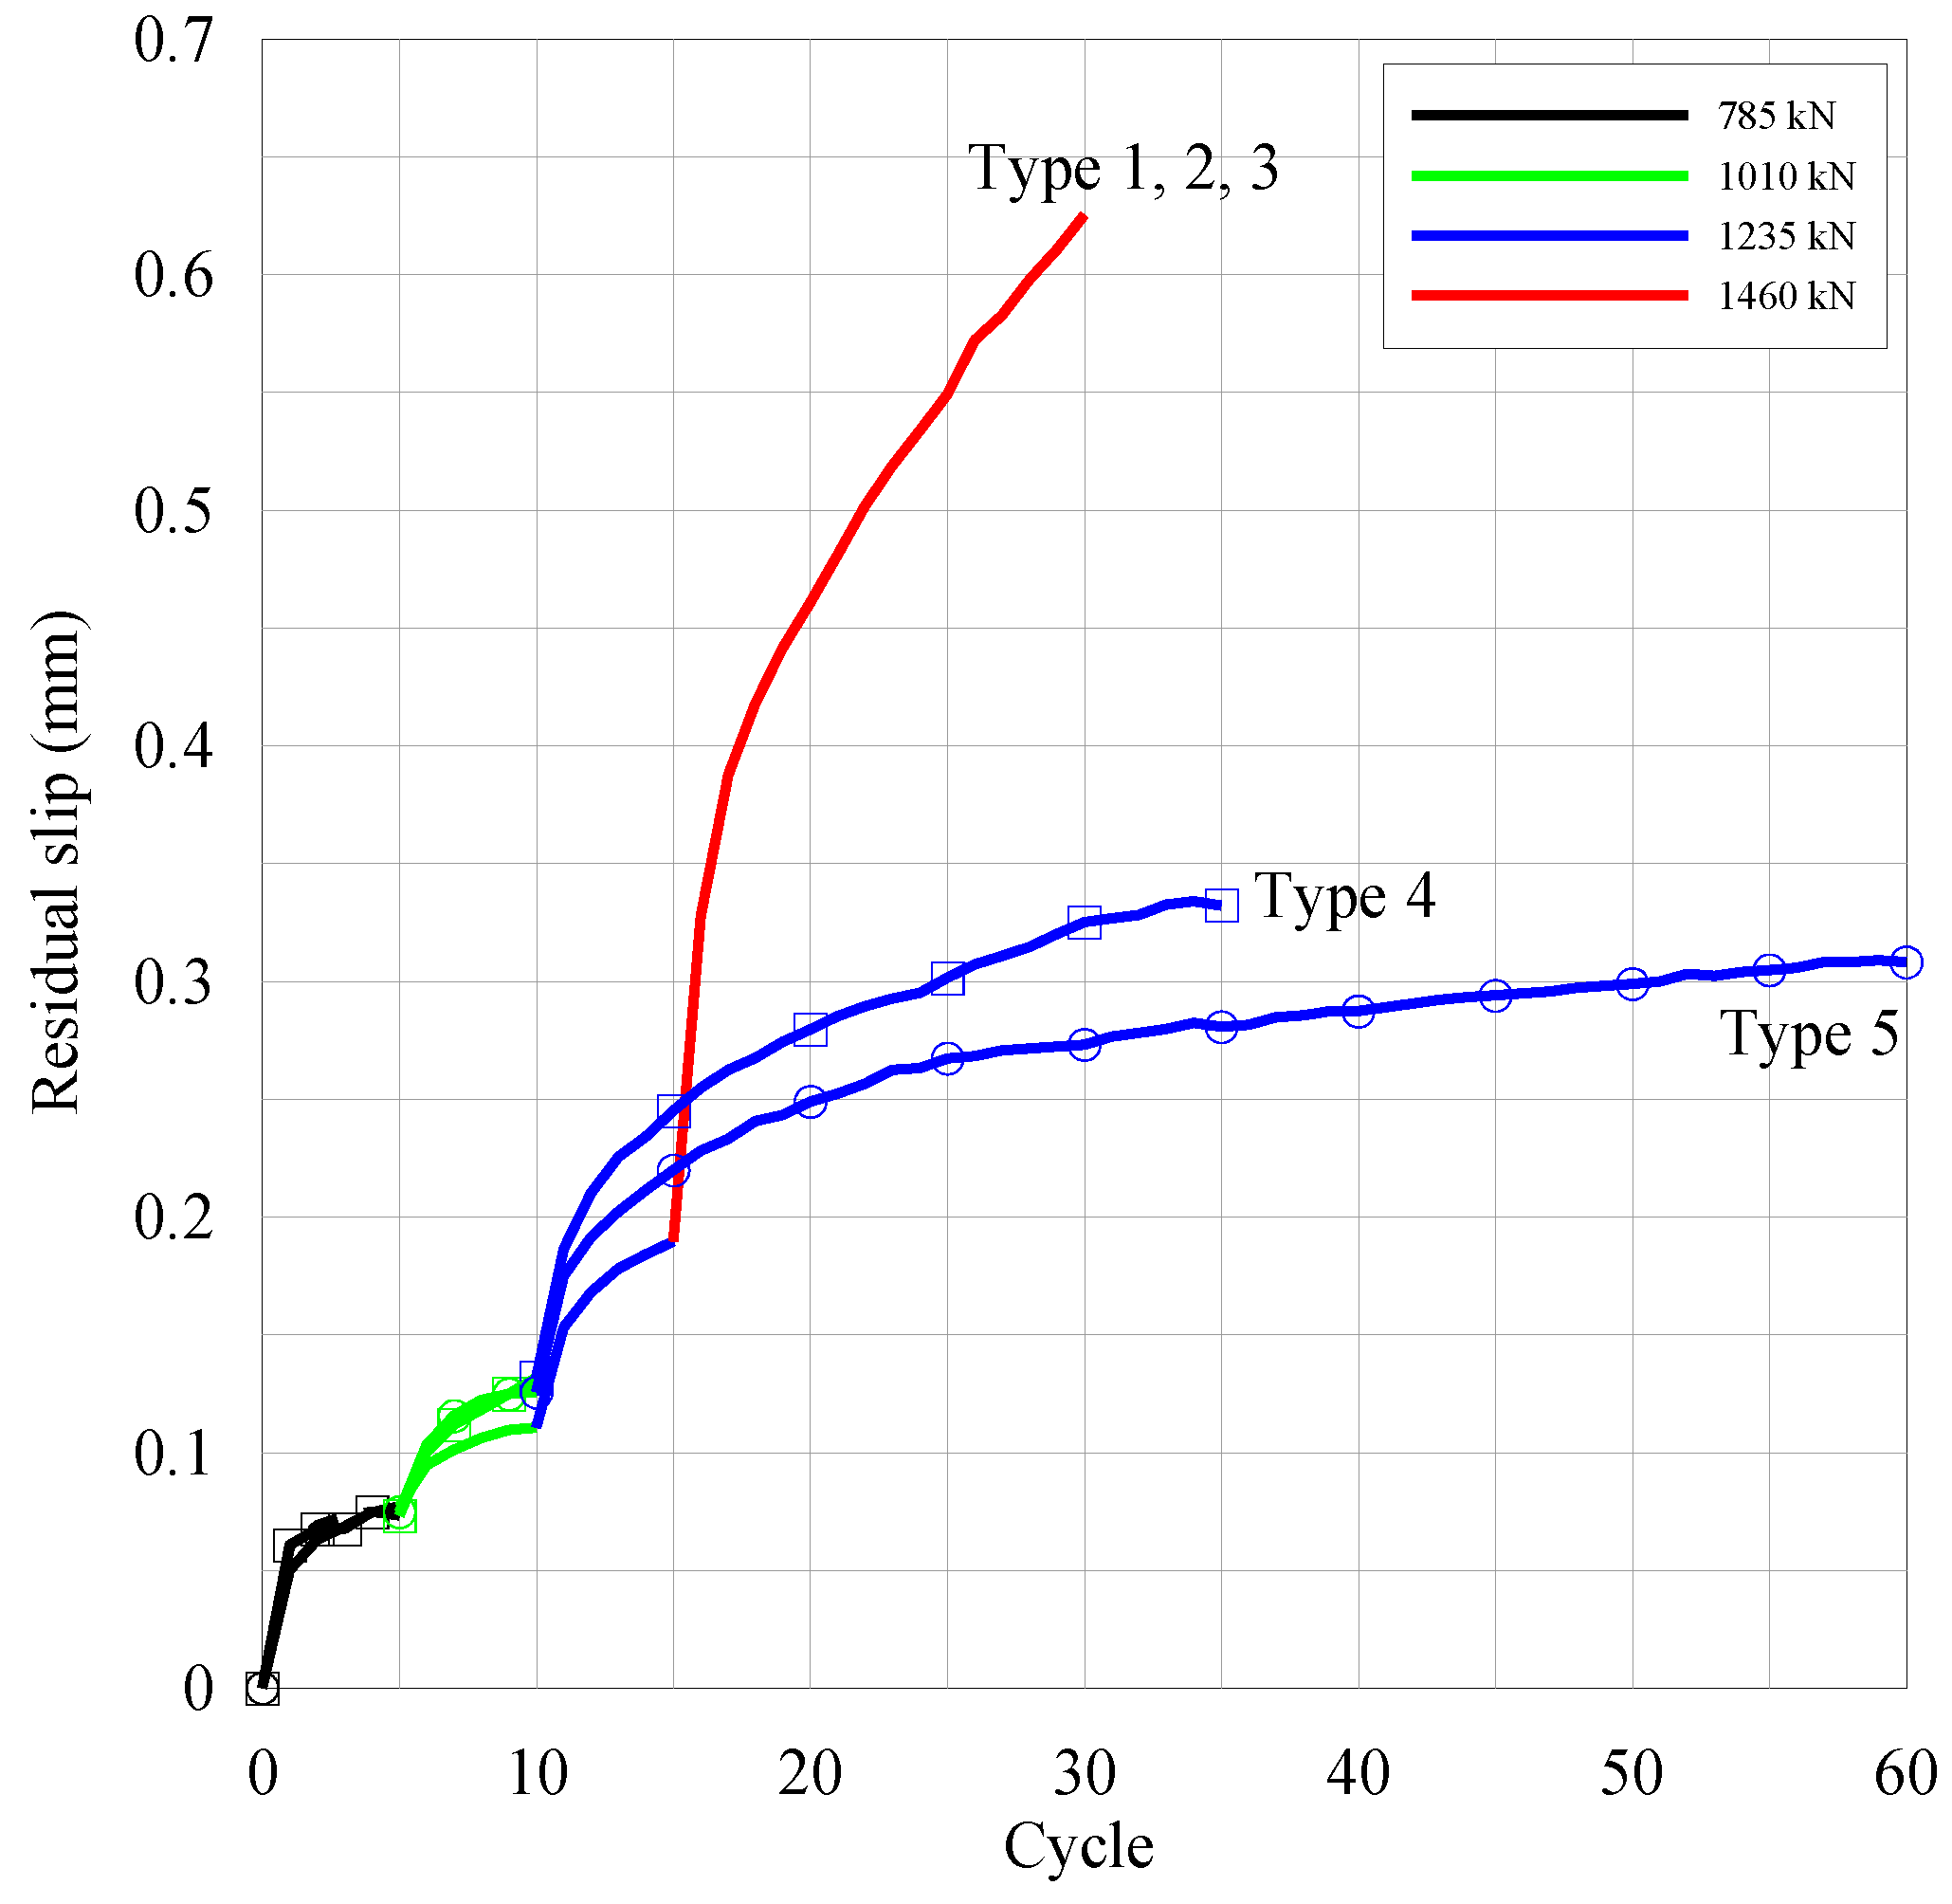
3.2.2. Residual Slip Increment under Repeated Loads
4. Shear Behavior under Repeated Loads
4.1. Residual Shear Performance after Repeated Loads
4.1.1. Residual Shear Strength
4.1.2. Residual Ductility
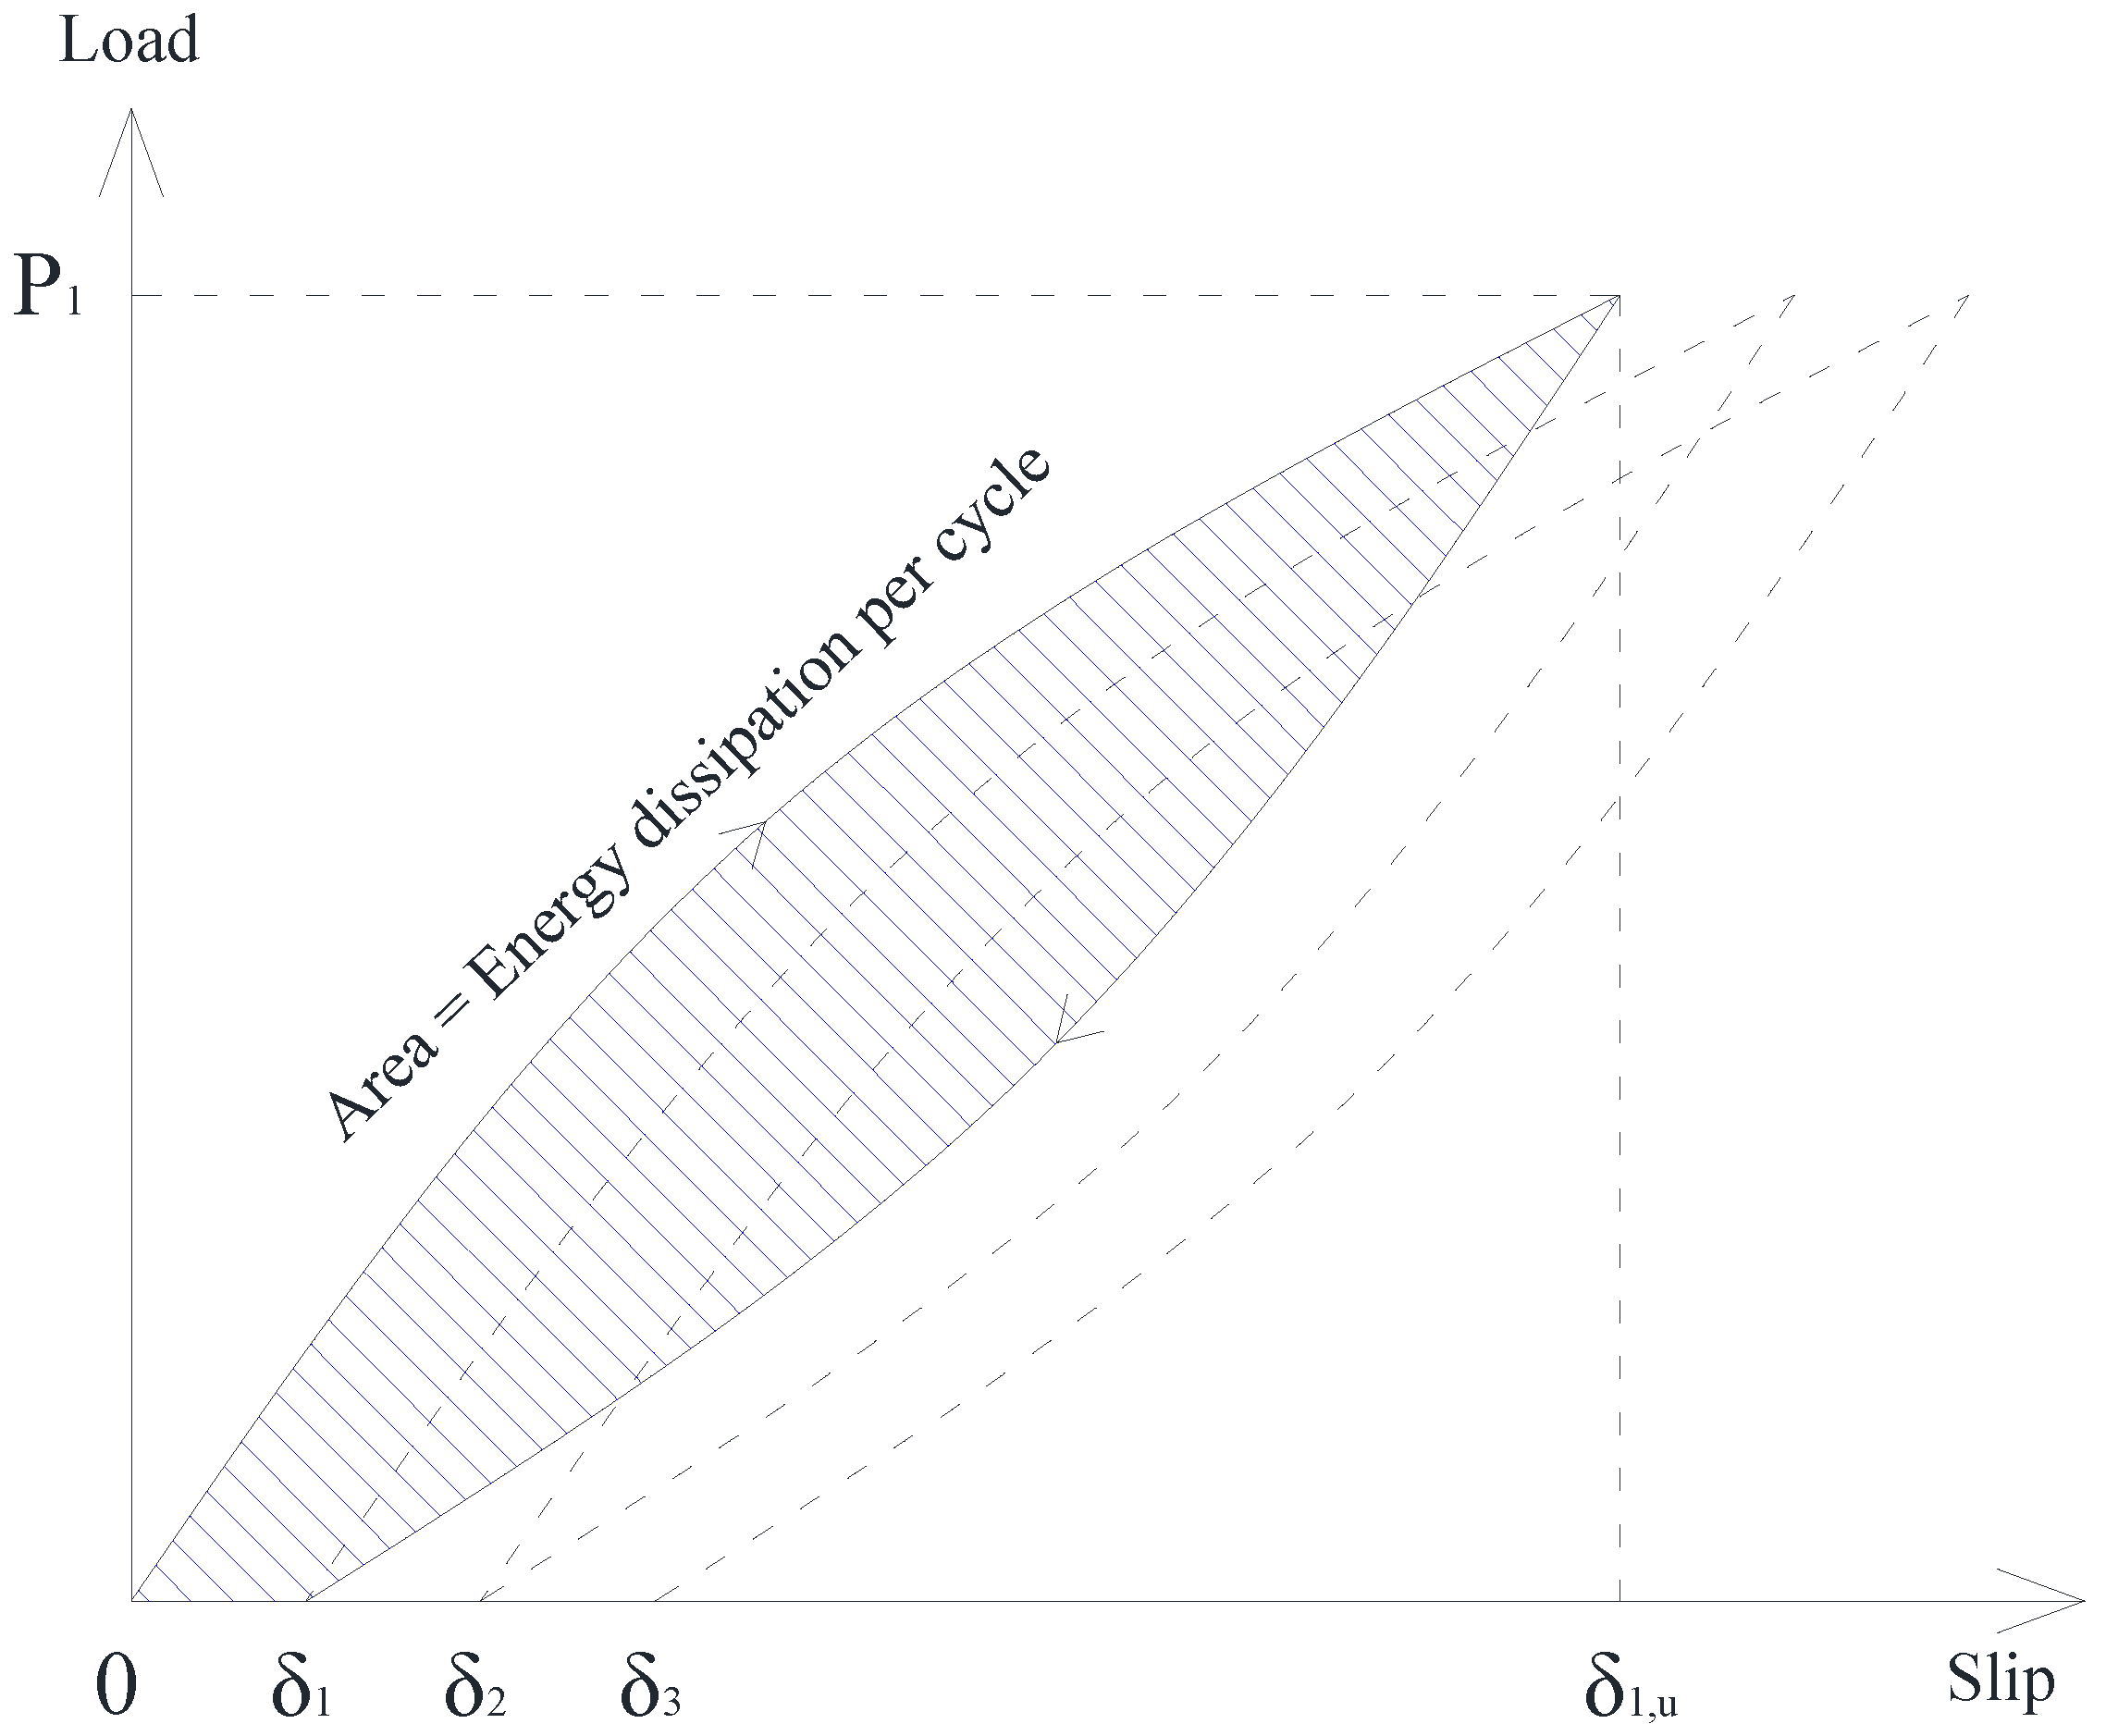
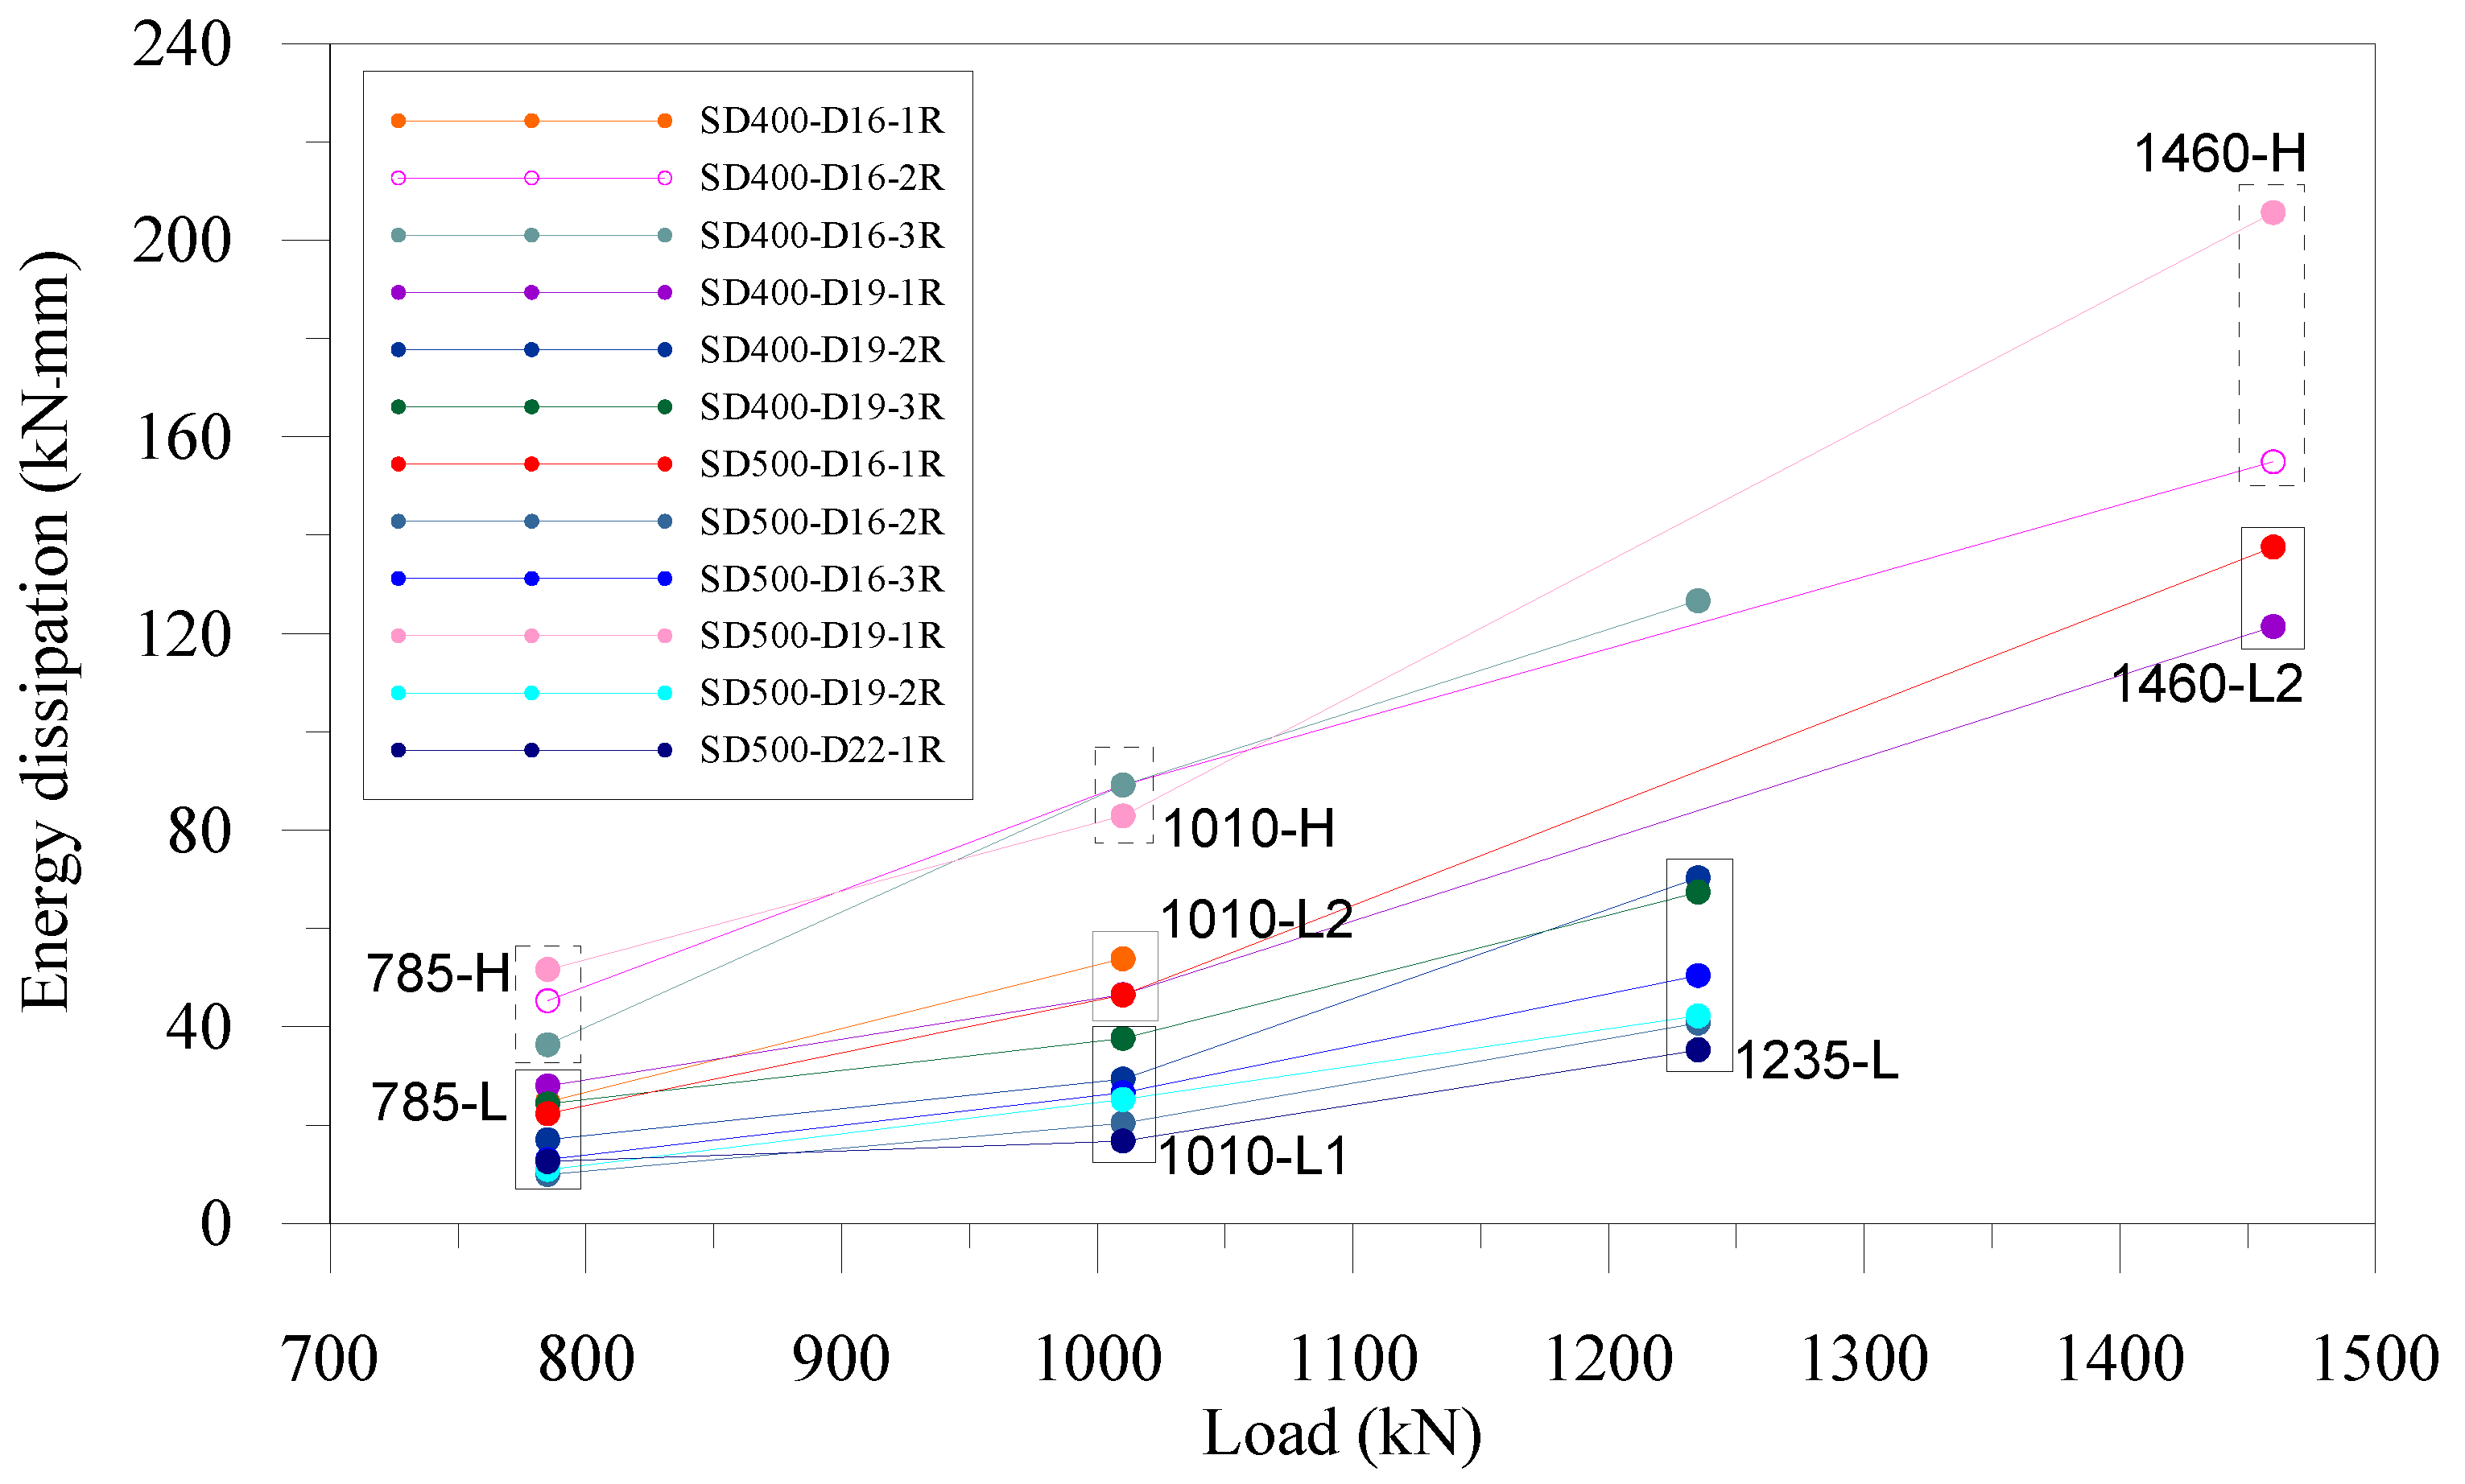
4.2. Energy Dissipation Characteristics under Repeated Loads Depending on Transverse Rebars
5. Residual Shear Strength Design Procedure under Repeated Loads
5.1. Energy Dissipation Models under Repeated Loads
5.2. Design Residual Shear Strength under the Repeated Loads Based on the Actual Shear Strength
5.2.1. Residual Shear Strength Due to the Repeated Loads
5.2.2. Design Residual Shear Strength under Repeated Loads
6. Conclusions
- (1)
- The design residual shear resistance formula under repeated loads was proposed with a resistance (reduction) factor, which can be selected depending on the target reliability level under the repeated load environments. The various reduction factors were provided for the range of target reliability index from 2.0 to 3.0. The proposed procedure can be applied to the other Y-type perfobond rib shear connectors with different design variables and repeated load intensities such as different Y-rib sizes, rebars, concrete strengths, etc.
- (2)
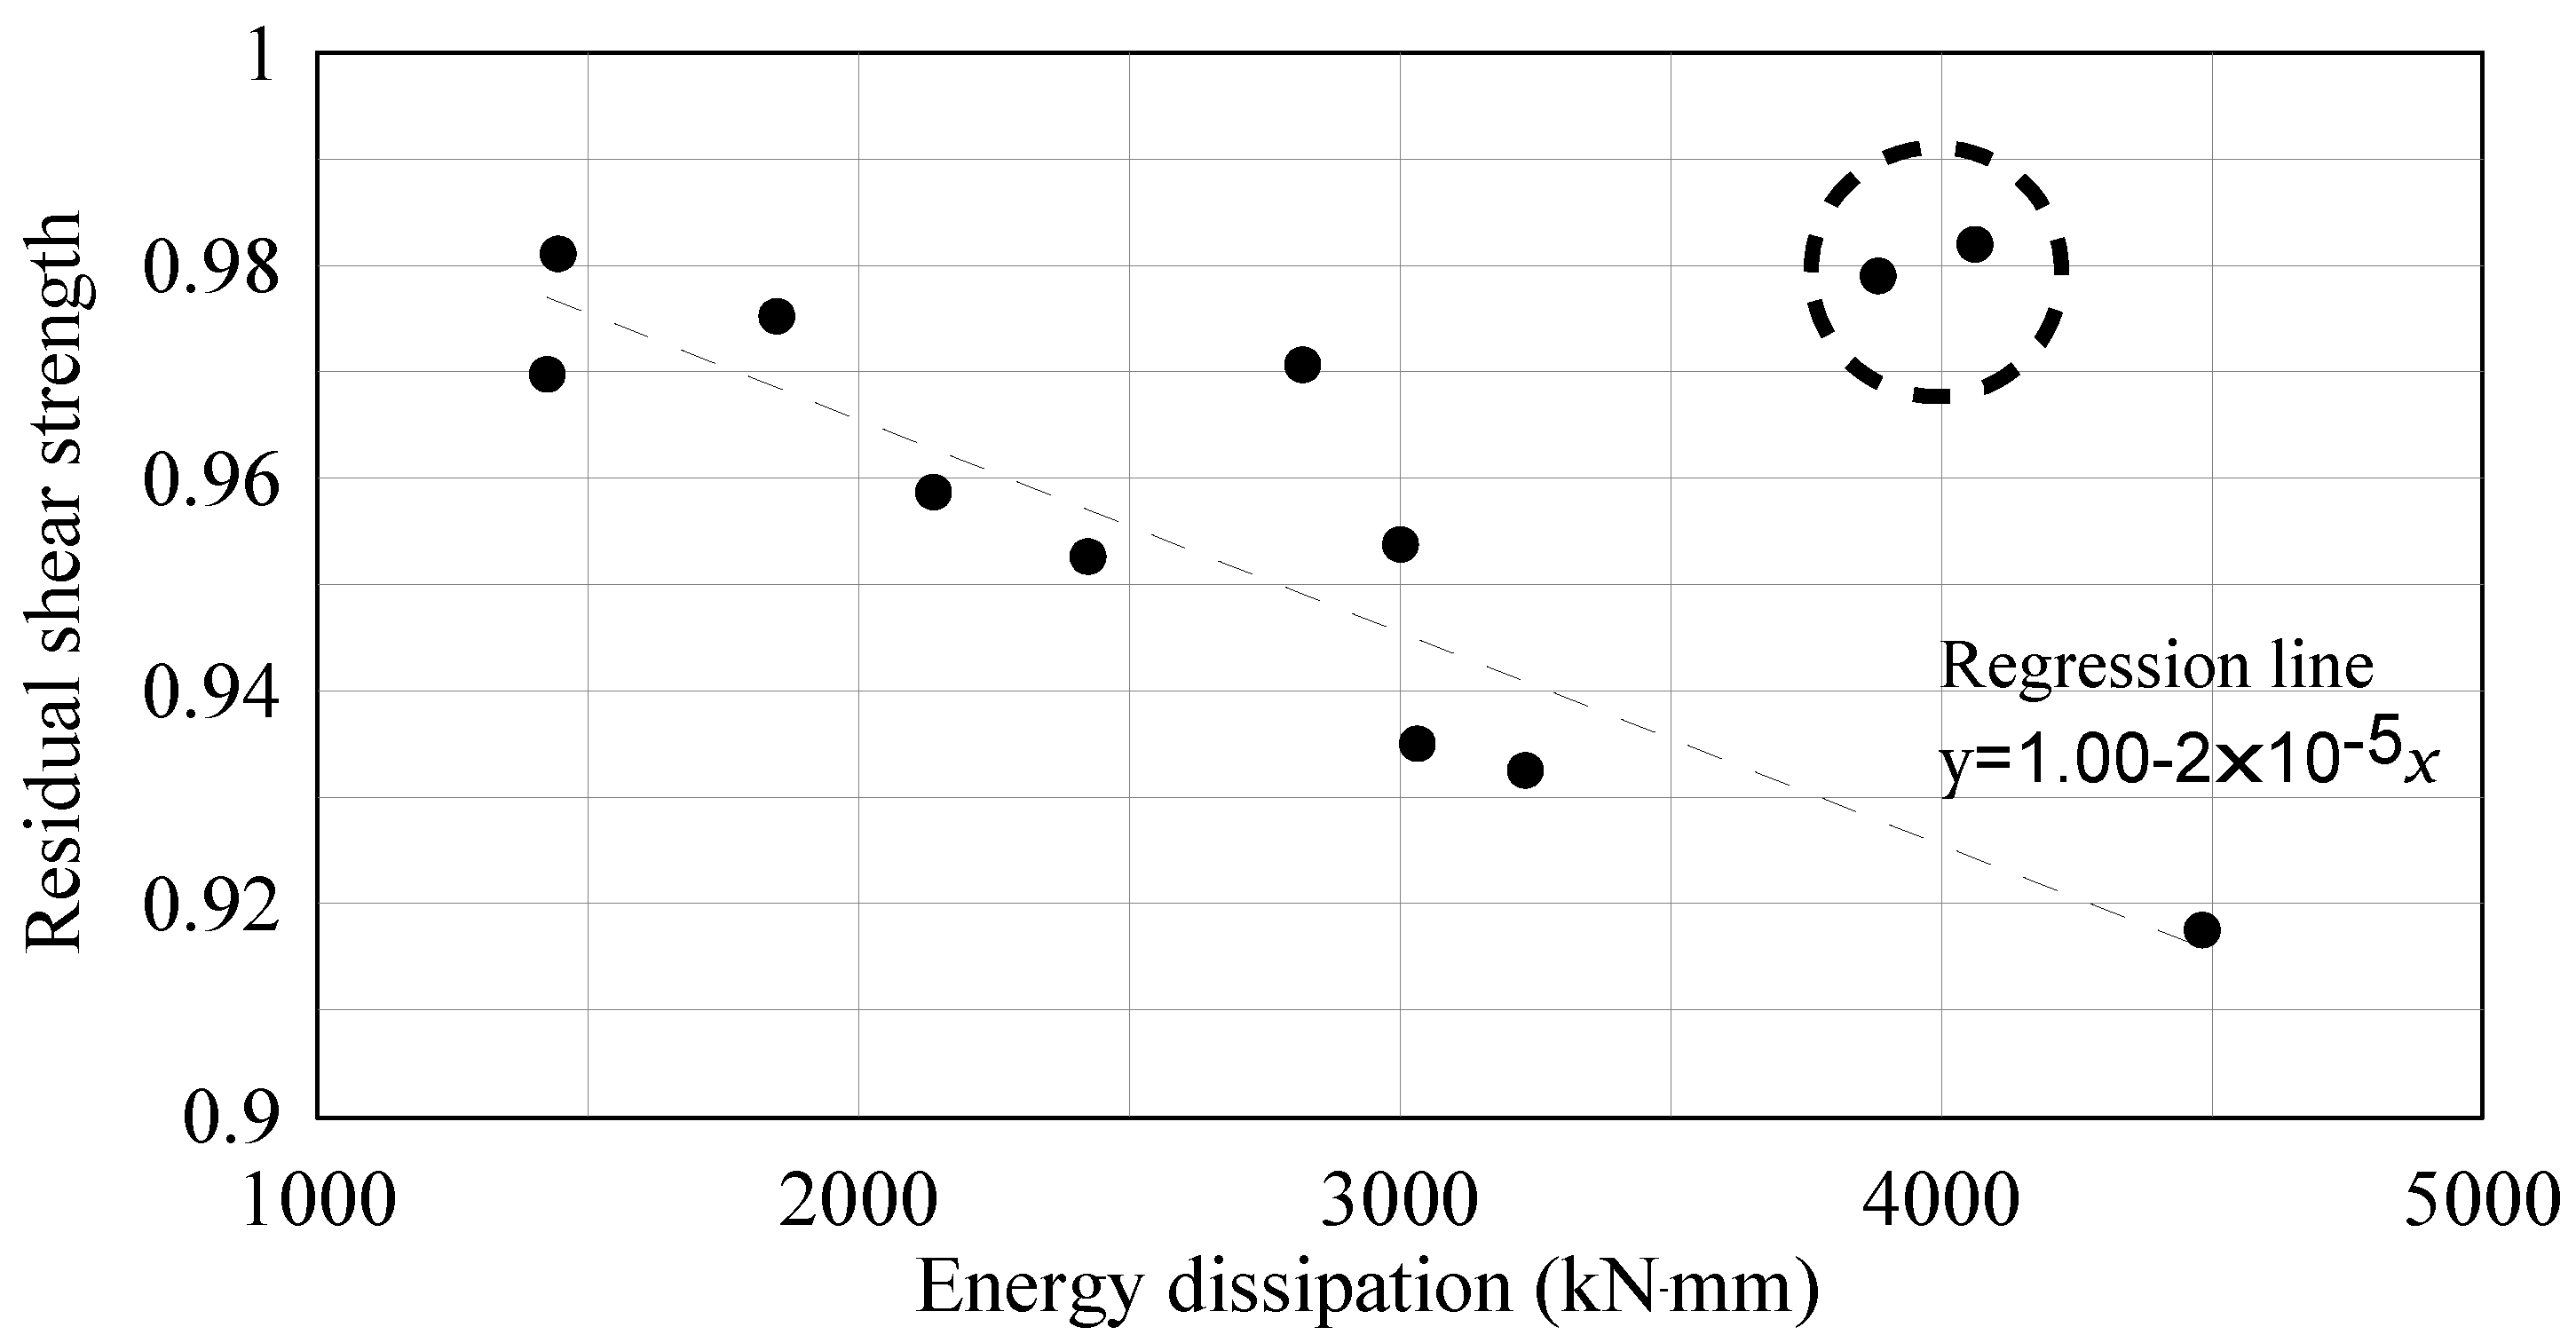
- The residual shear strength of Y-type perfobond rib shear connectors was found to decrease linearly with cumulated energy dissipation due to the repeated loads. The decreasing rate was evaluated to be quite stable with . The nominal residual shear strength can be estimated from the residual shear strength factor and the nominal shear strength. The residual shear strength factor was estimated by empirical data from the monotonic loading tests on the various specimens that have experienced various repeated loads.
- (3)
- It was found that the energy dissipation per each repeated load converges after 5–10 repetitions when the load intensity is up to 65% of the ultimate shear strength. However, the repeated load intensities over 65% of the ultimate shear strength generate scattered energy dissipations. It was also found that the residual slip increment due to repeated load does not become stable when the repeated load intensity exceeds 55% of the ultimate shear resistance.
- (4)
- From the load–strain relationships on the Y-ribs and rebars, it was found that Y-ribs contribute mainly to the shear resistance when the load is below 55% of the ultimate shear strength.
- (5)
- The residual ductility of Y-type perfobond rib shear connector remains intact after the repeated loads, given that the intensity of the repeated loads does not exceed 65% of the ultimate shear strength.
Author Contributions
Funding
Institutional Review Board Statement
Informed Consent Statement
Data Availability Statement
Conflicts of Interest
Appendix A. Energy Dissipation Models under Repeated Loads

| Cycle | 1 | 2 | 3 | 4 * | 5 * |
|---|---|---|---|---|---|
| Specimens | 12 | → | → | → | → |
| Averaged dissipated energy | 65.06 | 35.03 | 26.97 | 25.79 | 23.56 |
| Min. | 44.18 | 14.66 | 10.67 | 12.58 | 7.12 |
| Max. | 99.84 | 61.26 | 49.78 | 49.76 | 53.54 |
| Cycle | 1 | 2 | 3 | 4 * | 5 * |
|---|---|---|---|---|---|
| Specimens | 12 | → | → | → | → |
| Averaged dissipated energy | 71.66 | 55.45 | 48.97 | 45.02 | 45.86 |
| Min. | 50.95 | 33.44 | 24.54 | 11.52 | 21.47 |
| Max. | 100.57 | 85.76 | 85.81 | 89.89 | 88.44 |
| Cycle | 1 | 2 | 3 | 4 | 5 | 6 | 7 | 8 | 9 | 10 * |
|---|---|---|---|---|---|---|---|---|---|---|
| Specimens | 12 | → | → | → | → | 6 | → | → | → | → |
| Averaged dissipated energy | 121.59 | 92.13 | 86.56 | 81.27 | 81.54 | 67.32 | 67.85 | 64.99 | 68.29 | 61.39 |
| Min. | 82.30 | 46.50 | 55.20 | 41.41 | 47.80 | 35.34 | 45.77 | 40.16 | 40.81 | 30.59 |
| Max. | 118.37 | 74.06 | 79.28 | 74.42 | 71.24 | 70.43 | 74.29 | 68.40 | 67.71 | 70.30 |
| Cycle | 11 * | 12 * | 13 * | 14 | 15 | 16 | 17 | 18 | 19 | 20 |
| Specimens | → | → | → | → | → | → | → | → | → | → |
| Averaged dissipated energy | 58.90 | 62.69 | 64.47 | 62.99 | 61.50 | 63.86 | 60.47 | 59.88 | 60.68 | 60.38 |
| Min. | 28.17 | 41.12 | 37.38 | 41.62 | 28.12 | 40.25 | 40.37 | 40.68 | 39.67 | 38.57 |
| Max. | 71.95 | 69.69 | 73.44 | 74.56 | 75.35 | 69.83 | 68.15 | 65.86 | 63.19 | 67.78 |
| Cycle | 21 | 22 | 23 | 24 | 25 | 26 | 27 | 28 | 29 | 30 |
| Specimens | → | → | → | → | → | 3 | → | → | → | → |
| Averaged dissipated energy | 59.07 | 60.22 | 57.86 | 58.44 | 54.09 | 56.54 | 57.83 | 53.09 | 45.81 | 50.61 |
| Min. | 37.52 | 34.79 | 29.17 | 33.56 | 22.93 | 43.13 | 47.33 | 43.60 | 29.38 | 30.03 |
| Max. | 64.76 | 69.54 | 68.53 | 70.69 | 67.87 | 74.69 | 74.84 | 68.19 | 62.99 | 72.32 |
| Cycle | 31 | 32 | 33 | 34 | 35 | 36 | 37 | 38 | 39 | 40 |
| Specimens | → | → | → | → | → | → | → | → | → | → |
| Averaged dissipated energy | 44.32 | 49.99 | 44.51 | 53.90 | 53.97 | 45.70 | 48.56 | 51.56 | 50.98 | 52.86 |
| Min. | 25.57 | 34.68 | 19.91 | 44.89 | 46.70 | 20.14 | 37.73 | 46.43 | 41.40 | 37.68 |
| Max. | 61.89 | 66.28 | 69.36 | 67.75 | 67.08 | 66.26 | 63.56 | 60.62 | 66.37 | 72.50 |
| Cycle | 41 | 42 | 43 | 44 | 45 | 46 | 47 | 48 | 49 | 50 |
| Specimens | → | → | → | → | → | → | → | → | → | → |
| Averaged dissipated energy | 54.27 | 53.46 | 51.48 | 49.30 | 53.48 | 53.52 | 50.83 | 50.44 | 48.90 | 56.32 |
| Min. | 44.91 | 45.76 | 38.20 | 36.77 | 45.93 | 45.96 | 38.61 | 36.27 | 33.28 | 48.01 |
| Max. | 67.53 | 68.69 | 70.08 | 67.60 | 67.70 | 64.42 | 70.80 | 68.94 | 67.83 | 71.79 |
| Cycle | 1 | 2 | 3 | 4 | 5 | 6 | 7 | 8 | 9 * | 10 * |
|---|---|---|---|---|---|---|---|---|---|---|
| Specimens | 5 | → | → | → | → | 4 | → | → | → | → |
| Averaged dissipated energy | 258.27 | 220.60 | 175.35 | 168.77 | 154.27 | 171.79 | 162.19 | 157.32 | 155.22 | 155.58 |
| Min. | 227.67 | 191.44 | 153.79 | 141.81 | 127.38 | 130.89 | 127.33 | 126.33 | 124.03 | 114.88 |
| Max. | 338.78 | 241.86 | 207.18 | 215.91 | 209.57 | 216.71 | 211.12 | 217.01 | 203.64 | 203.03 |
| Cycle | 11 * | 12 * | 13 * | 14 * | 15 * | |||||
| Specimens | 3 | → | → | → | → | |||||
| Averaged dissipated energy | 151.77 | 154.45 | 153.60 | 159.18 | 153.97 | |||||
| Min. | 120.83 | 116.19 | 120.48 | 129.26 | 124.16 | |||||
| Max. | 207.66 | 208.04 | 207.15 | 207.48 | 202.40 |
References
- Bursi, O.S.; Gramola, G. Behaviour of headed stud shear connectors under low cycle high amplitude displacements. Mater. Struct. 1999, 32, 290–297. [Google Scholar] [CrossRef]
- Zandonini, R.; Bursi, O.S. Cyclic behavior of headed stud shear connectors. Compos. Constr. Steel Concr. IV 2002, 470–482. [Google Scholar] [CrossRef]
- Nakajima, A.; Saiki, I.; Kokai, M.; Doi, K.; Takabayashi, Y.; Ooe, H. Cyclic shear force–slip behavior of studs under alternating and pulsating load condition. Eng. Struct. 2003, 25, 537–545. [Google Scholar] [CrossRef]
- Maleki, S.; Bagheri, S. Behavior of channel shear connectors, Part I: Experimental study. J. Constr. Steel Res. 2008, 64, 1333–1340. [Google Scholar] [CrossRef]
- Shariati, A.; Shariati, M.; Sulong, N.R.; Suhatril, M.; Khanouki, M.A.; Mahoutian, M. Experimental assessment of angle shear connectors under monotonic and fully reversed cyclic load in high strength concrete. Constr. Build. Mater. 2014, 52, 276–283. [Google Scholar] [CrossRef]
- Shariati, M.; Shariati, A.; Sulong, N.R.; Suhatril, M.; Khanouki, M.A. Fatigue energy dissipation and failure analysis of angle shear connectors embedded in high strength concrete. Eng. Fail. Anlys. 2014, 41, 124–134. [Google Scholar] [CrossRef]
- Shariati, M.; Sulong, N.R.; Suhatril, M.; Shariati, A.; Khanouki, M.A.; Sinaei, H. Comparison of behaviour between channel and angle shear connectors under monotonic and fully reversed cyclic load. Constr. Build. Mater. 2013, 38, 582–593. [Google Scholar] [CrossRef]
- Kim, K.S.; Han, O.; Choi, J.; Kim, S.H. Hysteretic performance of stubby Y-type perfobond rib shear connectors depending on transverse rebar. Constr. Build. Mater. 2019, 200, 64–79. [Google Scholar] [CrossRef]
- Kim, D.Y.; Gombosuren, M.; Han, O.; Kim, S.H. Hysteretic model of Y-type perfobond rib connectors with large number of ribs. J. Constr. Steel Res. 2020, 166, 105818. [Google Scholar] [CrossRef]
- Kim, K.S.; Han, O.; Heo, W.H.; Kim, S.H. Behavior of Y-type perfobond rib shear connection under different cyclic loading conditions. Structure 2020, 26, 562–571. [Google Scholar] [CrossRef]
- Kim, S.H.; Kim, K.S.; Park, S.; Jung, C.Y.; Choi, J.G. Comparison of hysteretic performance of stubby Y-type perfobond rib and stud shear connectors. Eng. Struct. 2017, 147, 114–124. [Google Scholar] [CrossRef]
- Suzuki, A.; Kimura, Y. Cyclic behavior of component model of composite beam subjected to fully reversed cyclic loading. J. Struct Eng. 2019, 145, 04019015. [Google Scholar] [CrossRef]
- Suzuki, A.; Abe, K.; Suzuki, K.; Kimura, Y. Cyclic Behavior of Perfobond-Shear Connectors Subjected to Fully Reversed Cyclic Loading. J. Struct. Eng. 2021, 147, 04020355. [Google Scholar] [CrossRef]
- Kisaku, T.; Fujiyama, C. Modeling the cyclic response of perfobond-rib shear connectors. Pro. Eng. 2017, 171, 1317–1324. [Google Scholar] [CrossRef]
- Wang, Y.H.; Yu, J.; Liu, J.; Chen, Y.F. Experimental and Numerical Analysis of Steel-Block Shear Connectors in Assembled Monolithic Steel–Concrete Composite Beams. J. Bridge Eng. 2019, 24, 04019024. [Google Scholar] [CrossRef]
- Wang, X.; Liu, Y.; Liu, Y. Experimental study on shear behavior of notched long-hole perfobond connectors. Adv. Struct. Eng. 2019, 22, 202–213. [Google Scholar] [CrossRef]
- Wang, Y.H.; Yu, J.; Liu, J.P.; Chen, Y.F. Shear behavior of shear stud groups in precast concrete decks. Eng Struct. 2019, 187, 73–84. [Google Scholar] [CrossRef]
- Ramesh, D.; Sadhana, J.; Ganesh, B.; Gunasekaran, U. Enhancement of shear connectors for steel-concrete composite structures. J. Struct. Eng. 2015, 42, 363–369. [Google Scholar]
- Kim, S.H.; Choi, K.T.; Park, S.J.; Park, S.M.; Jung, C.Y. Experimental shear resistance evaluation of Y-type perfobond rib shear connector. J. Constr. Steel Res. 2013, 82, 1–18. [Google Scholar] [CrossRef]
- Kim, S.H.; Park, S.J.; Heo, W.H.; Jung, C.Y. Shear resistance characteristic and ductility of Y-type perfobond rib shear connector. Steel Compos. Struct. 2015, 18, 497–517. [Google Scholar] [CrossRef]
- Kim, S.H.; Kim, K.S.; Han, O.; Park, J.S. Influence of transverse rebar on shear behavior of Y-type perfobond rib shear connection. Constr. Build. Mat. 2018, 180, 254–264. [Google Scholar] [CrossRef]
- Kim, S.H.; Han, O.; Kim, K.S.; Park, J.S. Experimental behavior of double-row Y-type perfobond rib shear connectors. J. Constr. Steel Res. 2018, 150, 221–229. [Google Scholar] [CrossRef]
- Korean Standard D3503: Rolled Steels for General Structure; Korean Agency for Technology and Standards: Chungcheongbuk-do, Korea, 2018.
- Eurocode 4–1994. Design of Composite Steel and Concrete Structures, Part. 1.1: General Rules and Rules for Buildings, EN1994-1-1; European Committee for Standardization: Brussels, Belgium, 2004. [Google Scholar]
- Ang, A.H.-S.; Tang, W.H. Probability Concepts in Engineering; Wiley: Hoboken, NJ, USA, 2007; Volume 1. [Google Scholar]
- Kim, S.H.; Batbold, T.; Shah, S.H.A.; Yoon, S.; Han, O. Development of shear resistance formula for the Y-type perfobond rib shear connector considering probabilistic characteristics. Appl. Sci. 2021, 11, 3877. [Google Scholar] [CrossRef]


| Specimen | Number of Specimens (M/R) * | Y-Type Perfobond Rib Shear Connector | Transverse Rebar | Concrete Design Strength (MPa) | ||||
|---|---|---|---|---|---|---|---|---|
| Steel Grade | Steel Grade | |||||||
| SD400-D16-M/R | 6 (3/3) | 80 | 100 | 10 | SM490 | 16 | SD400 | 60 |
| SD400-D19-M/R | 6 (3/3) | 80 | 100 | 10 | SM490 | 19 | SD400 | 60 |
| SD500-D16-M/R | 6 (3/3) | 80 | 100 | 10 | SM490 | 16 | SD500 | 60 |
| SD500-D19-M/R | 6 (4/2) | 80 | 100 | 10 | SM490 | 19 | SD500 | 60 |
| SD500-D22-M/R | 3 (2/1) | 80 | 100 | 10 | SM490 | 22 | SD500 | 60 |
| Type | 28-Day | Test Date | ||
|---|---|---|---|---|
| Remicon #1 | Remicon #2 | Remicon #1 | Remicon #2 | |
| Experimental data | 62.0, 61.4, 59.7, 61.9, 58.0, 61.5 | 65.7, 65.6, 63.3, 59.5, 61.9, 64.5, 60.6 | 63.5, 58.7, 62.8, 63.0, 61.0, 66.1, 63.1, 61.9, 60.8, 62.0 | 62.8, 64.6, 63.1, 63.5, 63.8, 63.1, 61.5, 61.8, 61.2, 59.8, 62.3, 65.0, 62.6 |
| Mean | 60.8 | 62.9 | 62.2 | 62.5 |
| COV | 0.013 | 0.026 | 0.015 | 0.019 |
| Avg. strength | 61.8 | 62.4 | ||
| Type | Number of Specimens | Yield Strength | Tensile Strength | ||
|---|---|---|---|---|---|
| Test | Avg. | Test | Avg. | ||
| D16 (SD400) | 3 | 461, 461, 468 | 463.3 | 585, 587, 584 | 585.3 |
| D19 (SD400) | 3 | 482, 479, 480 | 480.3 | 595, 594, 591 | 593.3 |
| D16 (SD500) | 3 | 534, 538, 551 | 541.0 | 659, 668, 676 | 667.7 |
| D19 (SD500) | 3 | 550, 547, 543 | 546.7 | 674, 673, 670 | 672.3 |
| D22 (SD500) | 3 | 553, 549, 552 | 551.3 | 676, 672, 674 | 674.0 |
| T10 (SM490) | 3 | 408, 406, 407 | 407.0 | 546, 550, 552 | 549.3 |
| Specimen | Load Type |
|---|---|
| SD400-D16-3M | Monotonic load |
| SD500-D16-3M | Monotonic load |
| SD500-D19-3M | Monotonic load |
| Specimen | No. | |||||
|---|---|---|---|---|---|---|
| SD400-D16 | 1 M | 2240.3 | 28.7 | 25.8 | 3.2 | 9.0 |
| 2 M | 2234.3 | 37.5 | 33.2 | 4.1 | 9.2 | |
| 3 M | 2210.9 | 35.4 | 32.0 | 2.7 | 13.2 | |
| Avg. | 2228.5 | 33.9 | 30.4 | 3.3 | 10.5 | |
| SD400-D19 | 1 M | 2458.0 | 45.6 | 41.0 | 3.9 | 11.6 |
| 2 M | 2456.1 | 34.2 | 30.8 | 4.6 | 7.5 | |
| 3 M | 2496.3 | 45.7 | 39.0 | 5.0 | 9.1 | |
| Avg. | 2470.1 | 41.8 | 36.9 | 4.5 | 9.4 | |
| SD500-D16 | 1 M | 2321.1 | 24.9 | 22.3 | 4.0 | 6.3 |
| 2 M | 2240.3 | 23.8 | 21.4 | 3.0 | 7.9 | |
| 3 M | 2239.7 | 41.0 | 35.1 | 3.0 | 13.5 | |
| Avg. | 2267.0 | 29.9 | 26.3 | 3.3 | 9.2 | |
| SD500-D19 | 1 M | 2493.2 | 50.5 | 45.1 | 5.1 | 9.8 |
| 2 M | 2547.0 | 56.1 | 40.9 | 4.6 | 12.3 | |
| 3 M | 2375.7 | 45.4 | 49.0 | 6.0 | 7.5 | |
| 4 M | 2493.7 | 55.9 | 46.9 | 4.4 | 12.8 | |
| Avg. | 2477.4 | 52.0 | 45.5 | 5.0 | 10.6 | |
| SD500-D22 | 1 M | 2614.7 | 46.7 | 42.0 | 5.9 | 7.9 |
| 2 M | 2656.5 | 47.9 | 43.2 | 7.0 | 6.9 | |
| Avg. | 2635.6 | 47.3 | 42.6 | 6.4 | 7.4 |
| Specimen | Y-Rib | Transverse Rebar | ||
|---|---|---|---|---|
| Yield Strain | Yield Load | Yield Strain | Yield Load | |
| SD400-D16-3M | 0.0019 | 1440.3 kN | 0.0022 | 1556.4 kN |
| SD500-D16-3M | 0.0019 | 1214.9 kN | 0.0023 | 1567.3 kN |
| SD500-D19-3M | 0.0019 | 1381.4 kN | 0.0026 | 1757.3 kN |
| Average | 0.0019 | 1345.5 kN | 0.0024 | 1627.0 kN |
| Load Stage | Stage 1 (35%) | Stage 2 (45%) | Stage 3 (55%) | Stage 4 (65%) | Stage 5 |
|---|---|---|---|---|---|
| Intensity | 785 kN | 1010 kN | 1235 kN | 1460 kN | Monotonic |
| Load Type | Number of Repeated Loads | |||
|---|---|---|---|---|
| Stage 1 | Stage 2 | Stage 3 | Stage 4 | |
| 1 | 5 | 5 | 5 | 5 |
| 2 | 5 | 5 | 5 | 10 |
| 3 | 5 | 5 | 5 | 15 |
| 4 | 5 | 5 | 25 | - |
| 5 | 5 | 5 | 50 | - |
| Specimen | Load Type | Specimen | Load Type |
|---|---|---|---|
| SD400-D16-1R | Type 1 | SD400-D19-1R | Type 3 |
| SD400-D16-2R | Type 2 | SD400-D19-2R | Type 4 |
| SD400-D16-3R | Type 4 | SD400-D19-3R | Type 5 |
| SD500-D16-1R | Type 3 | SD500-D19-1R | Type 3 |
| SD500-D16-2R | Type 4 | SD500-D19-2R | Type 4 |
| SD500-D16-3R | Type 5 | SD500-D22-1R | Type 5 |
| Specimen (Monotonic) | Specimen (Repeated) | Load Type | Ratio (B/A) | ||
|---|---|---|---|---|---|
| SD400-D16 | 2228.5 | SD400-D16-1R | Type 1 | 2136.4 | 0.959 |
| SD400-D16-2R | Type 2 | 2125.4 | 0.954 | ||
| SD400-D16-3R | Type 4 | 2188.5 | 0.982 | ||
| SD400-D19 | 2470.1 | SD400-D19-1R | Type 3 | 2309.6 | 0.935 |
| SD400-D19-2R | Type 4 | 2408.9 | 0.975 | ||
| SD400-D19-3R | Type 5 | 2418.4 | 0.979 | ||
| SD500-D16 | 2267.1 | SD500-D16-1R | Type 3 | 2114.1 | 0.933 |
| SD500-D16-2R | Type 4 | 2224.2 | 0.981 | ||
| SD500-D16-3R | Type 5 | 2200.5 | 0.971 | ||
| SD500-D19 | 2477.4 | SD500-D19-1R | Type 3 | 2273.6 | 0.918 |
| SD500-D19-2R | Type 4 | 2402.5 | 0.970 | ||
| SD500-D22 | 2635.6 | SD500-D22-1R | Type 5 | 2510.7 | 0.953 |
| Load Type | Specimen (Repeated) | Residual Ratio | Averaged Reduction Ratio |
|---|---|---|---|
| Type 1 | SD400-D16-1R | 0.959 | 0.041 |
| Type 2 | SD400-D16-2R | 0.954 | 0.046 |
| Type 3 | SD400-D19-1R | 0.935 | 0.071 |
| SD500-D16-1R | 0.933 | ||
| SD500-D19-1R | 0.918 | ||
| Type 4 | SD400-D16-3R | 0.982 | 0.023 |
| SD400-D19-2R | 0.975 | ||
| SD500-D16-2R | 0.981 | ||
| SD500-D19-2R | 0.970 | ||
| Type 5 | SD400-D19-3R | 0.979 | 0.031 |
| SD500-D16-3R | 0.971 | ||
| SD500-D22-1R | 0.953 |
| Monotonic Loading Tests Only | Monotonic Loading Tests after Repeated Loading Tests | |||||||
|---|---|---|---|---|---|---|---|---|
| Specimen | Specimen | Load Type | ||||||
| SD400-D16-1 | 28.7 | 3.2 | 9.0 | SD400-D16-1R | Type 1 | 44.7 | 2.7 | 16.5 |
| SD400-D16-2 | 37.5 | 4.1 | 9.2 | SD400-D16-2R | Type 2 | 24.4 * | 3.2 | 7.5 |
| SD400-D16-3 | 35.4 | 2.7 * | 13.2 | SD400-D16-3R | Type 4 | 24.5 | 3.5 | 6.9 * |
| Average | 33.9 | 3.1 | 10.5 | Average | 31.2 | 3.2 | 10.3 | |
| SD400-D19-1 | 45.6 | 3.9 | 11.6 | SD400-D19-1R | Type 3 | 36.7 | 5.2 | 7.0 |
| SD400-D19-2 | 34.2 | 4.6 | 7.5 | SD400-D19-2R | Type 4 | 34.4 | 4.4 | 7.9 |
| SD400-D19-3 | 45.7 | 5.0 | 9.1 | SD400-D19-3R | Type 5 | 45.0 | 4.9 | 9.2 |
| Average | 41.8 | 4.5 | 9.4 | Average | 38.7 | 4.8 | 8.0 | |
| SD500-D16-1 | 24.9 | 4.0 | 6.3 * | SD500-D16-1R | Type 3 | 26.8 | 3.6 | 7.5 |
| SD500-D16-2 | 23.8 * | 3.0 | 7.9 | SD500-D16-2R | Type 4 | 39.4 | 3.7 | 10.7 |
| SD500-D16-3 | 41.0 | 3.0 | 13.5 | SD500-D16-3R | Type 5 | 33.9 | 3.5 | 9.6 |
| Average | 29.9 | 3.3 | 9.2 | Average | 33.4 | 3.6 | 9.3 | |
| SD500-D19-1 | 50.5 | 5.1 | 9.8 | SD500-D19-1R | Type 3 | 25.1 | 2.0 * | 12.9 |
| SD500-D19-2 | 56.1 | 4.6 | 12.3 | SD500-D19-2R | Type 4 | 45.1 | 5.3 | 8.5 |
| SD500-D19-3 | 45.4 | 6.0 | 7.5 | |||||
| SD500-D19-4 | 55.9 | 4.4 | 12.8 | |||||
| Average | 52.0 | 5.0 | 10.6 | Average | 35.1 | 3.6 | 10.7 | |
| SD500-D22-1 | 46.7 | 5.9 | 7.9 | SD500-D22-1R | Type 5 | 52.5 | 4.8 | 10.9 |
| SD500-D22-2 | 47.9 | 7.0 | 6.9 | |||||
| Average | 47.3 | 6.4 | 7.4 | Average | 52.5 | 4.8 | 10.9 | |
| Steel Grade | Dia. (mm) | Specimen | Cumulative Energy Dissipation (5 Cycles of 785 kN) | Average 1 | Average 2 | Average 3 |
|---|---|---|---|---|---|---|
| SD400 | 16 | SD400-D16-1R | 229.9 | 249.1 | 207.7 min: 118.0 max: 277.0 | 176.4 min: 97.0 max: 277.0 |
| 16 | SD400-D16-2R | 277.0 | ||||
| 16 | SD400-D16-3R | 240.5 | ||||
| 19 | SD400-D16-1R | 198.7 | 166.2 | |||
| 19 | SD400-D16-2R | 118.0 | ||||
| 19 | SD400-D16-3R | 181.8 | ||||
| SD500 | 16 | SD500-D16-1R | 183.1 | 132.0 | 145.2 min: 97.0 max: 257.0 | |
| 16 | SD500-D16-2R | 100.9 | ||||
| 16 | SD500-D16-3R | 112.0 | ||||
| 19 | SD500-D19-1R | 257.0 | 189.0 | |||
| 19 | SD500-D19-2R | 121.0 | ||||
| 22 | SD500-D22-1R | 97.0 | 97.0 |
| Steel Grade | Dia. (mm) | Specimen | Cumulative Energy Dissipation (5 Cycles of 1010 kN after 5 Cycles of 785 kN) | Average 1 | Average 2 | Average 3 |
|---|---|---|---|---|---|---|
| SD400 | 16 | SD400-D16-1R | 309.9 | 384.4 | 308.6 min: 180.3 max: 449.8 | 267.0 min: 158.0 max: 449.8 |
| 16 | SD400-D16-2R | 393.4 | ||||
| 16 | SD400-D16-3R | 449.8 | ||||
| 19 | SD400-D16-1R | 277.0 | 232.8 | |||
| 19 | SD400-D16-2R | 180.3 | ||||
| 19 | SD400-D16-3R | 241.1 | ||||
| SD500 | 16 | SD500-D16-1R | 256.0 | 204.1 | 225.4 min: 158.0 max: 411.5 | |
| 16 | SD500-D16-2R | 169.1 | ||||
| 16 | SD500-D16-3R | 187.3 | ||||
| 19 | SD500-D19-1R | 411.5 | 290.9 | |||
| 19 | SD500-D19-2R | 170.2 | ||||
| 22 | SD500-D22-1R | 158.0 | 158.0 |
| Steel Grade | Dia. (mm) | Specimen | Cumulative Energy Dissipation (5 Cycles of 1235 kN after 5 Cycles of 785 kN–5 Cycles of 1010 kN) | Average 1 | Average 2 | Average 3 |
|---|---|---|---|---|---|---|
| SD400 | 16 | SD400-D16-1R | 536.5 | 641.4 | 518.7 min: 324.9 max: 816.0 | 463.1 min: 310.2 max: 816.0 |
| 16 | SD400-D16-2R | 571.6 | ||||
| 16 | SD400-D16-3R | 816.0 | ||||
| 19 | SD400-D16-1R | 445.9 | 396.1 | |||
| 19 | SD400-D16-2R | 324.9 | ||||
| 19 | SD400-D16-3R | 417.4 | ||||
| SD500 | 16 | SD500-D16-1R | 472.7 | 379.2 | 407.5 min: 310.2 max: 648.2 | |
| 16 | SD500-D16-2R | 310.4 | ||||
| 16 | SD500-D16-3R | 354.6 | ||||
| 19 | SD500-D19-1R | 648.2 | 479.2 | |||
| 19 | SD500-D19-2R | 310.2 | ||||
| 22 | SD500-D22-1R | 348.7 | 348.7 |
| Steel Grade | Dia. (mm) | Specimen | Cumulative Energy Dissipation (5 Cycles of 1460 kN after 5 Cycles of 785 kN–5 Cycles of 1010 kN–5 Cycles of 1235 kN) | Average 1 | Average 2 | Average 3 |
|---|---|---|---|---|---|---|
| SD400 | 16 | SD400-D16-1R | 1061.2 | 1000.8 | 958.6 min: 874.1 max: 1061.2 | 977.3 min: 874.1 max: 1080.5 |
| 16 | SD400-D16-2R | 940.4 | ||||
| 16 | SD400-D16-3R | - | ||||
| 19 | SD400-D16-1R | 874.1 | 874.1 | |||
| 19 | SD400-D16-2R | - | ||||
| 19 | SD400-D16-3R | - | ||||
| SD500 | 16 | SD500-D16-1R | 930.0 | 930.0 | 1005.3 min: 930.0 max: 1080.5 | |
| 16 | SD500-D16-2R | - | ||||
| 16 | SD500-D16-3R | - | ||||
| 19 | SD500-D19-1R | 1080.5 | 1080.5 | |||
| 19 | SD500-D19-2R | 310.2 | ||||
| 22 | SD500-D22-1R | 348.7 | 348.7 |
| No. | Specimen | 785 kN | 1010 kN | 1235 kN | 1460 kN |
|---|---|---|---|---|---|
| 1 | SD500-D16-2R (Type4) | - | |||
| 2 | SD500-D19-2R (Type4) | - | |||
| 3 | SD500-D22-1R (Type5) | - | |||
| 4 | SD500-D16-3R (Type5) | - | |||
| 5 | SD400-D19-2R (Type4) | - | |||
| 6 | SD500-D16-1R (Type3) | - | |||
| 7 | SD400-D19-3R (Type5) | - | |||
| 8 | SD400-D16-1R (Type1) | - | - | ||
| 9 | SD400-D19-1R (Type3) | - | |||
| 10 | SD400-D16-3R (Type4) | - | |||
| 11 | SD400-D16-2R (Type2) | - | |||
| 12 | SD500-D19-1R (Type3) | - | |||
| Average-1 (All specimens) (A) | 24.67 | 45.44 | - | ||
| Average-2 (No. 1, 2, 3, 4, 5, 7) (B) | 14.63 | 25.99 | 51.07 * | - | |
| Ratio of mean value (B/A) | 0.59 | 0.57 | - | ||
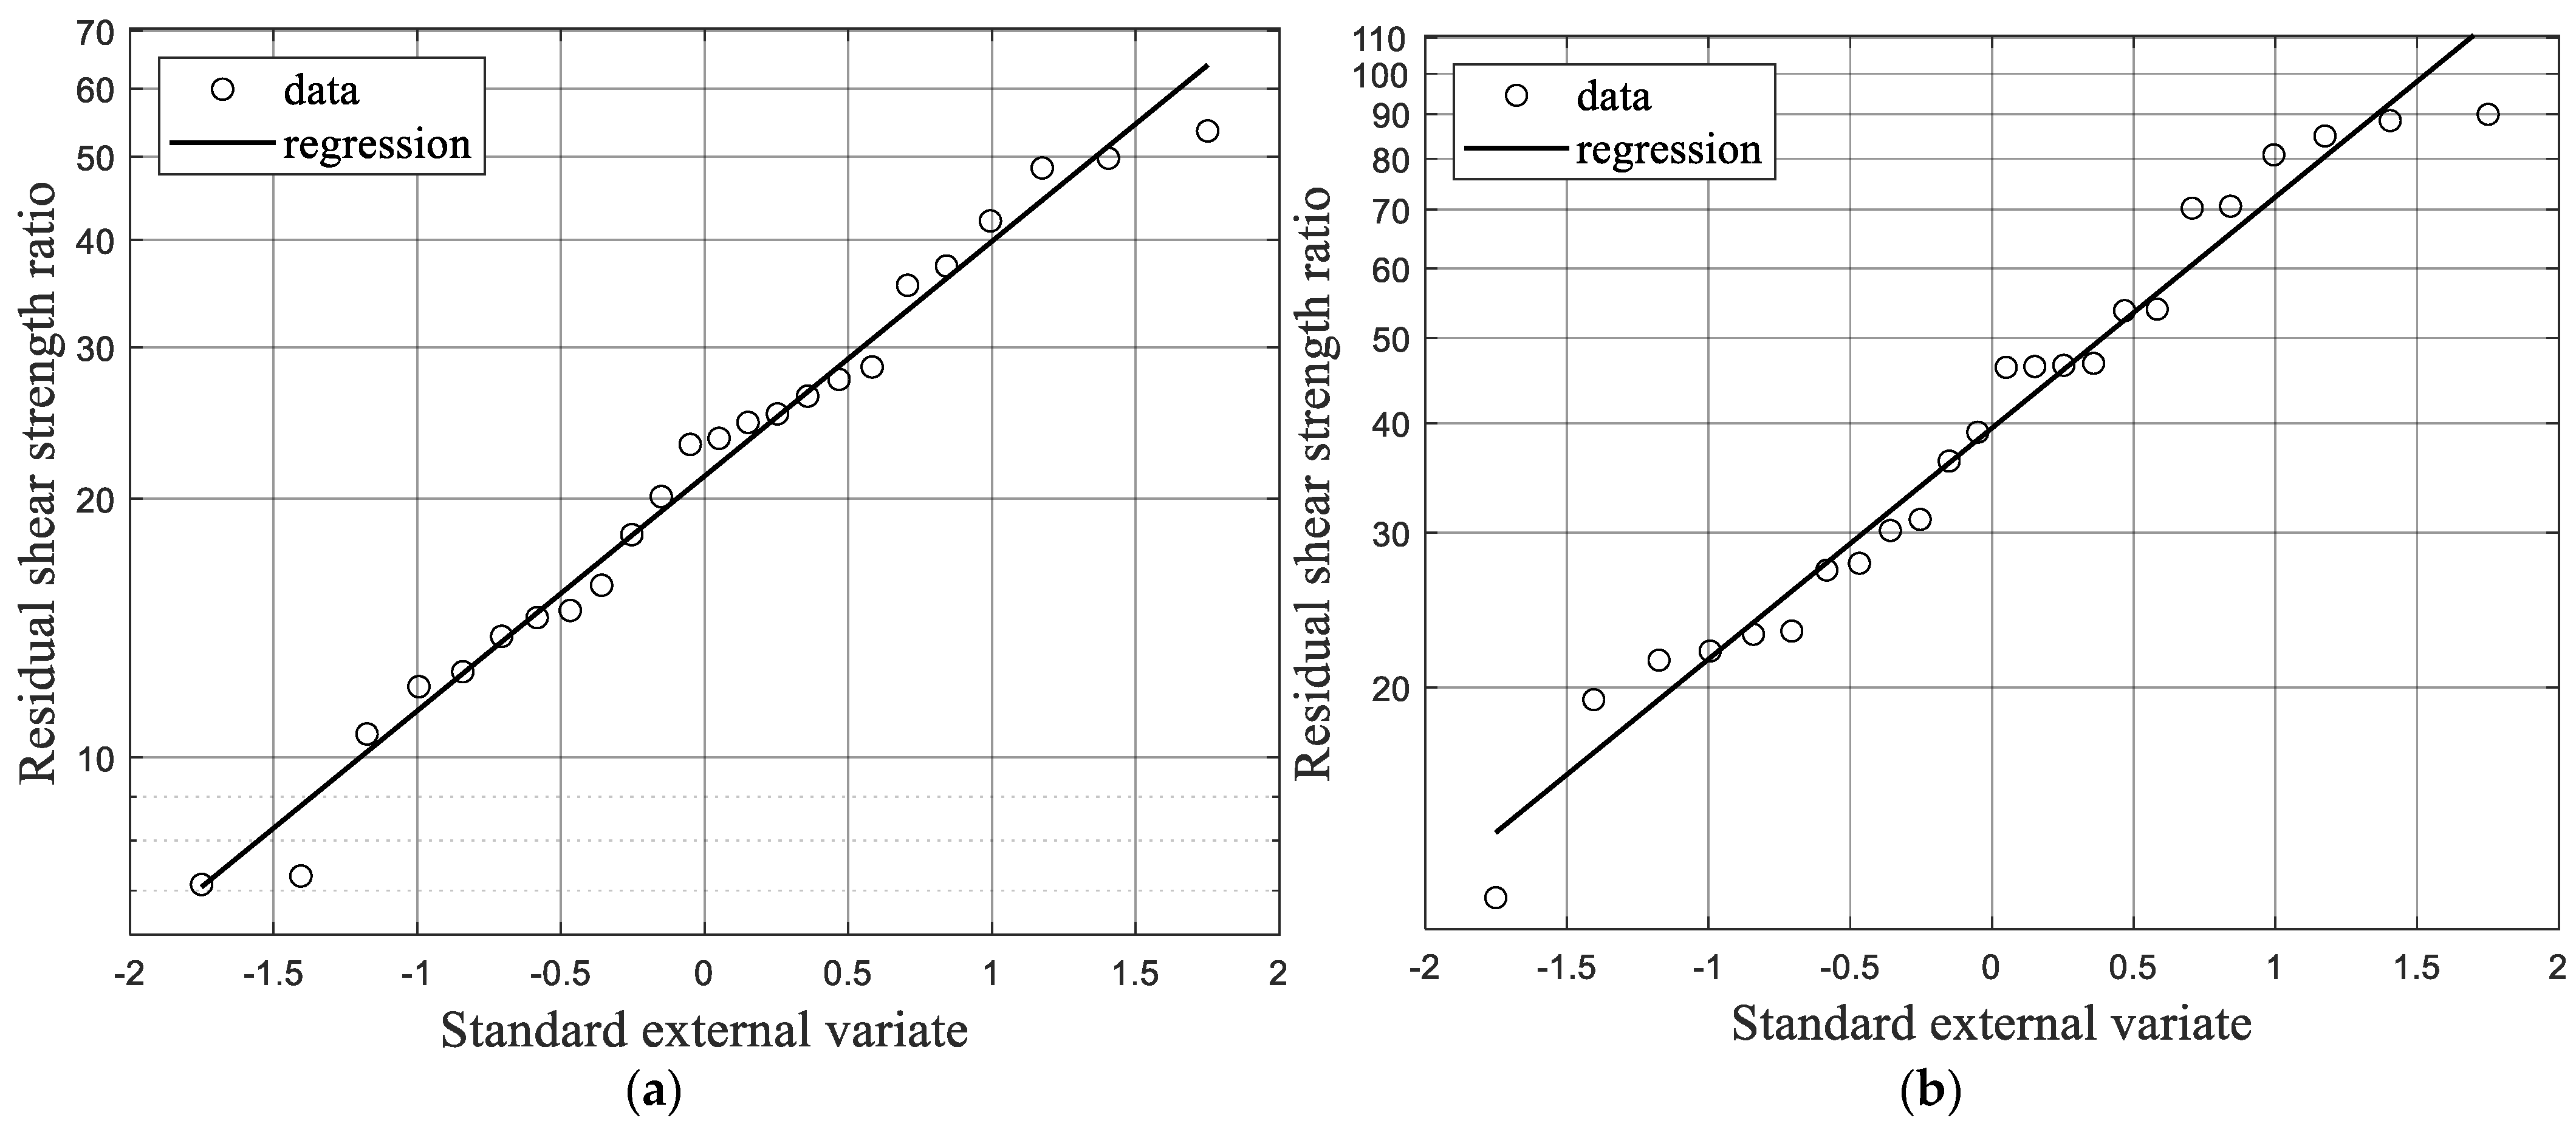
| Type | Mean | COV | Correlation Coefficient | |
|---|---|---|---|---|
| 785 kN | Normal | 24.67 | 0.586 | 0.966 |
| Log-normal | 25.89 | 0.696 | 0.992 * | |
| Type-I | 25.25 | 0.612 | 0.988 | |
| 1010 kN | Normal | 45.44 | 0.563 | 0.964 |
| Log-normal | 47.44 | 0.666 | 0.985 * | |
| Type-I | 46.45 | 0.584 | 0.979 |
| Load (kN) | Mean (kN·mm) | COV | Distribution |
|---|---|---|---|
| 785 | 25.89 | 0.696 | Log-normal |
| 1010 | 47.44 | 0.666 | Log-normal |
| 1235 | 92.85 * | 0.636 * | Log-normal |
| 1460 | 129.49 * | 0.606 * | Log-normal |
| Load Type | Specimen | Total Energy Dissipation (kN·mm) | Residual Shear Strength (A) | Nominal Residual Shear Strength on Regression Line (B) | Ratio (A/B) | Note |
|---|---|---|---|---|---|---|
| 1 | SD400-D16-1R | 2137.6 | 0.959 | 0.963 | 1.001 | |
| 2 | SD400-D16-2R | 3000.3 | 0.954 | 0.946 | 1.015 | |
| 3 | SD500-D16-1R | 3231.0 | 0.933 | 0.941 | 0.997 | |
| SD400-D19-1R | 3031.5 | 0.935 | 0.945 | 0.995 | ||
| SD500-D19-1R | 4481.5 | 0.917 | 0.916 | 1.008 | ||
| 4 | SD400-D16-3R | 4061.6 | 0.982 | 0.977 | - | Excluded |
| SD500-D16-2R | 1444.0 | 0.981 | 0.969 | 1.010 | ||
| SD400-D19-2R | 1848.1 | 0.975 | 0.977 | 1.013 | ||
| SD500-D19-2R | 1423.9 | 0.970 | 0.949 | 0.998 | ||
| 5 | SD500-D16-3R | 2819.6 | 0.971 | 0.957 | 1.029 | |
| SD400-D19-3R | 3882.8 | 0.979 | 0.963 | - | Excluded | |
| SD500-D22-1R | 2423.1 | 0.953 | 0.946 | 1.001 |
| Type | Mean | COV | Correlation Coefficient | |
|---|---|---|---|---|
| Residual shear strength | Normal | 1.0067 | 0.0117 | 0.9529 |
| Log-normal | 1.0067 | 0.0117 | 0.9542 | |
| Type-I | 1.0075 | 0.0128 | 0.9802 |
| Case | Mean | COV | |
|---|---|---|---|
| 4-rib | Normal | 1.129 | 0.127 |
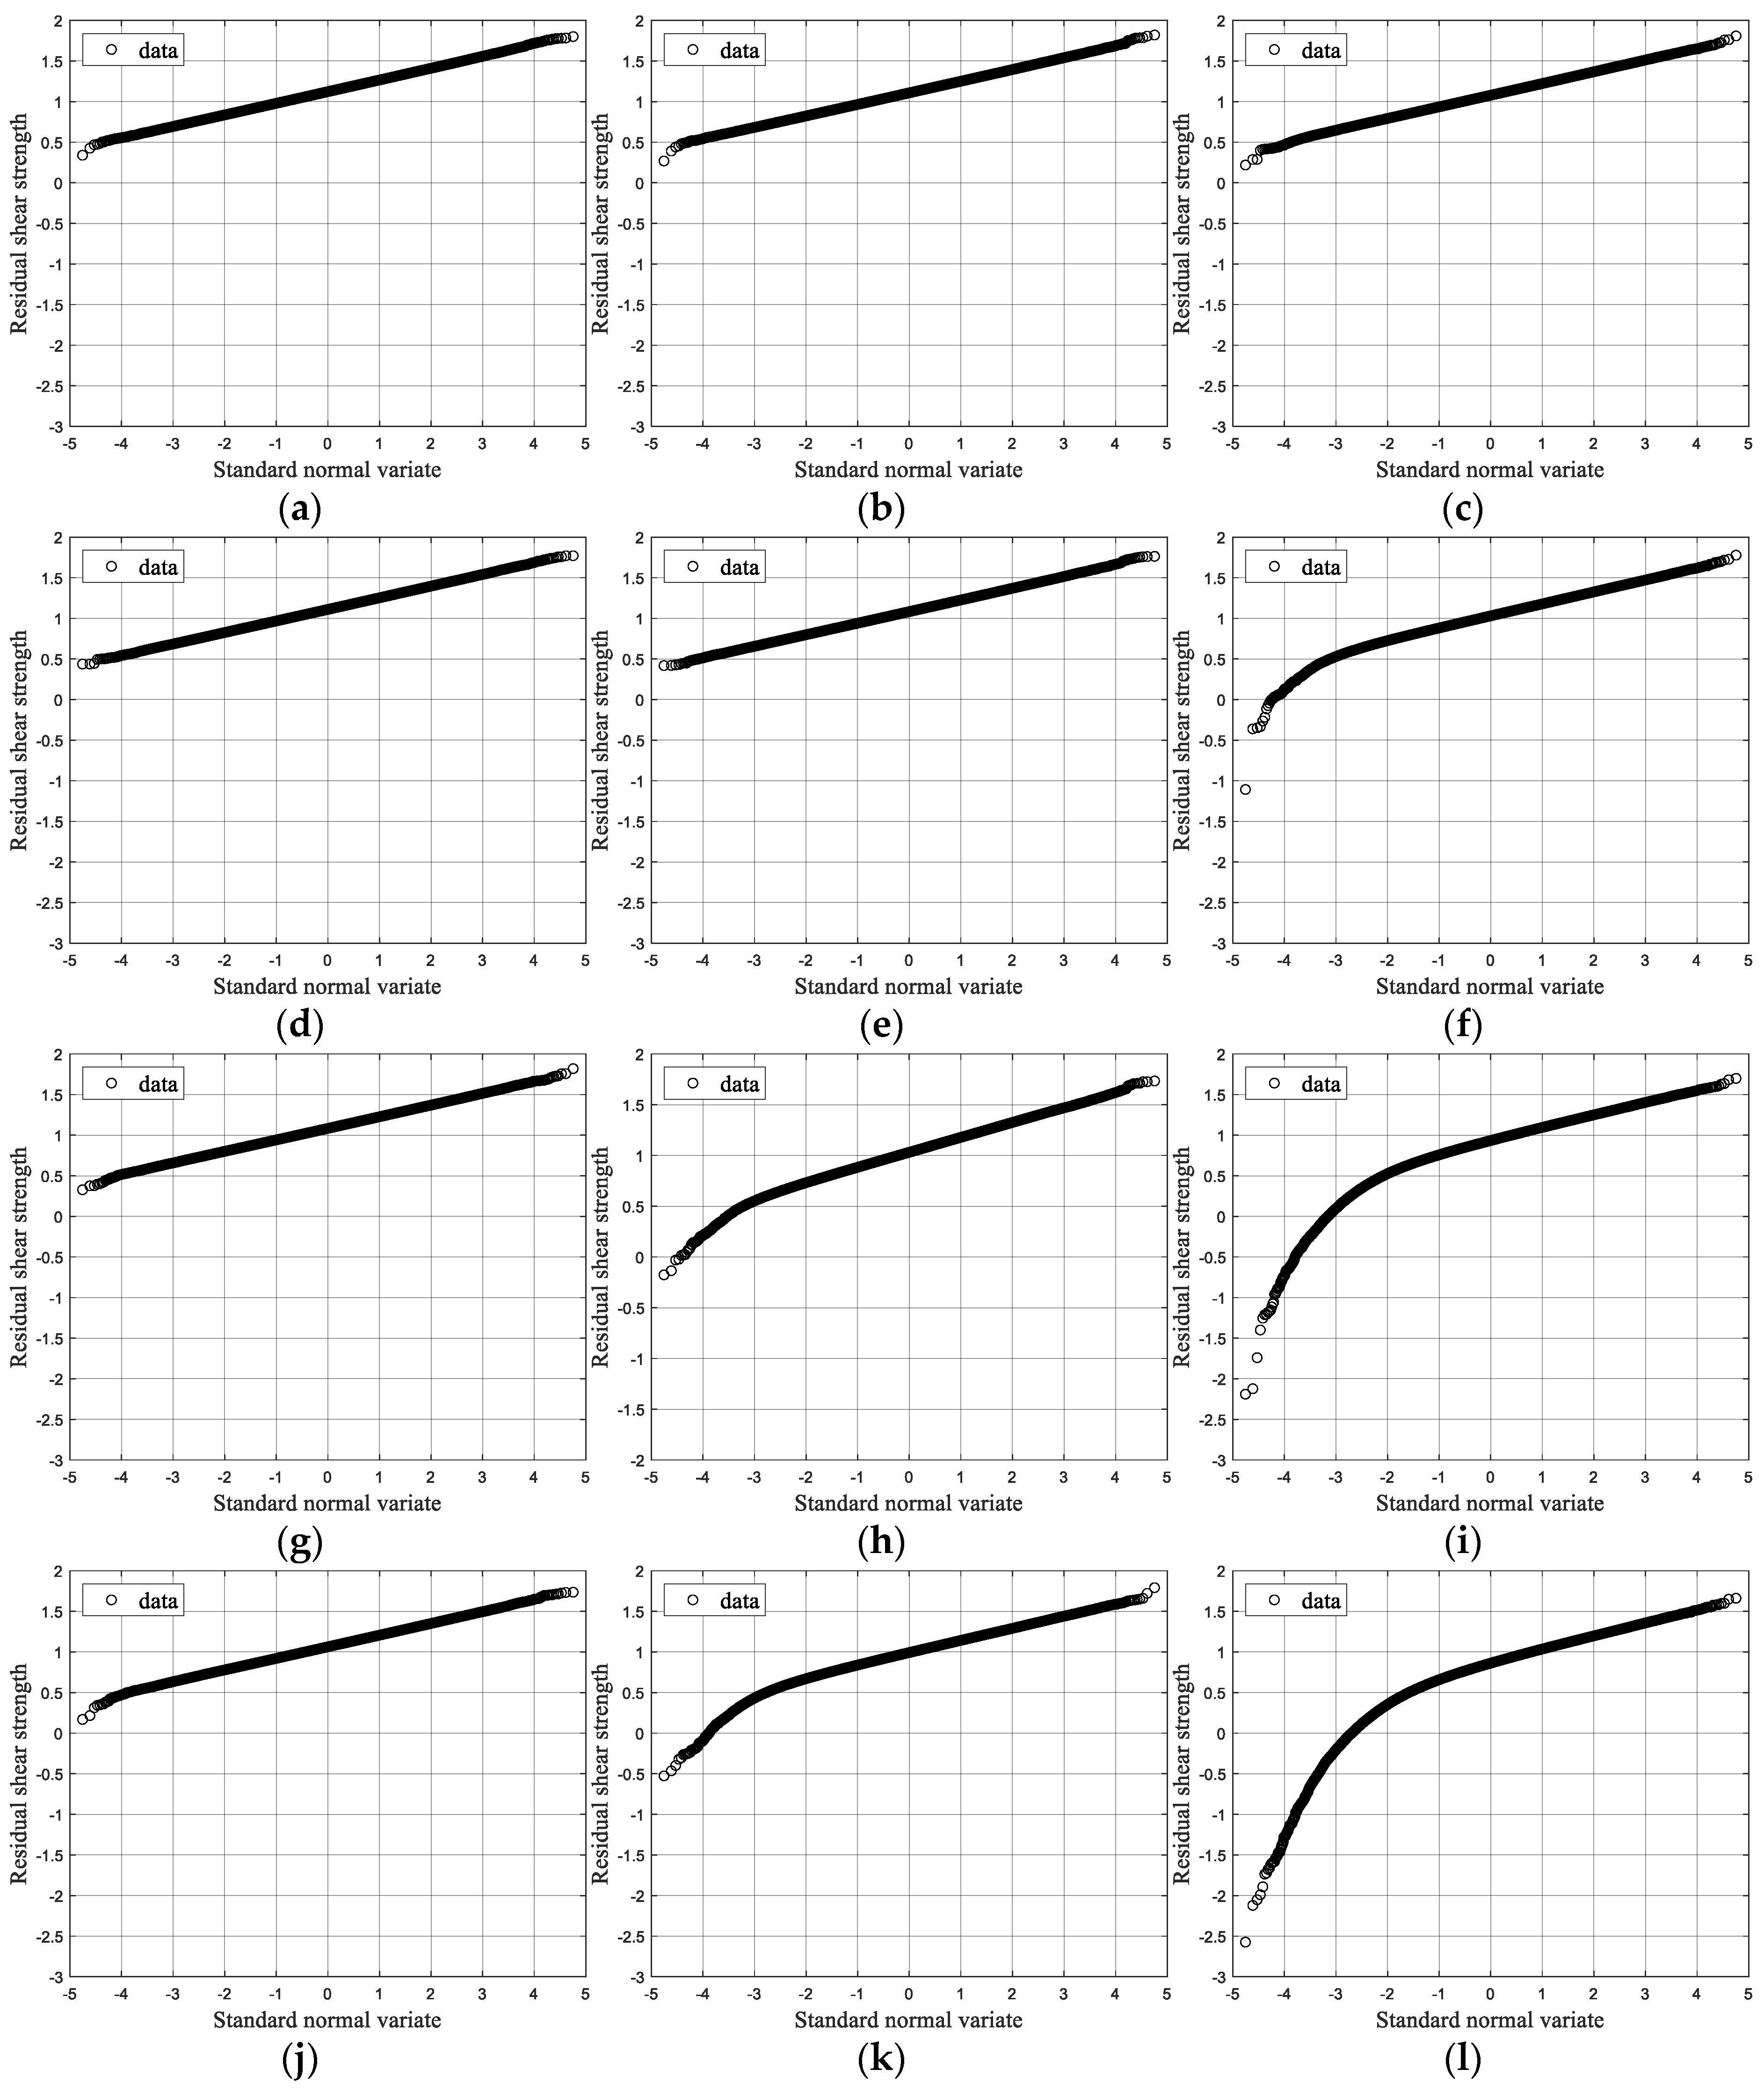
| Type | 785 kN | 1010 kN | 1235 kN | 1460 kN | |
|---|---|---|---|---|---|
| 25 | Mean | 1.123 | 1.111 | 1.084 | 1.064 |
| COV | 0.128 | 0.129 | 0.131 | 0.135 | |
| 50 | Mean | 1.108 | 1.084 | 1.031 | 0.990 |
| COV | 0.129 | 0.132 | 0.144 | 0.156 | |
| 100 | Mean | 1.030 | 0.924 | 0.843 | 1.030 |
| COV | 0.146 | 0.193 | 0.243 | 0.146 |
| 785 kN | 1010 kN | 1235 kN | 1460 kN | ||
|---|---|---|---|---|---|
| 25 | 2.0 | 0.846 | 0.845 | 0.838 | 0.832 |
| 2.5 | 0.773 | 0.772 | 0.763 | 0.755 | |
| 3.0 | 0.700 | 0.699 | 0.689 | 0.678 | |
| 50 | 2.0 | 0.844 | 0.837 | 0.809 | 0.771 |
| 2.5 | 0.771 | 0.762 | 0.715 | 0.654 | |
| 3.0 | 0.697 | 0.687 | 0.608 | 0.497 | |
| 100 | 2.0 | 0.834 | 0.802 | 0.646 | 0.475 |
| 2.5 | 0.759 | 0.704 | 0.427 | 0.157 | |
| 3.0 | 0.683 | 0.586 | 0.118 | - |
Publisher’s Note: MDPI stays neutral with regard to jurisdictional claims in published maps and institutional affiliations. |
© 2021 by the authors. Licensee MDPI, Basel, Switzerland. This article is an open access article distributed under the terms and conditions of the Creative Commons Attribution (CC BY) license (https://creativecommons.org/licenses/by/4.0/).
Share and Cite
Kim, S.-H.; Han, O.; Yoon, S.; Boldoo, T. Shear Resistance Assessment of the Y-Type Perfobond Rib Shear Connector under Repeated Loadings. Appl. Sci. 2021, 11, 7667. https://doi.org/10.3390/app11167667
Kim S-H, Han O, Yoon S, Boldoo T. Shear Resistance Assessment of the Y-Type Perfobond Rib Shear Connector under Repeated Loadings. Applied Sciences. 2021; 11(16):7667. https://doi.org/10.3390/app11167667
Chicago/Turabian StyleKim, Sang-Hyo, Oneil Han, Suro Yoon, and Tuguldur Boldoo. 2021. "Shear Resistance Assessment of the Y-Type Perfobond Rib Shear Connector under Repeated Loadings" Applied Sciences 11, no. 16: 7667. https://doi.org/10.3390/app11167667
APA StyleKim, S.-H., Han, O., Yoon, S., & Boldoo, T. (2021). Shear Resistance Assessment of the Y-Type Perfobond Rib Shear Connector under Repeated Loadings. Applied Sciences, 11(16), 7667. https://doi.org/10.3390/app11167667