Article

Effect of Purple-Colored Wheat Bran Addition on Quality and Antioxidant Property of Bread and Optimization of Bread-Making Conditions

1
Department of Food Science and Nutrition, Pusan National University, Busan 46241, Korea
2
Kimchi Institute, Pusan National University, Busan 46241, Korea
*
Author to whom correspondence should be addressed.
Appl. Sci. 2021, 11(9), 4034; https://doi.org/10.3390/app11094034
Submission received: 8 April 2021 / Revised: 26 April 2021 / Accepted: 27 April 2021 / Published: 29 April 2021
(This article belongs to the Special Issue Cereal-Based Foods)

Abstract

:
Purple-colored wheat bran was blended with flour at different ratios. The dough mixing characteristics of the flour–bran blends and quality characteristics and antioxidant activity of the bread prepared with the blends were investigated. Additionally, response surface methodology (RSM) was used to optimize the formula and processing conditions for the bread prepared with the blend at 30% bran. Solvent retention capacity (SRC), as a quality characteristic of the blends, showed that water absorption and damaged starch contribution increased proportionally as the bran blending ratio increased. Dough mixing patterns of blends determined by a mixograph exhibited deteriorated gluten strength by increasing the bran blending ratio. The total phenolic and anthocyanin contents and antioxidant activity (ABTS and DPPH radical scavenging activity) of the bread increased proportionally as the bran blending ratio increased. RSM analysis revealed that the best-fitted model for the results was a quadratic polynomial model with regression coefficient values close to or more than 0.900 for all responses. Optimized conditions were 68.1 g water, 4.0 min mixing time, and 67.3 min fermentation time. Overall, purple-colored wheat bran was successfully applied to produce bread with healthy functional properties by controlling water and mixing time.

1. Introduction

Wheat is one of the most widely consumed crops globally and is the most consumed after rice, per capita, in Korea. Currently, the self-sufficiency rate of wheat production in Korea is less than 1%, resulting in the import of approximately 99% of wheat from the United States, Australia, and Canada [1]. Nevertheless, wheat consumption has continued to increase recently, and the bakery market is expanding as a result of the westernization of the diet [2]. The consumption of functional foods containing dietary fiber and antioxidants has also increased because of increased consumer interest in health [3].
Wheat bran is a by-product generated during milling [4] and consists of a pericarp, testa, and aleurone layer [5]. Depending on the type of wheat or milling method, wheat bran usually contains 9–14% moisture, 4–6% fat, 14–18% protein, 5–7% ash, and 50–70% carbohydrates, including 40–50% of dietary fiber [6]. It is known to have anticancer and anti-obesity health benefits [7,8]. Wheat bran dominantly contains insoluble fiber as dietary fiber and is mainly used in confectionery and bakery products [9]. Insoluble dietary fiber helps prevent constipation and improves bowel function, contributing to the prevention of intestinal diseases such as colon cancer [5].
For the development of value-added grains, the National Institute of Crop Science, under the Rural Development Administration, has released a purple-colored wheat variety “Ariheuk” to promote Korean domestic wheat production and consumption. This wheat variety has a ten times higher antioxidant capacity than regular wheat and is rich in minerals [10]. A white wheat variety, “Baekgang”, suitable for making bread, was also released to increase the Korean domestic wheat self-sufficiency rate [11].
Numerous studies have been conducted on the application of whole wheat and bran in bakery products. Yu and Beta [12] examined changes in the phenolic content or antioxidant activity of breads during their production using colored whole wheat flour. In this study, the levels of free phenolic compounds increased during mixing, but those of bound phenolic compounds slightly decreased after fermentation for 30 min and significantly increased after fermentation for 65 min and during baking. The total antioxidant activity also showed a trend similar to that of the total phenol content. When making bread by adding up to 20% colored wheat bran, the dough weakens, moisture loss increases during baking, and the bread volume decreases with increasing proportions of bran [13]. However, studies using Korean domestic wheat flour and purple-colored wheat bran are scarce. Compared to imported wheat, Korean domestic wheat has advantages in food safety due to its low residual pesticide content, the short transportation distance, and the fresh consumption without long-term storage. [10]. To improve the quality of products formulated with wheat bran or whole wheat flour, dough improvers are commonly used, resulting in increased production costs. However, consumers favor products with lean formulas because of clean labeling. Thus, wheat bran pre-treatments such as hydration, extrusion, and fermentation are also used [14,15,16], resulting in increased production costs. Studies on controlling the primary ingredients or processing conditions are scarce. Therefore, it is worth investigating the effects of the primary ingredient or processing factor on the quality of the final product, for improving the quality of the flour–bran-blended bread.
In this study, the physicochemical and dough mixing properties and bread-making performance of a blend of Korean domestic wheat flour with purple-colored wheat bran at different blending ratios were determined. The antioxidant activity of the bread was analyzed. In addition, significant processing factors were identified and optimized to improve bread quality while increasing antioxidant activity.

2. Materials and Methods

2.1. Materials

Korean domestic wheat flour from the cultivar “Baekgang” and purple-colored wheat bran from the cultivar “Ariheuk”, milled using a Buhler mill, were supplied by the National Institute of Crop Science under the Rural Development Administration in Korea. The flour yield of “Baekgang” was 70.0%, and the bran yield of “Ariheuk” was 15.2%. For the particle size of the “Ariheck” bran, three sieves (0.5, 1.0, and 2.0 mm) were used, and the percentage of each fraction passed through the sieves was: 3% ≥ 2.0 mm, 1.0 mm < 68% < 2.0 mm, 0.5 mm < 24% < 1.0 mm, 0.5 mm ≥ 5%. The bran yield was 15.3%. Sugar (CJ Jeiljedang, Seoul, Korea), shortening (Lotte Foods, Seoul, Korea), yeast (Societe Industrielle Lesaffre, Marcq, France), salt (CJ Jeiljedang, Seoul, Korea), and skim milk powder (Seoulmilk, Seoul, Korea) were purchased from local markets. Sodium carbonate used for solvent retention capacity (SRC) analysis was of reagent grade.

2.2. Analysis of the Physicochemical Properties of Flour–Bran Blends

“Baekgang” flour and “Ariheuk” bran were blended at ratios of 10:0, 9:1, 8:2, and 7:3, and designated as F100/B0, F90/B10, F80/B20, and F70/B30, respectively. The moisture contents of the flour alone, bran alone, and flour–bran blends were measured according to the AACC method 44-15.02 [17]. The ash content in flour was also measured according to the AACC Method 08-01.01 [17].

2.3. Solvent Retention Capacity Analysis of the Flour–Bran Blends

SRC analysis of the blends was performed according to Method 56-11.02 [17] to evaluate the quality. The SRC values in only water and sodium carbonate solution were measured because wheat bran could cause a significant error in the SRC values of lactic acid and sucrose solutions due to excessive swelling [18]. The flour or flour–bran blend (5 g) was added to a pre-weighed 50 mL conical tube. Distilled water and 5% (w/w) sodium carbonate solution were prepared, and 25 g of each solution was added to each tube containing flour. After dispersing and hydrating the flour or flour–bran blend for 20 min, the tube was centrifuged at 1000× g for 15 min (LaboGene 1248, Gyrozen Inc., Daejeon, Korea). The supernatant was discarded, and the pellet and tube were weighed. The % SRC values were calculated.

2.4. Determination of the Dough Mixing Property of the Flour–Bran Blends

The dough properties were evaluated using a 10 g mixograph (National Manufacturing Co., Lincoln, NE, USA) according to Method 54-40.02 [17]. A flour or flour–bran blend (10 g) was weighed and transferred to a mixing bowl of the mixograph. Based on the water SRC values of the flour or flour–bran blend, 6.0–6.6 g of distilled water was added to the bowl and mixed for 10 min. Mixograms of the samples were recorded to access the dough mixing characteristics.

2.5. Preparation of Bread Made of Flour–Bran Blends at Different Bran Ratios

Bread-making was conducted using a slight modification of Method 10-10.03 [17]. The flour or flour–bran blend (100 g), salt (1.5 g), skim milk powder (4 g), and shortening (3 g) were blended and placed in a micro pin mixer bowl. Pre-suspended sugar (6 g) and yeast (2 g) in 60 g of distilled water (29 ± 0.5 °C) were added and mixed for 4 min using a micro pin mixer (100 g, National Manufacturing Inc., Lincoln, NE, USA). The mixed dough was folded into a dough sheeter (YT-160, Shanghai Huayuan Food Machinery Co., Ltd., Shanghai Huayuan Food Machinery Co., Ltd., Shanghai, China) to make dough with a 0.47-cm thickness. The folded dough was placed in a baking pan and fermented in a fermenter (Phantom M301 Combi, Samjung, Gyeonggi, Korea) at 35 °C and 85% relative humidity for 105 min. The same fermentation time was used for baking bread regardless of bran blending to simply compare the effect of bran, although the fermentation time was appropriate for making bread with flour alone. The fermented dough was baked in an oven (Phantom M301 Combi, Samjung, Gyeonggi, Korea) at 215 °C for 23 min. The bread was allowed to cool at room temperature for 20 min, removed from the baking pan, and allowed to cool down for 10 min. Bread appearance was compared, and crumb colors were evaluated using a colorimeter (CR-20, Konica Minolta, Tokyo, Japan). Breads were also used to analyze the total phenolic and anthocyanin contents, and antioxidant activities.

2.6. Measurement of Total Phenolic and Anthocyanin Contents of Bread Made with Flour–Bran Blends

To analyze any changes in total phenolic and anthocyanin contents of bread during the bread-making process, the total phenolic and anthocyanin contents of the crust and crumb of the bread prepared with the flour–bran blends at different blending ratios were measured according to the method of Yu and Beta [12]. The bread was lyophilized for 48 h and then ground to extract total phenolic compounds. A bread sample (2 g) was mixed with 80% methanol (Duksan, Seoul, Korea) or 20 g of acidified methanol (pH 1) solution in a 50 mL tube wrapped with an aluminum foil, stirred using a stirrer (CN/VM-80, Miulab, Hangzhou, China) for 90 min, and then dispersed in an ultrasonicator (LK-U105, LK Lab Korea, Namyangju, Korea) at 40 kHz for 30 min. The mixture was centrifuged at 12,000× g for 15 min at 4 °C, and the supernatant was separated. The pellet was extracted again using the above process, and the resulting supernatant was combined with the previous one and stored at −20 °C. An extract of the bread sample with 80% methanol was used to analyze total phenolic compound content, DPPH, and ABTS radical scavenging activity, and the extract of the bread sample with acidified methanol was used to measure the total anthocyanin content.
The total phenolic compound content was determined using Folin–Ciocalteu reagent (Sigma, St. Louis, MO, USA) diluted ten times immediately before use. Bread extract (0.2 mL) was oxidized using 1.5 mL of diluted Folin–Ciocalteu reagent. The mixture was allowed to equilibrate for 5 min and neutralized with 1.5 mL of sodium carbonate solution (60 g/L) at room temperature. The absorbance of the mixture was measured at 725 nm using a spectrophotometer (X-ma 6100 PC, Human Corporation, Seoul, Korea) after 90 min. Methanol (80%) was used as the blank and gallic acid (gallic acid, Sigma, St. Louis, MO, USA) was used as the standard. The total phenolic content of the bread crust and crumb on a dry weight basis (dwb) was expressed as mg GAE/100 g.
To determine the total anthocyanin content of bread crust and crumb, cyanidin-3-glucoside, the main anthocyanin component in colored wheat, was used as a standard. The bread extract and the solution with 10 mg of cyanidin-3-glucoside (C3G) instead of bread were treated for 30 min with reagents. Absorbance was measured at 535 nm. The total anthocyanin content of the bread crust and crumb on a dry weight basis (dwb) was calculated by comparing with the absorbance of C3G and expressed as mg C3GE/100 g.

2.7. Measurement of the Antioxidant Activity of Bread Made with Flour–Bran Blends

To analyze any changes in the antioxidant activity of the bread during the bread-making process, the total antioxidant activity of the bread crust and crumb was measured by DPPH and ABTS radical scavenging activities according to the method described by Yu and Beta [12]. To determine DPPH radical scavenging activity, DPPH (1,2-diphenyl-1-picryl hydrazyl) solution (60 μmol/L) (3.9 mL) and bread extract (0.1 mL) were mixed and reacted at 25 °C for 30 min (t = 30). The absorbance was measured at 515 nm using a spectrophotometer (X-ma 6100 PC, Human Corporation, Seoul, Korea). For the sample-free group, absorbance was measured by mixing 3.9 mL of DPPH solution and 0.1 mL of 80% methanol. DPPH radical scavenging activity (%) was calculated using the absorbance (Asample t = 30) value of the sample-added group and the absorbance (Asample t = 0) value of the sample-free group. The graph of trolox concentration versus DPPH radical scavenging activity was plotted as the standard curve, and the DPPH value on a dry weight basis (dwb) was expressed as μmol TE (trolox equivalents)/100 g.
For determining ABTS radical scavenging activity, ABTS [2,2′-azino-bi (3-ethylbenzothiazoline-6-sulfonic acid), 7 mM] (Sigma, Mannheim, Germany) solution and 2.45 mM K2S2O8 (Sigma, St. Louis, MO, USA) solution were mixed 1:1 for 2 min and then reacted in the dark for 12 h. After diluting 1 mL of ABTS solution to 50 mL, absorbance was measured by mixing 1.85 mL of this solution with 0.1 mL of the extract of bread crumb and crust with methanol. The ABTS radical scavenging activity (%) was calculated using the absorbance (Asample t = 30) value of the sample-added group and the absorbance (Asample t = 0) value of the sample-free group. The graph of trolox concentration versus ABTS radical scavenging activity was plotted as the standard curve, and the ABTS value on a dry weight basis (dwb) was expressed as μmol TE (trolox equivalents)/100 g (dryw).

2.8. Experimental Design for Optimizing the Processing Conditions of Bread Made of Flour–Bran Blends at 30% Bran

Additionally, a response surface methodology with a Design Expert program (version 10.0, Stat-Ease, Inc., Minneapolis, MN, USA) was used to identify significant processing factors and optimize the water amount in formulation, dough mixing and fermentation conditions to improve the quality of bread made with the flour–bran blend while enhancing its antioxidant activity. The flour–bran blend with 30% bran was used because the bran percentage in the blend was higher than that in the whole wheat flour (approximately 20%). Based on a central composite design for making bread with the flour–bran blend at 30% bran, three factors as independent variables were selected and the levels for each factor were: water amount (55, 75 g), mixing time (2, 5 min), fermentation time (50, 90 min). A center point (65 g water, 3.5 min mixing time, and 70 min fermentation time) was also included. Overall, bread baking under seventeen conditions (by setting α point to 1.5) (Table 1) was conducted as described above and in random order. The bread quality was analyzed by bread moisture, color, height, volume, and firmness.

2.9. Measurement of Bread Quality

The bread crumb color was measured using a colorimeter (CR-20, Konica Minolta, Tokyo, Japan) for a piece of the bread with 1.5 cm thickness. Brightness (L*), redness (a*), and yellowness (b*) of bread crumb were recorded.
The bread height was measured with a caliper (HDS-20C, Mitutoyo, Kanagawa, Japan).
The bread volume was measured by the rapeseed displacement method—AACC Method 10-05.01 [17] with a slight modification. Waxy millet was filled in a 1.5 L volume container and measured its weight. The specific volume (mL/g) of the waxy millet was calculated. After placing a loaf of bread into the container, and the weight of spilled out waxy millet was measured. The volume of the bread was calculated using the specific volume (mL/g) of the waxy millet. The average value was calculated by repeated measurements at least twice for each sample.
According to Method 74-09.01 [17], the firmness of the bread was measured using a texture analyzer (CT3, Brookfield, Middleboro, MA, USA). A loaf of bread was cut into 2 pieces with a thickness of 1.5 cm from the center. The firmness of the pieces was measured, and the average value was calculated. Conditions for measuring firmness are as follows: test mode, measure force in compression; probe, TA-AACC36; pretest speed, 2.0 mm/s; test speed, 2.0 mm/s; post-test speed, 5.0 mm/s; penetration distance, 10 mm.

2.10. Statistical Analysis

All measurements were performed at least in duplicate. The data were evaluated with ANOVA and Tukey’s HSD test for mean comparison between samples using SPSS (ver. 25.0; IBM Corp., Armonk, NY, USA). A significant difference was considered at p < 0.05, unless otherwise specified. Using the Design Expert program, the data from RSM were analyzed by ANOVA to identify the main factors affecting the quality characteristics of the bread and to find a model suitable for each dependent variable as quality characteristics. The response surface 3D plot was generated based on the optimized model for each dependent variable. As the representative quality characteristics of the bread, the bread volume, height, and firmness were selected to optimize the formula and processing conditions. The bread volume and height were set as the maximum, and bread firmness was set as the minimum, and the desirability was calculated to identify the optimum conditions. Additionally, the prediction of the optimized formula and processing conditions was verified.

3. Results and Discussion

3.1. Moisture and Ash Contents of the Flour–Bran Blends

The moisture and ash contents of the flour–bran blends are shown in Table 2. Before blending, the moisture content of bran was 14.8%, which was significantly higher than that of flour alone (12.1%). In general, bran is a by-product generated from the wheat milling process, and flour is mainly produced from the endosperm, resulting in a relatively lower moisture content than bran [19]. Although the flour and bran samples used in this study were obtained from different wheat cultivars, they were milled under similar conditions using the same mill. Thus, the trends in moisture content for flour and bran were similar. The moisture content of the flour–bran blends was 12.9–12.9%, demonstrating a proportional increase as the blending ratio of wheat bran increased because of the high moisture content of bran. The moisture contents of flour and bran are positively correlated with the amount of water added during the tempering step during wheat milling [20].
The ash content of bran was 3.75%, which was approximately eight times higher than that of flour alone (0.48%). Hwang et al. [6] reported that the ash content of imported wheat bran is 5–7%. The “Ariheuk” bran used in this study showed a somewhat lower value than the results from different wheat varieties and milling methods. In general, minerals are located in the bran, which is the husk of wheat. Thus, the ash content of bran was significantly higher than that of flour. In this study, as the blending ratio of bran increased, the ash content increased proportionally to 0.48–1.46%. Katina [21] reported that the quality of bread is affected by protein, ash, and pentosan among flour components. The higher the ash content and the lower the protein content, the lower the bread volume, which negatively affects the bread color. Therefore, it can be predicted that making bread with flour–bran blends with an increasing blending ratio of bran significantly affects bread volume and color.

3.2. Quality of Flour–Bran Blends Using SRC

The SRC analysis results of flour–bran blends with different blending ratios are shown in Table 2. The water SRC values were 65.2–81.7%, and the sodium carbonate SRC values were 88.4–102.5%. Both SRC values increased proportionally as the blending ratio of bran increased. As an advantage of SRC, for flours produced from blends of wheat or flour, each SRC value equates to the mathematical, linearly proportional, weighted average of the corresponding SRC values for the 100% flour from each individual wheat in the blend [18]. The SRC values in water and sodium carbonate solutions are indicators of water absorption and the contribution of damaged starch among the quality characteristics of wheat flour, respectively [18]. These results of the SRC analysis suggest that an increased amount of water is needed for dough formation during the bread-making process for the breads made from flour–bran blends. Navrotskyi et al. [22] reported that the water retention capacity of bran is negatively correlated with bread baking properties. The increased sodium carbonate SRC values indicated an increase in the contribution of damaged starch. Damaged starch in wheat flour also contributes to an increase in water absorption, and excessively damaged starch delays the water absorption of gluten protein, lowers gluten formation, and negatively affects bread quality [23]. Farrand [24] reported that if flour with the same protein content increased the damaged starch content, the moisture absorption capacity of flour increased to a certain degree of homogeneity during dough mixing. However, when the starch granules are damaged excessively, the interface between air and dough becomes unstable during gelatinization, which results in the adhesion of the internal gas cell during baking, a decrease in bread volume, and a negative impact on bread crumb texture [25,26,27]. Thus, the water and sodium carbonate SRC results of the blends can predict the impact of blending ratio on the bread-baking performance of the blends.

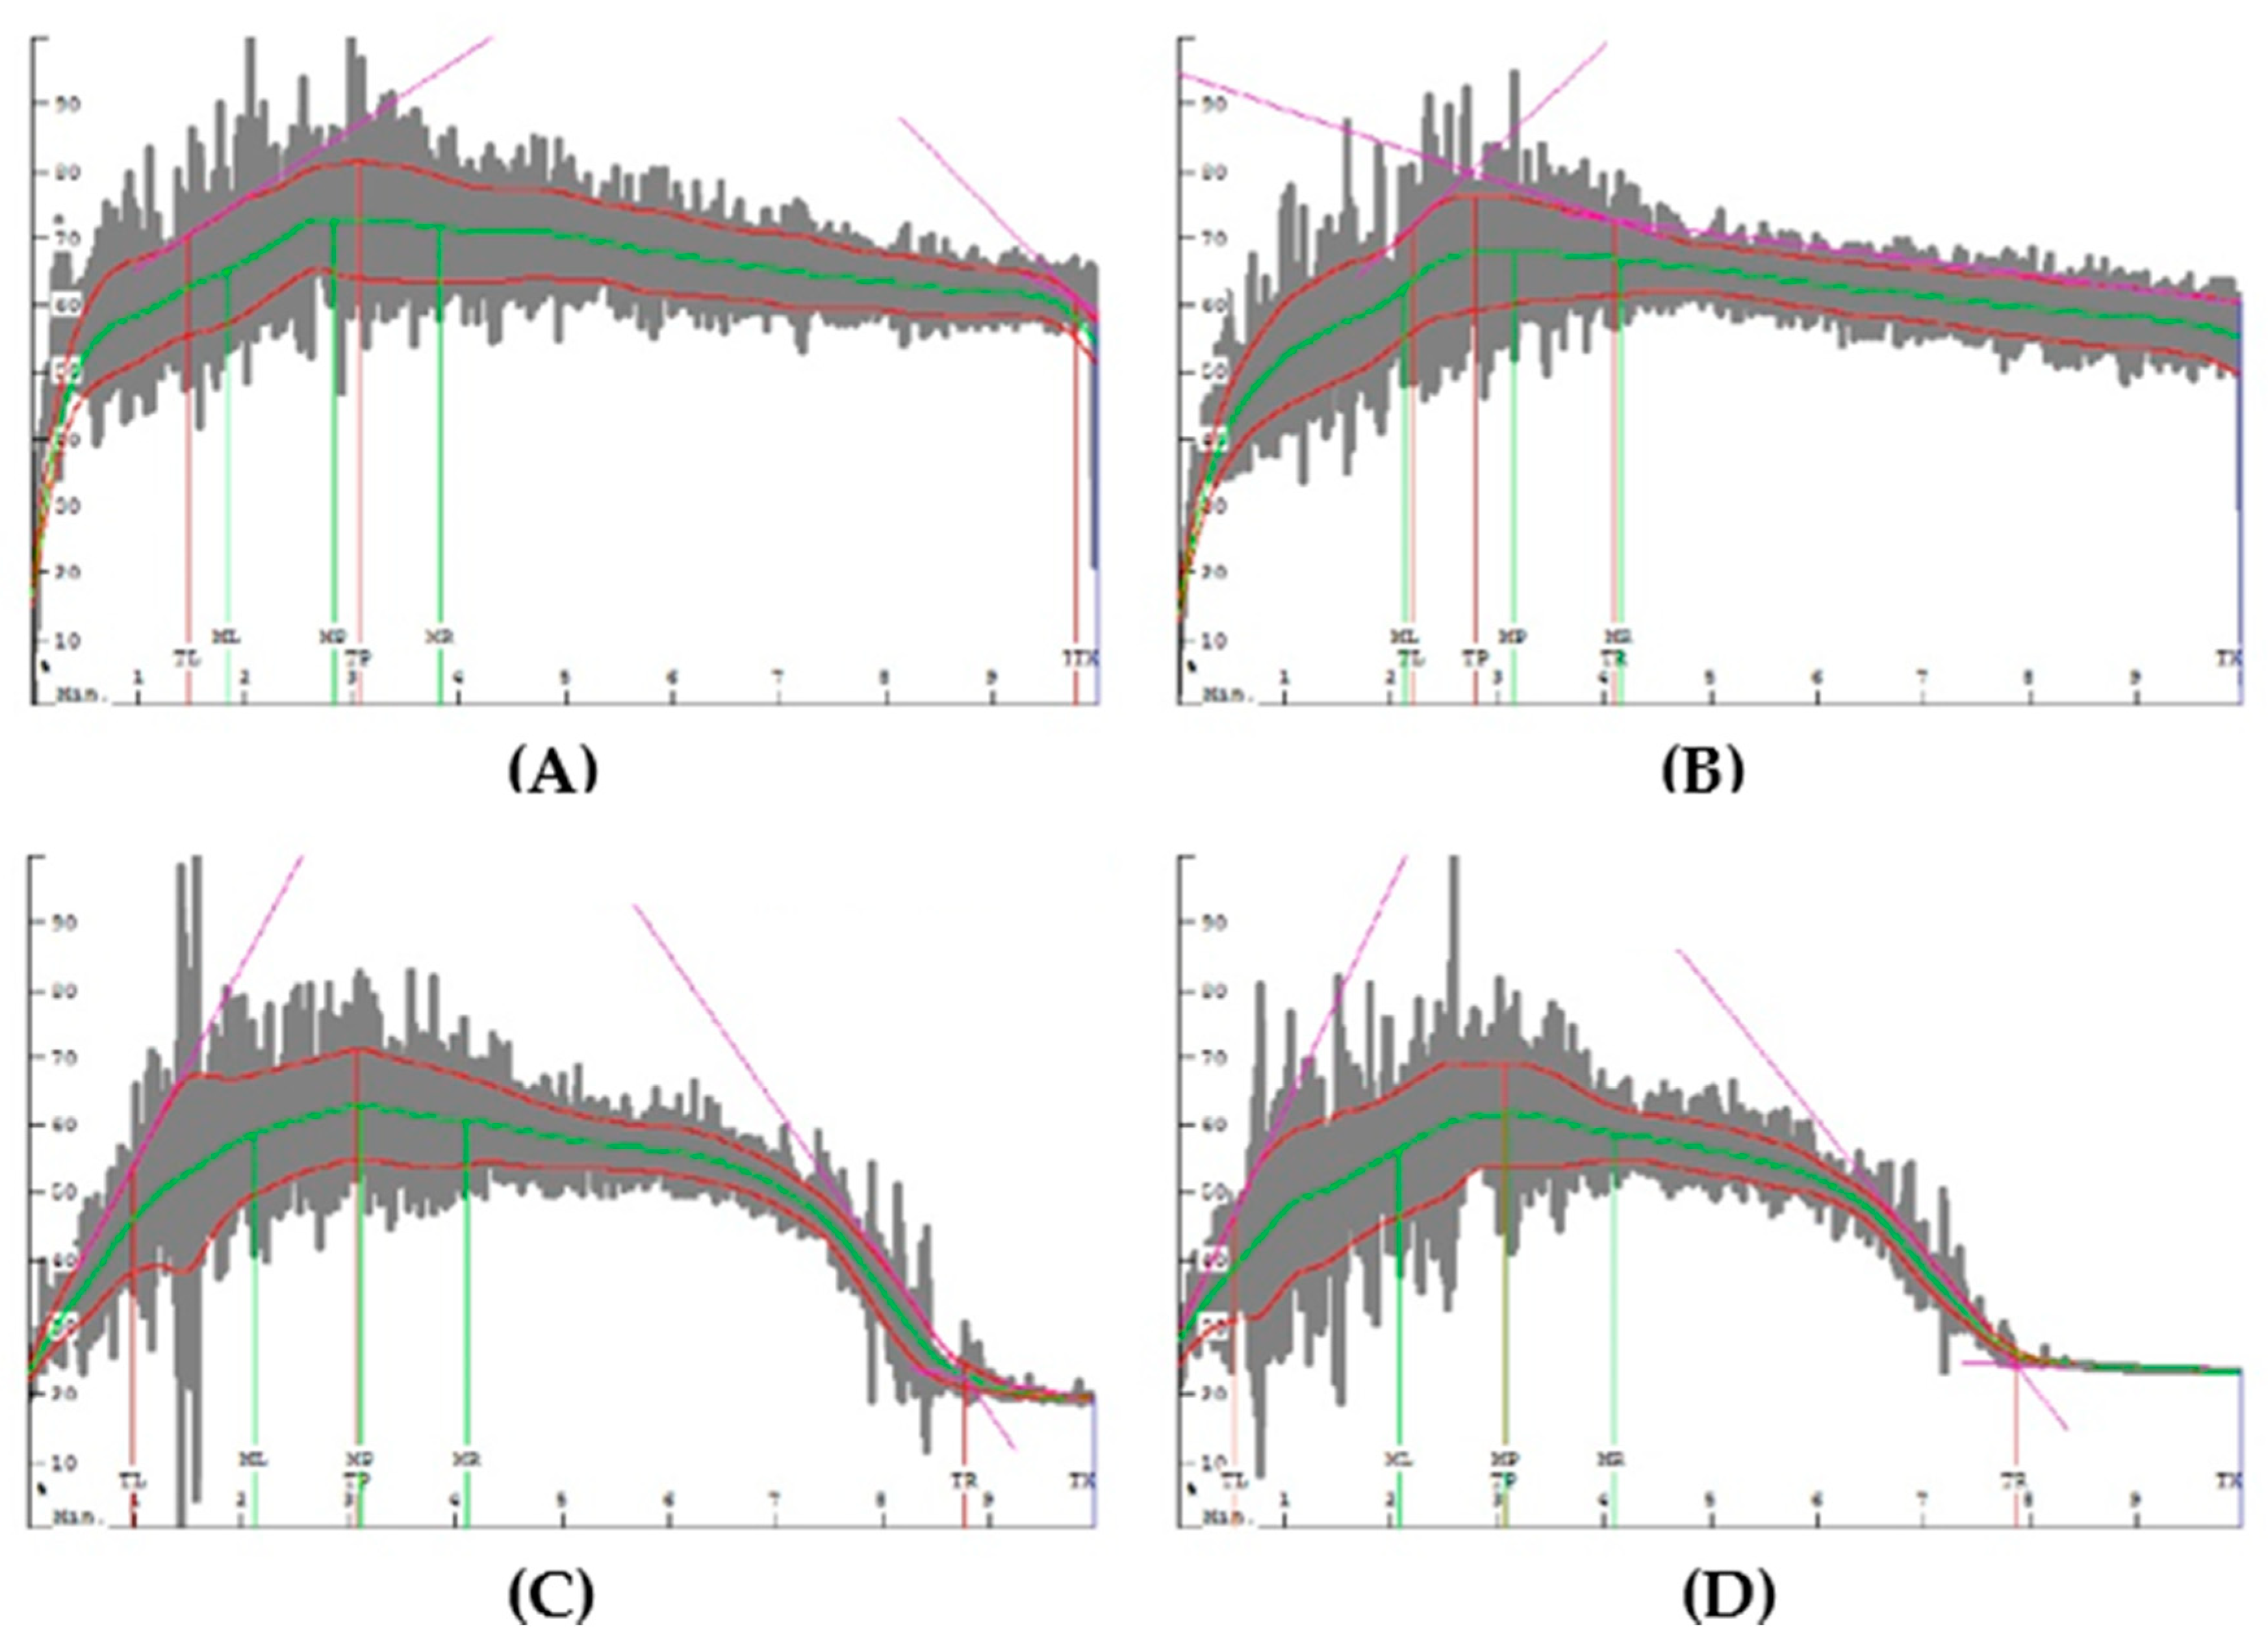
3.3. Dough Property of Flour–Bran Blends Using Mixograph

Mixograms of flour–bran blends with different blending ratios of bran are shown in Figure 1. As the blending ratio increased, a noticeable change in the dough mixing pattern was observed. Mixogram B (F90/B10), with a blending ratio of 10% bran, slightly decreased the bandwidth after the peak compared to mixogram A (F100/B0) of flour without bran blending, indicating no significant effect of the bran with such a low blending ratio.
On the other hand, mixograms C (F80/B20) and D (F70/B30) of the flour–bran blend with blending ratios of 20% and 30% bran, respectively, showed that the bandwidth of the dough sharply narrowed from 3 to 4 min after the start of mixing compared to mixogram A, suggesting that gluten formation capacity rapidly deteriorated. As the added amount of dietary fiber from rice bran to flour increases, the water absorption rate of the flour–fiber blend increases [28]. The addition of wheat bran or whole grain wheat flour to refined wheat flour generally increases the water absorption of the dough [29,30]. The water absorption rate of the flour–bran blends increased with an increase in the blending ratio of bran, which contains a dietary fiber content of 40–50%. An increase in the insoluble dietary fiber content in bread weakens the gluten matrix [31,32,33]. The bran mainly consists of insoluble dietary fiber [34], and the gluten matrix will be significantly weakened [35] when the blending ratio of bran is more than 20%, which results in a negative effect on the bread-making process. Our results showed a trend similar to that observed in previous studies.

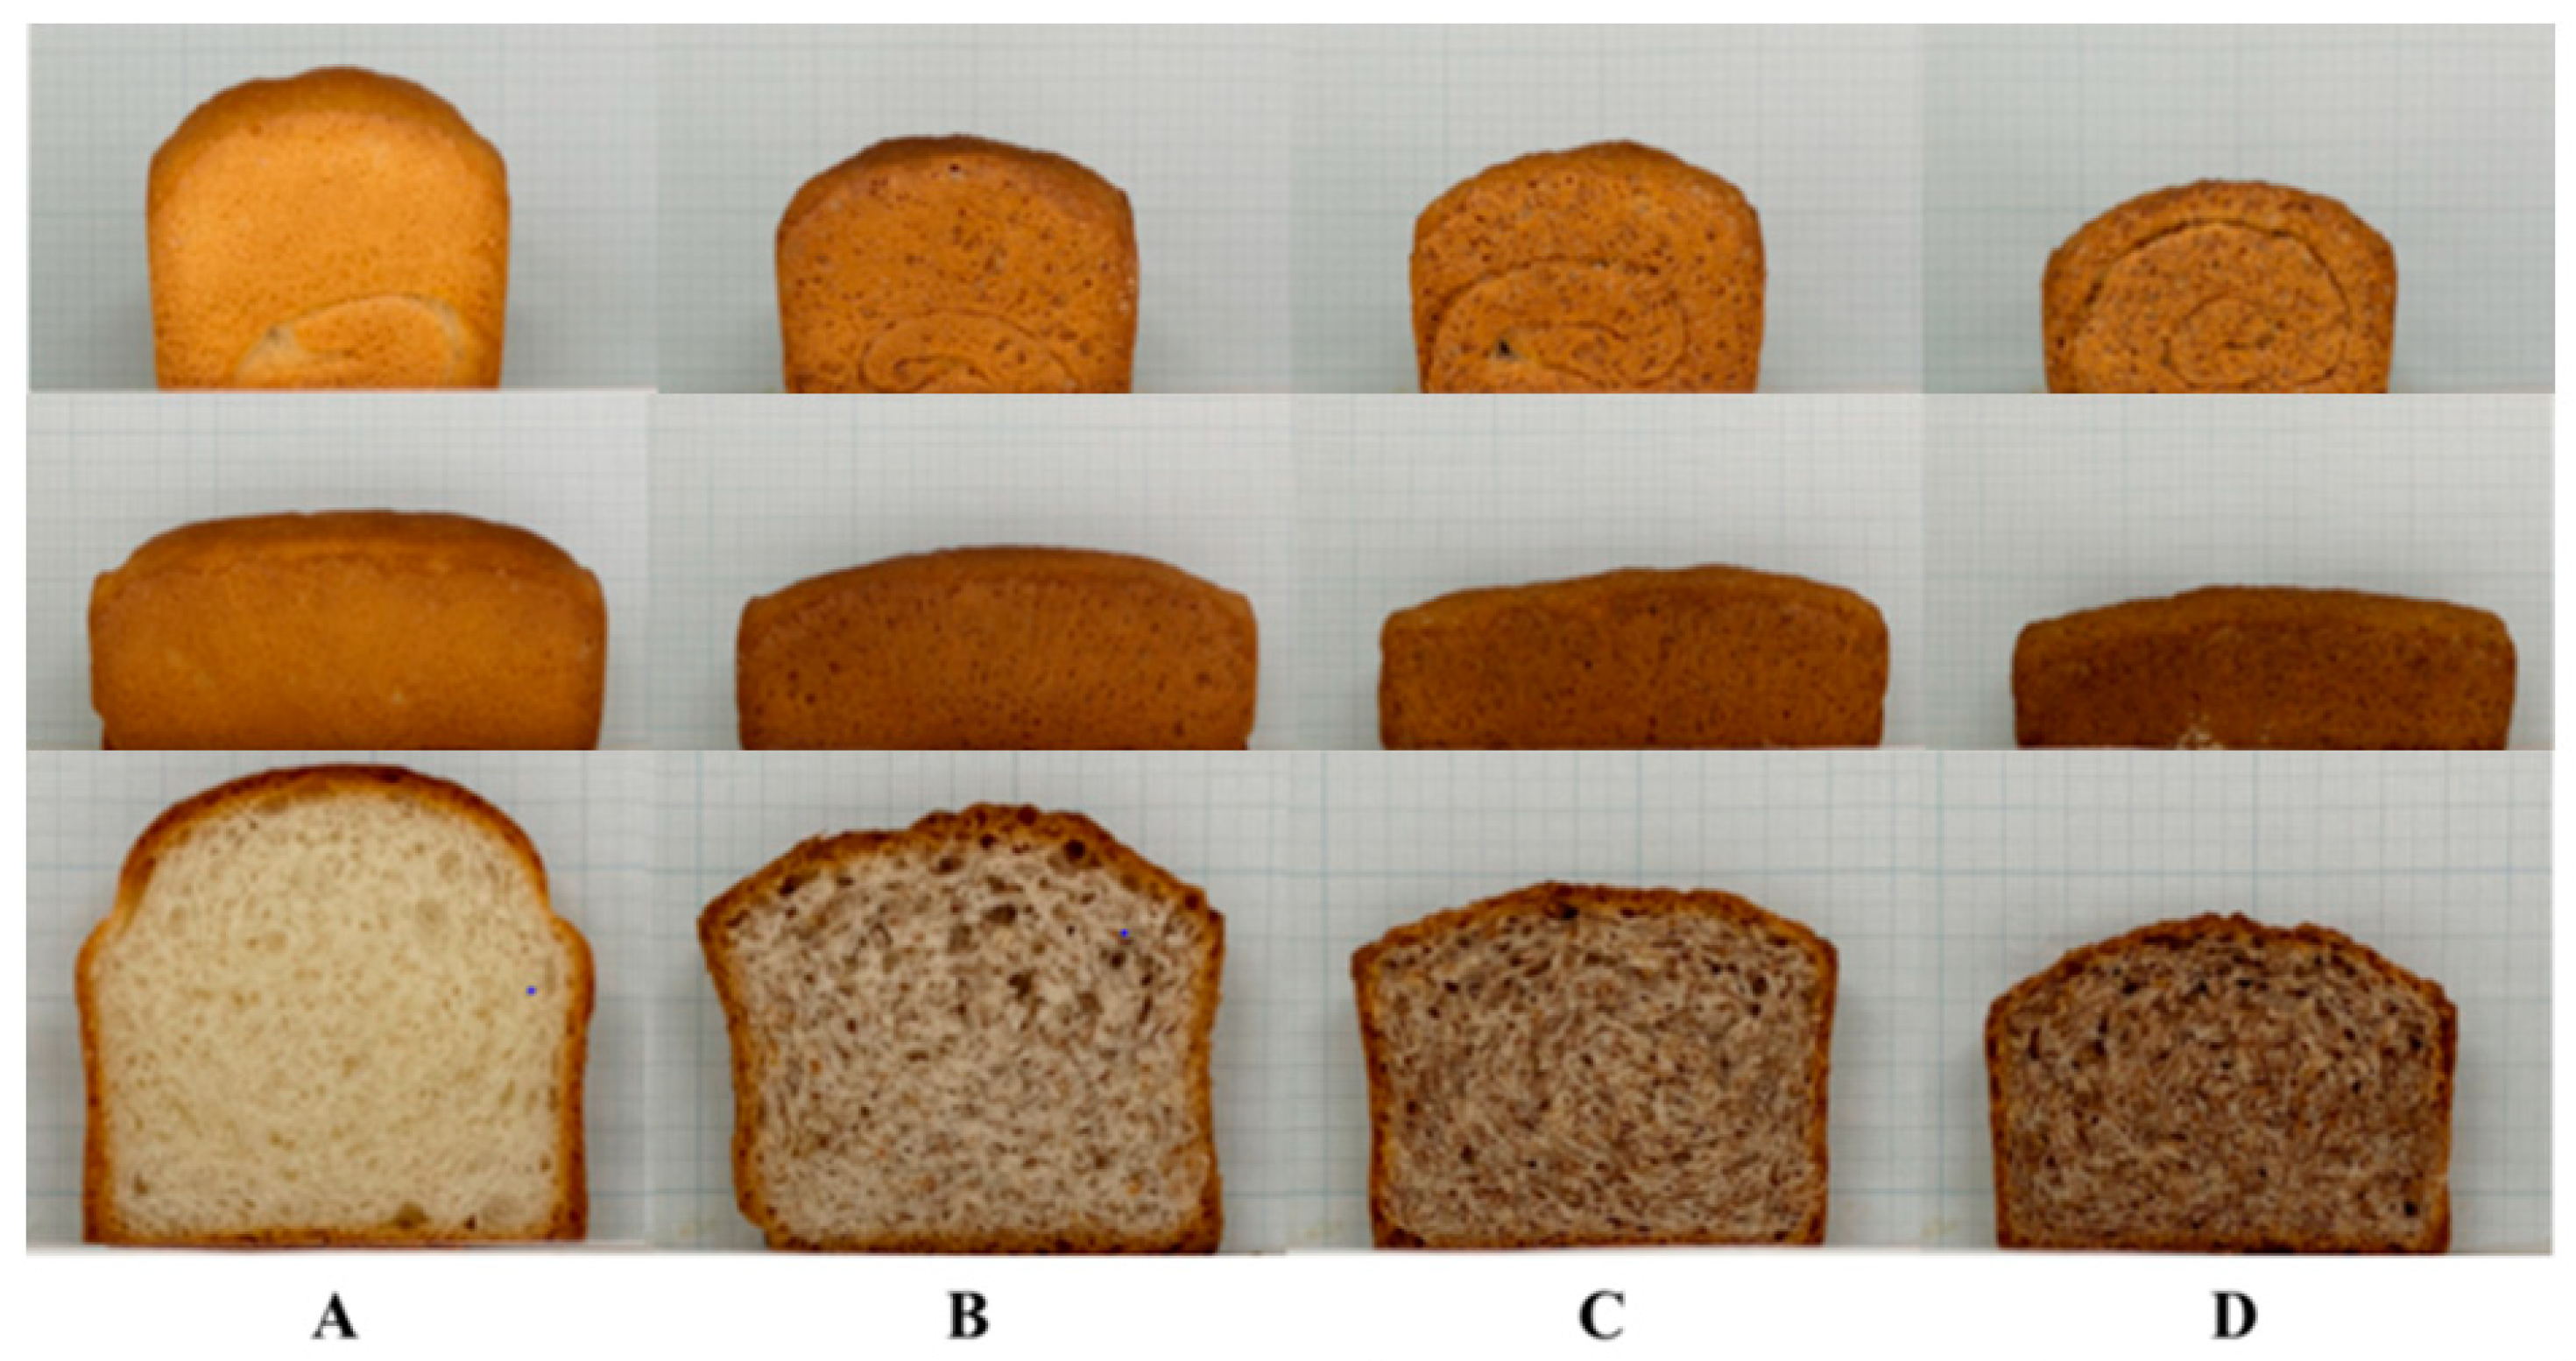
3.4. Quality of Bread Prepared with Flour–Bran Blends at Different Blending Ratios

The side view and cross-sectional photographs of bread made with flour–bran blends with different bran blending ratios are shown in Figure 2. As the blending ratio increased, the dough height after fermentation and the height of the bread decreased, and the color of the crumbs became darker. With the same fermentation time, decreased dough height by increasing the bran blending ratio indicated weakened dough strength led to decreased gas retention. As a result, the crumb porosity of bread became dense as the blending ratio increased. Bread prepared with the flour–bran blend at 10% bran showed more porous crumb than those at 20% or 30% bran, which close to the bread without bran addition.
L* values showed a significant decrease from 74.1 to 50.8, and a* values showed a significant increase from 1.1 to 6.9. However, the b* values decreased slightly from 14.1 to 13.3 when bran was blended with flour (Table 3). Similar to the dough properties measured by the mixograph (Figure 1), the cross-section and the height of the bread prepared by blending more than 20% bran decreased significantly.
Liu et al. [29] showed that the incorporation of wheat bran into wheat flour by up to 15% decreased the specific volume of Chinese steamed bread. Schmiele et al. [30] also reported that the addition of wheat bran by up to 40% to refined flour decreased the specific volume of pan bread. Wheat flour protein has a unique property for making bread, and gluten is formed by the combination of gliadin and glutenin in the dough, which has viscoelasticity. It forms a three-dimensional network structure that enables the capture of gas generated during fermentation and maintains the bread structure. However, the addition of wheat bran dilutes the gluten protein of the flour, resulting in weakened dough strength, decreased bread volume, and deteriorated bread quality [36]. In a previous study, the amount of bran added at a level that does not deteriorate the quality of bread was reported to be 7–10% [37,38], which is consistent with the results of the present study.

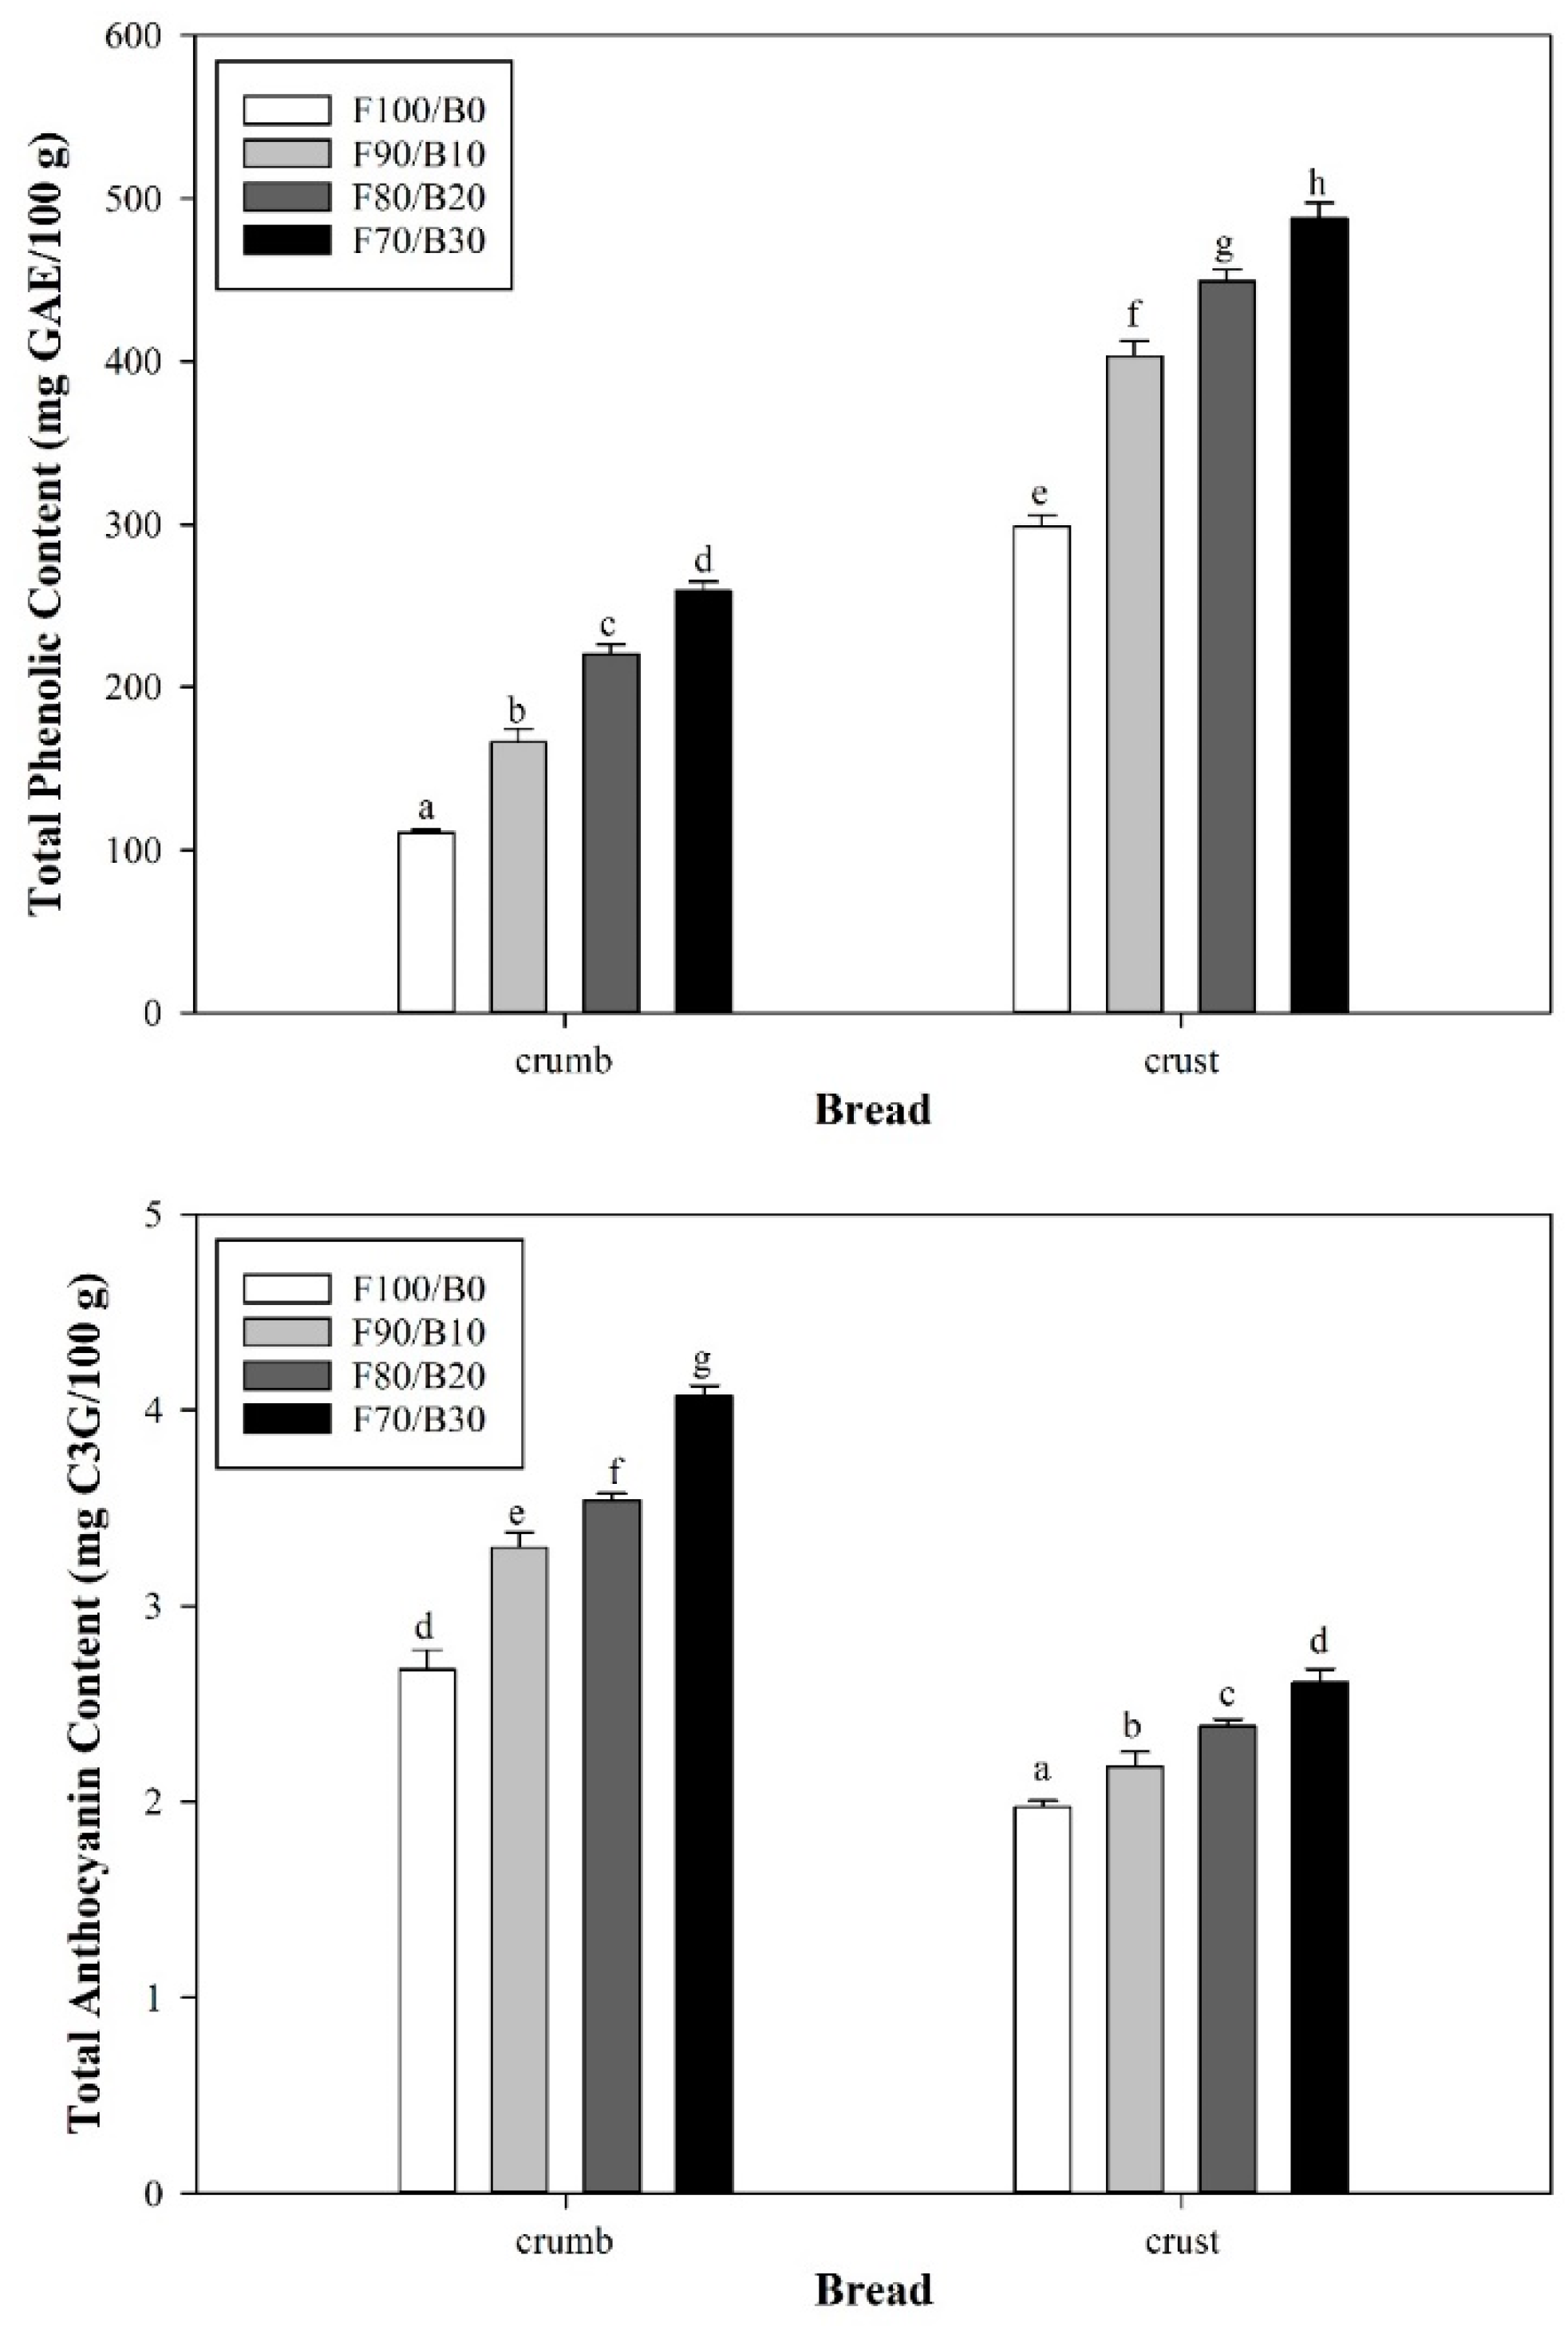
3.5. Total Phenolic and Anthocyanin Contents of the Bread Prepared with the Flour–Bran Blends

The total phenolic and anthocyanin contents of the bread made from flour–bran blends with different bran blending ratios are shown in Figure 3. The total phenolic content of the bread prepared with the flour–bran blends was in the range of 110.6–258.9 mg GAE/100 g for the bread crumb and of 298.8–487.4 mg GAE/100 g for the bread crust. The total anthocyanin content of the bread prepared with the flour–bran blends was in the range of 2.68–4.07 mg C3GE/100 g for the bread crumb and of 1.97–2.61 mg C3GE/100 g for the bread crust. As the blending ratio increased, the total phenolic and anthocyanin contents significantly increased in both the bread crumb and crust. The total phenolic content of the bread crust was higher than that of the bread crumb, which is consistent with the results reported by Yu and Beta [12]. During the baking of wheat-based products, amino acids and reducing sugars of wheat flour form phenolic compounds via the Maillard reaction. More phenolic compounds are formed in the bread crust than in the bread crumb because of the formation of pigments by the Maillard reaction [39,40]. However, the total anthocyanin content was higher in the bread crumb than in bread crust, showing the opposite trend for the total phenolic content. The results were consistent with those of previous studies, which found that more anthocyanins were destroyed in the crust of bread. Anthocyanins are relatively unstable to heat and lead to easy destruction during processing [41]. In particular, the bread crust was much hotter during baking than the bread crumb [42]. Li et al. [41] reported that anthocyanins in muffins prepared with purple wheat were destroyed entirely during baking because of their high sensitivity to heat.
Phenolic compounds are mainly distributed in plants and have been reported to have antioxidant, antibacterial, and anti-inflammatory activities. These can be used as indirect indicators of the antioxidant activity [43,44]. The purple-colored wheat bran used in this study contained anthocyanin pigment, unlike regular wheat bran. When bran was blended at 30%, the total phenolic and total anthocyanin contents were the highest among the blending ratios tested. The antioxidant activity of the bread can be enhanced by blending with bran.

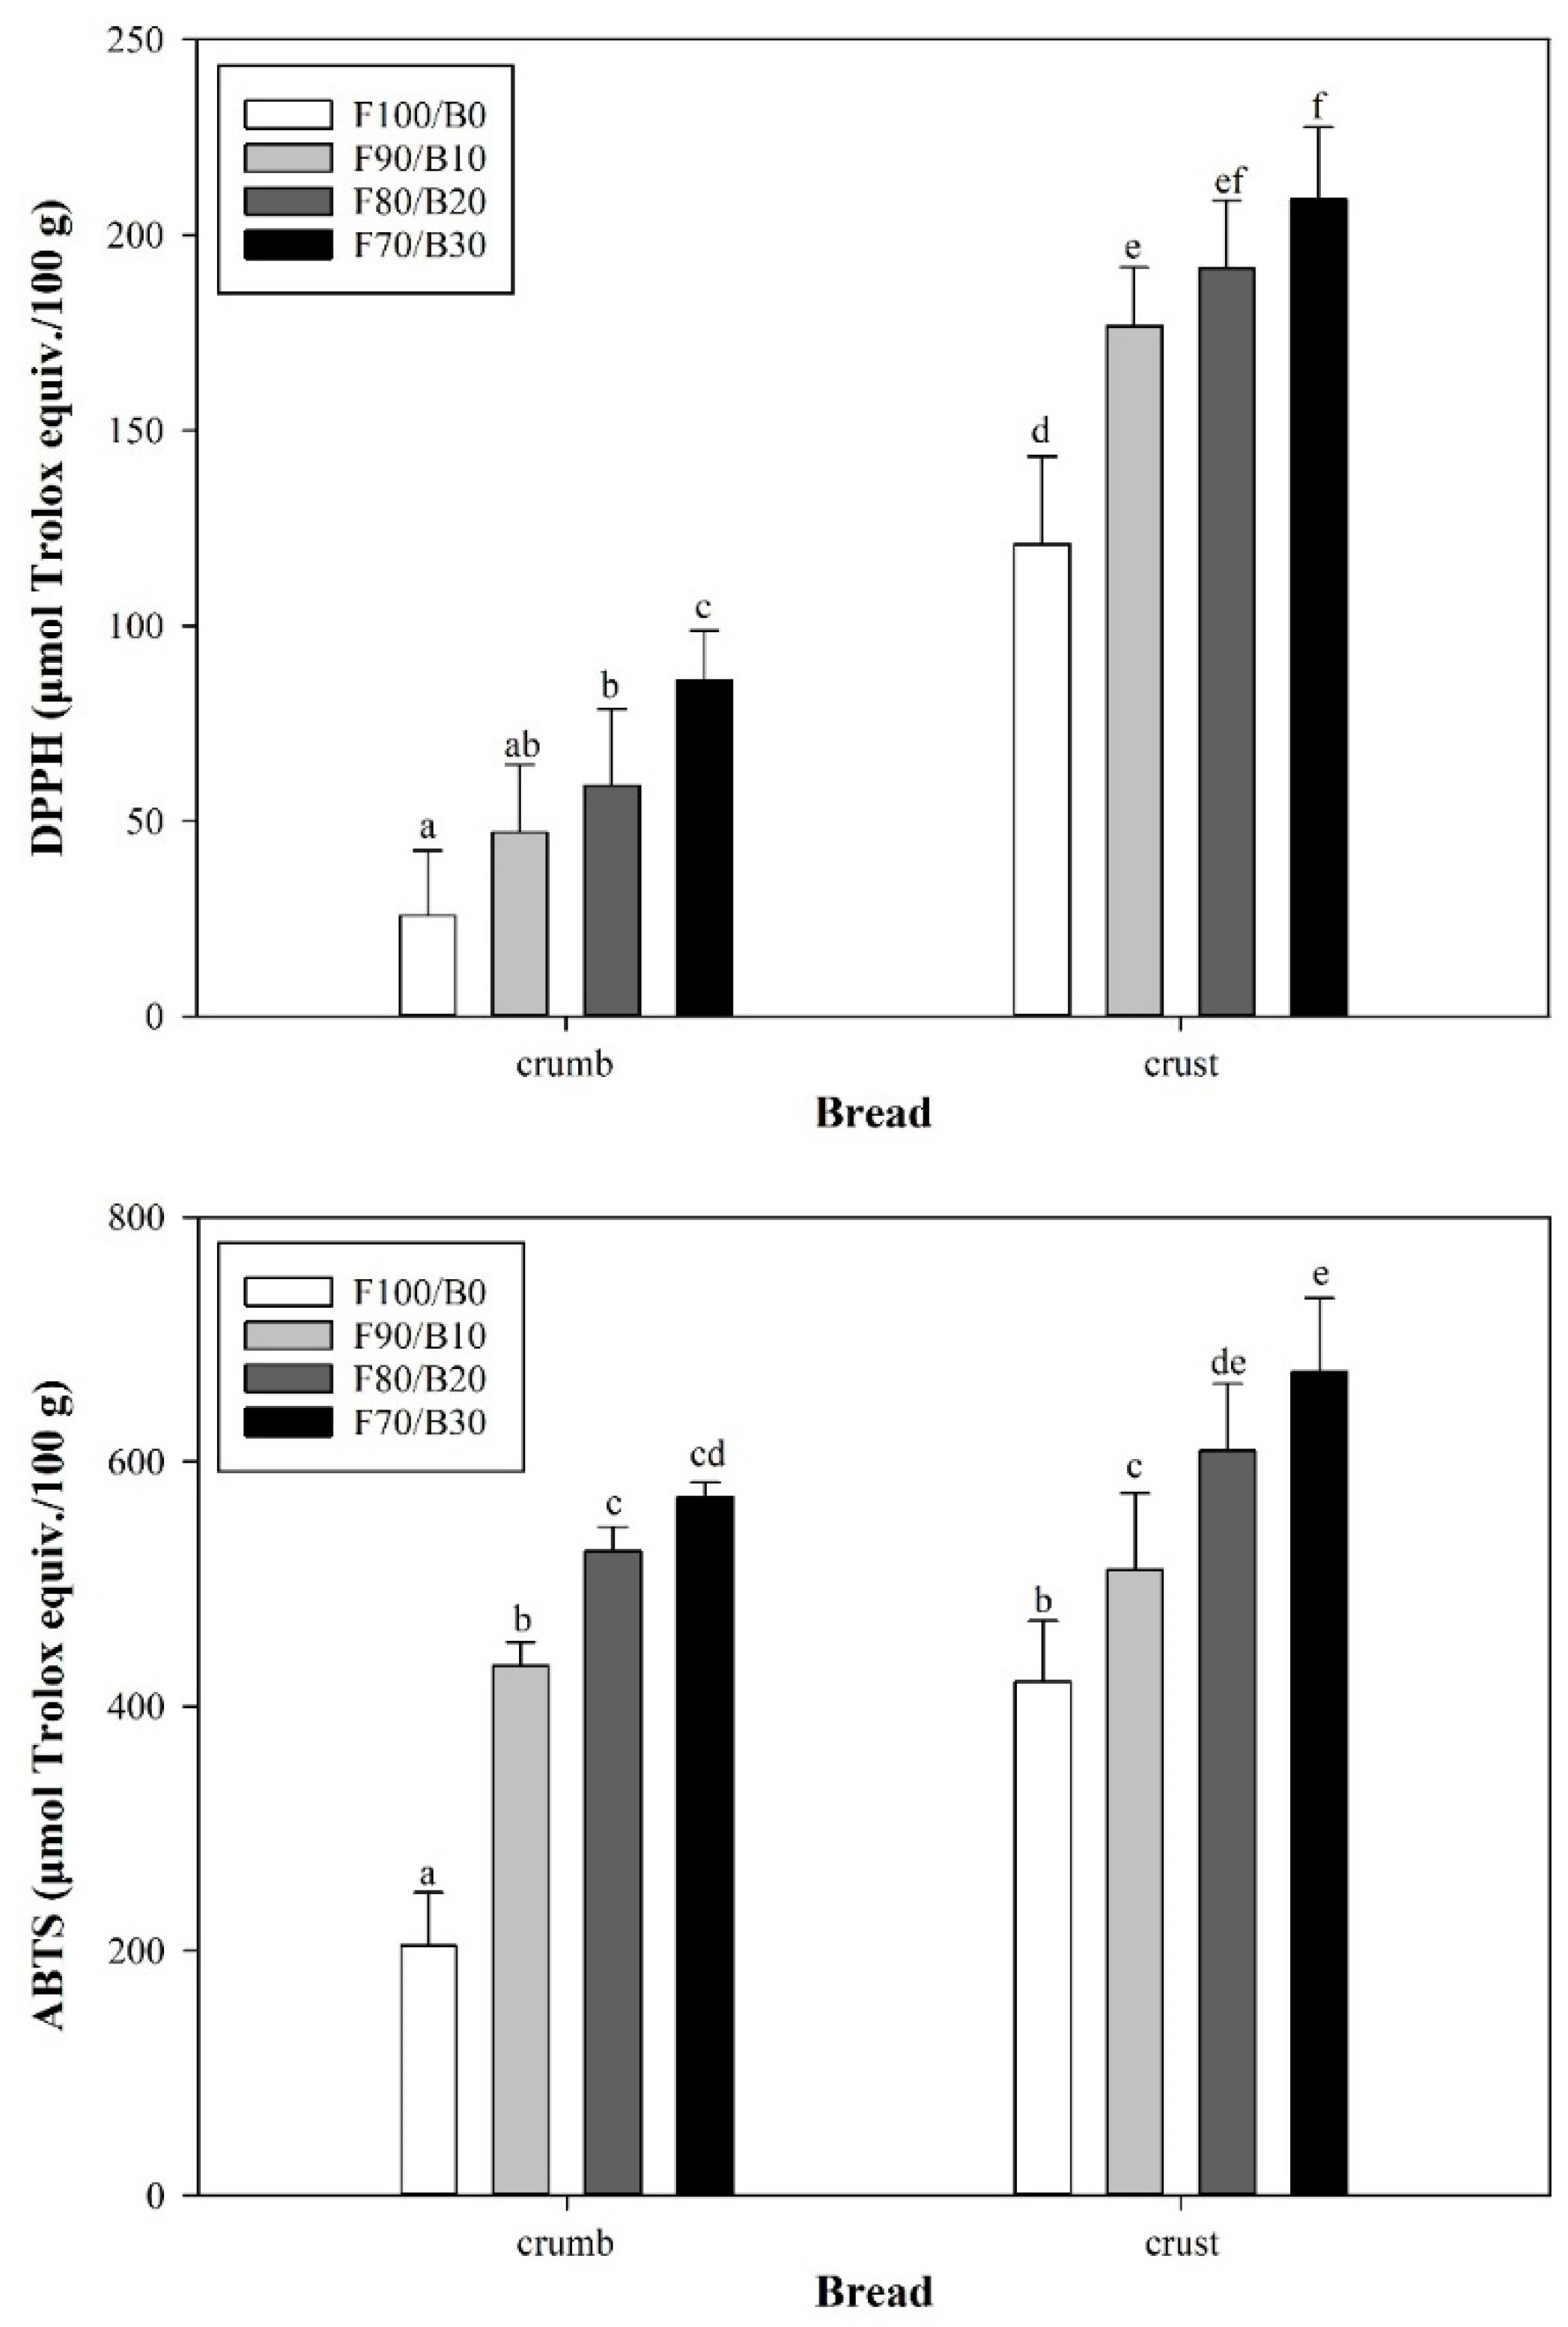
3.6. Antioxidant Activity of Bread Prepared with Flour–Bran Blends

The DPPH and ABTS radical scavenging activities of the bread crust and crumb are shown in Figure 4. The DPPH radical scavenging activity of the bread prepared with the flour–bran blends was 25.8–85.9 μmol TE (trolox equivalents)/100 g for the bread crumb and 120.9–209.2 μmol TE (trolox equivalents)/100 g for the bread crust. The ABTS radical scavenging activity of the bread prepared with the flour–bran blends was 204.9–571.1 μmol TE (trolox equivalents)/100 g for the bread crumb and 420.1–673.7 μmol TE (trolox equivalents)/100 g for the bread crust. As the blending ratio of bran increased, both DPPH and ABTS radical scavenging activities in the bread crumb and crust increased proportionally. The results confirmed a higher scavenging activity for the crust than for the crumb. These results were similar to those of studies on the antioxidant activities of the crumb and crust of the bread prepared by adding black rice flour [45] and the antioxidant activities of the crumb and crust of the bread prepared by adding three types of bran [12]. Melanoidin pigments produced by the Maillard reaction during baking in bakery products are reported to have antioxidant functions [46,47,48]. Besides the antioxidant properties of melanoidin pigments, other Maillard reaction products such as acrylamide are classified by the International Agency of Research on Cancer (IARC) as potential carcinogenics [49]. Therefore, the formation of acrylamide during baking should be cautious and controlled.
In this study, the antioxidant activity increased more in the crust with an increase in the bran blending ratio because of more melanoidin pigments produced in the crust. Moreover, in the crust, owing to the total phenolic content being much higher than the total anthocyanin content, the total phenolic composition could more significantly contribute to the antioxidant activity than the total anthocyanin content.

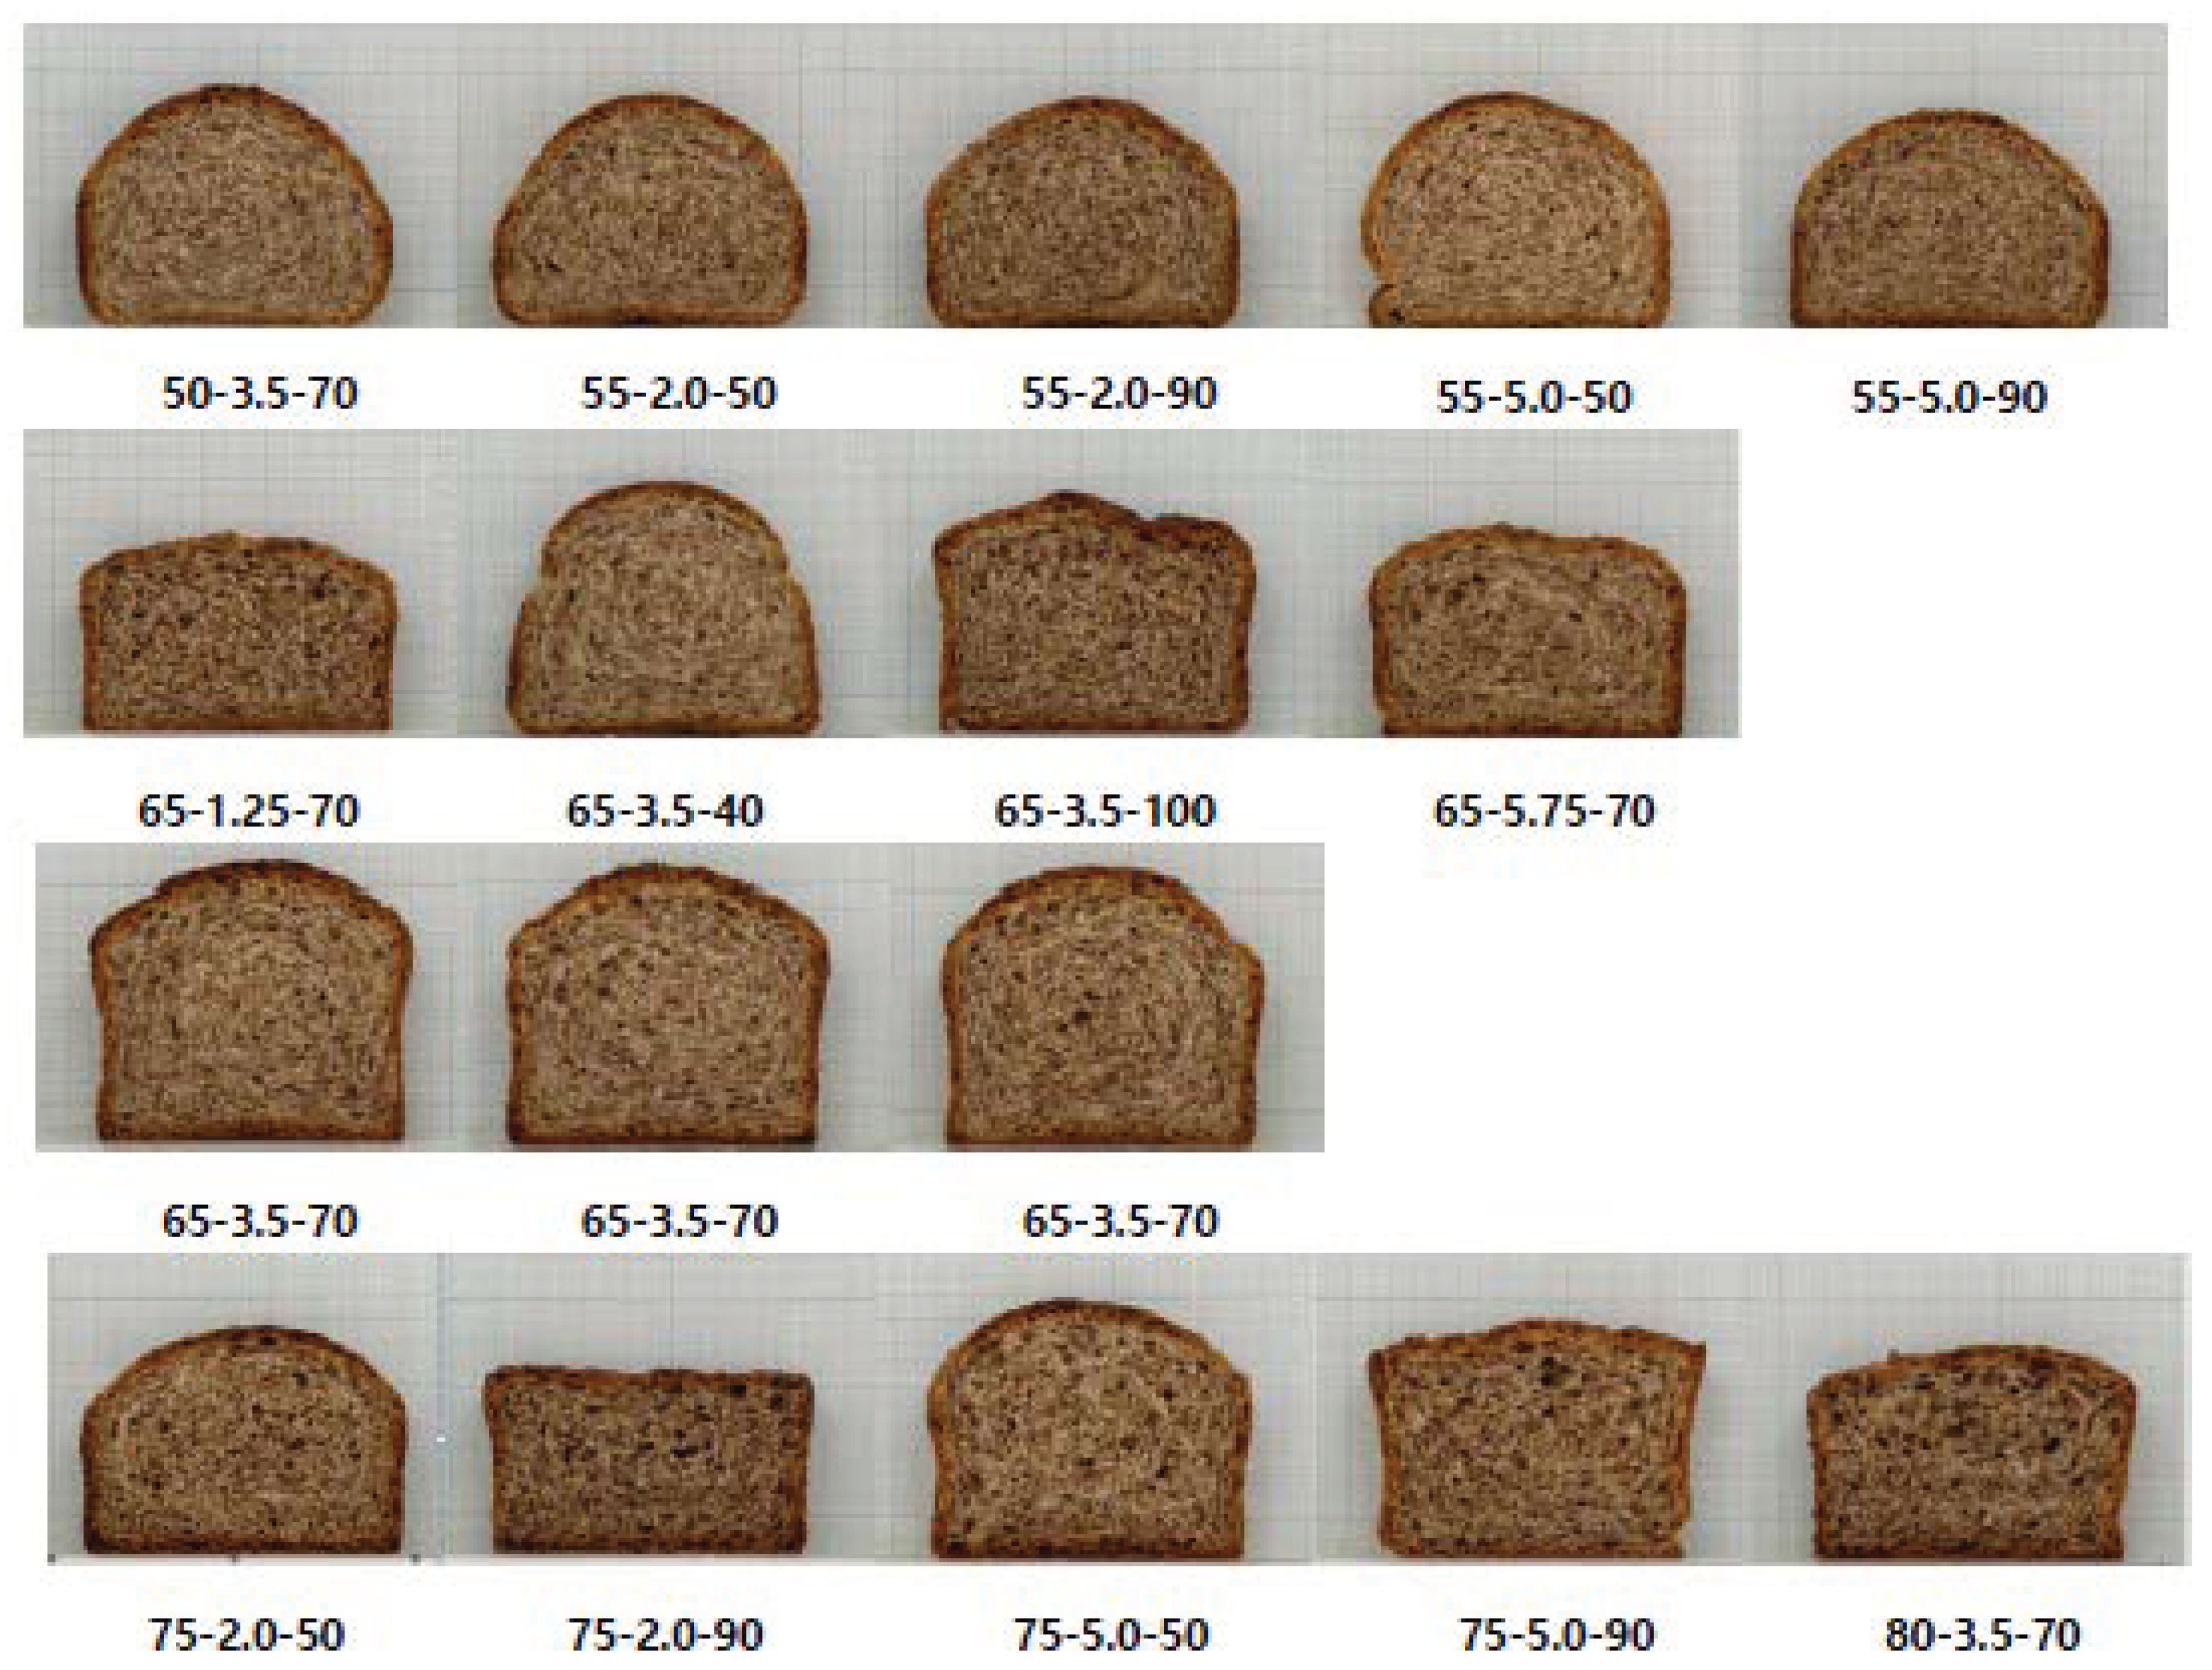
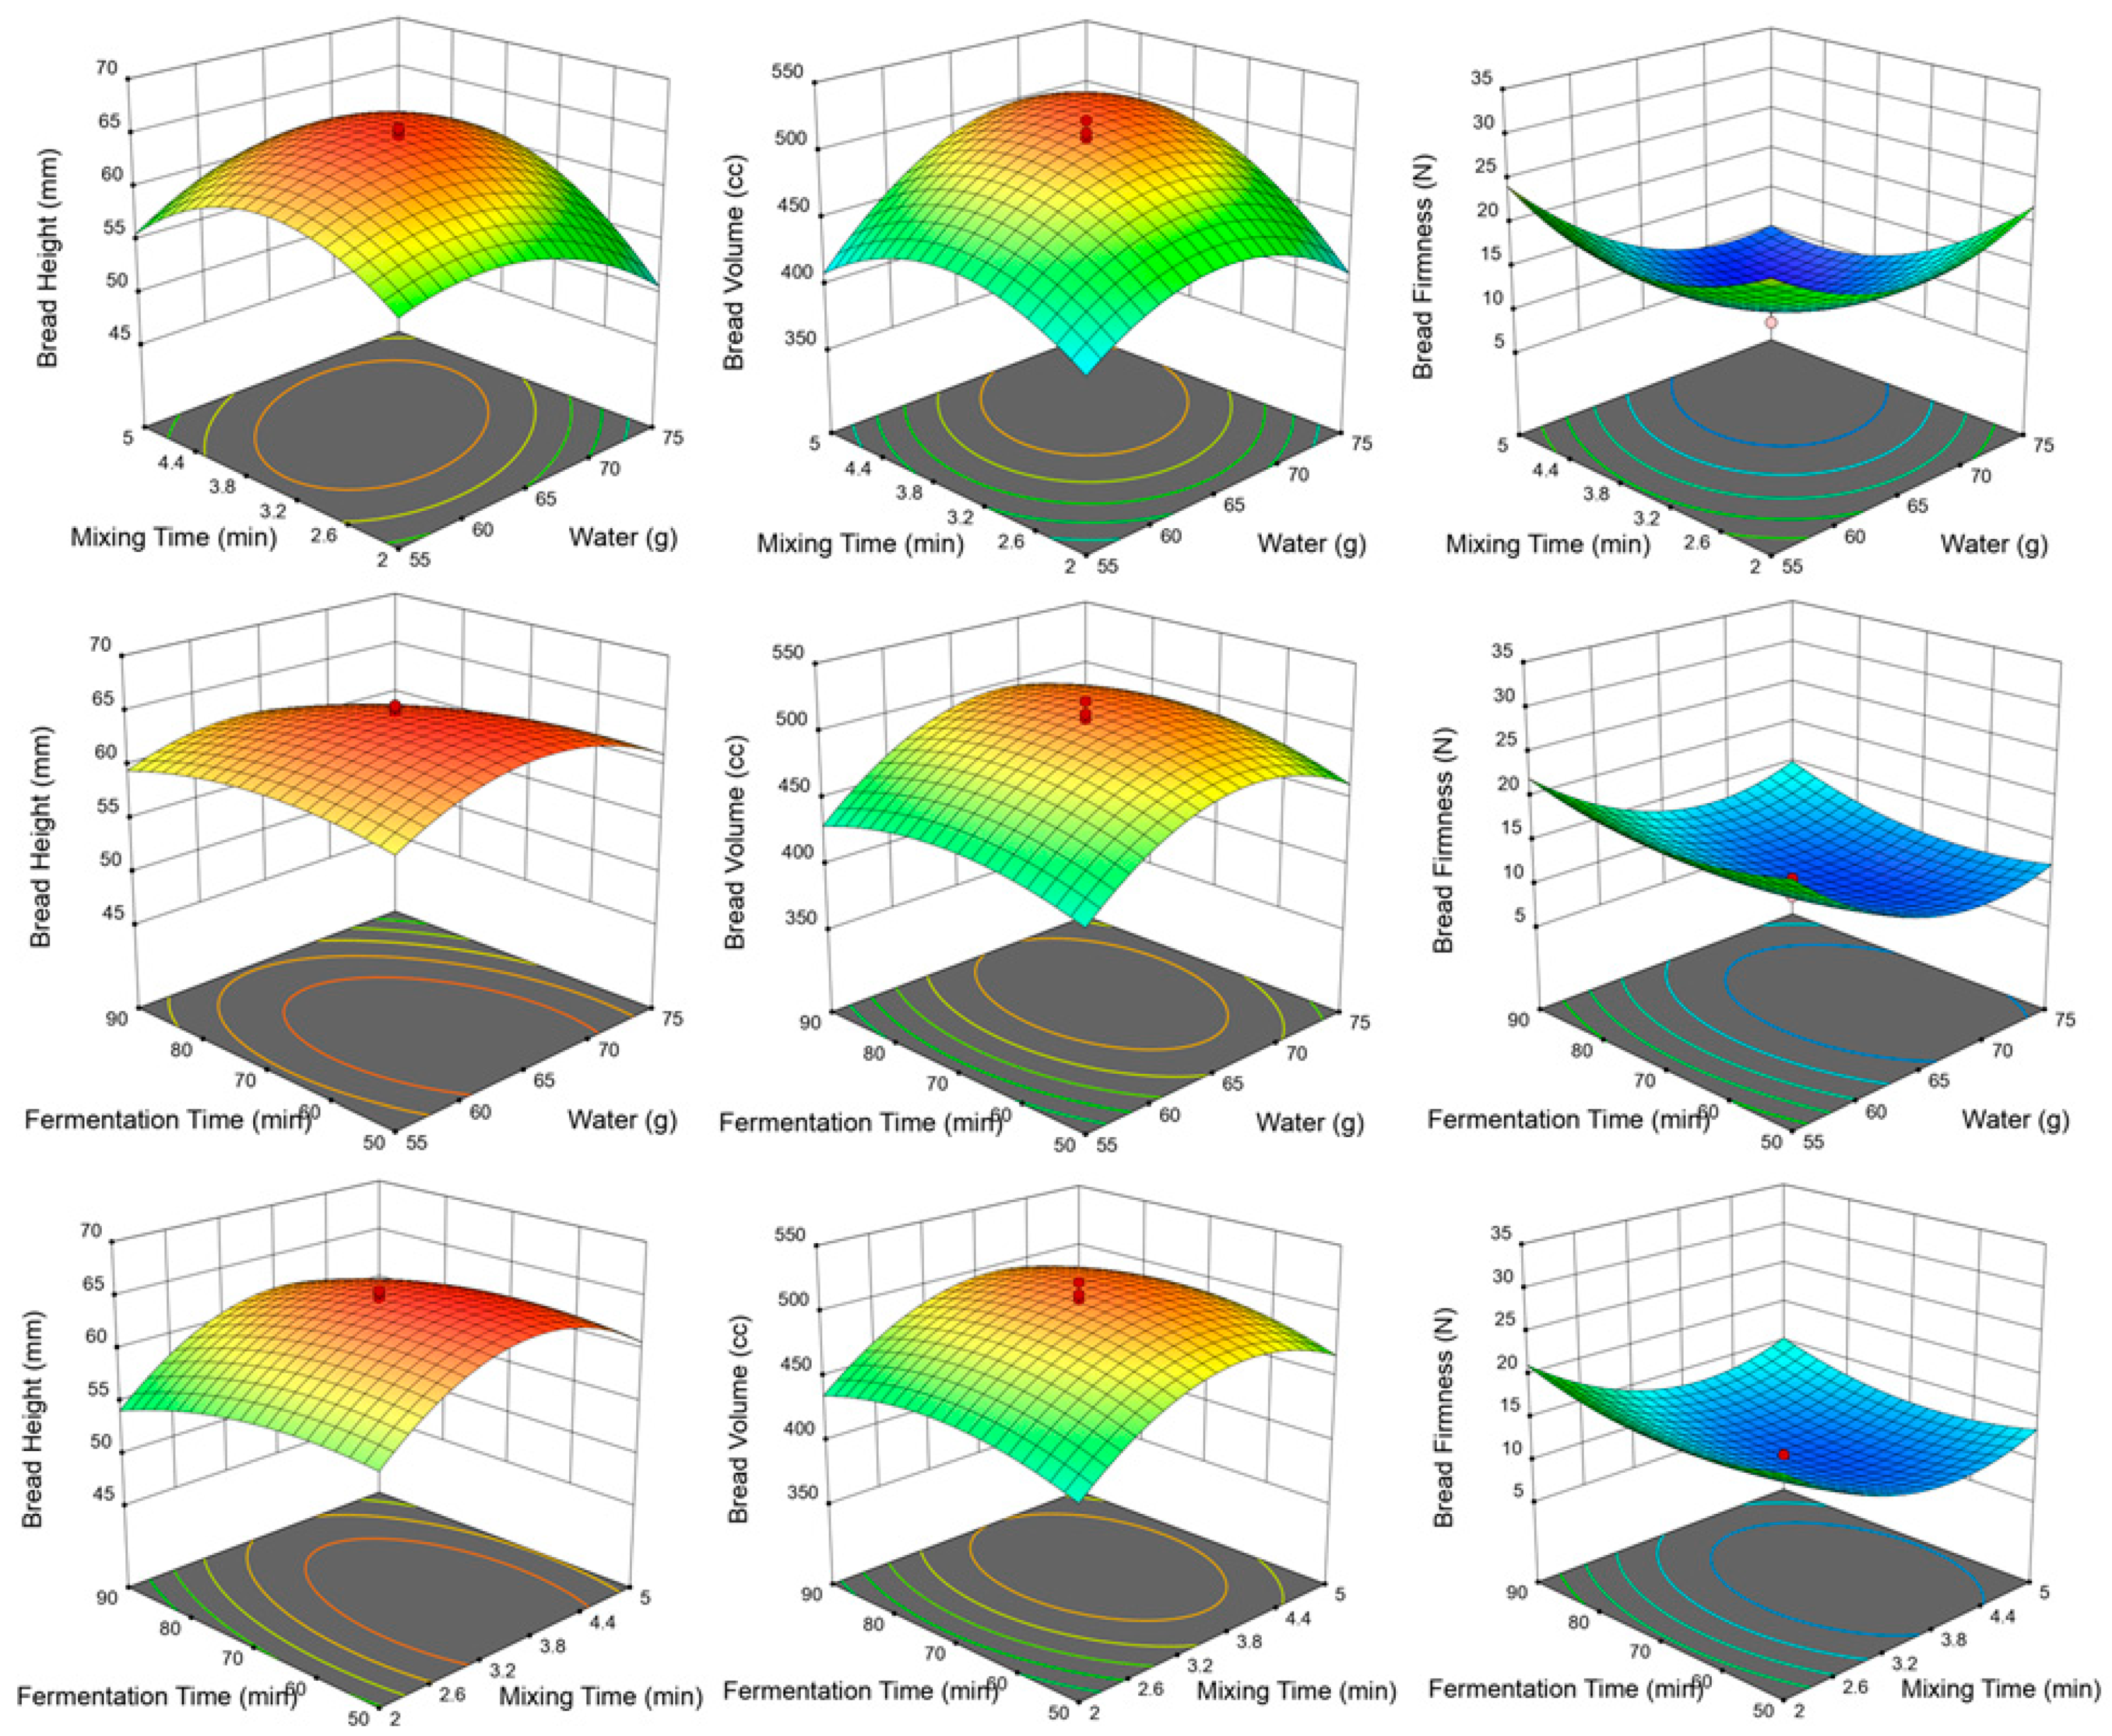
3.7. Optimization of Processing Conditions for Bread Prepared with Flour–Bran Blends at 30% Bran

Based on the response surface methodology (RSM) to optimize the effect of water amount, mixing time, and fermentation time on the quality of bread formulated with 30% flour–bran blend, the bread’s cross-sectional photos are shown in Figure 5. Among the bread samples, the bread prepared with the center point: 65 g water, 3.5 min mixing time, 70 min fermentation time appeared the largest cross-section size.
The result (mean values) measured quality characteristics of bread was presented in Table 4. The moisture content of the bread was 37.6–46.0%. The formula with a large amount of water was larger than that with a small amount of water. This result is consistent with the previous study reported by Jo et al. [50] that the moisture content of bread increased as the added water amount increased in mixing. In the tested formula and processing conditions, the moisture content of bread was the lowest at 37.6% at 50 g of water, 3.5 min of mixing time, and 70 min of fermentation time. In comparison, the bread moisture content was the highest (46.0%) at 80 g of water, 3.5 min of mixing time, and 70 min of fermentation time. ANOVA analysis exhibited that the moisture content of bread was significantly affected by both the water amount and the fermentation time.
The bread crumb color was 47.1–56.7 for L*, 5.7–6.6 for a*, and 11.6–13.5 for b* (Table 4). Kim et al. [51] reported that the pigment components were denatured during the fermentation and baking process, affecting the bread crumb color. The purple-colored bran of “Ariheuk” in this study contains functional components such as anthocyanins, tannins, and polyphenols, which causes the change in the bread crumb color during fermentation and baking.
The bread height was 45.4–65.5 mm. In the tested formula and processing conditions, the bread height was the highest at the center point: 65 g of water, the mixing time 3.5 min, and the fermentation time 70 min. When the mixing time and fermentation time were long, the bread height was low. ANOVA analysis exhibited that the bread height was significantly influenced by the mixing time (Table 5). The result could be supported by finding that gluten development had significantly deteriorated after 3–4 min of mixing time when 30% of bran was added to the flour using a mixograph.
The bread volume was 378–523 mL. ANOVA analysis showed that the bread volume was significantly affected by the water amount and the mixing time (p < 0.05) (Table 5). Like the bread height, the bread volume was the highest at the center point: 65 g of water, the mixing time 3.5 min, and the fermentation time 70 min. The volume of bread is generally affected by the protein quantity and quality of wheat flour, the degree of gluten development, and the dough improvers [52]. When bran contained dietary fiber was blended for making bread, the gluten was diluted and led to form “weak dough,” resulting in reduced volume [37]. Therefore, in this study, the volume of bread can be increased by controlling the water and mixing time.
The bread firmness was 8.6–30.0 N. The firmness was the lowest at the center point: 65 g of water, 3.5 min of mixing, and 70 min of fermentation time, where the bread height and volume were the largest. The firmness of bread is related to the moisture content of bread, the degree of air cell development, and the bread volume. The firmness of bread decreased as the moisture content of bread was high, the air cell was well developed, and the volume increased [50]. On the other hand, the highest firmness value was observed at 55 g of water, 5 min of mixing time, and 50 or 90 min fermentation time because of low air cell development and small bread volume led by a small water amount. ANOVA analysis showed that the bread firmness was significantly affected by the amount of water and the mixing time (p < 0.05) (Table 5).
The representative characteristics of bread (bread height, volume, and firmness) were quadratic models (Table 5). For bread height, only the mixing time showed a significance at p < 0.05. For bread volume and firmness, water and mixing time showed significance at p < 0.05. Among the three factors, fermentation time did not significantly affect the quality characteristics of height, volume, and firmness. Overall, mixing time was identified as the most significant factor in the quality of bread prepared with the flour–bran blend.
Three-dimensional response surface plots for each quality characteristic of bread are shown in Figure 6. For the representative quality attributes of bread, such as height, volume, and firmness, excellent quality of bread with higher height and volume and lower firmness appeared as the water amount and mixing time were closer to the center point.
All three bread characteristics were found to have the highest significance with volume p < 0.05, height p < 0.01, and firmness p < 0.01. R2 referred to the degree of model fit, and confirmed the suitability in the height of 0.911, volume of 0.888, and firmness of 0.912 (Table 6).
For optimizing formula and processing conditions for bread prepared with flour–bran blend at 30% bran, the volume and height were set as the maximum value, and the firmness was set as the minimum value. With the determined reaction equations, the desirability analyzed by Design Expert Software was 0.960, and the identified optimum conditions were 68.1 g water, 4.0 min mixing time, and 67.3 min fermentation time. For verifying the predicted values based on the models, actual values based on experiments are shown in Table 7.
The optimized formula and processing conditions were verified well. Compared with the bread height obtained from the previous test for the effect of bran blending ratio, bread formulated with optimum conditions showed a height of 64.7 mm, which was close to the height of the bread (65.4 mm) with 10% bran. The results demonstrated a significant improvement in bread quality by controlling the formulation of basic ingredients and processing conditions without adding additional dough improvers.

4. Conclusions

To develop healthy functional foods formulated with purple-colored bran, the quality and dough properties of flour–bran blends with different blending ratios and the quality and antioxidant activity of bread prepared with the blends were investigated in this study. Additionally, optimizing processing conditions for bread with the blend at 30% bran was conducted using response surface methodology. Increasing the blending ratio of bran resulted in increased water absorption and the contribution of damaged starch, and decreased gluten formation. With more than 20% bran, the weakening effect of gluten development was significantly noticeable. As the blending ratio of bran increased, the bread-making performance of the flour–bran blends decreased. However, the total phenolic compound and total anthocyanin contents and the DPPH and ABTS radical scavenging activities as indicators of antioxidant activity significantly increased. The results were best fitted into a quadratic polynomial model with regression coefficient values close to or more than 0.900 for all responses based on RSM analysis. Optimized conditions were close to a center point: 68.1 g water, 4.0 min mixing time, and 67.3 min fermentation time. Overall, this study provides fundamental data for developing bread to promote health benefits through purple-colored wheat bran’s excellent antioxidant activity. In particular, controlling the amount of water and mixing time could improve bread quality without requiring any additional ingredients.

Author Contributions

Conceptualization, M.K. and Y.M.; methodology, Y.S. and Y.M.; formal analysis, Y.S. and Y.M.; investigation, M.K.; data curation, Y.S.; writing—original draft preparation, Y.S. and Y.M.; writing—review and editing, M.K.; supervision, M.K.; project administration, Y.M.; funding acquisition, M.K. All authors have read and agreed to the published version of the manuscript.

Funding

This research was supported by the Cooperative Research Program for Agriculture Science and Technology Department (Project No. PJ014543012020) funded by the Rural Development Administration (Korea).

Institutional Review Board Statement

Not applicable.

Informed Consent Statement

Not applicable.

Data Availability Statement

Data are contained within the article.

Acknowledgments

We thank Kyeong Hoon Kim at for the gift of the sample of purple-colored wheat bran.

Conflicts of Interest

The authors declare no conflict of interest.

References

  1. Flour Yield Classification: Korea Flour Mills Industrial Association. Available online: http://www.kofmia.org/data/stat_idx03.jsp (accessed on 3 August 2018).
  2. Processed Food Segmentation Market Status: Food Information Statistics System. Available online: https://www.atfis.or.kr/article/M001010000/view.do?articleId=3086&page=&searchKey=&searchString=&searchCategory= (accessed on 23 October 2020).
  3. Shin, Y.J.; Jegal, J.M.; Lee, M.H. Quality and antioxidant properties of white bread with gynura procumbens powder. Culin. Sci. Hosp. Res. 2019, 25, 1–11. [Google Scholar]
  4. Vetrimani, R.; Rao, P.H. Studies on stabilization of wheat bran. J. Food Sci. Technol. 1990, 27, 332–335. [Google Scholar]
  5. Onipe, O.O.; Jideani, A.I.O.; Beswa, D. Composition and functionality of wheat bran and its application in some cereal food products. Int. J. Food Sci. Technol. 2015, 50, 2509–2518. [Google Scholar] [CrossRef]
  6. Hwang, J.K.; Kim, C.T.; Cho, S.J.; Kim, C.J. Effects of various thermal treatments on physicochemical properties of wheat bran. Korean J. Food Sci. 1995, 27, 394–403. [Google Scholar]
  7. Gȯmez, M.; Jiménez, S.; Ruíz, E.; Oliette, B. Effect of extruded wheat bran on dough rheology and bread quality. LWT Food Sci. Technol. 2011, 44, 2231–2237. [Google Scholar] [CrossRef]
  8. Sudha, M.L.; Vetrimani, R.; Leelavathi, K.E. Influence of fibre from different cereals on the rheological characteristics of wheat flour dough and on biscuit quality. Food Chem. 2007, 100, 1365–1370. [Google Scholar] [CrossRef]
  9. Leelavathi, K.E.; Rao, P.H. Development of high fiber biscuits using wheat bran. J. Food Sci. Technol. 1993, 30, 187–190. [Google Scholar]
  10. Agrifood Department Briefing. Available online: https://www.gov.kr/portal/ntnadmNews/1476047 (accessed on 23 October 2020).
  11. Rural Development Administration Briefing. Available online: https://www.gov.kr/portal/gvrnPolicy/view/156154662?PolicyType=G00301&srchTxt=%EB%B0%B1%EA%B0%95%20%EB%B0%80%EA%B0%80%EB%A3%A8 (accessed on 23 October 2020).
  12. Yu, L.; Beta, T. Identification and antioxidant properties of phenolic compounds during production of bread from purple wheat grains. Molecules 2015, 20, 15525–15549. [Google Scholar] [CrossRef] [PubMed] [Green Version]
  13. Hřivna, L.; Zigmundová, V.; Burešová, I.; Maco, R.; Vyhnánek, T.; Trojan, V. Rheological properties of dough and baking quality of products using coloured wheat. Plant Soil Environ. 2018, 64, 203–208. [Google Scholar]
  14. Li, L.; Wang, Z.; Li, L.M.; Zheng, X.L.; Ma, S.; Wang, X.X. Effects of fermented wheat bran on flour, dough, and steamed bread characteristics. J. Chem. 2018, 1597308, 1–7. [Google Scholar] [CrossRef]
  15. Messia, M.C.; Reale, A.; Maiuro, L.; Candigliota, T.; Sorrentino, E.; Marconi, E. Effects of pre-fermented wheat bran on dough and bread characteristics. J. Cereal Sci. 2016, 69, 138–144. [Google Scholar] [CrossRef]
  16. Rezaei, S.; Najafi, M.A.; Haddadi, T. Effect of fermentation process, wheat bran size and replacement level on some characteristics of wheat bran, dough, and high-fiber Tafton bread. J. Cereal Sci. 2019, 85, 56–61. [Google Scholar] [CrossRef]
  17. AACC. Method 08-01.01, 10-10.03, 44-15.02, 54-40.02, 56-11.02. In Approved Methods of Analysis, 11th ed.; AACC International: St. Paul, MN, USA, 2010. [Google Scholar]
  18. Kweon, M.; Slade, L.; Levine, H. Solvent retention capacity (SRC) testing of wheat flour: Principles and value in predicting flour functionality in different wheat-based food processes, as well as in wheat breeding—A review. Cereal Chem. 2011, 88, 537–552. [Google Scholar] [CrossRef]
  19. Avarzed, E.; Wang, X.; Moon, Y.; Kim, K.H.; Kweon, M. Quality characteristics and antioxidant activities of cookies formulated with the blend of Korean domestic wheat flour and purple wheat bran. Korean J. Food Cook Sci. 2020, 36, 152–162. [Google Scholar] [CrossRef]
  20. Kweon, M.; Martin, R.; Souza, E. Effect of tempering conditions on milling performance and flour functionality. Cereal Chem. 2009, 86, 12–17. [Google Scholar] [CrossRef]
  21. Katina, K. High-Fiber Baking; Woodhead Publishing: Cambridge, UK, 2003; pp. 487–499. [Google Scholar]
  22. Navrotskyi, S.; Guo, G.; Baenziger, S.; Xu, L.; Rose, D.J. Impact of wheat bran physical properties and chemical composition on whole grain flour mixing and baking properties. J. Cereal Sci. 2019, 89, 102790. [Google Scholar] [CrossRef]
  23. Joo, O.S.; Jung, Y.M. Effects of attrition milling in wheat flour on starch damaged of dough and bread baking properties. Korean J. Food Preserv. 2001, 8, 434–441. [Google Scholar]
  24. Farrand, E.A. The Influence of particles size and starch damaged on the characteristies of bread flours. Bak. Dig. 1972, 46, 22–26. [Google Scholar]
  25. Tester, R.F. Properties of damaged starch granules. Composition and swelling properties of maize, rice, pea and potato starch fractions in water at various temp. Food Hydrocoll. 1997, 11, 293–301. [Google Scholar] [CrossRef]
  26. Miller, B.S.; Trimbo, H.B.; Powell, K.R. Effect of flour granulation and starch damage on the cake making quality of soft wheat flour. Cereal Sci. Today 1967, 12, 245–252. [Google Scholar]
  27. Zeleznak, K.J.; Hoseney, K.C. The role of water in the retrogradation of wheat starch gels and bread crumb. Cereal Chem. 1986, 63, 407–411. [Google Scholar]
  28. Kim, Y.S.; Ha, T.Y.; Lee, S.H.; Lee, H.Y. Properties of dietary fiber extract from rice bran and application in bread-making. Korean J. Food Sci. Technol. 1997, 29, 502–508. [Google Scholar]
  29. Li, W.; Brennan, M.; Serventi, L.; Brennan, C. Effect of wheat bran on dough rheology and final quality of Chinese steamed bread. Cereal Chem. 2017, 94, 581–587. [Google Scholar] [CrossRef]
  30. Schmiele, M.; Jackel, L.Z.; Patricio, S.M.C.; Steel, C.J.; Chang, Y.K. Rheological properties of wheat flour and quality characteristics of pan bread as modified by partial additions of wheat bran or whole grain wheat flour. Int. J. Food Sci. Technol. 2012, 47, 2141–2150. [Google Scholar] [CrossRef]
  31. Sangnak, A.; Noomhorm, A. Chemical, physical and baking properties of dietary fiber prepared from rice straw. Food Res. Int. 2004, 37, 66–74. [Google Scholar] [CrossRef]
  32. Sangnak, A.; Noomhorm, A. Effect of dietary fiber from sugarcane bagasse and sucrose ester on dough and bread properties. LWT Food Sci. Technol. 2004, 37, 697–704. [Google Scholar] [CrossRef]
  33. Wang, J.; Rosell, C.M.; Barber, C. Effect of addition of different fibers on wheat dough performance and bread quality. Food Chem. 2002, 79, 221–226. [Google Scholar] [CrossRef]
  34. Lee, Y.T. Quality characteristics of high-fiber breads added with domestic wheat bran. J. Korean Soc. Agric. Chem. Biotechnol. 2003, 46, 323–328. [Google Scholar]
  35. Boita, E.R.F.; Oro, T.; Bressiani, J.; Santetti, G.S.; Bertolin, T.E.; Gutkoski, L.C. Rheological properties of wheat flour dough and pan bread with wheat bran. J. Cereal Sci. 2016, 71, 177–182. [Google Scholar] [CrossRef]
  36. Jung, D.S.; Lee, E.Z.; Eun, J.B. Quality properties of bread made of wheat flour and black rice flour. Korean J. Food Sci. Technol. 2002, 34, 232–237. [Google Scholar]
  37. Pomeranz, Y.; Shogren, M.D.; Finney, K.F.; Bechtel, D.B. Fiber in breadmaking—Effects on functional properties. Cereal Chem. 1977, 54, 25–41. [Google Scholar]
  38. Wang, W.M.; Klopfenstein, C.F. Effect of twin-screw extrusion on the nutritional quality of wheat, barley, and oats. Cereal Chem. 1993, 70, 712–715. [Google Scholar]
  39. Perez-Jimenez, J.; Diaz-Rubio, M.E.; Mesias, M.; Morales, F.J.; Saura-Calixto, F. Evidence for the formation of maillardized insoluble dietary fiber in bread: A specific kind of dietary fiber in thermally processed food. Food Res. Int. 2014, 55, 391–396. [Google Scholar] [CrossRef] [Green Version]
  40. Borrelli, R.C.; Mennella, C.; Barba, F.; Russo, M.; Russo, G.L.; Krome, K.; Erbersdobler, H.F.; Faist, V.; Fogliano, V. Characterization of colored compounds by enzymatic extraction of bakery products. Food Chem. Toxicol. 2003, 41, 1367–1374. [Google Scholar] [CrossRef]
  41. Li, W.; Pickard, M.D.; Beta, T. Effect of thermal processing on antioxidant properties of purple wheat bran. Food Chem. 2007, 104, 1080–1086. [Google Scholar] [CrossRef]
  42. Abdel-Aal, E.S.M.; Hucl, P. Composition and stability of anthocyanins in blue-grained wheat. J. Agric. Food Chem. 2003, 51, 2174–2180. [Google Scholar] [CrossRef]
  43. Kim, S.J.; Baek, S.Y.; Kim, D.H.; Kim, M.R. Physicochemical properties and antioxidant activities of morning bread added with Enteromorpha prolifera. J. Korean Soc. Food Sci. Nutr. 2019, 48, 1244–1252. [Google Scholar] [CrossRef]
  44. Duval, B.; Shetty, K. The stimulation of phenolics and antioxidant activity in pea (Pisum sativum) elicited by genetically transformed anise root extract. J. Food Biochem. 2001, 25, 361–377. [Google Scholar] [CrossRef]
  45. Sui, X.; Yap, P.Y.; Zhou, W. Anthocyanins during baking: Their degradation kinetics and impacts on color and antioxidant capacity of bread. Food Bioprocess Technol. 2015, 8, 983–994. [Google Scholar] [CrossRef]
  46. Manzocco, L.; Calligaris, S.; Mastrocola, D.; Nicoli, M.C.; Lerici, R.C. Review of non-enzymatic browning and antioxidant capacity in processed foods. Trends Food Sci. Technol. 2001, 11, 340–346. [Google Scholar] [CrossRef]
  47. Lingnert, H. Antioxidative Maillard reaction products III. Application in cookies. J. Food Process Preserv. 1980, 4, 219–243. [Google Scholar] [CrossRef]
  48. Summa, C.T.; Wenzl, M.; Brohee, M.; De La Calle, B.; Anklam, E. Investigation of the correlation of the acrylamide content and the antioxidant activity of model cookies. J. Agric. Food Chem. 2006, 54, 853–859. [Google Scholar] [CrossRef] [PubMed]
  49. Soares, C.M.D.; Alves, R.C.; Oliveira, M.B.P.P. Acrylamide in coffee. In Processing and Impact on Active Components in Food; Elsevier: Amsterdam, The Netherlands, 2015; pp. 575–582. [Google Scholar]
  50. Jo, Y.; Chun, A.; Sim, E.Y.; Park, H.Y.; Kwak, J.E.; Kim, M.J.; Lee, C.K. Effect of kneading and fermentation conditions on the quality of gluten-free rice bread. Korean J. Food Sci. Technol. 2020, 52, 510–515. [Google Scholar]
  51. Kim, J.K.; Kim, Y.H.; Oh, J.C.; Yu, H.H. Optimization of White Pan Bread Preparation via Addition of Purple Barley Flour and Olive Oil by Response Surface Methodology. J. Korean Soc. Food Sci. Nutr. 2012, 41, 1813–1822. [Google Scholar] [CrossRef]
  52. Tebben, L.; Shen, Y.; Li, Y. Improvers and functional ingredients in whole wheat bread: A review of their effects on dough properties and bread quality. Trends Food Sci. Technol. 2018, 81, 10–24. [Google Scholar] [CrossRef]
Figure 1. Mixograms of the flour–bran blends with different ratios: (A) F100/B0; (B) F90/B10; (C) F80/B20; (D) F70/B30.
Applsci 11 04034 g001
Figure 2. Side view and cross-sections of the breads formulated with the flour–bran blends at different ratios: (A) F100/B0; (B) F90/B10; (C) F80/B20; (D) F70/B30.
Applsci 11 04034 g002
Figure 3. Total phenolic and total anthocyanin contents of the crumb and crust of the bread formulated with the flour–bran blends at different ratios. Bars represent the mean values, and the error bars denote the standard deviation from triplicate measurements. The same letters above the bars are not significantly different (p < 0.05) according to Tukey’s HSD test.
Applsci 11 04034 g003
Figure 4. DPPH and ABTS radical scavenging activities of the crumb and crust of the bread formulated with the flour–bran blends at different ratios. Bars represent the mean values, and the error bars denote the standard deviation from triplicate measurements. The same letters above the bars are not significantly different (p < 0.05) according to Tukey’s HSD test.
Applsci 11 04034 g004
Figure 5. Cross-sections of bread prepared with flour–bran blend at 30% bran at different water amounts, mixing times and fermentation times based on response surface methodology: samples are indicated in terms of “water-mixing time–fermentation time”.
Applsci 11 04034 g005
Figure 6. Three-dimensional plots on the three representative quality characteristics of bread affected by significant factors of the formula and processing conditions in the preparation of bread with flour–bran blend at 30% bran.
Applsci 11 04034 g006
Table 1. Experimental design in formula and processing conditions for the preparation of bread with flour–bran blend at 30% bran.
Standard OrderRun OrderWater (g)Mixing Time (min)Fermentation Time
(min)
14552.0050
28752.0050
315555.0050
416755.0050
53552.0090
65752.0090
714555.0090
87755.0090
913503.5070
106803.5070
1117651.2570
1211655.7570
1312653.5040
1410653.50100
152653.5070
161653.5070
179653.5070
Table 2. Moisture and ash contents, and SRC values of the flour–bran blends at different ratios.
MoistureAshSRC (%)
(%)(%)WaterSodium Carbonate
F100/B012.1 ± 0.0 a (1)0.48 ± 0.00 a65.2 ± 0.6 a88.4 ± 0.0 a
F90/B1012.4 ± 0.1 b0.81 ± 0.00 b70.5 ± 0.3 b92.1 ± 0.4 b
F80/B2012.7 ± 0.0 c1.14 ± 0.01 c76.3 ± 0.6 c97.8 ± 0.5 c
F70/B3012.9 ± 0.0 d1.46 ± 0.01 d81.7 ± 0.3 d102.5 ± 0.1 d
(1) Results are expressed as mean ± SD. Values with the same letter within the same column are not significantly different (p < 0.05) according to Tukey’s HSD test.
Table 3. Height and color of bread made from the flour–bran blends at different ratios.
Flour–Bran BlendBread Ht
(mm)
Color
L*a*b*
F100/B077.274.1 ± 0.5 d (1)1.1 ± 0.0 a14.9 ± 0.4 b
F90/B1065.463.4 ± 0.6 c3.8 ± 0.6 b13.4 ± 0.9 a
F80/B2060.755.1 ± 0.7 b5.2 ± 0.4 c12.1 ± 0.7 a
F70/B3053.750.8 ± 0.2 a6.9 ± 0.3 d13.3 ± 0.5 a
(1) Results are expressed as mean ± SD. Values with the same letter within the same column are not significantly different (p < 0.05) according to Tukey’s HSD test.
Table 4. Quality characteristics of bread prepared with flour–bran blend based on RSM.
Std OrderMoisture
Content
(%)
Crumb ColorHeight
(mm)
Volume
(mL)
Firmness
(N)
L*a*b*
139.354.16.213.055.139427.7
244.847.16.111.654.741318.7
339.656.16.313.356.341230.0
445.150.55.811.960.547412.6
539.653.16.212.655.139924.1
645.747.46.412.345.439527.3
739.653.46.613.552.038130.0
845.448.95.811.857.749711.4
937.656.66.313.558.038127.9
1046.048.56.112.252.642117.5
1142.748.96.212.249.437827.6
1242.250.96.513.054.043616.7
1342.456.75.712.460.542616.7
1442.751.56.212.759.647716.7
1542.651.55.912.165.352310.7
1642.552.75.812.164.951010.5
1742.751.35.911.965.55138.6
Table 5. Fitted model and significant factor identified based on p-values for the three representative quality characteristics of bread prepared with flour–bran blend at 30% bran.
ResponseFactor (1)p-ValueModel
Bread heightWater0.3747Quadratic
MT0.0360
FT0.0844
Bread volumeWater0.0281Quadratic
MT0.0287
FT0.5639
Bread firmnessWater0.0030Quadratic
MT0.0148
FT0.3919
(1) MT: mixing time; FT: fermentation time.
Table 6. Analysis of variance of the quadratic models for height, volume, and firmness of bread prepared with flour–bran blend.
ResponseSourceDFSum of SquaresMean SquareF ValueR2
Bread heightModel9450.9350.108.00 **0.911
Residual743.826.26
Total16494.75
Bread volumeModel936,822.124091.356.17 *0.888
Residual74642.61663.23
Total1641,464.73
Bread firmnessModel9758.6584.298.03 **0.912
Residual773.5210.50
Total16832.17
*, ** indicated significance at p < 0.05 and 0.01, respectively.
Table 7. Predicted and experimental values of response at optimized conditions.
Optimum Condition
Water (g)68.168.1
Mixing time (min)4.04.0
Fermentation time (min)67.367.3
ResponsePredicted valueExperimental value
Bread height (mm)64.664.7 ± 1.5
Bread volume (mL)513.2530.5 ± 9.0
Bread firmness (N)8.88.2 ± 0.5
Publisher’s Note: MDPI stays neutral with regard to jurisdictional claims in published maps and institutional affiliations.

