Abstract
High processing speeds enormously enlarge the number of possible fields of application for laser processes. For example, material removal for sheet cutting using multiple passes or precise mass corrections can be achieved by means of spatter formation. For a better understanding of spatter formation at processing speeds of several hundred meters per minute, characterizations of the processing zone are required. For this purpose, a 400 W single-mode fiber laser was used in this study to process stainless steel AISI 304 (1.4301/X5CrNi18-10) with speeds of up to 600 m/min. A setup was developed that enabled a lateral high-speed observation of the processing zone by means of a glass plate flanking. This approach allowed for the measurement of several dimensions, such as the penetration depth, spatter formation, and especially, the inclination angle of the absorption front. It was shown that the loss of mass started to significantly increase when the absorption front was inclined at about 60°. In combination with precise weighings, metallographic examinations, and further external process observations, these findings provided an illustration of four empirical process models for different processing speeds.
1. Introduction
The development of remote technology enables very high processing speeds in laser material processing, which leads to an enormously enlarged field of applications. Depending on the processing speed, applications ranging from welding to cutting are possible.
For example, gas-free sheet cutting [1] or highly precise mass corrections of metallic compounds for balancing processes can be realized via the use of cw-mode laser radiation in combination with high processing speeds. Compared to pulse-mode ablation methods [2], the cycle time can be shortened due to higher removal rates. As such, the removal mechanism is primarily based on melt pool ejections (spatters) when the process is combined with high feed rates. This approach is already applied for cutting thin sheet metal without an additional cutting gas supply [1,3]. The effect of spatter formation occurs in deep penetration laser welding if a local volume of melt is exposed to a certain amount of momentum perpendicular to the melt surface to extract the melt pool [4]. For this purpose, an equation is known from the literature, which specifies the condition for spatter detachment (see Equation (1) [5]):
Following this relation, the extraction of a single spatter requires the kinetic energy of the fluid element to be greater than the sum of the kinetic energy of the droplet and the surface energy of the melt. The given equation is a function of the density of the melt ρ, the droplet volume Vdr, the velocity of the fluid vfl, the velocity of the droplet vdr, the surface tension σ, and the droplet surface area Odr. These parameters are determined by the material and process characteristics, whereby some factors can be influenced significantly. The velocity of the melt flow depends strongly on welding speed but is significantly higher than the welding speed itself, as shown in [6]. This effect can be explained by the pressure that is exerted on the melt by the vaporized material of the keyhole front wall [4,7]. Therefore, it is a common approach to scale up the processing speed if a certain loss of mass [8] or a resulting cut kerf is to be achieved [9] by means of spatter formation.
However, the application of processing speeds of several meters per second leads to changes in the characteristic keyhole model. Characterizations of the keyhole in deep penetration laser welding have already been made in many studies. In [10], for example, high-speed X-ray imaging was used up to welding speeds of 7 m/min to determine the inclination of the keyhole front, among other values. Another method that is used to perform process observations in deep penetration laser welding with welding speeds up to 10 m/min is shown in [11] for coated steel. Here, a glass plate was fixed tightly to the metal sheets, while the laser spot was placed with two-thirds of its diameter on the sample and one-third on the glass plate. This setup allowed for a lateral view inside the resulting keyhole when the laser focus was moved along the edge of the sample. Several studies have shown that a huge enlargement of the keyhole in the feed direction occurs already at welding speeds of 20 m/min due to the increased inclination of the keyhole front wall. As such, the changed reflection conditions of the laser beam at the keyhole front wall lead to significant reductions in the penetration depth [12]. Further increases in welding speed up to 50 m/min led to the formation of an “absorbing front,” where most of the interaction with the incident laser must take place [13]. In [14], these assumed shapes of the keyhole could be confirmed using trials with welding speeds up to 70 m/min by means of high-speed X-ray radiography. Correspondingly, in different studies on remote laser cutting, a significant change in the welding regime occurs when it comes to processing speeds of about 200 m/min [1]. Up to this velocity, deep penetration welds with single spatter detachments of the melt are produced. Further increased welding speeds lead to significantly reduced penetration depths and less remaining melt that comes along with the formation of cut kerfs [1,3]. In [9], it was assumed that for processing speeds of about 840 m/min, the recoil pressure of the evaporated material at the absorption front accelerates the melt up the sidewalls and along the bottom of the resulting kerf to leave the processing zone. Here, the inclination angle of the front wall was determined via 3D measurements of the solidified end crater by laser scanning microscopy after switching off the laser power during the process. However, using this method, the real geometry of the absorption front can only be represented to a limited degree, due to the subsequent reflux of the molten material after the switch-off. In [3], investigations were carried out for processing speeds of up to 2700 m/min by means of a polygon scanner. Here, it becomes apparent that the inclination angle of the absorption front can be calculated using the ratio of spot size and ablation depth.
It can be seen that the characterization and determination of the certain dimensions of the process zone in laser beam welding were examined for different processing speeds by means of various methods. However, detailed investigations of processing speeds up to 600 m/min are not yet available in the state of the art.
In this study, investigations regarding the formation of the absorption front and the processing zone in laser processing with speeds from 1 m/s (60 m/min) to 10 m/s (600 m/min) were carried out. Besides the determination of the loss of mass, investigations on cross-sections and high-speed recordings were carried out. In addition, a camera setup was developed that enabled the processing zone to be observed through a glass plate. This approach provided characterizations regarding the keyhole and absorbing front using high-speed records at high processing speeds and small focal diameters. These aspects provided a detailed characterization of the processing zone and led to a better understanding of the resulting material removal mechanism in high-speed laser processing. Furthermore, a deeper insight into spatter formation and the behavior of the absorption front regarding the scanning speed was achieved.
2. Materials and Methods
The experiments were carried out as bead-on-plate welds with stainless austenitic steel sheets (AISI 304, X5CrNi18-10). The essential chemical composition of the steel is given below in Table 1.

Table 1.
Chemical composition of stainless steel 1.4301 in mass% (according to DIN EN 10088-3 [15]).
In order to implement the relative motion between the workpiece and the laser beam, a 400 W single-mode fiber laser (TruFiber 400, Trumpf Laser GmbH, Ditzingen, Germany) was equipped with a 2D galvanometric scanning system with an f-Tetha lens (PFO 20, Trumpf Laser GmbH, Ditzingen, Germany). The technical data of the laser and scanning system are listed in Table 2. The focal position was chosen based on the maximum resulting penetration depth in cross-sections of bead-on-plate welds. The laser power was set to the maximum of 380 W for all experiments, while the laser was operated in cw-mode.

Table 2.
Technical data of the laser and scanning system.
A 5 mm thick borosilicate glass plate was attached to the steel sheets for the trials, as depicted schematically in the experimental setup in Figure 1. Borosilicate glass was used in this setup because of its high thermal shock resistance and low thermal expansion. The samples were cut to size using wire-cut EDM to achieve high-quality cut edges. This realized a minimum gap between the glass plate and the sheets along the edge during clamping. Due to the small focal diameter of 16.5 microns, the challenge here was to place the laser focus on the edge of the sample with its complete diameter. Even the slightest lateral displacements in both y directions lead to unusable results. The authors henceforth refer to this setup as the half-section setup.
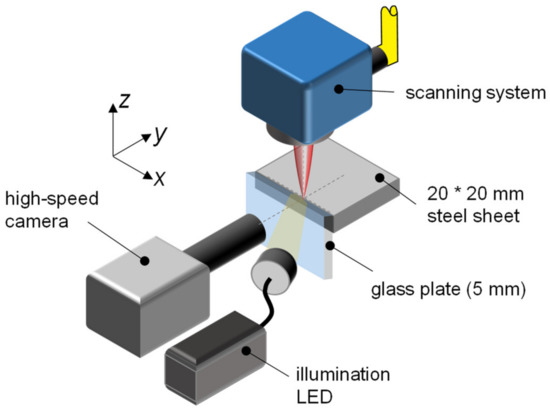
Figure 1.
Schematic depiction of the experimental setup for high-speed recordings in the half-section setup.
For a side view, the high-speed camera (Fastcam SA-X2, Photron Deutschland GmbH, Reutlingen, Germany) was positioned perpendicular to the x-z plane with a distance of about 100 mm. A Navitar 12× zoom lens was used to achieve sufficient magnification for the measurements of several dimensions, even in small processing zones. A high-power LED system with a wavelength of 630 nm in combination with a narrow band-pass filter in the optical path of the camera was used to illuminate the processing zone. This setup allowed for the inclination angle of the absorption front to be determined, in addition to the penetration depth. The high-speed records in this work were captured at a framerate of 150,000 fps. Another two camera setups were applied in this study to capture further information about the processing zone. Their setups are described in detail in the respective results sections.
The loss of mass of the samples was determined via weighings before and after the laser process with a precision balance (ME 235S, Sartorius AG, Goettingen, Germany). Because of the high resolution of the balance (0.01 mg), the samples received a two-step cleaning procedure with acetone and isopropyl alcohol in an ultrasonic bath prior to each weighing.
The sample number n is given in each diagram. As such, the error bars show the corresponding standard deviation of the sample. Furthermore, for a concise presentation of the results, the processing speeds in this work are henceforth given in meters per second.
3. Results
3.1. Reference Process
Since processing speeds from 1 to 10 m/s were considered and the energy, mass, and momentum transfer between the keyhole/absorbing front and molten material changed significantly in the addressed range, the loss of mass with the associated metallographic cross-sections was examined at the beginning. In order to clarify the difference in the resulting loss of mass for the applied processing speeds and reduce the effect of measurement errors due to the weighing, the loss of mass was scaled up by processing complete areas. For this purpose, 300 single lines with a spacing of 100 µm were performed within a constant area of 20 × 20 mm2 in the middle of the sample. For statistical validation, three samples were processed for every applied processing speed. The samples were cleaned and weighed after the trials. The resulting loss of mass for the different processing speeds can be seen in Figure 2. In addition, characteristic metallographic cross-sections of the individual process tracks are shown for selected processing speeds, which represent the significant changes in the processing result.
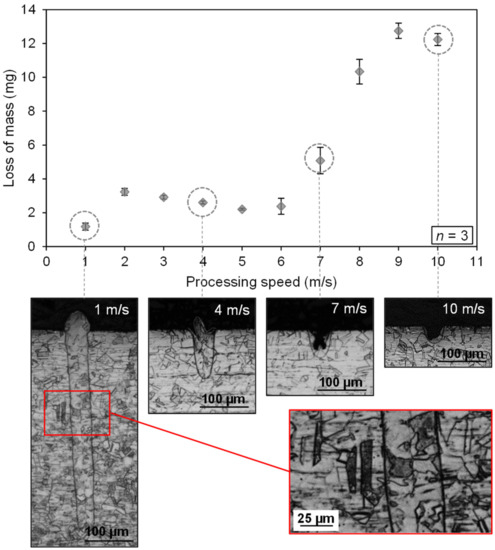
Figure 2.
Resultant loss of mass with corresponding cross-sections.
It became apparent that the loss of mass increased with the application of a higher processing speed. The lowest loss of mass was measured with about 1.2 mg for 1 m/s. At a processing speed of 10 m/s, a mass of 12.2 mg was lost, which equaled an increase by a factor of 10. However, a plateau between 1 and 6 m/s was visible. At speeds above 6 m/s, there was a massive increase in the loss of mass up to 9 m/s. From 9 to 10 m/s, there was a slight decrease in the mean value visible. This might have been due to the decreased amount of deposited energy, which came along with the higher scanning speed. However, a significant difference was not found due to the overlapping standard deviation.
The cross-sections from Figure 2 gave a first explanation of the resulting loss of mass. In addition to very substantial reductions in the penetration depth with increased speeds, it became apparent that humps occurred for the low processing speeds, while the formation of kerfs became visible for processing speeds of 7 m/s and beyond. Small layers of solidified melt remained at the sidewalls and the bottom of the kerfs for the higher processing speeds, while there was even less remaining melt visible for a 10 m/s processing speed. The samples were electrolytically etched with oxalic acid, which made the melt lines visible. Regarding the microstructure, no changes were seen at the applied magnification using light microscopy. The microstructure surrounding the melt area seemed to be unaffected in the shown cross-sections. No changes compared to the base material were found next to the melt lines, which can be explained by the high processing speeds and the low amount of dissipated heat [16].
The cross-sectional areas of the weld seams were measured to study these geometric changes in more depth. This allowed for the melt volume to be calculated via multiplication with the total length of the seams that were created during the areal processing. Only the melted area below the surface was considered for this purpose to exclude the influence of humps or solidified melt on the sheet’s surface. The results for different processing speeds can be taken from Figure 3a. It can be seen that the melt volume decreased significantly with increased processing speed. In the same diagram, the calculated loss volume is shown by means of the second axis. The volume of the loss material was determined using the measured loss of mass and the density of AISI 304 (7.9 g/mm3 [17]).
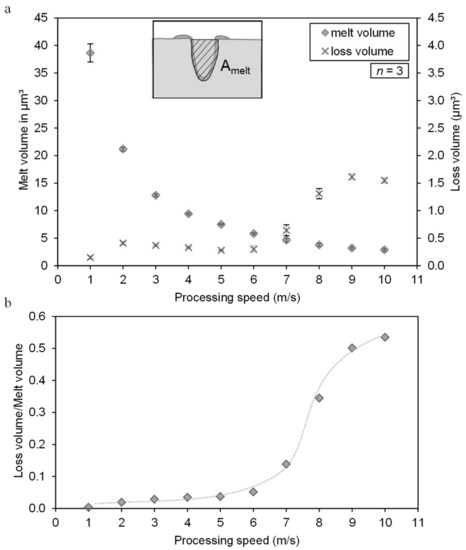
Figure 3.
(a) Melt volume and calculated loss volume; (b) ratio of loss volume to melt volume.
The ratio of loss volume to melt volume is given in Figure 3b. It can be shown that the proportion of loss volume became larger with increasing processing speed, rising to a value of 0.53 for 10 m/s. At lower speeds up to 5 m/s, the fraction of volume that became lost during the process seemed rather negligible, with values below 4% of the melt volume. For the lower processing speeds, it can be assumed that the loss of volume was based more on evaporation, while the melt ejections represent the main removal mechanism at higher speeds regarding the cross-sections in Figure 2.
3.2. Characterization by Means of the Half-Section Setup
In order to gain more information about the dimensions and several effects of the process zone, the half-section setup was developed in accordance with the work of [11], which allowed for a lateral view into the process. Snapshots from the footage at different times of high-speed records at 1 m/s can be seen in Figure 4. The approximate position of the incident laser beam is marked with a red arrow in each frame. An exact indication of the laser beam position was difficult due to the small focal diameter of 16.5 µm. The snapshot shows the appearance of an almost vertically orientated keyhole. The absorption front here seemed to be inclined slightly against the scanning direction. This effect can be attributed to a slight deviation in the positioning of the laser focus in the y-direction. The area right next to the focal position still appeared in the solid phase for this record. For this reason, the absorption front was outlined (white dotted line) by connecting the assumed focal position on the sheet surface with the visible ground of the resulting keyhole in Figure 4. As such, the focal position could be determined in the videos from a light reflection on the sheet’s surface. Furthermore, the melt flow, as well as the melt pool, could be observed by means of the applied setup. In addition, the area of solidification became visible, which was marked out at 13.2 µs by means of the white dotted solidification line.
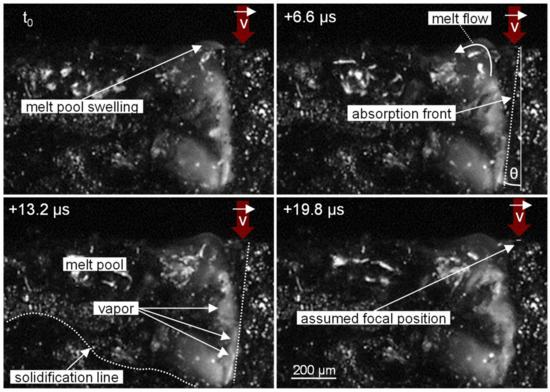
Figure 4.
Snapshots from the footage of the high-speed records in half-section setup at a processing speed of 1 m/s.
In order to verify the transferability of the results from the half-section setup, in the next step, the resultant penetration depth and seam width were compared to the measurements from the metallographic cross-sections. This enabled the direct depiction of the differences that were caused by the half-section setup due to changed thermal conditions. The results and an example for the determination of both penetration depths for a processing speed of 2 m/s are given in Figure 5. The penetration depths were measured at three different times in each of the three records and correspondingly in the cross-sections for nine single seams to calculate the mean values and standard deviations.
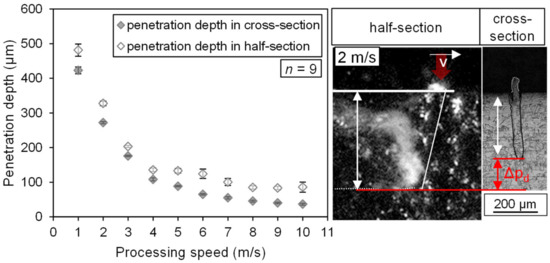
Figure 5.
Resultant penetration depths in the cross-sections and half-section setup.
It can be seen that the penetration depths in the cross-section were always lower than the values for the depth in the half-section, while the difference between the results from the 1 m/s and 2 m/s processing speeds was significantly higher than for the higher speeds. This was due to the larger heat accumulation, which occurred at the edge of the sample. The glass plate had a much lower thermal conductivity compared to AISI 304, which led to a larger amount of deposited heat.
The determination of the values for the resulting seam width was carried out correspondingly to the ones for the penetration depth. For the measurement of the seam width in the half-section setup, the resulting seams were pictured in a top view by means of a microscope. The results for the measured widths can be seen in Figure 6. Regarding values for the cross-sections, it became obvious that the processing speed had no influence on the resulting seam width. Instead of a clear trend, there was a plateau for the complete range of applied processing speeds. For the measured seam widths created using the half-section setup, there was only a significant increase at 1 m/s and 2 m/s compared to the ones visible from the cross-section. This might have been due to the already mentioned amount of deposited heat, which was accordingly higher for the lower processing speeds. Furthermore, the standard deviation of the entire data series for the seam width in the half-section setup was significantly higher, which can be explained by small inaccuracies in the specimen-to-glass positioning that occurred during the process because of thermal expansion of the sample. This could lead to the formation of a small gap between the glass and the sample, which was filled with melt during the process.
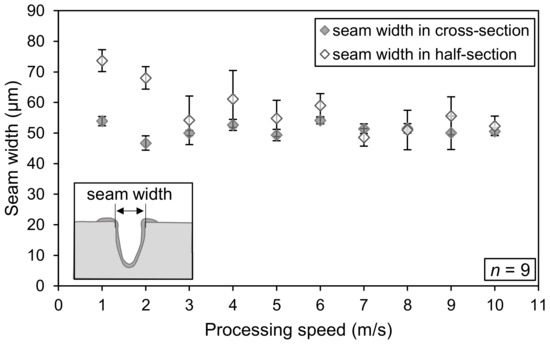
Figure 6.
Resultant seam widths in the cross-section and half-section setups.
Considering the differences shown between the resultant penetration depth and seam width, it can be stated that there was a slight influence from the half-section setup. However, the underlying characteristics of the curves are comparable; therefore, the half-section setup can be considered for valid investigations.
The lateral process observation also enabled the determination of the inclination angle of the absorption front, as is already shown in Figure 4. A qualitative comparison of the resultant inclination of the absorption front is given for selected processing speeds in Figure 7. White dotted lines mark the absorption front and the penetration depth in order to support better recognition.
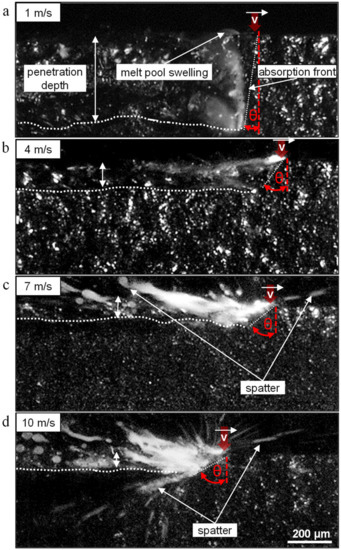
Figure 7.
Comparison of inclination angle of the absorption front for different processing speeds: (a) 1 m/s, (b) 4 m/s, (c) 7 m/s, and (d) 10 m/s.
Figure 7a shows the smallest measured inclination angle of about 14°, which was found with a processing speed of 1 m/s. Right behind the interaction area of the laser beam, a huge melt pool swelling formed by the up-flowing melt occurred. This aspect showed the presence of a keyhole at this processing speed. When the processing speed was increased, this melt pool swelling became smaller and the distance to the interaction zone with the incident laser beam simultaneously increased. Already at 4 m/s (see Figure 7b), no melt pool swelling was visible in the captured section. There was also a massive decrease in penetration depth, which came along with a significant increase in the inclination angle. A further increase in the processing speed to, for example, 7 m/s (see Figure 7c) led to the formation of spatter. It became apparent that major parts of the melt pool were ejected from the processing zone away from the scanning direction of the laser beam. Only a few spatters remained in the front. A further increase in the processing speed to 10 m/s (see Figure 7d) led to even bigger inclination angles of about 70°, a lower penetration depth, and the formation of smaller spatters. Because of the extended formation of trajectories, the smaller spatters seemed to have a higher velocity and left the processing zone in more directions compared to those shown in Figure 7c.
For statistically validated values, three measurements of the inclination angle were made using each of the three videos. The results are depicted in Figure 8a, where a clear, approximately linear relationship between the resulting inclination angle and the processing speed can be seen. It is also noticeable that the inclination angle of the absorption front varied for every processing speed within a relatively small range. A linear relationship between the resulting inclination angle and processing speed was already determined by [18], where focal diameters of 200 to 600 µm and processing speeds in the range of 0.016 to 0.16 m/s were applied.
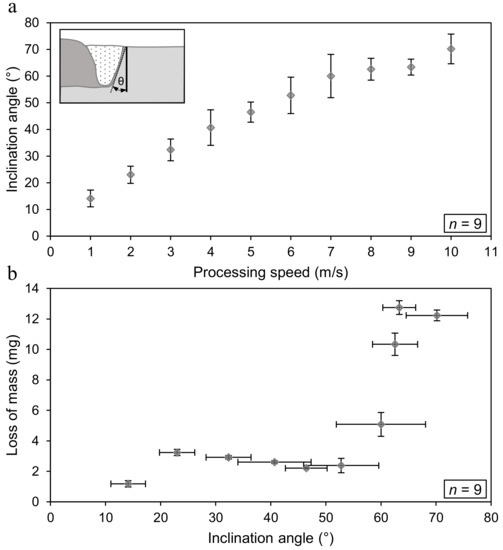
Figure 8.
(a) Resultant inclination angle of the absorption front for different processing speeds; (b) resultant loss of mass and corresponding inclination angle of the absorption front.
The resulting inclination angles were correlated with the resulting loss of mass from the removal trials afterward. The results are shown in Figure 8b. It became obvious that a significant rise in the loss of mass was found with an inclination angle of 60°. Further increases in the inclination angle also led to a significant increase in the loss of mass. However, between the resultant inclination angles of 20° and 50°, the loss of mass was almost the same. At this point, it became evident that there was a causal relationship between the resultant loss of mass and the inclination angle of the absorption front.
3.3. Further Process Observations
Up to this point, the penetration depth and inclination angle of the absorption front could be determined via process observations. In order to get more information about the area trailing the absorption front, a further experimental setup was developed, which allowed for gathering high-speed records from above with a 45° inclination angle of the camera (see Figure 9c). This perspective allowed for the determination of the keyhole length or even the length of the melt-free zone, which was found for higher processing speeds. For the trials, the seams were aligned parallel to the edge of the sample with a distance of 5 mm.
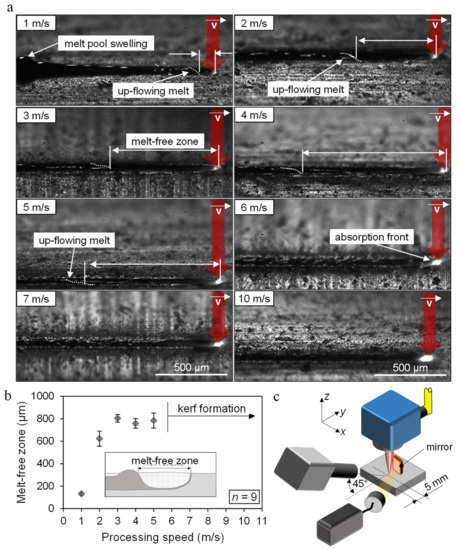
Figure 9.
(a) Snapshots of high-speed records; (b) length of the melt-free zone for different processing speeds; (c) camera setup for records from above at an angle of 45°.
A comparison of single captured frames for different processing speeds is given in Figure 9a. Similar to the records done in the half-section setup, an up-flowing melt was visible right behind the absorption front at 1 m/s. Based on this, it can be assumed that at this processing speed, a keyhole was apparent, as described for deep penetration laser welding in several studies [19]. On the left-hand side of the described frame, huge melt pool swelling was visible. The formation of these melt pool swellings is described as the humping effect in the literature [20]. As the processing speed increased, this up-flowing melt appeared at a growing distance from the absorption front, as can be seen for 2 m/s, 3 m/s, 4 m/s, and 5 m/s. These images demonstrate how the process zone changed at higher processing speeds such that instead of describing a keyhole, it is now referred to as an absorption front [13].
In order to quantify these observations, the length of the melt-free zone behind the absorption front was determined. For this purpose, the distance between the interaction zone of the laser beam and the point where the up-flowing melt reached the level of the sample surface was measured. The results can be seen in Figure 9b. It can be observed that the measured length for 2 m/s was longer than the measured length for 1 m/s by a factor of four. This huge difference led to the assumption that already at 2 m/s, no keyhole was surrounded by a circular melt flow. Beyond processing speeds of 5 m/s, it was not possible to measure this melt-free area. The formation of kerfs was visible beyond processing speeds of 5 m/s instead. The melt must be accelerated out of the processing zone as it was also visible for the higher processing speeds in the half-section setup.
In order to clarify the formation of the melt ejections more precisely, another experimental setup was developed, which can be seen in Figure 10. The camera position was quite similar to that found in the half-section setup. The difference here was the focal position and the illumination mode. In this setup, the light of the high-power LED was reflected directly into the optical path of the camera by means of a mirror. This allowed for producing records in a transmitted light method, whereby objects in the focal plane of the camera were displayed dark with a very lit-up background. The position of the laser focus on the sheet was made similar to the previously described camera setup.
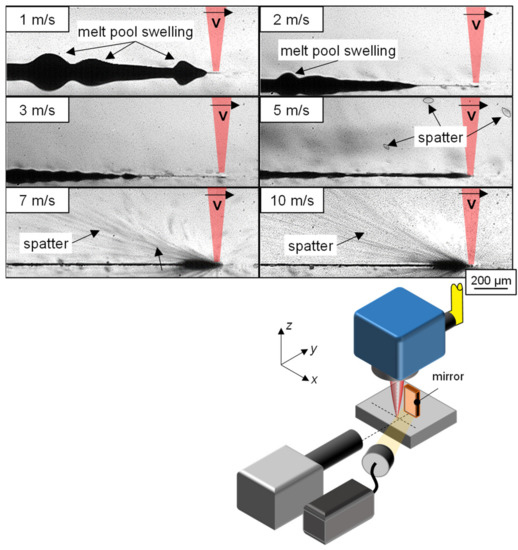
Figure 10.
Snapshots of high-speed records using the transmitted light method (top) and a schematic depiction of camera setup (bottom).
A comparison of some of the captured images is given for different processing speeds in Figure 10. The frames made at 1 and 2 m/s again show the formation of huge melt pool swellings behind the interaction zone. This humping effect did not immediately appear for processing speeds beyond 2 m/s. They became smaller with increased speeds and could not be captured in the section shown. At 5 m/s, the formation of spatters at the absorption front was observed. Most of them left in or lateral to the scanning direction with velocities that were comparable to the processing speed. The melt layer, which was leading the absorption front, seemed to be the area of extraction for this kind of spatter occurring at 5 m/s. At 7 m/s, much more and significant finer spatters were detected, which preferentially left the process zone against the scanning direction. The change in spatter detachment showed that the melt flow around the absorption front was significantly affected by the processing speed. A further increase in speed up to 10 m/s resulted in even finer spatters, which left with higher velocities in the same orientation as for 7 m/s. The high velocity of the spatters was demonstrated by the formation of trajectories instead of clearly visible single spatters. The light mode of the high-power LED illumination here led to motion blur effects.
4. Process Models and Discussion
When all the preceding aspects, findings, and measurements of this study are taken into account, a schematic process model can be developed. For this purpose, Figure 11 illustrates two-dimensional empirical process models for selected processing speeds in the range from 1 to 10 m/s. Theoretical considerations regarding the reflection of the incident laser beam were demonstrated by means of drawn-in red lines.
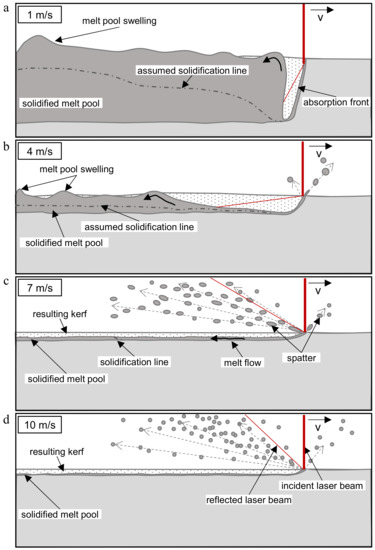
Figure 11.
Empirical process models for (a) 1 m/s, (b) 4 m/s, (c) 7 m/s, and (d) 10 m/s.
Figure 11a shows that an almost vertically orientated keyhole was generated, which was surrounded by molten material. Considering the penetration depth from the cross-sections of about 420 µm and the length of the 0melt-free zone of about 131 µm, the aspect ratio of the depicted keyhole was about 3.2. When the inclination angle from Section 3.2 is taken into account, the reflection of the incident laser beam can be assumed, as shown in Figure 10. In the case of the process model shown for 1 m/s, the incident laser beam was reflected toward the rear wall of the keyhole, which led to further multiple reflections and increased absorption of the incident laser energy. This effect resulted in significantly higher penetration depths compared to higher processing speeds.
At processing speeds of 4 m/s (see Figure 11b), the absorption front was inclined by about 40° such that the incident laser beam was reflected nearly horizontally toward the up-flowing melt. If a second reflection would be considered, it might guide the laser beam upward, out of the processing zone, without further reflections and absorptions of the laser energy. The resultant melt flow at this speed still led to the formation of several melt pool swellings, as already observed for the lower processing speeds. At a processing speed of 4 m/s, the formation of spatters can also be seen at the absorption front. The spatters seemed to leave from the thin layer of melt running in front of the absorption front.
When it came to processing speeds of about 7 m/s (see Figure 11c), the absorption front was even more inclined such that the incident laser beam was reflected directly upward, out of the processing zone. At the same time, it can be seen that the amount of spatter grew. For this reason, it can be assumed that a transfer of momentum on the trailing melt pool through the reflected laser beam did not necessarily increase the loss of mass. The resulting velocity of the melt flow at these speeds could explain this effect. It provided the kinetic energy of the melt such that it was sufficiently high to fulfill the detachment condition described in Equation (1). As a result, the flow velocity of the melt was much greater than the processing speed itself. It can be assumed, that the melt volume and, consequently, the melt layer leading the absorption front decreased with increased scanning speed, which was why the velocity of the melt flow increased due to the law of continuity. This approach was also followed in an inverted manner in [21] by means of an enlargement of the upper melt pool in order to reduce spatter formation. The preferred direction of the spatter detachment here was orientated against the scanning direction. Only a small amount of spatter left the absorption front laterally or frontward. Furthermore, it can be seen that no melt pool swelling resulted from the backward-oriented melt flow. Instead, it led to the formation of a solidified melt layer on the bottom of the resulting kerf, as already shown in the cross-sections in Figure 2. The generation of kerfs instead of seams was already shown in [1] for scanning speeds beyond 5 m/s for a focal diameter of 25 µm and a laser power of 1 kW. In [22], the kerf generation was already determined at scanning speeds of 4.2 m/s for the same focal diameter and laser power of 3 kW. This shows that the kerf generation and, consequently, the spatter formation also depended on the size of the melt pool, as well as the applied processing speeds.
At the maximum processing speed of 10 m/s, the most obvious difference to the just-described process was the resultant size and velocity of the spatter (see Figure 11d). The inclination angle of the absorption front was only slightly higher, at about 70°, such that in this case, the incident laser beam was also reflected upward. The penetration depth was only slightly reduced, while the thickness of the remaining layer of solidified melt on the bottom was reduced at the same time. It also became visible that there was less remaining melt at the kerf walls for 10 m/s compared to 7 m/s. An explanation could be that the higher velocity of the melt flow overcame a certain threshold to leave the kerf at the top of the previously formed kerf. A potential explanation for the finer spatter could given in terms of a theoretical consideration of the breakup condition of liquid jets. Liquids become vaporized if the jet velocity reaches a certain threshold. As such, the resulting droplets are much smaller than the original jet diameter [23].
The investigations, especially the illustrated empirical process models, provide further knowledge and give a better overview of the different resultant process regimes. Nevertheless, further examinations are needed regarding the solidification at higher processing speeds or the spatter detachment, which has not been completed yet. Clarifying the solidification conditions of the melt pool using computational fluid dynamic simulations could provide a better understanding of the humping effect. Additionally, the effect of enlarged spot sizes on kerf generation and, consequently, spatter formation, will be the subject of further investigations.
5. Conclusions
In this study, the processing zone in high-speed laser processing of stainless steel AISI 304 with speeds from 1 m/s up to 10 m/s was examined. The effects on the process zone due to the processing speed while using a half-section setup were described with the aid of external process observations. It was shown that a keyhole only formed at a processing speed of 1 m/s. Already at 2 m/s, the processing zone could instead be described as a leading absorption front with a trailing melt-free zone. Increases of the processing speed beyond 6 m/s led to an enhanced spatter formation. Finally, four empirical process model conditions were illustrated based on the measured and observed aspects. Considering these results, for the process and material parameters applied in this work, the following conclusions were drawn:
- The resultant loss of mass clarified the different process regimes that dominated in the range of processing speeds from 1 to 10 m/s. There was an increase by a factor of more than 10 for the resultant loss of mass at 10 m/s compared to that found at 1 m/s. It could be observed that the loss of mass started to increase significantly at processing speeds of 7 m/s. Examinations on metallographic cross-sections showed differences in the amount of remaining melt at the walls and bottom of the resulting kerfs for high processing speeds.
- The resulting inclination angle increased nearly linear with the increased processing speed. Under the applied process parameters, an angle of about 14° was produced at 1 m/s, while the absorption front was inclined at about 70° for processing speeds of 10 m/s. The correlation with the resulting loss of mass showed significant increases at inclination angles of about 60°.
- At processing speeds between 4 and 6 m/s, the preferred orientation of single spatter detachments was observed to be lateral and frontward relative to the scanning direction, with velocities comparable to the processing speed. The orientation of the spatter detachment occurring at processing speeds beyond 7 m/s was characterized as being primarily against the scanning direction. At the same time, a much higher amount of finer spatter was observed to occur at a processing speed of 7 m/s, when the absorption front was inclined at about 60°. As such, the formation of long trajectories for a single spatter demonstrated its immense acceleration out of the processing zone.
Author Contributions
Conceptualization: P.H., K.S. and J.P.B.; methodology: P.H. and K.S.; investigation: P.H.; formal analysis: P.H. and K.S.; data curation: P.H.; visualization: P.H.; writing—original draft: P.H.; supervision and discussion: K.S. and J.P.B. All authors have read and agreed to the published version of the manuscript.
Funding
This research was funded by EUROPEAN UNION FUNDS UNDER THE EUROPEAN REGIONAL DEVELOMPENT FUND (ERDF), grant number 2017 FE 9091.
Institutional Review Board Statement
Not applicable.
Informed Consent Statement
Not applicable.
Data Availability Statement
Not applicable.
Acknowledgments
The precision balance was provided by the Machine Elements Group of the Technische Universität Ilmenau. The support is gratefully acknowledged.
Conflicts of Interest
The authors declare no conflict of interest.
References
- Mahrle, A.; Lütke, M.; Beyer, E. Fibre laser cutting: Beam absorption characteristics and gas-free remote cutting. J. Mech. Eng. Sci. Proc. Inst. Mech. Eng. Part C 2009, 224, 1007–1018. [Google Scholar] [CrossRef]
- Mustafa, H.; Matthews, D.T.A.; Römer, G.R.B.E. Influence of the pulse duration at near-infrared wavelengths on the laser-induced material removal of hot-dipped galvanized steel. J. Laser Appl. 2020, 32, 022015. [Google Scholar] [CrossRef]
- Ullmann, F.; Loeschner, U.; Hartwig, L.; Szczepanski, D.; Schille, J.; Gronau, S.; Knebel, T.; Drechsel, J.; Ebert, R.; Exner, H. High-speed laser ablation cutting of metal. In High-Power Laser Materials Processing: Lasers, Beam Delivery, Diagnostics, and Applications II; International Society for Optics and Photonics: San Francisco, CA, USA, 2013; Volume 8603, p. 860311. [Google Scholar] [CrossRef]
- Kaplan, A.F.H.; Powell, J. Spatter in laser welding. J. Laser Appl. 2011, 23, 032005. [Google Scholar] [CrossRef]
- Hügel, H.; Graf, T. Laser in der Fertigung: Grundlagen der Strahlquellen, Systeme, Fertigungsverfahren; Vieweg+Teubner: Wiesbaden, Germany, 2014; Volume 3. [Google Scholar]
- Beck, M. Modellierung des Laserstrahltiefschweißens; Teubner: Wiesbaden, Germany, 1996. [Google Scholar]
- Rominger, V.; Berger, P.; Hügel, H. Effects of reduced ambient pressure on spattering during the laser beam welding of mild steel. J. Laser Appl. 2019, 31, 042016. [Google Scholar] [CrossRef]
- Hellwig, P.; Schricker, K.; Bergmann, J.P. Effect of reduced ambient pressure and atmospheric composition on material removal mechanisms of steel and aluminum by means of high-speed laser processing. Procedia CIRP 2020, 94, 487–492. [Google Scholar] [CrossRef]
- Musiol, J.D. Remote-Laserstrahl-Abtragschneiden; Herbert Utz Verlag: Munich, Germany, 2015; Volume 307. [Google Scholar]
- Abt, F. Bildbasierte Charakterisierung und Regelung von Laserschweißprozessen; Herbert Utz Verlag: Munich, Germany, 2018; Volume 88. [Google Scholar]
- Tenner, F.; Riegel, D.; Mayer, E.; Schmidt, M. Analytical model of the laser welding of zinc-coated steel sheets by the aid of videography. J. Laser Appl. 2017, 29, 22411. [Google Scholar] [CrossRef]
- Fabbro, R. Melt pool and keyhole behaviour analysis for deep penetration laser welding. J. Phys. D Appl. Phys. 2010, 43. [Google Scholar] [CrossRef]
- Berger, P.; Hügel, H. Fluid Dynamic Effects in Keyhole Welding—An Attempt to Characterize Different Regimes. Phys. Procedia 2013, 41, 216–224. [Google Scholar] [CrossRef]
- Cunningham, R.; Zhao, C.; Parab, N.; Kantzos, C.; Pauza, J.; Fezzaa, K.; Sun, T.; Rollett, A.D. Keyhole threshold and morphology in laser melting revealed by ultrahigh-speed X-ray imaging. Science 2019, 363, 849–852. [Google Scholar] [CrossRef] [PubMed]
- DIN EN 10088-3 Stainless Steels—Part 3: Technical Delivery Conditions for Semi-Finished Products, Bars, Rods, Wire, Sections, and Bright Products of Corrosion Resisting Steels for General Purposes; German Version; Beuth Verlag GmbH: Berlin, Germany, 2014.
- Benyounis, K.; Olabi, A.; Hashmi, M. Effect of laser welding parameters on the heat input and weld-bead profile. J. Mater. Process. Technol. 2005, 164–165, 978–985. [Google Scholar] [CrossRef]
- Material Datasheet 1.4301. Available online: https://www.stauberstahl.com/werkstoffe/14301-werkstoff-datenblatt/ (accessed on 12 March 2021).
- Weberpals, J.-P. Nutzen und Grenzen Guter Fokussierbarkeit beim Laserschweißen; Herbert Utz Verlag: Munich, Germany, 2010. [Google Scholar]
- Jarwitz, M.; Lind, J.; Weber, R.; Graf, T.; Speker, N.; Haug, P. Investigation of the influence of superimposed intensity distributions on the spatter behavior in laser welding of steel using online X-ray diagnostics. In Proceedings of the International Congress on Applications of Lasers & Electro-Optics, Orlando, FL, USA, 14–18 October 2018; Laser Institute of America: Orlando, FL, USA, 2018; p. 703. [Google Scholar] [CrossRef]
- Otto, A.; Vázquez, R.G. Fluid dynamical simulation of high speed micro welding. J. Laser Appl. 2018, 30, 032411. [Google Scholar] [CrossRef]
- Nagel, F.; Brömme, L.; Bergmann, J.P. Effects of two superimposed laser beams on spatter formation during laser welding of high alloyed steel. J. Laser Appl. 2019, 31, 022005. [Google Scholar] [CrossRef]
- Lütke, M. Entwicklung des Remote-Laserstrahlschneidens Metallischer Werkstoffe; Fraunhofer-Verlag: Berlin, Germany, 2011. [Google Scholar]
- Ramlow, M. Simulation des Zerfalls von Flüssigkeiten mit Ansys Fluent. Dissertation, Technische Hochschule Wildau, Wildau, Germany, 2014. [Google Scholar]
Publisher’s Note: MDPI stays neutral with regard to jurisdictional claims in published maps and institutional affiliations. |
© 2021 by the authors. Licensee MDPI, Basel, Switzerland. This article is an open access article distributed under the terms and conditions of the Creative Commons Attribution (CC BY) license (https://creativecommons.org/licenses/by/4.0/).