Article

OCT Capillary Depth Measurement in Copper Micro Welding Using Green Lasers

1
Corporate Research, Robert Bosch GmbH, Robert-Bosch-Campus 1, 71272 Renningen, Germany
2
Production Technology Group, Technische Universität Ilmenau, Gustav-Kirchhoff-Platz 2, 98693 Ilmenau, Germany
*
Author to whom correspondence should be addressed.
Appl. Sci. 2021, 11(6), 2655; https://doi.org/10.3390/app11062655
Submission received: 23 February 2021 / Revised: 8 March 2021 / Accepted: 12 March 2021 / Published: 16 March 2021
(This article belongs to the Special Issue Modelling of Laser Welding)

Abstract

:
The transition of the powertrain from combustion to electric systems increases the demand for reliable copper connections. For such applications, laser welding has become a key technology. Due to the complexity of laser welding, especially at micro welding with small weld seam dimensions and short process times, reliable in-line process monitoring has proven to be difficult. By using a green laser with a wavelength of λ = 515 nm, the welding process of copper benefits from an increased absorption, resulting in a shallow and stable deep penetration welding process. This opens up new possibilities for the process monitoring. In this contribution, the monitoring of the capillary depth in micro copper welding, with welding depth of up to 1 mm, was performed coaxially using an optical coherence tomography (OCT) system. By comparing the measured capillary depth and the actual welding depth, a good correlation between two measured values could be shown independently of the investigated process parameters and stability. Measuring the capillary depth allows a direct determination of the present aspect ratio in the welding process. For deep penetration welding, aspect ratios as low as 0.35 could be shown. By using an additional scanning system to superimpose the welding motion with a spacial oscillating of the OCT beam perpendicular to the welding motion, multiple information about the process could be determined. Using this method, several process information can be measured simultaneously and is shown for the weld seam width exemplarily.

1. Introduction

Due to the transformation of the powertrain from combustion to electric systems, the demand for reliable copper welding connections is steadily increasing. For such applications, laser welding has become a key technology. Simultaneously, the need for trustworthy process monitoring to assure the quality of the finished weld is growing.
Especially in typical micro welding applications with several hundred welds per part and welding depth in the range of 200 μ m to 600 μ m , a reliable quality control is crucial. Additionally, in many micro applications, the maximum welding depth is limited due to the low thickness of the components. A monitoring of the welding depth is, therefore, essential for maintaining a high production quality.
One approach for an inline depth control of the laser welding process is optical coherence tomography (OCT), which is applied for many applications in macro laser welding already [1,2,3]. For micro laser welding, only few investigations have been carried out. As state-of-the-art, fiber lasers with high beam quality and small focal diameters are being used for micro laser welding of copper. These welding processes typically suffer from deep and narrow capillary shapes, increasing the difficulty for measuring the correct welding depth. Additionally, to achieve a stable welding process in copper, process strategies, like spatial beam modulation, must be applied, providing additional challenges. In recent investigations, the authors of Reference [4] showed the difficulties for measuring the welding depth in micro welding with a spot diameter of 82 μ m , while, for many applications, even smaller focal diameters are being used.
In latest developments, beam sources with shorter wavelength are reaching the required performance for laser micro welding of copper, opening up new possibilities. Using a green laser with a wavelength of 515 nm, the authors of Reference [5] were able to achieve comparable welding depth compared to state-of-the-art fiber micro welding processes. The use of shorter wavelengths in copper welding is beneficial due to an increased absorption of the laser beam in the material [6]. This allows larger focal diameters to be used, resulting in a shallow and wide capillary and a stable welding process. The resulting capillary shape increases the accessibility compared to micro laser welding with fiber lasers, which benefits the measurement of the capillary depth and the correlation to the welding depth.
In the following, the capillary depth measurement and the correlation to the welding depth in copper micro welding, using a green laser is presented. By measuring the capillary depth, the aspect ratio of the welding process can be determined directly and will be presented. Lastly, the possibilities of a scanned OCT system to measure several process information are presented and exemplarily shown for the weld seam width.

2. Materials and Methods

The experimental investigations were carried out using a scanner based optical setup. A detailed schematic illustration of the setup used in the experiments is displayed in Figure 1.
A frequency doubled Disk Laser (TruDisk Pulse 421, Trumpf) emitting green light ( λ = 515 nm) was used as laser source. The laser system has an average power of 400 W with pulse durations ranging from 0.3 ms to 50 ms. A fiber core diameter of 150 μ m combined with the optical setup results in a focal diameter of 300 μ m . A laser scanner was used to move the processing beam (green beam, Figure 1) relative to the sample surface in a linear motion. Each weld was carried out within a single pulse. Pure copper (Cu-ETP) with dimensions of 40 mm × 20 mm × 2 mm was used as sample. No shielding gas was used on the material.
Optical coherence tomography (OCT) was used for coaxial inline monitoring of the welding process. An additional laser scanning system is provided with the OCT System and allows for easy adjustment of the OCT beam (light red beam, Figure 1) position, as well as super positioning the welding motion with a custom OCT beam movement during the weld. The OCT System (LDD-600; IPG Photonics, formerly Laser Depth Dynamics) uses a measuring wavelength of 840 nm. The acquisition rate in the conducted experiments was set to 200 kHz. The focal diameter on the surface sample was measured to be ∼33 nm.
Additionally, coaxial high-speed imaging was used to determine the process regime, as well as the weld process stability. In Figure 1, the imaging beam path is represented by a grey beam. Using a high-speed camera (Phantom VEO1310, Vision Research) allowed recording the welding process with a framerate of 50 kHz at a resolution of 640 × 240 pixels, resulting in an observed area of 8000 μ m × 3000 μ m . The exposure time was set to 1 μ s. No additional illumination was used. A notch filter with a center wavelength of 514 ± 2 nm, as well as a shortpass filter with a cut-off wavelength of 750 nm, was used to block the processing laser, as well as the measuring laser of the OCT System.
The selection of the process parameters was based on the investigations in Reference [5] to achieve welding depths of up to 1 mm as used in typical copper micro welding applications in different weld regimes. The focal position of the processing beam was set to be on the sample surface. The laser power was varied in the range from 1000 W to 3000 W , while the welding speed was varied from 250 mm s to 750 mm s . Both parameters remained at a constant value during each welding process. The weld length in the experiments was set to 5 mm. Due to the limitation of the laser with a maximum pulse energy of 40 J , the weld length for the experiments with a welding speed of 250 mm s was set to 2.5 mm.

3. Results

3.1. Welding Depth and Process Stability

In order to be able to evaluate the measurement results of the OCT system, the laser welding process must first be investigated with respect to the welding regime and process stability. Only then can the applicability of using an OCT system to determine the welding depth in laser microwelding of copper with green lasers be assessed. To avoid misinterpretations of the measurement results, as well as measurement errors due to instabilities, the performed laser welding processes were classified with regard to the process regime and stability and will be presented in the following section, along with the achieved weld seam depth.
The occurring process regimes were evaluated by analyzing the weld seam surface. The evaluation criteria are displayed exemplary in Figure 2(a1,b1). For heat conduction welding, a bright and smooth weld seam surface, as shown in Figure 2(a1), can be observed. With increasing laser power, material evaporation sets in, changing the process regime from heat conduction to deep penetration welding. For this regime, an irregular surface of the weld seam can be detected, as displayed in Figure 2(b1).
The process stability was determined by the visual appearance of the weld seam surface, as well as the evaluation of the recorded high-speed-videos. The process stability was assessed on two criteria, melt flow effects (Figure 2(a1–d1)) and spatter occurrence (Figure 2(a2–d2)).
While, for heat conduction welding, shown in Figure 2(a1), no instabilities regarding the melt flow were observed, the deep penetration regime could be divided into three categories, stable, ’melt-jet effect’, and humping [7]. For stable melt flow conditions in deep penetration welding, the weld seam surface has an uneven surface, as shown in Figure 2(b1). For high welding speeds, a melt jet is forming behind the capillary which can also be seen on the weld seam surface, as displayed in Figure 2(c1). Lastly, for high welding speeds and high laser power, humping can be observed. This regime is characterized by regularly spaced humps on the weld seam surface, as displayed in Figure 2(d1).
By superimposing the high-speed-video images, the spatter occurrence of a full process can be evaluated within a single image. The results of superimposing the high-speed images are displayed in Figure 2(a2–d2) for the corresponding weld seam images displayed in Figure 2(a1–d1). An increased amount of spatter formation and the occurrence of spatters with a diameter > 100 μ m , was used as criteria for unstable processes. The formation of start spatters was not taken into account.
Using the presented criteria, the process displayed in Figure 2(b2) with a laser power of 1500 W and a welding speed of 250 mm s is considered unstable due to the occurring spatter amount and size, while the displayed processes in Figure 2(a2,c2–d2) are considered stable. Furthermore, no blowouts could be observed in the conducted experiments.
The welding depth was determined by metallographic investigations. For each weld, a cross section in the middle of the weld was performed. In Figure 3, the mean welding depth for n = 6 repetitions is displayed as function of the welding speed and the laser power. The welding speed can be distinguished by color and shape, where red triangles represent a welding speed of v   =   250   mm s , green diamonds v   =   500   mm s , and blue circles v   =   750   mm s . Based on the previously introduced criteria, the present welding regime is described by the background color (heat conduction welding = white; deep penetration welding = grey). Additionally, the process stability criteria are marked, where a cross pattern represents an increase in spatter formation with spatter sizes > 100 μ m , the dotted area represents experiments with melt-jet effects present and vertical lines represent the humping regime.
For a laser power of 1000 W , one can observe heat conduction welding for all three investigated welding speeds. For a welding speed of 250 mm s (red triangles), increasing the laser power to 1250 W results in a change from heat conduction to deep penetration welding. By increasing the laser power further, the welding depth increases up to ∼1070 μ m at P   =   3000   W . At the same time, an increase in spatter formation can be observed. With an increase of the welding speed to 500 mm s (green diamonds), the change from heat conduction welding to deep penetration welding shifts to P   =   1500   W . With increasing laser power, the welding depth rises up to 522 μ m at P   =   3000   W , while the process stays stable regarding melt flow effects and spatter formation. For a welding speed of 750 mm s (blue circles), the deep penetration welding regime starts at 1750 W and is accompanied by the prior presented melt-jet effect behavior of the molten material (dotted area). With increasing laser power, the process changes into the humping regime (vertical lines), while the welding depth increases up to 333 μ m at P   =   3000   W .
By the determination of the welding depth in the performed experiments, the correlation between the measured signals of the OCT and the welding depth can be determined. Furthermore, the classification of the process regimes and stability can be used to improve the validity of the results.

3.2. Capillary Depth Measurement Using OCT

In the following section, the usage of an optical coherence tomography system to gain information about the welding process is discussed.

3.2.1. OCT Positioning

To determine the capillary depth during the welding process, the positioning of the OCT relative to the laser beam is of particular importance. Due to the movement of the laser beam during laser welding, the front of the capillary is inclined. The inclination increases with the welding speed [8] and leads to a shift of the deepest point of the capillary. In order to be able to measure the capillary depth, the position of the OCT beam must be adjusted. In the following section, a method, as well as the results, to determine the position of the deepest point in relation to the center of the laser beam will be presented.
In 
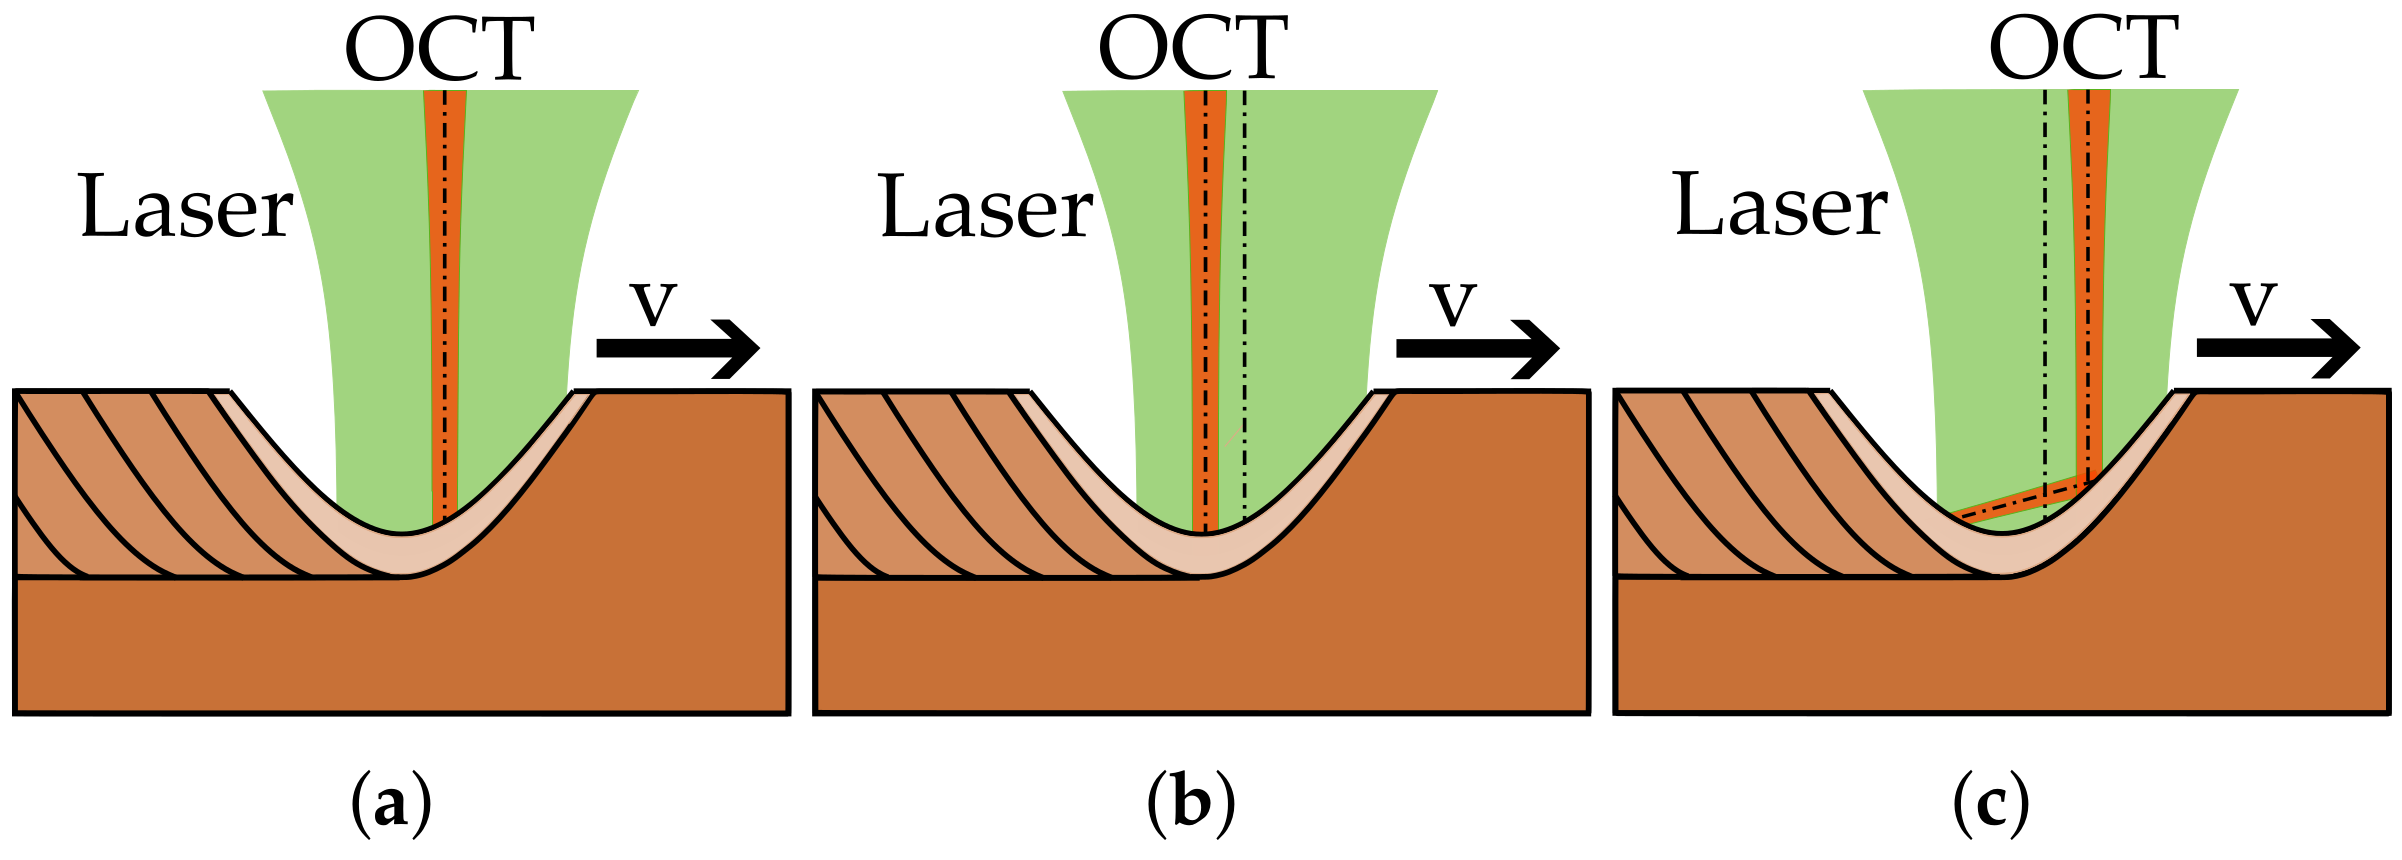
Figure 4, the addressed positional discrepancy is illustrated schematically. The Figure shows the laser beam (green) in a longitudinal cross section of the welding process. Additionally, the OCT beam (red) is displayed for different positions in relation to the origin of the laser beam. In Figure 4a, the position of the OCT beam is aligned with the position of the laser beam. In this configuration, the measured depth is less than the true depth of the capillary. By shifting the OCT beam behind the capillary, as illustrated in Figure 4b, the true depth of the capillary can be measured. Here, the molten surface is presumed to be orthogonal to the OCT beam, resulting in a measured depth with high signal intensity. Lastly, when the position of the OCT beam is shifted out of the deepest point, the OCT beam can be reflected off the capillary surface and lead to a too deep measurement Figure 4c.
In order to determine the optimal measuring position of the OCT beam, the position was altered during the welding process relative to the origin of the laser beam. By evaluating the measured depth, as well as the signal intensity, the optimal measurement position could be determined. 
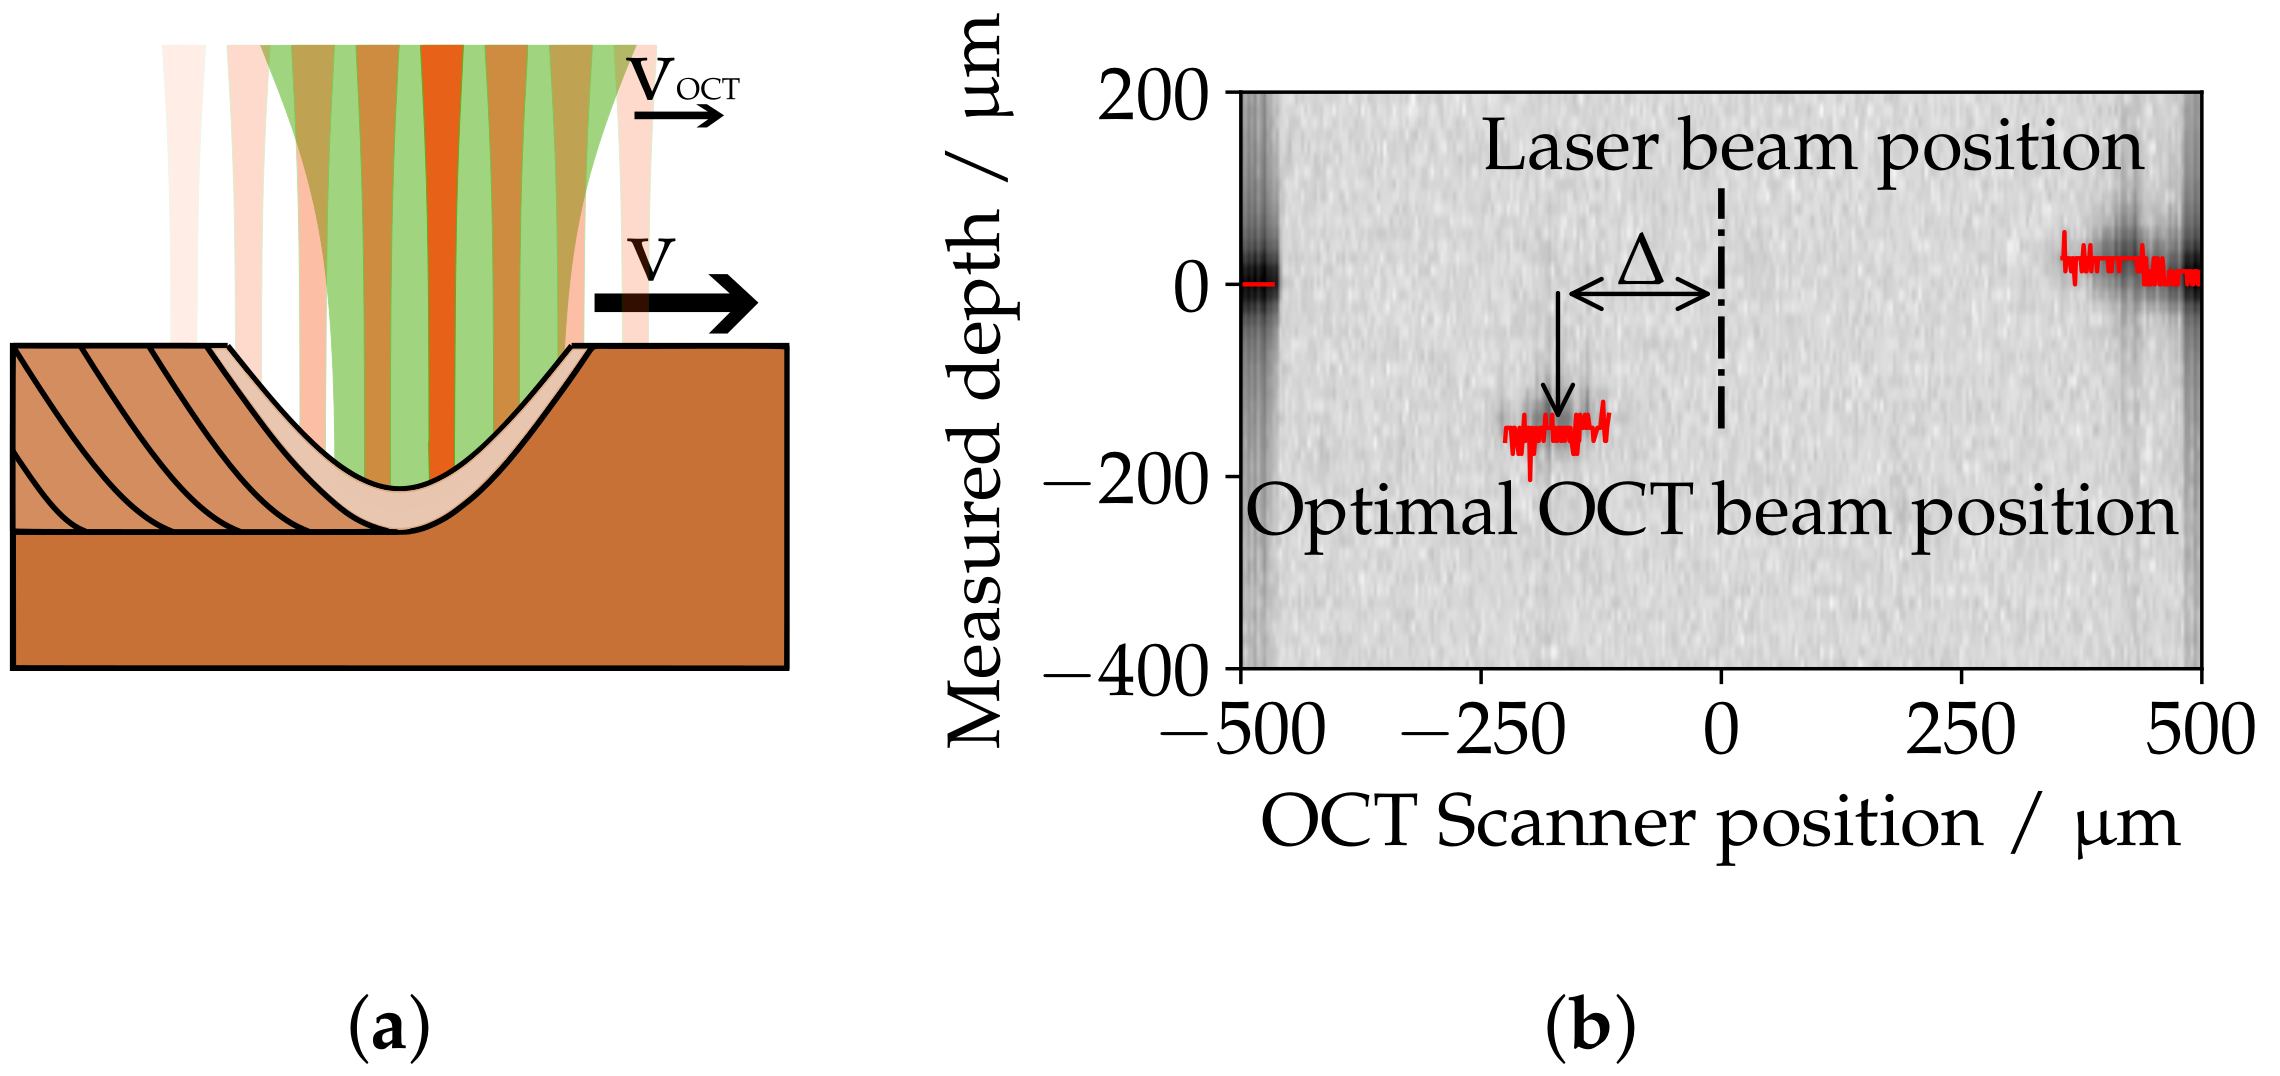
Figure 5 illustrates the presented method schematically. In Figure 5a, a longitudinal cross section of the welding process is displayed. The OCT beam (red line) is moved along the welding direction and passes the capillary and the origin of the laser beam (green) once. The result of such measurement is displayed in Figure 5b exemplary. The graph shows the measured depth (red) as function of the position of the OCT beam relative to the laser beam origin (dash-dotted line). In the areas where there is no visible measured depth, the signal intensity was low and, therefore, not relevant for the determination. In the displayed example, one can see a depth measurement with an offset of ∼ 180 μ m relative to the laser beam origin. This indicates that the lowest point of the capillary is trailing the laser beam.
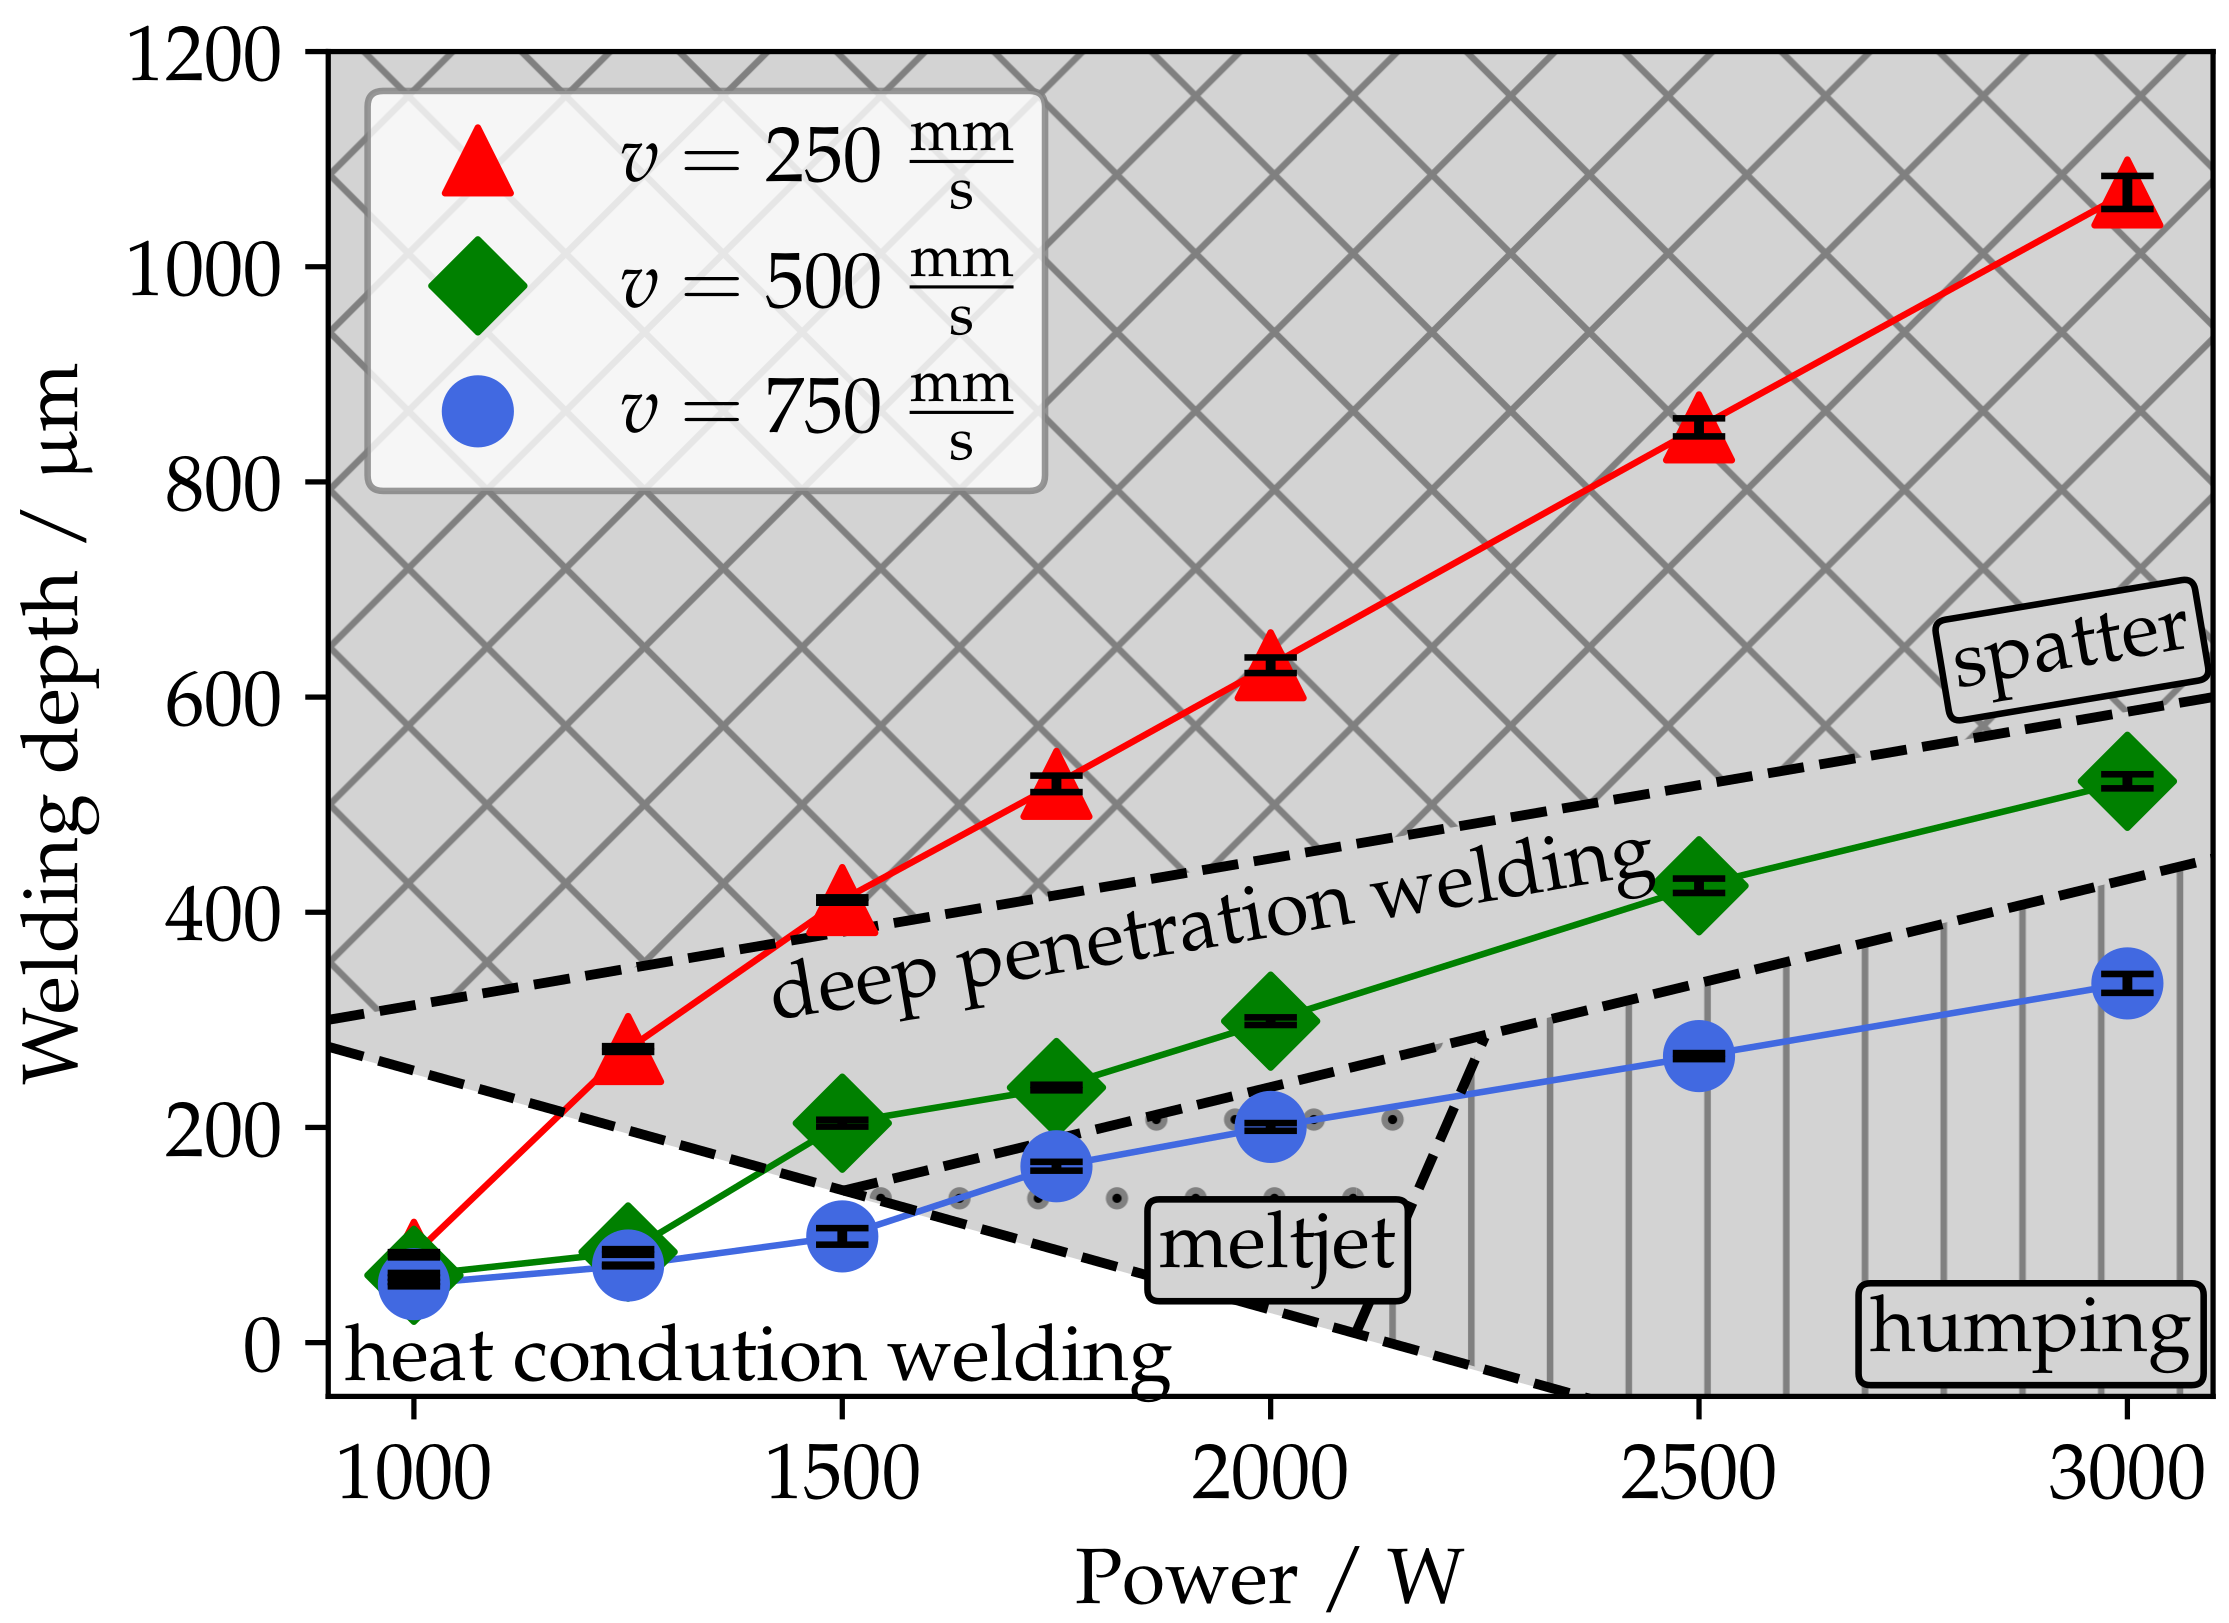
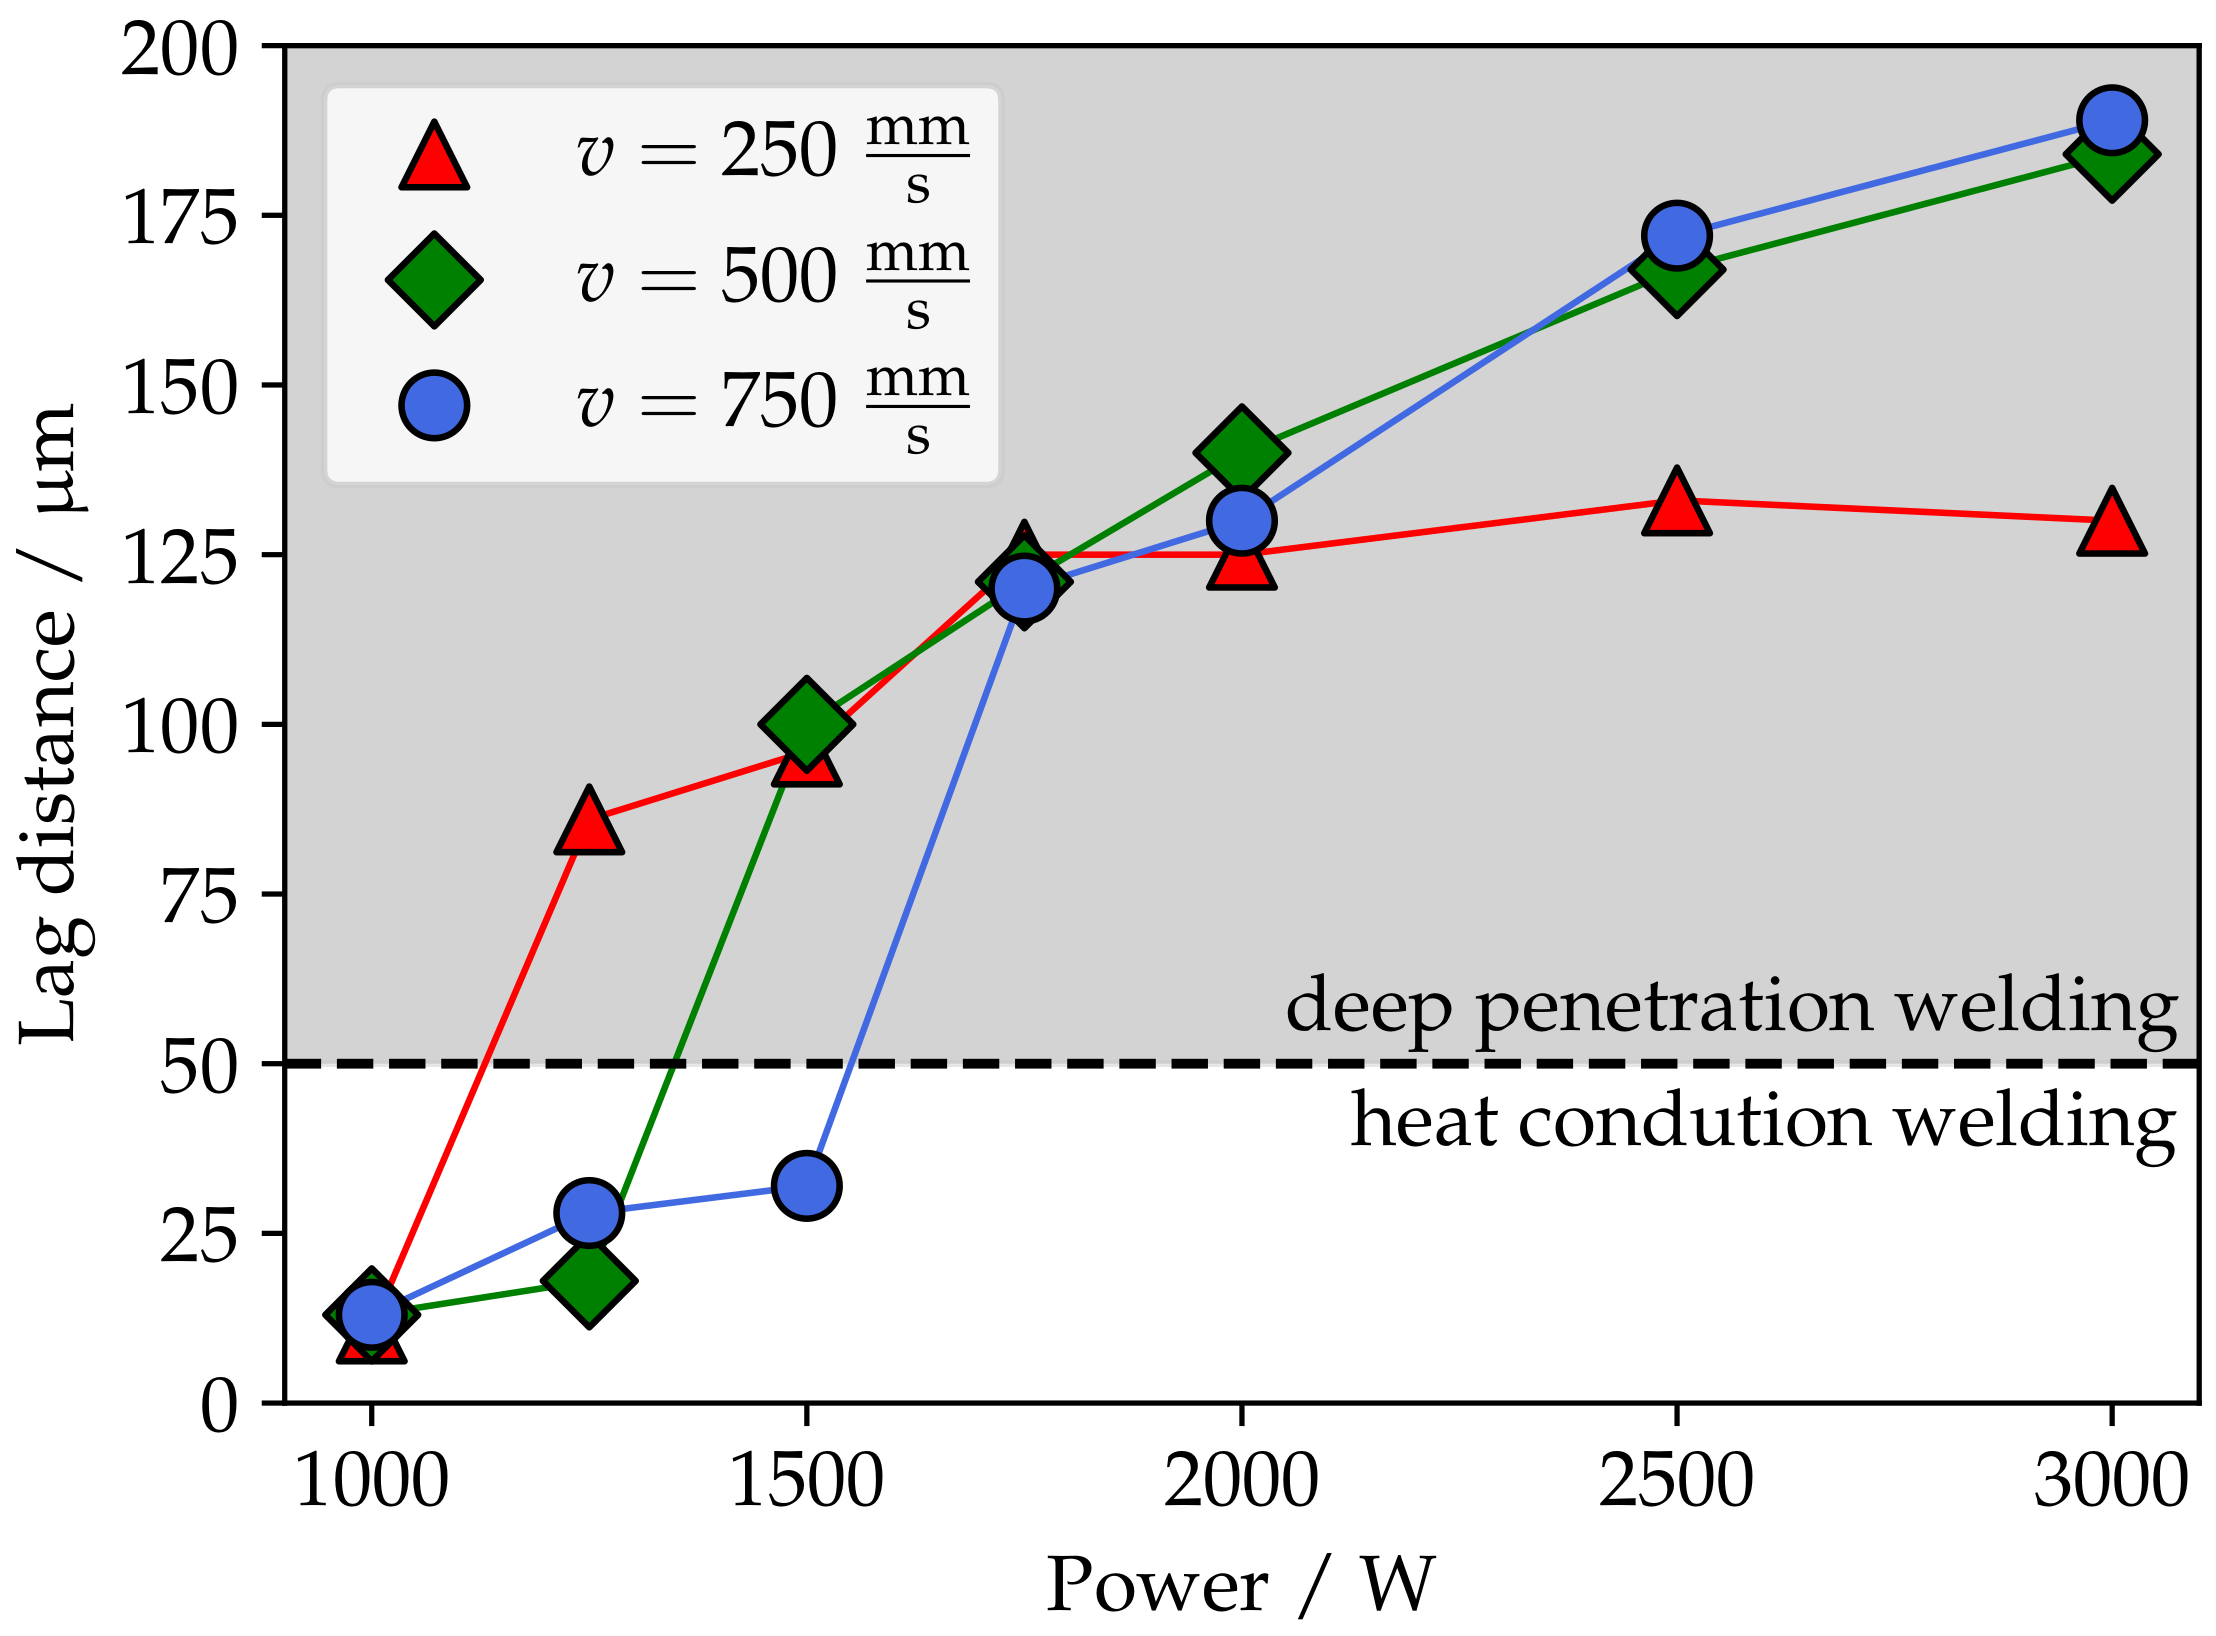
In order to determine the optimal lag distance as a function of the process parameters, the presented method was applied to the investigated process parameters. In Figure 6, the optimal offset values are displayed as function of the welding speed and the laser power. Additionally, both process regimes, heat conduction welding and deep penetration welding, are marked by the background color (heat conduction welding = white; deep penetration welding = grey). The welding speed can be distinguished by color and shape, where red triangles represent a welding speed of v   =   250   mm s , green diamonds v   =   500   mm s , and blue circles v   =   750   mm s .
In heat conduction welding, only minor depth could be measured; therefore, the signal intensity was used as the main criterion for the determination. The offset values were determined in the range of 10 μ m to 30 μ m , depending on the process parameters. For deep penetration welding, both the measured depth and the signal intensity were taken into consideration. The determined offset values were are the range of 85 μ m to 190 μ m , depending on the process parameters. For a low laser power and a low welding speed, only small offsets values need to be used, while, for high laser power and high welding speeds, the shift increases.
In conclusion, it could be shown that the deepest point of the capillary is trailing the laser beam; therefore, the measurement beam needs to be shifted behind the laser beam. By scanning the OCT beam along the welding direction during the welding process, the optimal offset of the measurement beam relative to the origin of the laser beam was determined. In experiments to determine the capillary depth, the optimal offset values were used to adjust the position of the OCT beam relative to the laser beam origin to ensure the measurement of the deepest point of the capillary.

3.2.2. Capillary Depth Measurement

For copper micro welding with green lasers, deep penetration welding with much lower aspect rations compared to fiber laser welding processes can be performed, therefore increasing the potential for the OCT to measure the capillary depth. In the following section, the results of the capillary depth measurement will be presented and compared to the corresponding welding depth.
As described in Section 3.1, the welding depth was determined by cross sections in the middle of the weld. For an accurate comparison, the capillary depth measurement in the middle of the weld seam was determined. However, in order to compensate for the positioning error caused by grinding the sample when performing the cross section, the mean depth measurement in a range of −50 μ m to 50 μ m around the middle of the weld was used.
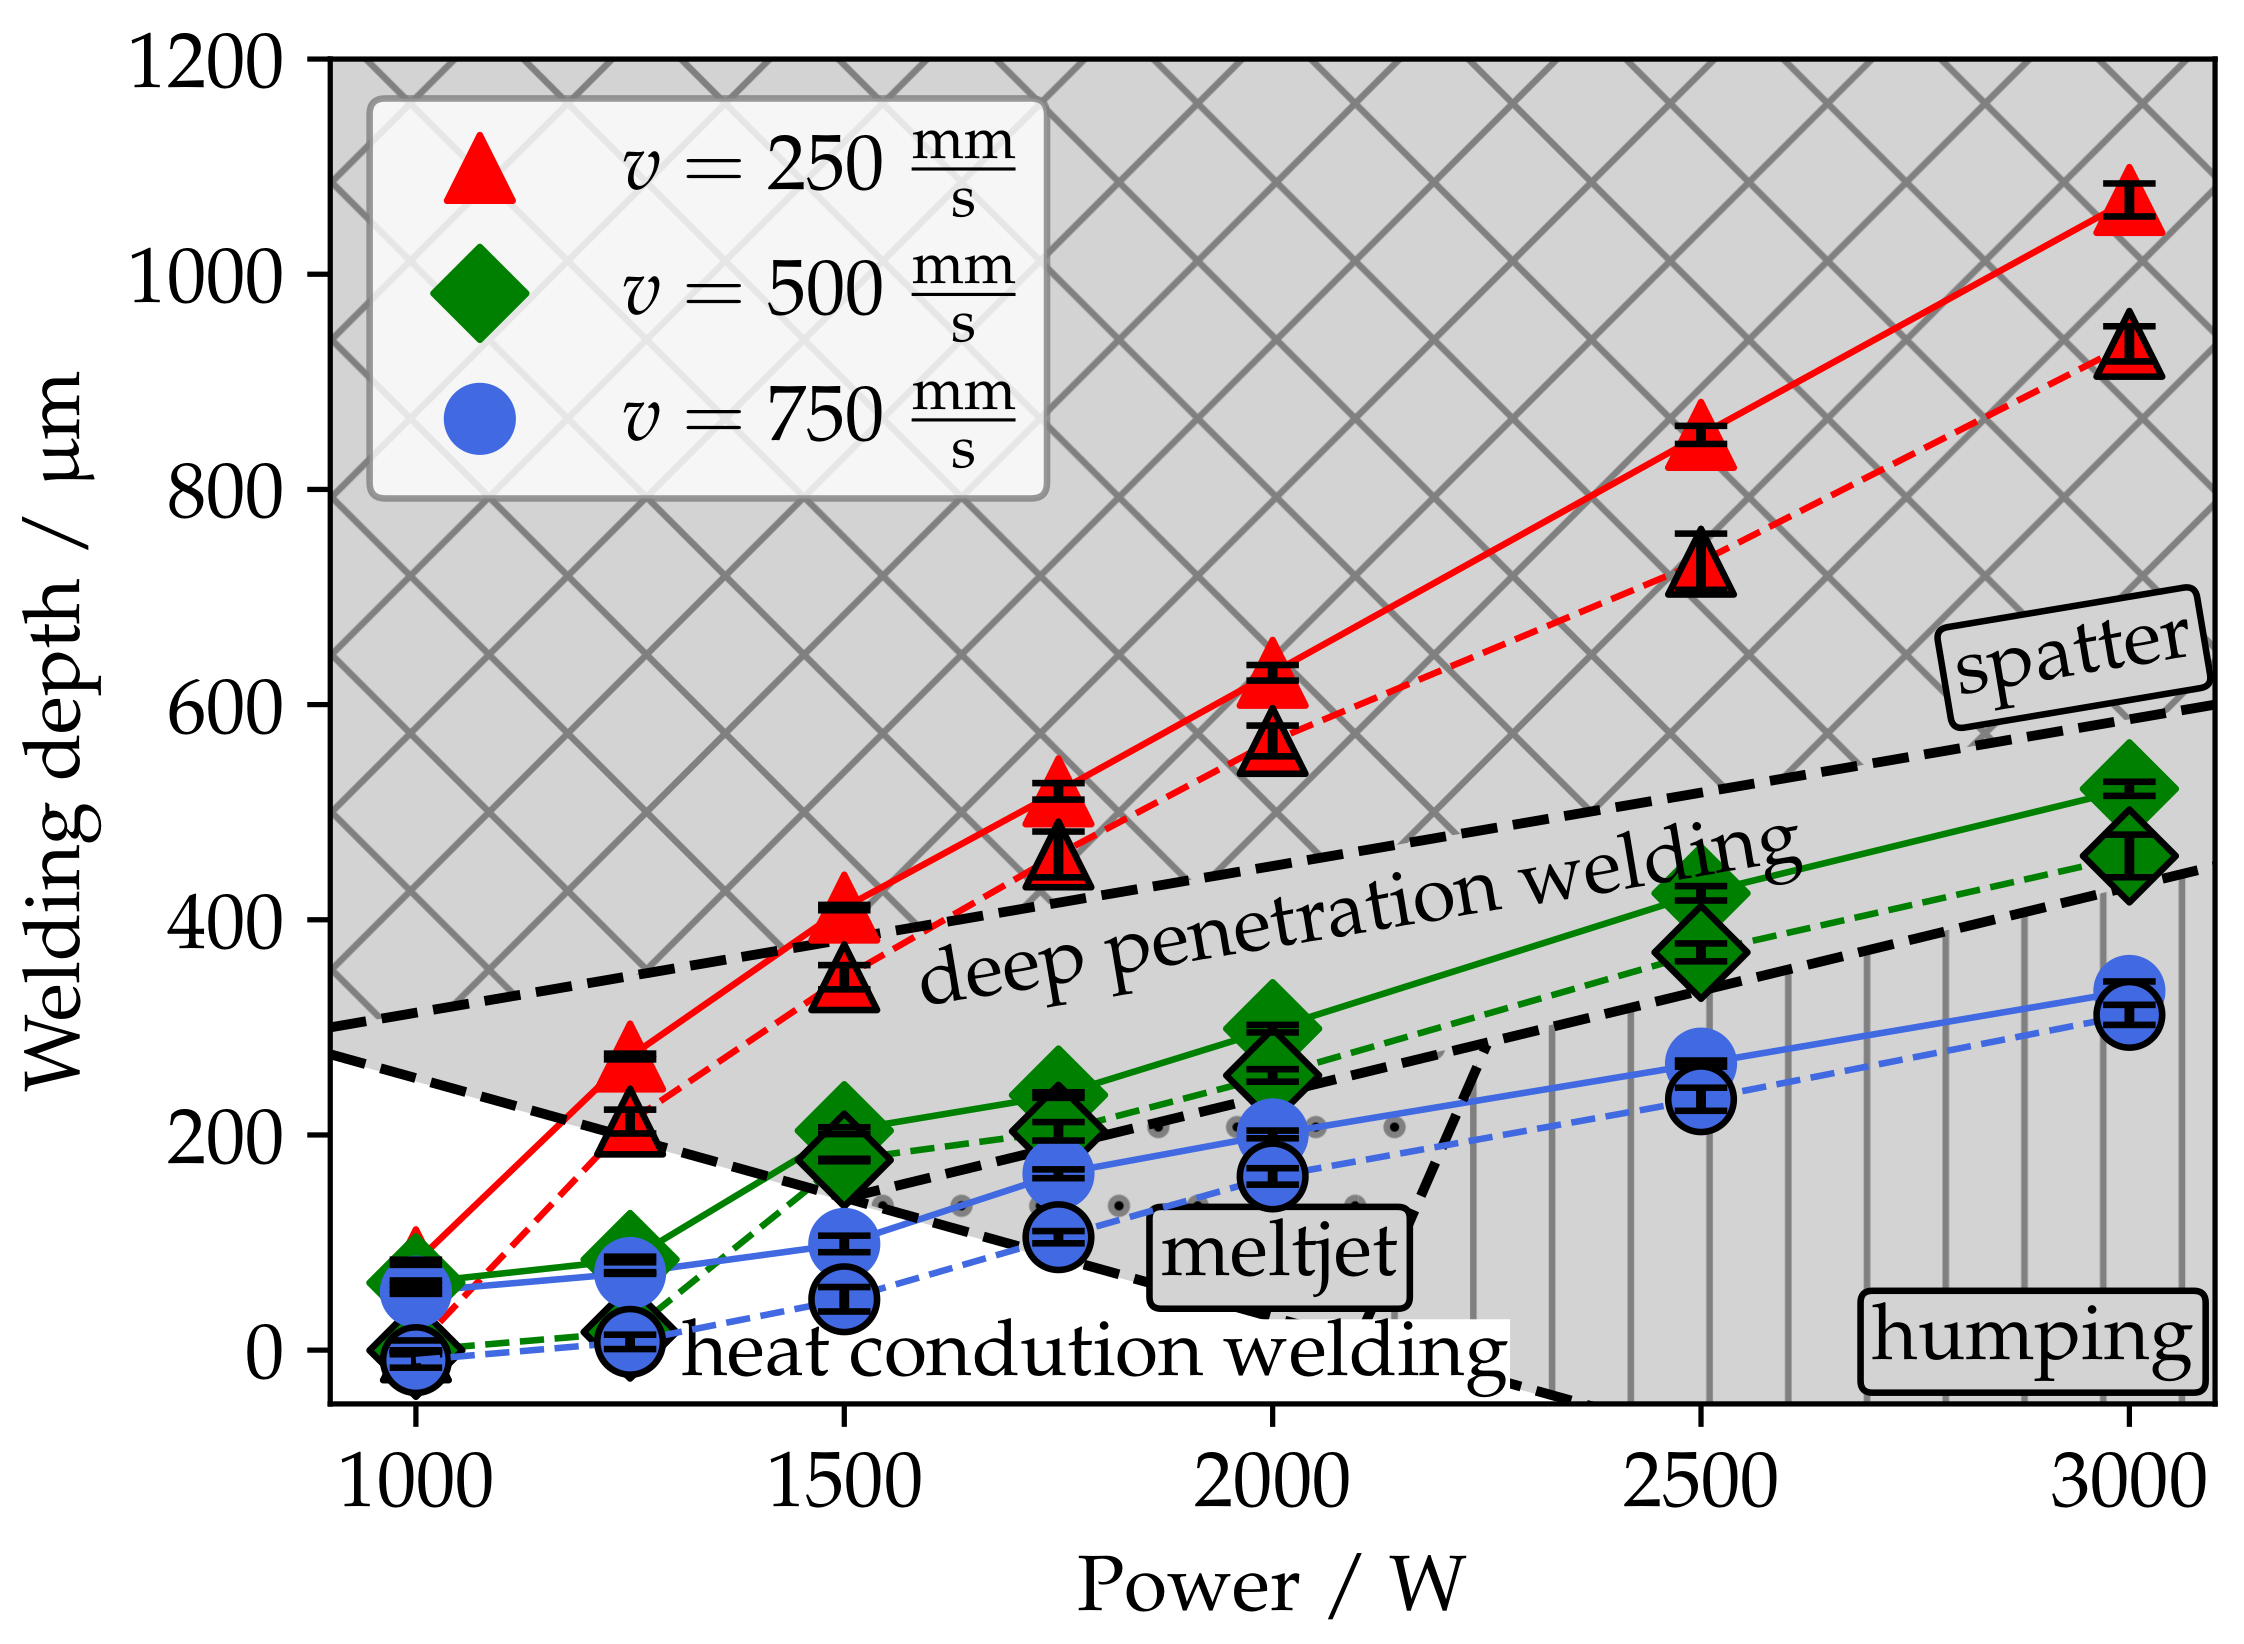
In Figure 7, the results of the OCT depth measurement and the welding depth are displayed as a function welding speed and the laser power. The welding speed can be distinguished by color and shape, where red triangles represent a welding speed of v   =   250   mm s , green diamonds v   =   500   mm s , and blue circles v   =   750   mm s . To differentiate the OCT depth measurement from the welding depth, the OCT depth measurements are marked with a black outline. The formatting of the background follows the formatting in Figure 3 and can be found in Section 3.1.
A good correlation can be observed when comparing both measurements. This correlation seems to be independent of the process stability and the regime.
In order to determine if a measurement of the welding depth based on the capillary depth is viable, the percentage deviation between the measured values:
Δ = s w e l d s O C T s w e l d   ·   100 ,
where s w e l d as the welding depth, and s O C T 
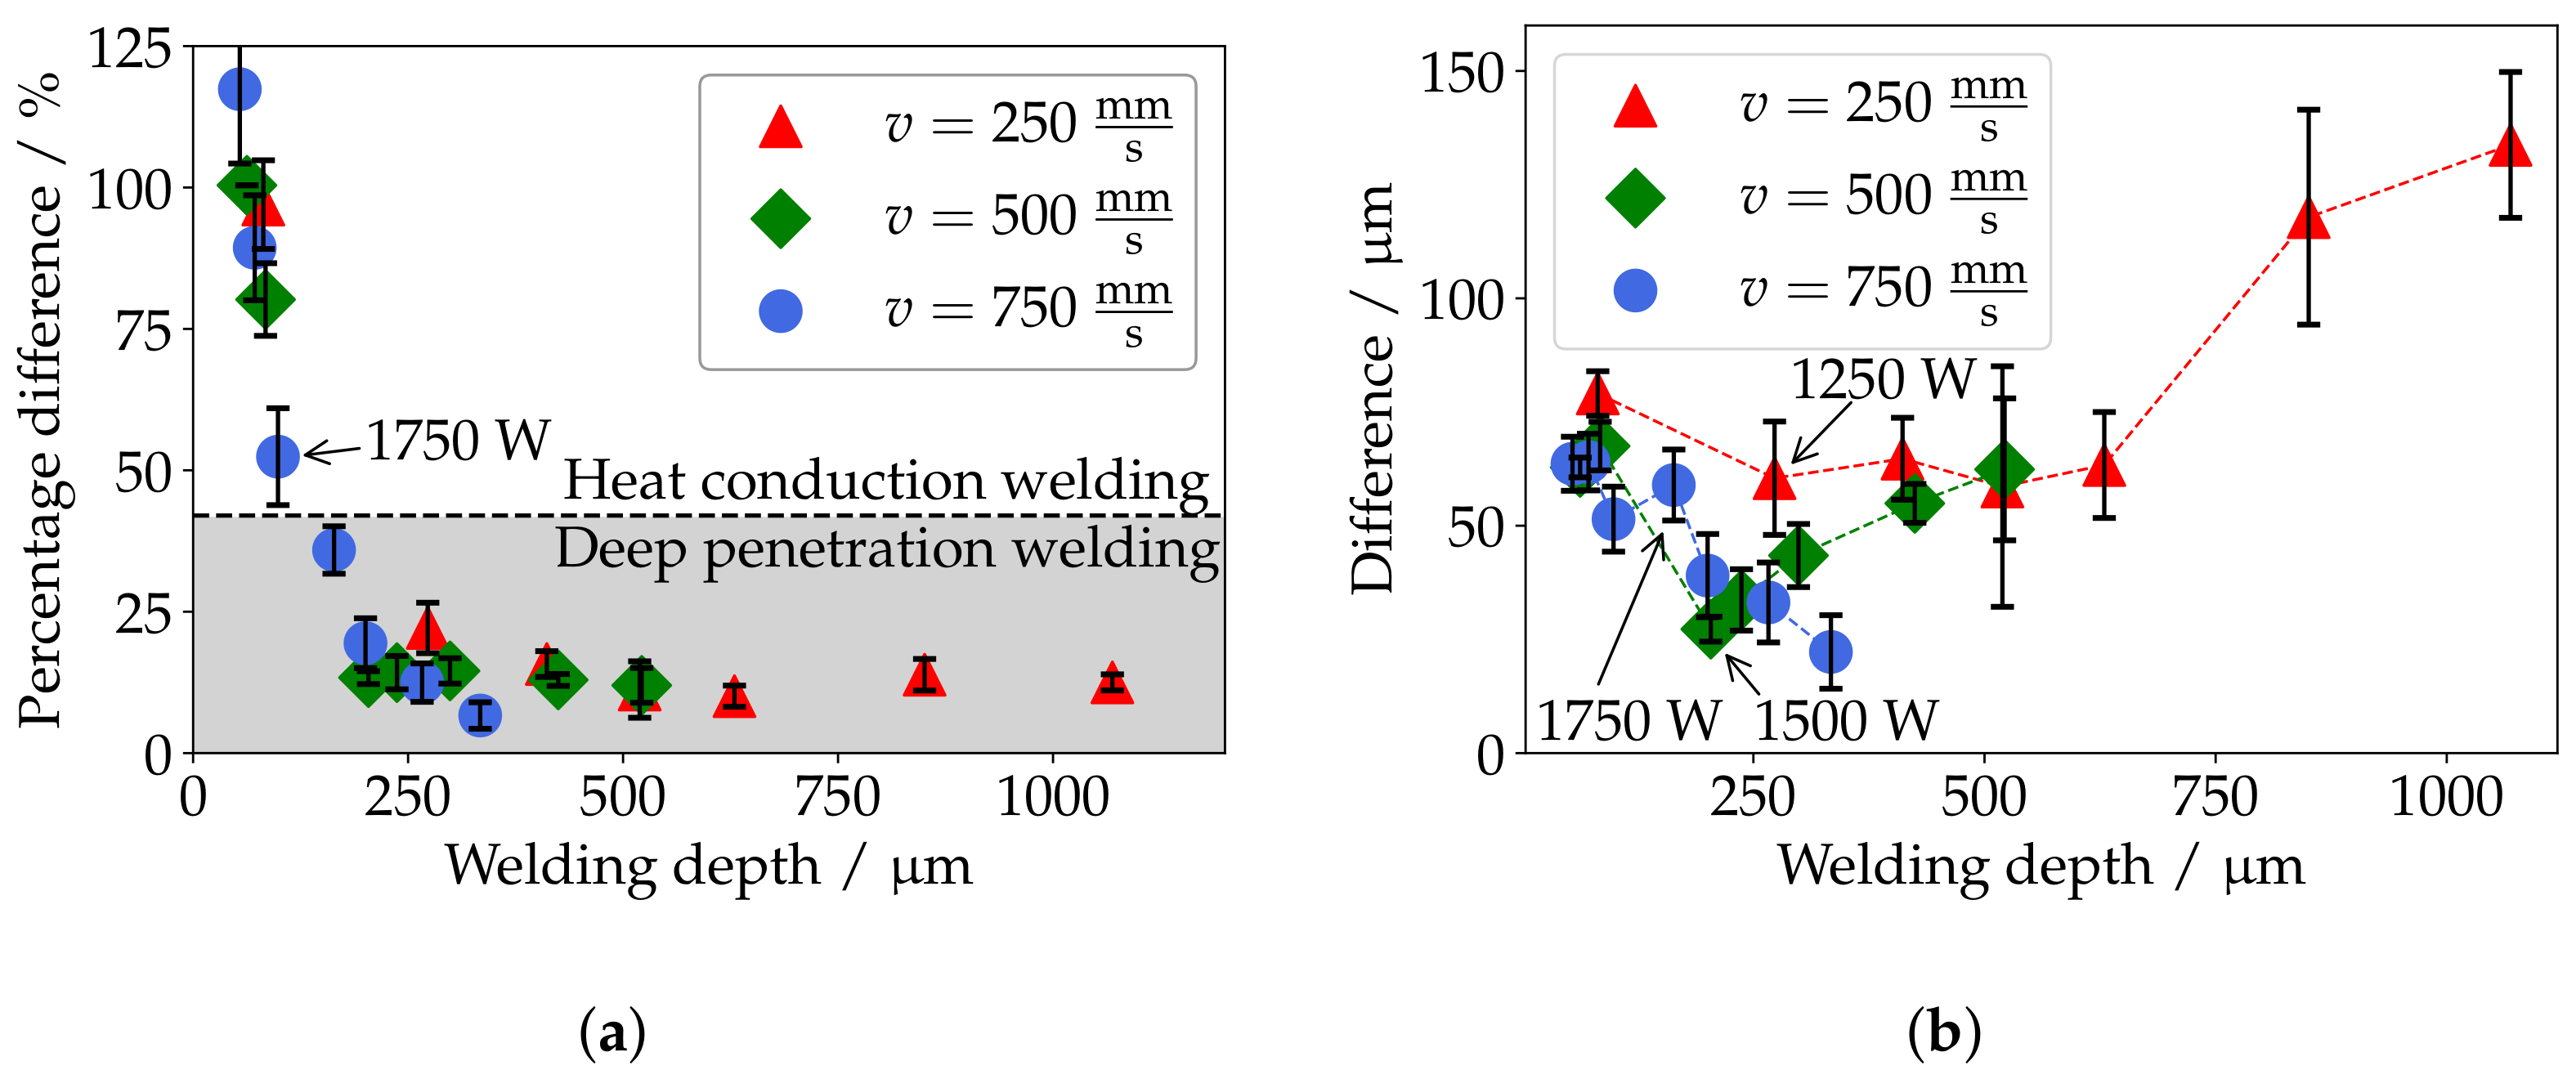
as the measured capillary depth, was determined. In Figure 8a, the percentage difference is displayed as function of the welding depth and the welding speed. The welding speed can be distinguished by color and shape, where red triangles represent a welding speed of v   =   250   mm s , green diamonds v   =   500   mm s , and blue circles v   =   750   mm s . Additionally, both process regimes, heat conduction welding and deep penetration welding, are marked by the background color (heat conduction welding = white; deep penetration welding = grey).
When looking at the percentage difference in the heat conduction welding regime, the majority of the measurements are in the range of 75–125%, which indicates that only minor depth could be measured by the OCT System. A determination of the welding depth based on the OCT depth measurement is not viable here. For values above 100%, the OCT System measured a negative depth. A potential explanation for this spread of measurements could be the axial resolution of the OCT System of 13 μ m which has a significant impact with welding depth being in the range of 50 μ m to 80 μ m . However, one exception can be observed in heat conduction welding. For a welding speed of 750 mm s and a laser power of 1750 W , a percentage difference of 50% can be observed. Since the measurement error decreases with increasing welding depth due to the axial resolution of the OCT system, this implies that a small pit must have formed in the molten material during heat conduction welding.
For deep penetration welding, the percentage difference decreases with an increase in welding depth, making it feasible to determine the welding depth based on the capillary depth measurement.
To get an idea of the absolute difference between the measured variables, the absolute difference between the capillary depth and the welding depth is shown as a function of the welding speed and the welding depth in Figure 8b. The welding speed can be distinguished by color and shape, where red triangles represent a welding speed of v   =   250   mm s , green diamonds v   =   500   mm s , and blue circles v   =   750   mm s . Additionally, the laser power when changing from heat conduction welding to deep penetration welding is marked for each welding speed.
For a welding speed of 250 mm s (red triangle), a decrease in measured difference from 80 μ m to 60 μ m can be observed when changing from heat conduction welding to deep penetration welding at a laser power of 1250 W . In deep penetration welding, the measured difference stays constant at a value of ∼60 μ m with an increase in welding depth, an increase in absolute difference can be observed at a welding depth of 850 μ m . For a welding speed of 500 mm s (green diamond), the drop in absolute difference (65 μ m to 26 μ m ) can also be observed when changing from heat conduction welding to deep penetration welding at a laser power of 1500 W . With increasing welding depth in deep penetration welding, a steady increase in measured difference can be observed from 26 μ m to 62 μ m . When increasing the welding speed to 750 mm s (blue circle), no significant change in absolute difference by changing from heat conduction to deep penetration welding at a laser power of 1750 W can be seen. Additionally, contrary to the welding speeds of 250 mm s and 500 mm s , with increasing welding depth, a decrease in absolute difference can be observed. A potential explanation this decrease in difference could be the change in melt flow conditions (melt-jet effect; humping) for high welding speeds, as presented in Section 3.1.
In conclusion, by using an OCT System, the capillary depth in welding copper with green lasers can be determined. A good correlation between the capillary depth and the welding depth was shown for deep penetration welding, enabling a welding depth control using an OCT System in copper micro welding with green lasers. By evaluating the absolute difference between the welding depth and the capillary depth measurement, an increase in difference could be observed for welding speeds of 250 mm s and 500 mm s . For high welding speeds of 750 mm s , the absolute difference decreases, which is potentially caused by the change in melt flow conditions.

3.2.3. Aspect Ratio

In laser welding, the welding process is typically differentiated into two main welding regimes, heat conduction welding and deep penetration welding. For deep penetration in state-of-the-art copper welding processes with infrared laser at ∼1 μ m , the aspect ratio of the capillary:
R = s d f ,
where s is the measured capillary depth, and d f is the focal diameter of the laser, which is typically substantially larger than one [9]. Due to the increased absorptivity of the green wavelength in copper [6], a smooth transition from heat conduction welding to deep penetration welding can be observed, thus allowing for shallow penetration welding. In the following section, the resulting aspect ratios will be presented.
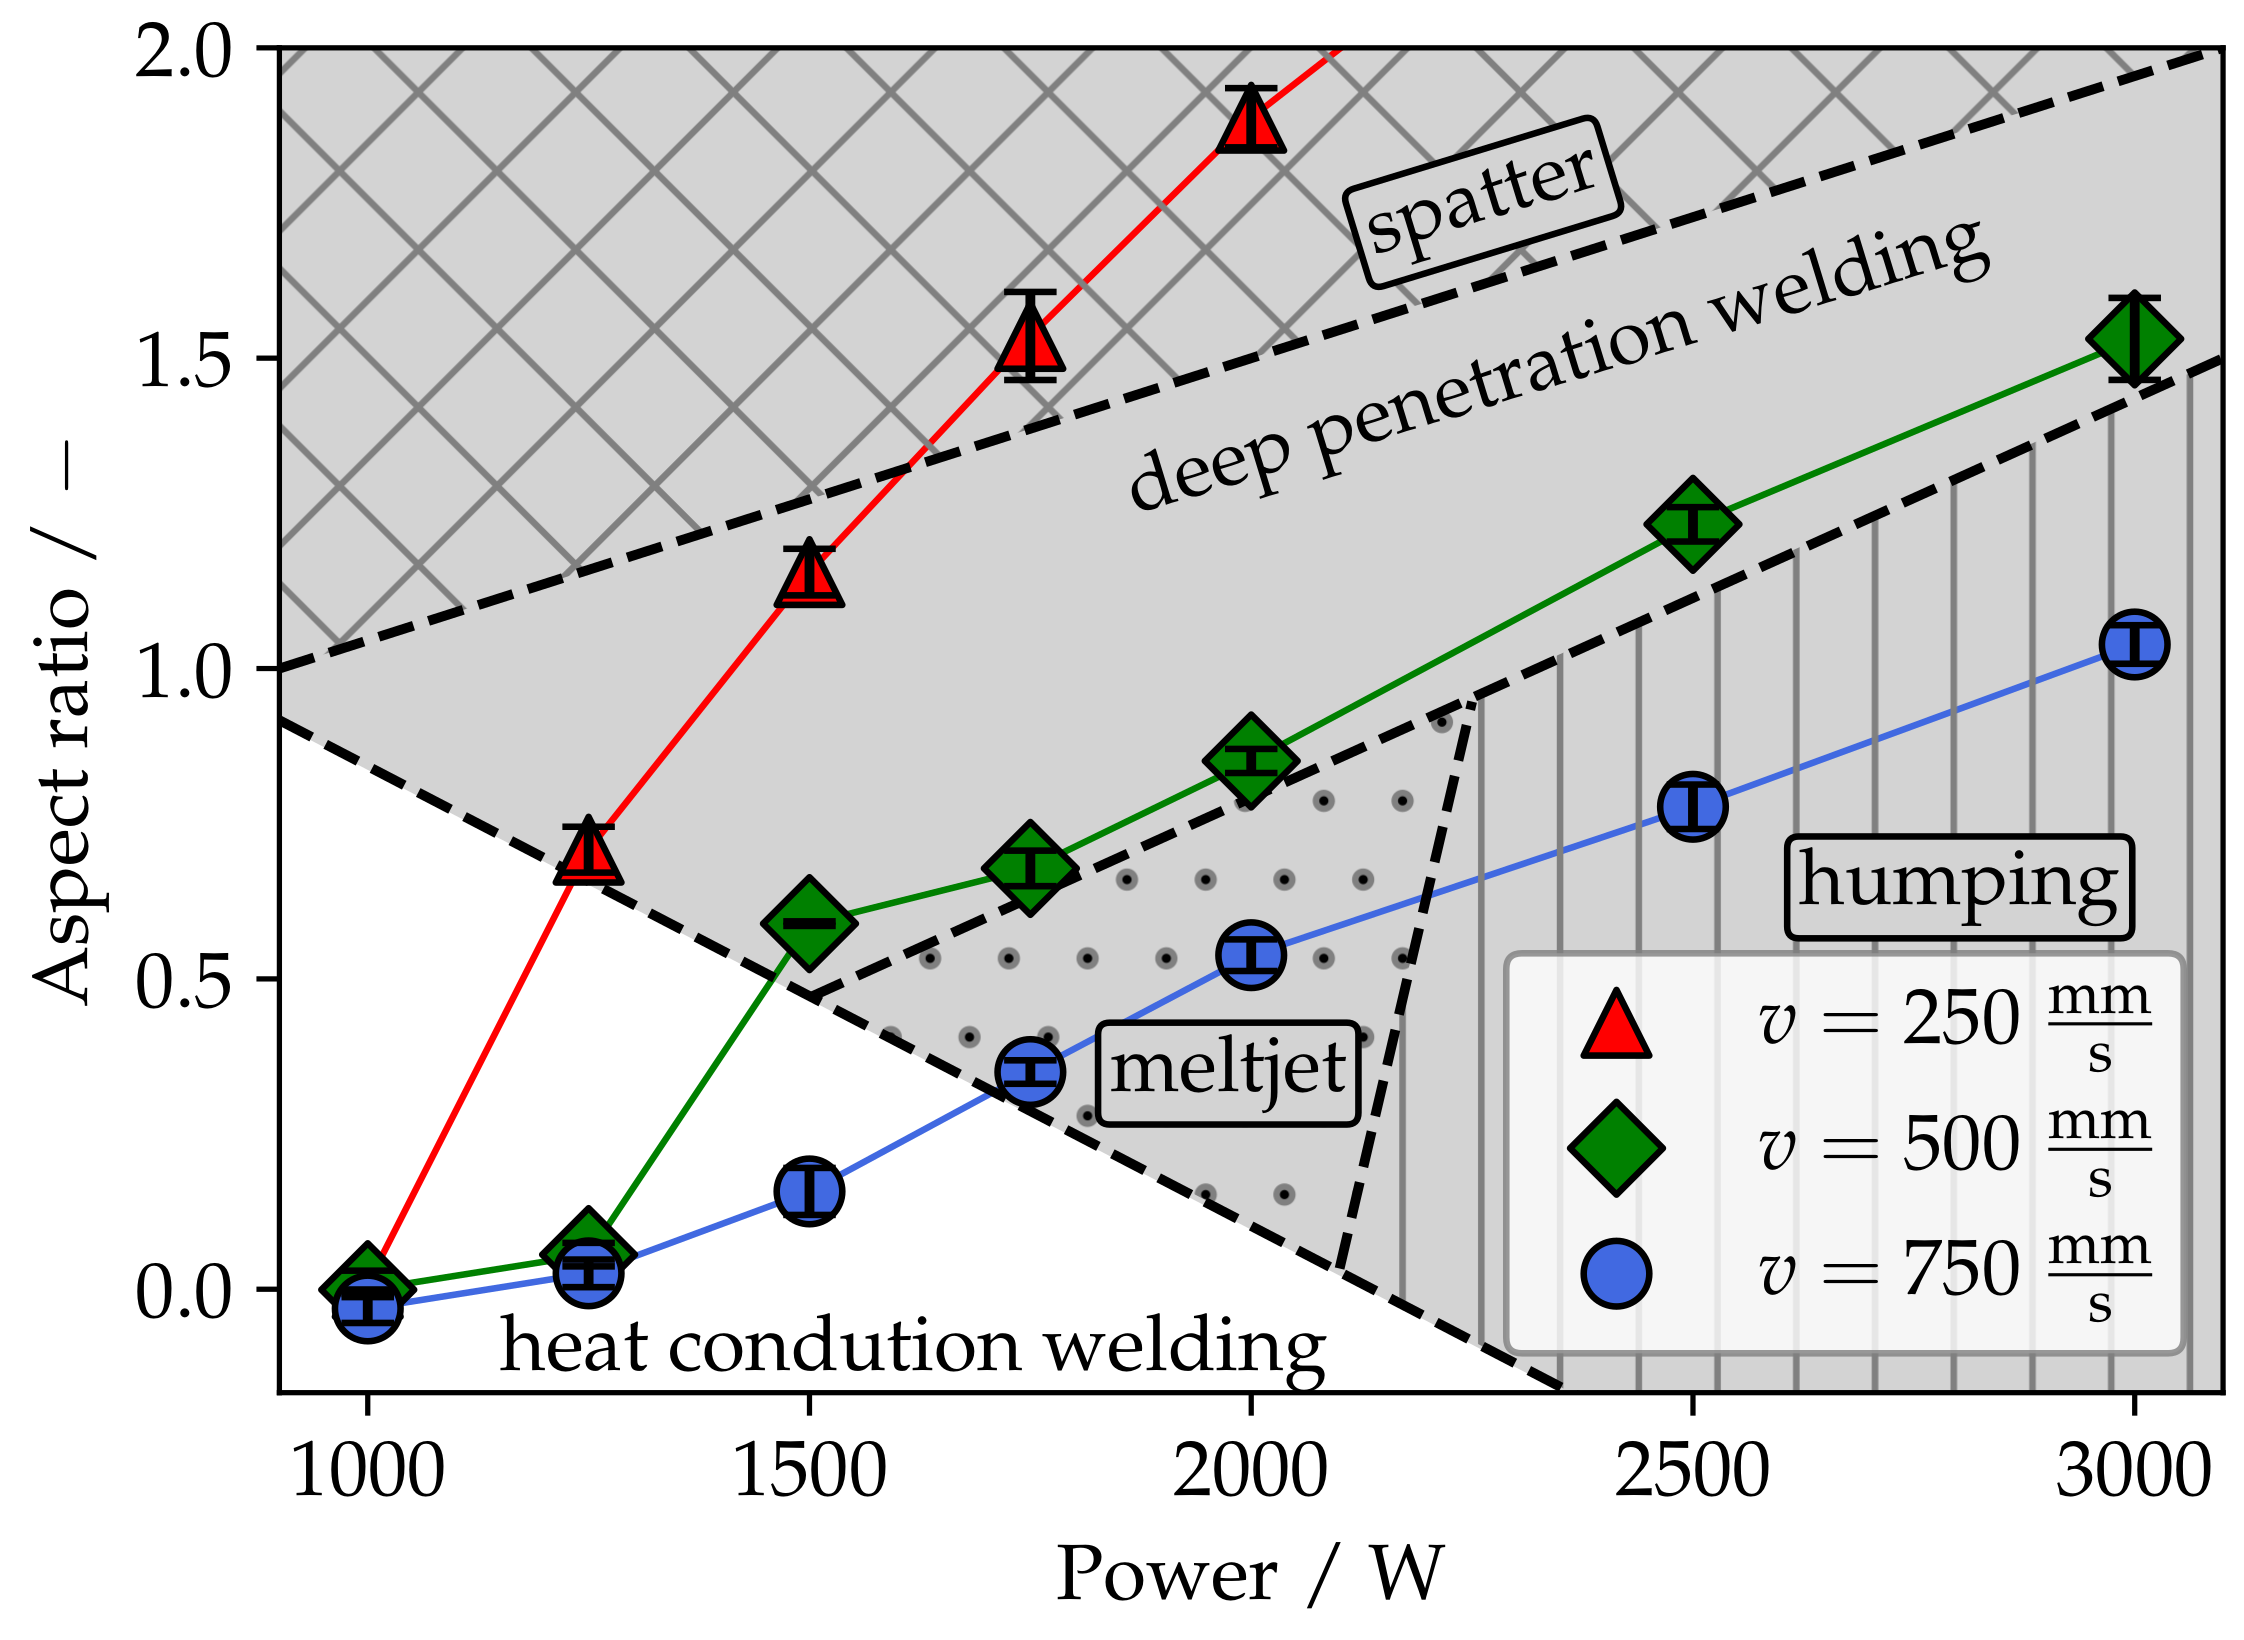
Using the presented results of the OCT depth measurement in Section 3.2, the resulting aspect ratio can be determined directly. In Figure 9, the aspect ratios are displayed as a function of the welding speed and laser power. The welding speed can be distinguished by color and shape, where red triangles represent a welding speed of v   =   250   mm s , green diamonds v   =   500   mm s , and blue circles v   =   750   mm s . Additionally, both process regimes, heat conduction welding and deep penetration welding, are marked by the background color (heat conduction welding = white; deep penetration welding = grey). The formatting for the process stability follows the formatting in Figure 3 and can be found in Section 3.1.
For heat conduction welding with low laser powers, the aspect ratio for all welding speeds is ∼0. With an increase of laser power, an increase of the aspect ratio can be observed. This is not only noticeable when changing from heat conduction welding to deep penetration welding but also during heat conduction welding with high welding speeds. Exemplary, for a welding speed of 750 mm s and a laser power of 1500 W a depth of ∼40 μ m was measured, resulting in an aspect ratio of 0.16 . This leads to the conclusion that a small melt pit must have already been formed during heat conduction welding.
For deep penetration welding, aspect ratios as low as 0.35 can be observed for a welding speed of 750 mm s and a laser power of 1750 W . With welding speeds of 500 mm s and 250 mm s , the lowest achieved aspect ratio increases to 0.58 and 0.7 , respectively. When focusing on the process stability, it can be noticed that, for deep penetration welding with low aspect ratios, no increased spatter formation was observed.
In conclusion, by using the depth measurement of the OCT System, the aspect ratio of the welding process could be determined directly. It could be shown that, for micro welding of copper with green lasers, aspect ratios less than 1 can be achieved in deep penetration welding. Additionally, the deep penetration process with low aspect ratio has shown to be more stable towards spatter formation.

3.2.4. Inline Measuring of the Melt Pool Width Using the OCT

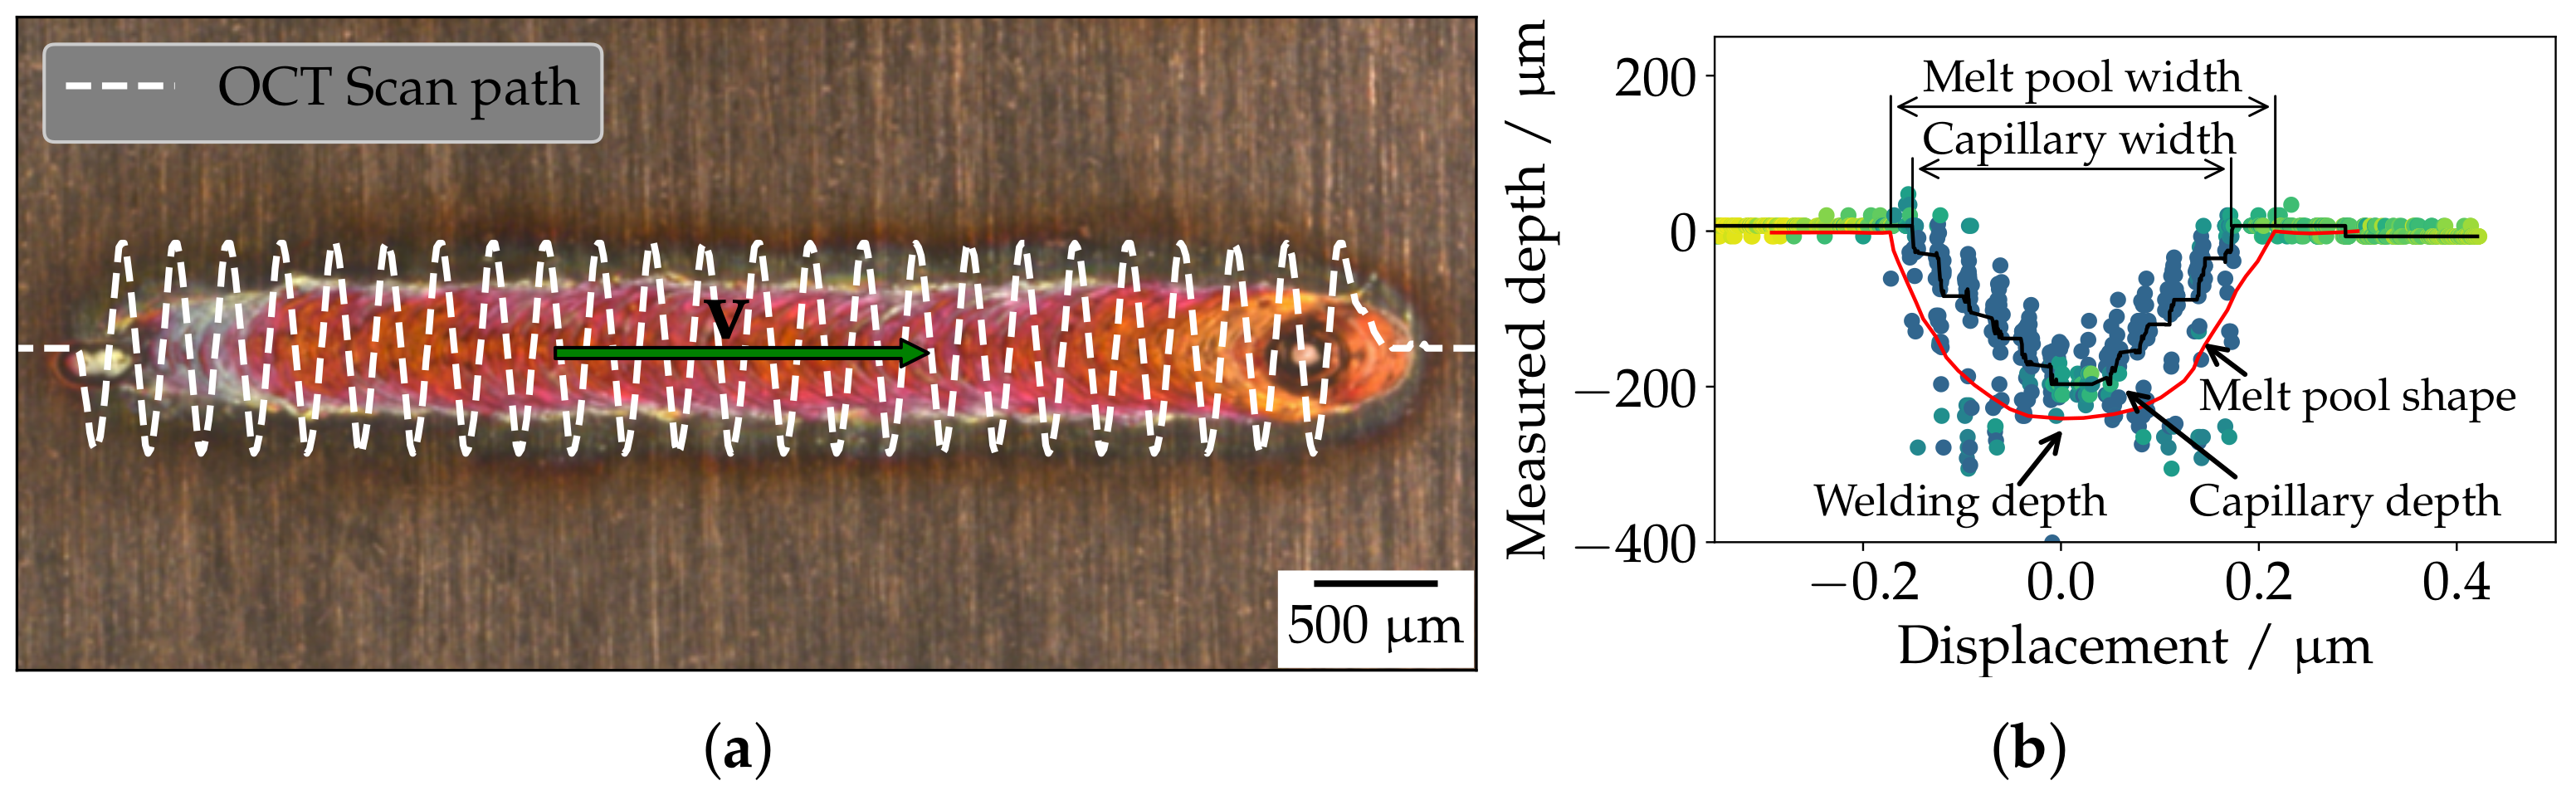
In the previous section, the OCT was used in a static configuration during the welding process. However, the scanning system provided with the LDD-600 allows to spacially modulate the OCT beam in any given shape during the welding process. This enables to determine multiple information about the welding process simultaneously. In the following section, the possibilities of the scanned approach of the OCT beam and the usage to determine melt pool width will be presented.
By spacially modulating the OCT Beam perpendicular to the welding direction during the welding process, not only can the capillary depth be determined but also additional information, like the capillary width, melt pool width, and approximations, about the capillary form might be determined. In Figure 10a, an image of a weld seam is displayed, overlaid with an sinusoidal modulation path (white). The usage of this motion path allows the determination of multiple process information during the welding process, which are displayed exemplary in Figure 10b. The figure shows a cross section of the welding process for a full amplitude of the OCT beam motion path. The red line represents the melt pool evaluated from a cross section of the finished weld, while the black line represents the cross section from the evaluated depth of the OCT Signal. Additionally, the OCT Signal is colored according to the signal intensity. By evaluating the signal depth and intensity, weld characteristics, such as the melt pool width and the capillary width, can be extracted, in addition to the capillary depth.
As a result of oscillating the OCT beam perpendicular to the welding process, the spatial resolution will be decreased. For a static configuration of the OCT beam, the resolution can be calculated by:
r = v f m e a s u r e ,
where v is the welding speed and f m e a s u r e is acquisition rate of the OCT System. For a scanned system, additional variables are needed to be taken into account. In the experiments, the welding process was overlaid with a sinusoidal modulation of the OCT beam perpendicular to the welding direction, which led to the movement pattern displayed in Figure 10a. The spatial resolution is now divided into the resolution along and perpendicular to the welding axis. The resolution along the weld direction is calculated by:
r = v f m o d ,
where v is the welding speed, and f m o d is the modulation frequency of the OCT beam. The resolution perpendicular to the welding direction is calculated by:
r = 2   ·   π   ·   f m o d   ·   A m p   ·   1 x 2 A m p 2 f m e a s u r e ,
where A m p is the Amplitude of the modulation, and x is the current distance from the middle axis.
In the experiments, a modulation frequency of f m o d = 2500 Hz was used. In Figure 11a, the resulting resolution along the welding direction is displayed as a function of the modulation frequency. One can observe that, for a welding speed of v   =   500   mm s and the chosen modulation frequency, a resolution of 100 μ m can be achieved. In comparison to the static configuration, with a resolution of 5 μ m at v   =   500   mm s , the resolution is significantly decreased.
In Figure 11b, the resolution perpendicular to the welding direction as a function of the current distance from the middle axis for two suitable Amplitudes in the experiments is displayed. One can observe that, with increasing distance, the resolution increases, as well. As a result, the amplitude should be chosen as small as possible, to achieve the highest spatial resolution in the area of interest.
In the following paragraph, the determination of the melt pool width is discussed. To determine the melt pool width, the change between the base material and the melt pool must be detected. This change is not necessarily accompanied by a change in the measured depth, which is why the change in signal intensity must be taken into account.
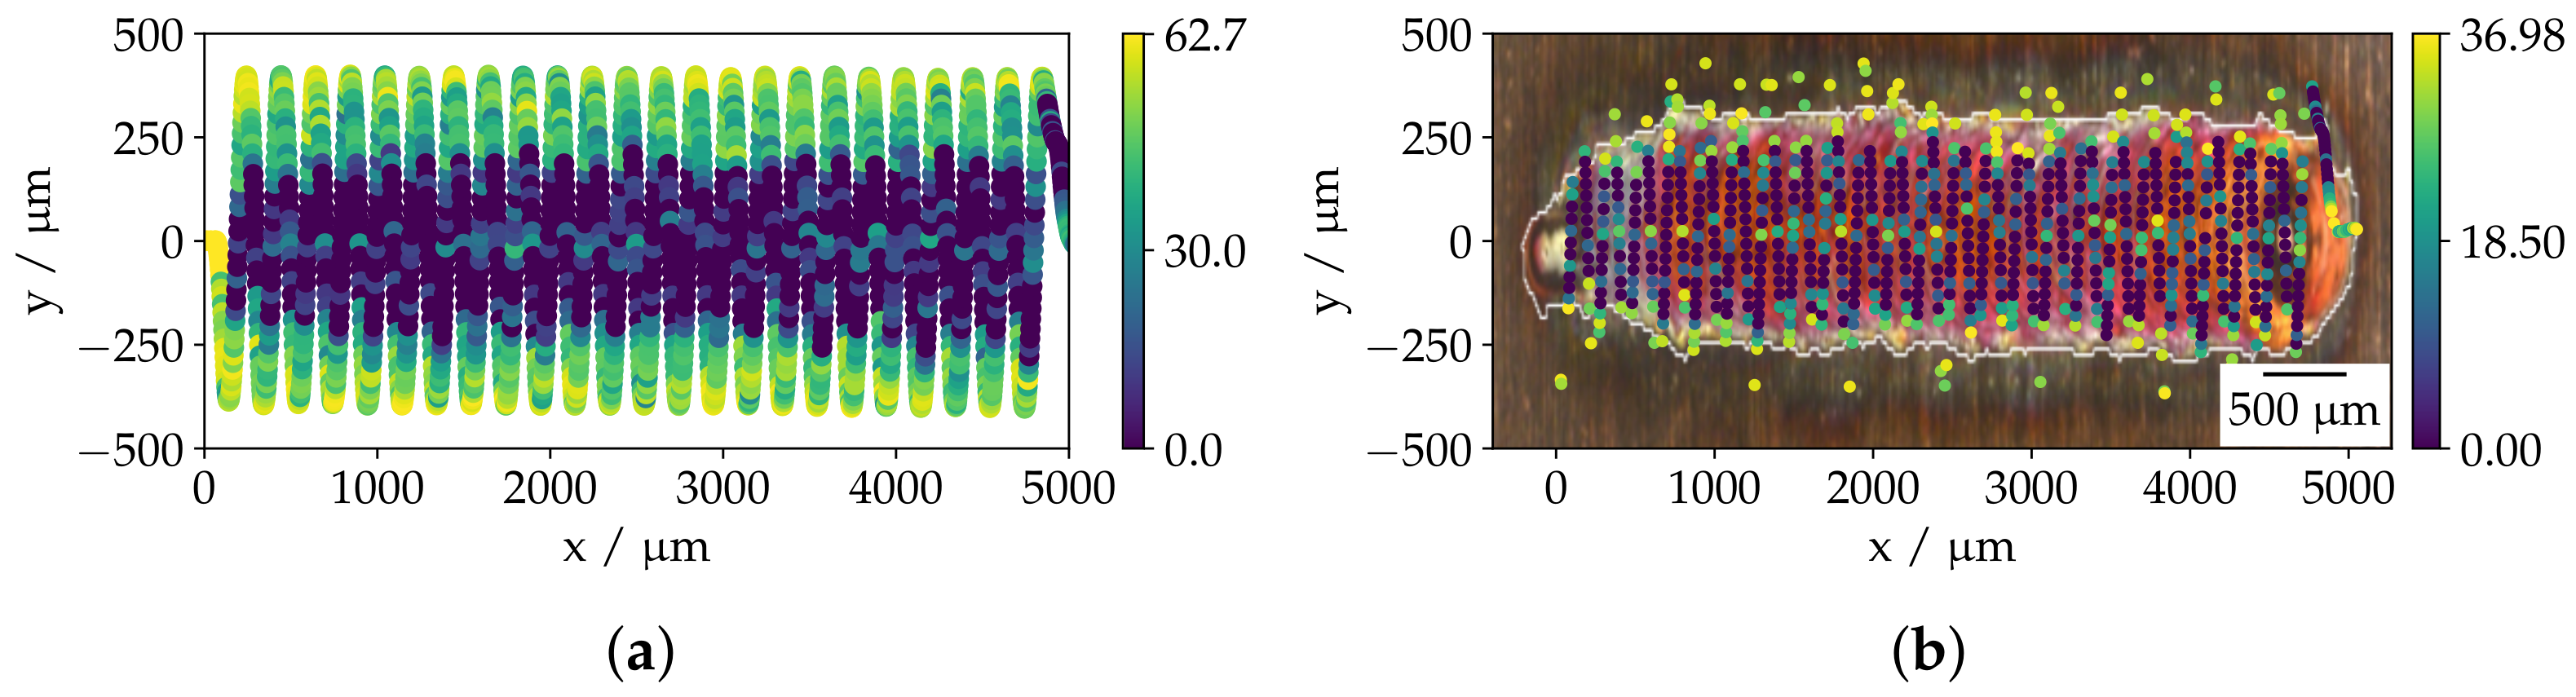
In Figure 12a, the scanned OCT beam path along the welding process is displayed in an x-y-plane for an exemplary experiment, where x defines the welding direction. The signal intensity in each measuring point is indicated by the color scale. When evaluating the signal intensity, one can observe that, at maximum distance to the center axis, the signal intensity is significantly higher than towards the symmetry axis. This is due to the sample reflecting the OCT beam without deflections. As soon as the beam is reflected at the molten surface, the signal intensity decreases due to a possible change in the reflective properties and the movement of the molten material.
Figure 12b shows an example weld in an x-y plane, where x defines the welding direction. The weld seam is overlaid with the corresponding OCT Signal intensity for the given path in Figure 10a. By applying a threshold value to the signal intensity, a good correlation between the weld seam width and the width, determined by thresholding then signal intensity, can be determined. However, some measuring points show the same signal intensity inside and outside the weld. This leads to the result that no clear edge can be defined. A possible explanation for this could be the melt pool dynamics during the process, as well as the fact that the comparison is only carried out on the static image of the weld seam after solidification of the material. An improvement of this result could possibly be achieved by adding another measurement information, such as the depth information.
In conclusion, by spacially modulating the OCT Beam perpendicular to the welding direction during the welding process, multiple information can be extracted from the OCT Signal. In the presented example, the weld seam width was determined by evaluation the positional information of the OCT beam, as well as the signal intensity. By applying a threshold value to the signal intensity, a good correlation was shown between the weld seam width and the signal width could be determined. However, no clear edge could be defined. This could possibly be improved by adding another measurement information, such as the depth information.

4. Conclusions

In this article, the applicability of using an Optical Coherence Tomography System for measuring the capillary depth in micro welding of copper using a green laser was presented. Using a focal diameter of 300 μ m and varying the welding speed from 250 mm s to 750 mm s , as well as the laser power from 1000 W to 3000 W , it was possible to achieve welding depth from 55 μ m up to 1070 μ m .
To determine the optimal position of the OCT measurement beam in relation to the laser beam origin, a method was presented in which the OCT beam position is altered during the welding process to measure the depth in multiple positions along the weld direction. With this method, it could be shown that the measuring position with the greatest depth and the highest signal intensity is trailing the laser beam. In addition, a dependency of the optimal measuring position on the process parameters could be shown. Whereas in heat conduction welding, the trailing distance is almost negligible, the trailing distance to be used increases with increasing laser power and welding speed.
By comparing the measured capillary depth and the welding depth determined in cross sections, a good correlation between both measured variables could be shown independently on the previously determined process regime and stability. By evaluating the percentage difference, it could be shown that no weld seam depth measurement is possible with heat conduction welding. For deep penetration welding, the percentage difference decreases with an increase in welding depth, making it feasible to determine the welding depth based on the capillary depth measurement. The absolute difference between the capillary and welding depth ranges from 22 μ m to 62 μ m for welding depth of 200 μ m to 600 μ m , as used in typical copper micro welding application.
Measuring the capillary depth during the welding process allows for a direct determination of the aspect ratio of the welding process. It could been shown that, for deep penetration, welding aspect ratios as low as 0.35 can be achieved, while, typically, aspect ratios substantially larger than one are the case using state-of-the-art fiber laser welding processes for copper micro welding. Welding with a shallow and wide capillary not only benefits the depth measurement with an OCT System but has also been shown stable regarding spatter occurrence. For heat conduction welding, a maximum aspect ratio of 0.16 was determined, resulting in the conclusion that a small melt pit must have been formed out prior to the change to deep penetration welding.
Using the the additional scanning system of the OCT System, multiple information about the welding process can be determined simultaneously. By superimposing the welding motion with a spatial movement perpendicular to the welding direction, additional information, like the capillary width, melt pool width, and approximations, about the capillary form might be determined. By thresholding the signal intensity, a good correlation between the OCT Signal and the weld seam width could be shown.

Author Contributions

Conceptualization, T.B.; methodology, T.B.; investigation, T.B.; writing—original draft preparation, T.B.; writing—review and editing, T.B., C.B., M.B., and J.P.B.; visualization, T.B. All authors have read and agreed to the published version of the manuscript.

Funding

This research received no external funding.

Institutional Review Board Statement

Not Applicable.

Informed Consent Statement

Not Applicable.

Data Availability Statement

Not Applicable.

Acknowledgments

The OCT system was provided by the company PT Photonic Tools GmbH (Björn Wedel). The sponsorship and support is gratefully acknowledged.

Conflicts of Interest

The authors declare no conflict of interest.

Abbreviations

The following abbreviations are used in this manuscript:
OCTOptical Coherence Tomography

References

  1. Kogel-Hollacher, M.; Schoenleber, T.B.; Strebel, R.M. Measurement and Closed-Loop Control of the Penetration Depth in Laser Materials Processing. In Proceedings of the 9th International Conference on Photonic Technologies, Furth, Germany, 19–22 September 2016. [Google Scholar]
  2. Boley, M.; Fetzer, F.; Weber, R.; Graf, T. Statistical evaluation method to determine the laser welding depth by optical coherence tomography. Opt. Lasers Eng. 2019, 119, 56–64. [Google Scholar] [CrossRef]
  3. Mittelstädt, C.; Mattulat, T.; Seefeld, T.; Kogel-Hollacher, M. Novel approach for weld depth determination using optical coherence tomography measurement in laser deep penetration welding of aluminum and steel. J. Laser Appl. 2019, 31, 022007. [Google Scholar] [CrossRef]
  4. Hollatz, S.; Hummel, M.; Jaklen, L.; Lipnicki, W.; Olowinsky, A.; Gillner, A. Processing of Keyhole Depth Measurement Data during Laser Beam Micro Welding. Proc. Inst. Mech. Eng. Part L J. Mater. Des. Appl. 2020, 234, 722–731. [Google Scholar] [CrossRef]
  5. Alter, L.; Heider, A.; Bergmann, J.P. Investigations on copper welding using a frequency-doubled disk laser and high welding speeds. Procedia CIRP 2018, 74, 12–16. [Google Scholar] [CrossRef]
  6. Engler, S.; Ramsayer, R.; Poprawe, R. Process Studies on Laser Welding of Copper with Brilliant Green and Infrared Lasers. Phys. Procedia 2011, 12, 339–346. [Google Scholar] [CrossRef]
  7. Berger, P.; Hügel, H.; Hess, A.; Weber, R.; Graf, T. Understanding of Humping Based on Conservation of Volume Flow. Phys. Procedia 2011, 12, 232–240. [Google Scholar] [CrossRef] [Green Version]
  8. Fabbro, R. Depth Dependence and Keyhole Stability at Threshold, for Different Laser Welding Regimes. Appl. Sci. 2020, 10, 1487. [Google Scholar] [CrossRef] [Green Version]
  9. Hügel, H.; Graf, T. Laser in der Fertigung; Vieweg + Teubner: Berlin/Heidelberg, Germany, 2009. [Google Scholar] [CrossRef]
Figure 1. Schematic illustration of the experimental setup; green beam: laser beam ( 515 nm), grey beam: imaging path (VIS ∌ 515 nm), light red beam: OCT beam ( 840 ).
Applsci 11 02655 g001
Figure 2. Exemplary weld seams to illustrate the criteria used for the assessment, as well as superimposed images of the high-speed-imaging, for determining the spatter occurrence in the laser process. (a1,a2) heat conduction welding ( P   =   1000   W , v   =   250   mm s ); (b1,b2) deep-penetration welding ( P   =   1500   W , v   =   250   mm s ); (c1,c2) deep-penetration welding with melt jet effects ( P   =   1750   W , v   =   750   mm s ), (d1,d2) deep-penetration welding with humping ( P   =   3000   W , v   =   750   mm s ).
Applsci 11 02655 g002
Figure 3. Mean welding depth ( n = 6 ) of welding copper with a green laser and a focal diameter of 300 μ m ; white: heat conduction welding, grey: deep penetration welding, cross pattern: increased spatter formation with spatter sizes > 100 μ m , dotted area: jet effect of the molten material, vertical lines: humping.
Applsci 11 02655 g003
Figure 4. Schematic illustration of the optical coherence tomography (OCT) beam position relative to the capillary and the laser beam origin, (a) OCT beam aligned with laser beam, insufficient depth measurement; (b) OCT beam shifted to the deepest point of the capillary, true capillary depth measurement; (c) OCT beam reflected on the capillary surface, depth measurement too deep.
Applsci 11 02655 g004
Figure 5. (a) Schematic illustration of the OCT beam movement during the welding process for determining the optimal lag distance of the OCT beam; (b) exemplary measurement result for determining the optimal lag distance.
Applsci 11 02655 g005
Figure 6. Optimal lag distances of the OCT beam relative to the the laser beam origin, depending on the process parameters.
Applsci 11 02655 g006
Figure 7. Mean welding and capillary depth ( n = 6 ); no outline: weld seam depth; with outline: capillary depth measurement, white: heat conduction welding, grey: deep penetration welding, cross pattern: increased spatter formation with spatter sizes > 100 ); no outline: weld seam depth; with outline: capillary depth measurement, white: heat conduction welding, grey: deep penetration welding, cross pattern: increased spatter formation with spatter sizes > 100 μ m , dotted area: jet effect of the molten material, vertical lines: humping.
Applsci 11 02655 g007
Figure 8. (a) Percentage difference between measured capillary depth and welding depth as function of the welding depth, white: heat conduction welding, grey: deep penetration welding; (b) absolute difference between measured capillary depth and welding depth.
Applsci 11 02655 g008
Figure 9. Comparison of the aspect ratios based on the capillary depth measurement ( n = 6 ) .
Applsci 11 02655 g009
Figure 10. (a) Weld seam image overlaid with a sinusoidal OCT beam movement path perpendicular to the welding process; (b) possible extractable process information when using the scanned OCT approach.
Applsci 11 02655 g010
Figure 11. (a) Resolution in welding direction as a function of the modulation frequency; (b) resolution perpendicular to the welding direction as a function of the distance from the middle axis.
Applsci 11 02655 g011
Figure 12. (a) OCT movement path and Intensity in an x-y-plane during a welding process; (b) weld seam image overlaid with corresponding OCT movement path and thresholded Intensity.
Applsci 11 02655 g012
Publisher’s Note: MDPI stays neutral with regard to jurisdictional claims in published maps and institutional affiliations.

