Abstract
(1) Background: The development of highly efficient methods for removing hazardous substances from the environment attracts increasing attention. Understanding the basic principles of the removal processes using graphene materials is equally essential to confirm their application efficiency and safety. (2) Methods: In this contribution, adsorption of pesticide dimethoate (DMT) on graphene-based materials has been investigated on the molecular level. (3) Results: The experimental results’ analysis revealed a cooperative binding mechanism of the DMT on the adsorption sites of investigated materials—graphene oxide (GO) and industrial graphene (IG). The adsorption data were analyzed using various adsorption isotherms to determine the thermodynamics of the adsorption process. The experimental results were correlated with Density Functional Theory (DFT) calculations of DMT adsorption on the model surfaces that appropriately describe the graphene materials’ reactive features. (4) Conclusions: Considering experimental results, calculated adsorption energies, optimized adsorption geometries, and electronic structure, it was proposed that the dispersive interactions determine the adsorption properties of DMT on plain graphene sites (physisorption). Additionally, it was shown that the existence of vacancy-type defect sites on the surfaces could induce strong and dissociative adsorption (chemisorption) of DMT.
1. Introduction
Organophosphates (OPs) are among the most toxic substances to humans ever known due to their ability to irreversibly inhibit enzyme acetylcholinesterase (AChE), which has a substantial role in the transmission of neuronal impulses by the cholinergic neurons, being present in both peripheral and central nervous system [1,2]. Despite well-known hazardous effects on human health, they persist in agriculture, mainly as pesticides. Recent studies have confirmed that extensive use of OPs induces drinking water contamination in various agricultural areas worldwide [3,4]. In this view, finding reliable methods for removing them from the environment is a matter of general interest. There is emerging research dealing with the various methods for their removal from contaminated water, including physicochemical methods (adsorption, electrochemical oxidation, and photocatalytic degradation) [5,6,7,8], chemical oxidation [9,10,11,12], and biological degradation [13,14,15,16]. Adsorption is particularly attractive for research and application, as it is simple to apply, economical, and environmentally friendly, since no additional toxic chemicals are used [17]. Hence, finding appropriate and efficient adsorbent materials represents the main challenge in this field.
Graphene-based materials have been extensively studied as adsorbents in past years [18,19] and have shown considerable effectiveness in removing organic and inorganic contaminants. In our recent paper [20], three graphene-type materials have been tested as adsorbents for OPs pesticides dimethoate (DMT) and chlorpyrifos (CPF). The spectroscopic analysis of graphene oxide (GO) and industrial graphene (IG) in this study includes Raman XRD, XPS (C 1s and O 1s spectra), and FTIR methods. IG has a high specific surface area (SSA), 600 m2 g−1, with a relatively small concentration of oxygen functional groups and effectively separated graphene layers. However, the aggregation of graphene sheets cannot be excluded. GO with SSA of 10 m2 g−1 has a highly disordered structure and low fraction of sp2 hybridized carbons due to a large concentration of different oxygen functional groups attached to its surface. Due to a large concentration of oxygen functional groups, this material is highly hydrophilic and easily dispersed in water with effectively separated sheets and the broadcast material. The XPS method confirmed a significant variation in the C/O ratio among the studied adsorbents and GO with almost 30 at% oxygen. The adsorbent, denoted as IG, contains approximately 6 at% oxygen and a largely preserved π electron system.
The extensive characterization of the material structure and adsorption efficiency revealed that relatively subtle differences in adsorbent structure (e.g., the distance between graphene sheets and surface concentration of defects) could bring vast differences in adsorption efficiency by a few orders of magnitude [21]. Such a result emphasizes a need for a deeper understanding of the adsorption properties and mechanism of adsorbent–adsorbate interaction to assure functionality and predict optimal adsorbent properties for the application. The involvement of theoretical chemistry methods and the development of reliable theoretical and empirical models to describe adsorption is crucial at this point of research [22,23,24].
This contribution aimed to elucidate the adsorption mechanism and analyze thermodynamical properties of the interaction between OP DMT and two types of commercial graphene surfaces, industrial graphene (IG) and graphene oxide (GO). Several adsorption isotherms [25], and the methods developed for the description of the interaction between macromolecules (graphene surfaces) and ligands (DMT) were applied [26] to better understand the formation of DMT–graphene composites and to estimate the cooperativity of the adsorbate binding. In parallel, a theoretical model of graphene-type surfaces based on density functional theory (DFT), which also took into account surface defects typically present on IG and GO, was established, and DMT adsorption energies on the prepared model surfaces were calculated. Finally, experimentally observed adsorption efficiency on two different adsorbents was discussed on the molecular level, in light of the results obtained from the experimental study and DFT model.
2. Materials and Methods
2.1. Chemicals
The commercially available Graphene Oxide Powder (GO) and Industrial-Quality Graphene (IG) were purchased by ACS Material, Pasadena, CA, USA. IG represents light black flakes, with thickness ≤ 3.0 nm and BET surface area near 600 m2g−1. GO is a grey–green powder with particle diameter between 1~15 μm, thickness 0.8~1.2 nm, and specific surface area 5–10 m2g−1 [27,28]. DMT (O,O-dimethyl S-[2-(methylamino)-2-oxoethyl] dithiophosphate) [29] was obtained by Pestanal, Sigma Aldrich, Denmark. The stock solution 1 × 10⁻¹ mol dm−3 solution was prepared in 10% ethanol (EtOH) and kept in the refrigerator before use. The working solutions were made by the dilution of the appropriate aliquot in doubly distilled water. The 3D DMT structure is presented in Figure 1.
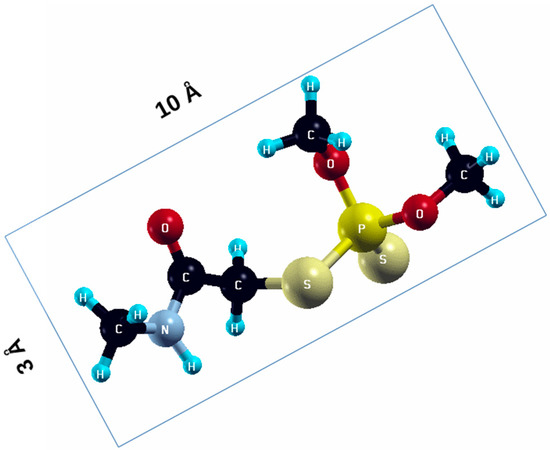
Figure 1.
3D structure of DMT. Horizontal and vertical lines represent the dimensions of the rectangular box used for estimation of the size of the adsorption site (Section 3.1.1). Color code: Carbon= black, sulfur = light yellow, phosphorus = yellow, oxygen = dark red, hydrogen = turquoise, nitrogen = grey.
2.2. Adsorption Studies
The desired amount of adsorbents (50–2000 mg dm−3) was dispersed in double distilled water before adding the appropriate aliquots of DMT. The vessels containing the adsorbent and DMT were placed on a laboratory shaker (Orbital Shaker—incubator ES-20, Grant—bio) and left overnight at 25 °C until the equilibrium was reached. The pH was around 6 (±0.2) in all the cases without the addition of any buffer. After equilibration, the mixtures were centrifuged for 10 min at 14,500 rpm, and the supernatant was filtered through a nylon filter membrane. The concentration of DMT was determined using UPLC analysis. The control experiments confirmed that there was no DMT degradation within the time of equilibration. The adsorption isotherms were constructed as the dependence of the DMT-free concentration on the adsorbent dose.
2.3. Apparatus
A Waters ACQUITY ultra-performance liquid chromatography (UPLC) system (Milford, MA, USA) coupled with a DAD detector controlled by the Empower software was used to determine DMT concentration in supernatant. Acetonitrile for liquid chromatography was purchased from J. T. Baker Phillipsburg, New Jersey, USA, (HPLC Quality); chromatographic separations for DMT determination were run on an ACQUITY UPLC™ BEH C18 column with the dimensions 1.7 μm, 100 × 2.1 mm (Waters). The isocratic conditions with the mobile phase consisting of 10% acetonitrile and 90% water (v/v) were applied with the eluent flow rate of 0.2 mL min−1 and the injection volume of 10 μL. Under the described conditions, the retention time was 1.73 ± 0.05 min.
2.4. Theoretical Calculations
DFT calculations were performed using periodic Pwscf code of Quantum ESPRESSO (QE) (v. 6.0) [30]. Employed ultrasoft pseudopotentials were based on GGA-PBE approximation for exchange-correlation functional [31]. Cutoff energy for plane waves was set to 40 Ry, while charge density cutoff was 600 Ry. The electronic convergence criterion was set to 10−6 eV. The vacuum between slabs was set to at least 25 Å to minimize interaction between periodic images. The relaxation was performed until the residual forces were below 0.005 eV Å−1. Van der Waals interactions were included through the DFT + D3 scheme of Grimme [32]. Graphene slab cells (3 × 3) and (6 × 6) consisted of 32 and 128 atoms, respectively. A sampling of k-points was performed using the Monkhorst–Pack scheme (4 × 4 × 1 k-points for 32-atom cell and 2 × 2 × 1 k-points for 128-atom cell) [33]. The isolated dimethoate molecule was optimized in a 50 × 50 × 50 Å3 cell, using only gamma k-point and Martyna–Tuckermann correction for isolated molecules, as implemented in QE [30]. Adsorption energy () was calculated from the difference between total energy of the graphene with adsorbed organophosphate (), and the sum of total energies of the empty graphene slab () and isolated organophosphate molecule ():
The electronic structure of bands was calculated using the projwfc.x code of QE, while the Bader [34] code was used to calculate charge transfer. Molecular structures are visualized using XCrysDen software (v.1.6.2) [35].
3. Results
3.1. Dimethoate Interaction with IG and GO Surfaces
3.1.1. Hill and Scatchard Analysis
Several experiments were performed to elucidate the reaction mechanism of DMT interaction with IG and GO surfaces. Here, we used the approximation of the bimolecular interaction between biological macromolecules and the ligand, considering DMT as the ligand and adsorbents as macromolecules (receptors) with several binding sites [36,37]. The DMT molecule was regarded as the box with the dimensions 10 × 3 × 3 nm. Its flat position on graphene surfaces was considered the energetically preferred orientation on the covers, as confirmed by DFT calculations (Section 3.2.1). The theoretical maximal concentration of binding sites (BS) for DMT on macromolecules () corresponds to the complete monolayer covering with the ligand and is expressed as the molar concentration of BS per g of graphene material. It was calculated from the specific surface of the adsorbent [27,28] and estimated the maximal surface of a single DMT binding site according to Equation (2):
Here, represents the specific surface of the graphene material obtained by the producer [38,39], —maximal estimated surface of a single adsorption site (10 × 3 Å for a DMT molecule in the flat orientation), —mass concentration of graphene in g dm−3, and is the Avogadro number. Using Equation (2), the calculated values of for GO and IG are 300 mol g−1 and 2.4 × 10⁴ mol g−1, respectively.
The first set of experiments in a water suspension of IG and GO was performed by keeping DMT concentration fixed (5 × 10⁻⁴ mol dm−3) at 25 °C and pH 6, while the surfactant concentration varied in the range from 0.05–2 g dm−3. In the second series of experiments, adsorbent concentrations were constant (0.25 and 2 g dm−3), and the adsorption of DMT was dependent on its concentration in the mixture. In all cases, the water solutions were stirred for 24 h to achieve equilibrium in the homogeneous suspension. The equilibrium-free pesticide concentration was measured from the supernatant after separation of adsorbent by centrifugation and filtration. Finally, the concentration of adsorbed DMT was calculated as the difference between the initial and equilibrium values.
The results presented in Figure 2 indicate that sigmoid-shaped dependences of adsorbed DMT on its equilibrium concentration were obtained in all cases. This reaction mechanism can be described by Hill and Scatchard models [26,40,41,42], which provide information about the type of the ligand–macromolecule interaction and discriminates between the random and cooperative process of DMT binding mode on a graphene surface. Moreover, these models enable us to determine if there was an interaction between the BS where the ligands’ subsequent binding depended on the BS number. Experimental values were fitted with Equation (3):
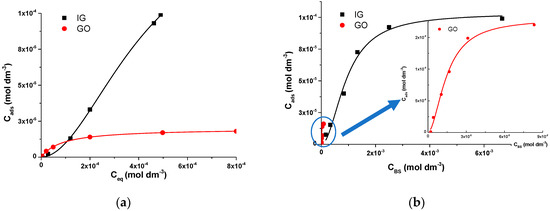
Figure 2.
(a) Dependence of adsorbed on equilibrium DMT concentration on 2 g dm−3 IG and GO; (b) dependence of adsorbed DMT concentration on IG and GO (inset) binding sites () in the suspension containing 5 × 10⁻⁴ mol dm−3 DMT after equilibration at 25 °C.
Here, is the concentration of bounded DMT molecules on the active sites of a receptor, i.e., the occupied BS, is yielding to the maximal number of occupied BS, is the free concentration of adsorbate, which is in equilibrium with bound ligands, is the apparent microscopic dissociation constant of adsorbent–adsorbate composite, and is the Hill coefficient describing cooperativity of ligand–macromolecule interaction. The results were analyzed in parallel by applying the Scatchard model to study the binding mode and estimate the binding parameters according to Equation (4) and Equation (5):
In the case of random binding, Equation (4) should be the straight line, since cooperative binding results in a humped curve, which rises to a maximum and then declines to 0 with the intercept at x-axis equal to , i.e., the total concentration of occupied BS per mol of the macromolecule surface. Equation (5) represents the modified Hill plot [36,37]. Here, is the ligand–macromolecule association constant. As the example, Figure 3 represents the Equations (4) and (5) for DMT adsorption on 2 g dm−3 IG and 0.25 g dm−3 GO surfaces.
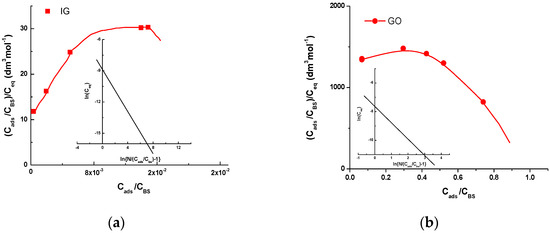
Figure 3.
Scatchard plots (Equation (4)) for DMT interaction with (a) 2 g dm−3 IG and (b) 0.25 g dm−3 GO. Inset: Hill plots (Equation (5)).
It is worth noticing that Equation (4) represents the humped curve for all experiments, which is characteristic of cooperative binding. Moreover, Equation (5) is sensitive to , and its linearity was tested for selected values obtained from the end point of adsorption curves, which indicate DMT concentration bound per mol of IG or GO binding sites. The mean values of the obtained parameters of reaction mechanism obtained from the performed experiments are given in Table 1.

Table 1.
Maximal DMT concentration per g of adsorbents (), apparent dissociation and adsorption constants of DMT–adsorbent composite (, ), Hill coefficient () and number of occupied binding sites as mol BS per g of adsorbents () for DMT binding on IG and GO surfaces.
3.1.2. Adsorption Isotherms and Standard Gibbs Free Energy
For the proper understanding and interpretation of the adsorption process on selected surfaces, the equilibrium of adsorption of DMT on 0.25 and 2 g dm−3 graphene adsorbents was evaluated using Langmuir, Liu, and Dubinin-Raduskievich (DR) isotherm models [17,25]. The following equations (Equations (6)–(8)) were applied to the experimental data presented as points in Figure 4:
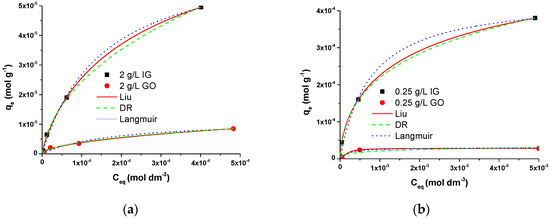
Figure 4.
Experimental data (points) for (a) 2 g dm−3 and (b) 0.25 g dm−3 IG and GO fitted with Langmuir (blue), Liu (red), and Dubinin–Raduschevich (green) adsorption isotherms.
Here, represents adsorption capacity (), /, is the equilibrium concentration of adsorbate, is the saturation concentration of dimethoate in water (for diluted solutions / << 1), is the universal gas constant, is temperature, and , , and are parameters obtained from fitting using equations in Equations (6)–(8). , , and represent Langmuir, Liu, and Dubinin–Radushkevich isotherm constants, respectively, related to adsorption’s energy. The experimental results were fitted to the above-listed adsorption models and are presented in Figure 4 as lines. The high values of the correlation coefficient suggest that the values calculated for both adsorbents are reliable.
The thermodynamic parameters of adsorption were evaluated using and constants, as reported previously [43]. Gibbs free energy of adsorption (Δ) was calculated according to the equation proposed by Zhou [44]:
In water solutions, represents the standard activity of water (55.5 mol dm−3). DR isotherm equation parameter was used to calculate the mean adsorption energy (absolute value) according to the relation [45,46,47]:
The mean values of isotherm parameters and energy calculated from these parameters are listed in Table 2. A satisfactory agreement was achieved by various models, suggesting the monolayer adsorption on the energetically homogeneous surface [25].

Table 2.
Mean values of fitting parameters of Langmuir, Liu, and Dubinin–Raduschevich models for two datasets with a constant graphene concentration (0.25 and 2 g dm−3).
All three quantities—Δ (from Langmuir and Liu models), (from DFT calculations), and (from DR model) in general describe the strength of surface/adsorbate interaction. Obtained negative Δ values of adsorption in all investigated cases confirm that adsorption at 298 K is exothermic. Moreover, Δ values from Langmuir and Liu isotherms are in good agreement with DFT calculated values of adsorption energy (Section 3.2.1, Table 3). Additionally, from DR isotherm is considerably lower compared to DFT calculated . The latter comparison with DR isotherm, however, should be taken with reserve, as is not the exact thermodynamic quantity, but rather a parameter related to adsorption strength.

Table 3.
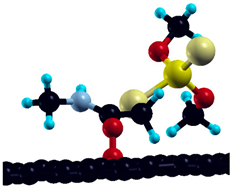
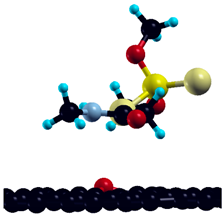
Initial (input) and final (optimized) DMT adsorption geometries, optimized adsorption energies () on pristine graphene, and surface-to-adsorbate charge transfer in electrons, per molecule (CT to DMT).
In the independent experiment, 0.250 mg/mL GO was used for adsorption of 5 × 10⁻⁴ mol dm−3 DMT as the model system to assess the temperature effect on the adsorption process. A slight increase of sorbed DMT concentration (5.90 × 10⁻⁶ mol dm−3, 6.53 × 10⁻⁶ mol dm−3, and 7.98 × 10⁻⁶ mol dm−3 at 298, 303, and 308 K, respectively) was observed. It is worth noticing that DMT adsorption’s temperature effects some similar commercial graphene materials (SM GO and GNA GO), indicating the same temperature-dependent trend (to be published). This behavior is characteristic for chemical adsorption due to the high energy of activation when the extent of adsorption rate increases initially and could decrease as the temperature increased further.
3.2. DFT Prediction of Dimethoate Adsorption
3.2.1. DMT Adsorption on Pristine Graphene
DFT calculations of adsorption energy and electronic structure were performed to confirm previous findings and provide a deeper insight into the adsorption process on the molecular level. The surface model was built to adequately describe the surface features of both IG and GO that could be of potential interest for their interaction with the DMT molecule. Several defect model surfaces—the Stone–Wales defect, N-defect, oxydefect, and monovacancy defect were considered along with adsorption on pristine graphene.
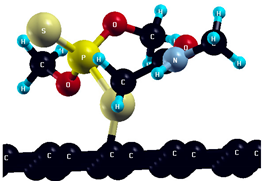
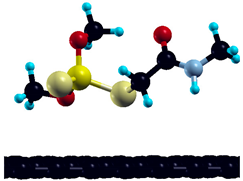
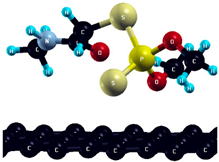
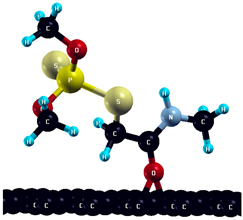
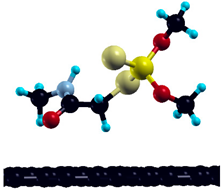
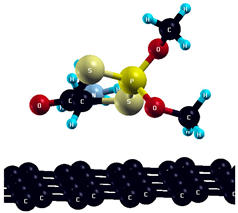
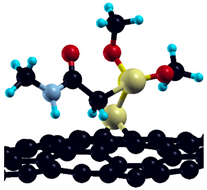
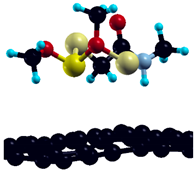
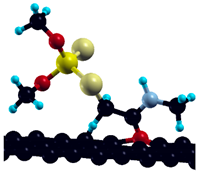
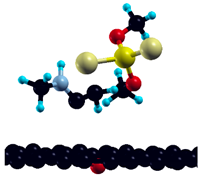
Adsorption on pristine graphene in a 6 × 6 graphene supercell was investigated in two initial adsorption geometries for DMT: S-binding and O-binding. Both initial geometries and corresponding optimized (final) geometries are depicted in Table 3. Adsorption energies, calculated for optimized geometries of DMT, are also presented in Table 3, along with the total calculated transfer of electrons from surface to adsorbate.
Obtained adsorption energies corroborate the experimental findings—that dimethoate binding on graphene is thermodynamically favorable, most likely due to physisorption. Moreover, higher adsorption strength in a smaller (3 × 3) supercell implies that the adsorption energy depends on the surface coverage in the investigated range.
Despite negative adsorption energies, optimized geometries are characterized by remarkably large closest substrate-to-adsorbate distances (2–3 Å), independently of the input geometry, and quite a small charge transfer—not exceeding 0.01 electron per adsorbate molecule. These results point to the dispersive interactions included in this model indirectly, through Van der Waals corrections, as the main factor determining DMT adsorption on pristine graphene. The total electronic density of states (DOS) of pristine graphene, and graphene with adsorbed DMT in preferential adsorption geometry, is represented in Figure 5.
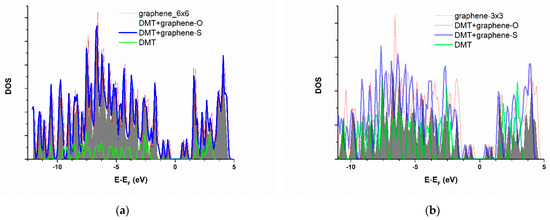
Figure 5.
Total electronic density of states (DOS) of pristine graphene, compared to the graphene with adsorbed DMT, for (a) 6 × 6 supercell and (b) 3 × 3 supercell. Fermi level is taken as energy zero. Grey surface—isolated DMT, red line—pristine graphene, blue line—graphene with adsorbed dimethoate.
This graph represents the energy distribution of electronic density—every peak, in essence, represents an electronic energy band. In this manner, the possible chemical bond formation would be reflected through novel bands’ appearance upon adsorption. Simultaneously, the downshift of bands on the graph would point to the system’s energy stabilization. As evident from Figure 5, in the case of a 6 × 6 graphene supercell, there is no significant modification of graphene band structure upon adsorption of dimethoate. On the other hand, in the case of a 3 × 3 supercell, there is some peak intensity increase and broadening of bands between −1 and −5 eV vs. Fermi level (more obvious compared to 6 × 6 due to the smaller cell size). Still, none of these changes undoubtedly point to some chemical interaction between surface and adsorbate.
3.2.2. Adsorption of DMT on Defect Graphene Surfaces
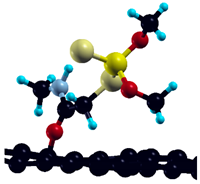
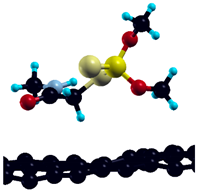
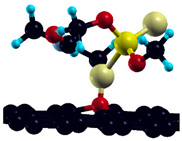
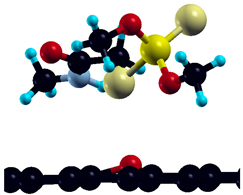
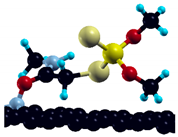
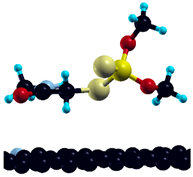
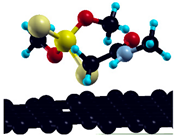
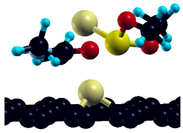
After adsorption on pristine graphene, the investigation is expanded to four defect graphene model surfaces, in a 3 × 3 graphene supercell—Stone–Walles (SW) defect, N-defect, oxydefect, and monovacancy (MV) defect (Figure 6). As mentioned in the previous section, these surface models are designed to represent the most representative surface features expected on the graphene surface and predict possible causes of altered reactivity of the investigated surfaces compared to pristine graphene. It should be emphasized that the structure of real (particularly oxygen-containing) surface groups may be considerably different from the oxydefect model (hydroxyl groups, carboxyl groups, etc.). However, it is expected that the model accurately describes at least the trends in the adsorption reactivity when oxygen is introduced. Similarly, the monovacancy defect is present on both IG and GO in a small amount (for example, on unsaturated edges). Still, it exhibits significant theoretical importance, since its increased reactivity might trigger considerable chemical changes in the system [48]. Optimized adsorption geometries of DMT on investigated surfaces, together with and charge transfer, are given in Table 4.
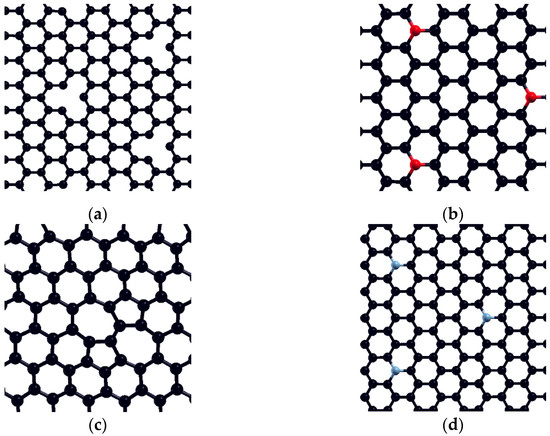
Figure 6.
Investigated defect model surfaces (3 × 3 graphene supercell): (a) monovacancy (MV) defect, (b) oxydefect, (c) SW defect, and (d) N-defect (carbon = black, oxygen = red, nitrogen = grey).

Table 4.
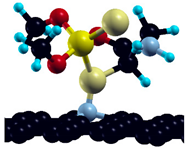
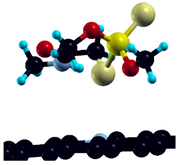
Adsorption energies () and surface-to-adsorbate charge transfer (CT) (e−) of DMT adsorption on graphene model surfaces. Optimized adsorption geometries are depicted.
As observed from the obtained results, adsorbate behavior and reactivity on defect model surfaces—SW, oxydefect, and N-defect—is similar to the one on pristine graphene, at least because of adsorption energetics and surface-to-adsorbate distance. Adsorption energy values are close to pristine graphene in 3 × 3 cell. Additionally, the formation of a particular chemical bond between the surface oxygen and DMT has not been detected. There was no charge transfer exceeding 0.012 e, and the PDOS structure changes (Figure S1, Supplementary material) are not likely to originate from chemical changes. However, in the case of the MV defect, geometry optimization results in dimethoate dissociation, pointing to the substantially different MV defect reactivity compared to other investigated surfaces (Table 4). The dissociation represents a chemical change, where DMT oxygen or sulfur atoms (depending on the input geometry) are incorporated into the vacant site of the graphene structure. This process resulted in the overall stabilization of the system by 2.35 eV in case of O-binding, and 2.43 eV in case of S-binding geometry (Equation (1), Table 4). As observed, the dissociation process is more complex than simple non-dissociative chemisorption, electron transfer was not calculated for the case of MV defect, while “adsorption energy” rather refers to “stabilization energy”, denoted by “≈” sign in Table 4. Figure 7 represents the DOS structure of graphene with the MV defect, before and after adsorption of DMT. Widening of DOS peaks is obvious, particularly for the peaks from the Fermi level to about −2.5 eV. Particularly, the appearance of a DOS minimum at the Fermi level represents the evidence of system stabilization upon dimethoate adsorption on MV-defect surface.
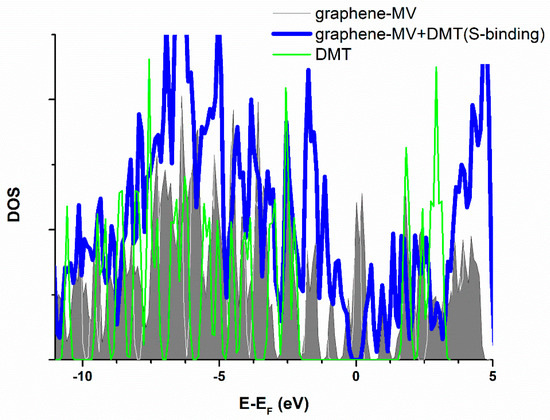
Figure 7.
Total electronic densities of states (DOS) of monovacancy (MV) defect graphene compared to the graphene with adsorbed DMT. Grey surface—isolated DMT, red line—pristine graphene, blue line—graphene with adsorbed dimethoate. Fermi level is taken as energy zero.
Based on the overall results of DFT calculations, a conclusion can be drawn that the intrinsic affinity of graphene towards adsorption of dimethoate is not influenced by the introduction of any among the investigated surface defects, except the MV defect, which induces dimethoate dissociation.
4. Discussion
The experimental studies of DMT interaction with selected graphenes suggest that adsorbate binding is a cooperative process. The positive, cooperative binding is confirmed by Hill and Scatchard analysis of binding curves, which exert the characteristic sigmoid shape and Hill coefficient close to 2. This behavior indicates that once one ligand molecule is bound to the macromolecule, its affinity for other ligand molecules increases. It is also found previously by applying the same models on some dye nanoparticles composites [36,37]. According to values, the interaction between DMT and GO surface yields a more stable associate. However, the maximum amount of adsorbed DMT per gram of adsorbate is higher for IG. This finding is to some extent corroborated by slightly larger Gibbs free energies (within the level of estimated uncertainty values) of adsorption obtained for GO, compared to IG. However, except for these indications, there is still no exact proof that GO is an intrinsically better adsorbent than IG.
Moreover, DMT adsorption on both GO and IG surfaces is an exothermic process, with the Gibbs free energy of adsorption in the approximate range of −10 to −30 kJ mol−1. Similar and Δ values were obtained for both Langmuir and Liu models, and these values correspond to physisorption rather than chemisorption. The results are also well fitted with DR isotherm equation, confirming that physisorption with a specific distribution of energies might occur.
The results of DFT model, in general, corroborate the experimental findings that physisorption mainly occurs. Based on the obtained results, efficient DMT adsorption on graphene is likely to originate from (1) dispersive interactions between surface and adsorbate and (2) chemical binding and dissociation on the unsaturated vacancy-type defects and edges (if any). Namely, adsorption of DMT on graphene can be significantly influenced by the introduction of vacancy-type defects. Thus, the structure of surface defects can decide between the chemical and physical nature of the adsorption. However, it should be kept in mind that such reactive vacancy-type defects are unstable in aqueous media and are easily oxidized by any oxygen species present in the solution [49,50]. Corresponding oxydefect and N-defect models, describing such oxidized (and nitrogen-saturated) features on the surface, exhibited considerably lower reactivity in adsorption, similar to pristine graphene reactivity.
Obtained results generally point to the fact that, despite some structural differences, the adsorption process of DMT on both IG and GO surfaces is determined by the same principles. The surface area of the adsorbent mainly determines the adsorption efficiency. Additionally, this study represents a successful step forward in ab initio modeling of adsorption of large adsorbates on carbonaceous materials. Obtained findings represent a basis for further development in this field: introducing more complex surface models, building the semiempirical models, evaluating the effects of solvent, etc.
5. Conclusions
A detailed experimental and theoretical analysis of DMT adsorption on two types of graphene surface—IG and GO—gives insight into the fundamental adsorption principles on the level of molecular interactions. Hill and Scatchard analysis pointed to the fact that the DMT binding on investigated surfaces is cooperative—binding of multiple molecules on the surface is facilitated. The evaluation of thermodynamical parameters using the Langmuir, Liu, and Dubnin–Radustciewitch isotherm model revealed that the adsorption is exothermic, and average adsorption strength corresponds to physisorption rather than chemisorption. DFT calculations of DMT adsorption on the graphene model confirmed that the adsorption process is thermodynamically favorable on pristine graphene and investigated defect model surfaces, with adsorption energies of an order of magnitude 0.5–1 eV per DMT molecule. Moreover, when the adsorption surface is flat, without electronic defects, adsorption is mainly determined by Van-der-Waals forces (physisorption). In contrast, if the unsaturated vacancy-type defects are present, adsorption energy increases significantly (chemisorption).
Supplementary Materials
The following are available online at https://www.mdpi.com/article/10.3390/app11094014/s1, Figure S1: Total electronic densities of states (DOS) of SW defect graphene, oxydefect graphene, N-defect graphene and monovacancy defect graphene compared to the pristine graphene with adsorbed DMT.
Author Contributions
Conceptualization: D.D.V.A.; methodology: V.J.A., T.D.L.-P., and D.D.V.A.; validation: V.M.V. and D.D.V.A.; formal analysis: V.J.A., T.D.L.-P., and D.D.V.A.; investigation: V.J.A., T.D.L.-P., and D.D.V.A.; resources: T.D.L.-P. and D.D.V.A.; data curation: T.D.L.-P. and D.D.V.A.; writing—original draft preparation: V.M.V. and D.D.V.A.; writing—review and editing: D.D.V.A.; visualization: V.J.A., T.D.L.-P., and D.D.V.A.; supervision: V.M.V.; project administration: D.D.V.A.; funding acquisition: D.D.V.A. All authors have read and agreed to the published version of the manuscript.
Funding
The research was funded by the Ministry of Education, Science, and Technological Development of the Republic of Serbia, Grant No. 451-03-9/2021-14/200017.
Institutional Review Board Statement
Not applicable.
Informed Consent Statement
Not applicable.
Data Availability Statement
The data used to support the findings of this study are available from the correspondence authors upon request.
Conflicts of Interest
The authors declare no conflict of interest.
References
- Colovic, M.B.; Krstic, D.Z.; Lazarevic-Pasti, T.D.; Bondzic, A.M.; Vasic, V.M. Acetylcholinesterase inhibitors: Pharmacology and toxicology. Curr. Neuropharmacol. 2013, 11, 315–335. [Google Scholar] [CrossRef] [PubMed]
- Anićijević, V.; Lazarević-Pašti, T.; Vasić-Anićijević, D.; Karkalić, R. Esters of organophosphorus acids: Toxicity, application and removal from the environment. Sci. Tech. Rev. 2019, 69, 15–29. [Google Scholar] [CrossRef]
- Ali, N.; Kalsoom; Khan, S.; Ihsanullah; Rahman, I.u.; Muhammad, S. Human Health Risk Assessment Through Consumption of Organophosphate Pesticide-Contaminated Water of Peshawar Basin, Pakistan. Expos. Health 2017, 10, 259–272. [Google Scholar] [CrossRef]
- Triassi, M.; Nardone, A.; Giovinetti, M.C.; De Rosa, E.; Canzanella, S.; Sarnacchiaro, P.; Montuori, P. Ecological risk and estimates of organophosphate pesticides loads into the Central Mediterranean Sea from Volturno River, the river of the “Land of Fires” area, southern Italy. Sci. Total Environ. 2019, 678, 741–754. [Google Scholar] [CrossRef]
- Savic, J.Z.; Petrovic, S.; Leskovac, A.R.; Lazarevic-Pasti, T.D.; Nastasijevic, B.J.; Tanovic, B.B.; Gasic, S.M.; Vasic, V.M. UV-C light irradiation enhances toxic effects of chlorpyrifos and its formulations. Food Chem. 2019, 271, 469–478. [Google Scholar] [CrossRef] [PubMed]
- Dyguda-Kazimierowicz, E.; Roszak, S.; Sokalski, W.A. Alkaline hydrolysis of organophosphorus pesticides: The dependence of the reaction mechanism on the incoming group conformation. J. Phys. Chem. B 2014, 118, 7277–7289. [Google Scholar] [CrossRef]
- Murillo, R.; Sarasa, J.; Lanao, M.; Ovelleiro, J.L. Degradation of chlorpyriphos in water by advanced oxidation processes. Water Supply 2010, 10, 1–6. [Google Scholar] [CrossRef]
- Wu, T.; Jans, U. Nucleophilic substitution reactions of chlorpyrifos-methyl with sulfur species. Environ. Sci. Technol. 2006, 40, 784–790. [Google Scholar] [CrossRef]
- Derbalah, A.S.; Nakatani, N.; Sakugawa, H. Photocatalytic removal of fenitrothion in pure and natural waters by photo-Fenton reaction. Chemosphere 2004, 57, 635–644. [Google Scholar] [CrossRef]
- Hirahara, Y.; Ueno, H.; Nakamuro, K. Aqueous photodegradation of fenthion by ultraviolet B irradiation: Contribution of singlet oxygen in photodegradation and photochemical hydrolysis. Water Res. 2003, 37, 468–476. [Google Scholar] [CrossRef]
- Konstantinou, I.K.; Albanis, T.A. Photocatalytic transformation of pesticides in aqueous titanium dioxide suspensions using artificial and solar light: Intermediates and degradation pathways. Appl. Catal. B Environ. 2003, 42, 319–335. [Google Scholar] [CrossRef]
- Wu, J.; Lan, C.; Chan, G.Y.S. Organophosphorus pesticide ozonation and formation of oxon intermediates. Chemosphere 2009, 76, 1308–1314. [Google Scholar] [CrossRef]
- Lazarević-Pašti, T.; Čolović, M.; Savić, J.; Momić, T.; Vasić, V. Oxidation of diazinon and malathion by myeloperoxidase. Pestic. Biochem. Physiol. 2011, 100, 140–144. [Google Scholar] [CrossRef]
- Ragnarsdottir, K.V. Environmental fate and toxicology of organophosphate pesticides. J. Geolog. Soc. 2000, 157, 859–876. [Google Scholar] [CrossRef]
- Raushel, F.M. Bacterial detoxification of organophosphate nerve agents. Curr. Opin. Microbiol. 2002, 5, 288–295. [Google Scholar] [CrossRef]
- Singh, B.K.; Walker, A. Microbial degradation of organophosphorus compounds. FEMS Microbiol. Rev. 2006, 30, 428–471. [Google Scholar] [CrossRef]
- Liu, G.; Li, L.; Huang, X.; Zheng, S.; Xu, X.; Liu, Z.; Zhang, Y.; Wang, J.; Lin, H.; Xu, D. Adsorption and removal of organophosphorus pesticides from environmental water and soil samples by using magnetic multi-walled carbon nanotubes@ organic framework ZIF-8. J. Mater. Sci. 2018, 53, 10772–10783. [Google Scholar] [CrossRef]
- Kyzas, G.Z.; Deliyanni, E.A.; Bikiaris, D.N.; Mitropoulos, A.C. Graphene composites as dye adsorbents. Chem. Eng. Res. Des. 2018, 129, 75–88. [Google Scholar] [CrossRef]
- Gusain, R.; Kumar, N.; Ray, S.S. Recent advances in carbon nanomaterial-based adsorbents for water purification. Coord. Chem. Rev. 2020, 405, 213111. [Google Scholar] [CrossRef]
- Lazarevic-Pasti, T.; Anicijevic, V.; Baljozovic, M.; Anicijevic Vasic, D.; Gutic, S.; Vasic, V.; Skorodumova, N.V.; Pasti, I.A. The impact of the structure of graphene-based materials on the removal of organophosphorus pesticides from water. Environ. Sci. Nano. 2018, 5, 1482–1494. [Google Scholar] [CrossRef]
- Araujo, P.T.; Terrones, M.; Dresselhaus, M.S. Defects and impurities in graphene-like materials. Mater. Today 2012, 15, 98–109. [Google Scholar] [CrossRef]
- Wang, H.; Hu, B.; Gao, Z.; Zhang, F.; Wang, J. Emerging role of graphene oxide as sorbent for pesticides adsorption: Experimental observations analyzed by molecular modeling. J. Mater. Sci. Technol. 2020, 63, 192–202. [Google Scholar] [CrossRef]
- Yadav, S.; Goel, N.; Kumar, V.; Singhal, S. Graphene oxide as proficient adsorbent for the removal of harmful pesticides: Comprehensive experimental cum DFT investigations. Anal. Chem. Lett. 2019, 9, 291–310. [Google Scholar] [CrossRef]
- Vasić Anićijević, D.V. Computational Modelling of Organophosphorus Pesticides—Density Functional Theory Calculations. In Organophosphate Pesticides; Marquis, F., Ed.; Nova Science Publishers, Inc.: New York, NY, USA, 2020; pp. 75–97. [Google Scholar]
- Ayawei, N.; Ebelegi, A.N.; Wankasi, D. Modelling and interpretation of adsorption isotherms. J. Chem. 2017, 3039817. [Google Scholar] [CrossRef]
- Gesztelyi, R.; Zsuga, J.; Kemeny-Beke, A.; Varga, B.; Juhasz, B.; Tosaki, A. The Hill equation and the origin of quantitative pharmacology. Arch. Hist. Exact Sci. 2012, 66, 427–438. [Google Scholar] [CrossRef]
- Available online: https://www.acsmaterial.com/graphene-oxide-s-method.html (accessed on 29 September 2020).
- Available online: https://www.acsmaterial.com/single-layer-graphene.html (accessed on 29 September 2020).
- Available online: https://pubchem.ncbi.nlm.nih.gov/compound/dimethoate (accessed on 29 September 2020).
- Giannozzi, P.; Baroni, S.; Bonini, N.; Calandra, M.; Car, R.; Cavazzoni, C.; Ceresoli, D.; Chiarotti, G.L.; Cococcioni, M.; Dabo, I.; et al. Quantum Espresso: A modular and open-source software project for quantum simulations of materials. J. Phys. Condens. Matter 2009, 21, 395502. [Google Scholar] [CrossRef]
- Perdew, J.P.; Burke, K.; Ernzerhof, M. Generalized gradient approximation made simple. Phys. Rev. Lett. 1996, 77, 3865. [Google Scholar] [CrossRef]
- Grimme, S. Semiempirical GGA-type density functional constructed with a long-range dispersion correction. J. Comput. Chem. 2006, 27, 1787–1799. [Google Scholar] [CrossRef]
- Monkhorst, H.J.; Pack, J.D. Special points for Brillouin-zone integrations. Phys. Rev. B 1976, 13, 5188–5192. [Google Scholar] [CrossRef]
- Bader, R.F.W.; Popelier, P.L.A.; Keith, T.A. Theoretical definition of a functional group and the molecular orbital paradigm. Int. J. Quantum Chem. 1994, 33, 620–631. [Google Scholar] [CrossRef]
- Kokalj, A. XCrySDen—A new program for displaying crystalline structures and electron densities. J. Mol. GraphModell. 1999, 17, 176–179. [Google Scholar] [CrossRef]
- Görner, H.; Chibisov, A.K.; Slavnova, T.D. Kinetics of J-aggregation of cyanine dyes in the presence of gelatin. J. Phys. Chem. B 2006, 110, 3917–3923. [Google Scholar] [CrossRef]
- Laban, B.; Zeković, I.; Vasić Anićijević, D.; Marković, M.; Vodnik, V.; Luce, M.; Cricenti, A.; Dramićanin, M.; Vasić, V. Mechanism of 3,3′-disulfopropyl-5,5′-dichlorothiacyanine anion interaction with citrate-capped silver nanoparticles: Adsorption and J-aggregation. J. Phys. Chem. C 2016, 120, 18066–18074. [Google Scholar] [CrossRef]
- Rasmussen, J.J.; Wiberg-Larsen, P.; Baattrup-Pedersen, A.; Cedergreen, N.; McKnight, U.S.; Kreuger, J.; Jacobsen, D.; Kristensen, E.A.; Friberg, N. The legacy of pesticide pollution: An overlooked factor in current risk assessments of freshwater systems. Water Res. 2015, 84, 25–32. [Google Scholar] [CrossRef]
- Wang, X.; Xing, H.; Jiang, Y.; Wu, H.; Sun, G.; Xu, Q.; Xu, S. Accumulation, histopathological effects and response of biochemical markers in the spleens and head kidneys of common carp exposed to atrazine and chlorpyrifos. Food Chem. Toxicol. 2013, 62, 148–158. [Google Scholar] [CrossRef]
- Goutelle, S.; Maurin, M.; Rougier, F.; Barbaut, X.; Bourgignon, L.; Ducher, M.; Maire, P. The Hill equation: A review of its capabilities in pharmacological modelling. Fund Clin Pharmacol. 2008, 22, 633–648. [Google Scholar] [CrossRef]
- Colquhoun, D. The quantitative analysis of drug–receptor interactions: A short history. Trends Pharmacol. Sci. 2006, 27, 149–157. [Google Scholar] [CrossRef] [PubMed]
- Scatchard, G. The attractions of proteins for small molecules and ions. Ann. N. Y. Acad. Sci. 1949, 51, 660–672. [Google Scholar] [CrossRef]
- Ghosal, P.; Gupta, A. Determination of thermodynamic parameters from Langmuir isotherm constant-revisited. J. Mol. Liq. 2017, 225, 137–146. [Google Scholar] [CrossRef]
- Zhou, X.; Zhou, X. The unit problem in the thermodynamic calculation of adsorption using the Langmuir equation. Chem. Eng. Commun. 2014, 201, 1459–1467. [Google Scholar] [CrossRef]
- Dubinin, M. The equation of the characteristic curve of activated charcoal. Dokl. Akad. Nauk. SSSR. 1947, 55, 327–329. [Google Scholar]
- Babaeivelni, K.; Khodadoust, A.P. Adsorption of fluoride onto crystalline titanium dioxide: Effect of pH, ionic strength, and co-existing ions. J. Colloid. Interface Sci. 2013, 394, 419–427. [Google Scholar] [CrossRef] [PubMed]
- Radushkevich, L. Potential theory of sorption and structure of carbons. Zhurnal Fiz. Khimii 1949, 23, 1410–1420. [Google Scholar]
- Anićijević, V.J.; Lazarević-Pašti, T.D.; Vasić Anićijević, D.D. Adsorption of dimethoate and sarin on graphene–establishing a DFT model. In Proceedings of the OTEH 2020, Belgrade, Serbia, 15–16 October 2020. [Google Scholar]
- Vasić Anićijević, D.D.; Perović, I.M.; Maslovara, S.L.; Brković, S.M.; Žugić, D.; Laušević, Z.; Marčeta Kaninski, M.J.M.J.o.C.; Engineering, C. Ab Initio Study of Graphene Interaction with O-2, O, and O. Maced. J. Chem. Chem. Eng. 2016, 35, 271–274. [Google Scholar] [CrossRef]
- Anićijević, V.; Jelić, M.; Jovanović, A.; Potkonjak, N.; Pašti, I.; Lazarević-Pašti, T. Organophosphorous pesticide removal from water by graphene-based materials–Only adsorption or something else as well? J. Serb. Chem. Soc. 2021, 1–12. [Google Scholar] [CrossRef]
Publisher’s Note: MDPI stays neutral with regard to jurisdictional claims in published maps and institutional affiliations. |
© 2021 by the authors. Licensee MDPI, Basel, Switzerland. This article is an open access article distributed under the terms and conditions of the Creative Commons Attribution (CC BY) license (https://creativecommons.org/licenses/by/4.0/).
